 Camilla Sguotti1,2*
 Alexandra M. Blöcker1Leonie Färber1Benjamin Blanz3Roland Cormier4Rabea Diekmann5Jonas Letschert6Henrike Rambo6Nicole Stollberg6
 Vanessa Stelzenmüller6
 Adrian C. Stier7
 Christian Möllmann1
- 1Institute of Marine Ecosystems and Fishery Science (IMF), Center for Earth System Research and Sustainability (CEN), University of Hamburg, Hamburg, Germany
- 2Department of Biology, University of Padova, Padova, Italy
- 3Research Unit Sustainability and Global Change (FNU), Center for Earth System Research and Sustainability (CEN), University of Hamburg, Hamburg, Germany
- 4Helmholtz-Zentrum Geesthacht, Centre for Materials and Coastal Research, Institute for Coastal Research, Geesthacht, Germany
- 5Hochschule Bremerhaven, University of Applied Sciences Bremerhaven, Bremerhaven, Germany
- 6Thünen Institute of Sea Fisheries, Bremerhaven, Germany
- 7Department of Ecology, Evolution and Marine Biology, University of California Santa Barbara (UCSB), Santa Barbara, CA, United States
Human impacts can induce ecosystems to cross tipping points and hence unexpected and sudden changes in ecosystem services that are difficult or impossible to reverse. The world´s oceans suffer from cumulative anthropogenic pressures like overexploitation and climate change and are especially vulnerable to such regime shifts. Yet an outstanding question is whether regime changes in marine ecosystems are irreversible. Here we first review the evidence for regime shifts in the North Sea ecosystem, one of the heaviest impacted and best studied marine ecosystems in the world. We then used catastrophe theory to show that fishing and warming have caused a previously undetected and potentially irreversible regime shift. Our study emphasizes the combined effects of local and global human impacts in driving significant ecosystem shifts and suggests that adaptation is likely the central avenue forward for maintaining services in the face of global climate change.
Introduction
In the face of global change, ecosystem resilience is necessary to maintain the critical services ocean ecosystems provide, yet we still know relatively little about how many anthropogenic pressure an ecosystem can take before it is irrevocably changed. In some circumstances, the accumulation of human impacts has induced ecosystem reorganizations called “regime shifts”, defined as abrupt changes in the structure and function of ecosystems (Scheffer et al., 2001; Beisner et al., 2003; Scheffer and Carpenter, 2003; Möllmann et al., 2015; Rocha et al., 2015). When regime shifts occur, previously abundant commercially-harvested species can be replaced by more tolerant species that are able to thrive under the new more heavily impacted conditions (Beaugrand, 2004; Vasilakopoulos et al., 2017). These changes can be socially and economically costly when they require adaptation by ocean users, including significant modifications to harvest methods, supply chains, and infrastructure (Carpenter, 2001; Scheffer et al., 2001; Levin and Möllmann, 2015). As a result, avoiding regime shifts, or reversing them, is often preferred. However, reversals can be slow and are not always possible, because of hysteresis – the delayed return to previous conditions following a regime. Therefore, there is continued interest and value in understanding what drives regime shifts, and there is significant uncertainty whether regime shifts can be reversed, and what management solutions exist in case of irreversibility (Levin and Möllmann, 2015; Selkoe et al., 2015).
While it is evident that avoiding irreversible regime shifts in a social-ecological system is fundamental in order to maintain services, the management application is not straightforward. The consideration of abrupt non-linear change in management is often undermined by the lack of consensus on the definition of the word “regime shift” and by methodological limitations. The former derives from the use of the same word “regime shift” in completely opposite contexts. Indeed, regime shift is used sometimes to describe a simple “phase shift” not characterized by hysteresis and sometimes to describe alternative stable states characterized by hysteresis (Scheffer et al., 2001; Selkoe et al., 2015). This lack of an agreed definition creates confusion in the scientific community around the concept and a certain level of disbelief in its importance. The presence of multiple definitions with opposite dynamics (with or without hysteresis) has repercussion also on their detection. Simple statistical change point analyses can be useful to identify phase shifts without hysteresis, but are not enough to detect the presence of irreversible regime shifts (Andersen et al., 2009). However, the majority of the paper studying regime shifts employs these types of methods and do not quantify or detect hysteresis. Moreover, often the drivers of regime shifts are not statistically tested.
Identifying the drivers of regime shifts can be relatively straightforward using empirical data. In general, human impacts such as fishing pressure and environmental drivers like temperature can be regressed against different types of ecosystem metrics to determine which combination of drivers caused observed shifts (Beaugrand, 2004; Andersen et al., 2009). Understanding whether a regime shift is reversible or irreversible, thus quantifying hysteresis, is however far more challenging and has rarely been done using empirical data both due to the shortness of the time series but also due to the difficulty of finding suitable statistical methods (Vasilakopoulos et al., 2017; Sguotti and Cormon, 2018; Schmitt et al., 2019). Hysteresis and irreversibility are due to powerful feedbacks loops (Beisner et al., 2003). These feedbacks stabilize the new regime through the creation of new interactions among species, new energy pathways and new system structures making it difficult or impossible to transit back to the previous system state even if the original driver of the regime shift is removed or alleviated. Thus, to determine whether a regime shift is reversible or not we need to answer two main questions. 1) How strong is the hysteresis? In other words, how much do we need to alter the drivers in order to disrupt the feedback loops formed in the new system? 2) Is management able to revert the drivers? Some drivers such as fishing or pollution can be reduced, while other pressure such as global climate change are likely more difficult to reverse (Hoegh-Guldberg and Bruno, 2010).
Here, we study regime shifts in the North Sea large marine ecosystem which is experiencing rapid warming and also intensive fishing pressure and is one of the most heavily human impacted areas in the world (Emeis et al., 2015). Firstly, we conducted a literature review to check what regime shifts have been documented and which methods were used to detect them. Previous analyses have documented regime shifts (abrupt ecosystem changes) in the North Sea in subsets of the ecosystem such as plankton or fishes in the 1980s and 1990s (Beaugrand, 2004; DeYoung et al., 2008; Wouters et al., 2015), however using models not able to quantify hysteresis. Afterwards, we collected data on the North Sea ecosystem to conduct a comprehensive analysis of its regime shifts, using all trophic levels of the ecosystem. We used the stochastic cusp model, an approach derived from catastrophe theory in order to detect a regime shift over the last 40 years in the ecosystem and test whether it was reversible or irreversible. We show the interactive effects of global warming and changes in fishing pressure in driving the most recent regime and document the existence of hysteresis (i.e. irreversibility). If reduced, fishing pressure could help to increase the yield of the currently exploited species; however, simply removing fishing pressure is unlikely to reverse the regime shift, which is maintained by other feedbacks. Moreover, since climate change is not currently reversible and can only be mitigated, we suggest that the new regime in which the North Sea resides now is irreversible and thus major adaptations need to be undertaken in order to maximize the services that can be provided by this newly transformed ecosystem.
Material and methods
Systematic review
We conducted a systematic review (September 2019) of the scientific literature related to regime shift dynamics in the North Sea ecosystem with special attention on how theory of critical transition is addressed. Web of Science and Science Direct were used as platforms to screen literature multiple databases using the following search criteria:
“TS = (“tipping point” OR “regime shift*” OR “top-down” OR “bottom-up” OR “trophic cascade*”) AND TS = (“North Sea”) AND TS = (“complex dynamic system” OR “ecosystem” OR “natural system” OR “ecology” OR “economic” OR “socio ecological system”)” (adapted for the two websites).
The first part of the search string referred to the type of dynamics and change we were interested to analyze and detect, in particular abrupt changes of the system and system functioning. In the second part of the search string (after AND) the types of publications that we were targeting were addressed, ranging from just ecological studies to economic and socio-ecological. However, just one economic study was found and therefore was dropped from the main analyses. Identified publications were added to a reference organizer and checked for duplicates. We excluded papers not dealing with the North Sea or not investigating regime shifts in any of the North Sea ecosystem components from the analysis. Subsequently, we developed a protocol (see Table 1 and SI Text) to rigorously analyze each publication and the analysis was conducted by 10 co-authors. To avoid biases due to subjective interpretation, the protocol contained 6 fixed multiple choice answers, each of which followed by a descriptive explanation (Table 1, SI Text). The timing of regime shifts and the type of method used in the paper were all screened by the first author, who, at the end assembled all the data checking for mistakes. The data collected were then analyzed with respect to how scientific studies address regime shifts in the North Sea ecosystem.
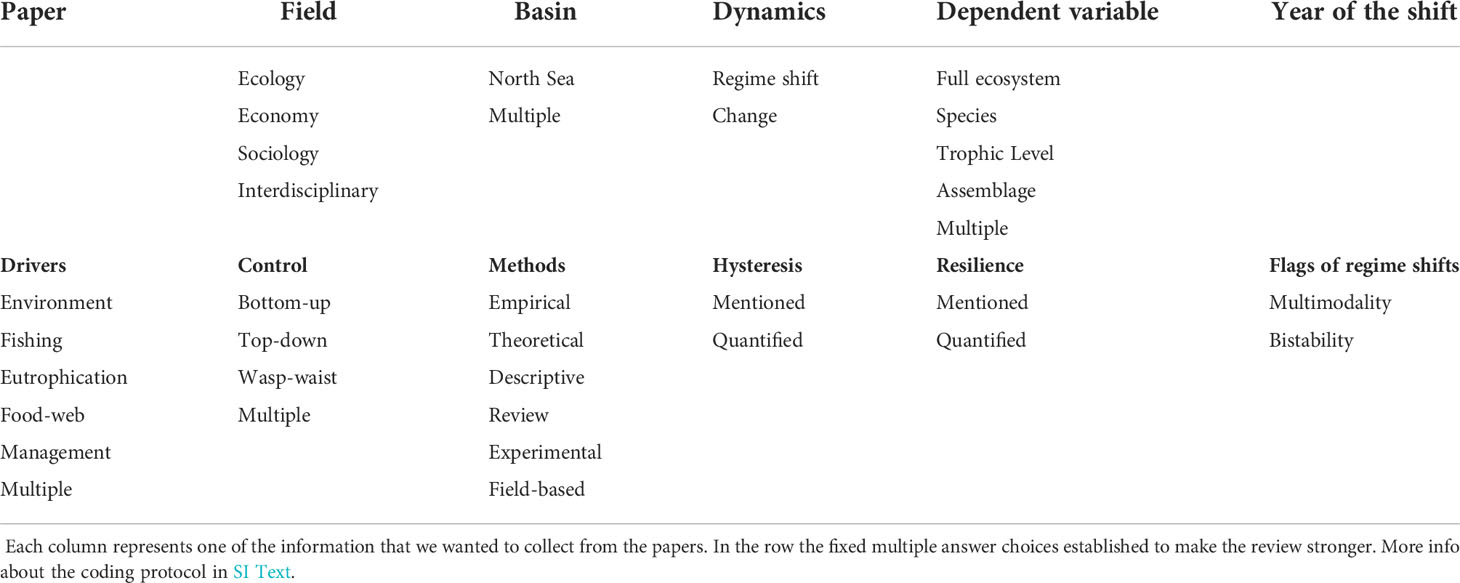
Table 1 Coding to analyze the papers collected from the review.
Biological data
We assembled a multivariate dataset to re-analyze North Sea ecosystem dynamics with special emphasis on regime shifts (SI Tables 3, 4). Our dataset covered the period from 1985 until 2015 and represents several trophic levels from plankton to fish. Plankton data were provided by the Continuous Plankton Recorder (CPR) program (www.cprsurvey.org) and included aggregated phytoplankton biomass indicators for dinoflagellates and diatoms as well as the phytoplankton color index as a bulk biomass indicator (Maritorena et al., 2010). The zooplankton community is represented by aggregated indicators for small and large copepods together amounting for most of the biomass (Maritorena et al., 2010). The fish community of the North Sea is represented by time-series on abundance (catch per unit of fishing effort) derived from the International Bottom Trawl Survey (IBTS) program of ICES (https://www.ices.dk/data/data-portals/Pages/DATRAS.aspx). The IBTS is an international survey which seasonally collects data on fish populations and communities. Each vessel deploys a standard otter trawl as sampling gear. The data collected are recorded as catch per unit of effort which means that they are standardized per unit of trawling time (ICES, 2015). In order to assure standardized sampling, at least two hauls are always conducted for each North Sea spatial unit (i.e. statistical rectangle), which cover one degree longitude and 0.5 degree latitude (ICES, 2015). Just data from Quarter 1 (January to March) were used in the analyses. The IBTS database contains data for more than 100 species. In order to numerically balance the dataset between fish and plankton we selected eight of the most important fish species as indicated in previous publications. The species chosen were also balanced between forage fish, groundfish and benthic fish (Engelhard et al., 2011; Lynam et al., 2017). In order to use comparable annual estimates, all the data were first aggregated per hauls, then averaged over statistical rectangle and finally summed over the entire North Sea.
External pressures
We analyzed North Sea regime shift dynamics in relation to fishing pressure and climate dynamics. Fishing effort data, representing the exploitation pressure on the system, were collected from Couce et al. (2020). These data consisted of beam and otter trawl effort data (hours swept per year), collected and reconstructed for the period from 1985 to 2015. Data were summed over the entire North Sea in order to obtain estimates of the total annual fishing effort. Climate-related variables in our analysis were Sea Surface Temperature (SST), as a local variable, and two climate indices, i.e. the North Atlantic Oscillation (NAO) and the Atlantic Multidecadal Oscillation (AMO). We selected these two indices because they have been shown to affect North Sea community dynamics and to induce past regime shifts (Beaugrand, 2004). SST was extracted from an oceanographic model developed by Núñez-Riboni and Akimova (2015). NAO and AMO were collected from the Earth System Research Laboratory (NOAA, www.esrl.noaa.gov). NAO is a high frequency index (7-25 years) depending on the different pressure at sea level between Iceland and Azores, while AMO is a low frequency multidecadal index (60 years) representing climate-related SST changes in the Atlantic Ocean (Hurrell, 1995). All the environmental data were averaged annually over the entire North Sea, apart from the NAO that was averaged just between December and March.
Principal component and change point analysis
To identify a major long-term signal of the North Sea ecosystem, a Principal Component Analysis (PCA) was performed on the community dataset. This technique is particularly useful because it allows to simplify the dataset, extracting the main variability and understanding relationships between variables (Legendre and Gallagher, 2001). Additionally, a cluster analysis was performed to detect differences in the community in different periods (Murtagh and Legendre, 2014). The hierarchical clustering was performed firstly estimating Euclidean Distance between the years based on their projections on the PCA biplot, and subsequently estimating the number of significant clusters, based on Ward´s criterion, based on graphical interpretation of the dendogram (Murtagh and Legendre, 2014). PC1 and PC2 were extracted as long-term signals of the community and were analyzed using two different types of change point analysis, the Bayesian change point analysis and change in mean and variance, to detect the presence of abrupt changes (Erdman and Emerson, 2007). The presence of abrupt changes in the community can indeed be a sign of regime-shift like dynamics, but cannot unequivocally confirm the presence of discontinuities and cannot highlight the effect of external drivers.
Stochastic cusp model
To detect the presence of true discontinuous dynamics and understand the synergistic effect of two drivers, one bottom-up, i.e. environment, and one top-down, i.e. fishing pressure, we applied the stochastic cusp model. This model comes from catastrophe theory and is based on the canonical form of the cusp, which describes abrupt changes of a state variable (zt) depending on small changes of two control factors (α,β) (Thom, 1977; Diks and Wang, 2016; Dakos and Kéfi, 2022). It is based on a cubic differential equation (Eq.1), reformulated as a stochastic differential equation adding a Wiener process (Eq.2) (Grasman et al., 2009; Diks and Wang, 2016; Sguotti et al., 2019b).
WhereV(zt,α,β) is a potential function whose slope represents the rate of change of the system (zt), depending on the two control variables (α,β)
Where the first part of the equation is the drift term, σz, is the diffusion parameter, and Wt represents the Wiener process
The parameters, α and β, and the state variable (zt) are modelled as linear function of one or more exogenous variables, using a likelihood approach (Eq.3 a-c). Here, the state variable was modelled as a linear function of the two long-term signals in the community (i.e. PC1 and PC2). Fishing effort was used as a linear predictor of α, the so-called asymmetry parameter, which controls changes in the community and can be managed (top-down) (Sguotti et al., 2019b). Environmental drivers were used separately as linear predictors of β, the bifurcation parameter, that controls whether the relationship between the state variable and α is linear or discontinuous and thus allows the emergence of regime shift dynamics (Eq.3 a-c)43.
Where α0,β0,and w0 are the intercepts and α1,β1,and w1,2 the slopes of the models
The best models were selected based on the Akaike Information Criterion (AIC) and the R². To detect the presence of multiple equilibria and therefore discontinuous dynamics it was necessary to solve Eq.4 and determine the Cardan´s discriminant (δ) (Grasman et al., 2009; Diks and Wang, 2016).
The system follows a discontinuous path and shows multiple equilibria if the Cardan´s discriminant is smaller or equal to 0, otherwise the system follows a continuous path (Grasman et al., 2009; Diks and Wang, 2016). This allows, to understand whether the community is close or far from tipping at every moment in time and to understand its dynamics, depending on the external control drivers. Therefore, the application of this model can help in detecting the presence of regime shifts and the synergistic effect of the drivers controlling the system.
All analyses were conducted in R Studio (version 3.6.1). The PCA was performed using the package ade4 (Dray and Dufour, 2007), the Bayesian change point analysis using bcp (Erdman and Emerson, 2007) while the stochastic cusp model with the package cusp (Grasman et al., 2009).
Results
Systematic literature review
North Sea ecosystem regime shifts have previously received significant empirical attention. Following our review protocol we identified 211 papers of which 55 were deemed relevant to understand how regime shifts were addressed in the North Sea literature (Supplementary Catalog). In total, 72 regime shifts were identified in various aspects of the ecosystem (SI Table 1; Figure 1A). These are not necessarily unique regime shifts in the sense that different paper could have described or investigate the same regime shift. The majority of the detected regime shifts were reported for the 1980s and 1990s (19 and 9, respectively; Figure 1A), but no regime shifts were reported after 2000. Studies varied in their statistical rigor; only 24 of the 55 studies applied statistical methods capable of clearly identifying abrupt changes in time series (Figure 1B; SI Table 2). The remaining papers either showed changes qualitatively without statistical testing or were review papers. Despite abundant theory linking the concept of regime shifts to ecosystems switching between alternative stable states, only 9% of studies examined the concept of irreversibility. Moreover, none of the empirical studies rigorously explored aspects of stability in regimes, indicating a significant need to examine these concepts further in the context of sustainable management.
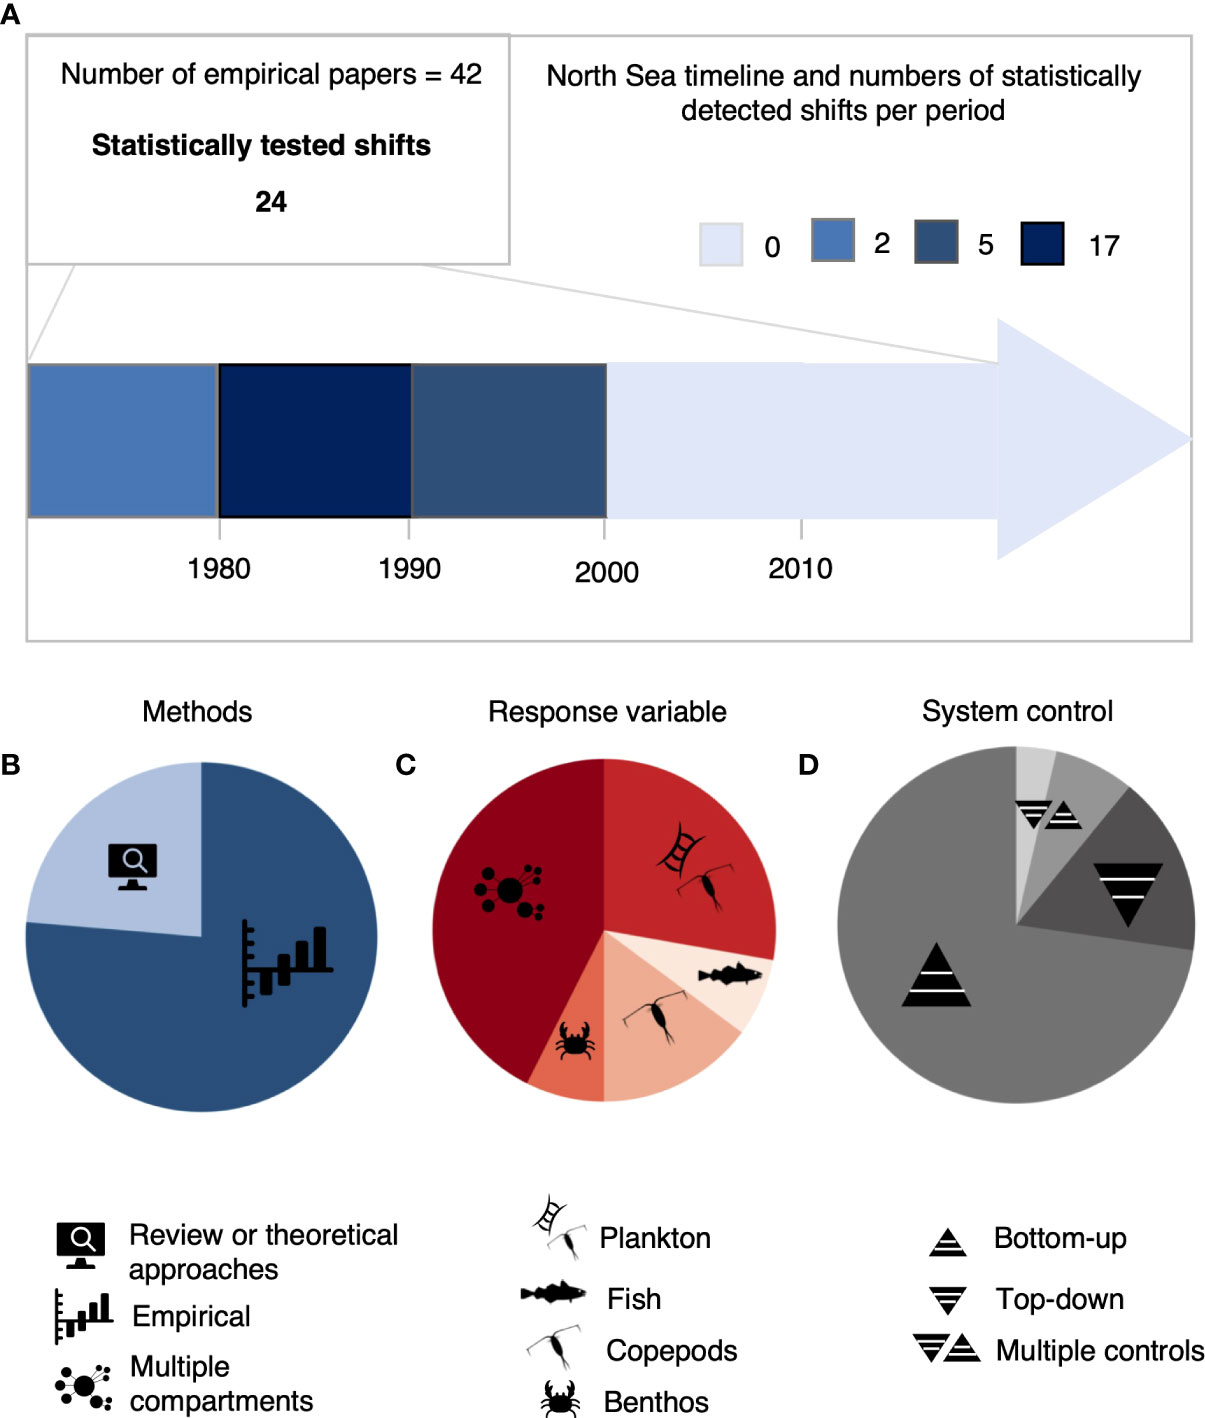
Figure 1 Results of the systematic literature review on regime shifts in the North Sea ecosystem. In total 55 papers dealt with regime shifts and 72 shifts were recorded. (A), Decadal occurrence of reported statistically tested regime shifts. 42 papers used empirical methods but just 24 tested the abrupt shift. (B–D), Percentage distribution of statistical methods applied, response variable and type of ecosystem control considered in reviewed studies. The percentages were calculated against the total number of papers (i.e. 55).
Our review also found that previous research on North Sea regime shifts was taxonomically biased, primarily examined dynamics of a single trophic level, and focused on single rather than cumulative human and environmental drivers of regime shifts. Most studies focused on plankton (mostly copepods), and 60% of the papers examined only a single trophic level (Figure 1B; SI Table 1). Additionally, most studies solely considered climatic variables as drivers of ecosystem change, e.g., temperature, the North Atlantic Oscillation (NAO) or the Atlantic Multidecadal Oscillation (AMO), and often ignored the potential importance of consumer resource interactions (Figure 1C). Moreover, only 16% of studies considered the effects of more than one pressure on the ecosystem at a time, despite that theory suggests discontinuous regime shift dynamics to emerge from the interaction of multiple drivers (SI Table 1). These gaps in previous research have limited our capacity to detect the typical properties of regime shifts: feedback mechanisms and cascading effects across trophic levels.
Probably the most important theoretical aspect of regime shifts is the potential of switching between true alternative states that are difficult or even impossible to return. Both hysteresis in recovery and especially irreversibility are key questions for ecosystem-based management of the oceans. However, we found only 5 of the 55 papers reviewed mentioning the concepts of hysteresis and irreversibility. Furthermore, none of the empirical studies rigorously explored aspects of stability in regimes, indicating a clear lack in the understanding of the dynamics of marine ecosystems crucially important for their sustainable management. In total, the results of our review revealed a clear mismatch between the theoretical concept of regime shifts and its application to empirical studies of marine ecosystem dynamics.
Analysis of North Sea ecosystem regime shifts
We described the North Sea community using a dataset including a taxonomically diverse group of species, from plankton to predatory fish and covering the entire trophic structure, for the period from 1985 until 2015 (see methods, SI Table 3; SI Figure 1). To describe the change in community structure through time, we used Principal Component Analysis (PCA) and extracted the main modes of variability in the data set (PC1 and PC2) (Figure 2; for detailed results of the PCA analysis, SI Figures 2–4). We then used hierarchical cluster analysis on the PCA results to demonstrate a shift in ecosystem states along the PC1 axis, which identified a clear distinction between community structures before and after 2002 (Figure 2A; SI Figure 5). At the beginning of the 2000s the North Sea was depleted from its demersal fish stocks, rich in small copepods, had an increasing number of pelagic fish, and was dominated by dinoflagellates. We identified a previously unreported shift in 2003 after which the system was characterized by higher diatom biomass, and an increase in three fish species: saithe (Pollachius virens), plaice (Pleuronectes platessa) and sprat (Sprattus sprattus) (Figure 2A; SI Figure 1). We applied statistical change point analysis to demonstrate that the shift between ecosystem states was abrupt (SI Figure 6) and hence indicates a possible North Sea ecosystem regime shift at the beginning of the 2000s that was not described in the literature so far (Figure 2B). Further variability in the ecosystem is represented by PC2, however without a clear and abrupt separation of states (SI Figure 7). To test whether this new identified change point was a true regime shift including hysteresis and whether the new state of the system is now stable, we used the stochastic cusp model (Box 1). Moreover, we investigate if the dominant drivers of the previous shifts were also the cause of this new shift.
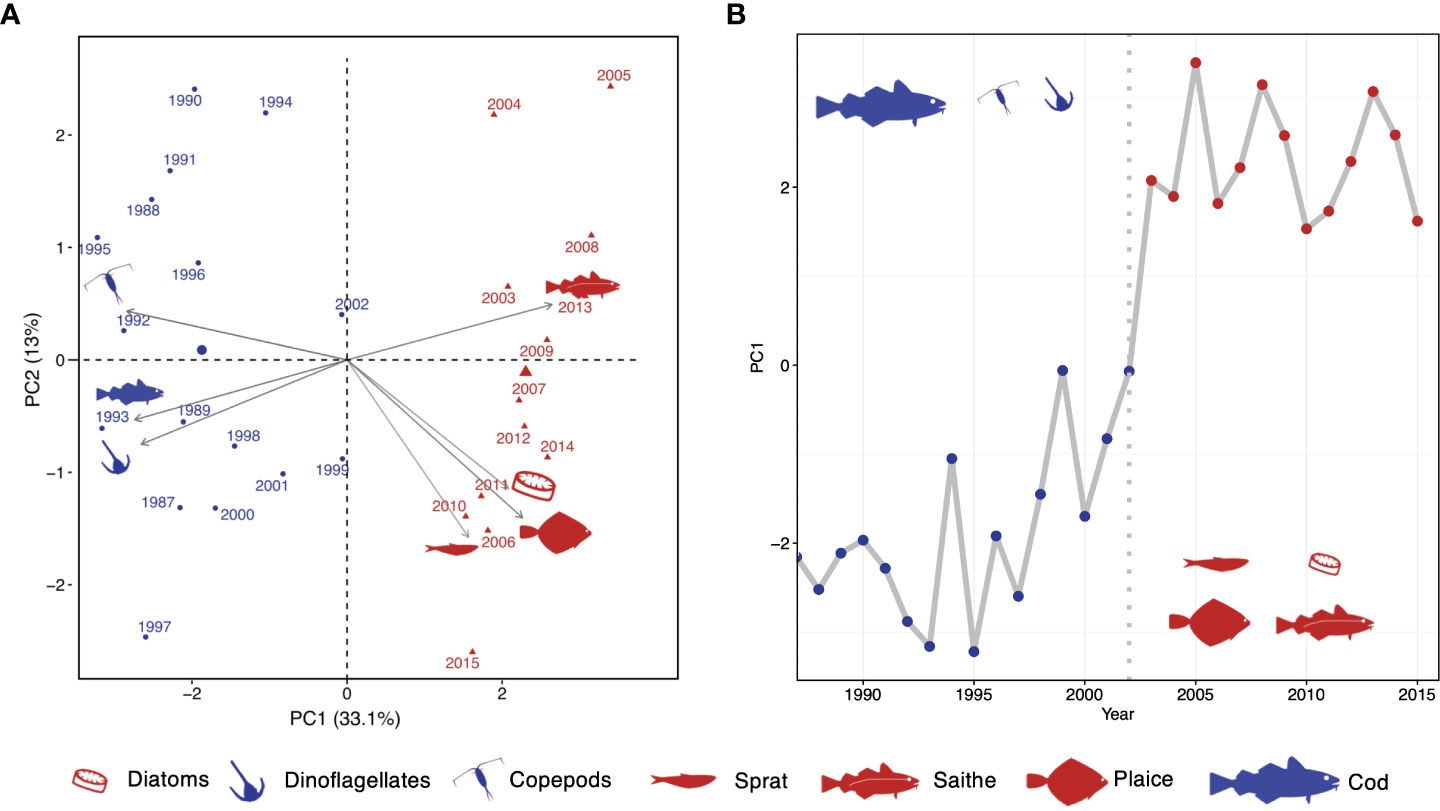
Figure 2 Regime shift in the North Sea ecosystem. (A) Biplot of principal components PC1 and PC2 (explained variance in brackets) associating the periods of the two ecosystem regimes to dominating species/taxonomic groups; only species/taxonomic groups with the highest loadings in PC1 and which are emergent species in PC2 are shown; for full PCA output see SI Figure 4. (B) Abrupt shift in scores of PC1 evaluated by statistical change point analysis.
Box 1. The stochastic cusp model and its application to the North Sea ecosystem
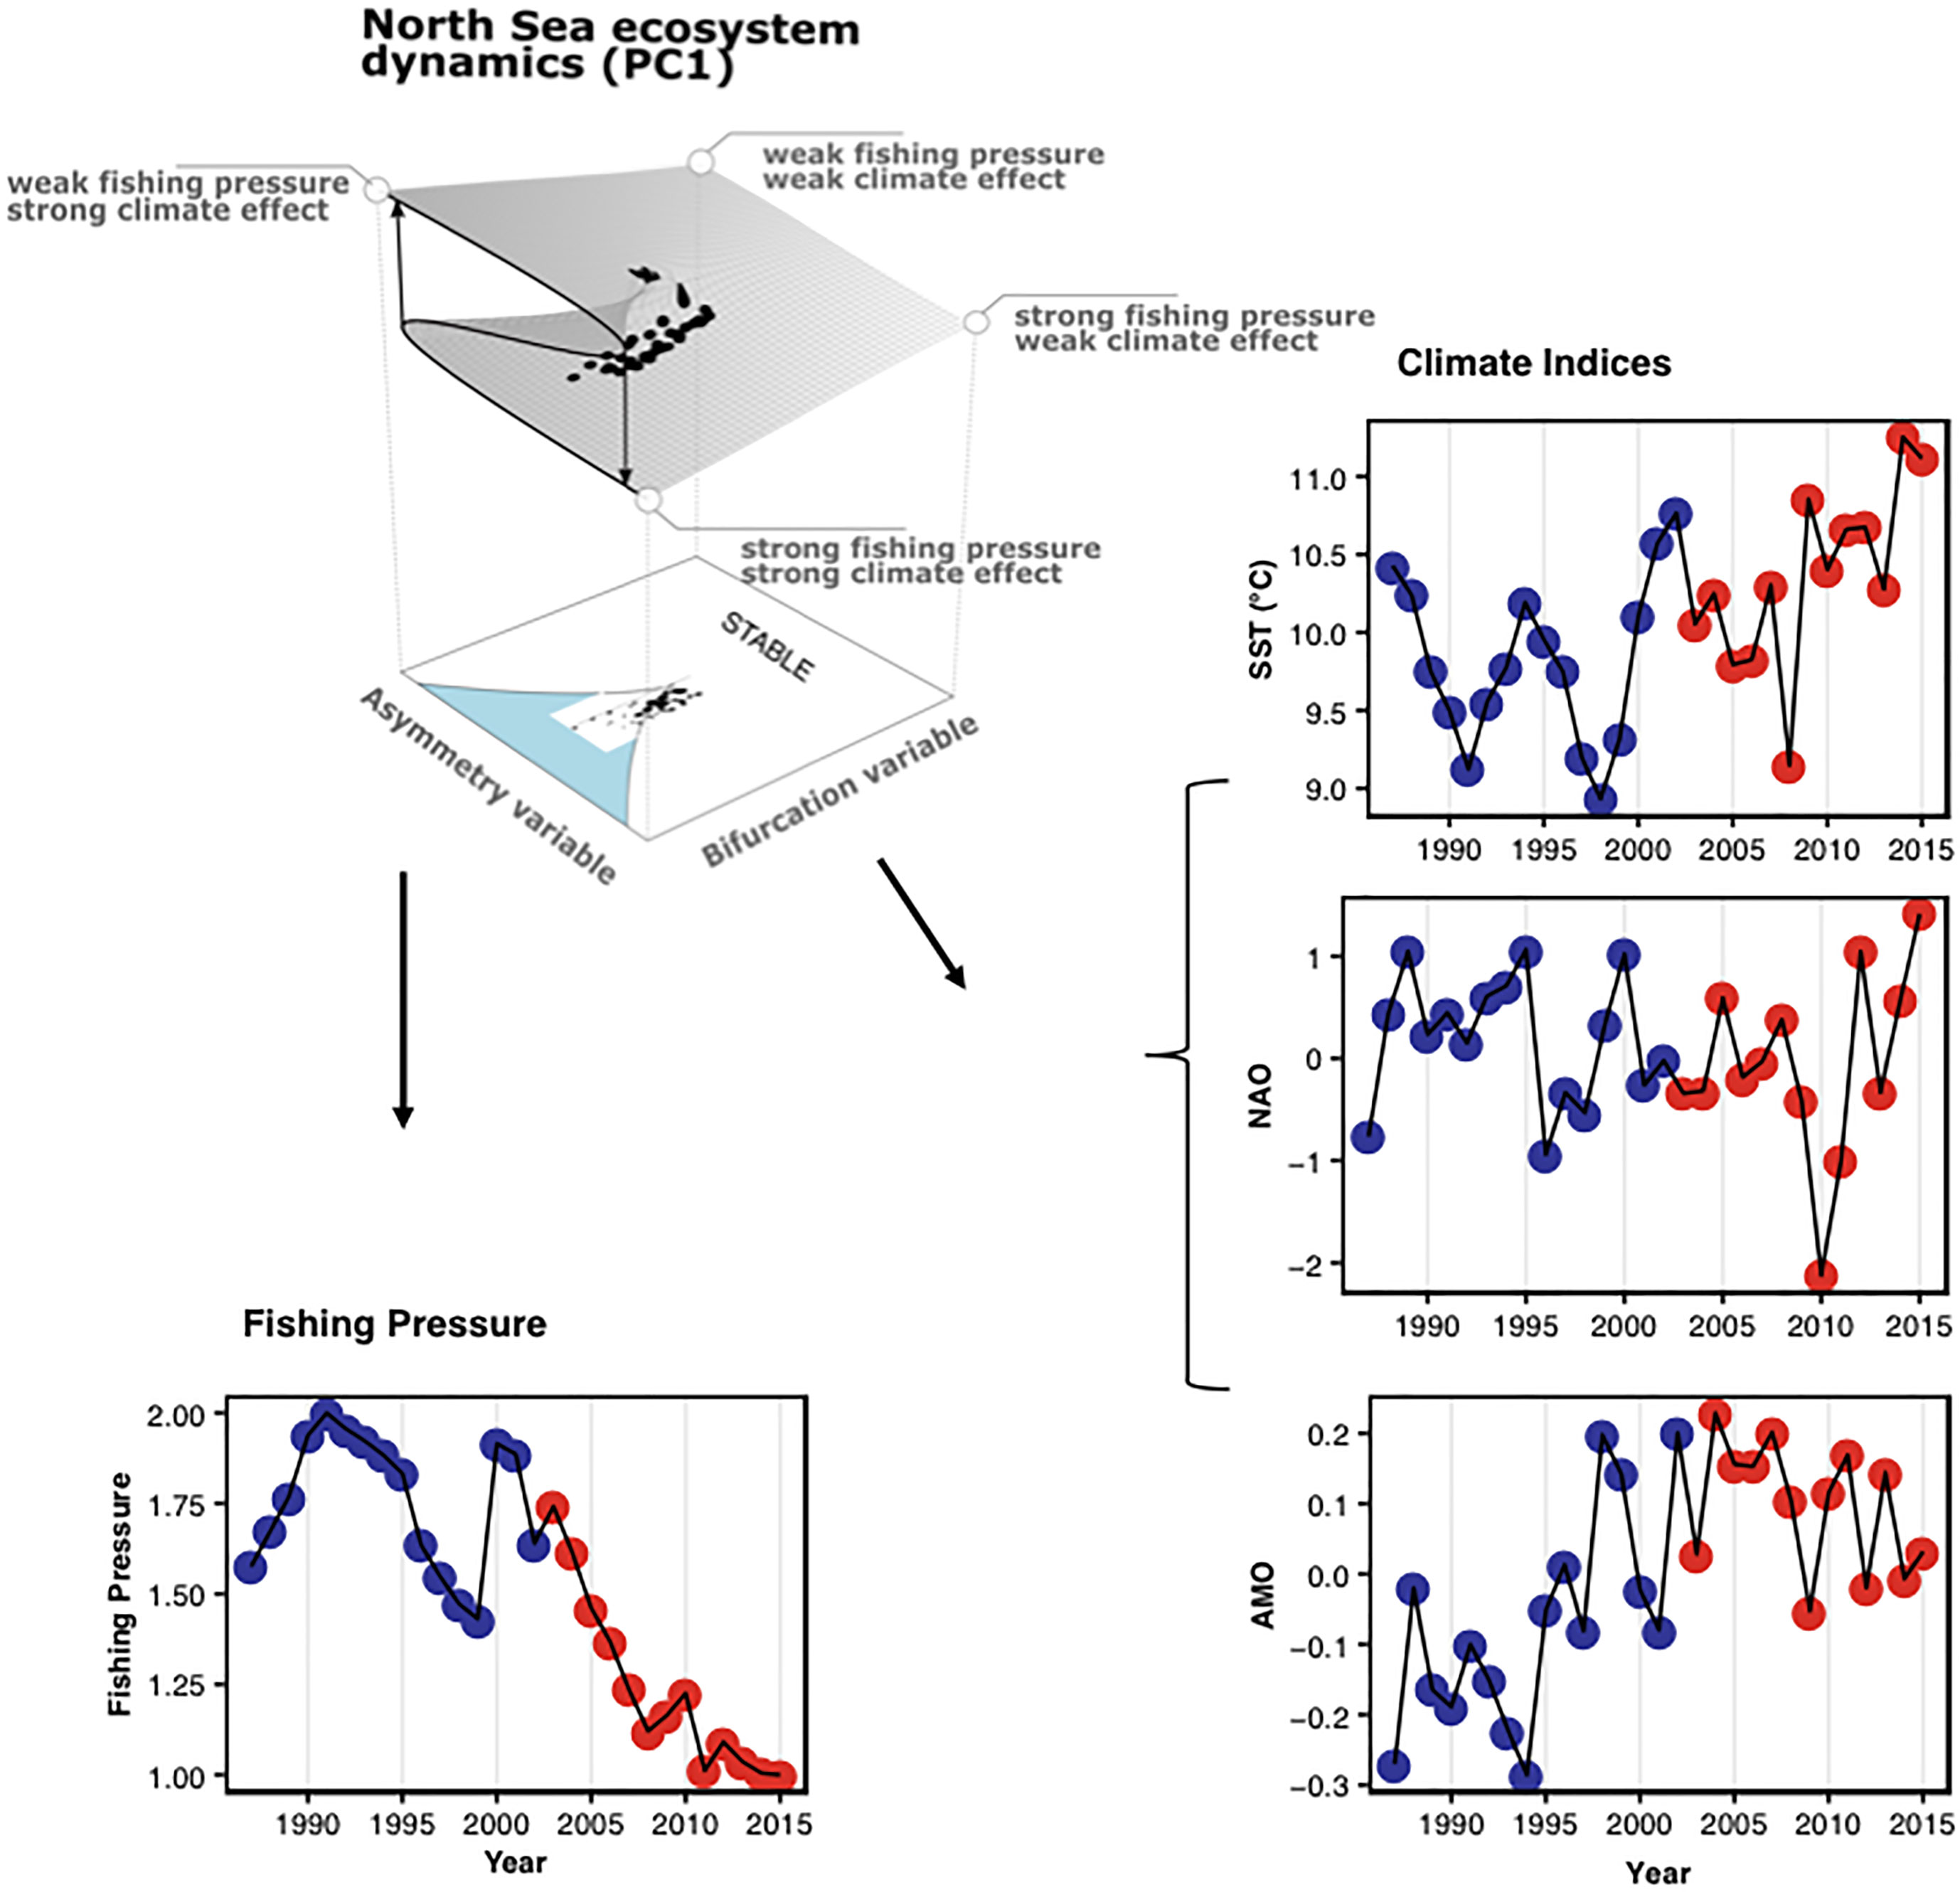
The cusp model is based on catastrophe theory that differentiates seven elementary catastrophes of which the most known in ecology is the fold catastrophe often used to represent regime shifts in a two-dimensional space (Thom, 1977; Grasman et al., 2009; Diks and Wang, 2016). In contrast to the fold, the cusp catastrophe considers a three-dimensional system where a state variable depends on two interacting control variables. The asymmetry variable affects the dimension of the state variable determining its transition between system states. The bifurcation variable determines the form of the relationship between the state variable and the asymmetry variable along a continuum from linear and continuous to non-linear discontinuous. The cusp catastrophe is represented by a potential function that can be fit to data using the method of moments and maximum likelihood estimators, and the state, asymmetry and bifurcation are canonical variables fit using linear models of observed quantities (see methods). In our analysis of the North Sea we modelled the dynamics of the state variable as a function of PC1 representing the main mode of variability in the ecosystem. The asymmetry and bifurcation variables were fit to time-series of fishing pressure and climate indices, respectively. Fishing pressure is represented by the logarithmic value of annual total hours fished (by beam and bottom trawls) of the North Sea fisheries. We used three indices for climate change (colors according to regimes identified in PC1; see Figure 2), i.e. sea surface temperature (SST) that represents the direct effect of climate on the water column, as well as the indices for the North Atlantic Oscillation (NAO) and the Atlantic Multidecadal Oscillation (AMO) that represent decadal and multidecadal climate dynamics, representatively. Our model setup bears the assumption that climate change can alter the relationship between fishing pressure and ecosystem state from linear to non-linear and vice versa. Importantly, using the stochastic cusp model we can distinguish between unstable (in fact bistable) and stable states in the dynamics of the system. Bistable dynamics exist under the folded curve where the state variable can flip between the upper and lower shield, called the cusp area (shaded in light blue) in the 2D representation of the model surface. Outside the cusp area the system is stable and present progressively higher hysteresis as we move away from the area.
We used the main mode of variability in the ecosystem (i.e. PC1) to model the system´s response variable in three stochastic cusp models. Fishing pressure (approximated as total hours fished by beam trawls and bottom trawls) was used to fit the asymmetry variable that largely represents the top-down effect of fisheries management on the system. In each of the models we used one climate variable (i.e. SST, NAO and AMO, SI Table 4) as the bifurcation variable that affects the system from bottom-up and according to the assumption of the stochastic cusp model determines if the relationship between fishing pressure and the main community dynamics is linear continuous or non-linear discontinuous. We can infer stability patterns from the model results of the new regime by inspecting if the predicted PC1 loadings are outside (stable) or inside (bistable) the cusp area (lightblue in Figure 3 and see also Box 1). A comprehensive model validation revealed that all three fitted stochastic cusp models are superior to alternative linear and logistic models, explained a large portion of the variability in the data and fulfilled additional criteria for this model type to be valid (R 2: 0.88, 0.85, 0.84 of the SST, AMO and NAO model respectively; more info at SI Table 5).
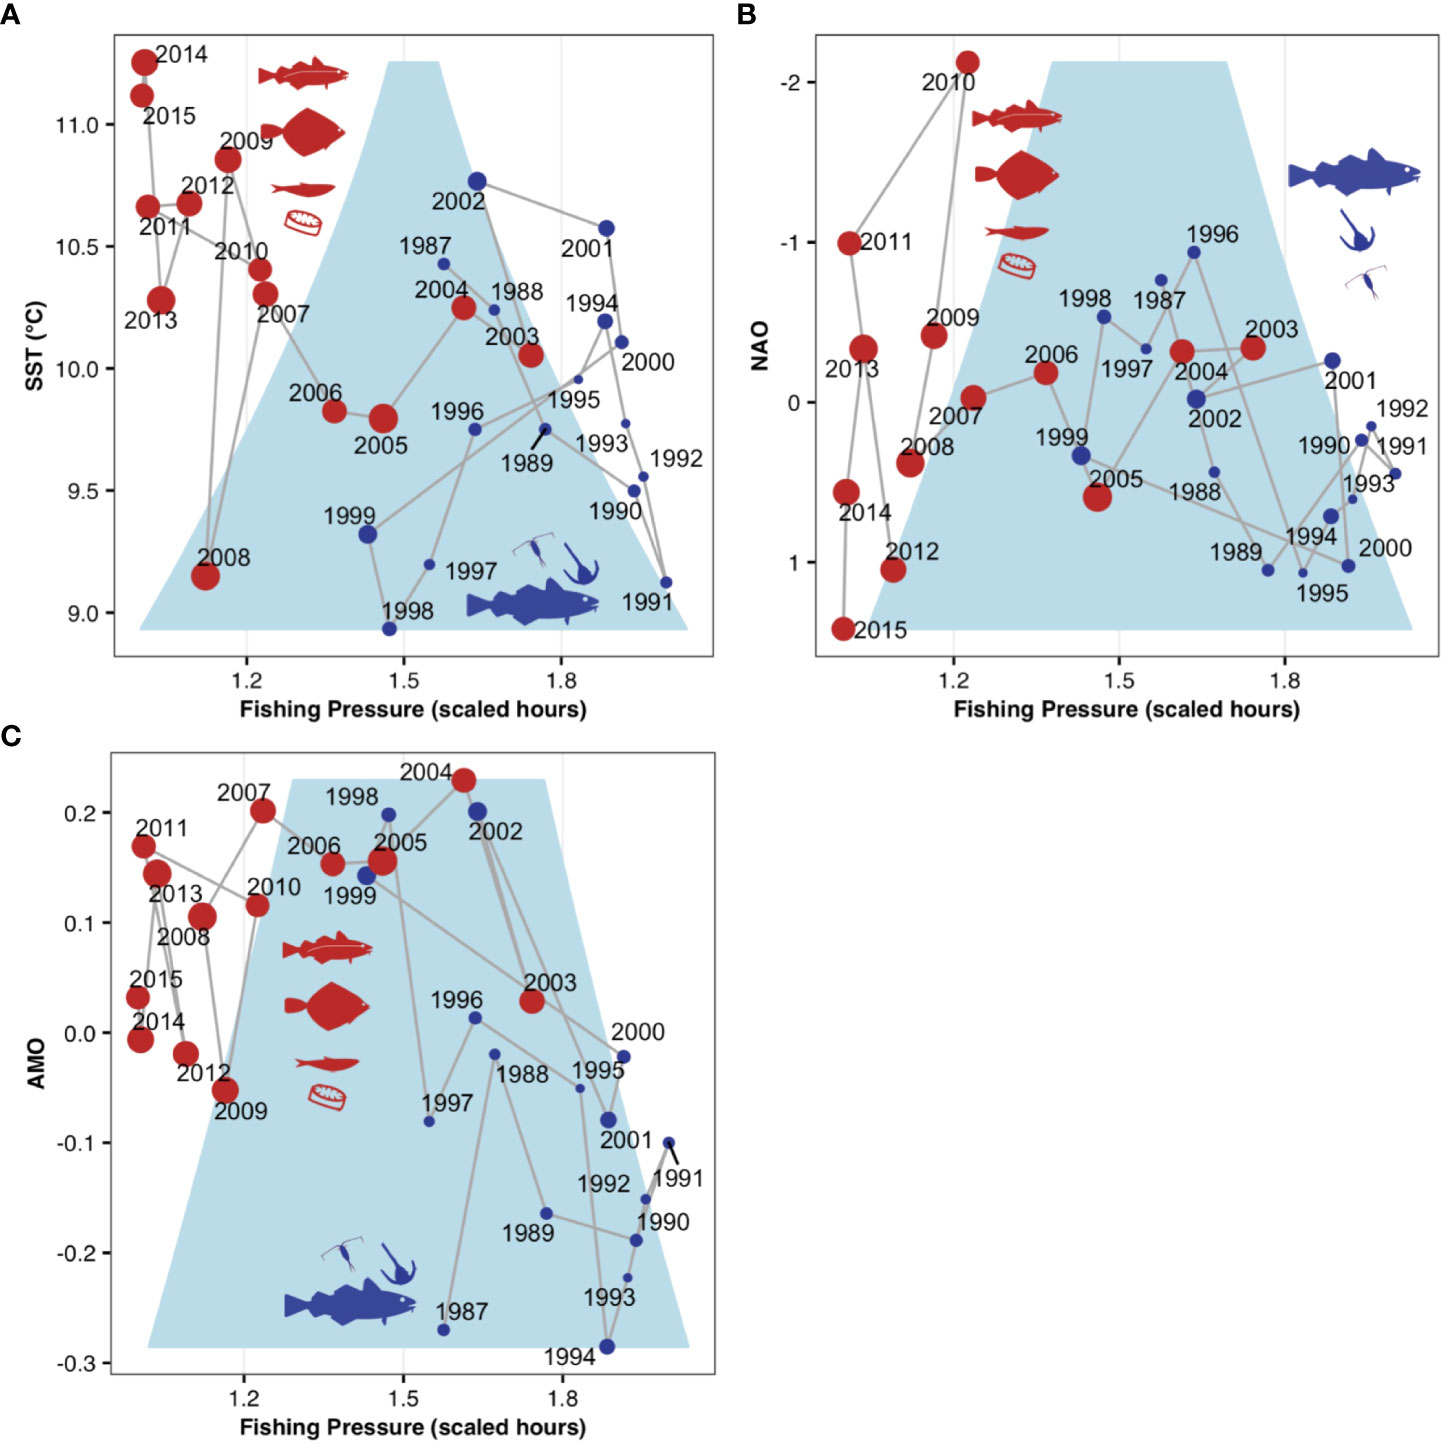
Figure 3 Potential irreversibility of a regime shift in the North Sea ecosystem. Results of stochastic cusp modelling showing predicted PC1 scores in relation to fishing pressure and (A), sea surface temperature (SST) (B), the index of the North Atlantic Oscillation (NAO), and (C), the index of the Atlantic Multidecadal Oscillation (AMO). Points are scaled according to PC1 scores; colors and regimes-specific species/taxonomic groups according to Figure 2; the light blue area represents the cusp area (below the fold) in which the system can exist in three states, two stable and one unstable and can therefore flip from a state to the other. Note that NAO values are on a reverse scale.
Fitted stochastic cusp models revealed that the recent regime shift in the North Sea ecosystem occurred when the system resided in the cusp area indicating unstable dynamics where the system state can flip between two configurations (Figure 3). All three models demonstrate that the regime shift in the food web of the North Sea is a response to a combination of climatic changes and a decrease in fishing pressure. SST and AMO models clearly show that the ecosystem is now in a significantly warmer state (Figures 3A, B), and also decadal atmospheric changes indicated by the NAO are supporting the effect of ongoing climate change (Figure 3C). Importantly, our empirical study shows that the new ecosystem state characterized by the dominance of diatoms as well as the fish species sprat, saithe and plaice is potentially irreversible. PC1 scores reflecting ecosystem dynamics in recent years are outside the unstable cusp area and are not likely to return to the previous state (Figure 3).
Discussion
The North Sea is one of the best studied marine systems in the world ocean since for centuries it has been an hotspot of human pressures (Emeis et al., 2015). Our literature review revealed that regime shifts have been previously documented in the North Sea at the end of the past century and extensively studied (Beaugrand, 2004). The most well-studied North Sea regime shift occurred at the end of the 1980s and involved in particular the plankton assemblage (Beaugrand, 2004; Alheit et al., 2005). An increase of temperature led to a progressive increase in dinoflagellates, a reduction in diatoms, and a decrease in the size copepods (Alheit et al., 2005). Before 1980s demersal fish populations were abundant and the gadoids stocks in particular were at their highest level (Hislop, 1996). However, continuously high fishing pressure coupled with the changes in the plankton community, led to a collapse of the entire demersal assemblage, particularly Atlantic cod (SI Figure 8). (Beaugrand et al., 2003; Lynam et al., 2017). After the 1980s the North Sea underwent an ecosystem reorganization where demersal fish assemblages were depleted, Atlantic herring increased in abundance, and the plankton community underwent an additional shift in species composition. Another shift, even if less reported, occurred at the end of the 1990s and included another change in the phytoplankton assemblage, with a new diatom-dominance (SI Figure 8). (Beaugrand and Ibanez, 2004). The studies analyzed in the literature largely ignored the concept of hysteresis, one of the pillar of regime shift. We argue that the evident inconsistency between the theory of regime shifts and its consideration in empirical studies is due to methodological limitations. In the papers we reviewed for the North Sea ecosystem, statistical analysis was largely limited to the application of change point analysis to detect abrupt changes in time series which is not suitable to address hysteresis or irreversibility (SI Table 2). Furthermore, mostly linear correlation and regression approaches are used to understand the relationship between state variables and drivers.
Hysteresis is very difficult to detect since standard statistical methods are often limited to linear approaches that are unable to deal with non-linear and state-dependent phenomena like regime shifts (Litzow and Hunsicker, 2016). However, empirical methods that are able to model and represent regime shifts were developed already in mathematics, and one such method is the stochastic cusp model (see Box 1) (Thom, 1977). The model is part of catastrophe theory and was developed in the 1970s by the mathematician Rene Thom, and applied to a range of disciplines such as economics (Diks and Wang, 2016), behavioral and psychological studies (Cramer et al., 2016), and fisheries science (Jones, 1977; Petraitis and Dudgeon, 2015; Sguotti et al., 2019b; Sguotti et al., 2019a; Möllmann et al., 2021). The stochastic cusp model, simplifying the system, is able to detect discontinuous dynamics of a state variable depending on the interactive effects of two drivers (Dakos and Kéfi, 2022). Moreover, it also mathematically identifies the combination of levels of the two drivers in which the system is unstable and in which it is resilient and therefore where strong hysteresis exists. At the brink of the 2000s, the North Sea presented a new structure and strong management measures have been implemented, in particular fishing restrictions with the goal to recover the depleted fish populations and to bring the system back to its previous flourished, before-1980s, period (Cardinale et al., 2013) (SI Figure 8). Was this new state characterized by forage fish and diatom reversible? We solve this enigma by investigating whether there was hysteresis or not in the system, using the stochastic cusp model.
We showed for the first time that the North Sea underwent a true, irreversible regime shift and that the community completely restructured after 2003. Since the community analyzed encompassed multiple trophic levels (from plankton to fish), the regime shift occurred over few years as shown by the stochastic cusp model and stabilized in a new state just after 2008. The regime shift was due to fishing pressure and climate change, two of the most important drivers of marine ecosystems in the Anthropocene (Emeis et al., 2015). Even though fishing pressure has been decreased significantly over time, we show evidence that the regime shift has not reversed. This is due to the interaction between fishing and climate change that creates hysteresis on the system. Nevertheless, the reduction of fishing pressure has probably helped the recovery of different demersal stocks which are now abundant in the ecosystem (Beukhof et al., 2019). Warming, creating hysteresis in the relationship between the ecosystem and fishing, is impeding the transition of the system towards the previous state and is expecting to continue. Indeed, warming will likely be impossible to reverse due to the limited mitigations that can decrease climate change, thus the new North Sea regime is likely irreversible (Figure 3) (Heinze et al., 2021). Hence, our analysis provides the first evidence of irreversibility of an ecosystem regime shift in the North Sea and likely beyond, suggesting that in areas where regime shifts depend on fishing and warming, similar patterns could apply. It is important to note that hysteresis can be detected in the relationship between fishing and ecosystem and thus that the interaction between warming and fishing is hindering policies to recover the system.
Our analyses showed a new regime shift in the North Sea ecosystem in 2003. Inspecting comprehensively the evolution of the North Sea through time, it appears more as if a slow regime shift, from a state dominated by gadoids and copepods, to a new state dominated by new demersal species (saithe and plaice), different plankton communities and also pelagic species such as sprat, started at the end of the 1980s (Figure 4) (Hughes et al., 2013b; Heinze et al., 2021). Even though this transition is not strictly abrupt (in the sense it occurred relatively slowly, in few years), the model highlights how it followed discontinuous and non-linear dynamics depending on two interactive drivers, fishing and climate change (Figures 3, 4). Thus, we can conclude that a regime shift occurred in the North Sea, affecting different elements of the trophic chain at different times, but eventually leading to a system reorganization, maintained by new feedbacks loop (Fauchald, 2010; Beukhof et al., 2019).
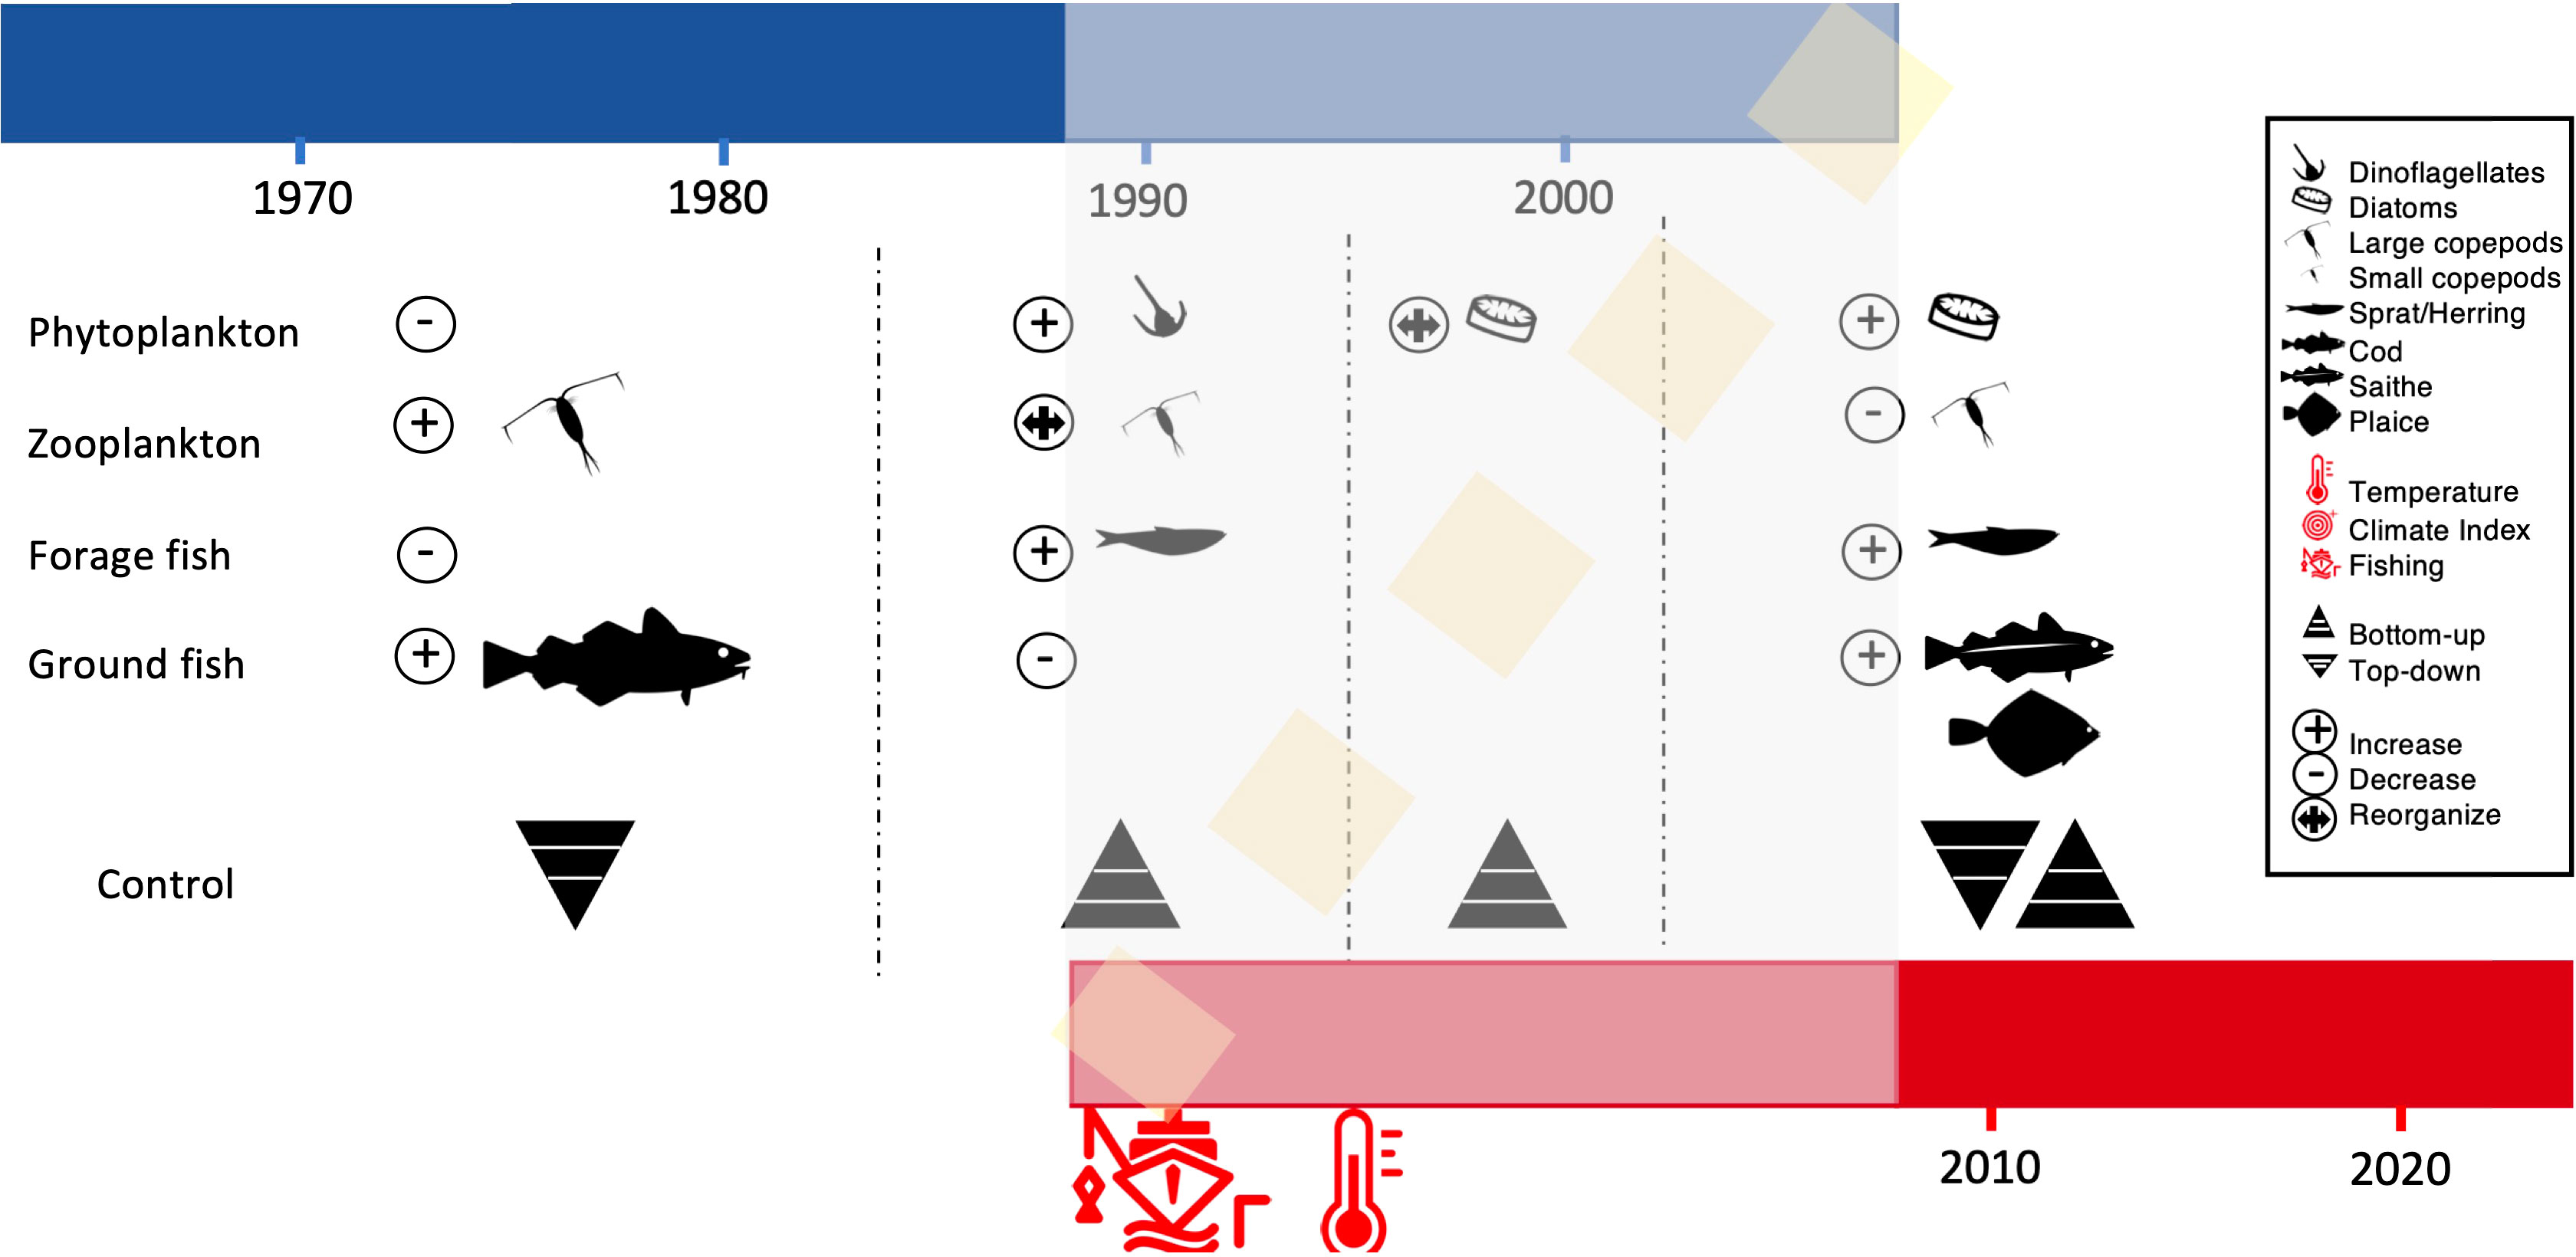
Figure 4 The North Sea regime shift. The 4 states of the North Sea community are indicated started from before the 1980s to after the 2003. In blue the first part of the time series which was stable and in red the new irreversible state of the system. The first 3 states are described in the literature, while the latter is for the first time detected in our comprehensive analyses. The two main drivers of the regime shift, fishing and climate change are indicated by the icons. The shaded area corresponds to the area of instability before a new stable state was reached, as indicated by our analysis. Icons in circles indicate whether a particular trophic level increased, declined or reorganized (in terms of relative species composition) in relation to a shift. Icons for organisms indicate regime-dominating species. Additionally, the food web control type (top-down or bottom-up) reported to be dominating during a specific regime is indicated.
More gradual regime shifts are typical of systems that present multiple scales (i.e. in space, but also trophic levels) and thus can present asynchronous responses to drivers, such as large marine ecosystems (Hughes et al., 2013a; Hughes et al., 2013b; Heinze et al., 2021). Identifying this type of long and not abrupt regime shift is hard since their more gradual nature can let them go unnoticed (Hughes et al., 2013b). However, from a management perspective they could also be easier to reverse since the window of opportunity of action is longer than the one of a sudden shift (Hughes et al., 2013b; Heinze et al., 2021). In the case of the North Sea, the management applied was not sufficient to reverse the shift and the system was able to transit into a now irreversible state. Nevertheless, the reduction of fishing pressure has favored a healthier ecosystem in which some demersal species (even if different from the one of the 1980s) have been able to thrive. The new irreversible system offers different services compared to the previous system and favors different type of fisheries. Climate change and warming will continue, and, and while we know the system is potentially irreversible, novel conditions could occur and the North Sea could continue to migrate towards completely novel and unexplored states (Ammar et al., 2021). Thus, adaptive management and a more flexible socio-economic sector, may help the human populations exploiting the North Sea to profit from the services the ecosystem provides (Biggs et al., 2012; Levin and Möllmann, 2015; Selkoe et al., 2015).
Conclusions
Understanding if ecosystems can or tend to recover to historical states or rather develop into novel not yet anticipated configurations is crucially important to best adapt ecosystem-based management of these systems in the face of global climate change (Levin and Möllmann, 2015). To do this, we need to extend our toolbox for empirical methods studying ecosystem regime shifts beyond change point analysis and linear correlative approaches, to whole ecosystem analysis that quantifies the stability of regime shifts and whether regime shifts can be reversed. Here, we combined multivariate analysis with stochastic cusp modeling, which allowed us to assess the interaction between climate and fishing in driving stable and potentially irreversible regimes in the North Sea ecosystem. This is one of a handful of promising new approaches such as Integrated Resilience Assessment (Vasilakopoulos et al., 2017), Early Warning Indicators of regime shifts (Scheffer et al., 2009) and Empirical Dynamic Modelling (EDM) (Ushio et al., 2018), which offer important and unique insights into ecosystem resilience, the drivers of ecosystem shifts, and the proximity of ecosystems to tipping points. While these tools are increasingly used in scientific studies, their application to management remains challenging since they are in some cases difficult to interpret and need many data. The stochastic cusp model can help management to understand the stability of the ecosystem under multiple drivers and thus to adjust policies to account for the resilience of the system. For instance, if a system underwent a true regime shift and is now in a stable state, managers could build policies not to restore it but to maintain the new state. Moreover, it could help identifying threshold in the effect of drivers that could induce tipping points favoring policies aiming at avoiding them. It is important to explore how to integrate this model and the others into management, to move a step forward towards a more resilient planet. In conclusion, such an extended toolbox to empirically investigate regime shift dynamics will provide a more fundamental base for sustainably managing the ocean and the services it provides to humanity. Understanding whether a system can recover back to previous conditions or is resilient in the new state, is fundamental in a constantly changing world, to apply adaptive and efficient management measures that can sustain the livelihoods of the millions of people living in close contact with the sea (Selkoe et al., 2015).
Data availability statement
Publicly available datasets were analyzed in this study. The community data are available at the Continuous Plankton Recorder (CPR) program (www.cprsurvey.org) and at the International Bottom Trawl Survey (IBTS) program of ICES (http://www.ices.dk/marine-data/data-portals/Pages/DATRAS.aspx). The Fishing and Temperature data are available from Couce et al., 2020 and Núñez-Riboni and Akimova, 2015.
Author contributions
CS, CM defined the study and the research question. CS performed the statistical analyses. CS, CM, AS interpreted the results and wrote the manuscript. CS, AB, LF, BB, RC, RD, JL HR, NS, VS performed the literature review and helped write the literature review results. All authors contributed to the article and approved the submitted version.
Funding
This study was conducted within the course of the BMBF-funded project SeaUseTip (funding code: 01LC1825A-C). This is also a contribution to the EU H2020 COMFORT project that received funding from the European Union’s Horizon 2020 research and innovation program under grant agreement number 820989 (project COMFORT, Our common future ocean in the Earth system–quantifying coupled cycles of carbon, oxygen, and nutrients for determining and achieving safe operating spaces with respect to tipping points).
Conflict of interest
The authors declare that the research was conducted in the absence of any commercial or financial relationships that could be construed as a potential conflict of interest.
Publisher’s Note
All claims expressed in this article are solely those of the authors and do not necessarily represent those of their affiliated organizations, or those of the publisher, the editors and the reviewers. Any product that may be evaluated in this article, or claim that may be made by its manufacturer, is not guaranteed or endorsed by the publisher.
Author disclaimer
The work reflects only the author’s/authors’ view; the European Commission and their executive agency are not responsible for any use that may be made of the information the work contains.
Supplementary material
The Supplementary Material for this article can be found online at: https://www.frontiersin.org/articles/10.3389/fmars.2022.945204/full#supplementary-material
References
Alheit J., Mollmann C., Dutz J., Kornilovs G., Loewe P., Mohrholz V., et al. (2005). Synchronous ecological regime shifts in the central Baltic and the north Sea in the late 1980s. ICES J. Mar. Sci. 62, 1205–1215. doi: 10.1016/j.icesjms.2005.04.024
Ammar Y., Niiranen S., Otto S. A., Möllmann C., Finsinger W., Blenckner T. (2021). The rise of novelty in marine ecosystems: The Baltic Sea case. Glob. Change Biol 00, 1–15. doi: 10.1111/gcb.15503
Andersen T., Carstensen J., Hernández-García E., Duarte C. M. (2009). Ecological thresholds and regime shifts: approaches to identification. Trends Ecol. Evol. 24, 49–57. doi: 10.1016/j.tree.2008.07.014
Beaugrand G. (2004). The north Sea regime shift: Evidence, causes, mechanisms and consequences. Prog. Oceanogr. 60, 245–262. doi: 10.1016/j.pocean.2004.02.018
Beaugrand G., Brander K. M., Alistair Lindley J., Souissi S. (2003). Plankton effect on cod recruitment in the north Sea C. Nature 426, 661–664. doi: 10.1038/nature02164
Beaugrand G., Ibanez F. (2004). Monitoring marine plankton ecosystems. II: Long-term changes in north Sea calanoid copepods in relation to hydro-climatic variability. Mar. Ecol. Prog. Ser. 284, 35–47. doi: 10.3354/meps284035
Beisner B. E., Haydon D. T., Cuddington K. (2003). Alternative stable states in ecology. Front. Ecol. Environ. 1, 376–382. doi: 10.1890/1540-9295(2003)001[0376:ASSIE]2.0.CO;2
Beukhof E., Dencker T., Pecuchet L., Lindegren M. (2019). Spatio-temporal variation in marine fish traits reveals community-wide responses to environmental change. Mar. Ecol. Prog. Ser. 610, 205–222. doi: 10.3354/meps12826
Biggs R., Schlüter M., Biggs D., Bohensky E. L., BurnSilver S., Cundill G., et al. (2012). Toward principles for enhancing the resilience of ecosystem services. Annu. Rev. Environ. Resour. 37, 421–448. doi: 10.1146/annurev-environ-051211-123836
Cardinale M., Dörner H., Abella A., Andersen J. L., Casey J., Döring R., et al. (2013). Rebuilding EU fish stocks and fisheries, a process under way? Mar. Policy 39, 43–52. doi: 10.1016/j.marpol.2012.10.002
Carpenter S. R. (2001)“Alternate states of ecosystems: evidence and some implications,” Ecology: achievement and challenge (Oxford: Blackwell Science). Available at: https://lter.limnology.wisc.edu/content/alternate-states-ecosystems-evidence-and-some-implications (Accessed May 11, 2017).
Couce E., Schratzberger M., Engelhard G. (2020). Reconstructing three decades of total international trawling effort in the North Sea. Earth Syst. Sci. Data 12, 373–386. doi: 10.5194/essd-2019-90
Cramer A. O. J., van Borkulo C. D., Giltay E. J., van der Maas H. L. J., Kendler K. S., Scheffer M., et al. (2016). Major depression as a complex dynamic system. PloS One 11, e0167490. doi: 10.1371/journal.pone.0167490
Dakos V., Kéfi S. (2022). Ecological resilience: What to measure and how. Environ. Res. Lett. 17, 043003. doi: 10.1088/1748-9326/ac5767
DeYoung B., Barange M., Beaugrand G., Harris R., Perry R. I., Scheffer M., et al. (2008). Regime shifts in marine ecosystems: Detection, prediction and management. Trends Ecol. Evol. 23, 402–409. doi: 10.1016/j.tree.2008.03.008
Diks C., Wang J. (2016). Can a stochastic cusp catastrophe model explain housing market crashes? J. Econ. Dyn. Control 69, 68–88. doi: 10.1016/j.jedc.2009.04.004
Dray S., Dufour A. B. (2007). The ade4 package: Implementing the duality diagram for ecologists. J. Stat. Software 22, 1–20.
Emeis K.-C., van Beusekom J., Callies U., Ebinghaus R., Kannen A., Kraus G., et al. (2015). The north Sea - a shelf sea in the anthropocene. J. Mar. Syst. 141, 18–33. doi: 10.1016/j.jmarsys.2014.03.012
Engelhard G. H., Pinnegar J. K., Kell L. T., Rijnsdorp A. D. (2011). Nine decades of north Sea sole and plaice distribution. ICES J. Mar. Sci. 68, 1090–1104. doi: 10.1093/icesjms/fsr031
Erdman C., Emerson J. W. (2007). Bcp: An r package for performing a Bayesian analysis of change point problems. J. Stat. Software 23, 1–13. doi: 10.18637/jss.v023.i03
Fauchald P. (2010). Predator-prey reversal: A possible mechanism for ecosystem hysteresis in the north Sea? Ecology 91, 2191–2197. doi: 10.1890/10-1922.1
Grasman R. P. P. P., Van Der Maas H. L. J., Wagenmakers E. (2009). Fitting the cusp catastophe in r: a cusp package primer. J. Stat. Software 32, 1–25. doi: 10.18637/jss.v032.i08
Heinze C., Blenckner T., Martins H., Rusiecka D., Döscher R., Gehlen M., et al. (2021). The quiet crossing of ocean tipping points. Proc. Natl. Acad. Sci. U. S. A. 118. doi: 10.1073/pnas.2008478118
Hislop J. R. (1996). Changes in north Sea gadoid stocks. ICES J. Mar. Sci. 53, 1146–1156. doi: 10.1006/jmsc.1996.0140
Hoegh-Guldberg O., Bruno J. F. (2010). The impact of climate change on the world’s marine ecosystems. Sci. (80-) 328, 1523–1528. doi: 10.1126/science.1189930
Hughes T. P., Carpenter S., Rockström J., Scheffer M., Walker B. (2013a). Multiscale regime shifts and planetary boundaries. Trends Ecol. Evol. 28, 389–395. doi: 10.1016/j.tree.2013.05.019
Hughes T. P., Linares C., Dakos V., van de Leemput I. A., van Nes E. H. (2013b). Living dangerously on borrowed time during slow, unrecognized regime shifts. Trends Ecol. Evol. 28, 149–155. doi: 10.1016/J.TREE.2012.08.022
Hurrell J. W. (1995). Decadal trends in the north Atlantic oscillation: Regional temperatures and precipitation. Science 269, 676–679. doi: 10.1126/science.269.5224.676
ICES (2015) Manual for the international bottom trawl surveys. Available at: http://www.ices.dk/community/groups/Pages/IBTSWG.aspx.
Jones D. D. (1977). Catastrophe theory applied to ecological systems. Simulation 29 (1), 1–15. doi: 10.1177/003754977702900102
Legendre P., Gallagher E. D. (2001). Ecologically meaningful transformations for ordination of species data. Oecologia 129, 271–280. doi: 10.1007/s004420100716
Levin P. S., Möllmann C. (2015). Marine ecosystem regime shifts: Challenges and opportunities for ecosystem-based management. Philos. Trans. R. Soc B. 370, 20130275. doi: 10.1098/rstb.2013.0275
Litzow M. A., Hunsicker M. E. (2016). Early warning signals, nonlinearity, and signs of hysteresis in real ecosystems. Ecosphere 7. doi: 10.1002/ecs2.1614
Lynam C. P., Llope M., Möllmann C., Helaouët P., Bayliss-Brown G. A., Stenseth N. C. (2017). Interaction between top-down and bottom-up control in marine food webs. Proc. Natl. Acad. Sci. U.S.A. 114, 1952–1957. doi: 10.1073/pnas.1621037114
Maritorena S., d’Andon O. H. F., Mangin A., Siegel D. A. (2010). Merged satellite ocean color data products using a bio-optical model: Characteristics, benefits and issues. Remote Sens. Environ. 114, 1791–1804. doi: 10.1016/j.rse.2010.04.002
Möllmann C., Cormon X., Funk S., Otto S. A., Schmidt J. O., Schwermer H., et al. (2021). Tipping point realized in cod fishery. Sci. Rep. 11 (1), 1–12. doi: 10.1038/s41598-021-93843-z
Möllmann C., Folke C., Edwards M., Conversi A. (2015). Marine regime shifts around the globe: Theory, drivers and impacts. Phil. Trans. R. Soc B. 370, 2013026020130260. doi: 10.1098/rstb.2013.0260
Murtagh F., Legendre P. (2014). Ward’s hierarchical agglomerative clustering method: Which algorithms implement ward’s criterion? J. Classif. 31, 274–295. doi: 10.1007/s00357-014-9161-z
Núñez-Riboni I., Akimova A. (2015). Monthly maps of optimally interpolated in situ hydrography in the north Sea from 1948 to 2013. J. Mar. Syst. 151, 15–34. doi: 10.1016/j.jmarsys.2015.06.003
Petraitis P. S., Dudgeon S. R. (2015). Variation in recruitment and the establishment of alternative community states. Ecology 96, 3186–3196. doi: 10.1890/14-2107.1
Rocha J. C., Peterson G. D., Biggs R. (2015). Regime shifts in the anthropocene: Drivers, risks, and resilience. PloS One 10. doi: 10.1371/journal.pone.0134639
Scheffer M., Bascompte J., Brock W. A., Brovkin V., Carpenter S. R., Dakos V., et al. (2009). Early-warning signals for critical transitions. Nature 461, 53–59. doi: 10.1038/nature08227
Scheffer M., Carpenter S. R. (2003). Catastrophic regime shifts in ecosystems: linking theory to observation. Trends Ecol. Evol. 18, 648–656. doi: 10.1016/j.tree.2003.09.002
Scheffer M., Carpenter S. R., Foley J. A., Folke C., Walker B. (2001). Catastrophic shifts in ecosystems. Nature 413, 591–596. doi: 10.1038/35098000
Schmitt R. J., Holbrook S. J., Davis S. L., Brooks A. J. (2019). Experimental support for alternative attractors on coral reefs C. Proc. Natl. Acad. Sci. U. S. A. 116, 4372–4381. doi: 10.1073/pnas.1812412116
Selkoe K. A., Blenckner T., Caldwell M. R., Crowder L. B., Erickson A. L., Essington T. L., et al. (2015). Principles for managing marine ecosystems prone to tipping points. Ecosyst. Heal. Sustain. 1, 17. doi: 10.1890/EHS14-0024.1
Sguotti C., Cormon X. (2018). “Regime shifts – a global challenge for the sustainable use of our marine resources”, in YOUMARES 8 – oceans across boundaries: Learning from each other (Cham: Springer International Publishing), 155–166. doi: 10.1007/978-3-319-93284-2_11
Sguotti C., Otto S. A., Cormon X., Werner K. M., Deyle E., Sugihara G., et al. (2019a). Non-linearity in stock–recruitment relationships of Atlantic cod: Insights from a multi-model approach. ICES J. Mar. Sci 77 (4), 1492–1502. doi: 10.1093/icesjms/fsz113
Sguotti C., Otto S. A., Frelat R., Langbehn T. J., Ryberg M. P., Lindegren M., et al. (2019b). Catastrophic dynamics limit Atlantic cod recovery. Proc. R. Soc B. 286. doi: 10.1098/rspb.2018.2877
Thom R. (1977). Structural stability, catastrophe theory and applied mathematics. The John yon Neumann lecture. SIAM Rev. 19. doi: 10.1137/1019036
Ushio M., Hsieh C.-H., Masuda R., Deyle E. R., Ye H., Chang C.-W., et al. (2018). Fluctuating interaction network and time-varying stability of a natural fish community. Nature 554, 360–363. doi: 10.1038/nature25504
Vasilakopoulos P., Raitsos D. E., Tzanatos E., Maravelias C. D. (2017). Resilience and regime shifts in a marine biodiversity hotspot. Sci. Rep. 7, 13647. doi: 10.1038/s41598-017-13852-9
Keywords: regime shifts, irreversibility, hysteresis, ecosystem resilience, stochastic cusp modeling, marine ecosystems
Citation: Sguotti C, Blöcker AM, Färber L, Blanz B, Cormier R, Diekmann R, Letschert J, Rambo H, Stollberg N, Stelzenmüller V, Stier AC and Möllmann C (2022) Irreversibility of regime shifts in the North Sea. Front. Mar. Sci. 9:945204. doi: 10.3389/fmars.2022.945204
Received: 16 May 2022; Accepted: 30 August 2022;
Published: 21 September 2022.
Edited by:
Martin Edwards, Plymouth Marine Laboratory, United KingdomReviewed by:
Mary Hunsicker, National Marine Fisheries Service (NOAA), United StatesRicardo Serrão Santos, University of the Azores, Portugal
Copyright © 2022 Sguotti, Blöcker, Färber, Blanz, Cormier, Diekmann, Letschert, Rambo, Stollberg, Stelzenmüller, Stier and Möllmann. This is an open-access article distributed under the terms of the Creative Commons Attribution License (CC BY). The use, distribution or reproduction in other forums is permitted, provided the original author(s) and the copyright owner(s) are credited and that the original publication in this journal is cited, in accordance with accepted academic practice. No use, distribution or reproduction is permitted which does not comply with these terms.
*Correspondence: Camilla Sguotti, Y2FtaWxsYS5zZ3VvdHRpQHVuaS1oYW1idXJnLmRl; Y2FtaWxsYS5zZ3VvdHRpQHVuaXBkLml0