 Junhyeong Seo
 Guebuem Kim
 Jae-Hyoung Park
 Hojong Seo
 Taehee Na
 Sok Kuh Kang
 Jeomshik Hwang
- 1School of Earth and Environmental Sciences/Research Institute of Oceanography, Seoul National University, Seoul, South Korea
- 2Marine Environmental Research Center, Korea Institute of Ocean Science and Technology (KIOST), Busan, South Korea
- 3Ocean Circulation and Climate Research Center, Korea Institute of Ocean Science and Technology (KIOST), Busan, South Korea
We examined particulate organic carbon (POC) export using 238U–234Th disequilibrium in the tropical northwest Pacific Ocean, where numerous eddies are present. We obtained data from an anticyclonic eddy in 2019 and from both anticyclonic and cyclonic eddies in 2020. In 2019, excess 234Th and higher POC concentrations were observed in the upper 100 m layer inside the anticyclonic eddy compared with the outer area of the eddy (the reference site). We speculate that the peculiar feature of excess 234Th in the surface layer was caused by horizontal transport of POC into the eddy and consequent POC degradation and release of particulate 234Th to a dissolved form. However, in 2020, lower POC concentrations with 234Th deficiency were observed in both cyclonic and anticyclonic eddies relative to the reference site. In both years, POC export was lower in the cores of the anticyclonic and cyclonic eddies relative to the reference site. We propose that severe nutrient depletion in the upper 150 m layer hindered nutrient supply by vertical water movement in the eddies. Despite the low POC export at 100 m depth, POC export at 500 m depth was comparable to values observed at 500 m depth at Station Papa in the more productive northeastern Pacific region. Our results imply that POC export into the deep ocean interior in this region may not be as low as expected from the low primary productivity in the euphotic zone.
Introduction
The tropical northwest Pacific (NWP) is one of the world’s largest oligotrophic regions. This region is characterized by low nutrient concentrations, particulate organic carbon (POC) inventory (Liu et al., 1995), and primary production (PP), with a dominant contribution from cyanobacteria (Li et al., 2018). Thus, any process that supplies external nutrients into the euphotic zone, such as mesoscale eddies are expected to affect biogeochemical processes in this oligotrophic ocean. Anticyclonic (warm) eddies usually exhibit lower phytoplankton biomass and PP than ambient water owing to their deeper thermocline (McGillicuddy and Robinson, 1997), whereas cyclonic (cold) eddies usually have higher phytoplankton biomass and PP due to the vertical transport of nutrient-replete deep water into the euphotic zone (Uchiyama et al., 2017). However, some studies have reported results that are inconsistent with these patterns (Franks et al., 1986; Greenwood et al., 2007; Fong et al., 2008). Dufois et al. (2017) suggested that PP in anticyclonic eddies is controlled by several competing processes, such as advection of productive waters and deeper vertical mixing.
In the NWP, mesoscale eddies are prevalent because of baroclinic instability associated with vertical shears between the North Equatorial Current and the eastward-flowing North Pacific Subtropical Countercurrent (Qiu, 1999) (Figure 1). Xu et al. (2019) reported that ~5,000 eddies were detected in the NWP over 20 years (1993–2013), with a mean lifespan of ~7 weeks and a mean speed of 6 km d−1 westward. Yun et al. (2020) reported no clear differences in phytoplankton biomass and PP between the outer area of the eddies and the mesoscale eddies in the tropical NWP.
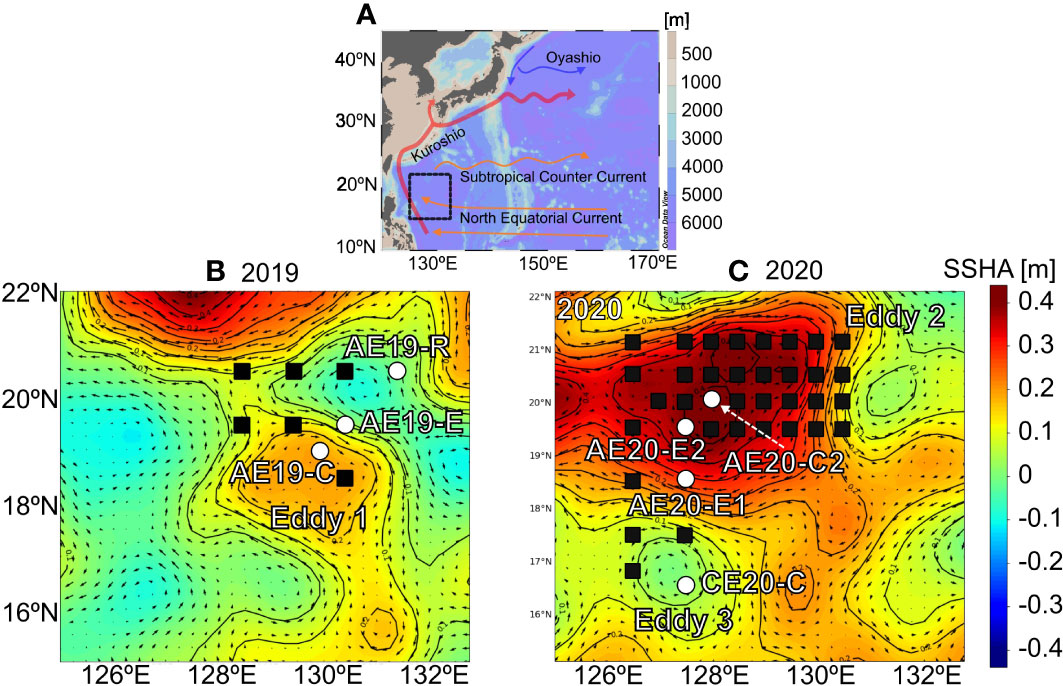
Figure 1 (A) Map showing the study region (black rectangle) and surface currents in the tropical northwest Pacific (modified from Gallagher et al., 2015). Blow-up map showing (B) the sampling stations (Eddy 1) in September 2019 and (C) sampling stations (Eddy 2 and Eddy 3) in September 2020. Circle (white) and squares (black) represent particulate and hydrography sampling, respectively. The background color shows the sea surface height anomaly (SSHA) averaged over the sampling period. The black arrows indicate the geostrophic current.
POC export out of the euphotic zone or the surface mixed layer is an essential process to transport carbon into the ocean interior. Export efficiency, defined as the ratio of POC export to primary production, was reportedly lower than 10% in this oligotrophic region (Buesseler et al., 1998; Hung and Gong, 2007). Mesoscale eddies may also affect the export efficiency in addition to primary productivity. Compared to the physical structure and PP of the eddies, the effect of mesoscale eddies on POC export processes is not well studied.
In this study, we examined the distributions of nutrients, POC, together with the distributions of total and particulate 234Th activities, to investigate the characteristics of POC export in the eddies of the tropical NWP. 238U–234Th disequilibrium has been successfully utilized to determine the scavenging rates of particle-reactive elements and POC export in the ocean (Buesseler et al., 1992; Owens et al., 2015). This method is based on the fact that 238U (t1/2 = 4.5 x 10⁹ y) is conservative while its daughter 234Th (t1/2 = 24.1 d) is particle-reactive and scavenged by sinking particles from the surface layer. We applied this method in the oligotrophic tropical NWP.
Materials and methods
Samples were collected in the tropical NWP (16–22°N, 126–132°E) from 30 August to 11 September 2019 and from 8 to 25 September 2020 aboard the R/V Isabu (Figure 1). Eddies were identified from the daily sea-level anomaly and the corresponding surface geostrophic current data from the Copernicus Marine Environment Monitoring Service (http://marine.copernicus.eu). The vertical distributions of temperature and salinity were also consulted to determine the presence of eddies (Figures 2, 3). In 2019, the hydrographic survey was conducted in and around an anticyclonic eddy (Eddy 1: ~220 km in diameter, ~45 days since formation, centered at 19°N, 130°E) from 3 to 5 September. In 2020, both an anticyclonic eddy (Eddy 2: ~660 km in diameter, ~180 days since formation, centered at 19°N, 129°E) and a cyclonic eddy (Eddy 3: ~110 km in diameter, ~30 days since formation, centered at 17°N, 128°E) were sampled from 13 to 18 September.
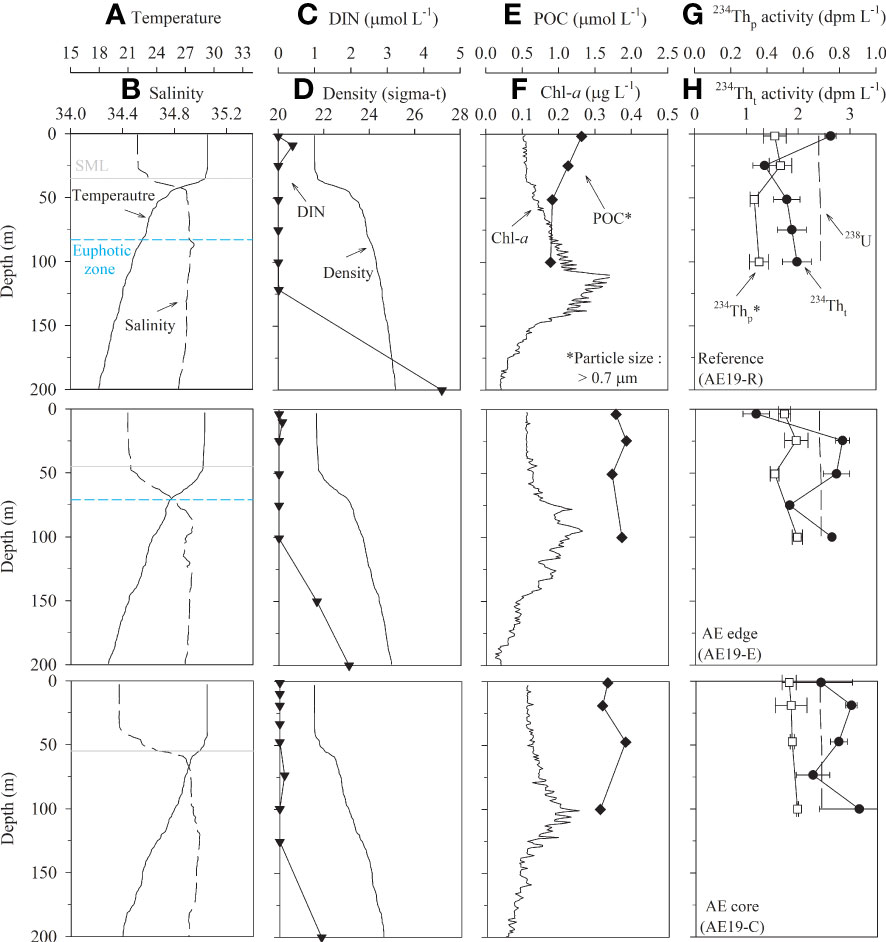
Figure 2 Vertical distributions of (A) temperature, (B) salinity, (C) DIN, (D) density, (E) POC, (F) Chl-a, (G) 234Thp, and (H) 234Tht at the reference site, the edge, and the core of an anticyclonic eddy in the tropical northwest Pacific in September 2019. The depths of SML (solid line) and euphotic zone (dashed line; 1% of PAR, photosynthetically active radiation) are denoted. The euphotic zone at AE19-C were not shown because PAR data are not available. Particle samples were > 0.7 µm.
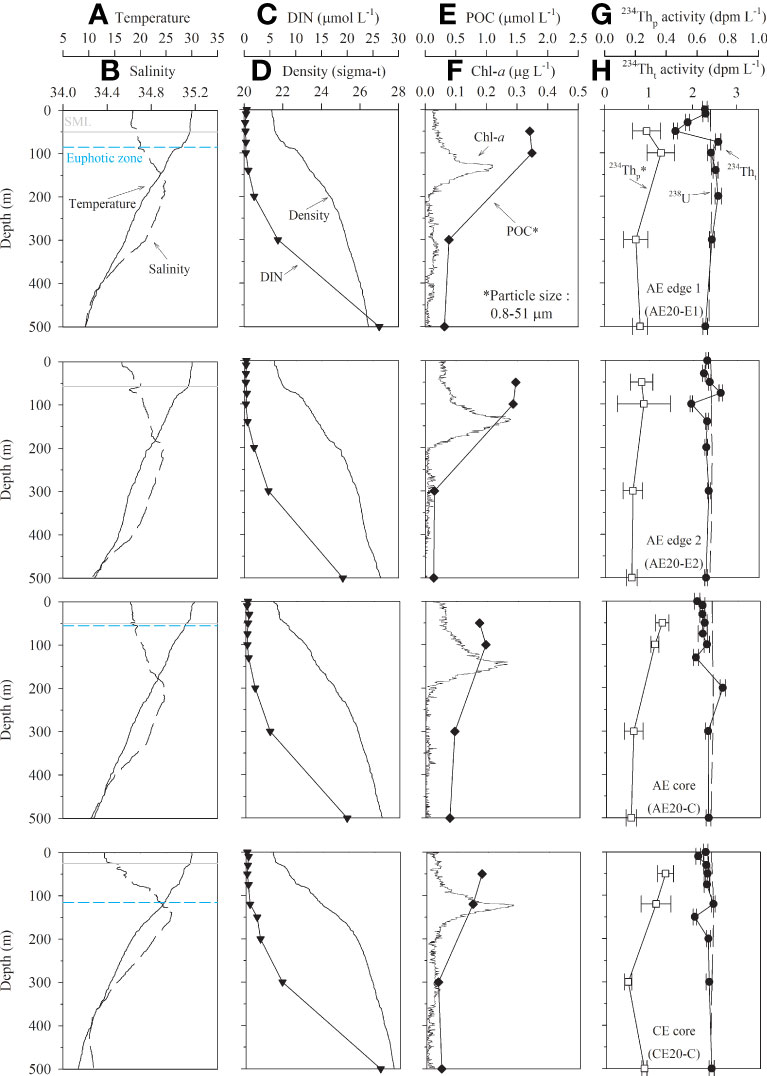
Figure 3 Vertical distributions of (A) temperature, (B) salinity, (C) DIN, (D) density, (E) POC, (F) Chl-a, (G) 234Thp, and (H) 234Tht at the edges, the core of an anticyclonic eddy, and the core of a cyclonic eddy in the tropical northwest Pacific in September 2020. The depths of SML (solid line) and euphotic zone (dashed line) are denoted. The euphotic zone at AE20-E2 were not shown because PAR data are not available. Particle samples were 0.8–51 µm in size.
Water samples were collected using a Rosette sampler equipped with Niskin bottles and a conductivity-temperature-depth (CTD) instrument (SeaBird, SBE-911 plus). Water samples used to analyze nutrients and chlorophyll-a (Chl-a) were immediately filtered through a pre-combusted (4 h at 450°C) glass fiber filter (GF/F, Whatman, 0.7 μm pore size). For nutrients and Chl-a analyses, samples were collected in high-density polyethylene bottles and stored at −20°C and −70°C, respectively. For the measurement of total 234Th activity, each 4 L seawater sample was collected in a polyethylene bottle without filtration in 2019. We increased the sample volume to 10 L in 2020 to reduce measurement uncertainties. Within one hour after the collection, samples were acidified (pH < 1) with 8 N HNO3.
In 2019, particulate samples used for 234Th and POC analyses were collected on a pre-combusted (4 h at 450°C) GF/F (142 mm diameter) using a single-filter head large volume filtration (WTS-LV, McLane, USA). In 2020, a dual-filter head McLane system was used with a Supor filter (Pall, 0.8 μm pore size, 142 mm diameter) and a pre-combusted GF/F (47 mm diameter) in line with a 51 μm pore size pre-filter. The particulate samples were collected at four depths each at three sites (AE19-R, AE19-E, and AE19-C) in 2019 and at four sites (AE20-E1, AE20-E2, AE20-C, and CE20-C) in 2020 (Figure 1). Approximately 400 L was filtered at a flow rate of 4–5 L m−1. Filtered samples were stored immediately at −70°C. As for site naming, AE19-R, AE19-E, and AE19-C represent the outer area (reference site), the edge area, and the core site of the anticyclonic eddy observed in 2019, respectively. For stations in 2020, AE20-E1, AE20,E2, AE20-C, and CE20-C represent the edge areas (E1 and E2), the core area of the anticyclonic eddy, and the core of the cyclonic eddy, respectively.
Analytical methods for Chl-a and nutrients are reported in Seo et al., (submitted-this issue). Briefly, Chl–a concentrations were determined using a fluorescence sensor (WET Labs ECO-AFL/FL), calibrated by a high-performance liquid chromatography (HPLC; n=88, r2 = 0.41, Figure S1). Nutrients (NH4+, NO2−, NO3−, PO43−, and Si(OH)4) were measured using an automatic nutrient analyzer (New QuAAtro39, SEAL Analytical), with a measurement accuracy of < 5% for a certified nutrient reference material (KANSO Co., LTD). For POC concentration, a 25 mm diameter circle was punched out from the GF/F filter. The sample was decarbonated by HCl fumigation in a desiccator, and POC concentration was measured using an elemental analyzer (EA 2400 CHNS/O Series II, PerkinElmer, USA) (Knap et al., 1996). The procedural blank was < 1% of the average sample concentration, and measurement uncertainty was < 2% based on multiple analyses of a sulfanilamide standard.
For the total 234Th (234Tht) measurement, an internal standard (230Th, 6.5 dpm) was added to the 4 L seawater sample collected in 2019 after acidification. KMnO4 and MnCl2 were added and allowed to stand for > 6 hours to form ~4 mg of MnO2 precipitate (Benitez-Nelson et al., 2001). The precipitates were collected using a quartz microfiber filter (Whatman 1.0 μm pore-size, 25 mm diameter), which took 24–28 hours. The filter with the stainless steel disc was covered with two layers of aluminum foil on board the research vessel. Beta-counting of 234Th for the covered filter was performed using a low-level beta counter (RISØ National Laboratories, Denmark) in a land-based laboratory. After beta counting, the recovery of 230Th was measured by adding a 229Th spike, and Th was further separated using an anion exchange column (Bio-Rad Laboratories, Hercules, CA). Both 229Th and 230Th were measured using a magnetic sector-field inductively coupled plasma-mass spectrometer (ICP-MS, Element 2, Thermo Scientific) (Pike et al., 2005). The activity of particulate 234Th (234Thp, > 0.7 µm) was measured using a beta counter in the punched-out portion (25 mm diameter) of each filter from the large volume filtration. The measured activities were considerably higher than the GF/F filter blank (~0.7 cpm).
To increase the sample volume with higher throughput, we used a modified method of the traditional Fe-precipitation method for the Th samples collected in 2020. The details of the method are described in Seo et al. (2021). In brief, for each measurement of 234Tht, an internal standard (230Th, 6.5 dpm) and Fe carrier (70 mg) were added to ~10 L of acidified seawater sample. After equilibration (~12 hours), the pH was adjusted to ~8 using NH4OH to form Fe precipitates. After siphoning off the supernatant, Fe precipitates were collected on filter paper (Whatman Grade 54). The precipitates were dissolved using 8 N HNO3 and heated for 1–2 hours in a hot block. The Th separation was then conducted using a UTEVA resin (Eichrom Industries, Darien, IL) on board the research vessel. In a land-based laboratory, Th was co-precipitated with CeF3 and placed on a filter paper (Eichrom, 0.1 μm pore size, and 25 mm diameter) for alpha and beta counting of 230Th and 234Th, respectively. The 234Thp activity was determined using the same method as the 234Tht method after acid digestion (using a mixture of concentrated HCl and HNO3) of a portion of the Supor filter sample, corresponding to ~50 L of seawater volume. The measured 234Th activity was corrected for chemical recovery, decay, and ingrowth from 238U. The initial beta-counting of all 234Th samples in 2019 and 2020 was performed within 15 days after the sampling. A series of counting was conducted to ensure the purity of the samples and for the calculation of counting uncertainties. The mean chemical recovery for the 234Th measurements in 2019 and 2020 was 82% ± 10% and 89% ± 12%, respectively. The procedural blank was < 1% of the samples, and the uncertainties of blank measurement and recovery (~10%) are based on 2-sigma counting statistics. Compatibility of the two methods of 234Tht measurement was ascertained by analysis of the equilibrium activities of 234Th and 238U (~2.5 dpm L−1) in a seawater standard (Seo et al., 2021).
Results
Sea surface height anomaly (SSHA) showed the presence of anticyclonic (positive SSHA values) and cyclonic (negative SSHA values) eddies with a spatially alternating pattern in both years. In 2019, the maximum SSHA was ~0.2 m for Eddy 1 (Figure 1). Vertical temperature distribution in the entire study region showed that the surface mixed layer (SML; defined as the depth at which the temperature was 0.5°C lower than that in the surface layer; Price et al., 1986; Kelly and Qiu, 1995) ranged from 35 to 59 m (50 ± 8 m; mean ± σ) in thickness. The thickness of the SML at AE19-R (reference site), AE19-E (edge site), and AE19-C (core site) was approximately 35, 45, and 55 m, respectively, deepening toward the eddy core (Figure 2). In 2020, the maximum SSHAs in Eddy 2 and Eddy 3 were ~0.4 m and about −0.1 m, respectively (Figure 1). The vertical gradients in temperature and density in 2020 were smaller than in 2019 (Figure 3). The SML ranged from 25 to 75 m in thickness (60 ± 14 m; mean ± σ). The thickness of the SML at AE20-E1 (edge of the anticyclonic eddy), AE20-E2 (edge of the anticyclonic eddy), AE20-C (core of the anticyclonic eddy), was about 50, 57, and 50 m, respectively, whereas that at CE20-C (core of the cyclonic eddy), 25 m, was notably shallower.
In 2019, Chl-a concentrations determined by a fluorescence sensor in the entire study region were < 0.38 μg L−1. Subsurface chlorophyll maximum (SCM) was observed in the 100–150 m layer, which is deeper than the euphotic zone (1% PAR, Photosynthetically Active Radiation) (Figure S2). At the three sites in Eddy 1, the Chl-a concentrations were < 0.35 μg L−1, with the SCM at 90–120 m depth (Figure 2). In 2020, the maximum Chl-a concentration in the entire study region was 0.29 μg L−1. The SCM was in the 100–150 m layer and therefore, in a similar position to that in 2019. In Eddy 2 and Eddy 3, the Chl-a concentrations were < 0.28 μg L−1, with the SCM in the 120–140 m depth range, which is slightly deeper than in 2019 (Figure 3). In both years, the Chl-a concentrations inside the eddies were not significantly different from those in the reference and edge sites. The Chl-a concentrations and the position of the SCM in the study region were similar to those observed in the Kuroshio-Oyashio confluence region in the subtropical northwest Pacific Ocean (Chl-a: 0.01–0.93 μg L−1 and SCM: 100–120 m) (Venrick, 1990; Li et al., 2018) and in the subtropical North Pacific gyre (ALOHA) in summer (Chl-a: 0.18 ± 0.08 μg L−1, SCM: ~120 m) (Prahl et al., 2005).
Dissolved inorganic nitrogen (DIN) concentrations in 2019 showed depletion (< 2 μmol L−1; here 2 μmol L−1 was adopted as the threshold following Reynolds, 2006) between the surface and a depth of 100–120 m and increased gradually with depth, with no clear differences observed between the reference site and the eddy sites (Figure 2). Here, DIN is equivalent to NO3−, as the concentrations of NO2− and NH4+ were below the detection limit for all samples. Vertical distribution patterns of dissolved inorganic phosphate and silicate were similar to that of DIN (not shown). In 2020, the vertical distributions of DIN at AE20-E1, AE20-E2, and AE20-C were similar to those observed in 2019 (Figure 3). In both years, the mean DIN concentration at 150 m was 0.74 ± 0.24 μmol L−1 at all stations, except in the core of the cyclonic eddy (CE20-C), which showed a slightly higher concentration (2 μmol L−1). This thick nutrient-depleted layer (~150 m) is commonly observed in the NWP region (Kitajima et al., 2009; Chen et al., 2013) and is much deeper than in the productive area (e.g., at Station Papa in the northeastern Pacific) (Signorini et al., 2001). In 2020, the DIN concentrations at 500 m depth at all sites were similar, with a mean value of 23 ± 4 μmol L−1 (Figure 3).
The mean POC concentrations (> 0.7 μm particle size) in the upper 100 m layer in 2019 were 1.06 ± 0.20, 1.82 ± 0.09, and 1.67 ± 0.16 μmol L−1 at AE19-R, AE19-E, and AE19-C, respectively (Figure 2). Thus, the POC concentrations were higher at the core and edge of the anticyclonic eddy than at the reference site. The vertical distributions of POC showed a small variation. In 2020, the mean POC concentrations (0.7–51 μm particle size) in the upper 100 m layer were 1.73 ± 0.03, 1.45 ± 0.03, 0.92 ± 0.07, and 0.83 ± 0.10 μmol L−1 at AE20-E1, AE20-E2, AE20-C, and CE20-C, respectively (Figure 3). The POC concentrations were lower in the cores of the anticyclonic and cyclonic eddies. In general, small particles (< 51 μm) are the largest fraction of POC in the oceanic environments (Lam et al., 2015; Lam et al., 2018). Thus, the POC concentrations of 0.7–51 μm particles are likely similar to those of > 0.7 μm particles. In this sense, POC concentrations in 2020 were not likely different from those observed in 2019. POC concentrations in this study region were lower than those observed (2.0 to 6.1 μmol L−1; > 0.45 μm particle size) in other parts of the northwest Pacific Ocean (20–32°N and 130–153°E; Zhong et al., 2021). The POC concentrations in the deeper layer (100–500 m) in 2020 ranged from 0.14 to 0.47 μmol L−1 (0.29 ± 0.12 μmol L−1; mean ± σ). The POC concentrations decreased sharply to similar values at 300 m and 500 m (Figure 3).
The 238U activity based on the salinity (Owens et al., 2011) ranged from 2.39 to 2.43 dpm L−1 in both years. The 234Tht activities in the upper 100 m layer in 2019 were 1.35–2.63, 1.18–2.84, and 2.26–3.67 dpm L−1 at AE19-R, AE19-E, and AE19-C, respectively (Figure 2). 234Tht activity increased toward the core of the anticyclonic eddy, with excess 234Tht in the edge and core. In 2020, the 234Tht activities in the upper 100 m layer were 1.61–2.58, 1.96–2.62, 2.06–2.28, and 2.08–2.42 dpm L−1 at AE20-E1, AE20-E2, AE20-C, and CE20-C, respectively (Figure 3). The vertical distributions of 234Tht showed no clear difference between the anticyclonic and cyclonic eddies. The 234Tht activities (2.35 ± 0.16 dpm L−1) in the deeper layer (100–500 m) were close to the equilibrium value, but slight excess activities at AE20-E1 and deficiency at AE20-E2, AE20-C, and CE20-C were observed (Figure 3).
In 2019, 234Thp (> 0.7 μm particle size) activities in the upper 100 m layer ranged from 0.33 to 0.56 dpm L−1 (Figure 2). Slightly higher activities were observed at the edge and core of the anticyclonic eddy (0.44–0.56 dpm L−1) than at the reference site (0.33–0.47 dpm L−1). In 2020, 234Thp (0.8–51 μm) activities in the upper 100 m layer ranged from 0.24 to 0.38 dpm L−1. The 234Thp activity in large particles (> 51 μm) was below the detection limit. Thus, the 234Thp activity of 0.8–51 μm particles should be the same as that of > 0.7 μm particles. The 234Thp activities in 2020 were slightly lower than those observed in 2019 (Figures 2, 3). Unlike in 2019, we observed no spatial differences in 234Thp activity associated with the eddies. However, the vertical distribution of 234Thp in the upper 100 m layer showed similar patterns in 2019 and 2020. In 2020, 234Thp ranged from 0.14 to 0.25 dpm L−1 (0.19 ± 0.04 dpm L−1) in the deeper layer (100–500 m). 234Thp activities decreased sharply from 100 m to 300 m, but the values at 500 m were similar to those at 300 m (Figure 3).
Discussion
Distributions of POC and 234Th
In 2019, POC concentration in the upper 100 m of the water column was higher within the anticyclonic eddy than at the reference site, as was the 234Thp activity (Figure 2 and Figure 4). The POC:234Thp ratio (μmol:dpm) in the upper 100 m layer increased from ~2.4 at the reference site to ~3.2 at the edge of the eddy (Figure 4). The 234Tht activity was also higher within the eddy than at the reference site. In the eddy core, we observed excess 234Tht activity over 238U (Figure 2), which is a unique feature not observed in the surface layer of the ocean since it is only possible when 234Th is imported from outside the system. Excess 234Tht is mainly caused by the presence of the dissolved form of 234Th (~0.72 dpm L−1 difference between the core and the reference site) and only minorly by the particulate form (~0.15 dpm L−1 difference). Therefore, we speculate that 234Th was imported in the particulate form, being attached to POC that was horizontally transported into the eddy, and was released into a dissolved form as POC decomposed. This suggests that processes that typically occur vertically in the oceanic water column (i.e., scavenging of Th in the surface layer then releasing to the water below, forming excess Tht), occur horizontally from outside the eddy to the eddy core. However, suspended particles will be moved with the water movement within the eddy while large particles are prone to gravitational settling. Thus, if an eddy is mature with age much longer than the half-life of 234Th, equilibrium within the eddy should be reached for 234Th, and no horizontal gradient is expected. Only ~45 days passed since its formation of Eddy 1, and thus equilibrium may not have been reached. The distribution of Chl-a did not show a commensurate increase toward the eddy core likely because it represents only living biomass and thus, in situ phytoplankton production (Savoye et al., 2003). Conversion of POC to DOC (dissolved organic carbon) may involve an increase in DOC concentration. However, such an increase was not clearly observed in our study (Seo et al., submitted-this issue), presumably because the fresh DOC and nutrients are consumed rapidly upon release.
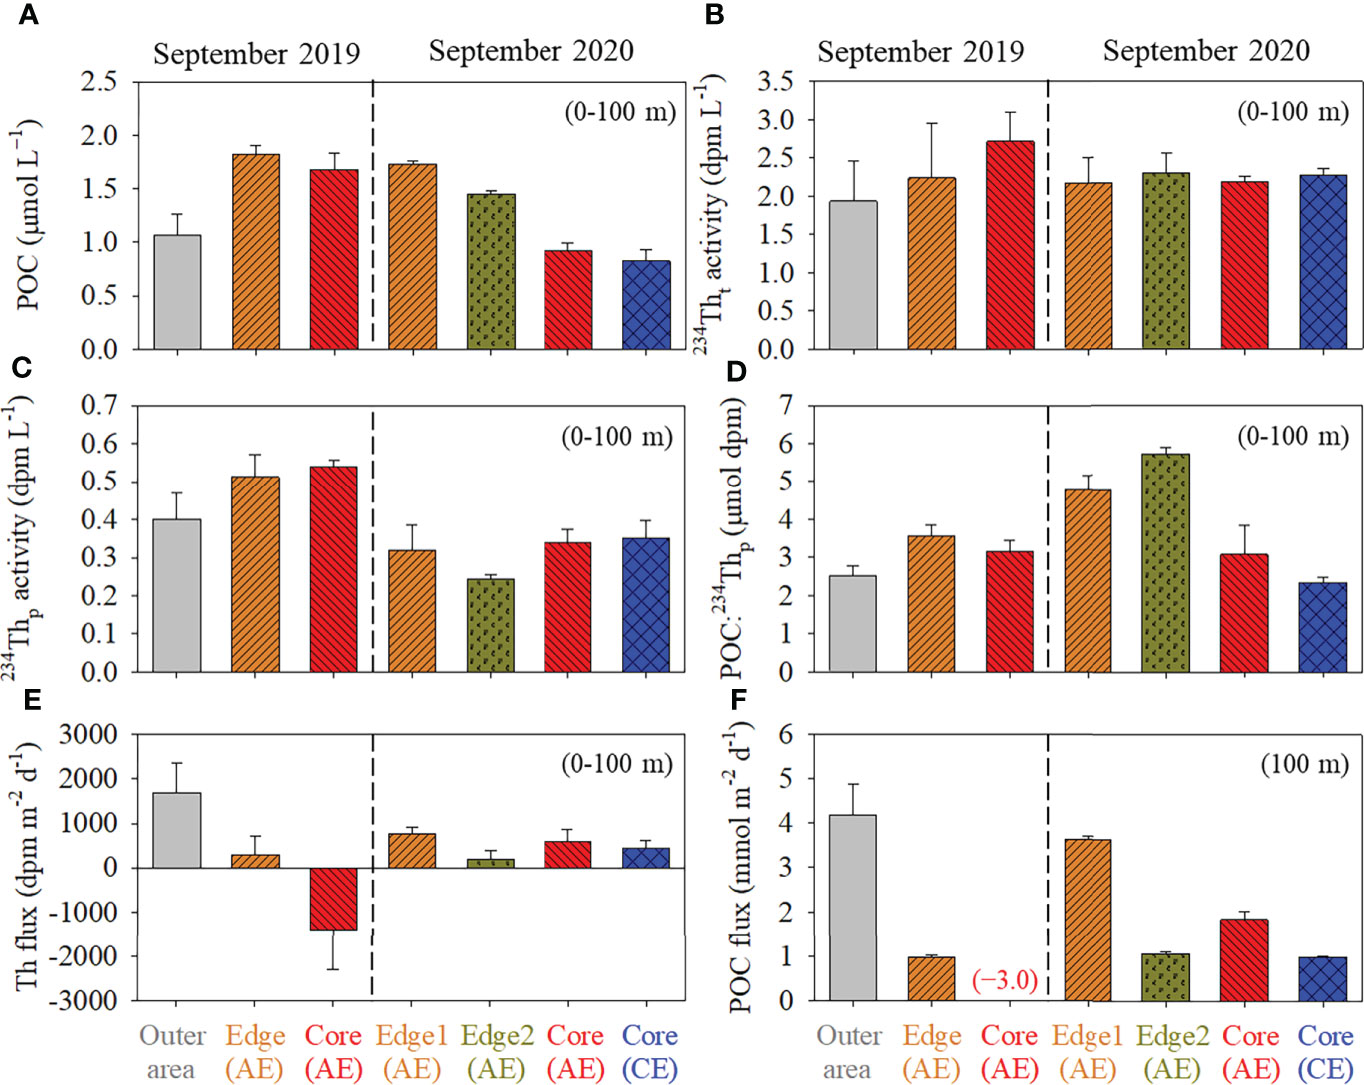
Figure 4 The concentrations of (A) POC, (B) 234Tht, (C) 234Thp, (D) POC:234Thp, (E) 234Th flux, and (F) POC flux in the upper 100 m layer at the reference site, the edge, the core of the anticyclonic eddy, and the core of the cyclonic eddy in the tropical northwest Pacific in Septembers 2019 and 2020.
In contrast to 2019, excess 234Tht was not observed in either eddies in 2020. In 2020, POC concentrations in the upper 100 m layer was lower in the cores of both eddies relative to the edge (Figures 3 and Figure 4), which is the opposite trend to that observed in 2019. It is not clear whether the excess 234Tht observed in 2019 was a persistent feature or only an ephemeral feature observed briefly soon after the formation of an eddy that collected POC from the surrounding water. However, because deficiencies of 234Tht relative to 238U are commonly observed in the surface layer, the excess of 234Tht observed in 2019 seems a special case.
Fluxes of 234Th
A generally used one-dimensional particle flux model based on the disequilibrium of 238U–234Th was applied to the study region (Savoye et al., 2006). The vertical flux of 234Th at a given depth (z) under the steady-state and negligible advection/diffusion is:
where PTh is the export flux (or removal from the water column) of 234Th; AU and ATh are the 238U and 234Th activities, respectively; and λTh is the decay constant of 234Th (0.02876 d−1). For the 2019 data, we attempted to estimate the flux at a depth of 100 m as recommed by Buesseler et al. (2006). This depth is below the euphotic zone in the study region (Figures 2, Figure 3 and Figure 5). The calculated 234Th fluxes were 1680 ± 680, 290 ± 410, and −1400 ± 900 dpm m−2 d−1 in the reference site, the edge, and the core of the anticyclonic eddy, respectively (Figure 4). The negative flux clearly indicates that the assumption is not justified and that the one-dimensional model is not applicable. The decrease in 234Th flux toward the eddy core and the negative flux in the core is most likely explained by horizontal particle transport because i) vertical upward transport of particles carrying 234Th should be negligible, and ii) convergence of water mass is usually predominant toward the core in the upper part of anticyclonic eddies. To fully simulate the process, a 3-dimensional physical model combined with behaviors of 234Th and POC will be necessary, which is not feasible in this study. The horizontal particle transport was apparently faster than the lifetime of 234Th (35 d). Qualitatively, the flux out of the water column at the reference site was large enough to support the negative flux of the core site. However, in 2020, the calculated 234Th fluxes, which ranged from 190 to 710 dpm m−2 d−1 at the four stations, did not show any trend toward the eddy core and no negative flux was observed. The 234Th fluxes at 100 m depth in 2020 were within the range of the values observed in the tropical oceans between 10°N and 30°N (740 ± 560 dpm m−2 d−1; Le Moigne et al., 2013).
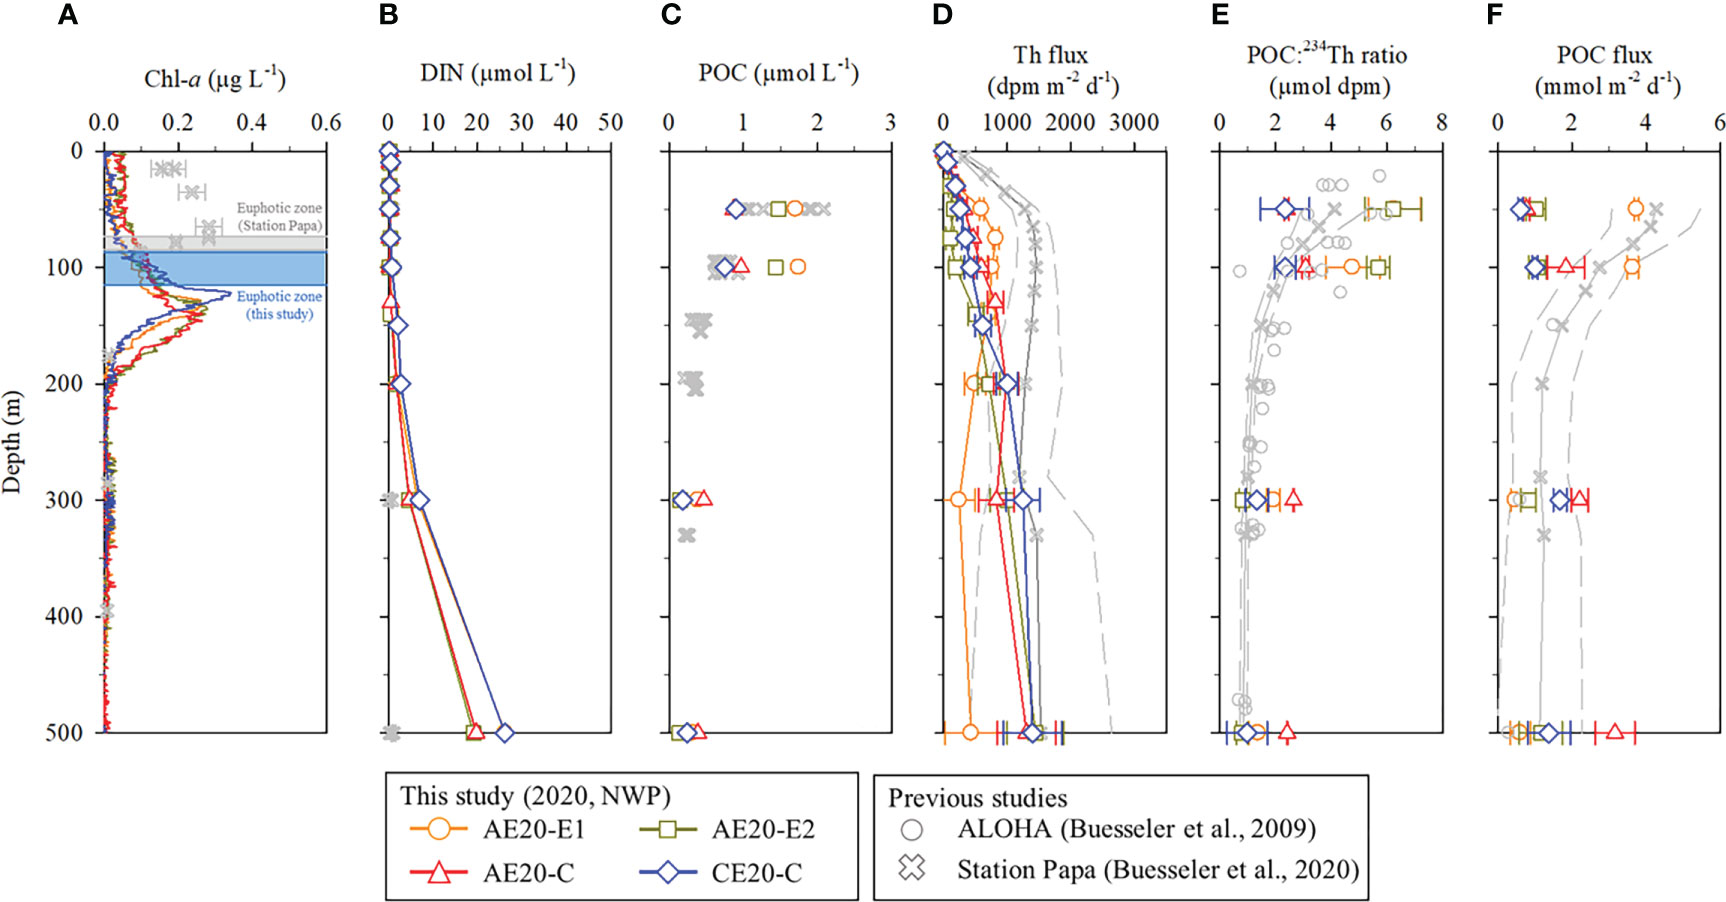
Figure 5 Vertical distributions in the upper 500 m layer of (A) Chl-a, (B) DIN, (C) POC, (D) 234Th flux, (E) POC:234Th ratio, and (F) POC flux in the tropical northwest Pacific in September 2020. The data for comparison are from Buesseler et al. (2009b) and Buesseler et al. (2020).
We expanded 234Th flux estimation to deeper depths than the euphotic zone in 2020. Below the particle production layer, the 234Th flux generally remains unchanged or decreases with increasing depth (Buesseler et al., 1995; Savoye et al., 2004). Decreasing 234Th flux with depth can be caused by releasing 234Th from particles as biogenic particles dissolve, and/or decomposition of POC resulting in a reduced POC:234Thp ratio. Steady-state and no lateral advection are a required condition. However, deviation from this condition results in small errors in the open ocean (Buesseler et al., 2020). The fluxes of 234Th at depths of 300 and 500 m in 2020 ranged from 250 to 1450 dpm m−2 d−1. The 234Th flux increased significantly with depth with the exception of AE20-E1, where it decreased with depth (Figure 5). At AE20-E1, the vertical distribution of the 234Th flux was different from that in the other stations: it was higher at shallow depths (< 100 m) and lower at greater depths (Figure 5). Increasing 234Th flux with depth implies net scavenging of 234Th. At 500 m water depth, the 234Th fluxes in the eddies (1300−1450 dpm m−2 d−1) except for AE20-E1 were surprisingly high and comparable with those at Station Papa (1530 ± 1120 dpm m−2 d−1; Buesseler et al., 2006) although PP in our region was only ~50% of the Station Papa (PP = 72 mmol m−2 d−1; Buesseler and Boyd, 2009a). This comparison implies the efficient export of particles into the deeper ocean in this oligotrophic ocean, which is further discussed in the following section.
POC export
The POC export flux (mmol m−2 d−1) at 100 m was calculated by multiplying the calculated 234Th flux (dpm m−2 d−1) by the POC:234Thp ratio (mmol dpm−1) measured at 100 m depth (Buesseler et al., 2006). We measured POC:234Thp ratio only for one size fraction i.e., >0.7 μm in 2019 and 0.8−51 μm in 2020. The ratio reportedly either remains invariant or increases with particle size (Buesseler et al., 2006). Thus, our POC flux estimates can be considered as a lower limit (Buesseler et al., 2006). In 2019, the POC fluxes at 100 m depth were calculated as 4.2 ± 0.3, 0.7 ± 0.1, and −3.0 ± 0.1 mmol m−2 d−1 at the reference site, the edge, and the core of the anticyclonic eddy, respectively (Figure 4F). Ideally, the non-steady state two-dimensional model together with the physical convection model based on high-resolution vertical and horizontal sampling will be needed to properly estimate the vertical and horizontal fluxes of POC (Buesseler et al., 2020). Zhou et al. (2013) proposed that particle redistribution within the eddy by sub-mesoscale advection is important for POC export and should be considered in flux estimation. An independent determination of the vertical flux by deployment of neutrally buoyant sediment traps will help to deconvolve the fluxes. Unfortunately, we were not able to separate the vertical and horizontal fluxes of POC with the limited information that we have. Thus, the estimated POC flux in 2019 should be considered as apparent values only. Instead, the results are meaningful in suggesting a process of POC convergence toward the eddies.
In 2020, the POC fluxes at 100 m depth ranged from 1.0 to 3.4 mmol m−2 d−1, with no evidence for horizontal transport inside the eddies (Figure 4F). The POC flux at 100 m depth in the study region was comparable to that in other oligotrophic oceans such as the gyre region in the subtropical North Atlantic (1.2−5.9 mmol m−2 d−1; Buesseler et al., 2008) and at Station ALOHA in the North Pacific gyre (1.3−1.9 mmol m−2 d−1; Buesseler et al., 2009b; Grabowski et al., 2019), but much lower than those in other productive regions (10 ± 6 mmol m−2 d−1; Figure 6). The lower POC export in the cyclonic eddy in 2020 is not consistent with the general understanding of higher POC production facilitated by nutrient supply due to the vertical water movement. As speculated by Seo et al., (submitted-this issue), the depletion of nutrients reaching as deep as ~150 m resulted in an insignificant supply of nutrients to the upper 100 m layer.
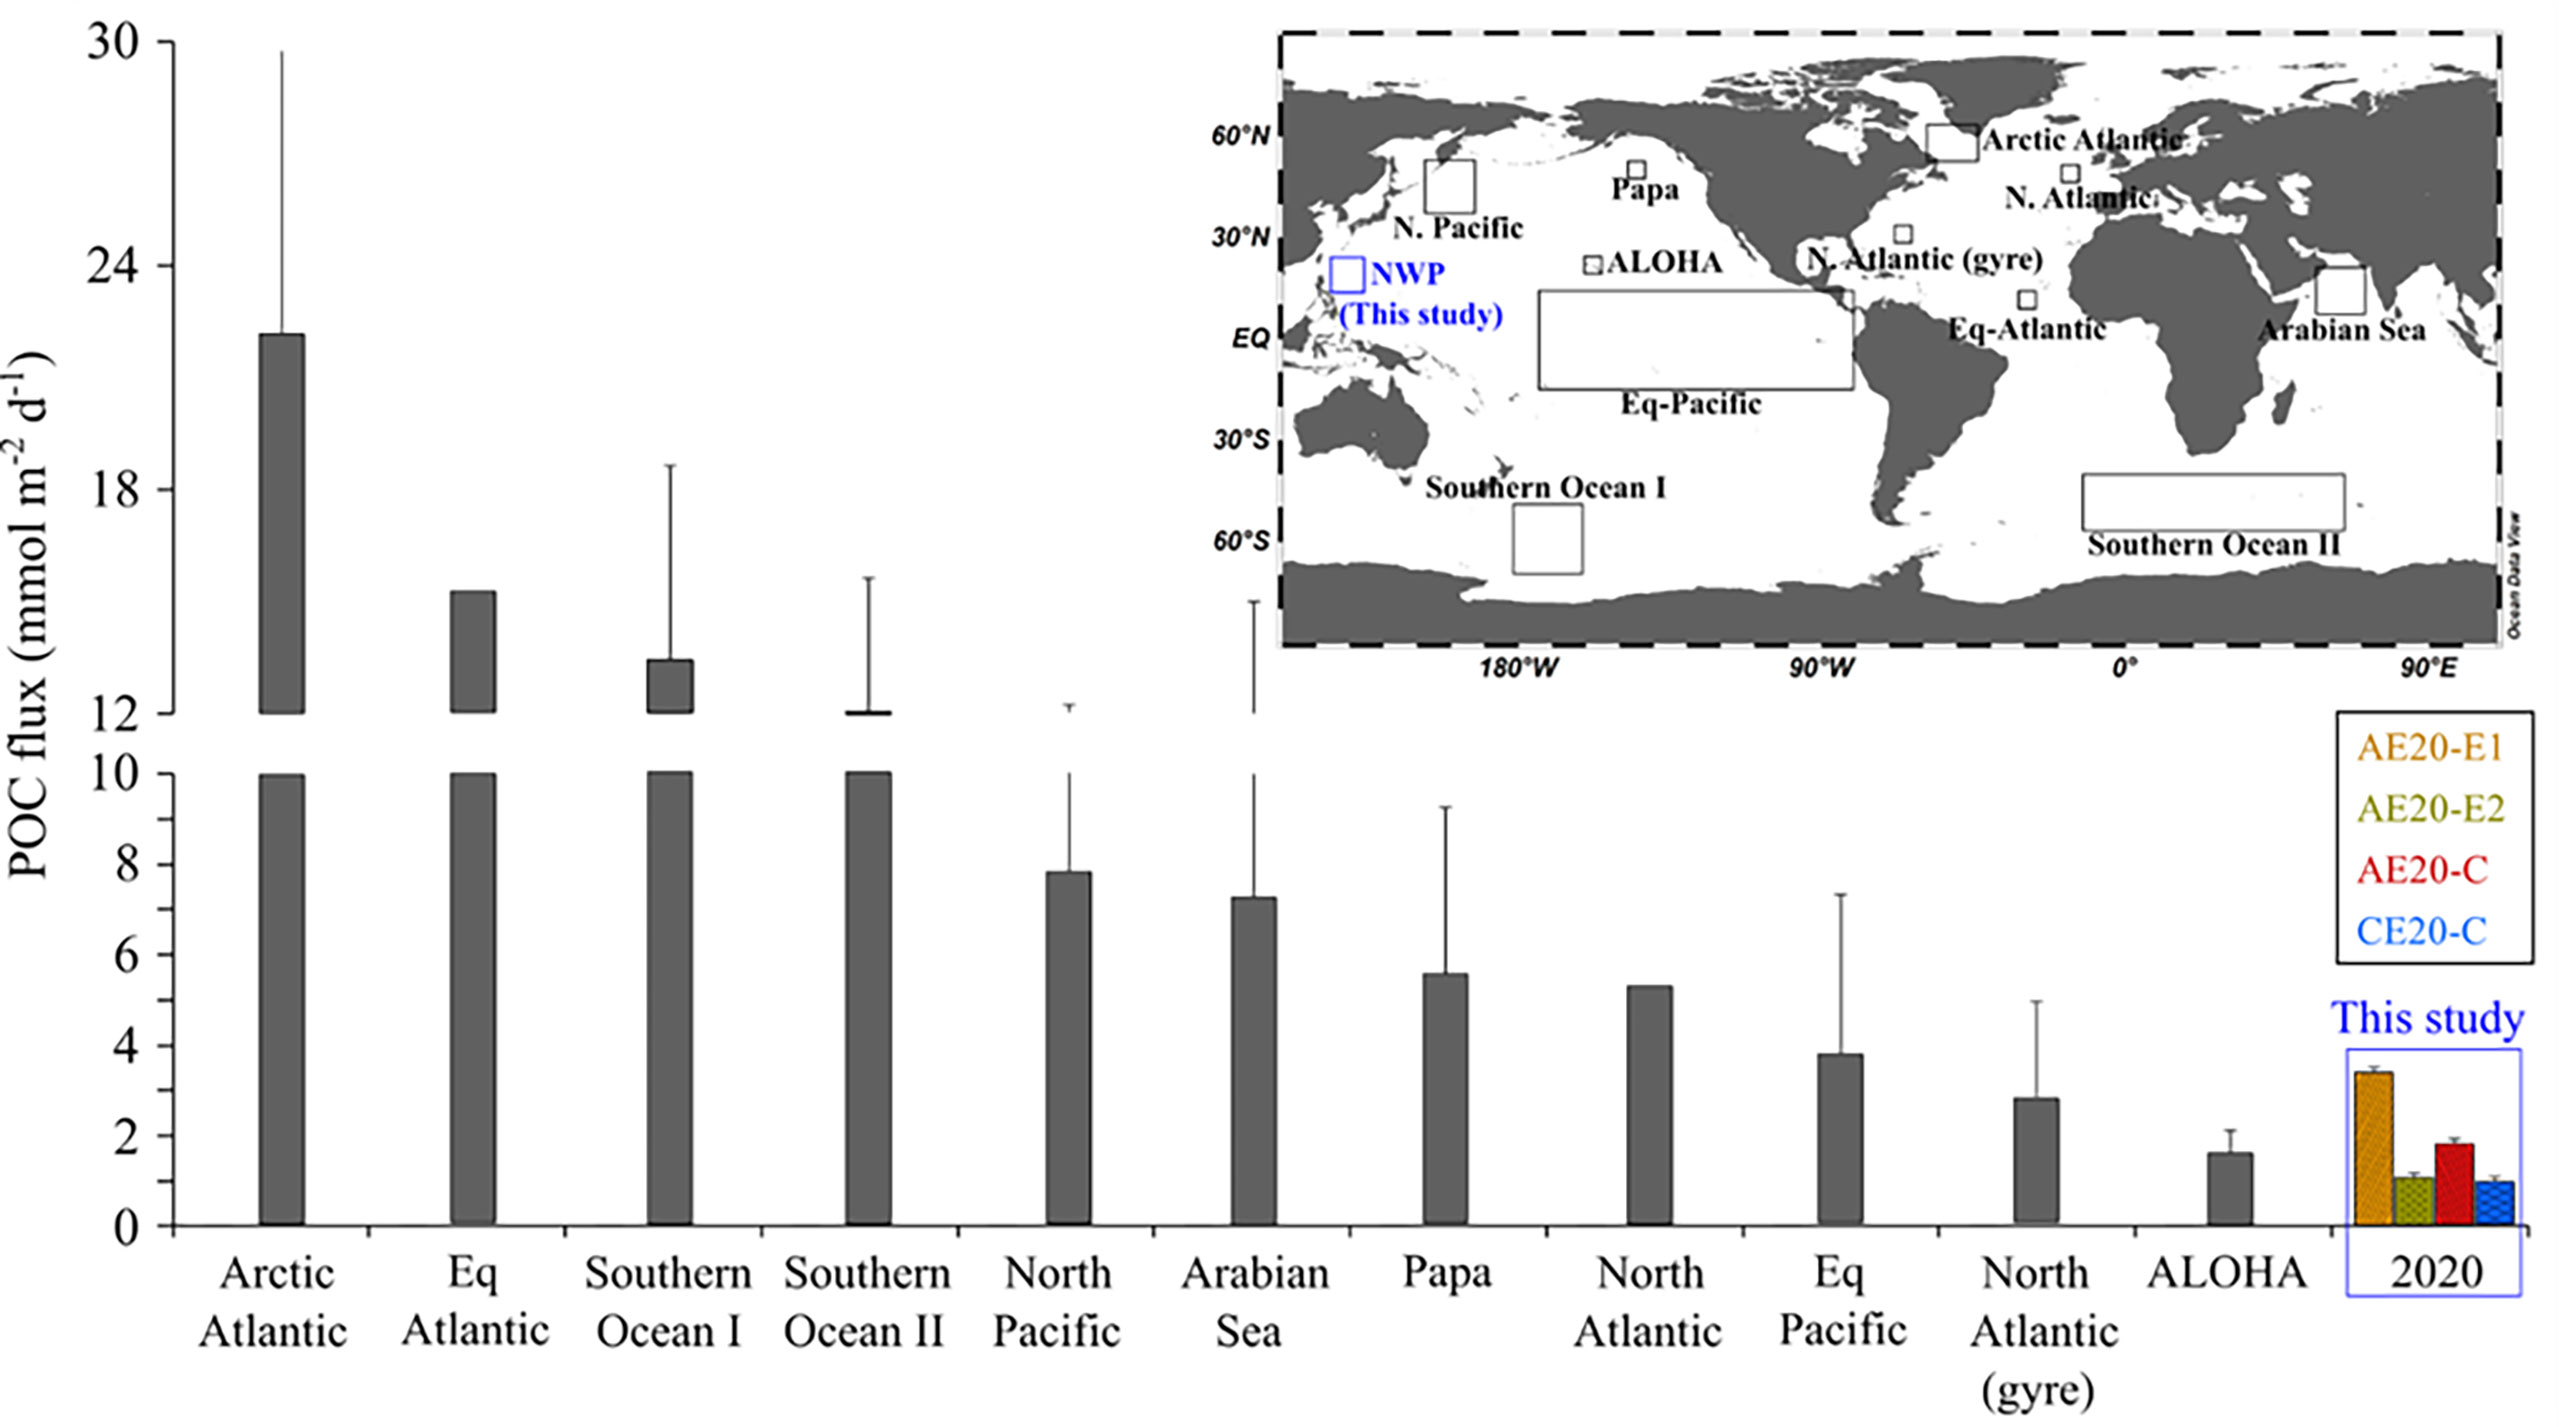
Figure 6 Distribution of 234Th-derived POC fluxes in the ocean. The boxes in the inset indicate the study regions. The data for comparison are from Moran et al. (2003) for the arctic Atlantic, Thomalla et al. (2008) for the equatorial Atlantic and the North Atlantic, Buesseler et al., 2003; Buesseler et al. (2001) for the Southern Ocean I, Rutgers van der Loeff et al. (1997) and Morris et al. (2007) for the Southern Ocean II, Kawakami and Honda (2007) for the North Pacific, Buesseler et al. (1998) for the Arabian Sea, Buesseler et al. (2020) for Station Papa, Buesseler et al. (1995) and Murray et al. (1996) for the equatorial Pacific, Buesseler et al. (2008) for the North Atlantic (gyre), and Buesseler et al. (2009b) for Station ALOHA.
The inconsistency in POC dynamics between 2019 and 2020 suggests that the factors controlling the POC flux in eddies are complex, with various influencing factors including the eddy’s stage, age, and the initial conditions of the water mass (Bishop et al., 1992; Shih et al., 2020 and the references therein). Hydrographic conditions in the surface layer were different in the sense that the study region in 2020 was mainly occupied by a large anticyclonic eddy. Mean sea surface temperature of the study region during the cruise was higher in 2020 than 2019 by ~0.4°C. The SML was shallower and the thermocline was less clear in 2020 than in 2019. The different ages of the eddies, ~180 days of Eddy 2 in 2020 vs. ~45 days of Eddy 1 in 2019, may have been a factor. However, it is not clear why the POC dynamics in 2019 and 2020 were so different.
An interesting finding from the observation in 2020 is the high POC flux at depths deeper than 100 m. We compared our deep POC flux data (> 100 m) with that from Station Papa, where POC fluxes based on the same method are available at several depths below the euphotic zone (Buesseler et al., 2020). The PP at Station Papa is about two times that in our study region (Buesseler and Boyd, 2009a). The POC flux at 100 m depth at Station Papa was ~3 times that observed at our sites. However, the mean POC flux at 500 m at our sites (1.6 ± 1.1 mmol m−2 d−1) is similar to that at Station Papa (Figure 5). At our sites except for AE20-E1, POC flux at 300 and 500 m were higher those at 100 m whereas POC flux remained unchanged or decreased below the primary production zone at Station Papa. We speculate that the production in the deep SCM contributed to the POC flux in the deeper layer. The depth of the SCM in our study sites (~120 m) was greater than that at Station Papa (~75 m; Buesseler et al., 2020). Since the deep layer is biogeochemically less dynamic, our results suggest that such higher POC export may occur in the deep layer of the oligotrophic ocean. If this is the case, the examination of POC export at 100 m depth may have been underestimated in the extremely oligotrophic ocean. Thus, further evaluation by the deployment of sediment traps with high-resolution in the twilight zone are needed.
Conclusions
We investigated POC fluxes in the eddy-rich northwest tropical Pacific in Septembers 2019 and 2020. In 2019, excess 234Th activities within the anticyclonic eddy were observed, which was speculatively caused by horizontal particle transport into the eddy core at the early stage of eddy formation. However, when we examined an anticyclonic eddy and a cyclonic eddy in 2020, such horizontal particle convergence was not observed. POC flux in the cyclonic eddy was not higher than that in the anticyclonic eddy, because the nutrient-depleted layer was so deep (~120 m) that water advection did not help to bring nutrients up from below. However, we observed that the POC fluxes based on 234Th at 300 and 500 m depths were not so low and comparable with that at more productive Station Papa. This result suggests that POC flux to the ocean interior in the oligotrophic region may be higher than expected, presumably because production in the deep subsurface chlorophyll maximum layer and a smaller vertical density gradient may lead to more efficient POC settling. This implication that POC flux at deeper depths in the oligotrophic region may be higher than thought is intriguing. However, further studies are necessary by a well-orchestrated campaign including 234Th-based flux determinations with sediment trap deployments at multiple depths in the mesopelagic zone to better characterize the biological pump in the oligotrophic regions.
Data availability statement
The raw data supporting the conclusions of this article will be made available by the authors, without undue reservation.
Author contributions
JH contributed to the conceptualization of the study. JS, HS, TN performed field sampling and analyses. J-HP and SK were involved in the interpretation of physical processes. JH, GK, and JS were involved in the data interpretation and writing of the manuscript. All authors contributed to the article and approved the submitted version.
Funding
This research was funded by the Korea Institute of Ocean Science and Technology through a project to promote the cooperative use of the research vessel (PE99884).
Acknowledgments
We thank the captain and the crew of the R/V Isabu for their help at sea and all cruise participants for their help with sampling.
Conflict of interest
The authors declare that the research was conducted in the absence of any commercial or financial relationships that could be construed as a potential conflict of interest.
Publisher’s note
All claims expressed in this article are solely those of the authors and do not necessarily represent those of their affiliated organizations, or those of the publisher, the editors and the reviewers. Any product that may be evaluated in this article, or claim that may be made by its manufacturer, is not guaranteed or endorsed by the publisher.
Supplementary material
The Supplementary Material for this article can be found online at: https://www.frontiersin.org/articles/10.3389/fmars.2022.976201/full#supplementary-material
References
Benitez-Nelson C., Buesseler K., van der Loeff M., Andrews J., Ball L., Crossin G., et al. (2001). Testing a new small-volume technique for determining 234Th in seawater. J. Radioanalytical Nucl. Chem. 248, 795–799. doi: 10.1023/A:1010621618652
Bishop J., Smith R., Baker K. (1992). Springtime distributions and variability of biogenic particulate matter in gulf stream warm-core ring 82B and surrounding NW Atlantic waters. Deep Sea Res. Part A. Oceanographic Res. Papers 39, S295–S325. doi: 10.1016/S0198-0149(11)80017-8
Buesseler K. O., Andrews J. A., Hartman M. C., Belastock R., Chai F. (1995). Regional estimates of the export flux of particulate organic carbon derived from thorium-234 during the JGOFS EqPac program. Deep Sea Res. Part II: Topical Stud. Oceanogr. 42, 777–804. doi: 10.1016/0967-0645(95)00043-P
Buesseler K. O., Bacon M. P., Cochran J. K., Livingston H. D. (1992). Carbon and nitrogen export during the JGOFS north Atlantic bloom experiment estimated from 234Th:238U disequilibria. Deep Sea Res. Part A. Oceanographic Res. Papers 39, 1115–1137. doi: 10.1016/0198-0149(92)90060-7
Buesseler K. O., Ball L., Andrews J., Benitez-Nelson C. R., Belastock R., Chai F., et al. (1998). Upper ocean export of particulate organic carbon in the Arabian Sea derived from thorium-234. Deep Sea Res. Part II Top. Stud. Oceanogr. 45, 2461–2487. doi: 10.1016/S0967-0645(98)80022-2
Buesseler K. O., Barber R. T., Dickson M.-L., Hiscock M. R., Moore J. K., Sambrotto R. (2003) The effect of marginal ice-edge dynamics on production and export in the southern ocean along 170°W. Deep Sea Res. Part II Top. Stud. Oceanogr. 50, 579–603. doi: 10.1016/S0967-0645(02)00585-4
Buesseler K. O., Benitez-Nelson C. R., Moran S. B., Burd A., Charette M., Cochran J. K., et al. (2006). An assessment of particulate organic carbon to thorium-234 ratios in the ocean and their impact on the application of 234Th as a POC flux proxy. Mar. Chem. 100, 213–233. doi: 10.1016/j.marchem.2005.10.013
Buesseler K. O., Benitez-Nelson C. R., Roca-Martí M., Wyatt A. M., Resplandy L., Clevenger S. J., et al. (2020). High-resolution spatial and temporal measurements of particulate organic carbon flux using thorium-234 in the northeast pacific ocean during the EXport processes in the ocean from RemoTe sensing field campaign. Elementa: Sci. Anthropocene 8(1), 030. doi: 10.1525/elementa.2020.030
Buesseler K. O., Benitez-Nelson C., Rutgers van der Loeff M., Andrews J., Ball L., Crossin G., et al. (2001). An intercomparison of small- and large-volume techniques for thorium-234 in seawater. Mar. Chem. 74, 15–28. doi: 10.1016/S0304-4203(00)00092-X
Buesseler K. O., Boyd P. W. (2009a). Shedding light on processes that control particle export and flux attenuation in the twilight zone of the open ocean. Limnol. Oceanogr. 54, 1210–1232. doi: 10.4319/lo.2009.54.4.1210
Buesseler K. O., Lamborg C., Cai P., Escoube R., Johnson R., Pike S., et al. (2008). Particle fluxes associated with mesoscale eddies in the Sargasso Sea. Deep Sea Res. Part II: Topical Stud. Oceanogr. 55, 1426–1444. doi: 10.1016/j.dsr2.2008.02.007
Buesseler K. O., Pike S., Maiti K., Lamborg C. H., Siegel D. A., Trull T. W. (2009b). Thorium-234 as a tracer of spatial, temporal and vertical variability in particle flux in the north pacific. Deep Sea Res. Part I: Oceanographic Res. Papers 56, 1143–1167. doi: 10.1016/j.dsr.2009.04.001
Chen K. S., Hung C. C., Gong G. C., Chou W. C., Chung C. C., Shih Y. Y., et al. (2013). Enhanced POC export in the oligotrophic northwest pacific ocean after extreme weather events. Geophysical Res. Lett. 40, 5728–5734. doi: 10.1002/2013GL058300
Dufois F., Hardman-Mountford N. J., Fernandes M., Wojtasiewicz B., Shenoy D., Slawinski D., et al. (2017). Observational insights into chlorophyll distributions of subtropical south Indian ocean eddies. Geophysical Res. Lett. 44, 3255–3264. doi: 10.1002/2016GL072371
Fong A. A., Karl D. M., Lukas R., Letelier R. M., Zehr J. P., Church M. J. (2008). Nitrogen fixation in an anticyclonic eddy in the oligotrophic north pacific ocean. ISME J. 2, 663–676. doi: 10.1038/ismej.2008.22
Franks P. J., Wroblewski J. S., Flierl G. R. (1986). Prediction of phytoplankton growth in response to the frictional decay of a warm-core ring. J. Geophysical Res.: Oceans 91, 7603–7610. doi: 10.1029/JC091iC06p07603
Gallagher S. J., Kitamura A., Iryu Y., Itaki T., Koizumi I., Hoiles P. W. (2015). The pliocene to recent history of the kuroshio and tsushima currents: a multi-proxy approach. Prog. Earth Planetary Sci. 2, 1–23. doi: 10.1186/s40645-015-0045-6
Grabowski E., Letelier R. M., Laws E. A., Karl D. M. (2019). Coupling carbon and energy fluxes in the north pacific subtropical gyre. Nat. Commun. 10, 1895. doi: 10.1038/s41467-019-09772-z
Greenwood J., Feng M., Waite A. (2007). A one-dimensional simulation of biological production in two contrasting mesoscale eddies in the south eastern Indian ocean. Deep Sea Res. Part II: Topical Stud. Oceanogr. 54, 1029–1044. doi: 10.1016/j.dsr2.2006.10.004
Hung C.-C., Gong G.-C. (2007). Export flux of POC in the main stream of the kuroshio. Geophys. Res. Lett. 34(18). doi: 10.1029/2007GL030236
Kawakami H., Honda M. C. (2007) Time-series observation of POC fluxes estimated from 234Th in the northwestern north pacific. Deep Sea Res. Part I Oceanogr. Res. Pap. 54, 1070–1090. doi: 10.1016/j.dsr.2007.04.005
Kelly K. A., Qiu B. (1995). Heat flux estimates for the Western north atlantic. part I: Assimilation of satellite data into a mixed layer model. J. Phys. Oceanogr. 25, 2344–2360. doi: 10.1175/1520-0485(1995)025<2344:HFEFTW>2.0.CO;2
Kitajima S., Furuya K., Hashihama F., Takeda S., Kanda J. (2009). Latitudinal distribution of diazotrophs and their nitrogen fixation in the tropical and subtropical western north pacific. Limnol. Oceanogr. 54, 537–547. doi: 10.4319/lo.2009.54.2.0537
Knap A., Michaels A., Close A., Ducklow H., Dickson A. (1996). Protocols for the joint global ocean flux study (JGOFS) core measurements. JGOFS Reprint IOC Manuals Guides No. 29 UNESCO 1994, 19.
Lam P. J., Lee J.-M., Heller M. I., Mehic S., Xiang Y., Bates N. R. (2018). Size-fractionated distributions of suspended particle concentration and major phase composition from the U.S. GEOTRACES Eastern pacific zonal transect (GP16). Mar. Chem. 201, 90–107. doi: 10.1016/j.marchem.2017.08.013
Lam P. J., Ohnemus D. C., Auro M. E. (2015). Size-fractionated major particle composition and concentrations from the US GEOTRACES north Atlantic zonal transect. Deep Sea Res. Part II Top. Stud. Oceanogr. 116, 303–320. doi: 10.1016/j.dsr2.2014.11.020
Le Moigne F. A. C., Henson S. A., Sanders R. J., Madsen E. (2013). Global database of surface ocean particulate organic carbon export fluxes diagnosed from the 234Th technique. Earth Syst. Sci. Data 5, 295–304. doi: 10.5194/essd-5-295-2013
Li Y.-Y., Chen X.-H., Xie Z.-X., Li D.-X., Wu P.-F., Kong L.-F., et al. (2018). Bacterial diversity and nitrogen utilization strategies in the upper layer of the northwestern pacific ocean. Front. Microbiol. 9, 797. doi: 10.3389/fmicb.2018.00797
Liu K.-K., Lai Z.-L., Gong G.-C., Shiah F.-K. (1995). Distribution of particulate organic matter in the southern East China Sea: implications in production and transport. Terrestrial Atmospheric Oceanic Sci. 6, 27–45. doi: 10.3319/TAO.1995.6.1.27(KEEP-MASS)
McGillicuddy J. D., Robinson A. (1997). Eddy-induced nutrient supply and new production in the Sargasso Sea. Deep Sea Res. Part I: Oceanographic Res. Papers 44, 1427–1450. doi: 10.1016/S0967-0637(97)00024-1
Moran S. B., Weinstein S. E., Edmonds H. N., Smith J. N., Kelly R. P., Pilson M. E. Q., et al. (2003). Does 234Th/238U disequilibrium provide an accurate record of the export flux of particulate organic carbon from the upper ocean? Limnol. Oceanogr. 48, 1018–1029. doi: 10.4319/lo.2003.48.3.1018
Morris P. J., Sanders R., Turnewitsch R., Thomalla S. (2007). 234Th-derived particulate organic carbon export from an island-induced phytoplankton bloom in the southern ocean. Deep Sea Res. Part II Top. Stud. Oceanogr. 54, 2208–2232. doi: 10.1016/j.dsr2.2007.06.002
Murray J. W., Young J., Newton J., Dunne J., Chapin T., Paul B., et al. (1996). Export flux of particulate organic carbon from the central equatorial pacific determined using a combined drifting trap-234Th approach. Deep Sea Res. Part II Top. Stud. Oceanogr. 43, 1095–1132. doi: 10.1016/0967-0645(96)00036-7
Owens S. A., Buesseler K. O., Sims K. W. W. (2011). Re-evaluating the 238U-salinity relationship in seawater: Implications for the 238U–234Th disequilibrium method. Mar. Chem. 127, 31–39. doi: 10.1016/j.marchem.2011.07.005
Owens S., Pike S., Buesseler K. (2015). Thorium-234 as a tracer of particle dynamics and upper ocean export in the Atlantic ocean. Deep Sea Res. Part II: Topical Stud. Oceanogr. 116, 42–59.-39. doi: 10.1016/j.dsr2.2014.11.010
Pike S., Buesseler K., Andrews J., Savoye N. (2005). Quantification of 234Th recovery in small volume sea water samples by inductively coupled plasma-mass spectrometry. J. Radioanalytical Nucl. Chem. 263, 355–360. doi: 10.1007/s10967-005-0062-9
Prahl F. G., Popp B. N., Karl D. M., Sparrow M. A. (2005). Ecology and biogeochemistry of alkenone production at station ALOHA. Deep Sea Res. Part I: Oceanographic Res. Papers 52, 699–719. doi: 10.1016/j.dsr.2004.12.001
Price J. F., Weller R. A., Pinkel R. (1986). Diurnal cycling: Observations and models of the upper ocean response to diurnal heating, cooling, and wind mixing. J. Geophys. Res. Ocean. 91, 8411–8427. doi: 10.1029/JC091iC07p08411
Qiu B. (1999). Seasonal eddy field modulation of the north pacific subtropical countercurrent: TOPEX/Poseidon observations and theory. J. Phys. Oceanogr. 29, 2471–2486. doi: 10.1175/1520-0485(1999)029<2471:SEFMOT>2.0.CO;2
Rutgers van der Loeff M. M., Friedrich J., Bathmann U. V. (1997) Carbon export during the spring bloom at the Antarctic polar front, determined with the natural tracer 234Th. Deep Sea Res. Part II Top. Stud. Oceanogr. 44, 457–478. doi: 10.1016/S0967-0645(96)00067-7
Savoye N., Aminot A., Tréguer P., Fontugne M., Naulet N., Kérouel R. (2003). Dynamics of particulate organic matter δ15N and δ13C during spring phytoplankton blooms in a macrotidal ecosystem (Bay of seine, France). Mar. Ecol. Prog. Ser. 255, 27–41. doi: 10.3354/meps255027
Savoye N., Benitez-Nelson C., Burd A. B., Cochran J. K., Charette M., Buesseler K. O., et al. (2006). 234Th sorption and export models in the water column: A review. Mar. Chem. 100, 234–249. doi: 10.1016/j.marchem.2005.10.014
Savoye N., Buesseler K., Cardinal D., Dehairs F. (2004). 234Th deficit and excess in the southern ocean during spring 2001: Particle export and remineralization. Geophysical Res. Lett. 31. doi: 10.1029/2004GL019744
Seo J., Seo H., Hwang J., Kim G. (2021). Rapid and accurate method for determining 234Th in seawater: Fe Co-precipitation, UTEVA extraction, and micro-precipitation. Ocean Sci. J 56, 378–384. doi: 10.1007/s12601-021-00035-x
Shih Y. Y., Hung C. C., Shao H. J., Chow C. H., Muller F. L. L., Cai Y. H. (2020). The impact of eddies on nutrient supply, diatom biomass and carbon export in the northern south China Sea. Front. Earth Sci. 8. doi: 10.3389/feart.2020.537332
Signorini S. R., McClain C. R., Christian J. R., Wong C. (2001). Seasonal and interannual variability of phytoplankton, nutrients, TCO2, pCO2, and O2 in the eastern subarctic pacific (ocean weather station papa). J. Geophysical Res.: Oceans 106, 31197–31215. doi: 10.1029/2000JC000343
Thomalla S. J., Poulton A. J., Sanders R., Turnewitsch R., Holligan P. M., Lucas M. I. (2008). Variable export fluxes and efficiencies for calcite, opal, and organic carbon in the Atlantic ocean: A ballast effect in action? Global Biogeochem. Cycles 22(1), 27–41. doi: 10.1029/2007GB002982
Uchiyama Y., Suzue Y., Yamazaki H. (2017). Eddy-driven nutrient transport and associated upper-ocean primary production along the kuroshio. J. Geophysical Res.: Oceans 122, 5046–5062. doi: 10.1002/2017JC012847
Venrick E. (1990). Mesoscale patterns of chlorophyll a in the central north pacific. Deep Sea Res. Part A. Oceanographic Res. Papers 37, 1017–1031. doi: 10.1016/0198-0149(90)90108-8
Xu A., Yu F., Nan F. (2019). Study of subsurface eddy properties in northwestern pacific ocean based on an eddy-resolving OGCM. Ocean Dynamics 69, 463–474. doi: 10.1007/s10236-019-01255-5
Yun M. S., Kim Y., Jeong Y., Joo H. T., Jo Y. H., Lee C. H., et al. (2020). Weak response of biological productivity and community structure of phytoplankton to mesoscale eddies in the oligotrophic Philippine Sea. J. Geophysical Res.: Oceans 125, e2020JC016436. doi: 10.1029/2020JC016436
Zhong Q., Yu T., Lin H., Lin J., Ji J., Ni J., et al. (2021). 210Po-210Pb disequilibrium in the Western north pacific ocean: Particle cycling and POC export. Front. Mar. Sci. 8. doi: 10.3389/fmars.2021.700524
Keywords: Th-234, POC export, anticyclonic eddy, cyclonic eddy, tropical northwest Pacific
Citation: Seo J, Kim G, Park J-H, Seo H, Na T, Kang SK and Hwang J (2022) Export of particulate organic carbon (POC) in the eddy region of the tropical northwest Pacific. Front. Mar. Sci. 9:976201. doi: 10.3389/fmars.2022.976201
Received: 23 June 2022; Accepted: 05 September 2022;
Published: 23 September 2022.
Edited by:
Jing Zhang, University of Toyama, JapanReviewed by:
Fajin Chen, Guangdong Ocean University, ChinaHajime Kawakami, Japan Agency for Marine-Earth Science and Technology (JAMSTEC), Japan
Copyright © 2022 Seo, Kim, Park, Seo, Na, Kang and Hwang. This is an open-access article distributed under the terms of the Creative Commons Attribution License (CC BY). The use, distribution or reproduction in other forums is permitted, provided the original author(s) and the copyright owner(s) are credited and that the original publication in this journal is cited, in accordance with accepted academic practice. No use, distribution or reproduction is permitted which does not comply with these terms.
*Correspondence: Jeomshik Hwang, amVvbXNoaWtAc251LmFjLmty