 Anne L. Schaefer
 Kristen B. Gorman
 Mary Anne Bishop
- 1Prince William Sound Science Center, Cordova, AK, United States
- 2College of Fisheries and Ocean Sciences, University of Alaska Fairbanks, Fairbanks, AK, United States
Comprehensive assessments of cumulative impacts to seabirds have been hindered by an incomplete understanding of temporal and spatial patterns in marine habitat use, particularly during the non-breeding season when seabirds can range widely across the global ocean. Alcids are an important component of the meso-predator biodiversity of the North Pacific Ocean, yet the non-breeding movement ecology and distribution for many of the Pacific Auk species remain poorly quantified. Recent and projected declines for historically robust populations of tufted puffin (Fratercula cirrhata) in Alaska highlight the importance of resolving aspects of the species’ non-breeding ecology, especially the pelagic phenology and distribution. We used light-level geolocation to quantify the annual at-sea distribution of tufted puffins between a major Gulf of Alaska nesting colony (Middleton Island) and heretofore unknown migration routes and wintering areas. Geolocator data from 42 complete migration routes of reproductive adult tufted puffins collected primarily between 2018-2020 revealed that both males and females were short-distance migrants, wintering on average 616 km from their breeding colony. Tufted puffins departed the breeding grounds in early September. Males made fewer stops and arrived earlier to wintering areas than females, however the arrival date to the wintering area was later in 2019 compared to 2018. Males took 30.5 ± 16.7 (± standard deviation) days in 2018 and 30.8 ± 24.6 days in 2019 to arrive at wintering areas. Conversely, females took 36.1 ± 16.8 days in 2018 and 59.8 ± 17.3 days in 2019 to arrive at wintering areas. Adult tufted puffins wintered primarily in the deep offshore waters of the eastern Gulf of Alaska and partially in the adjacent Northeast Pacific Ocean over a period of 151.9 days ± 31.6 with spring migrations starting by late March. Males and females showed consistent spatial distributions within seasons, especially during winter. Tufted puffins shifted southwards throughout the non-breeding season, similar to other Atlantic and Northeast Pacific alcids. Our study provides important information on the at-sea non-breeding phenology and distribution of tufted puffins, which can inform risk assessments for the species including vulnerability to spatially and temporally explicit marine pollution, disease, fisheries by-catch, and ocean-climate variability.
Introduction
The life histories of seabirds have long been recognized as distinctively slow, with low reproductive rates, extended developmental periods, delayed reproductive onset, and long life spans (Ashmole, 1963; Lack, 1968). While the role of a heterogenous marine food supply in shaping seabird life histories has been debated (Ricklefs, 1990), the marine environment is clearly a prime selective force that has shaped seabird physiology, behavior, population vital rates, and diversification (Schreiber and Burger, 2001). Theory generally predicts that populations of species with slow life histories should be buffered from environmental variability (Morris et al., 2008; Sæther et al., 2013). In this context, it might be expected that seabird populations would be particularly resilient to variation in the marine environment. However, seabirds are among the most threatened vertebrates (Dias et al., 2019), and a large literature has documented changes in demographic rates, abundance, or community structure with ocean climate variability (La Cock, 1986; Ainley et al., 1994; Montevecchi and Myers, 1997; Gjerdrum et al., 2003; Morrison et al., 2011; Oro, 2014; Gorman et al., 2021) with recent reports of mass mortality events in association with extreme marine heatwaves (Jones et al., 2018; Jones et al., 2019; Piatt et al., 2020; Arimitsu et al., 2021).
Beyond the effects of ocean climate and food supply on the regulation of marine bird populations, a myriad of other stressors also contribute to the cumulative impacts that affect seabirds such as competition with fisheries and as bycatch, pollution, as well as invasive species (Dias et al., 2019). Comprehensive assessments of cumulative impacts to seabirds have been hindered by an incomplete understanding of their temporal and spatial marine habitat use. This is particularly true for the non-breeding season when seabirds range widely across remote regions of the global ocean often spanning multiple geopolitical boundaries (within the 200 nautical mile exclusive economic zone), as well as regions of the high seas that are considered global commons in terms of marine resource jurisdiction, management, and enforcement (Harrison et al., 2018). To help fill this knowledge gap, here we report a multi-year biologging study designed to assess the at-sea migratory and wintering movements of tufted puffins (Fratercula cirrhata) that breed at a major colony in the Gulf of Alaska (GOA) using light-level geolocation. To our knowledge, this is the first study to report the over-winter seasonal movements and pelagic distribution for the species.
Tufted puffins are among the 23 extant species comprising the auks (Aves: Alcidae) (Weir and Mursleen, 2013; Smith and Clarke, 2015) and are the largest among the puffins (genera Fratercula and Cerorhinca) (Gaston and Jones, 1998). As pelagic, pursuit-diving, flying seabirds, tufted puffins to go ashore only during the breeding season to rear their one offspring per pair in earthen burrows (Gaston and Jones, 1998; Piatt and Kitaysky, 2002). The species is widespread throughout the west coast of North America and Alaska, including the Northeast Pacific Ocean and Bering Sea regions, and while west coast populations (California to Southeast Alaska) have declined (Piatt and Kitaysky, 2002) the historically robust populations of the GOA present new concerns given recent declines that are predicted to continue in the future (Goyert et al., 2017).
In this study, we used light-level geolocation (GLS) to determine the pelagic migration routes, phenology, and wintering areas of adult tufted puffins nesting at Middleton Island − a major GOA breeding population (Institute for Seabird Research and Conservation, 2021). The objectives of our study were to: 1) quantify tufted puffin temporal and spatial patterns at sea during the non-breeding season; 2) assess the effects of sex, body condition, and year as predictors of non-breeding movements; and 3) calculate and compare sex-specific seasonal utilization distributions. Well appreciated as inefficient fliers due to high wing-loading (Spear and Ainley, 1997), we hypothesized tufted puffins may be constrained in their ability to range widely at sea to find productive foraging grounds. Following conclusions by Fayet et al. (2017b) that female and male adult Atlantic puffins (Fratercula arctica) follow similar migratory routes and are synchronous in their timing of return to breeding colonies, we hypothesized that adult male and female tufted puffins would have similar non-breeding behaviors and locations that would be consistent between years. Finally, we hypothesized that tufted puffins with a higher body condition index would travel greater distances given that the balance between energy expenditure and gain is recognized as an important factor underlying migration tactics and the distributions of animals (Shepard et al., 2013).
Methods
Study area
The study was conducted at Middleton Island, Alaska (59.48°N, 146.38°W), a low-lying island located in the north-central GOA (Figure 1). Middleton Island is situated 120 km from the Alaskan mainland and 15 km from the continental shelf. The region is oceanographically influenced by the east-west flowing Alaska Current and seasonally by the Alaska Coastal Current (Stabeno et al., 2004). Approximately 20,000 puffins are present on the island during the breeding season, an increase from ~5,000 individuals in the 1970s (Institute for Seabird Research and Conservation, 2021).
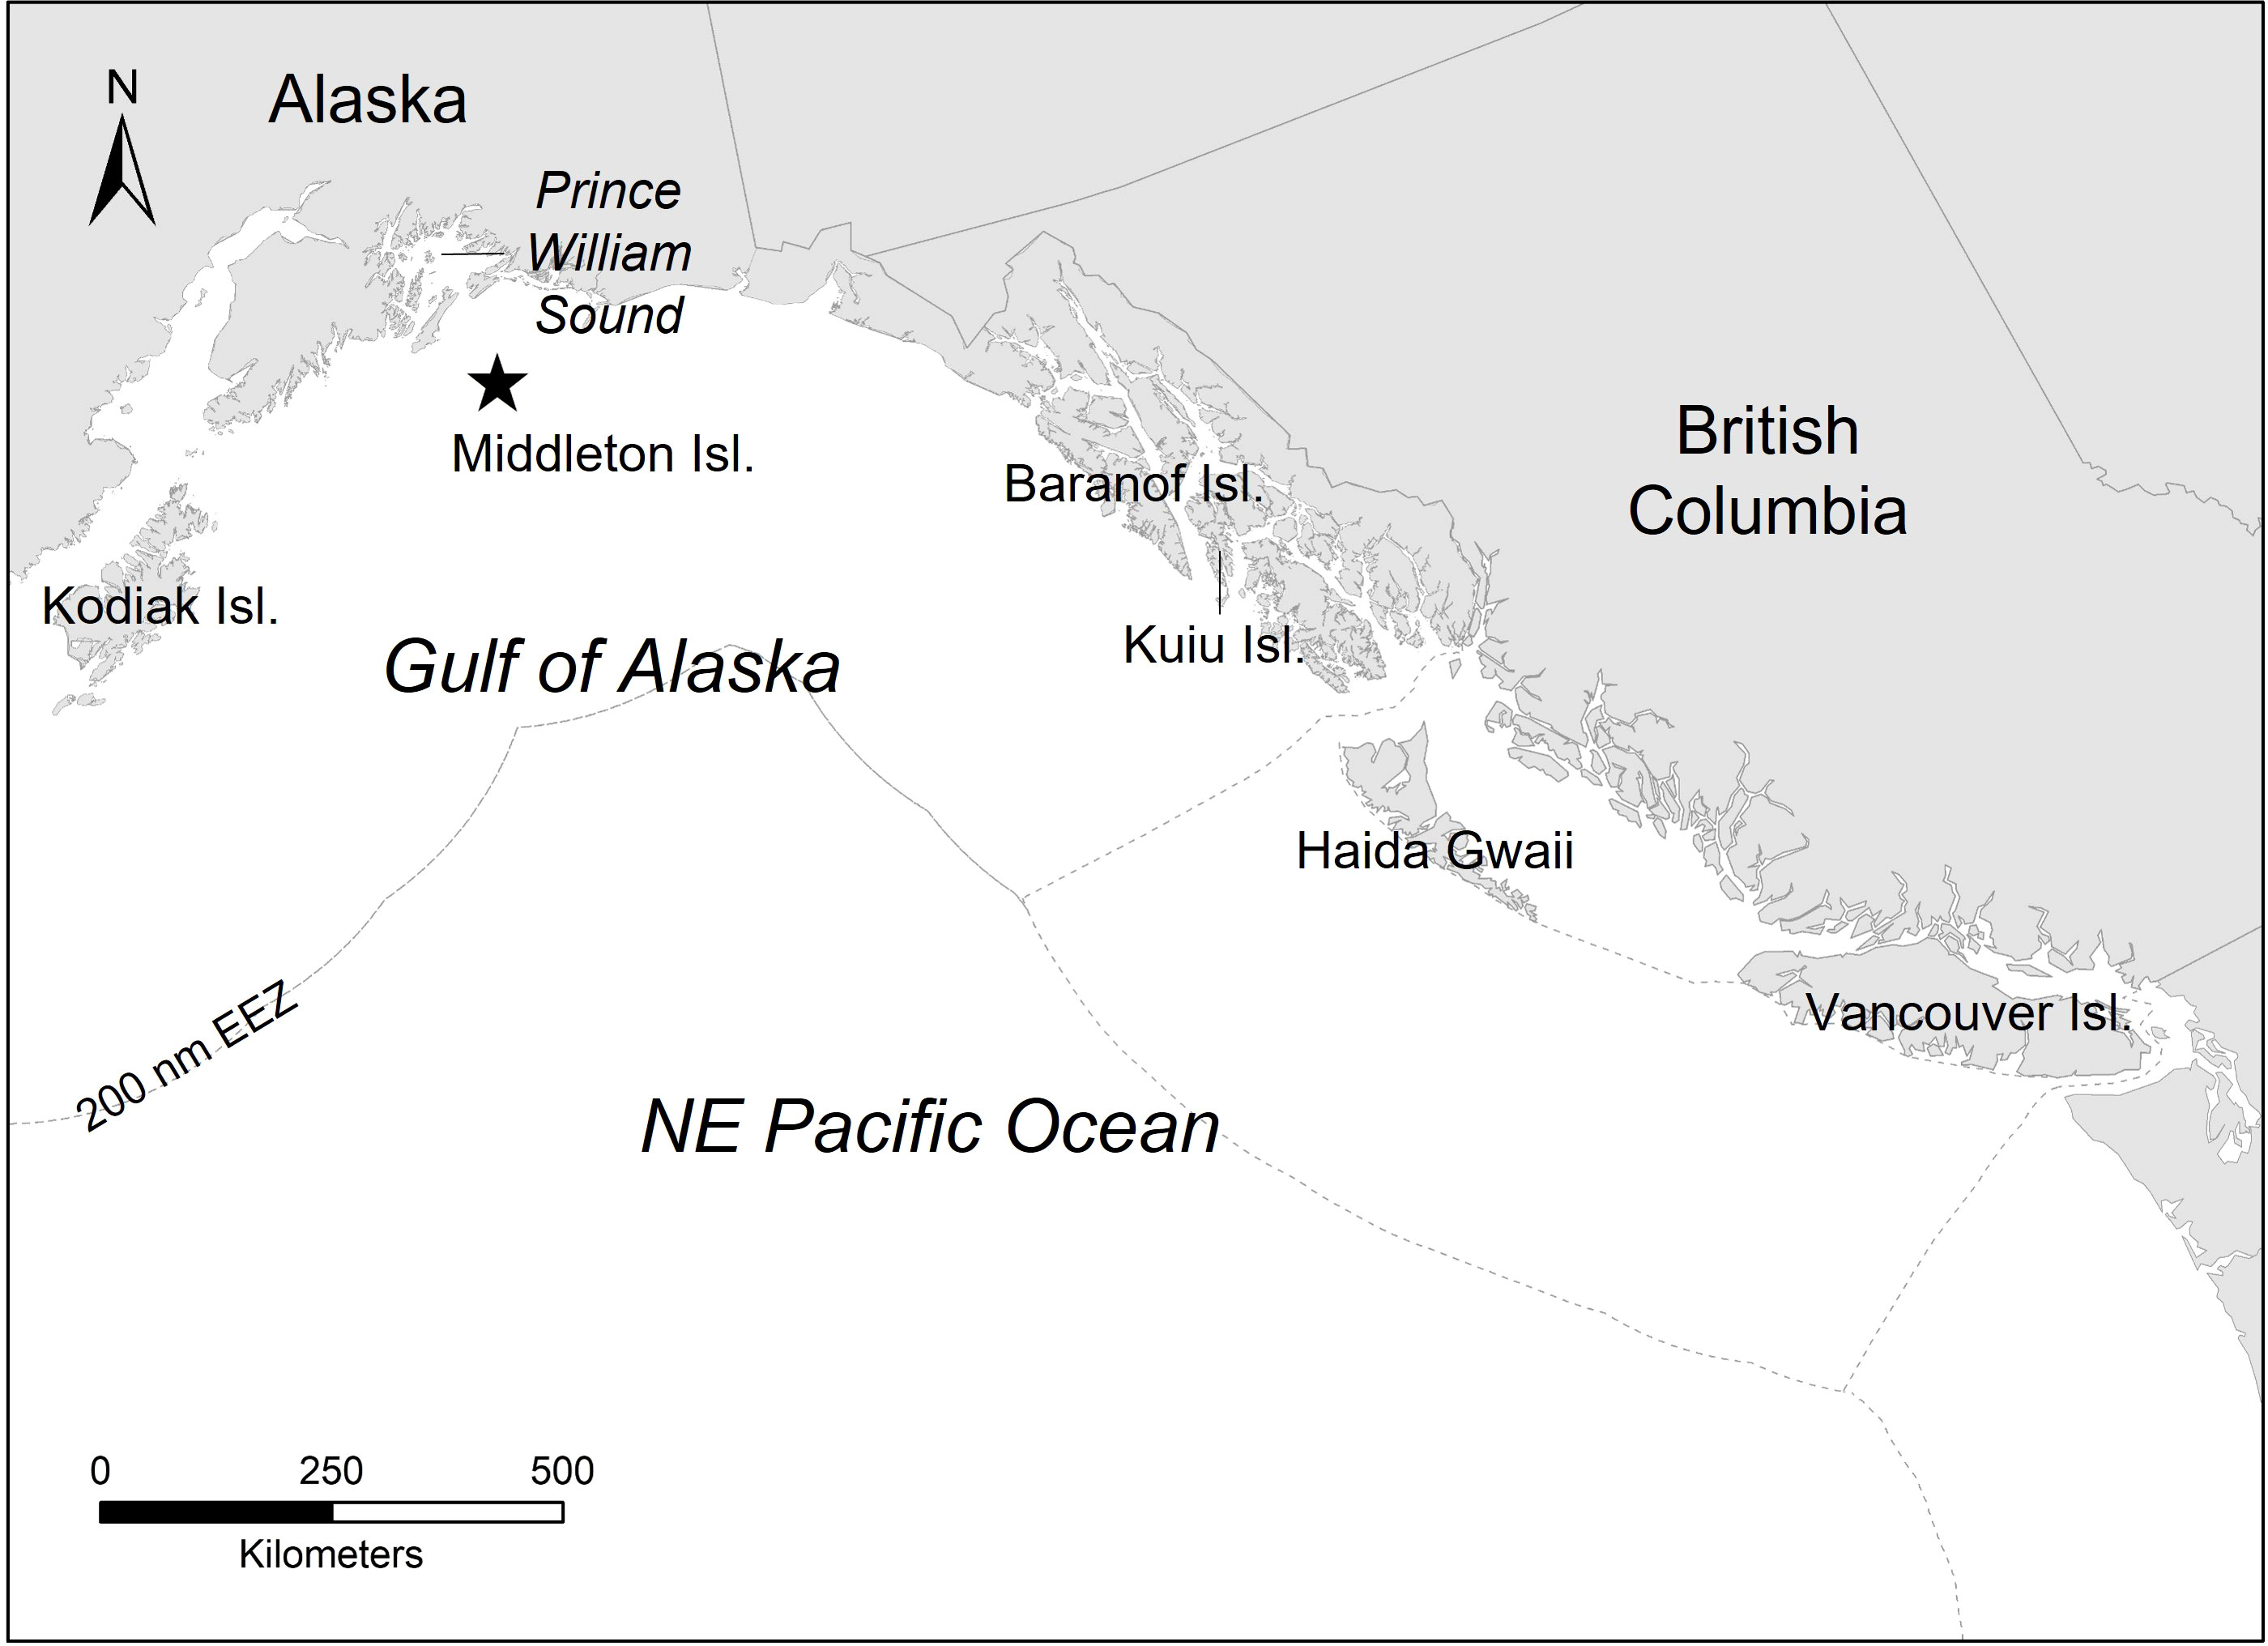
Figure 1 This study was conducted at Middleton Island, Alaska (59.48 °N, 146.38 °W; denoted by the star), a low-lying island located in the north-central Gulf of Alaska. The dashed gray line represents the 200 nautical mile (nm) exclusive economic zone (EEZ) that delineates the jurisdictional boundaries of the United States and Canada.
Field methods
We deployed 60 archival GLS tags (Migrate Technology, UK; model: Intigeo C-65 super) on adult tufted puffins breeding at Middleton Island over two field seasons (2018: n = 30, 2019: n = 30). The GLS tags recorded ambient light-levels and sea surface temperature (SST), and had an expected battery life of approximately two years. Light intensity was measured every 60 seconds with the maximum value in each 5-minute interval recorded. The maximum, minimum, and mean SST were recorded every 8 hours, with the sensor sampling after 20 minutes of continuous immersion (accuracy ± 0.5°C, resolution 0.125°C).
We used an infrared burrow-scope (PukaNet, Hawaii) to locate occupied breeding burrows and hand-captured adult tufted puffins during the middle of chick rearing (late July 2018 and 2019) to deploy GLS tags. This time period was selected to minimize disturbance effects at the nest and reduce the possibility of nest abandonment (Rodway et al., 1996). We banded each captured bird with a unique USGS metal band on the left leg and a GLS tag mounted on a plastic (darvic) leg band on the right leg. The combined mass of the darvic band, GLS device, and mounting materials (cable tie, self-amalgamating tape, adhesive) was 2.2 g, which was ~0.3% of body weight at the time of deployment (range 631–824 g), well below accepted standards (Barron et al., 2010). We also collected a suite of standard morphometric measurements including wing chord length (mm), tarsus length (mm), bill depth (mm), culmen length (mm), and head-bill length (mm), as well as whole blood samples for molecular sex determination (CHD gene, Antech Diagnostics, Fountain Valley, California). After handling, birds were returned to their burrow. The high site fidelity of tufted puffins (Piatt and Kitaysky, 2002) enabled us to recapture individuals in subsequent summers during the mid-incubation phase of the breeding cycle (late June 2019, 2020, 2021). During recapture, the GLS tag (including the darvic leg band) was removed and standard morphometric measurements were collected again for each individual. Morphometric data were not collected for individuals recaptured in 2021 due to reduced field efforts.
Light-level processing and statistical analysis
We used R versions 4.1.3 for all spatial and statistical analyses (R Core Team, 2022, RRID: SCR_001905). Light-level data from the GLS tags were analyzed following methods outlined by (Lisovski et al., 2020). We processed the raw light-level data and determined daily twilights using twGeos (Lisovski et al., 2015) and then estimated twice-daily locations and the resulting most-probable tracks using probGLS (Merkel et al., 2016). We used both tag-derived and remotely-sensed sea surface temperature (SST) to inform and refine the estimation of most probable locations. Satellite-derived mean SST and mean SST error were extracted from the National Oceanic and Atmospheric Administration (NOAA) Optimal Interpolated SST dataset1). We defined the fastest, most likely speed as 16.5 m/s and the maximum flight speed as 22 m/s following Spear and Ainley (1997) to constrain daily flight distances. The overall median error for probGLS-derived locations is 185 km, with 145 km median error around the spring and fall equinoxes (Phillips et al., 2004; Merkel et al., 2016). Therefore, we did not exclude any data points around the equinoxes from analysis.
We performed a change point analysis to define migratory movements during the non-breeding season (departure date from Middleton Island, arrival date to wintering area, departure date from wintering area, arrival date to Middleton Island) using the GeoLight package (Lisovski and Hahn, 2012) following a similar framework outlined by Hobson et al. (2015). This analysis identified breakpoints in the light data to determine potential residency and migration periods. The approach was valuable for providing an initial estimate of residency periods, however, the error around the estimated location data complicates the determination of exact departure and arrival dates for residency periods. Therefore, using the most-probable locations derived from the probGLS analysis, large (>= 150 km, i.e., the approximate median error for probGLS-derived locations, Merkel et al., 2016), consistent movements away from the breeding and wintering grounds were used as determinants of departure when necessary (e.g., Hobson et al., 2015).
We defined winter as the residency period in which a bird remained in an area for the longest period during the non-breeding season. Fall was defined as the period between departure from the breeding colony and arrival to the wintering area, while spring was defined as the period between departure from the wintering area and arrival back at the breeding area. All residency periods identified during the fall and spring seasons were classified as potential stopovers. We used weekly mean locations (latitude, longitude) to determine the cumulative distance traveled during fall and spring for each individual tufted puffin to estimate migration distance. The mean monthly great-circle distance from the breeding colony and the great-circle distance from the breeding area to the mean wintering location were calculated for each individual using the haversine formula included in the geosphere package in R (Hijmans, 2021).
We developed an a priori set of 11 candidate linear models with sex, body condition, and year as explanatory variables to test for differences in 14 non-breeding movement response variables (see Supplementary Table 1 for the candidate model set details). An individual body condition term was calculated by extracting the residuals from a linear regression of bird weight as a function of the first principal component (PC1) of body size based on the lengths of the wing chord, tarsus, culmen, and head-bill, as well as bill depth that were collected at the time of first capture. Response variables of interest included arrival and departure dates, travel distances between and number of days to reach wintering and breeding areas, and winter longitude and latitude. We used information-theoretic methods to direct model selection and parameter estimation following Burnham and Anderson (2002). The MuMIn package in R (Barton, 2020) was used for full model averaging and estimation of weighed parameter estimates and parameter likelihoods.
We calculated seasonal utilization distributions (UDs) for male and female tufted puffins using the adehabitatHR package in R (Calenge, 2006). To quantify consistency of spatial distributions within each sex, we calculated the proportion of overlap in the core distributions (50% UD) within males and females for each season across years. To compare spatial use between the sexes, we calculated the proportion of overlap in spatial distributions between males and females for each season across years. Seasonal cutoffs were determined using the change point analysis as described above.
At-sea observations
To provide context for our results and broaden our assessment of tufted puffin non-breeding seasonal distributions, we consulted the North Pacific Pelagic Seabird Database (NPPSD v. 3.02). The NPPSD is a database containing abundance and distribution data for >20 million birds representing 160 species and collected over a 40-year time span in the North Pacific Ocean including the Alaskan shelf and deep ocean waters (Drew and Piatt, 2020). Data in the NPPSD database are standardized into 3.3 km transect segments with observations aggregated to the midpoint of each segment.
We queried the full NPPSD and acquired all available at-sea distribution and abundance data for tufted puffins. We aggregated these records into three non-breeding season distributions (fall, winter, and spring) using the mean values derived from the change point analysis. We binned the observations into 100 x 100 km grid cells and calculated the mean density of tufted puffins when present (birds/km2) for each grid cell. All mapping and spatial binning of the NPPSD observations was conducted using ArcMap 10.8 (ESRI, 2020, RRID: SCR_011081).
Results
Geolocator deployment and recovery
Of the 60 GLS tags deployed on reproductive adult tufted puffins during two breeding seasons (2018, 2019), we recovered 42 GLS tags over the course of three subsequent field seasons (2019: n = 16 [deployed in 2018]; 2020: n = 24 [3 deployed in 2018, 21 deployed in 2019]; 2021: n = 2 [deployed in 2019]), achieving a 70% recovery rate (Table 1). Five GLS tags were recovered two years after deployment (2018-2020: n = 3, 2019-2021: n = 2) (see Supplementary Figure 1). Overall, GLS failure rates were low. Of the 42 recovered tags, three tags failed prior to recovery during the first year of deployment (failure dates: Sept. 13, 2019; Feb. 12, 2019; Apr. 12, 2020) and two failed during the second year of deployment prior to recovery (failure date: March 20, 2020 for both). In total we obtained 42 complete and five partial annual migration routes. We note that all recaptures of GLS tagged tufted puffins occurred at the same burrow where the bird was originally located.
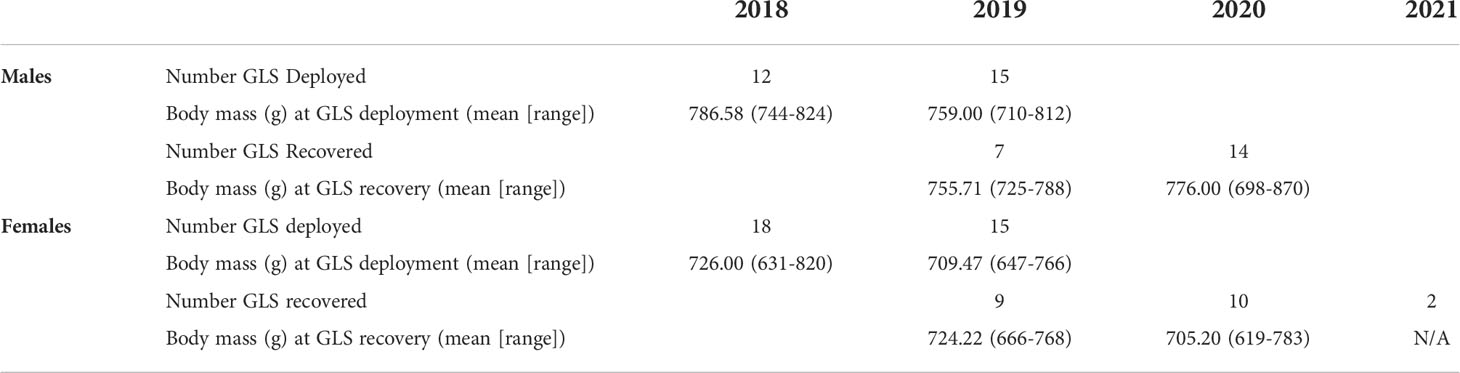
Table 1 The number of light-level geolocator (GLS) tags deployed and recovered, and associated body mass measurements, from adult tufted puffins nesting at Middleton Island, Alaska (2018-2021).
GLS tags were deployed on 27 males (2018: n = 12, 2019: n = 15) and 33 females (2018: n = 18, 2019: n = 15) and recovered from 21 males and 21 females (Table 1). At first capture (late-July 2018 and 2019), body weight of tufted puffins averaged 771.3 g (n = 27) for males and 718.5 g (n = 33) for females. Upon recapture the following year (late-June 2019 and 2020), males weighed 769.2 g (n = 21) and females 714.2 (n = 19) (Table 2). Structurally, male tufted puffins had longer wing chord, tarsus, culmen, head-bill, and weight measurements than females (Table 2).
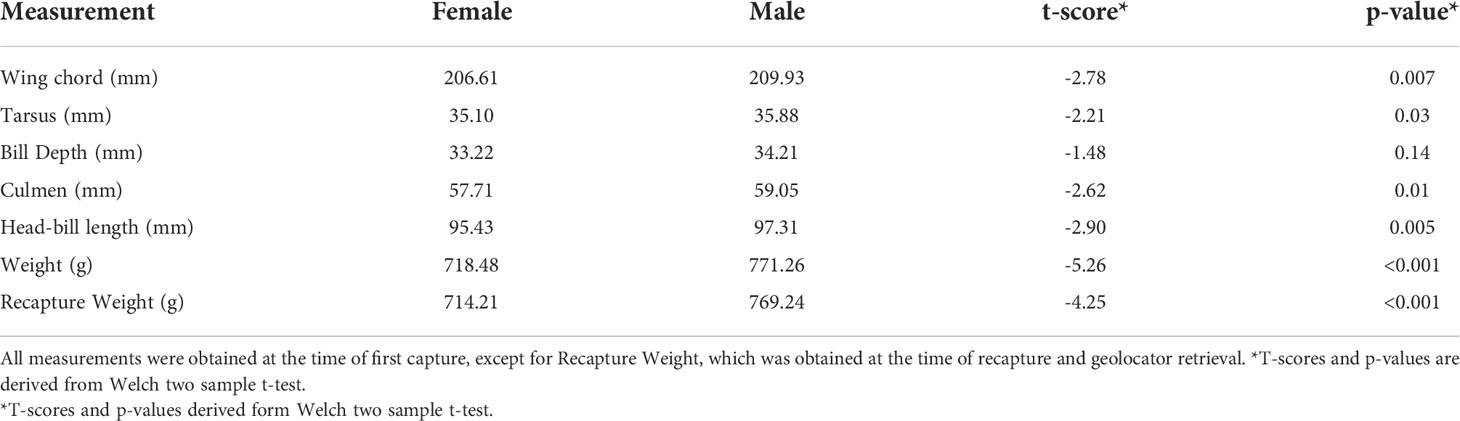
Table 2 Comparison of morphometric measurements taken at the time of first capture (except for recapture weight) of adult male and female tufted puffins nesting at Middleton Island, Alaska.
Summary statistics of migration timing and movements are presented below as the mean ± standard deviation. We did not include the second year of data for individuals tracked during 2019-2021 in modeling efforts or in summary statistics due to small sample sizes (n = 2, 2020-2021).
Migration timing
During the study, tufted puffins departed Middleton Island in early September (mean departure date: 5 September ± 10.5 days). Sex, year, and body condition did not explain more variation in breeding site departure dates than the null model (Tables 3, 4). After departing the breeding area, males made fewer stops and arrived earlier to wintering areas compared to females in both years, however the arrival date to the wintering area was later in 2019 compared to 2018 for both sexes (Tables 3, 4). Modeling results suggested males visited 1.1 ± 0.7 stopover locations between the breeding and wintering area, while females visited 1.7 ± 0.8 stopovers, however the confidence intervals for the parameter estimates of the sex term overlapped zero (Table 3). After departure from Middleton Island, males took 30.5 ± 16.7 days in 2018 and 30.8 ± 24.6 days in 2019 to arrive at wintering areas in early October (mean arrival date for 2018: 3 October ± 18.8 days, 2019: 9 October ± 19.0 days). In contrast, females took 36.1 ± 16.8 days in 2018 and 59.8 ± 17.3 days in 2019 to arrive at wintering areas by mid-October in 2018 (10 October ± 16.5 days) and late-October in 2019 (31 October ± 13.3 days).
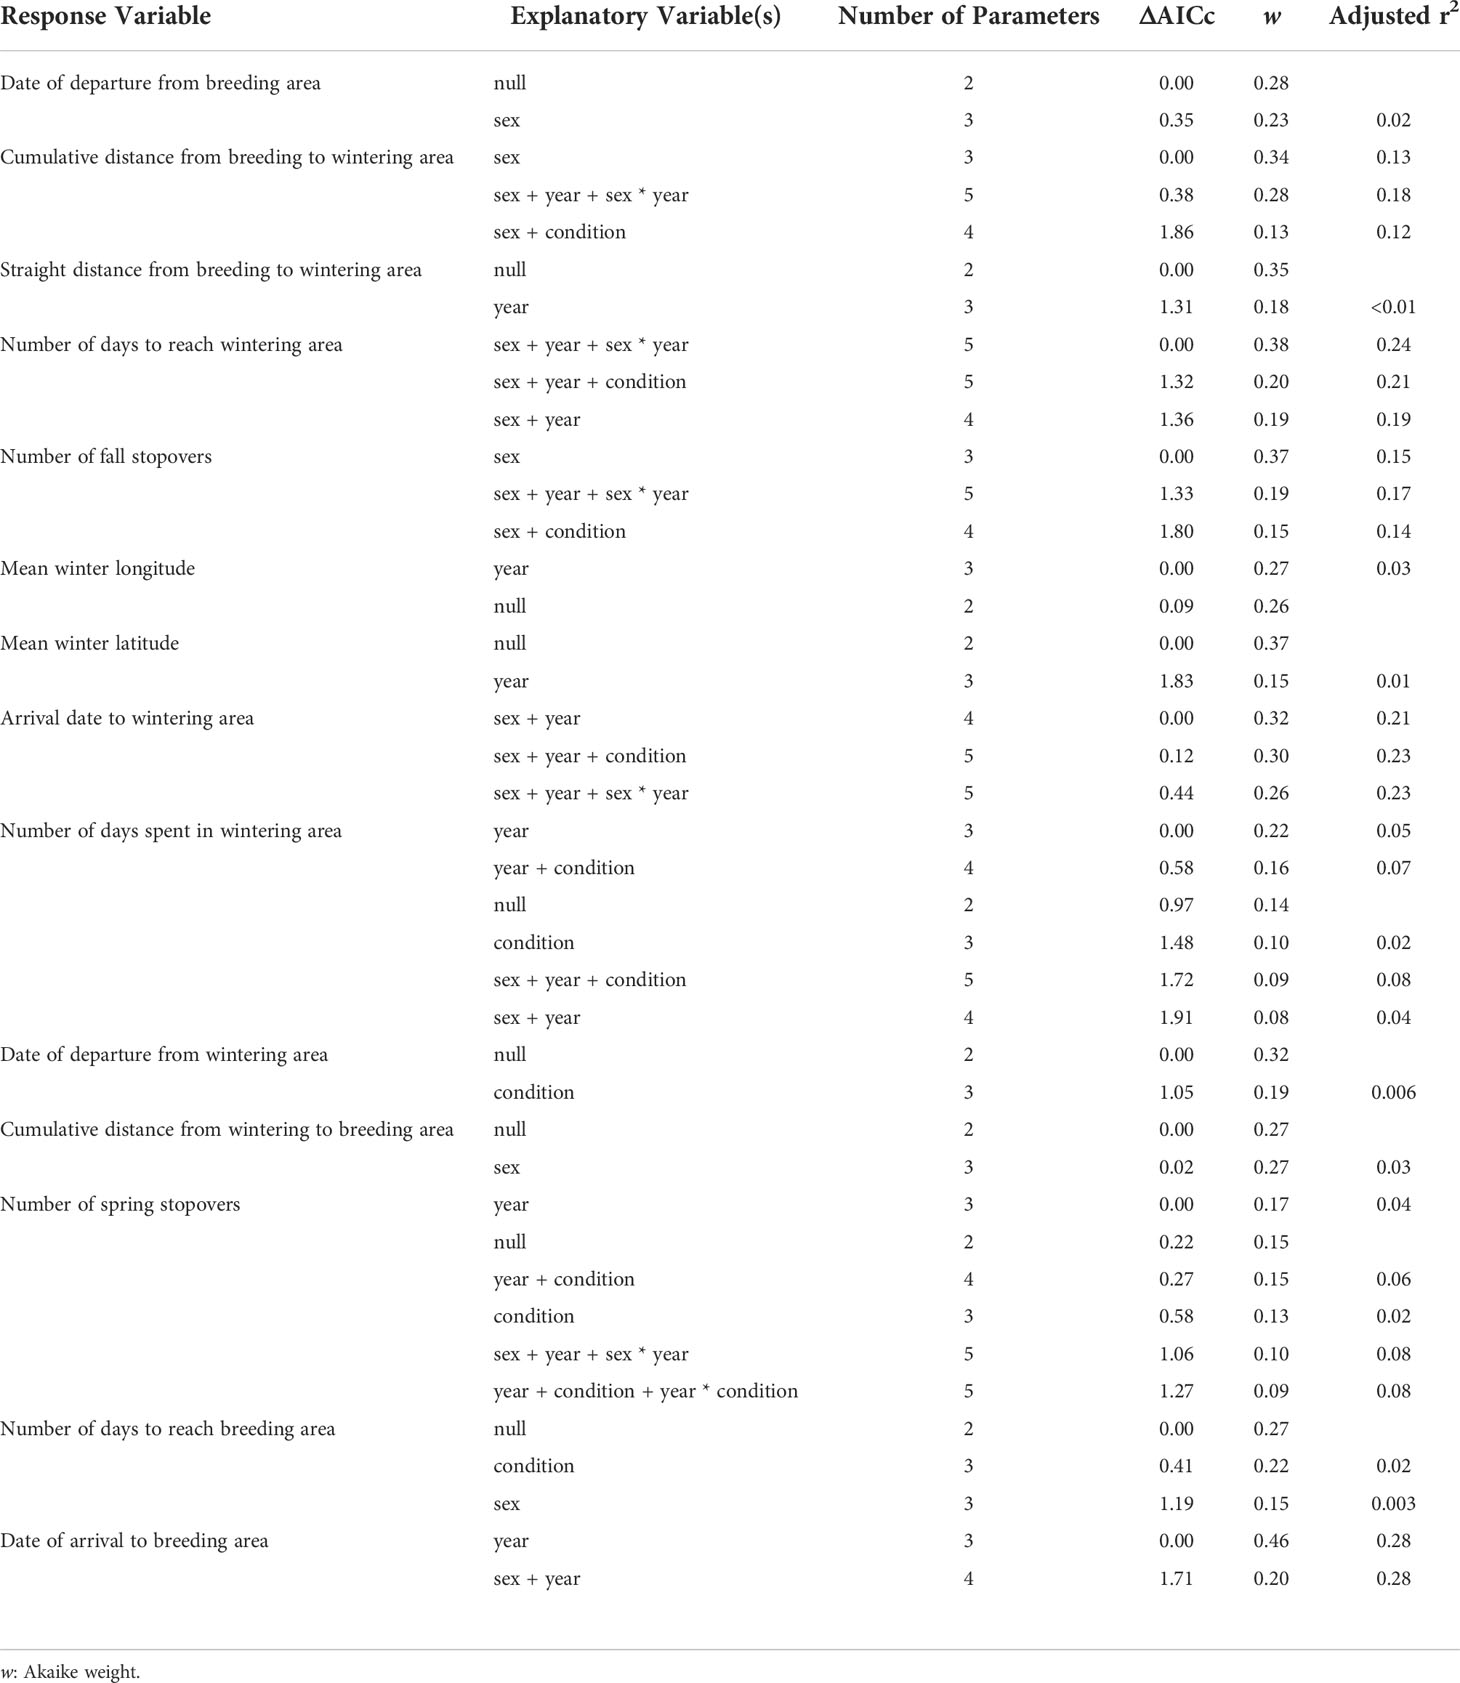
Table 3 Models that received Akaike’s Information Criterion values adjusted for small sample size, AICc, less than 2 for linear regression analysis testing the effects of sex, year, and body condition of adult tufted puffins nesting at Middleton Island, Alaska for 14 non-breeding movement response variables.
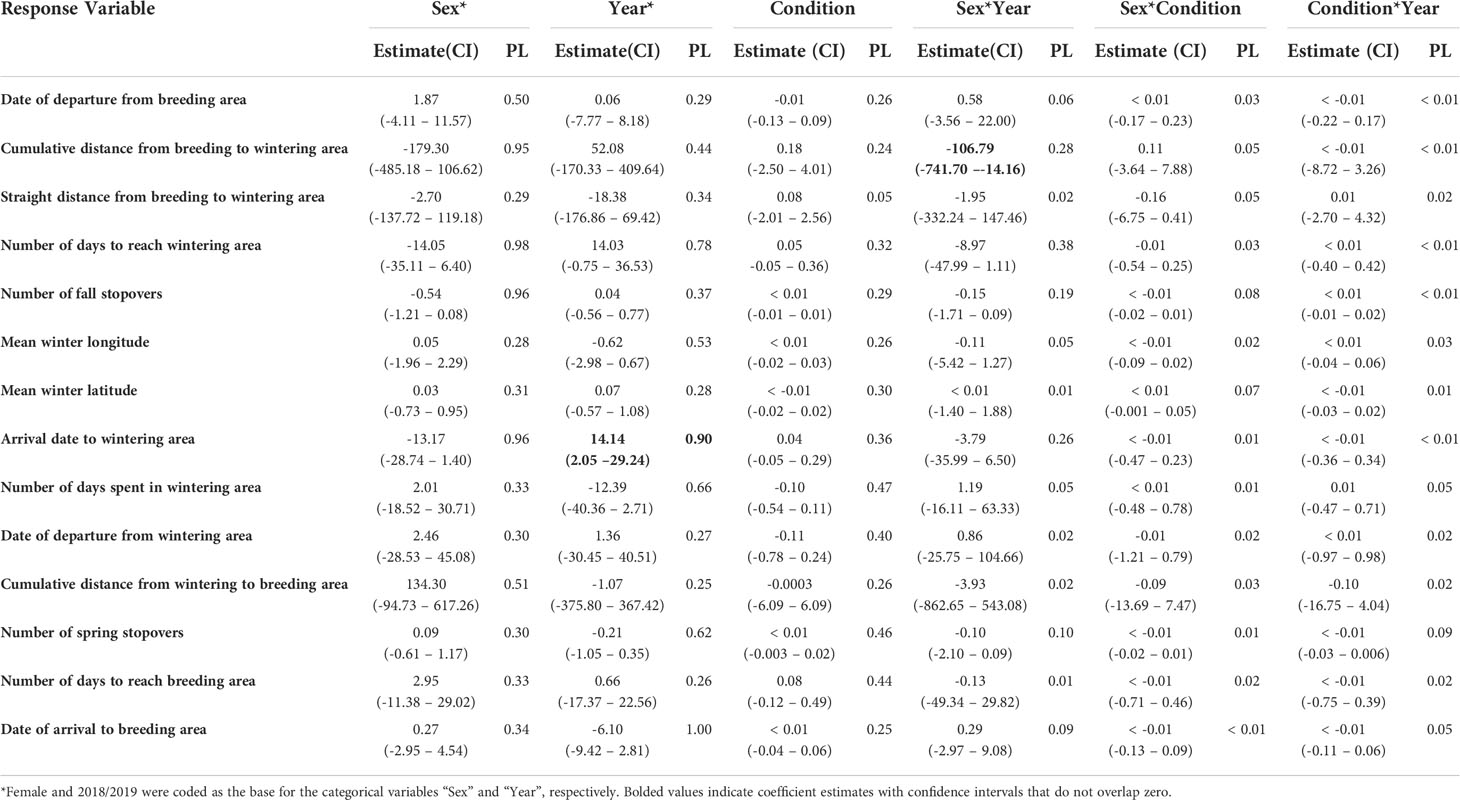
Table 4 Parameter estimates, 95% confidence intervals (CI), and parameter likelihoods (PL) for candidate models explaining variation in tufted puffin movements.
The number of days spent in the wintering area, departure date from the wintering area, number of stopover locations, and number of days to reach the breeding area varied widely across individuals but there were no sex, year, or body condition differences detected (Tables 3, 4). On average, tufted puffins remained at their wintering areas for 151.9 ± 31.6 days, departing in late-March (mean departure date: 22 March ± 49.7). Spring movements lasted 49.1 ± 29.4 days on average and tufted puffins visited 1.4 ± 0.9 stopovers. Modeling results provide some support that arrival date back to the breeding colony at Middleton Island varied by year (Table 3), although confidence intervals for the year term overlap zero (Table 4). In 2019, tufted puffins arrived back to the Middleton Island breeding colony in early May (mean arrival date: 5 May ± 5.1 days). In 2020, puffins arrived slightly earlier (mean arrival date 28 April ± 4.1 days).
Seasonal distribution
During the non-breeding season, tufted puffins nesting at Middleton Island were primarily distributed off the continental shelf in the GOA and Northeast Pacific Ocean between 50 – 58 °N and 132 – 150 °W (Figure 2). However, we also documented nearshore habitat use during one winter (2018-2019) of our study.
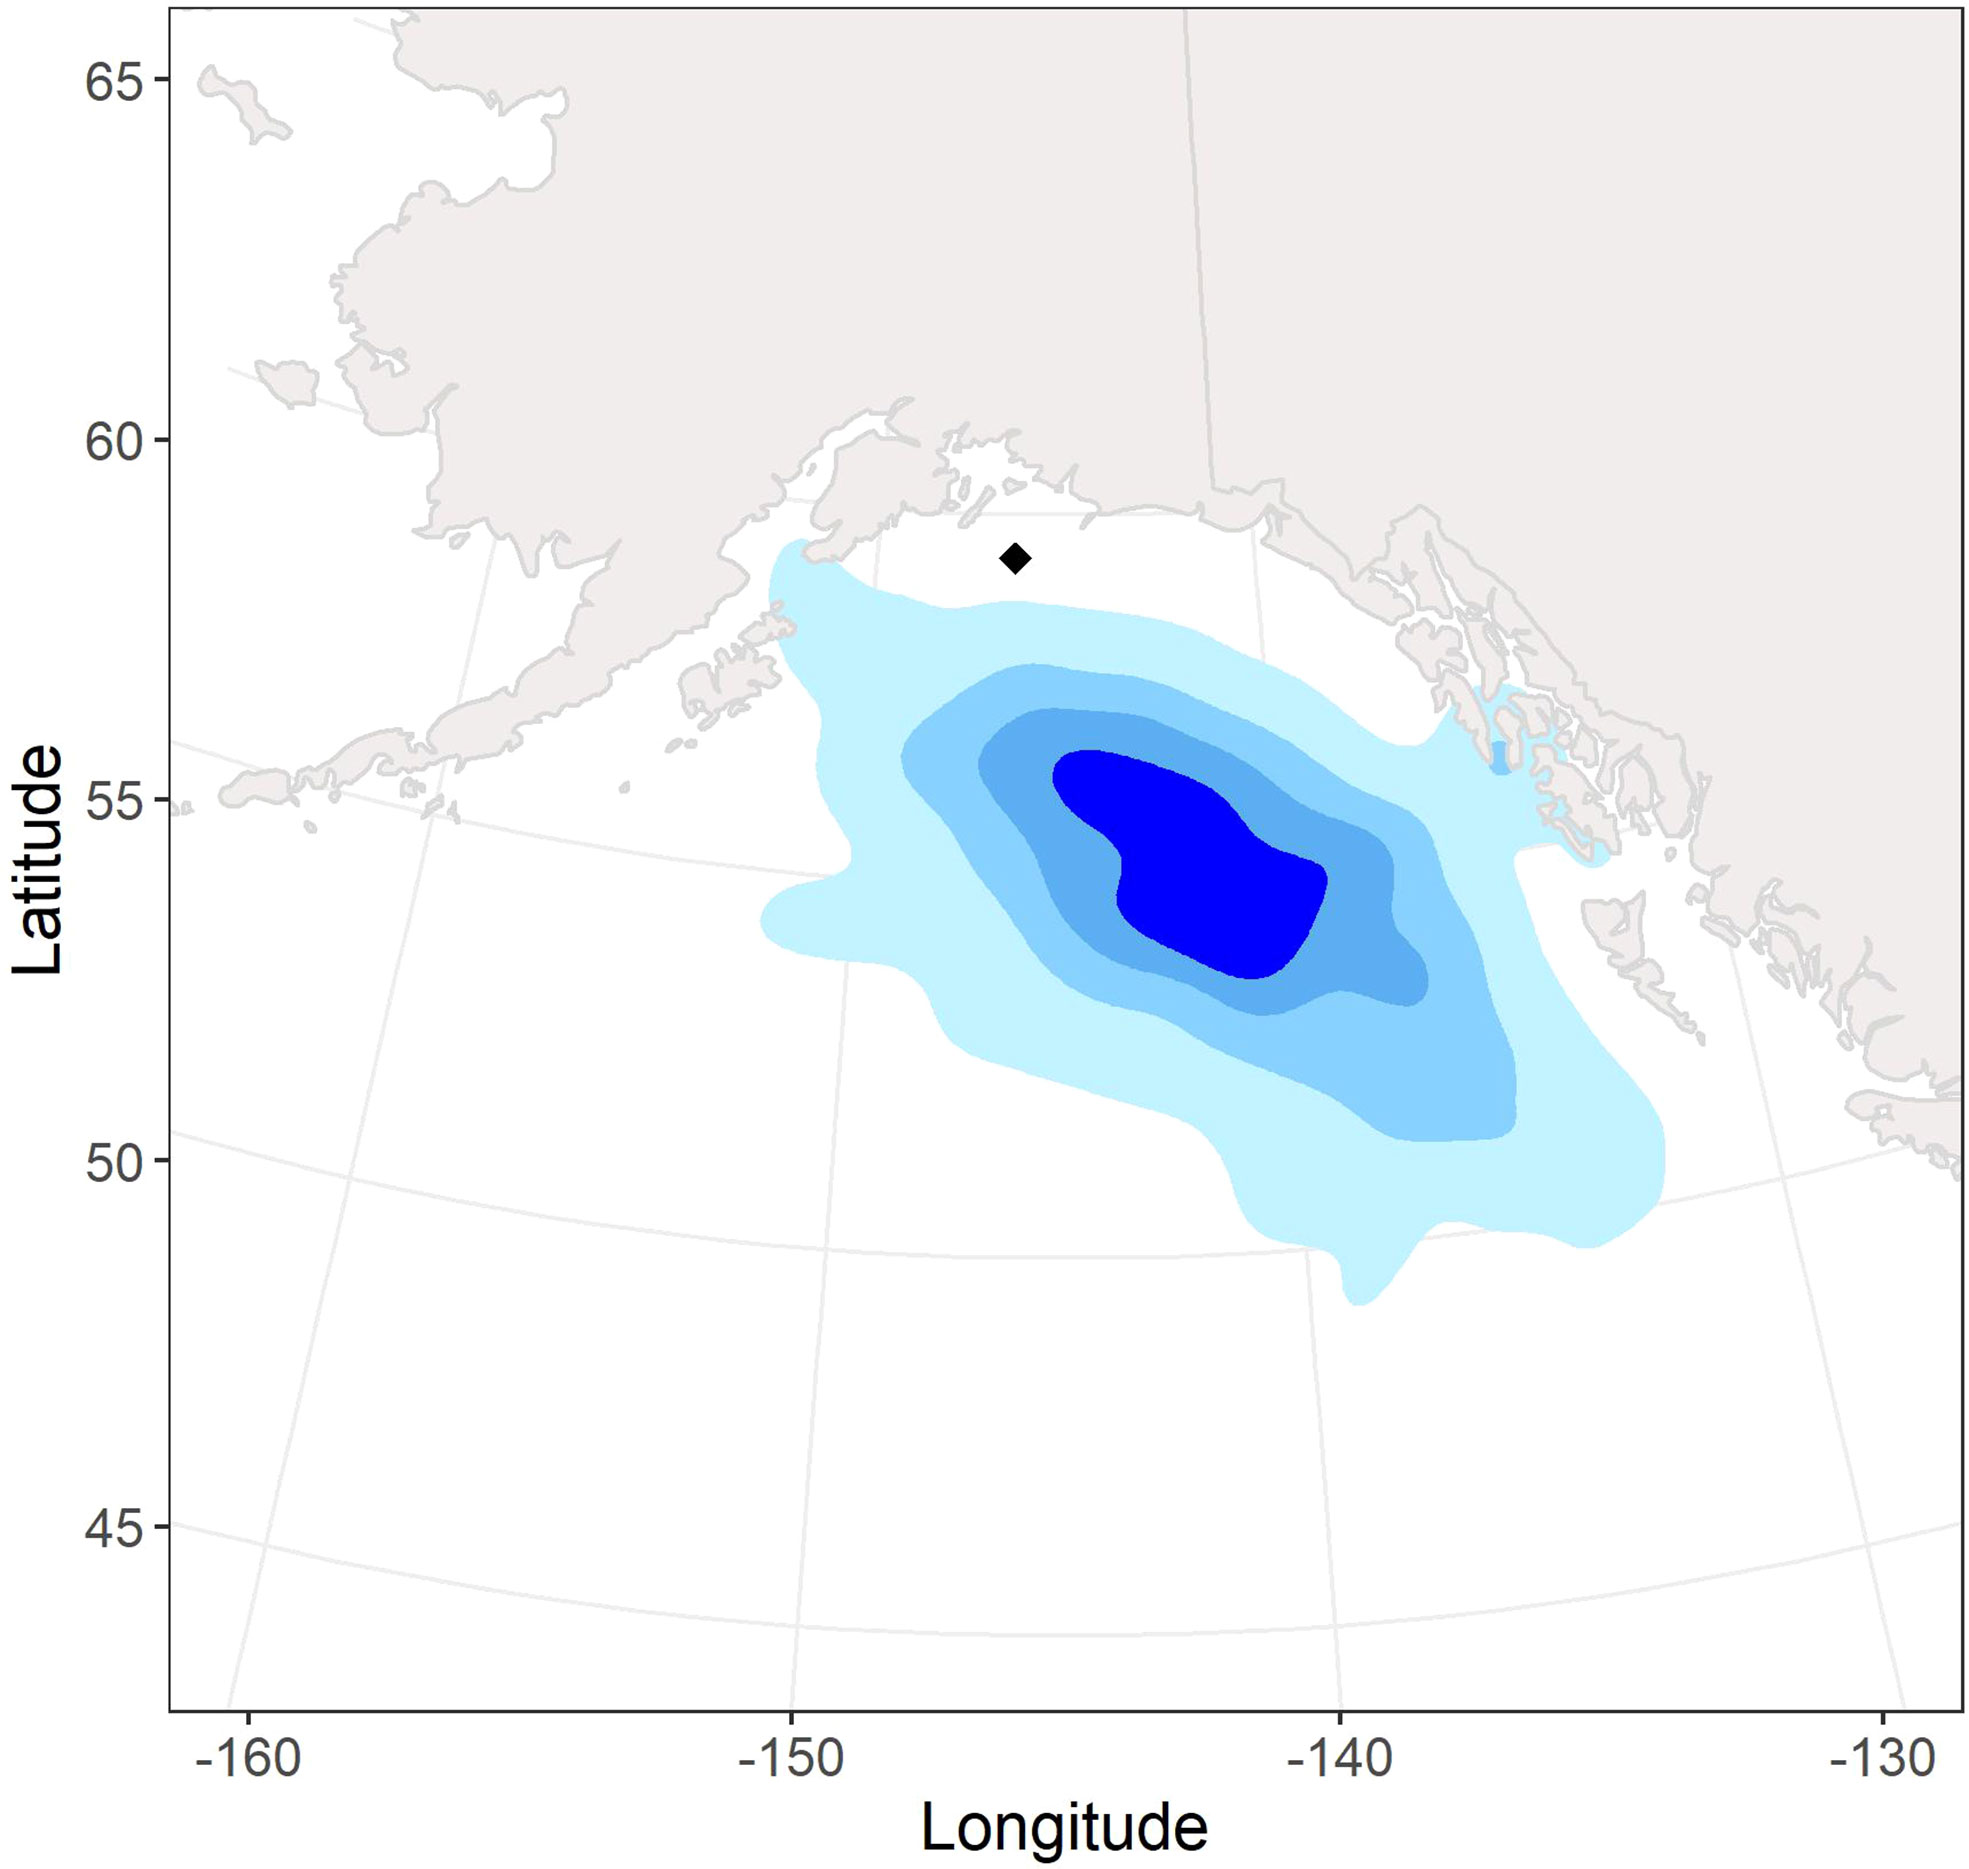
Figure 2 Non-breeding season (fall – spring) kernel density utilization distributions (95%, 75%, 50%, 25%; light blue to dark blue) of 47 annual tracks from 42 adult tufted puffins tagged with archival light-level geolocators at Middleton Island, Alaska (2018–2021). The location of Middleton Island is denoted by the black diamond.
After departing the breeding area, female puffins traveled farther on average (674.92 ± 349.77 km) than males (405.71 ± 234.94 km) during the fall season (Tables 3, 4). The sex by year interaction term was significant as demonstrated by the non-overlapping confidence intervals (Table 4), revealing important differences in the post-breeding season movements by male and female puffins across years. In 2018, both males and females traveled roughly the same distance during the fall season before arrival to their wintering areas (females: 561.41 ± 224.18 km; males: 528.70 ± 259.12 km). In contrast, during fall 2019, males traveled 335.42 ± 195.90 km on average, while females covered over twice that distance (770.98 ± 413.28 km) due to the protracted duration of the fall 2019 period for females.
There were no significant differences in the mean winter latitude or longitude by sex, year, or body condition (Tables 3, 4). Mean wintering locations spanned 5.1 degrees of latitude (51.70 – 56.80 °N) and 10.9 degrees of longitude (136.3 – 147.2 °W). The average distance between breeding and wintering locations across all GLS tagged individuals was 615.67 ± 189.71 km. Tufted puffin distributions shifted southward throughout the non-breeding season, with a mean distance from the colony of 560.20 ± 133.96 km in November compared to 716.21 ± 276.22 km in February (Figures 3, 4; see also Supplementary Figures 2, 3 for seasonal kernel density distributions for males and females across years).
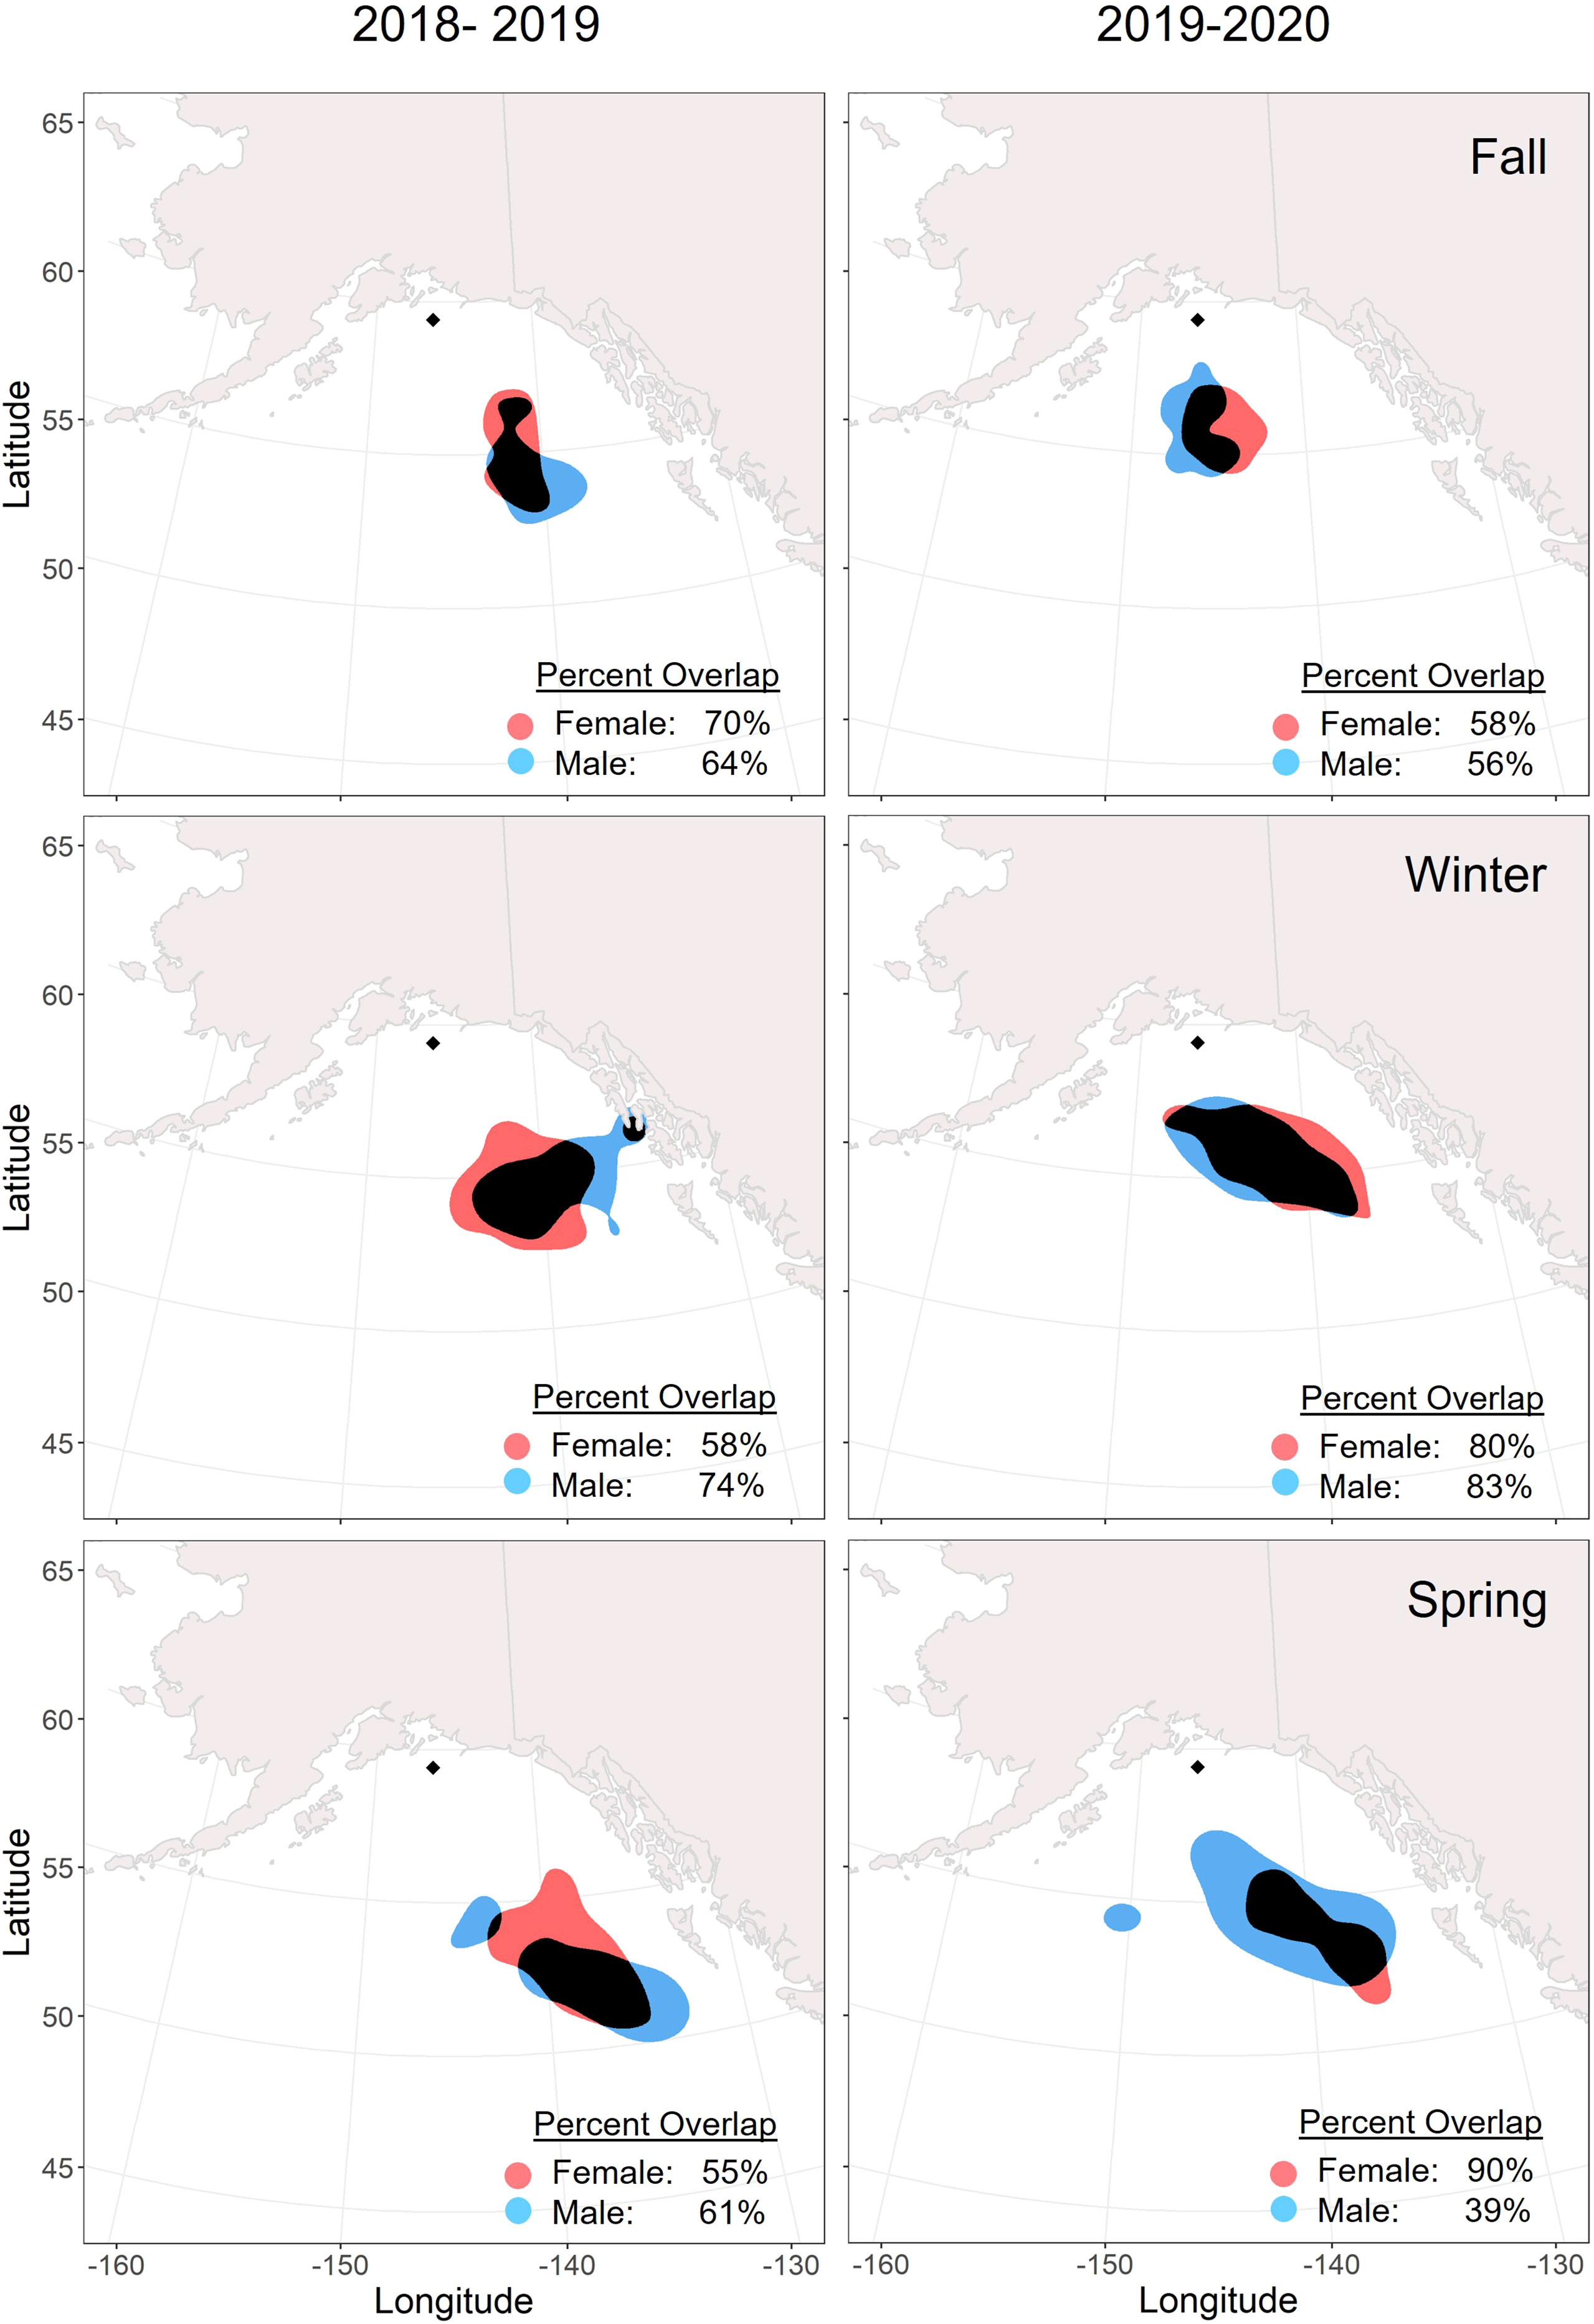
Figure 3 Overlap of core (50%) utilization distributions for male (blue) and female (red) tufted puffins within non-breeding seasons. Adult tufted puffins were fitted with archival light-level geolocators at Middleton Island, Alaska (2018-2020). The location of Middleton Island is denoted by the black diamond. Areas where the distributions overlap are displayed in black. The timing of seasons was determined by a change point analysis for each tracked puffin.
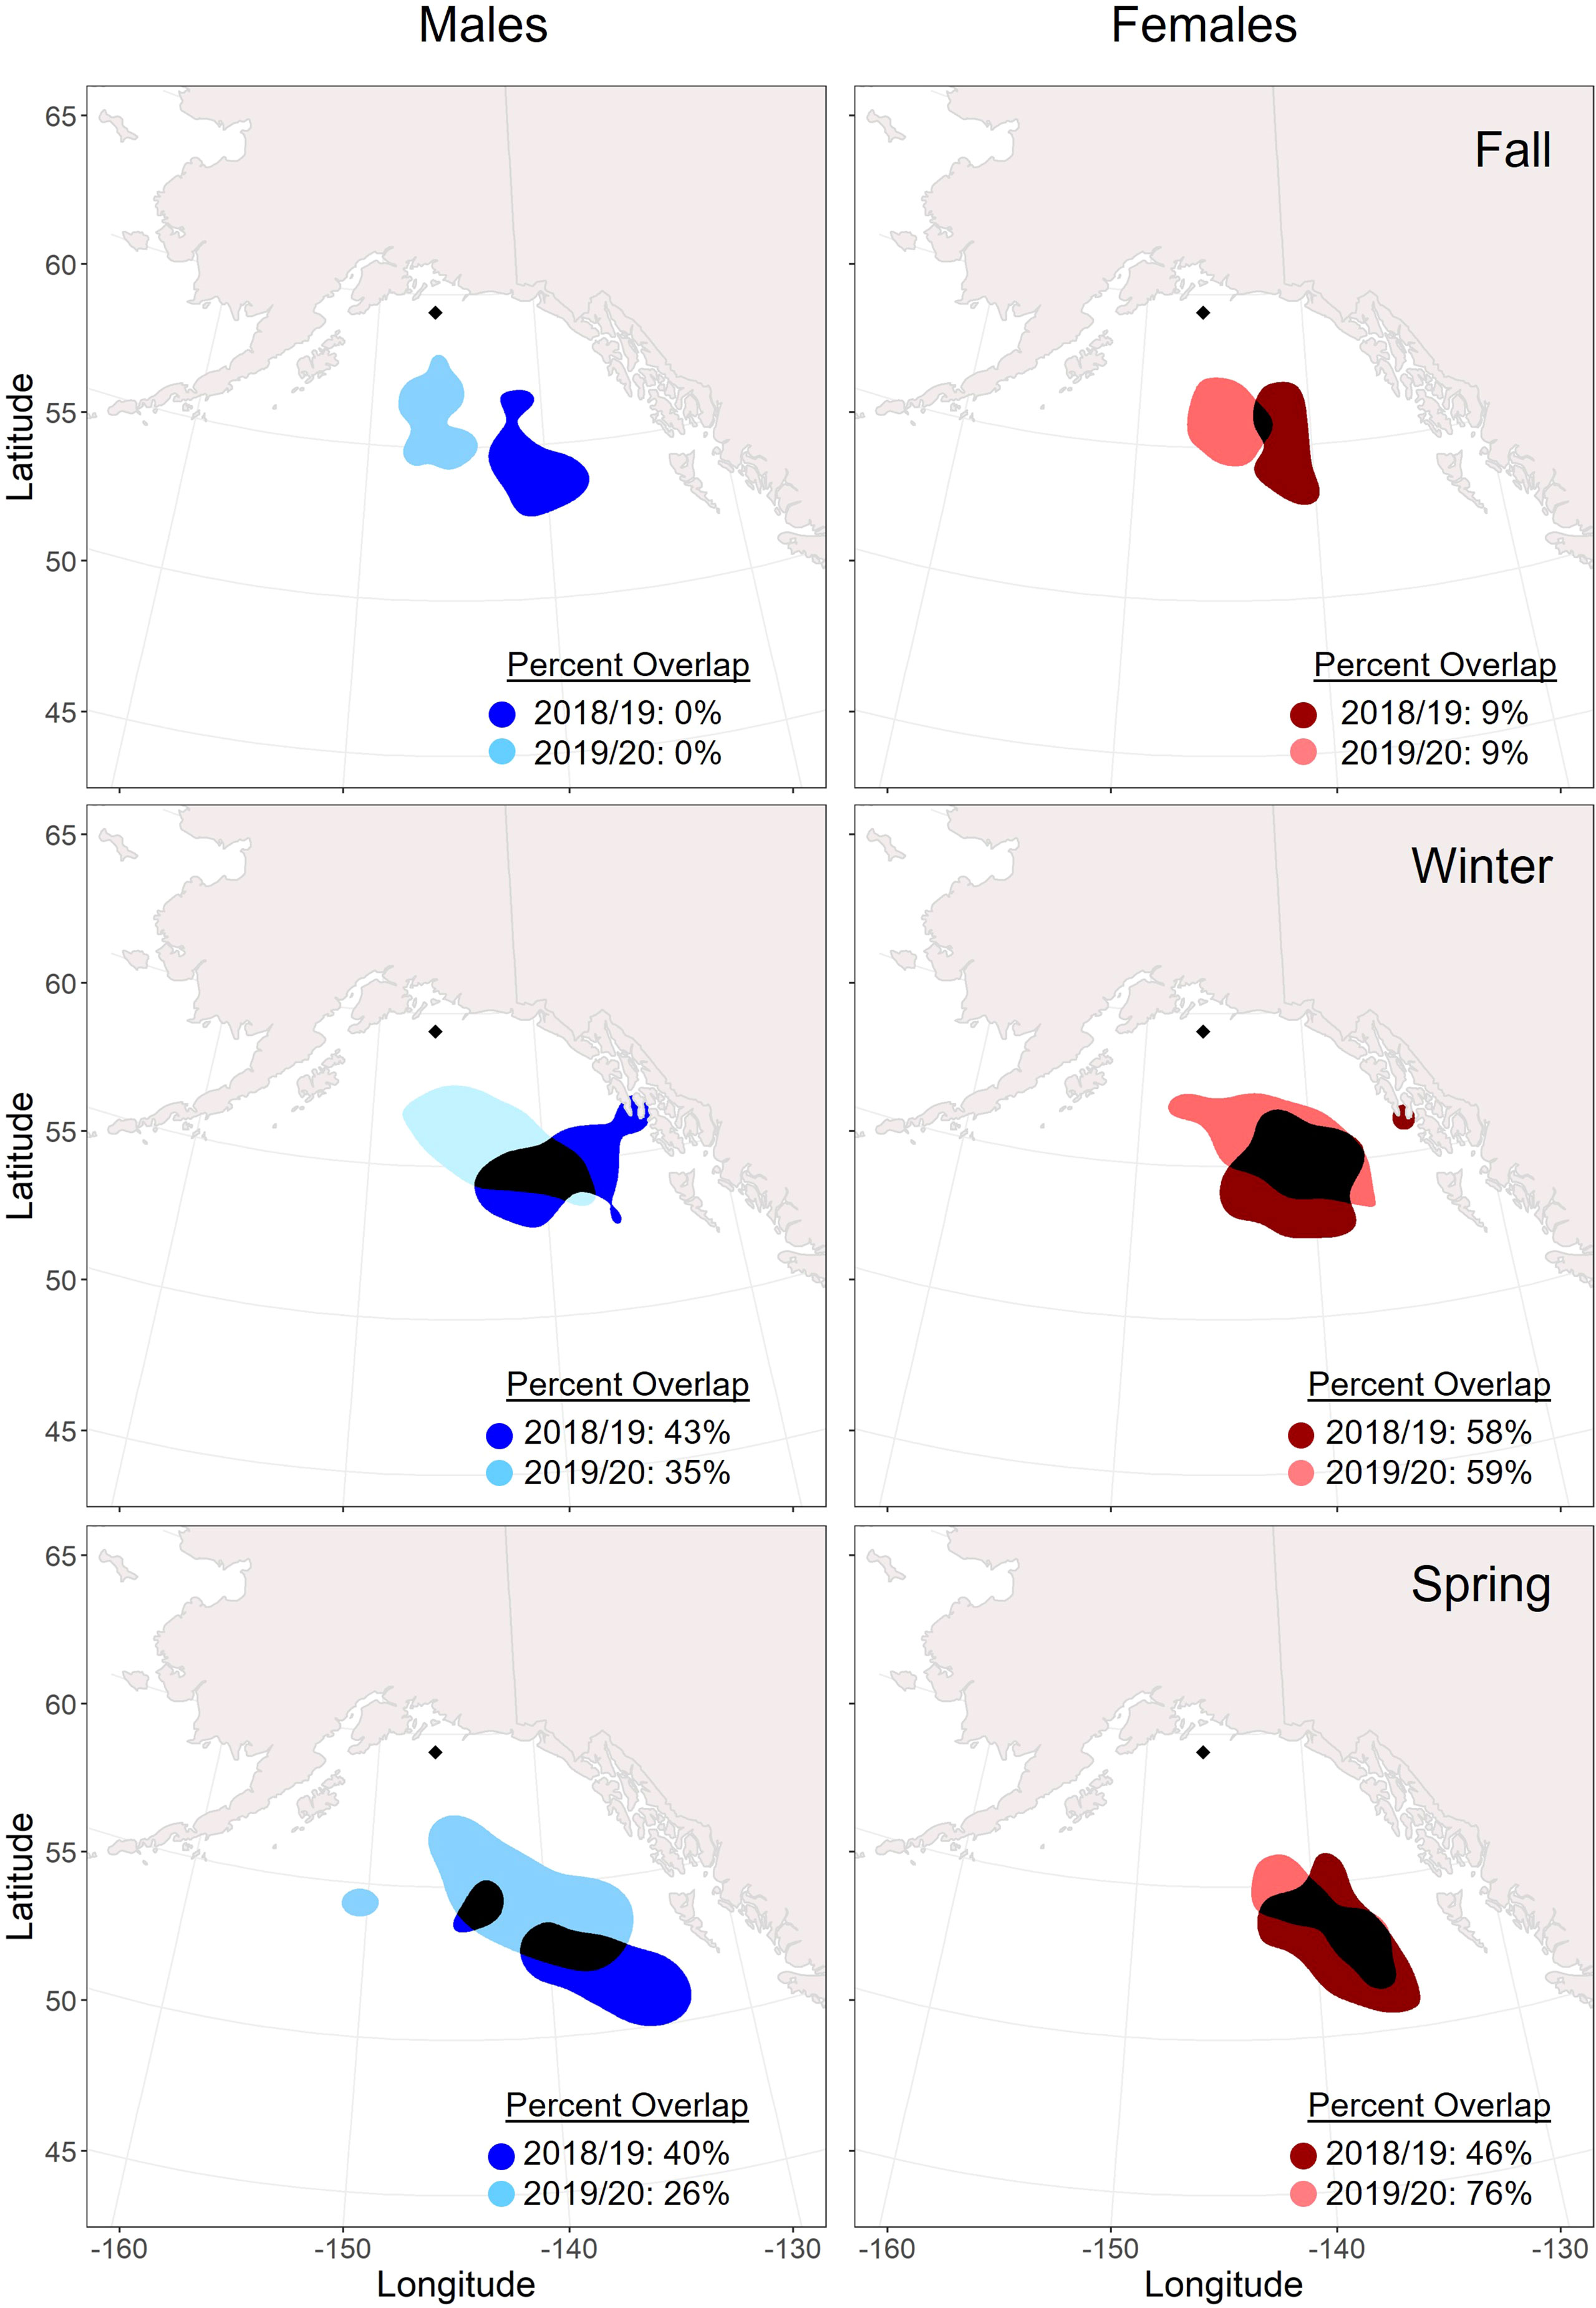
Figure 4 Overlap of seasonal core (50%) utilization distributions across years (2018/19: darker color; 2019/2020: lighter color) for male and female tufted puffins fitted with archival light-level geolocators on Middleton Island, Alaska (2018-2020). The location of Middleton Island is denoted by the black diamond. Areas where the distributions overlap are displayed in black. The timing of seasons was determined by a change point analysis for each tracked puffin.
In spring, there were no significant differences in the cumulative distance traveled before arrival back to the breeding area by sex, year, or body condition (Tables 3, 4). Due to the southward shift over the winter period, on average, tufted puffins covered more distance during spring (850.97 ± 520.72 km) compared to fall (546.17 ± 326.76 km).
Males and females showed relatively consistent spatial distribution within seasons, especially during winter. Core distributions (50% UD) between the sexes overlapped by over 50% in all seasons and years except for spring 2020 when the female distribution was more spatially constrained (Figure 3). Across years, females demonstrated higher consistency in core (50% UD) non-breeding distribution in all seasons compared to males (Figure 4), especially during winter and spring. For both males and females, the fall distributions in 2019 shifted west and northwards. In winter 2018/2019, both male and female core distribution included a nearshore area in southeastern Alaska near Kuiu Island and the southern end of Baranof Island. During both springs, core distributions for both males and females tended to shift southward from the wintering area.
During the 2018/19 non-breeding season, all estimated UDs (25%-95%) primarily remained north of 50° latitude across all seasons (Supplementary Figure 2). However, in 2019/20, distributions expanded southwards during fall (females), winter (males and females), and spring (males) (Supplementary Figure 3). The farthest recorded distribution reached just south of 45°N during the winter season. The southward expansion of these seasonal ranges resulted in 95% UD areas that were 39% larger for females during fall, 4% larger for males during winter, and 97% larger for males during spring of the 2019/20 non-breeding season as compared to their 2018/19 distributions.
At-sea observations
Of the 460,285 transects we examined in the NPPSD, 50,151 transects contained observations of tufted puffins. These observations were aggregated by the mean seasonal values derived from the change point analysis. Records of tufted puffins included: Fall (September 5 – October 14) 7,516 of the 67,752 transects (11.09%); Winter (October 15 – March 21), 1,423 of 80,087 transects (1.78%); and Spring (March 22 – May 2), 1,246 of 47,986 transects (2.60%) (Figure 5).
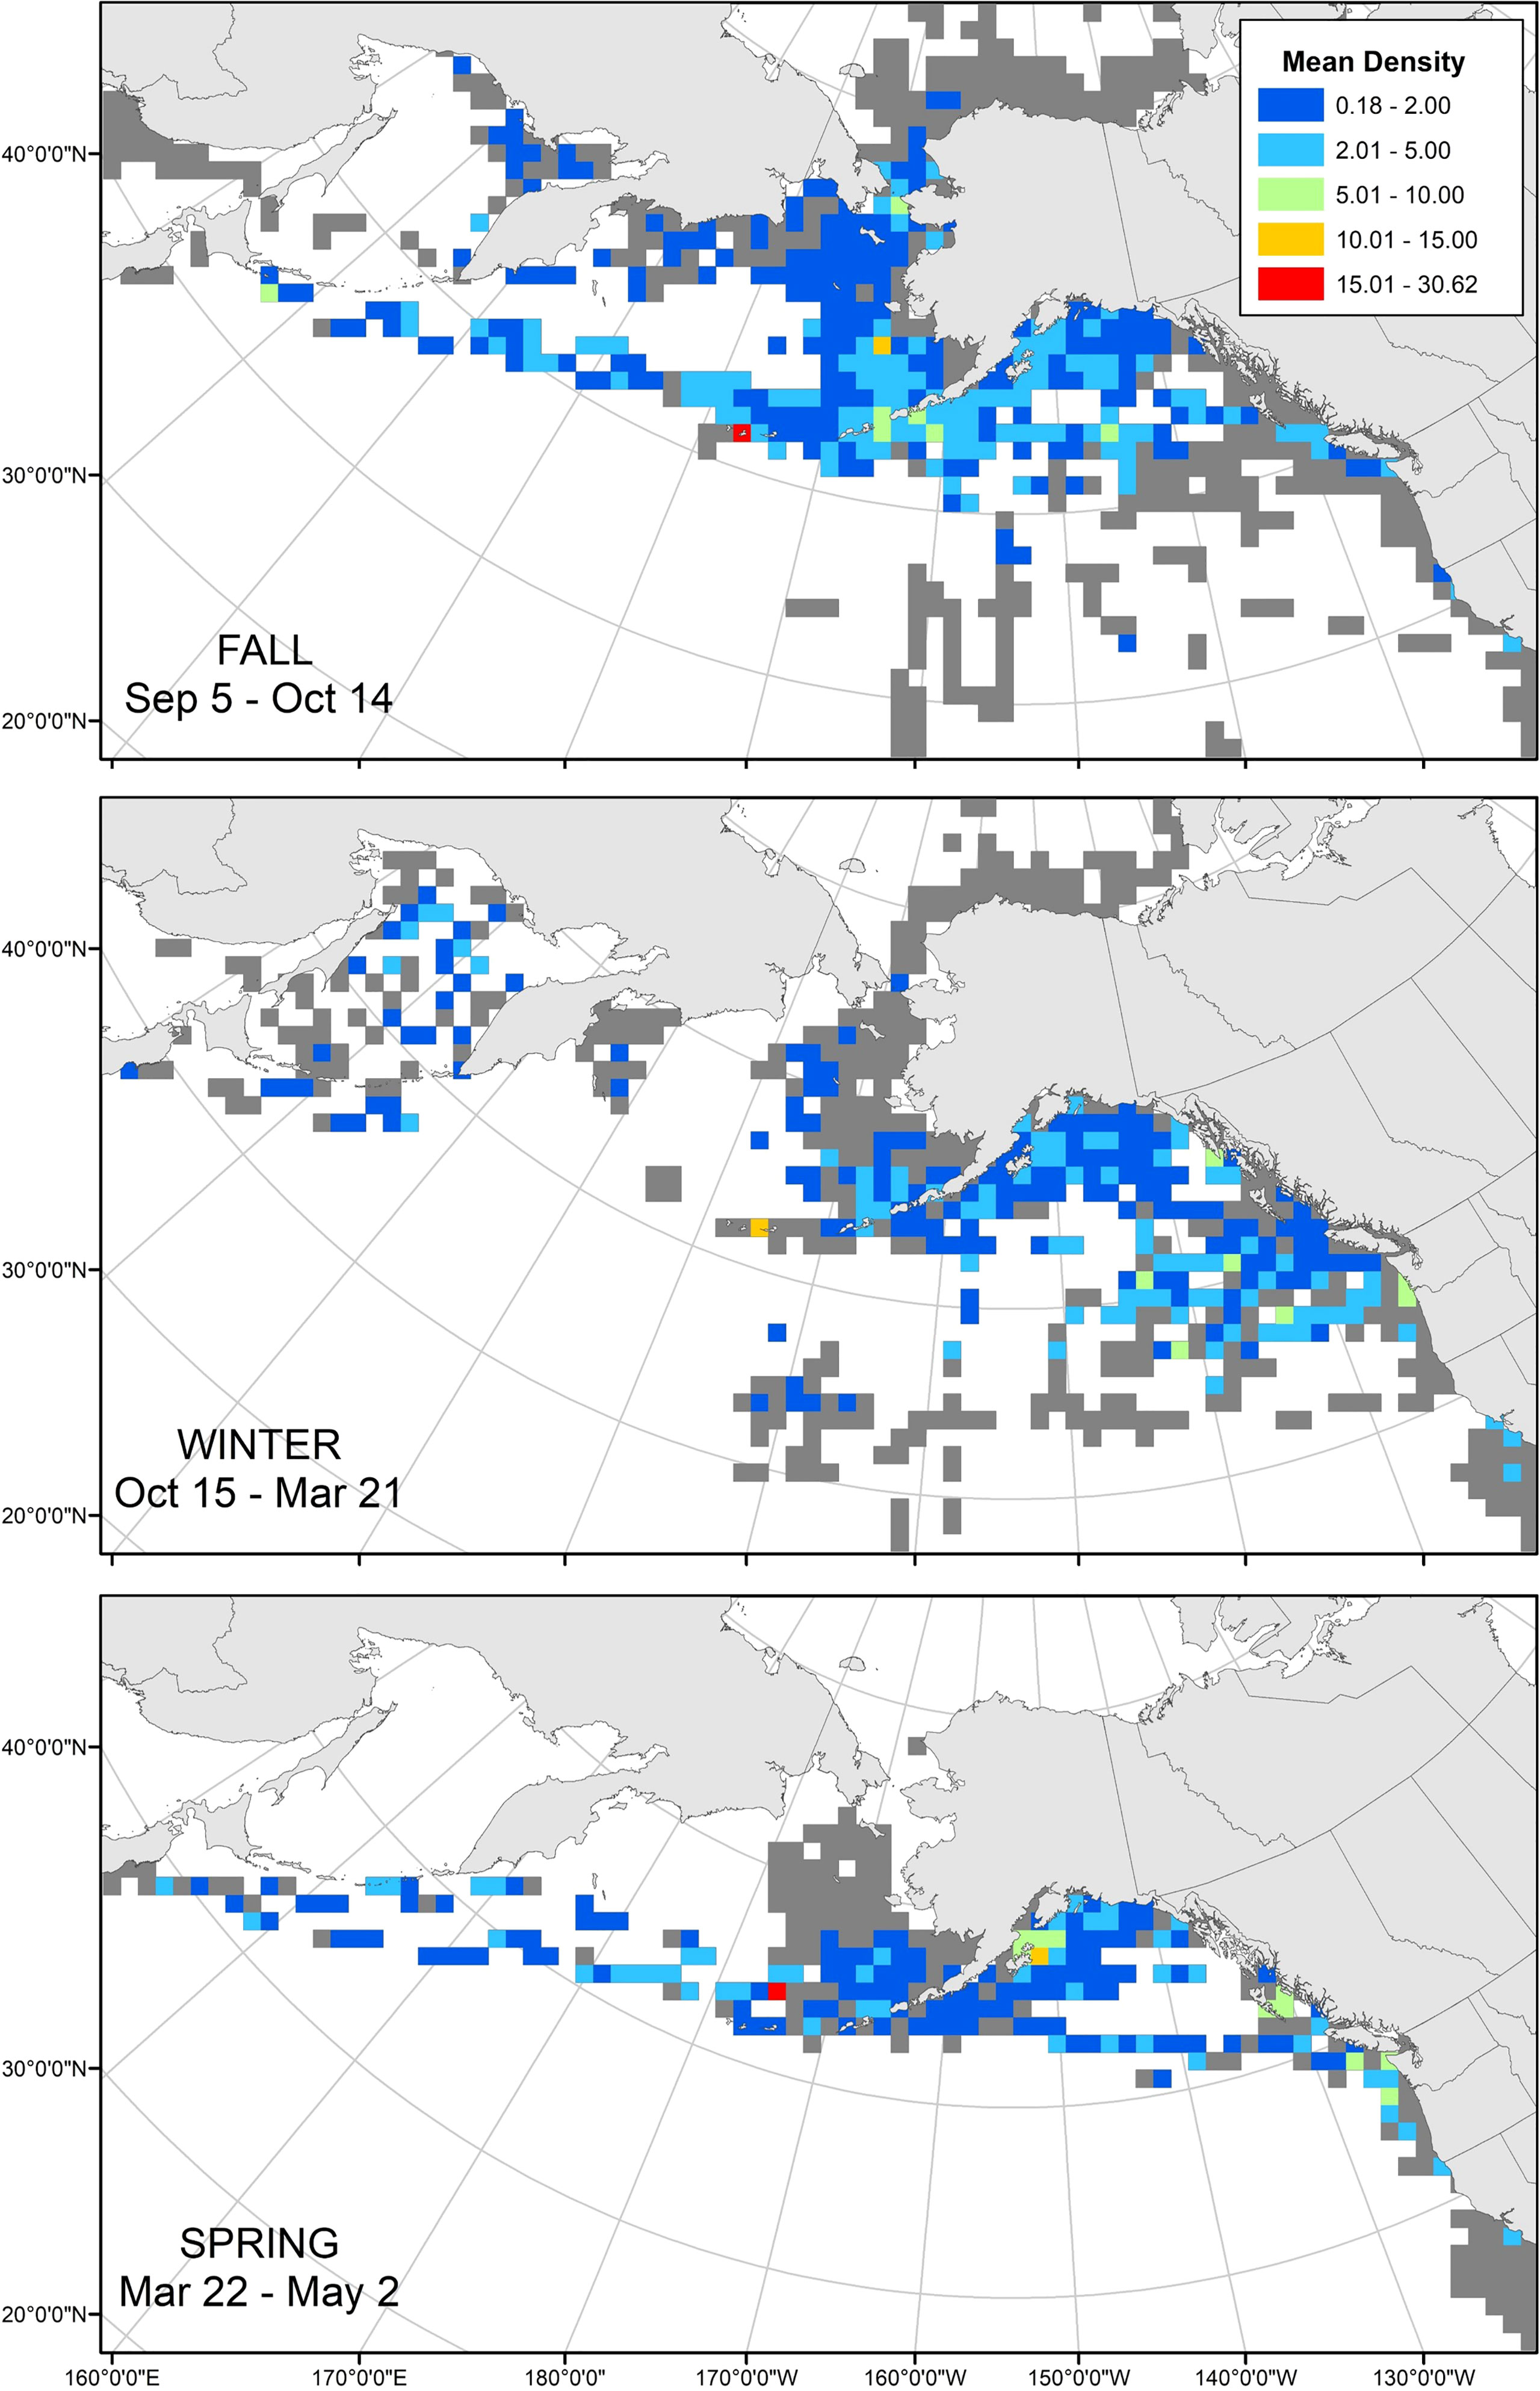
Figure 5 North Pacific Pelagic Seabird Database mean tufted puffin density (birds/km2) by seasons, 1974 – 2019. At-sea observations were binned into 100 x 100 km grid cells and seasons were defined based on mean dates derived from our tracked tufted puffins (Fall: Sep 5 – Oct 14; Winter: Oct 15 – Mar 21; Spring: Mar 22 – May 2. Grayed cells indicate surveyed areas without tufted puffin observations.
Tufted puffins were observed in relatively low densities throughout the non-breeding season. During winter, the highest density was recorded in the Aleutian Islands, and intermediate densities recorded in the nearshore waters of southeastern Alaska and Washington, and off the shelf in the Northeast Pacific (Figure 5). Of the 1,423 winter transects with puffin observations, most occurred in November (31%), February (28%), and October (24%), while few occurred in March (10%), January (4%), and December (4%).
Discussion
Drivers of non-breeding season spatial distribution
This is the first study to report the non-breeding seasonal movements and over-winter pelagic distribution of tufted puffins. Geolocator data from 42 complete migration routes revealed that tufted puffins were short-distance migrants, wintering in the deep GOA and Northeast Pacific waters ~615 km south and southeast of the Middleton Island breeding colony. Similar to Atlantic puffins (Burnham et al., 2021) and Cassin’s auklets of British Columbia, Canada (Studholme et al., 2019), our study population of tufted puffins shifted southwards throughout the non-breeding season, ranging from ~560 km from the colony in early winter to ~716 km from the colony during late winter. These results are in contrast to previous evidence suggesting tufted puffins winter south of 40°N and in the central North Pacific Ocean (see International North Pacific Fisheries Commission, 1992, noted in Piatt and Kitaysky, 2002). Instead, the core (50% UD) of this population’s non-breeding range extended to just south of 55°N, off the coast of southeast Alaska (Figure 2), while the southernmost locations recorded for tufted puffins in this study were just south of 45°N in the waters west of Washington state. We hypothesized that male and female tufted puffins would share similar migratory locations and our results suggest no segregation of the sexes across fall, winter, or spring seasons. Kernel density utilization distributions of male and female tufted puffins had a high degree of overlap, with no seasonal or annual patterns of non-overlapping areas (Figure 3). Further, we found no sex differences in mean winter latitude or longitude (Figure 3).
The relatively short-distance migration of this population may reflect physical limitations of the species. In a comparative analysis of avian tracking data, Watanabe (2016) found that for birds using powered flapping flight (69 species), migration distance decreased with increasing body mass and wing loading due to rising flight costs. As the largest among the puffins (genera Fratercula and Cerorhinca) (Gaston and Jones, 1998), tufted puffins use powered flapping flight and their high body mass and wing loading (Johnsgard, 1987; Spear and Ainley, 1997) may reduce their capacity to disperse greater distances. In contrast, congeneric Atlantic puffins in Greenland that weighed ~23% (males) and ~39% (females) less at first capture than the tufted puffins included in our study traveled ~1400 – 3700 km from the breeding colony during throughout the winter (Burnham et al., 2021).
Additionally, the GOA and Northeast Pacific Ocean near Middleton Island may sustain rich winter foraging conditions compared to pelagic waters farther away, thereby reducing the need for our study population of puffins to undertake longer migrations after breeding. For example, Atlantic puffins from larger and less productive colonies and/or in areas with poorer local winter conditions migrated further and wintered in less productive waters compared to Atlantic puffins breeding at smaller colonies and in areas with more productive winter habitat (Fayet et al., 2017a). Unfortunately, there is very little data regarding seabird prey abundance and availability during winter in the GOA and the Northeast Pacific Ocean. However, the GOA is considered one of the world’s most productive oceans sustaining large populations of seabirds, marine mammals, and fishes, including economically important groundfish and salmon populations (Mundy and Cooney, 2005). The central basin of the GOA is characterized by dispersed volcanic seamounts (Maloney, 2004), which are areas noted for high productivity and biomass (Pitcher et al., 2007) and provide important habitat for demersal fish and mid-water cephalopods (Clarke, 2007). Based on data from historical surveys, seamounts may provide reliable foraging habitat for tufted puffins targeting squid, euphausiids, and pelagic fish (Hughes, 1981), which have been identified as primarily components of their diet (Hatch and Sanger, 1992; Piatt and Kitaysky, 2002). It would be fruitful for future studies to compare the non-breeding movements and distribution of tufted puffins with their sympatric congener the horned puffin (F. corniculate) to compare migratory strategies related to their differing morphologies and dietary niches. Past research on the Aethia auklets of the western Aleutian Islands demonstrated that the closely related whiskered (A. pygmaea), parakeet (A. psittacula), and crested (A. cristatella) auklets comprise a migratory continuum from resident to long distance migrants, respectively, driven by each species specific nutritional requirements (Schacter, 2017; Schacter and Jones, 2018).
During winter 2018/2019, we documented evidence of nearshore use by the majority of tagged male and female tufted puffins during the early winter season in both the western GOA’s Lower Cook Inlet/Kodiak Island area and later that same winter in southeastern Alaska’s southern Baranof Island and Kuiu Island within the Alexander Archipelago. This overlap of the sexes in nearshore areas where puffins are not normally observed during the non-breeding season is corroborated by nearshore puffin densities recorded on NPPSD transects in southeastern Alaska. The nearshore distribution shifts may have been in response to local environmental conditions. Oceanographically, these two areas are very different, with the continental shelf relatively wide (>100 km) at Lower Cook Inlet/Kodiak Island and relatively narrow (<30 km) at the southern Baranof Island/Kuiu Island area. However, both areas support large tufted puffin breeding colonies, including >133,000 puffins around the Barren Islands in Lower Cook Inlet and 11,000 puffins at St. Lazaria Island just west of Sitka (North Pacific Seabird Data Portal3). We speculate the presence of forage fish may have been driving winter use of these two areas. In a review of fishes in the GOA, it was noted that juvenile fishes are typically found close to shore during winter in both Lower Cook Inlet and southeastern Alaska (Mundy and Hollowed, 2005). In Lower Cook Inlet, Pacific sand lance (Ammodytes personatus), Pacific herring (Clupea pallasii), walleye pollock (Gadus chalcogrammus), and Pacific capelin (Mallotus catervarius) are abundant forage fish species (Abookire and Piatt, 2005; Speckman et al., 2005), while at Baranof Island the underwater Edgecumbe Pinnacles Marine Reserve just outside of Sitka Sound supports a high density and diversity of juvenile rockfish (Sebastes spp.) and lingcod (Ophiodon elongatus) (Starr et al., 2004) and Sitka Sound supports a robust Pacific herring fishery (Dupuis et al., 2022). Although tufted puffins are thought to forage primarily on squid and euphausiids throughout the year, forage fish such as capelin, sandlance, and juvenile pollock and rockfish, have also been documented as important prey items during the non-breeding season (Piatt and Kitaysky, 2002).
Interannual differences in migration phenology and distance
Similar to other colonies along the coast of the Northeast Pacific Ocean (Piatt and Kitaysky, 2002; Jones et al., 2019), tufted puffins departed from the breeding area at Middleton Island in early September. In 2018, both males and females traveled approximately the same distance from the breeding to wintering area during the fall season. However, in fall 2019, females traveled more than twice the distance traveled by males. Further, despite departing the breeding area at the same time, females arrived at the wintering area on average 22 days after males in 2019, although the effect of sex was not significant due to high variation in arrival date to the wintering area (Table 4). As a result of the protracted fall period, the 95% UD for females was ~10% larger than males and the cumulative distance traveled was more than twice the distance of males during fall 2019. We originally hypothesized that tufted puffins in better body condition would travel greater distances. However, our analysis did not support an effect of female body condition (i.e., model 9 in our candidate mode set, Supplementary Table 1, Tables 3, 4) on migratory phenology or distance metrics. We speculate there may be sex-specific dietary preferences between males and females following the breeding season that drive differences in habitat selection between the sexes.
The annual differences between the 2018 and 2019 fall migration may have been related to the onset of a marine heatwave in June 2019 that resulted in above average SST accompanied by high surface air temperature anomalies over Alaska (Amaya et al., 2020). This Northeast Pacific marine heatwave lasted into January 2020 across much of the GOA waters used by tufted puffins during the non-breeding season. However, in the waters just south of the non-breeding area (40-50° N), the marine heatwave persisted much longer, and included peaks in SST anomalies during April, July, and November 2020 (Chen et al., 2021). Warming ocean conditions in the GOA can be a source of large-scale, major ecosystem perturbations to the marine food web. In particular, the massive 2013-2016 marine heatwave (i.e., The Blob, Di Lorenzo and Mantua, 2016) was shown to reduce the availability of cold-water associated euphausiids (Order: Euphausiacea), as well as the availability and quality of Pacific capelin, sand lance, and herring (Arimitsu et al., 2021; Suryan et al., 2021), all key forage species for tufted puffins (Hatch and Sanger, 1992; Piatt et al., 1997; Piatt and Kitaysky, 2002).
Fall migration for tufted puffins is expected to be more flexible and less constrained by weather conditions and food resources than spring migration, when puffins must arrive in good condition and within a timeframe that allows for successful reproduction. Reduced availability of forage fish and euphausiids during fall 2019 may have caused puffins to use a different migratory strategy that, in turn, prolonged migration time to the wintering grounds. Support for this idea originates from the Middleton Island breeding grounds as the occurrence of Pacific herring and more coastal species of forage fish in seabird diets during the summer of 2019 indicated that the availability of offshore prey such as capelin was reduced (Hatch et al., 2019).
Geolocator recovery rates
This study is among the more successful geolocator studies for a Pacific alcid to date based on our GLS tag recovery rate (70% overall). Other GLS studies of Pacific alcids report tag recovery rates ranging from 33-93%. For Aethia auklets of the western Aleutian Islands (Buldir and Gareloi Islands), Schacter (2017) reported GLS tag recovery rates of 35% for whiskered auklets (see also Schacter and Jones, 2018), 52% for crested auklets, and 72% for parakeet auklets. Two GLS studies of Cassin’s auklets (Ptychoramphus aleuticus) reported variable tag return rates from 33% for birds tagged in British Columbia, Canada (Studholme et al., 2019) to 72% for birds tagged in California (Johns et al., 2020). A GLS tagging study of rhinocerous auklets (Cerorhinca monocerata, grouped within the puffins following Smith and Clarke, 2015) reported an overall recovery rate of 40.5% (range: 0-80%) among birds tagged across 13 eastern Pacific Ocean breeding colonies − only two locations had GLS tag return rates >70%. For larger bodied thick-billed murres (Uria lomvia) of the Pribilof Islands, Alaska, a GLS study reported return rates >90% (Orben et al., 2015). For the congeneric Atlantic puffin, GLS studies have reported similarly high recapture rates ranging from 70-100% (Fayet et al., 2016; Fayet et al., 2017a; Fayet et al., 2017b; Burnham et al., 2021). The high breeding site fidelity of our tufted puffin study population along with their larger body size, relatively small weight of the GLS tags, and environmental conditions favorable for survival and breeding are all key factors that contributed to the high GLS tag return rates during this study.
Conservation implications
Tufted puffins spend ~75% of the year away from their breeding colonies, highlighting the importance of understanding the ecology of the non-breeding phase of the annual cycle for the species. Our study provides an important first step in uncovering the non-breeding phenology and distribution for tufted puffins nesting in the GOA. Puffins were overwhelmingly pelagic and occupied a broad swath of the GOA and Northeast Pacific Ocean. The at-sea, non-breeding distribution of our study population of tufted puffins at Middleton Island spanned geopolitical boundaries between the U.S. and Canada (within 200 nm exclusive economic zone, Figure 1), as well as regions of the high seas that are considered global commons (Harrison et al., 2018), complicating conservation and management of the species.
Given the projected declines for northern GOA populations of tufted puffins (Goyert et al., 2017), we recommend further investigations identify similar temporal and spatial patterns in the non-breeding distributions of the other major nesting colonies in the region, as well as for the closely related horned puffin. The coarse resolution of geolocator data relative to the short distances traveled by this population importantly limited our power to detect relationships between migratory patterns and potential drivers (i.e., sex, body condition, year). Further understanding the ecological drivers of migratory strategies and winter distributions of tufted puffins throughout the GOA could have large conservation implications in the face of changing ocean-climate conditions. For example, the two recent marine heatwaves described above upset trophic dynamics throughout the food web (Arimitsu et al., 2021; Suryan et al., 2021), resulting in a massive seabird mortality event and breeding colony failures for common murres (Uria aalge, Piatt et al., 2020) and unusual mortalities of marine mammals (e.g., Christiansen et al., 2021). Marine heatwaves are predicted to increase in frequency, intensity, and duration in the future (Frölicher et al., 2018; Barkhordarian et al., 2022). Further, a long-term Pacific warming pool was recently identified at the southern extent of the non-breeding distribution for our study population (Barkhordarian et al., 2022). The warming pool is marked by a pronounced increase in annual mean sea surface temperature, a reduction in winter cooling, and winters that are warmer and shorter. The persistence of the warming pool and the potential development of a positive feedback loop could have profound ecological impacts on the region (e.g., Arimitsu et al., 2021), particularly for species with limited dispersal capacity such as tufted puffins based on our results. Tufted puffin bycatch is also a conservation concern, despite the decline in high-seas drift net fisheries (Piatt and Kitaysky, 2002). Our findings suggest that seamounts may provide important wintering habitat for tufted puffins. While bottom-contact fishing is currently prohibited on the GOA’s 15 seamounts in federal waters (North Pacific Fisheries Management Council4), there are no prohibitions on fishing in the mid-and near-surface waters where puffins are likely to forage.
Data availability statement
The datasets presented in this study can be found in online repositories. The names of the repository/repositories and accession number(s) can be found below: Unprocessed geolocator data and complete field data have been archived on the Alaska Ocean Observing System Ocean Data Explorer (https://portal.aoos.org/). Additionally, the geolocator and field data, and R code used by this study are publicly available on GitHub: https://github.com/gormankb/Schaefer-et-al.-Frontiers-in-Marine-Science. Individuals interested in using these data are expected to follow standard, collegial guidelines such as those outlined by the US LTER Network’s Data Access Policy, Requirements, and Use Agreement: http://www.lternet.edu/policies/data-access. In particular, we highlight the following from the US LTER Network data policy: The consumer of these data (“Data User” herein) has an ethical obligation to cite it appropriately in any publication that results from its use. The Data User should realize that these data may be actively used by others for ongoing research and that coordination may be necessary to prevent duplicate publication. The Data User is urged to contact the authors of these data if any questions about methodology or results occur. Where appropriate, the Data User is encouraged to consider collaboration or coauthorship with the authors. The Data User should realize that misinterpretation of data may occur if used out of context of the original study.
Ethics statement
Animal handling procedures were approved by Prince William Sound Science Center’s Institutional Animal Care and Use Committee (IACUC Protocol: PWSSC2018-03) and University of Alaska Fairbanks IACUC (Protocol acknowledgement: 1437412). Activities were conducted following Scientific Permits from Alaska Department of Fish and Game (permits: 18-178, 19-102, 20-100, and 21-053 to KBG) and the US Geological Survey Bird Banding Lab (permit: 23432 to MAB).
Author contributions
KBG, ALS, and MAB conceived, designed, obtained funding for the study, and managed logistics. KBG managed grant and permit reporting. ALS and KBG conducted field work and analysed the data. All authors contributed to the writing of the manuscript and gave final approval for manuscript submission. All authors accept responsibility for the manuscript content, which has not been published and is not under review for publication elsewhere.
Funding
Funding for this project was provided by the North Pacific Research Board (Project No. 1812).
Acknowledgments
We are grateful to the Institute for Seabird Research and Conservation (ISRC: https://middletonisland.org/) for guidance and assistance with fieldwork at Middleton Island, Alaska. We especially thank the following individuals with ISRC: Scott Hatch, Martha Hatch, Kyle Elliott, Akiko Shoji, Shannon Whelan, Jenna Schlener, Fred Tremblay, Abraham Turner, Sierra Pete, Jessica Morales Valenzuela, and Aidan Colligan. Ann Harding (Auk Ecological Consulting) provided important guidance on Tufted Puffin field capture methods. Rachael Orben (Oregon State University) provided critical guidance on GLS attachment methods. James Fox (Migrate Technology) provided invaluable advice regarding GLS operations and assistance with GLS tag data downloads. Alexis Will (University of Alaska Fairbanks) and Benjamin Merkel (Akvaplan-niva AS, Tromsø, Norway) provided guidance with GLS data processing and Sara Williams (Panthera) provided analytical advice. We thank Editor Rob Harcourt and two anonymous reviewers for useful comments that improved the manuscript. Dena’ina Air Taxi provided logistical support. Prince William Sound Science Center and the College of Fisheries and Ocean Sciences, University of Alaska Fairbanks both provided administrative support.
Conflict of interest
The authors declare that the research was conducted in the absence of any commercial or financial relationships that could be construed as a potential conflict of interest.
Publisher’s note
All claims expressed in this article are solely those of the authors and do not necessarily represent those of their affiliated organizations, or those of the publisher, the editors and the reviewers. Any product that may be evaluated in this article, or claim that may be made by its manufacturer, is not guaranteed or endorsed by the publisher.
Supplementary material
The Supplementary Material for this article can be found online at: https://www.frontiersin.org/articles/10.3389/fmars.2022.999461/full#supplementary-material
Footnotes
- ^ www.ncei.noaa.gov/products/optimum-interpolation-sst
- ^ https://www.usgs.gov/centers/alaska-science-center/science/north-pacific-pelagic-seabird-database
- ^ https://www.axiom.seabirds.net
- ^ https://www.npfmc.org/habitat-protections/
References
Abookire A. A., Piatt J. F. (2005). Oceanographic conditions structure forage fishes into lipid-rich and lipid-poor communities in lower Cook Inlet, Alaska, USA. Mar. Ecol. Prog. Ser. 287, 229–240. doi: 10.3354/meps287229
Ainley D. G., Sydeman W. J., Hatch S. A., Wilson U. W. (1994). Seabird population trends along the west coast of North America: causes and the extent of regional concordance. Stud. Avian Biol. 15, 119–133.
Amaya D. J., Miller A. J., Xie S.-P., Kosaka Y. (2020). Physical drivers of the summer 2019 North Pacific marine heatwave. Nat. Commun. 11 (1), 1903. doi: 10.1038/s41467-020-15820-w
Arimitsu M. L., Piatt J. F., Hatch S., Suryan R. M., Batten S., Bishop M. A., et al. (2021). Heatwave-induced synchrony within forage fish portfolio disrupts energy flow to top pelagic predators. Glob. Change Biol. 27 (9), 1859–1878. doi: 10.1111/gcb.15556
Ashmole N. P. (1963). The regulation of numbers of tropical oceanic birds. Ibis 103b (3), 458–473. doi: 10.1111/j.1474-919X.1963.tb06766.x
Barkhordarian A., Nielsen D. M., Baehr J. (2022). Recent marine heatwaves in the North Pacific warming pool can be attributed to rising atmospheric levels of greenhouse gases. Commun. Earth Environ. 3 (1), 131. doi: 10.1038/s43247-022-00461-2
Barron D. G., Brawn J. D., Weatherhead P. J. (2010). Meta-analysis of transmitter effects on avian behaviour and ecology. Methods in Ecology and Evolution 1, 180–187. doi: 10.1111/j.2041-210X.2010.00013.x
Barton K. (2020) MuMIn: Multimodel inference. R package version 1.43.17. Available at: https://CRAN.R-project.org/package=MuMIn.
Burnham K. P., Anderson D. R. (2002). Model selection and multimodel inference: A practical information theoretic approach (New York, NY: Springer-Verlag).
Burnham K. K., Burnham J. L., Johnson J. A., Huffman A. (2021). Migratory movements of Atlantic puffins Fratercula arctica naumanni from high Arctic Greenland. PloS One 16 (5), e0252055. doi: 10.1371/journal.pone.0252055
Calenge C. (2006). The package “adehabitat” for the R software: A tool for the analysis of space and habitat use by animals. Ecol. Modell. 197 (3), 516–519. doi: 10.1016/j.ecolmodel.2006.03.017
Chen Z., Shi J., Liu Q., Chen H., Li C. (2021). A persistent and intense marine heatwave in the Northeast Pacific during 2019–2020. Geophys. Res. Lett. 48 (13), e2021GL093239. doi: 10.1029/2021GL093239
Christiansen F., Rodríguez-González F., Martínez-Aguilar S., Urbán J., Swartz S., Warick H., et al. (2021). Poor body condition associated with an unusual mortality event in gray whales. Mar. Ecol. Prog. Ser. 658, 237–252. doi: 10.3354/meps13585
Clarke M. (2007). "Seamounts and cephalopods", in Seamounts: ecology, fisheries and conservation. Eds. Pitcher T. J., Morato T., Hart P. J., Clark M. R., Haggan N., Santos R. S. (Hoboken, New Jersey: Wiley - Blackwell), 207–229.
Dias M. P., Martin R., Pearmain E. J., Burfield I. J., Small C., Phillips R. A., et al. (2019). Threats to seabirds: A global assessment. Biol. Conserv. 237, 525–537. doi: 10.1016/j.biocon.2019.06.033
Di Lorenzo E., Mantua N. (2016). Multi-year persistence of the 2014/15 North Pacific Marine Heatwave. Nat. Clim. Change 6 (11), 1042–1047. doi: 10.1038/nclimate3082
Drew G. S., Piatt J. F. (2020). North pacific pelagic seabird database (NPPSD). NPPSD version 3.0. Anchorage, Alaska: U.S. Geol. Surv. doi: 10.5066/F7WQ01T3. Available at: https://www.usgs.gov/centers/alaska-science-center/science/north-pacific-pelagic-seabird-database.
Dupuis A., Harris D., Meredith B., Salomone P. (2022). “2022 southeast Alaska herring sac roe fishery management plan,” in Regional information report no. 1J22-05 (Douglas, Alaska: Alaska Department of Fish and Game, Division of Commercial Fisheries).
Fayet A. L., Freeman R., Anker-Nilssen T., Diamond A., Erikstad K. E., Fifield D., et al. (2017a). Ocean-wide drivers of migration strategies and their influence on population breeding performance in a declining seabird. Curr. Biol. 27 (24), 3871–3878.e3873. doi: 10.1016/j.cub.2017.11.009
Fayet A. L., Freeman R., Shoji A., Boyle D., Kirk H. L., Dean B. J., et al. (2016). Drivers and fitness consequences of dispersive migration in a pelagic seabird. Behav. Ecol. 27 (4), 1061–1072. doi: 10.1093/beheco/arw013
Fayet A. L., Shoji A., Freeman R., Perrins C. M., Guilford T. (2017b). Within-pair similarity in migration route and female winter foraging effort predict pair breeding performance in a monogamous seabird. Mar. Ecol. Prog. Ser. 569, 243–252. doi: 10.3354/meps12083
Frölicher T. L., Fischer E. M., Gruber N. (2018). Marine heatwaves under global warming. Nature 560 (7718), 360–364. doi: 10.1038/s41586-018-0383-9
Gaston A. J., Jones I. L. (1998). Bird families of the world: The auks (Alcidae) (Oxford: Oxford University Press).
Gjerdrum C., Vallée A. M. J., St. Clair C. C., Bertram D. F., Ryder J. L., Blackburn G. S. (2003). Tufted puffin reproduction reveals ocean climate variability. Proc. Natl. Acad. Sci. U.S.A. 100 (16), 9377–9382. doi: 10.1073/pnas.1133383100
Gorman K. B., Ruck K. E., Williams T. D., Fraser W. R. (2021). Advancing the sea ice hypothesis: Trophic interactions among breeding Pygoscelis penguins with divergent population trends throughout the Western Antarctic peninsula. Front. Mar. Sci. 8. doi: 10.3389/fmars.2021.526092
Goyert H. F., Garton E. O., Drummond B. A., Renner H. M. (2017). Density dependence and changes in the carrying capacity of Alaskan seabird populations. Biol. Conserv. 209, 178–187. doi: 10.1016/j.biocon.2017.02.011
Harrison A.-L., Costa D. P., Winship A. J., Benson S. R., Bograd S. J., Antolos M., et al. (2018). The political biogeography of migratory marine predators. Nat. Ecol. Evol. 2 (10), 1571–1578. doi: 10.1038/s41559-018-0646-8
Hatch S. A., Arimitsu M., Piatt J. F. (2019). “Seabird-derived forage fish indicators from Middleton island,” in Ecosystem Status Report 2019 Gulf of Alaska. Eds. Zador S., Yasumiishi E., Whitehouse G. A. (605 W 4th Ave, Suite 306, Anchorage, AK 99501: North Pacific Fishery Management Council), Pages 105–108.
Hatch S. A., Sanger G. A. (1992). Puffins as samplers of juvenile pollock and other forage fish in the Gulf of Alaska. Mar. Ecol. Prog. Ser. 80 (1), 1–14. doi: 10.3354/meps080001
Hijmans R. J. (2021) Geosphere: Spherical trigonometry. R package version 1.5-14. Available at: https://CRAN.R-project.org/package=geospphere.
Hobson K. A., Kardynal K. J., Van Wilgenburg S. L., Albrecht G., Salvadori A., Cadman M. D., et al. (2015). A continent-wide migratory divide in north American breeding barn swallows (Hirundo rustica). PloS One 10 (6), e0129340. doi: 10.1371/journal.pone.0129340
Hughes S. E. (1981). Initial U.S. exploration of nine Gulf of Alaska seamounts and their associated fish and shellfish resources. Mar. Fish. Rev. 43 (1), 26–33.
Institute for Seabird Research and Conservation (2021). Middleton Island seabird research and monitoring: 2021 field report. (Anchorage, AK) 39.
Johnsgard P. A. (1987). Comparitive distributions and strucutural adapatations (Lincoln, Nebraska: University of Nebraska Press).
Johns M. E., Warzybok P., Jahncke J., Lindberg M., Breed G. A. (2020). Oceanographic drivers of winter habitat use in cassin’s auklets. Ecol. Appl. 30 (3), e02068. doi: 10.1002/eap.2068
Jones T., Divine L. M., Renner H., Knowles S., Lefebvre K. A., Burgess H. K., et al. (2019). Unusual mortality of tufted puffins (Fratercula cirrhata) in the eastern Bering Sea. PloS One 14 (5), e0216532. doi: 10.1371/journal.pone.0216532
Jones T., Parrish J. K., Peterson W. T., Bjorkstedt E. P., Bond N. A., Ballance L. T., et al. (2018). Massive mortality of a planktivorous seabird in response to a marine heatwave. Geophys. Res. Lett. 45 (7), 3193–3202. doi: 10.1002/2017GL076164
La Cock G. D. (1986). The Southern Oscillation, environmental anomalies, and mortality of two southern African seabirds. Clim. Change 8 (2), 173–184. doi: 10.1007/BF00139753
Lisovski S., Bauer S., Briedis M., Davidson S. C., Dhanjal-Adams K. L., Hallworth M. T., et al. (2020). Light-level geolocator analyses: A user's guide. J. Anim. Ecol. 89 (1), 221–236. doi: 10.1111/1365-2656.13036
Lisovski S., Hahn S. (2012). GeoLight – processing and analysing light-based geolocator data in R. Methods Ecol. Evol. 3 (6), 1055–1059. doi: 10.1111/j.2041-210X.2012.00248.x
Lisovski S., Sumner M. D., Wotherspoon S. J. (2015) TwGeos: Basic data processing for light-based geolocation archival tags. github repository. Available at: https://github.com/slisovski/TwGeos.
Maloney N. E. (2004). Sablefish, Anoplopoma fimbria, populations on Gulf of Alaska seamounts. Mar. Fish. Rev. 66 (3), 1–12.
Merkel B., Phillips R. A., Descamps S., Yoccoz N. G., Moe B., Strøm H. (2016). A probabilistic algorithm to process geolocation data. Mov. Ecol. 4 (1), 26. doi: 10.1186/s40462-016-0091-8
Montevecchi W. A., Myers R. A. (1997). Centurial and decadal oceanographic influences on changes in northern gannet populations and diets in the north-west Atlantic: implications for climate change. ICES J. Mar. Sci. 54 (4), 608–614. doi: 10.1006/jmsc.1997.0265
Morrison K. W., Hipfner J. M., Blackburn G. S., Green D. J. (2011). Effects of extreme climate events on adult survival of three Pacific auks. Auk 128, 707–715. doi: 10.1525/auk.2011.10198
Morris W. F., Pfister C. A., Tuljapurkar S., Haridas C. V., Boggs C. L., Boyce M. S., et al. (2008). Longegevity can buffer plant and animal populations against changing climatic variability. Ecology 89 (1), 19–25. doi: 10.1890/07-0774.1
Mundy P. R., Cooney R. T. (2005). "Physical and biological background," in The Gulf of Alaska: biology and oceanography. Ed. Mundy P. R. (Alaska: University of Alaska Fairbanks, Alaska Sea Grant), 15–23.
Mundy P. R., Hollowed A. (2005). "Fish and shellfish," in The Gulf of Alaska: biology and oceanography. Ed. Mundy P. R. (Alaska: University of Alaska Fairbanks, Alaska Sea Grant), 81–97.
Orben R. A., Paredes R., Roby D. D., Irons D. B., Shaffer S. A. (2015). Body size affects individual winter foraging strategies of thick-billed murres in the Bering Sea. J. Anim. Ecol. 84 (6), 1589–1599. doi: 10.1111/1365-2656.12410
Oro D. (2014). Seabirds and climate: knowledge, pitfalls, and opportunities. Front. Ecol. Evol. 2. doi: 10.3389/fevo.2014.00079
Phillips R. A., Silk J. R. D., Croxall J. P., Afanasyev V., Briggs D. R. (2004). Accuracy of geolocation estimates for flying seabirds. Mar. Ecol. Prog. Ser. 266, 265–272. doi: 10.3354/meps266265
Piatt J. F., Kitaysky A. S. (2002). “Tufted puffin (Fratercula cirrhata),” in The Birds of North America. Eds. Poole A., Gill F. (Philadelphia, Pennsylvania: The Birds of North America Inc.).
Piatt J. F., Parrish J. K., Renner H. M., Schoen S. K., Jones T. T., Arimitsu M. L., et al. (2020). Extreme mortality and reproductive failure of common murres resulting from the Northeast Pacific Marine Heatwave of 2014-2016. PloS One 15 (1), e0226087. doi: 10.1371/journal.pone.0226087
Piatt J. F., Roby D. D., Henkel L., Neuman K. (1997). Habitat use, diet and breeding biology of tufted puffins in Prince William Sound, Alaska. Northwest. Nat. 78 (3), 102–109. doi: 10.2307/3536864
Pitcher T. J., Morato T., Hart P. J., Clark M. R., Haggan N., Santos R. S. (Eds.) (2007). Seamounts: ecology, fisheries and conservation (Hoboken, New Jersey: Wiley - Blackwell).
R Core Team (2022). R: A language and environment for statistical computing (Vienna, Austria: R Foundation for Statistical Computing). Available at: https://www.R-project.org/.
Ricklefs R. E. (1990). Seabird life histories and the marine environment: Some speculations. Col. Waterbirds 13 (1), 1–6. doi: 10.2307/1521414
Rodway M. S., Montevecchi W. A., Chardine J. (1996). Effects of investigator disturbance on breeding success of Atlantic puffins Fratercula arctica. Biol. Conserv. 76, 311–319. doi: 10.1016/0006-3207(94)00118-9
Sæther B.-E., Coulson T., Grøtan V., Engen S., Altwegg R., Armitage K. B., et al. (2013). How life history influences population dynamics in fluctuating environments. Am. Nat. 182 (6), 743–759. doi: 10.1086/673497
Schacter C. (2017). Migration dynamics: Testing ecological theory with tracking data for Aethia auklets in the North Pacific (Memorial University of Newfoundland, St. John’s Newfoundland & Labrador, Canada).
Schacter C. R., Jones I. L. (2018). Confirmed year-round residence and land roosting of whiskered auklets (Aethia pygmaea) at Buldir Island, Alaska. Auk 135 (3), 706–715. doi: 10.1642/auk-17-235.1
Schreiber E. A., Burger J. (2001). “Seabirds in the marine environment” in Biology of marine birds. Ed. Burger E.A.S.A.J. (Boca Raton, Florida: CRC Press), 1–15.
Shepard E. L. C., Wilson R. P., Rees W. G., Grundy E., Lambertucci S. A., Vosper S. B. (2013). Energy landscapes shape animal movement ecology. Am. Nat. 182 (3), 298–312. doi: 10.1086/671257
Smith N. A., Clarke J. A. (2015). Systematics and evolution of the pan-alcidae (Aves, charadriiformes). J. Avian Biol. 46 (2), 125–140. doi: 10.1111/jav.00487
Spear L. B., Ainley D. G. (1997). Flight behaviour of seabirds in relation to wind direction and wing morphology. Ibis 139 (2), 221–233. doi: 10.1111/j.1474-919X.1997.tb04620.x
Speckman S. G., Piatt J. F., Minte-Vera C. V., Parrish J. K. (2005). Parallel structure among environmental gradients and three trophic levels in a subarctic estuary. Prog. Oceanogr. 66 (1), 25–65. doi: 10.1016/j.pocean.2005.04.001
Stabeno P. J., Bond N. A., Hermann A. J., Kachel N. B., Mordy C. W., Overland J. E. (2004). Meteorology and oceanography of the northern Gulf of Alaska. Cont. Shelf Res. 24 (7), 859–897. doi: 10.1016/j.csr.2004.02.007
Starr R. M., O'Connell V., Ralston S. (2004). Movements of lingcod (Ophiodon elongatus) in southeast Alaska: potential for increased conservation and yield from marine reserves. Can. J. Fish. Aquat. Sci. 61 (7), 1083–1094. doi: 10.1139/f04-054
Studholme K. R., Hipfner J. M., Domalik A. D., Iverson S. J., Crossin G. T. (2019). Year-round tracking reveals multiple migratory tactics in a sentinel North Pacific seabird, cassin’s auklet. Mar. Ecol. Prog. Ser. 619, 169–185. doi: 10.3354/meps12965
Suryan R. M., Arimitsu M. L., Coletti H. A., Hopcroft R. R., Lindeberg M. R., Barbeaux S. J., et al. (2021). Ecosystem response persists after a prolonged marine heatwave. Sci. Rep. 11 (1), 6235. doi: 10.1038/s41598-021-83818-5
Watanabe Y. Y. (2016). Flight mode affects allometry of migration range in birds. Ecol. Lett. 19 (8), 907–914. doi: 10.1111/ele.12627
Keywords: Tufted Puffins, Fratercula cirrhata, geolocator (GLS), migration, movement, non-breeding season, Gulf of Alaska
Citation: Schaefer AL, Gorman KB and Bishop MA (2022) Light-level geolocation reveals the short-distance non-breeding movements and distribution of tufted puffins throughout the Northeast Pacific Ocean. Front. Mar. Sci. 9:999461. doi: 10.3389/fmars.2022.999461
Received: 21 July 2022; Accepted: 19 August 2022;
Published: 06 September 2022.
Edited by:
Rob Harcourt, Macquarie University, AustraliaReviewed by:
Katsufumi Sato, The University of Tokyo, JapanAnna Klenova, Lomonosov Moscow State University, Russia
Copyright © 2022 Schaefer, Gorman and Bishop. This is an open-access article distributed under the terms of the Creative Commons Attribution License (CC BY). The use, distribution or reproduction in other forums is permitted, provided the original author(s) and the copyright owner(s) are credited and that the original publication in this journal is cited, in accordance with accepted academic practice. No use, distribution or reproduction is permitted which does not comply with these terms.
*Correspondence: Kristen B. Gorman, a2Jnb3JtYW5AYWxhc2thLmVkdQ==
†These authors have contributed equally to this work and share first authorship