 Paula Possamai Sergipe
 Vinicius Louro
 Yára Regina Marangoni
 Denise Silva de Moura
 Luigi Jovane
- 1Oceanographic Institute, University of São Paulo, São Paulo, Brazil
- 2Institute of Geosciences, University of São Paulo, São Paulo, Brazil
- 3Institute of Astronomy, Geophysics, and Atmospheric Sciences, University of São Paulo, São Paulo, Brazil
The Rio Grande Rise (RGR) is an extensive structural high located in the South Atlantic Ocean, target of increasing exploratory interest. During the last decades, considerable attention has been given to its genesis, dynamic, regional tectonic, and composition. Some studies indicate the presence of volcanic rocks, mainly basaltic, related to their volcanic origin and Ferromanganese Crusts, boosting the research and economic interest. This study suggests the location of volcanic rocks and FeMn crusts at the north portion of Cruzeiro do Sul Rift within the RGR, characterizing the local geology and distribution pattern. We used multibeam bathymetry, sidescan sonar, dredges, and magnetic field data to integrate and better constrain the results. The magnetic field data highlighted the location of probable basaltic rocks, agreeing with the published literature, which was afterward confirmed by dredge samples. Their magnetic anomalies displayed the predominance of reverse polarization and less frequent normal polarization anomalies. FeMn crusts need a large volume of magnetite to cause anomalies in the local magnetic field, which does not happen in the RGR. There, they have reduced thickness and are frequently eroded, as displayed by the bathymetry, sidescan sonar, and geological data. Magnetic lineaments at the Rift margin defined a zone with a series of normal faults. During the Rift formation, transcurrent movements caused an intense fracturing, providing pathways for magma intrusion. Therefore, the fault zone could be related to the primary magnetic anomalies as a function of the magma intrusion and the occurrence of the rifting process and seafloor spreading. The new data presented in this paper brings valuable data for the comprehension and exploration effort of the RGR.
1 Introduction
The Rio Grande Rise (RGR) still has many parts unexplored and unknown, so as its composition, genesis, and relationship with Walvis Chain. Understanding this context is essential to explain the main tectonic questions about the South Atlantic Ocean (SAO) formation scenario (Dietz and Holden, 1970; Morgan, 1971; Detrick et al., 1977; Gamboa and Rabinowitz, 1984; O’Connor and Duncan, 1990; Galvão and De Castro, 2017; Graça et al., 2018).
Since 2009, Brazilian institutions have promoted many expeditions, including universities and its Geological Service (SGB-CPRM). Extensive areas of ferromanganese (FeMn) crust deposits, still unexplored in the RGR (Benites et al., 2020), increase the research and economic interest in the area. From an exploratory point of view, cobalt-rich occurrences make the FeMn crusts appealing targets for mining endeavors (Hein et al., 2003; Lisniowski et al., 2019).
The FeMn crusts are products of hydrogenating processes in which iron and manganese oxides precipitate on the water column directly on the hard surface of oceanic elevations, as guyots or seamounts (Hein and Koschinsky, 2014). These crusts can provide a considerable variety of elements to the marine environment (Hein et al., 2003). Their structures are highly efficient in controlling redox potential reactions; they indicate the oceanic regional and global historical context and reveal, through its stratigraphic layers, oceanographic and weather conditions of the region (Hein et al., 2003 apud Hein and Koschinsky, 2014).
Lisniowski et al. (2019) used a multi-beam echo sound to identify rocks outcrop and FeMn crusts in the RGR through slope and backscatter intensity parameters. They produced a representative model of the surface substrate types in the RGR (Figure 1). The study area of this report, highlighted in red, displayed the FeMn crusts and rock outcrops corresponding to volcanic rocks.
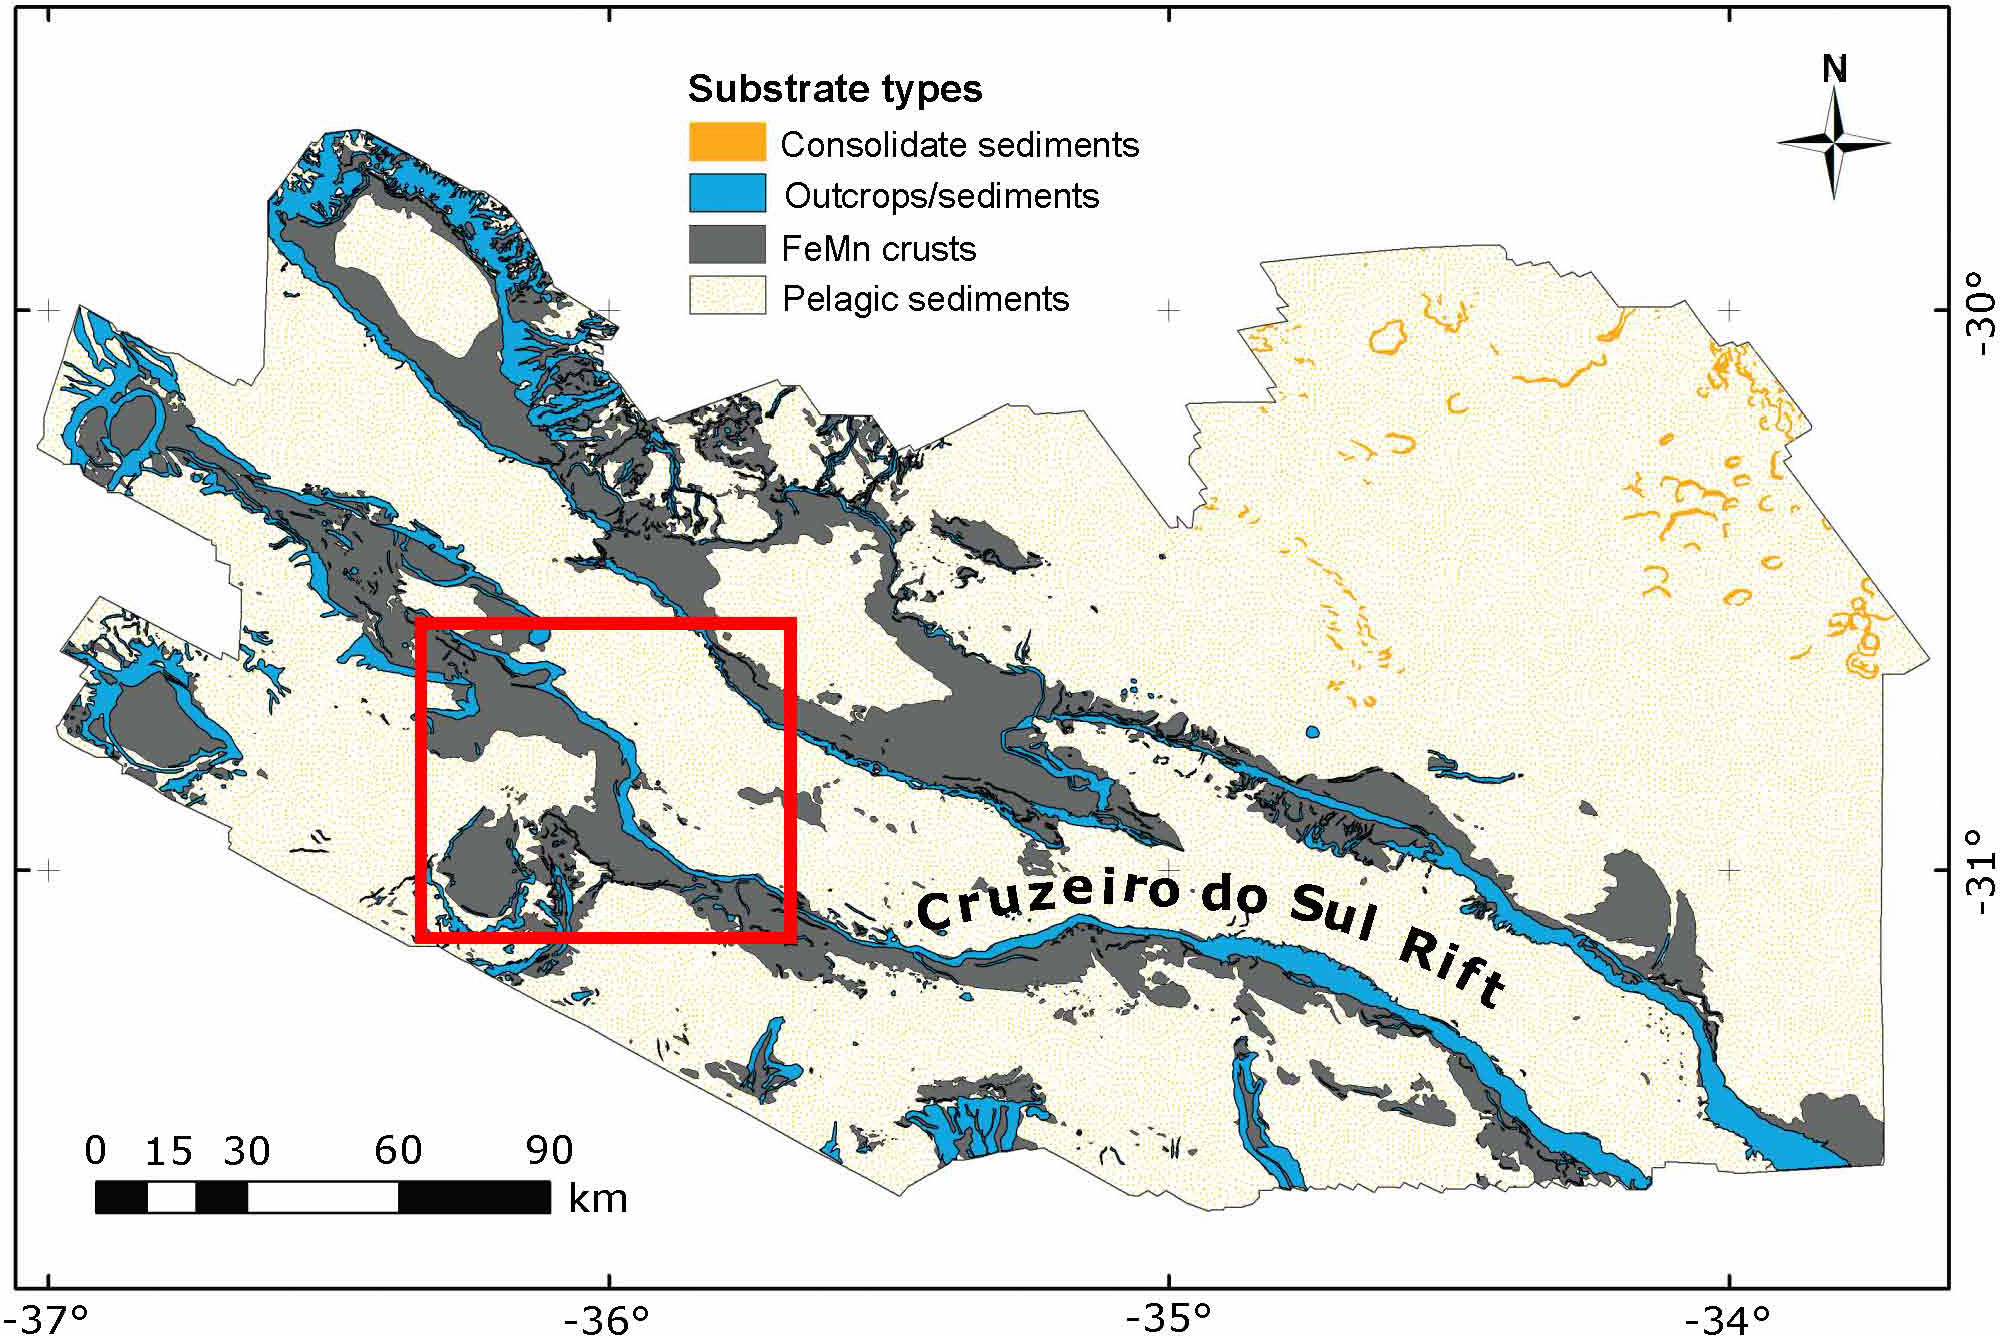
Figure 1 Map of the substrate types presented in the western portion of the RGR. In red is highlighted the study area location (modified by Lisniowski et al., 2019).
Most of the basaltic rocks were in the western portion of the RGR (Jovane et al., 2019). These rocks, when fresh, have a high magnetic susceptibility reaching up to 200x10³ (SI; Telford et al., 1990) and possibly host remanent magnetization, depending on their mineralogy and grain size. The FeMn crusts can also display remanent magnetization, as already found in FeMn nodules in the Clarion-Clipperton Zone (CCZ) in the Eastern Pacific Ocean (Hassan et al., 2020). In general, marine magnetic data can contribute to identifying these materials. However, the crusts in the western RGR are too thin or have eroded until their magnetic signal becomes almost indistinguishable from the background (Praxedes et al., 2019). To overcome this limitation, we integrated the surface geological data, multi-beam echo sound, and backscatter by sidescan sonar. At the same time, the extension of the volcanic rock could be determined using the marine magnetic field and geological data.
Compiling different geophysical (acoustic and potential methods) and geological methods as investigative tools of marine geology is very important to widely understand the RGR, contributing to a whole definition of its structures and geological context. This integration is essential because seismic data has low efficiency in the RGR (Constantino et al., 2017), given the presence of limestone reflector of the Santonian age covering the acoustic basement (Kumar, 1979; Montserrat et al., 2019).
This study determined possible locations with volcanic rocks and FeMn crusts in the northern portion of Cruzeiro do Sul Rift (NCSR) in the western RGR, using (1) bathymetric data, (2) sidescan sonar data, (3) geological data obtained by dredges operations, and (4) marine magnetic field data. Over the integration of these results, we performed a geological characterization of the study area, locating and setting a distribution pattern of targets for further exploration.
2 Geological context
The RGR is one of the main igneous provinces (LIPs) of the SAO, at about 1,500 km from the Brazilian coast, between 28-34°S and 28°-40°W (Gamboa and Rabinowitz, 1984; Galvão and De Castro, 2017). The RGR is an extensive morphological high reaching 3,500 m from the oceanic crust. This high acts as a significant barrier to the transport of sediments through the Vema and Hunter channels between Brazil and Argentina basins (Kaji et al., 2011; Galvão and De Castro, 2017) (Figures 2, 3).
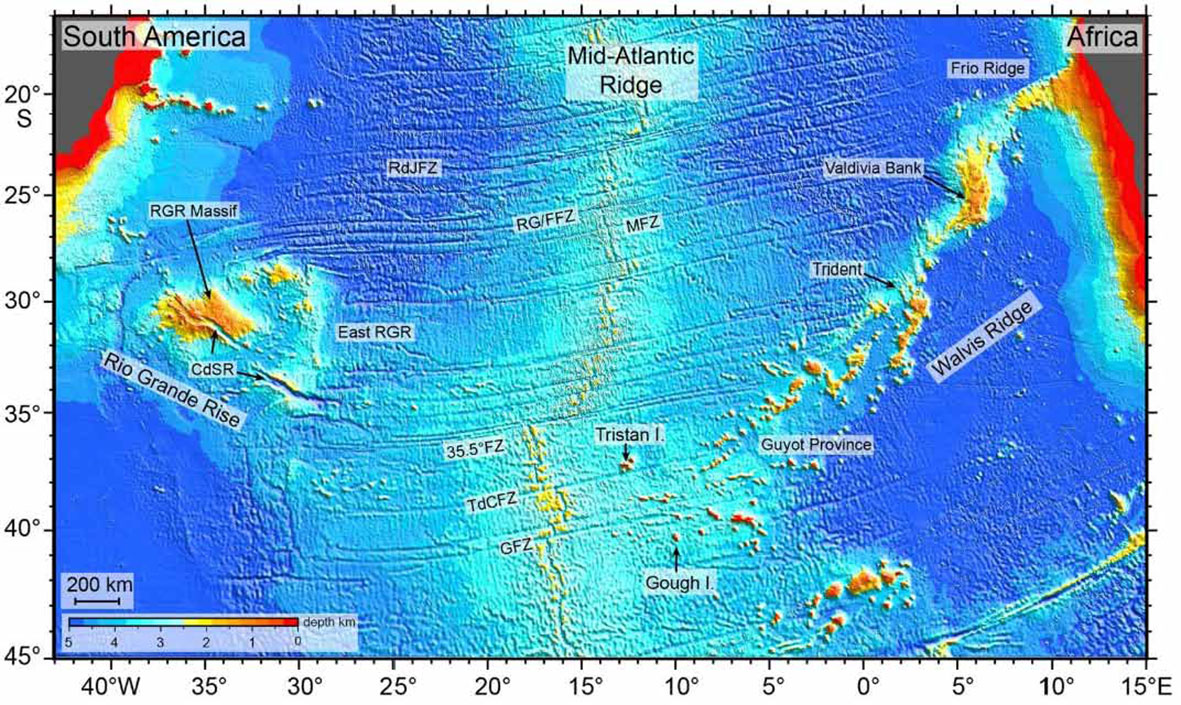
Figure 2 Bathymetric map of SAO, including the RGR, Walvis Ridge, Tristan da Cunha mantellic plume and smaller features. The bathymetry was a product between available depth soundings and high-resolution marine gravity information from the Geosat and ERS-1 spacecraft (Smith and Sandwell, 1997). Extracted from Sager et al., 2021. RdJFZ, Rio de Janeiro Fracture Zone; RG/FFZ, Rio Grande – Florianopolis Fracture Zone; MFZ, Moore Fracture Zone; TdCFZ, Tristan da Cunha Fracture Zone; GFZ, Gough Fracture Zone; CdSR, Cruzeiro do Sul rift.
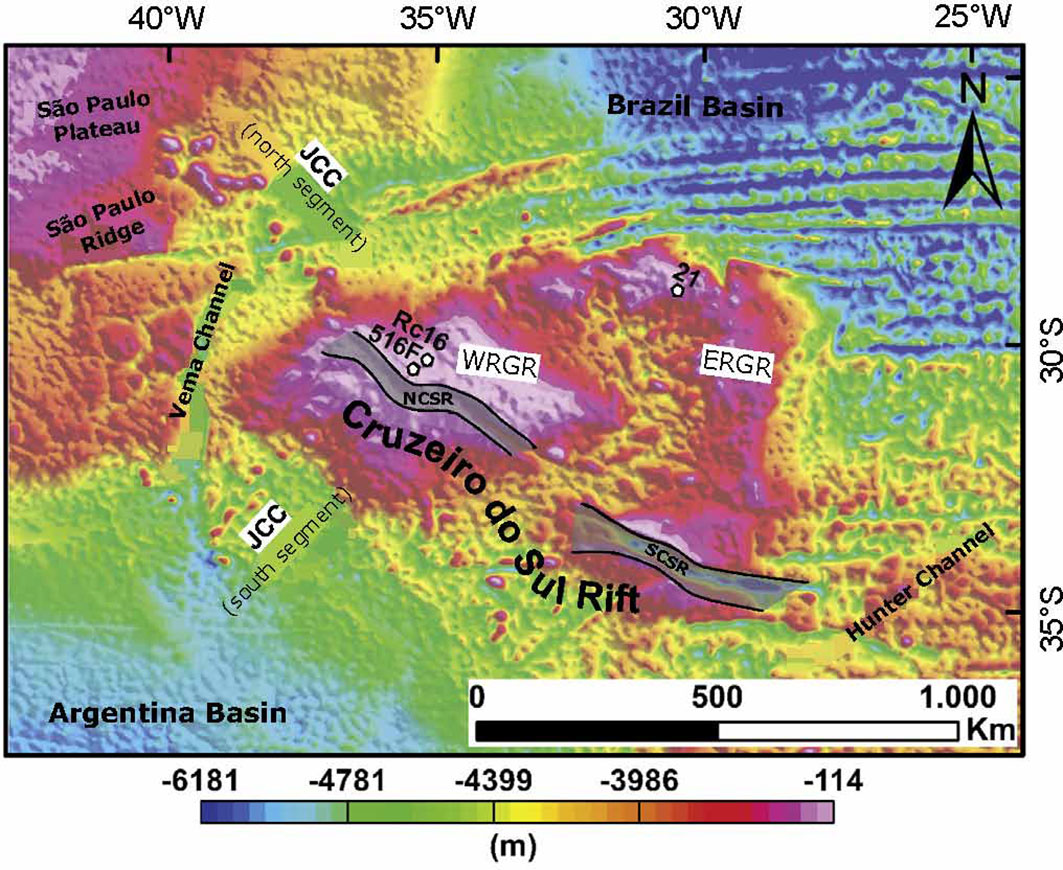
Figure 3 Bathymetric map displaying the Rio Grande Rise and the Cruzeiro do Sul Rift, including the 516F and 21 boreholes and the RC16 Seamount Dredging. WRGR corresponds to the Western Rio Grande Rise, ERGR is the Eastern Rio Grande Rise, JCC is the Jean Charcot Seamounts, NCSR is the northern segment, and SCSR is the southern segment of the Cruzeiro do Sul Rift (extracted from Galvão and De Castro, 2017).
Some authors characterize the RGR as a semicircular aseismic ridge (Gamboa and Rabinowitz, 1984; Galvão and De Castro, 2017), suggesting a different geological history from the adjacent oceanic crust. In this hypothesis, the RGR would correspond to an isolated portion of the continental crust released from its matrix with the predominance of basaltic rocks (Gamboa and Rabinowitz, 1984). Detrick et al. (1977) suggested that RGR was initially on the surface with few parts above sea level, between the Santonian and Campanian stages (72.1 – 86.3 M), to later suffer a subsidence process.
Another hypothesis proposes that RGR and the Walvis Chain formed during the rifting process of the Gondwana Supercontinent, which generated the Atlantic Ocean (Dietz and Holden, 1970; Morgan, 1971). According to O’Connor and Duncan (1990), the volcanic system complex RGR – Walvis Chain was a product of the Tristan da Cunha mantle plume. The RGR would have formed between the Santonian – Coniacian stages, below sea level at the central region of this axis. It moved to the west, accompanying the SAO expansion and the separation of South America and African plates (Figure 2). Later, pelagic sedimentation covered the RGR, as revealed by seismic interpretations (Gamboa and Rabinowitz, 1984).
Gamboa and Rabinowitz (1984) divided the RGR into western (WRGR) and the eastern (ERGR) portions (Figure 3). The WRGR has an elliptical shape and originated from the intense volcanism during Eocene (< 50 M), which elevated the oceanic crust and produced countless oceanic islands. The ERGR shows a north-south-oriented trend, believed as a manifestation of the crest migration of the ridge surrounded by fracture zones. The ERGR crest has an average depth of 2,000 m, and, currently, the presence of guyots and seamounts decreases its depth to less than 700 m below sea level (Gamboa and Rabinowitz, 1984; Ussami et al., 2013). The main rift separated both portions in the NW-SE direction, with widths between 10 and 20 km, 1,500 km in extension, and more than 1,000 m in depth to the top of the elevation, all surrounded by guyots and seamounts (Mohriak et al., 2010; Galvão and De Castro, 2017).
The Cruzeiro do Sul Rift (Figure 3) can be related to magmatic-tectonic events which influenced the development of the RGR (Galvão and De Castro, 2017 apud Galvão and De Castro, 2017). The transforming movements during the rift formation divided it into two regions. The northern segment (NCSR) crosses the northwest portion of RGR, whereas the south segment (SCSR) lies at the south of ERGR (Galvão and De Castro, 2017).
The NCSR comprises volcanic rocks, limestone, and FeMn crusts (Jovane et al., 2019). This report indicates the presence of pebbles of metamorphic rocks, mudstone, siltstone, pyroclastic, and pegmatitic rocks in smaller to almost absent concentrations. The substrate rocks supporting the FeMn crusts display basalt, carbonates, and phosphorates, or ironstone (Benites et al., 2020; Benites et al., 2021; Benites et al., 2022).
Praxedes et al. (2019) characterize the Cruzeiro do Sul Rift as a rotated block set separated by antithetic normal faults which extend until the acoustic basement. These authors affirm that the northeast plateau has a flat relief composed of partially eroded sedimentary sequences. These sequences are products of subaerial erosive processes that occurred 20-40 Ma ago (mid-Eocene to early Oligocene) before to subsidence process. Seismic data supports such interpretation (Figures 4A, B) and correlates positively with the Deep-Sea Drilling Project boreholes 516F (30°16.59’S, 35°17.10’O; Figure 4C).
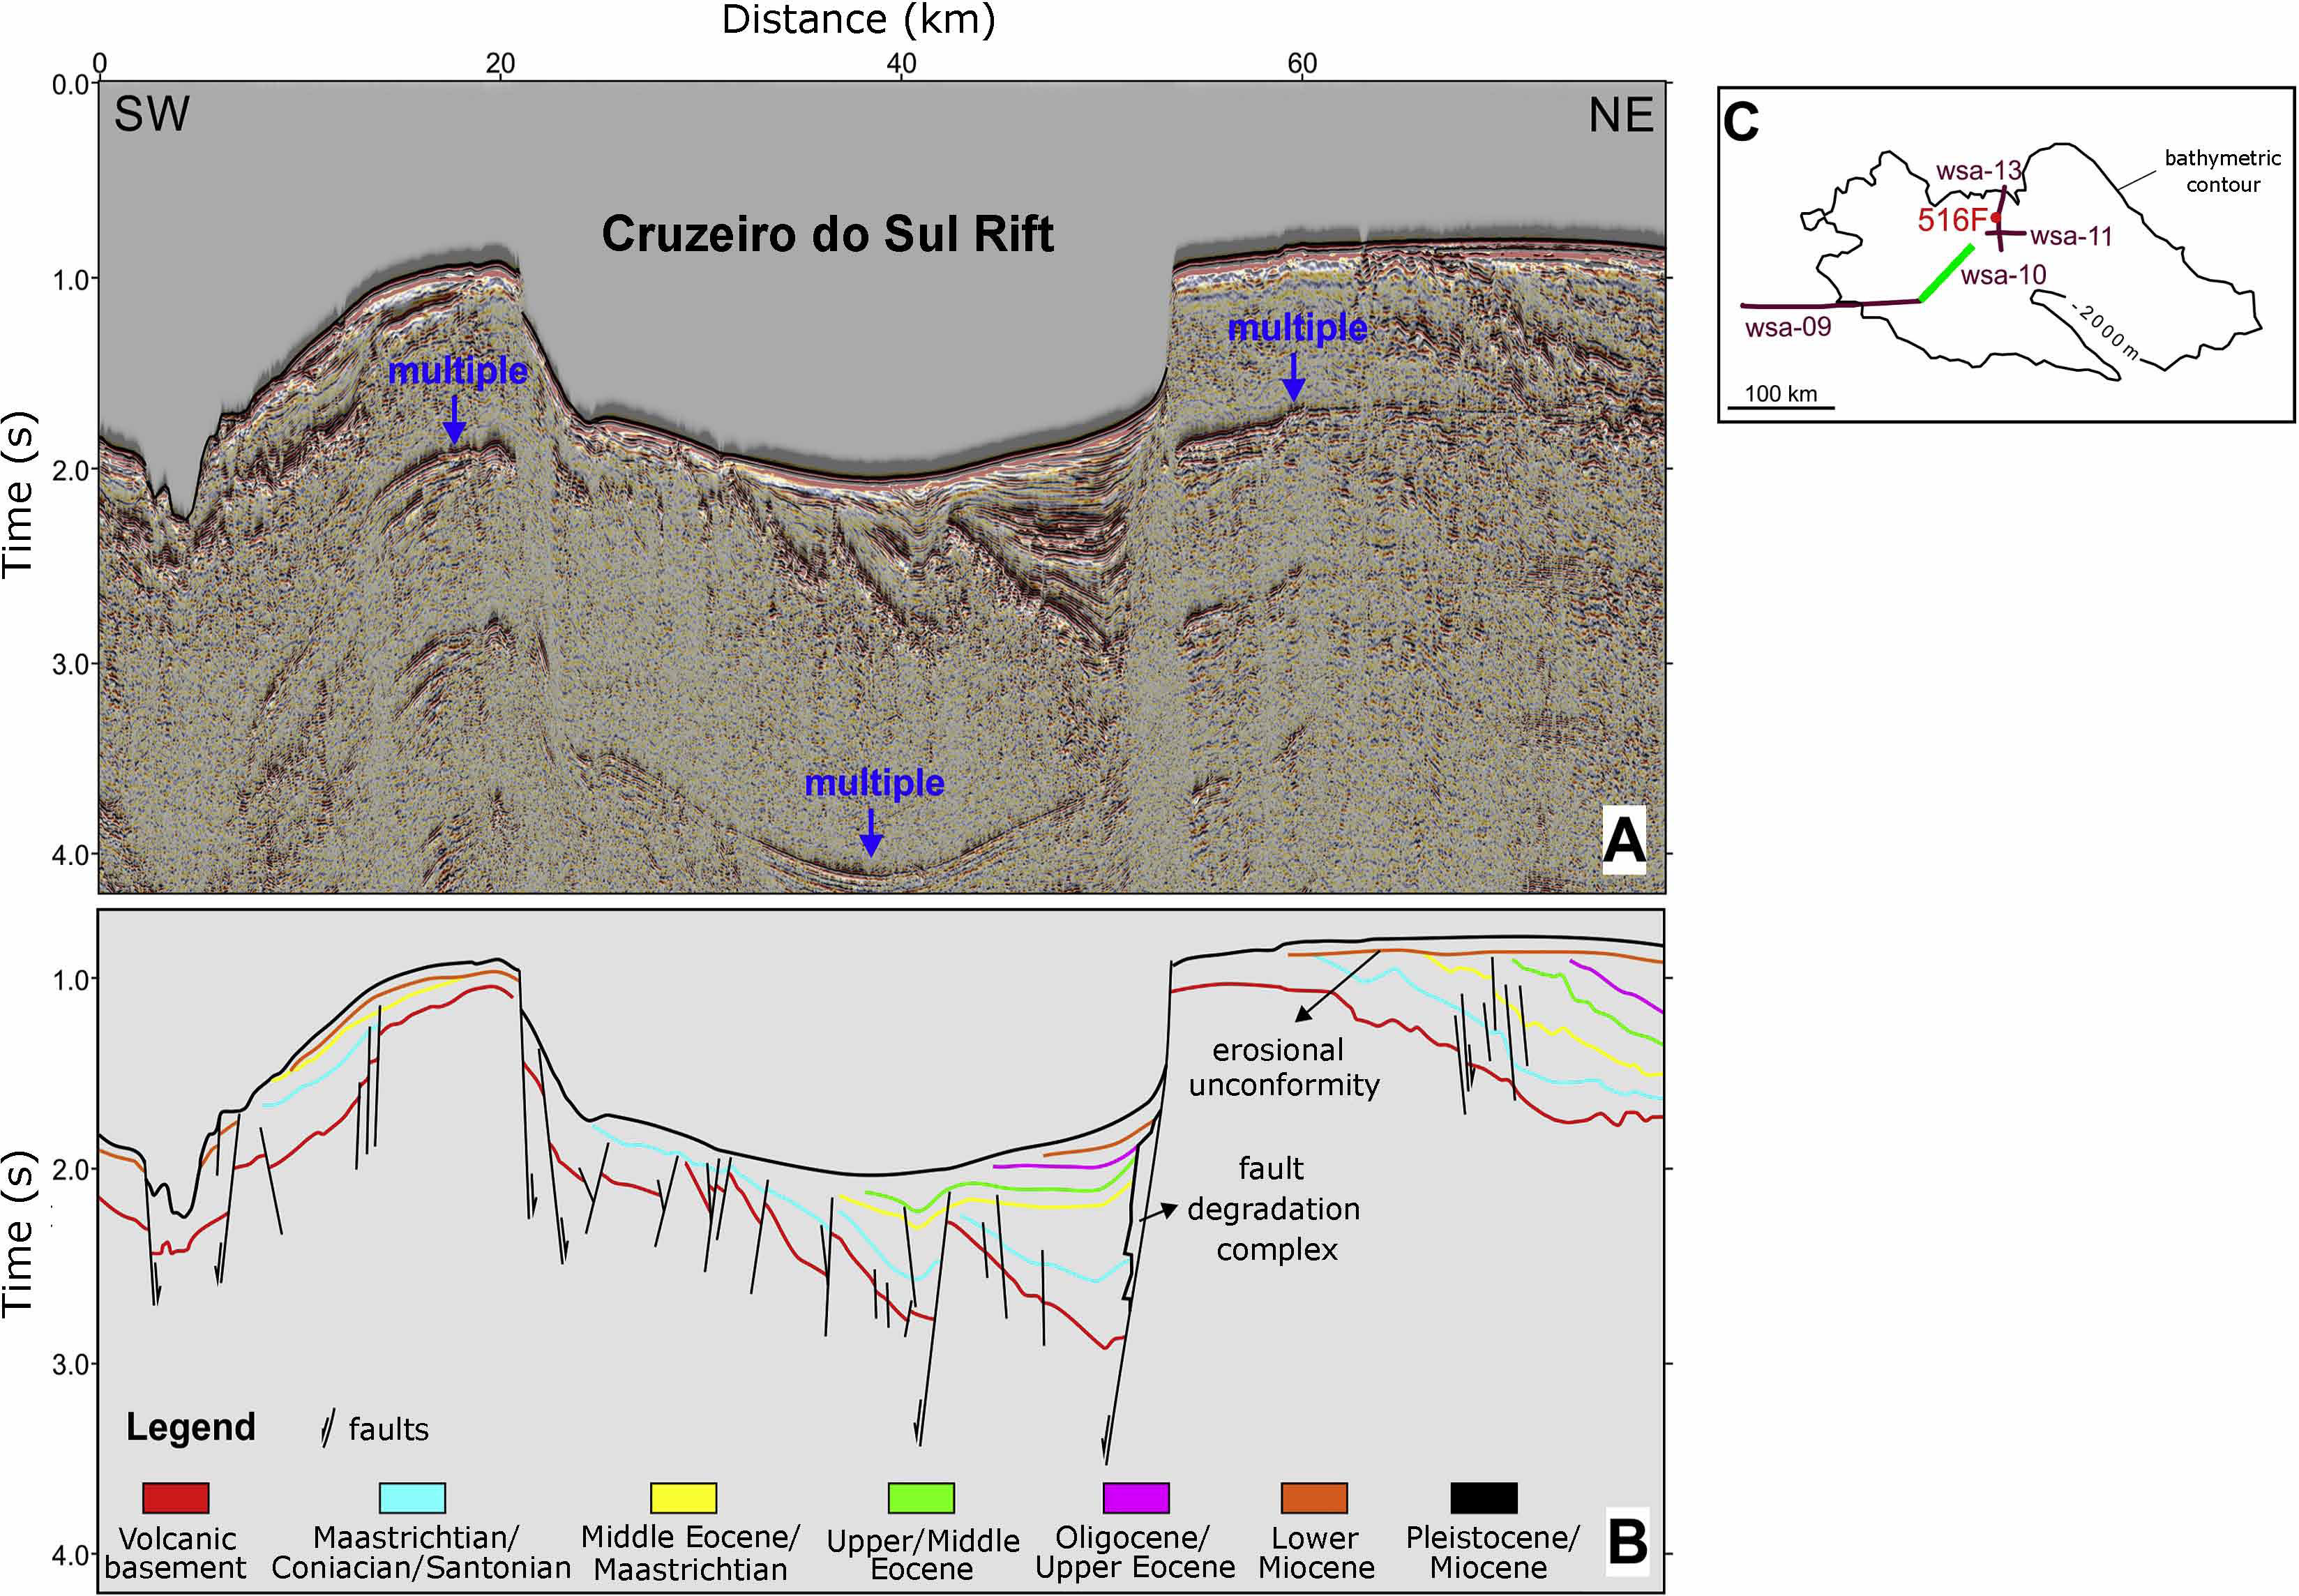
Figure 4 Raw (A) and interpreted (B) seismic profile wsa-10, located in the northern Cruzeiro do Sul Rift as shown in (C) by the green line (adapted from Praxedes et al., 2019).
3 Methods and data
3.1 The MarineE-tech project
The MarineE-tech Project began with the RGR-1 cruise on board the Alpha Crucis ship, between January 28th and February 19th, 2018. According to Jovane et al. (2019), oceanographic, geophysical, hydrographic, geological, and ecological surveys were done during this cruise being known as a multidisciplinary cruise. The aim was to expand and complement earlier studies about the RGR, besides providing elemental information to mining activities. This work used bathymetric, magnetic, and geological data acquired in this cruise to perform and discuss results.
This project continued with the DY094 cruise, which occurred between October 20th and November 6th, 2018, on board the Royal Research (RRS) Discovery ship. The RRS Discovery navigates 1,400 km to the east of Brazil until RGR, which objective was to investigate potential rock deposits cobalt enriched for future mining activities (Murton et al., 2018). About the data acquired in this cruise, the bathymetry, sidescan sonar, and geological data were used for this research.
3.2 Bathymetric data
The bathymetry on the RGR-1 cruise was acquired using a Reson 7160 multibeam echo sound (Teledyne) with a frequency of 41 kHz (Jovane et al., 2019). The acquisition lines had NE-SW orientation and were perpendicular to the main slope, varying from 1 to 2,1 km from each other to potentialize the beam covering. The beam width varied to maintain a good quality of data.
During the DY094 cruise, the bathymetry surveyed the ocean floor with a Simrad EM122 multibeam echo sound with a 10 kHz frequency. The data collection occurred while the ship was in stationary mode or making small movements (Murton et al., 2018). The ship crew processed and interpolated the bathymetry using predefined ship configuration and the new calibration values (Figure 5).
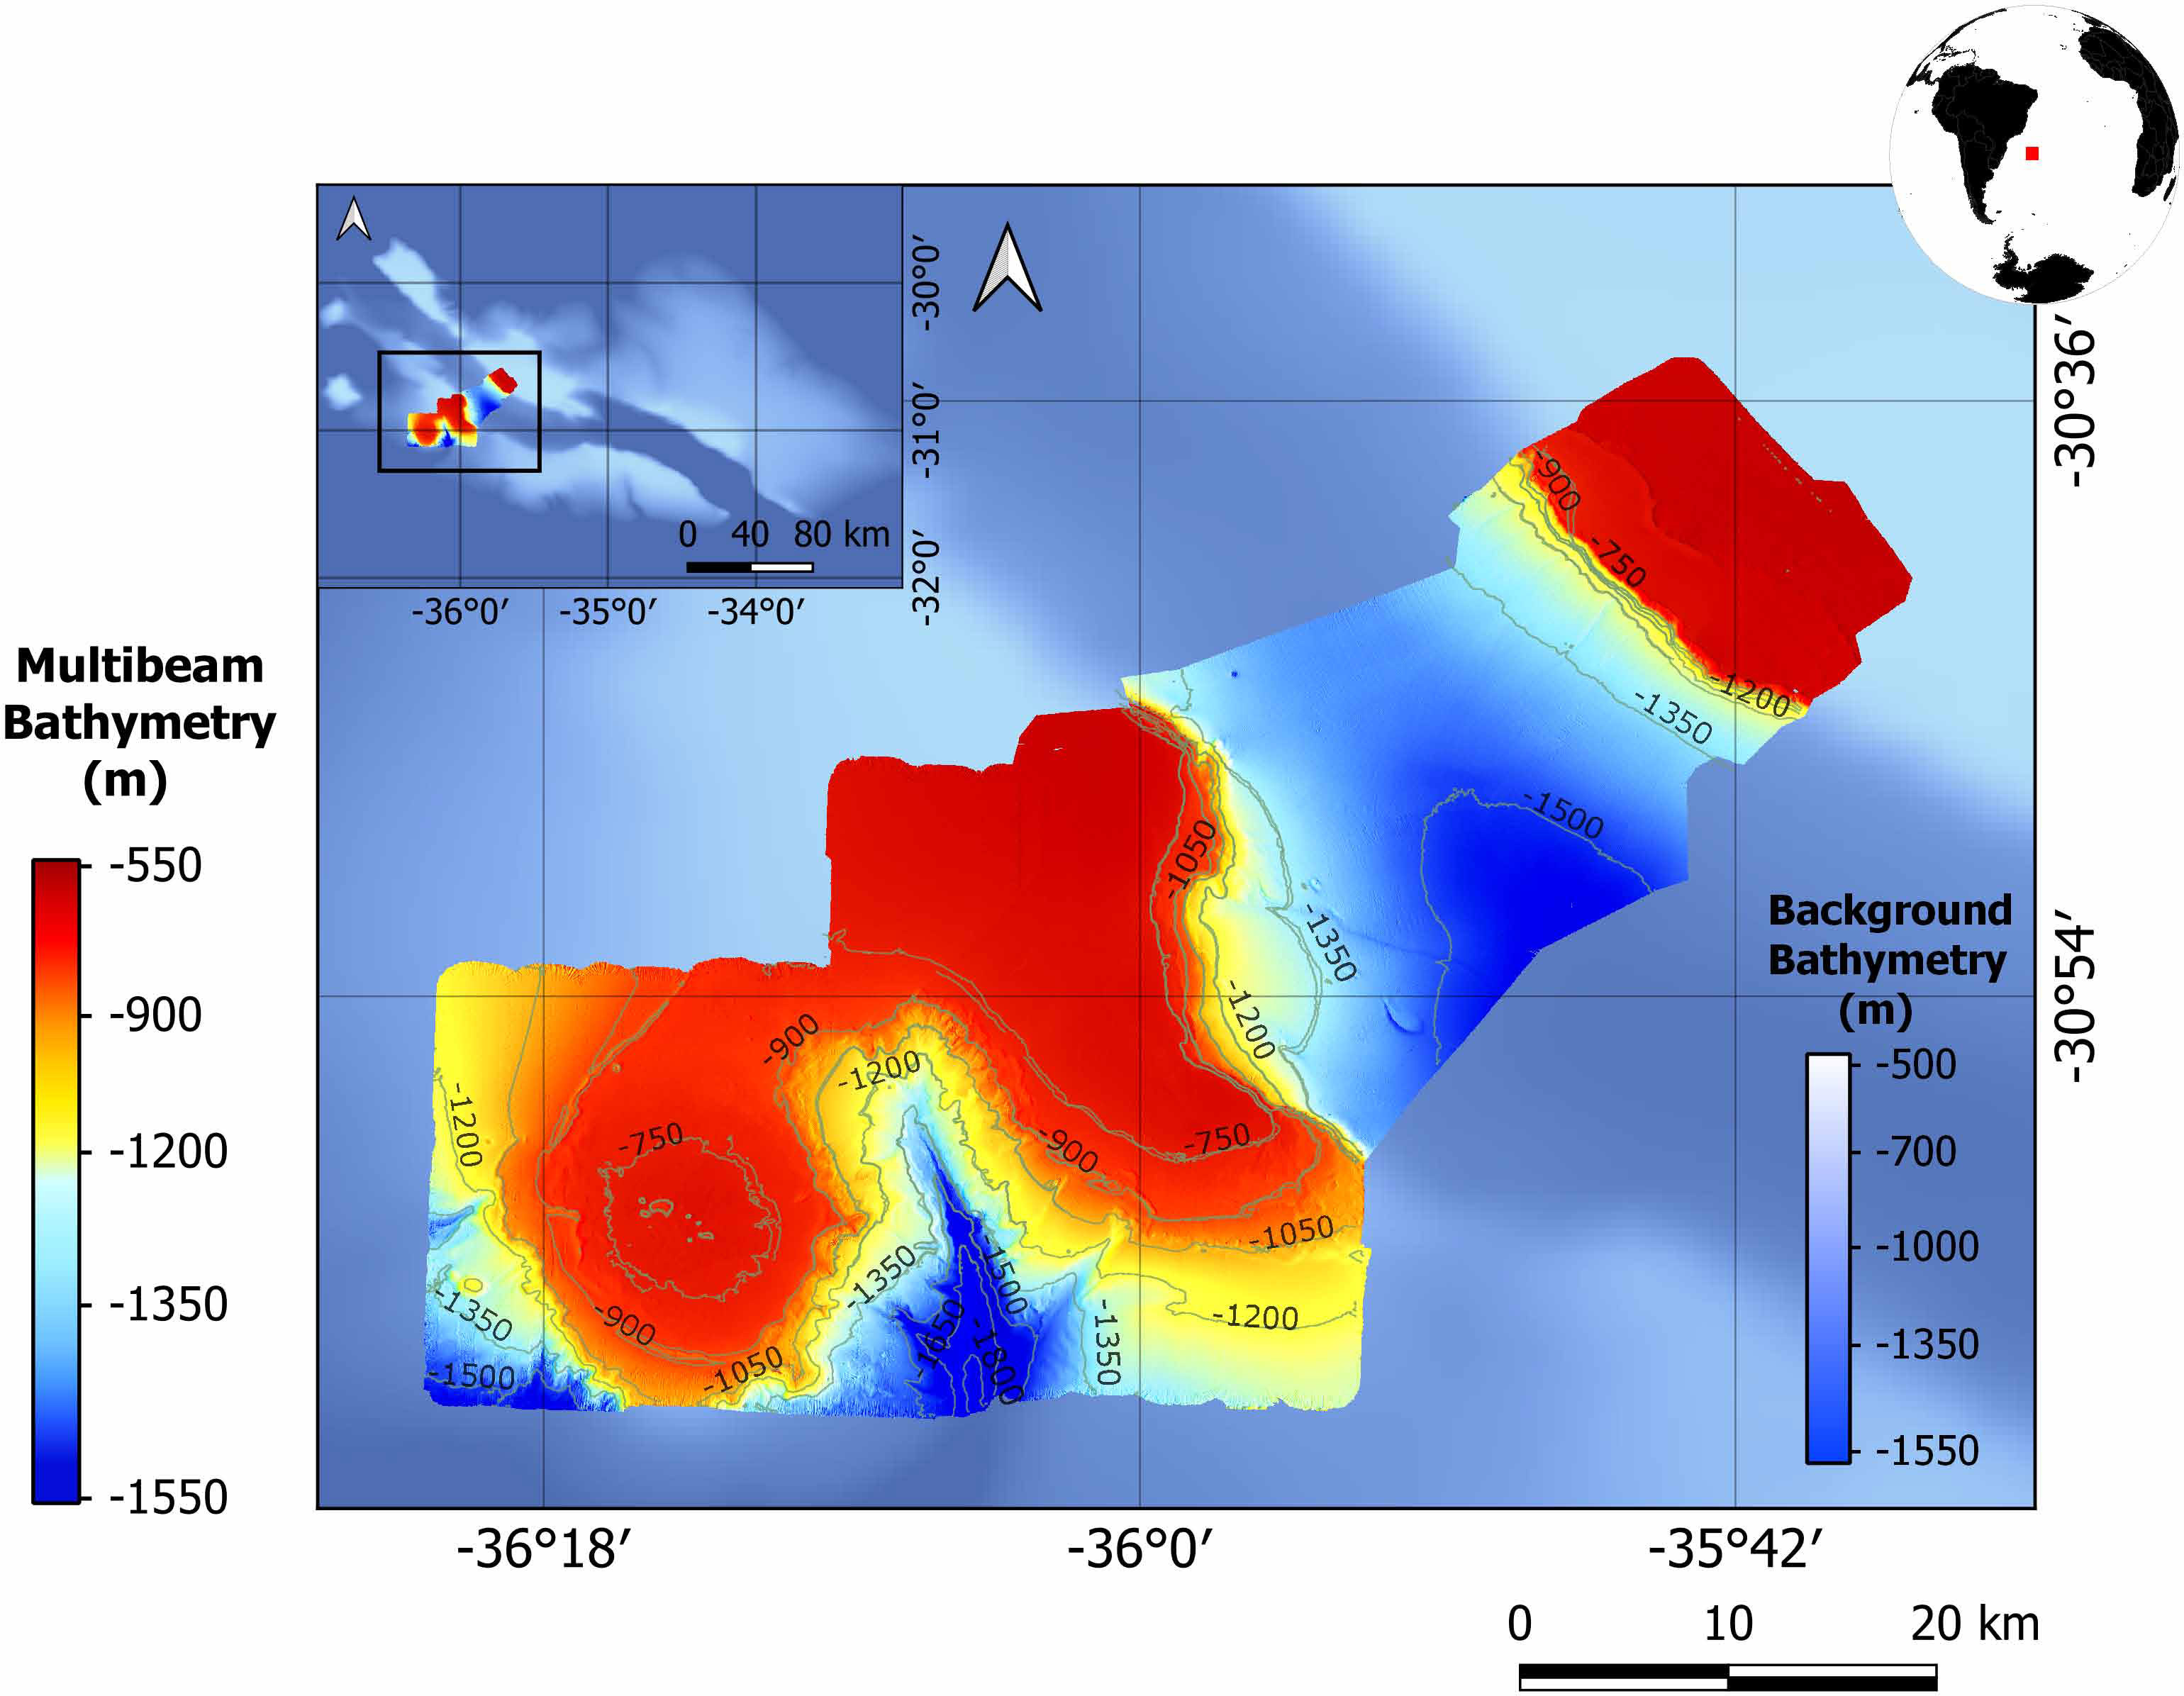
Figure 5 Bathymetric map of the study area with the shaded relief (azimuth = 90°, vertical angle = 40°), located in the north portion of the Cruzeiro do Sul Rift (NCSR) in the west portion of the Rio Grande Rise. The bathymetry data on the NCSR were acquired by the multibeam echo sound from both cruises during MarineE-tech Project, the RGR-1 grid with 25 meters and the DY094 grid with 15 meters (Murton et al., 2018). The isobath spacing is 150 meters. The bathymetry in the background is from GEBCO_2020 with a spatial resolution of 15 arc-second (GEBCO Compilation Group, 2020). This bathymetric base background was maintained for all the other figures.
3.3 Sidescan sonar data acquisition
We integrated sonar data with geological dredge samples, constraining the local marine geology and its relief. Murton et al. (2018) reported the sonar data used in this work. The acquisition occurred during five missions using an Autonomous Underwater Vehicle (AUV) with an Edgetech 4200 sidescan sonar and a frequency of 100 kHz. The line spacing was 600 meters, and the average clearance from the seafloor was 90 meters. This equipment acquired data at 1.2 m/s (4.3 km/h), with its traveled distance depending on the ascent and descent times (30 minutes for every 1000 meters of ascent or descent) to the research depth, plus 45 minutes to calibrate the equipment, and 15 minutes to initiate the navigation. The traveled distance equation by the AUV for every mission can be expressed by Eq. 1, where Di is the initial depth, and Df is the final depth (Murton et al., 2018):
The high and low backscatter signals generated detailed information about the region’s relief and geology. The high backscatter represented a hard ground seafloor related to rock outcrops or FeMn crusts, whereas the low backscatter usually indicated soft sedimentation (Murton et al., 2018).
3.4 Dredge operations
The geological acquisition occurred through dredge operations in the NCSR during the RGR-1 and DY094 cruises. This study used samples 5 to 17 from Jovane et al. (2019), collected using a 0.5 m by 0.025 m rectangular dredge with a mesh of 0.025 cm. These authors attribute the success of the rectangular dredge to its broad contact with the seafloor, which preserved the flat surfaces. After reaching the seafloor, the dredge had more 30% to 50% of the cable’s length released while the ship was not moving. The dredge collected subsurface material, keeping a velocity from 1 to 2 knots (0.514 to 1.029 m/s) following the planned acquisition lines. This cruise acquired more than 300 geological samples of rocks, including volcanic rocks and FeMn crusts.
Likewise, the DY094 cruise acquired more than 300 samples through 23 dredge operations (Murton et al., 2018). They used a square dredge with a width of 1 meter and a chain mail bag. The contrasting ambiances supported the decision of the best places for sampling during the geophysical acquisition and bathymetric variation. This choice aimed to study how this environment affects the formation, occurrence, and morphology of the FeMn crusts and the preservation of the seafloor. The planned routes varied from 0.6 to 1.2 km for these operations. The collected material revealed volcanic rocks and FeMn crusts and served as a basis for the survey locations of both cruises from the MarineE-tech Project.
The dredged material by the MarineE-tech Project included basalt, FeMn, and phosphorite crusts. The dredges also displayed smaller amounts of limestone, pebbles of metamorphic rocks, siltstone, ironstones, pyroclastic, and serpentine (Jovane et al., 2019). Almost all of the samples’ surfaces were polished, which indicates the presence of oceanographic conditions (such as the high intensity of currents, for example), making it challenging to preserve FeMn oxide and contribute to the erosion process on the surface.
The basalt was found mainly on the margin of the NCSR (Jovane et al., 2019). Some dredges also recovered FeMn and phosphorite crusts spread out on the top of the plateau, which is both relevant for mining activities. The basalt has a fine-grain aphanitic matrix with plagioclase and pyroxene phenocrysts, while the crusts have a darker color and are well-polished (Murton et al., 2018).
We used this geological data to interpret the magnetic signals, mainly when the spot has basaltic rocks. The FeMn and phosphorite crust positions were best resolved on the sidescan sonar results contributing to the relief detailing of the study area.
3.5 Magnetic field data
Jovane et al. (2019) used the SeaSPY2 magnetometer during the RGR-1 cruise to acquire the magnetic field data used in our work. These authors report that the equipment was towed at 250 m away from the oceanographic ship Alpha Crucis to avoid noise during acquisition. The SeaSPY2 is a proton precession magnetometer with Overhauser technology. It has a resolution of 0.001 nT, an absolute accuracy of 0.1 nT, and a sampling rate of 1 Hz. The acquisition lines were spaced by approximately 2 km and divided into areas A1 and A2 (Figure 6).
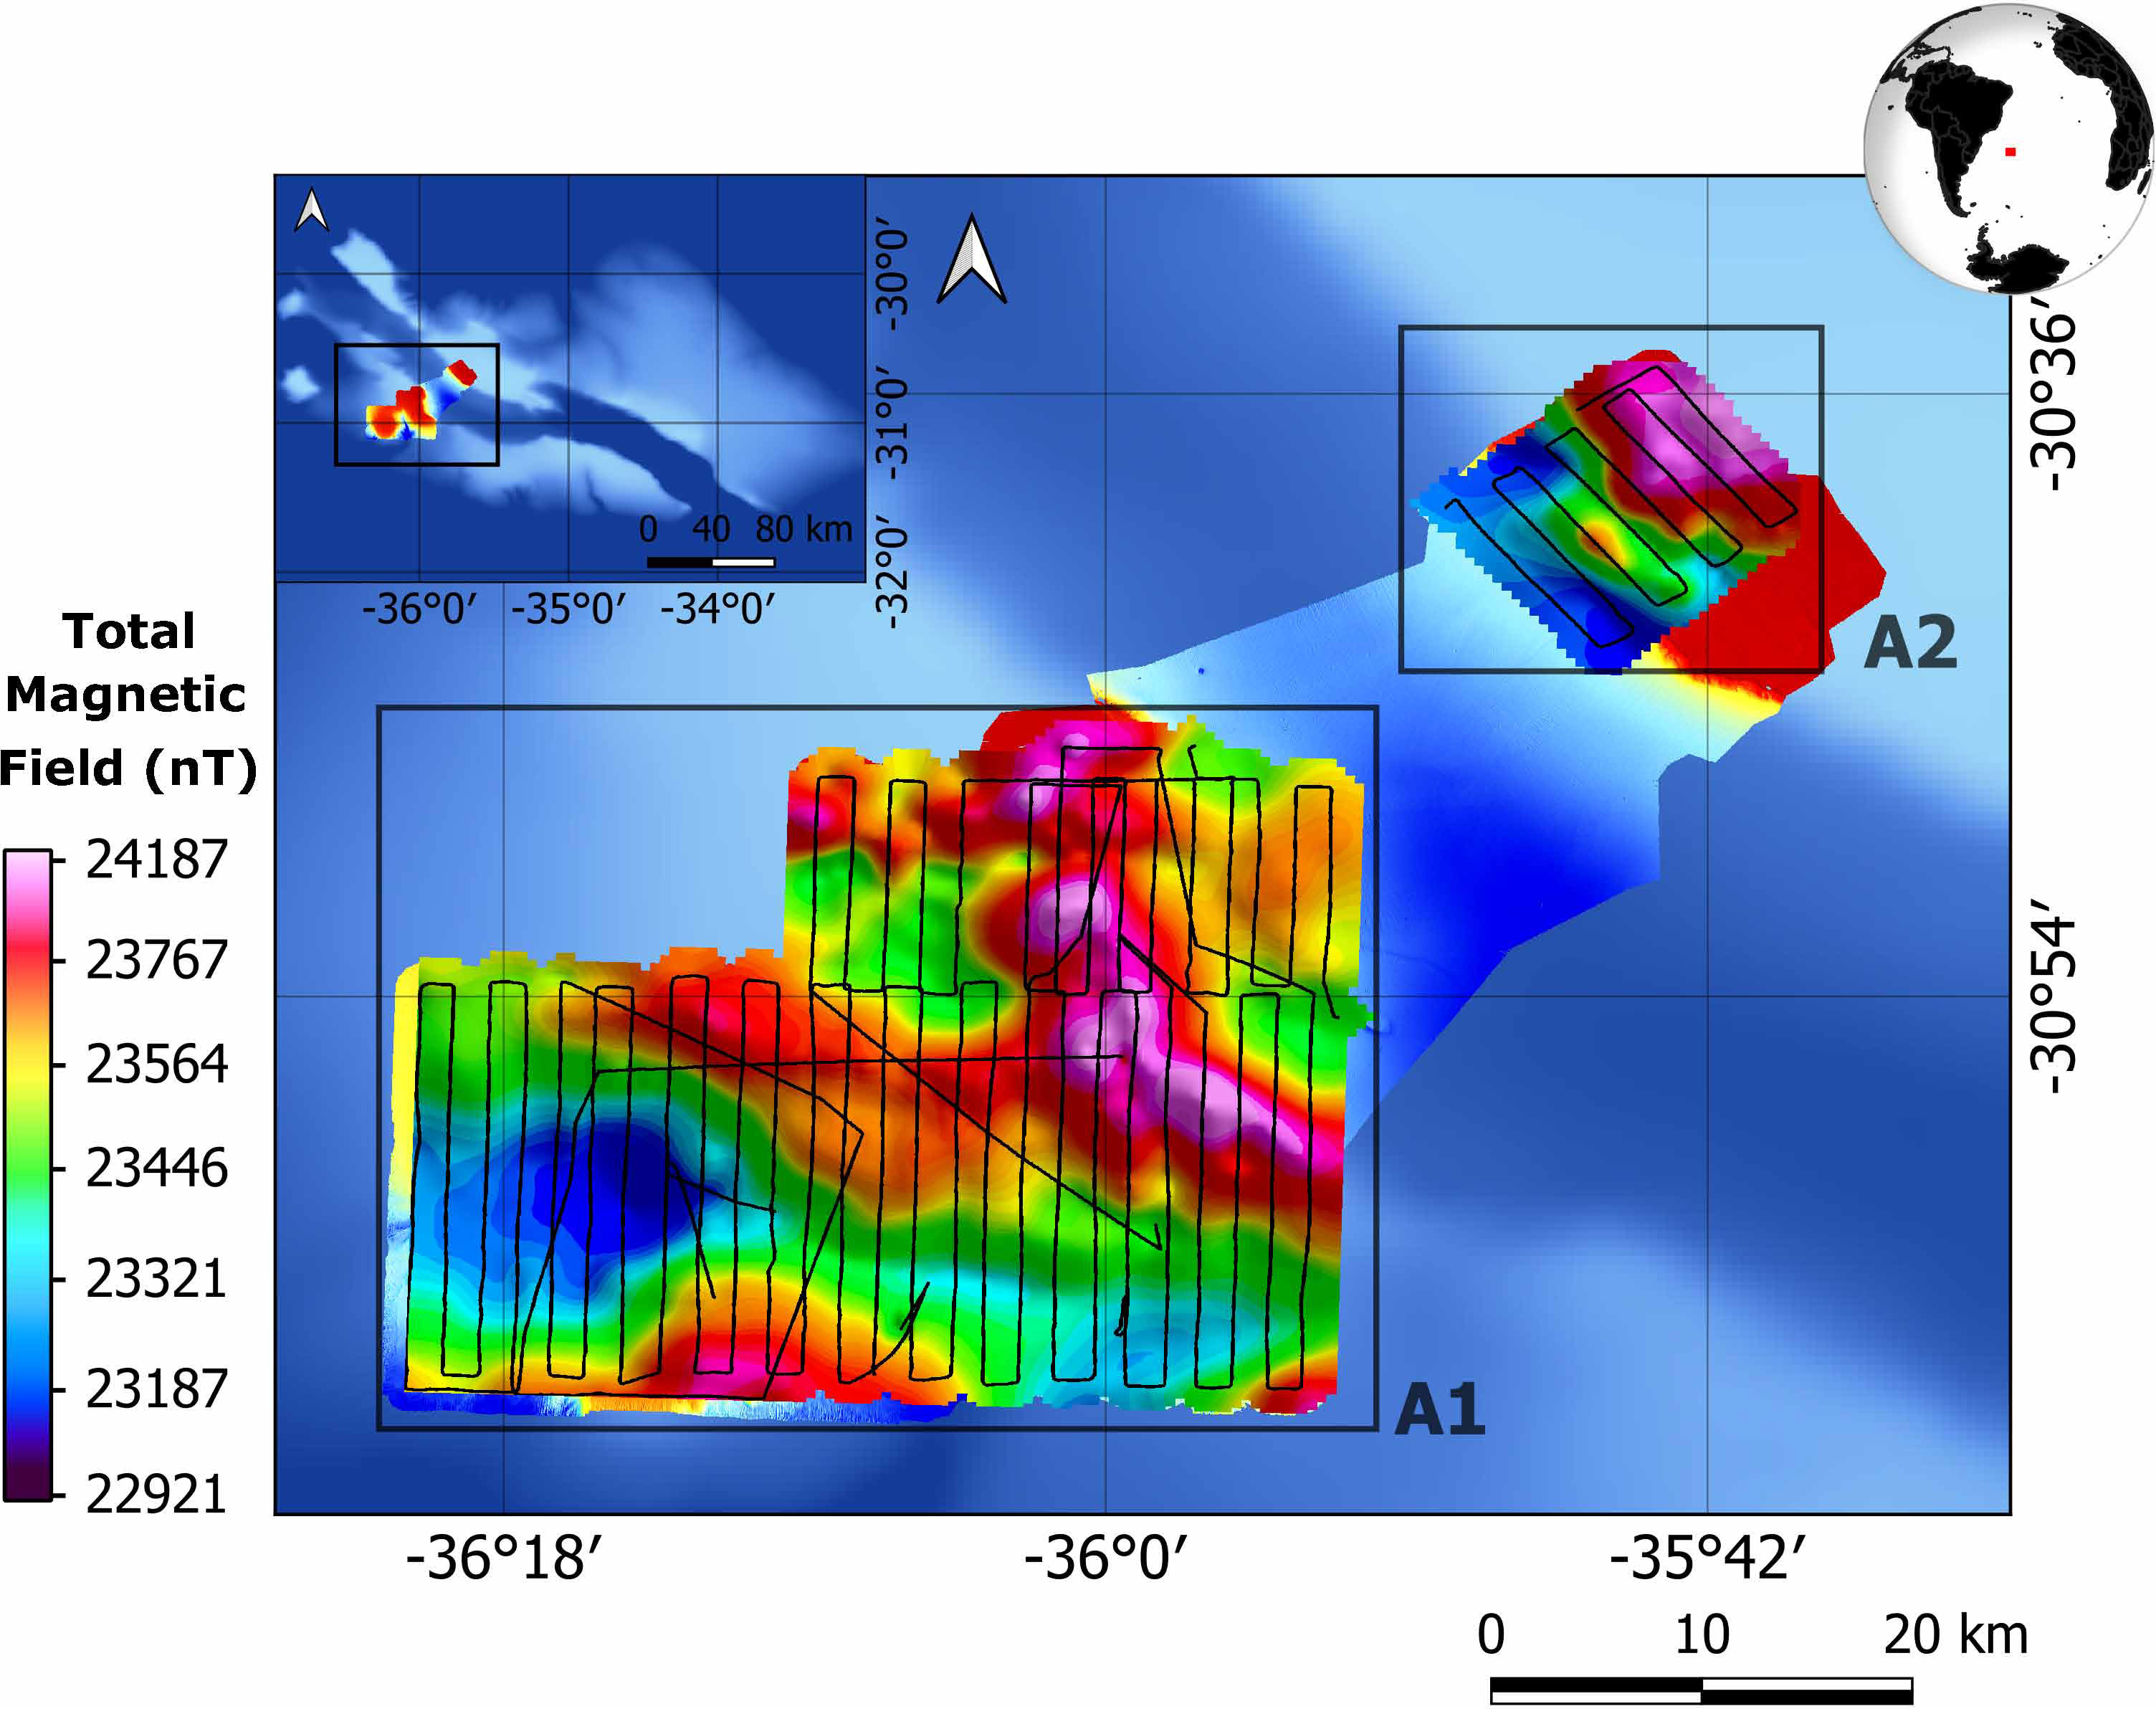
Figure 6 Total intensity magnetic field map in nanoteslas (nT), acquired during the RGR-1 cruise in the northern segment of the Cruzeiro do Sul Rift (NCSR) (areas A1 and A2). The acquisition lines have 2 km spacing, and the grid cell size is 450 m.
The magnetic data was not reduced from the diurnal field because of the vast distance between the RGR and the closest land patch with the possibility of installing a magnetic base. We filtered the surveyed field using a non-linear filter to remove all the unwanted noises and spikes. This filter had a width of 3 and tolerance of 5 fiducials, considering a window of 3 fiducials and evaluating the gradient between neighboring values.
The survey size required removing the Earth’s internal magnetic field (IGRF) from data to deal with latitude variations originating in the Earth’s outer core. Since the objective of this study was to locate volcanic rocks on the surface, the magnetic field’s long wavelengths, primarily associated with deeper sources, needed to be removed (Audet and Mareschal, 2007). We applied a residual gaussian filter to highlight magnetic anomalies in each area (A1 and A2), with standard deviations of 0.07778 m-1 for area A1 and 0.089 m-1 for area A2.
We used a set of enhancement filters to interpret the magnetic framework of the study area. The AS3D (Nabighian, 1972; Roest et al., 1992; Blakely, 1996) highlights the location of shallow magnetic sources by displaying their contour with a peak of gradient amplitude. Its weak dependency on the magnetization direction makes it an excellent tool for analyzing the geometry of magnetic sources.
The Reduction to the Magnetic Pole filter (RTP; Baranov, 1957) aims to transform the mid to high-latitude magnetic field anomalies into vertical anomalies. The idea is to simulate their behavior as if they were at the magnetic pole, where the field is vertical. The RTP transforms the anomalies’ behavior, making it symmetrical and mostly restricted to the boundaries of the magnetic source. The filtering output, when correctly applied, is similar to the AS3D’s, being possible to use the last as a resort to evaluate the quality of the RTP filtering. However, its results display a magnetic field as a product instead of its gradient.
Variations for the RTP filtering operator have been published since its first proposal (Baranov, 1957; Grant and Dodds, 1972; Blakely, 1996). Initially, it assumes prior knowledge of the sources induced and total magnetization properties. However, it is not always the case, especially when the object of study host remanent magnetization (Melo and Barbosa, 2019). The remanence vector often differs from the induced field, producing a divergent direction of total magnetization. Combining the total magnetic field, the AS3D, and the RTP permits interpreting the bodies’ magnetization behavior. That includes assessing the magnetite size and content and the possibility of a crystallization contemporaneity.
To evaluate the magnetic framework of the study area, we used the Tilt Derivative filter (TDR; Miller and Singh, 1994). The TDR normalizes and enhances the visualization of the expression of shallow and deep magnetic lineament sources using the phase of the field gradient. Its interpretation depends on the magnetic field’s inclination angle and, therefore, on the latitude of the source (Verduzco et al., 2004). This technique allowed us to evaluate possible faults, dikes, and linear features with the contrast of magnetization, especially the fault zone found in the Cruzeiro do Sul Rift in the WRGR (Praxedes et al., 2019).
4 Results and discussion
The study area, located in the northern portion of Cruzeiro do Sul Rift (NCSR), western RGR, has 2,072 km² and bathymetric variation between 750 and 1,800 m. Slopes higher than 30° occur in the margin of the rift, demarcating its fault strikes. The plateau on the right margin (in the northeast) defines a lineament that reaches a slope from 10° to 15°. On the left margin, the plateau is predominantly flat (< 5°), with circular structures appearing in the southwest, where the slope varies between 10° and 15°. Also, the black arrow indicates a rugged terrain in the south. Both indications can correspond to FeMn crusts. We integrated the slope with bathymetry contours; together, they displayed irregular relief, structures, and shapes as the depth increased (Figure 7).
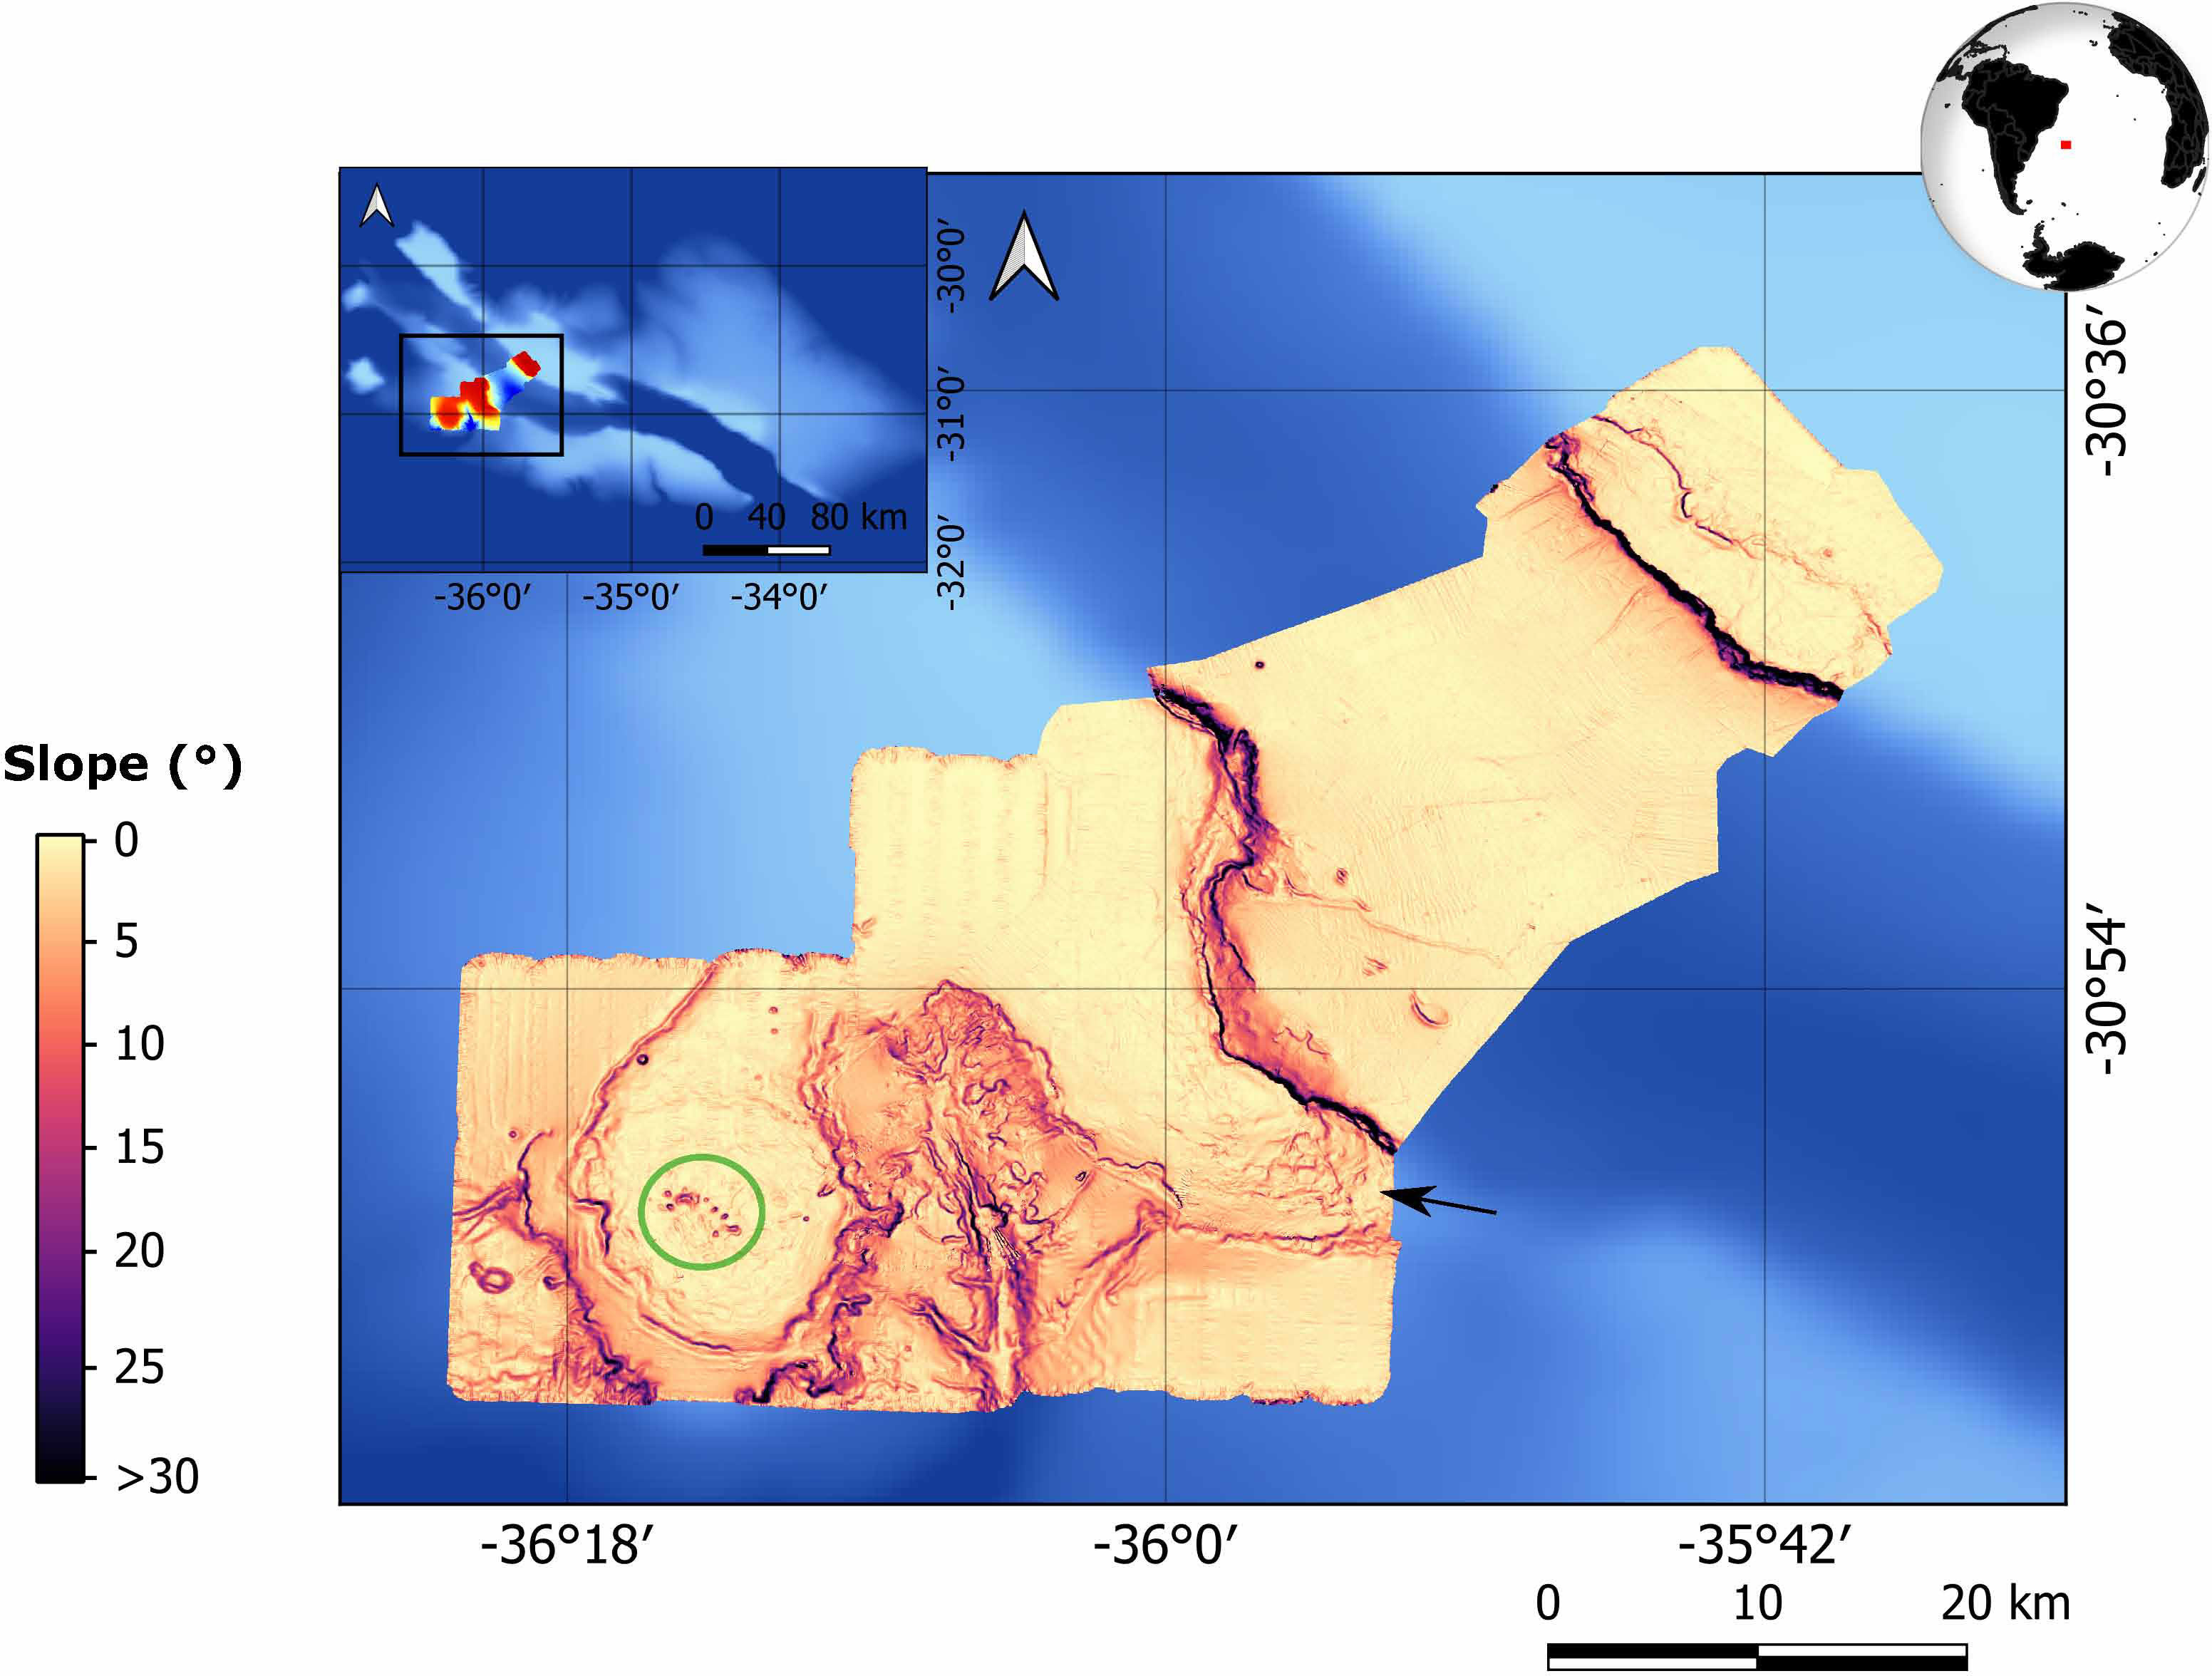
Figure 7 Slope map of the study area, in degrees. The green circle highlights circular structures, and the black arrow points to rough terrain, both could be related to crusts.
Looking for superficial structures such as rock outcrops, we used a gaussian filter to remove the long wavelength magnetic field and highlight the residual field produced by these shallow sources. The A1 and A2 areas (Figure 8) display similar wavelengths. However, Area A1 contains normal and reversal polarization anomalies, whereas area A2 only hosts signatures of normal polarization.
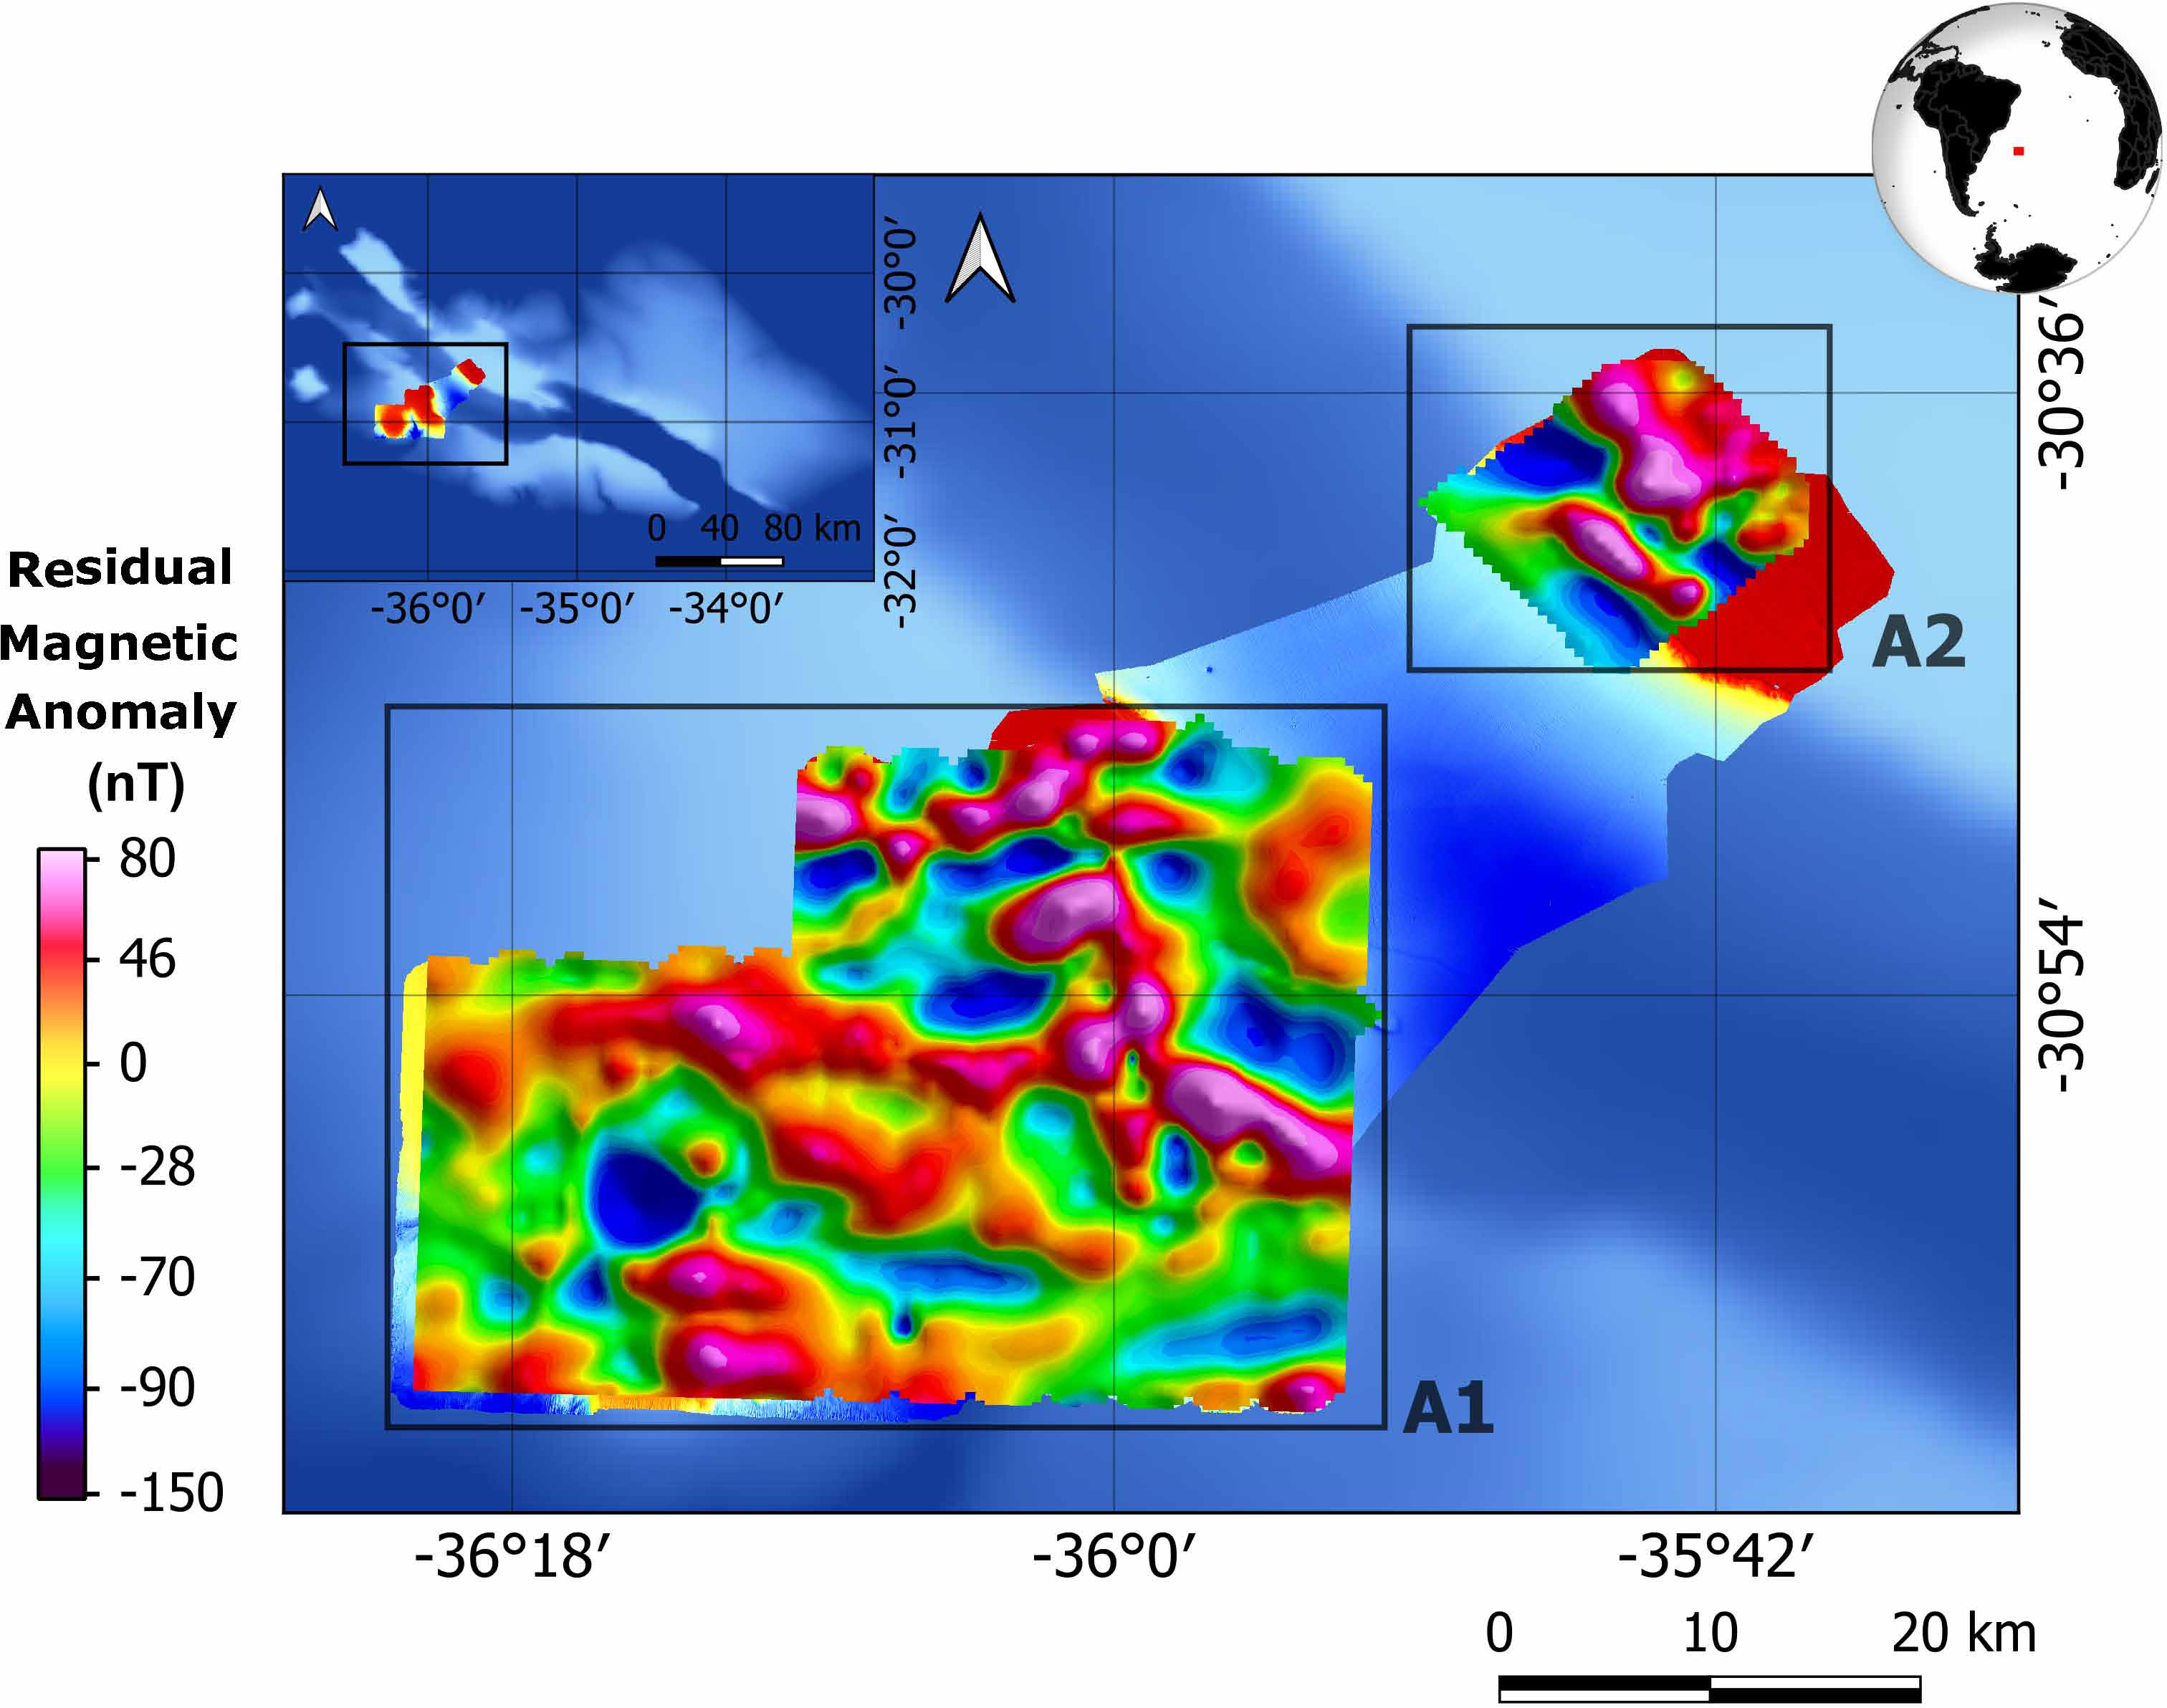
Figure 8 Residual Magnetic Anomaly map obtained after the Gaussian filter application in the areas A1 and A2, using a standard deviation of 0.0778 and 0,089, respectively. The grid cell size is 450 meters.
The A1 area AS3D filtering indicated potential magnetic sources in the northeast portion of the map, near the rift margin (Figure 9A). Another source appeared in the southwest portion of the same product. The RTP produced positive asymmetrical anomalies displaced from the source boundaries – defined by the AS3D – in the northwest anomalies of area A1 (Figure 9B), with amplitudes up to 250 nT. This signature suggested the predominance of a remanent magnetization in the bodies from this region.
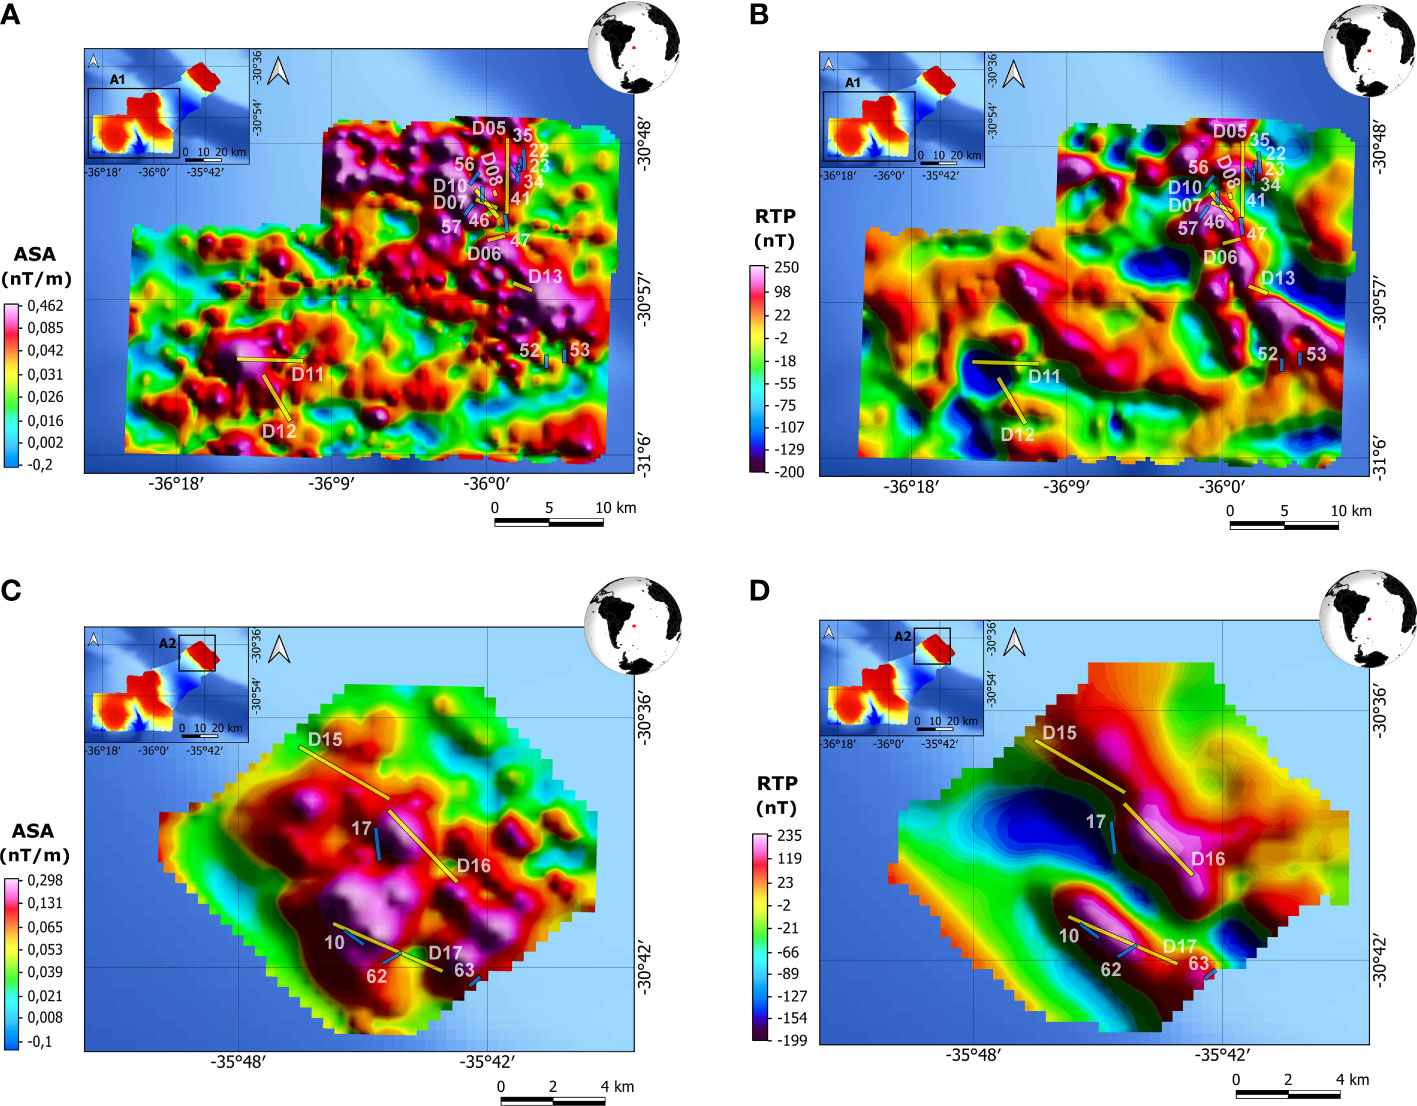
Figure 9 Result magnetic maps with the dredge tracks during RGR-1 (in yellow) and DY094 (in blue) cruises in areas A1 and A2. (A) 3D Analytical Signal (AS3D) map, and (B) Reduction to Pole (RTP) map from area A1 containing dredges D05, D06, D07, D08, D10, D11, D12, and D13 in yellow and 22, 23, 34, 35, 41, 46, 47, 52, 53, 56 and 57 in blue. (C) 3D Analytical Signal (AS3D) map, and (D) Reduction to Pole (RTP) map from area A2 containing dredges D15, D16 and D17 in yellow and 10, 17, 62 and 63 in blue. All maps have a grid cell size of 450 meters.
In the southwest, an intense anomaly suggested the presence of significant remanent magnetization, given its reverse behavior in the total magnetic field and its negative signature after the RTP (Figure 9B). The near to circular RTP anomaly was spatially coherent with a primary AS3D peak (Figure 9A).
Jovane et al. (2019) report volcanic rocks (basalt) recovered in dredge operations of the RGR-1 cruise. These basalts were found mainly in the Cruzeiro do Sul Rift margins (Figure 9; dredges D05, D06, D08, and D13 indicated by the yellow tracks), where it has peaks of maximum in AS3D and RTP results, indicating potential magnetic sources. The dredges 22, 23, 35, 47, and 53, represented by blue tracks, also returned with basaltic rocks (Murton et al., 2018). Together, the AS3D and RTP results suggested significant remanent magnetization through simultaneous peaks caused by the presence of high-susceptibility basalts.
Benites et al. (2020) indicate that a few dredges acquired FeMn crusts from the top of the plateau (D05, D06, D07, D10, and D11, indicated by the yellow tracks). The dredges 22, 23, 34, 41, 46, 52, 53, 56, and 57 found crusts during the DY094 cruise (Murton et al., 2018). However, the FeMn crusts may not be responsible for the magnetization because of their small volume of magnetite compared to basaltic rocks.
The D11 dredging within the RTP area of the southwestern anomaly (Figure 9B) pointed out that the source of the local magnetic anomaly does not outcrop. Another possibility might be the presence of FeMn crust in that region. However, more than its volume may be required to produce such an intense negative anomaly. If in an expressive volume, FeMn crusts could produce magnetic anomalies due to the biogenic magnetite (magnetotactic bacteria), seen in FeMn nodules by Hassan et al. (2020) and Dong et al. (2016). Hypothetically, the same explanation would serve to dredge D12 (Jovane et al., 2019).
In the A2 area, the AS3D displayed four places with potential magnetic sources: one in the northwest, one in the central, one in the southeast, and a larger one in the southwest part of the map (Figure 9C). The RTP indicated potential anomalies predominating remanent magnetization, with amplitudes varying from 235 to -199 nT (Figure 9D). The dredges operations occurred within the positive anomalies and recovered FeMn crusts (D15 and D17 tracks). The same happened in dredges 10, 62, and 63, which produced phosphorite crusts (Murton et al., 2018). The basaltic rocks appeared in dredges D15, D16, and D17 and in dredges 10, 17, and 63 (Murton et al., 2018; Jovane et al., 2019; Benites et al., 2020). The FeMn crusts were intensely eroded (Benites et al., 2020), turning the basaltic rocks the best explanation for the sources of magnetization.
We detached and inserted the prominent anomalies of the AS3D of areas A1 and A2 on the bathymetric map (Figure 10A). The anomalies concentrate predominantly on the top of the plateau, mainly near the Cruzeiro do Sul Rift boundaries, where the depth reaches 750 m. The lineaments emphasized in the rift zone represent the Fault Zone (Praxedes et al., 2019). These lineaments display an NW-SE trend, following the rift margin direction (Figures 10B–D).
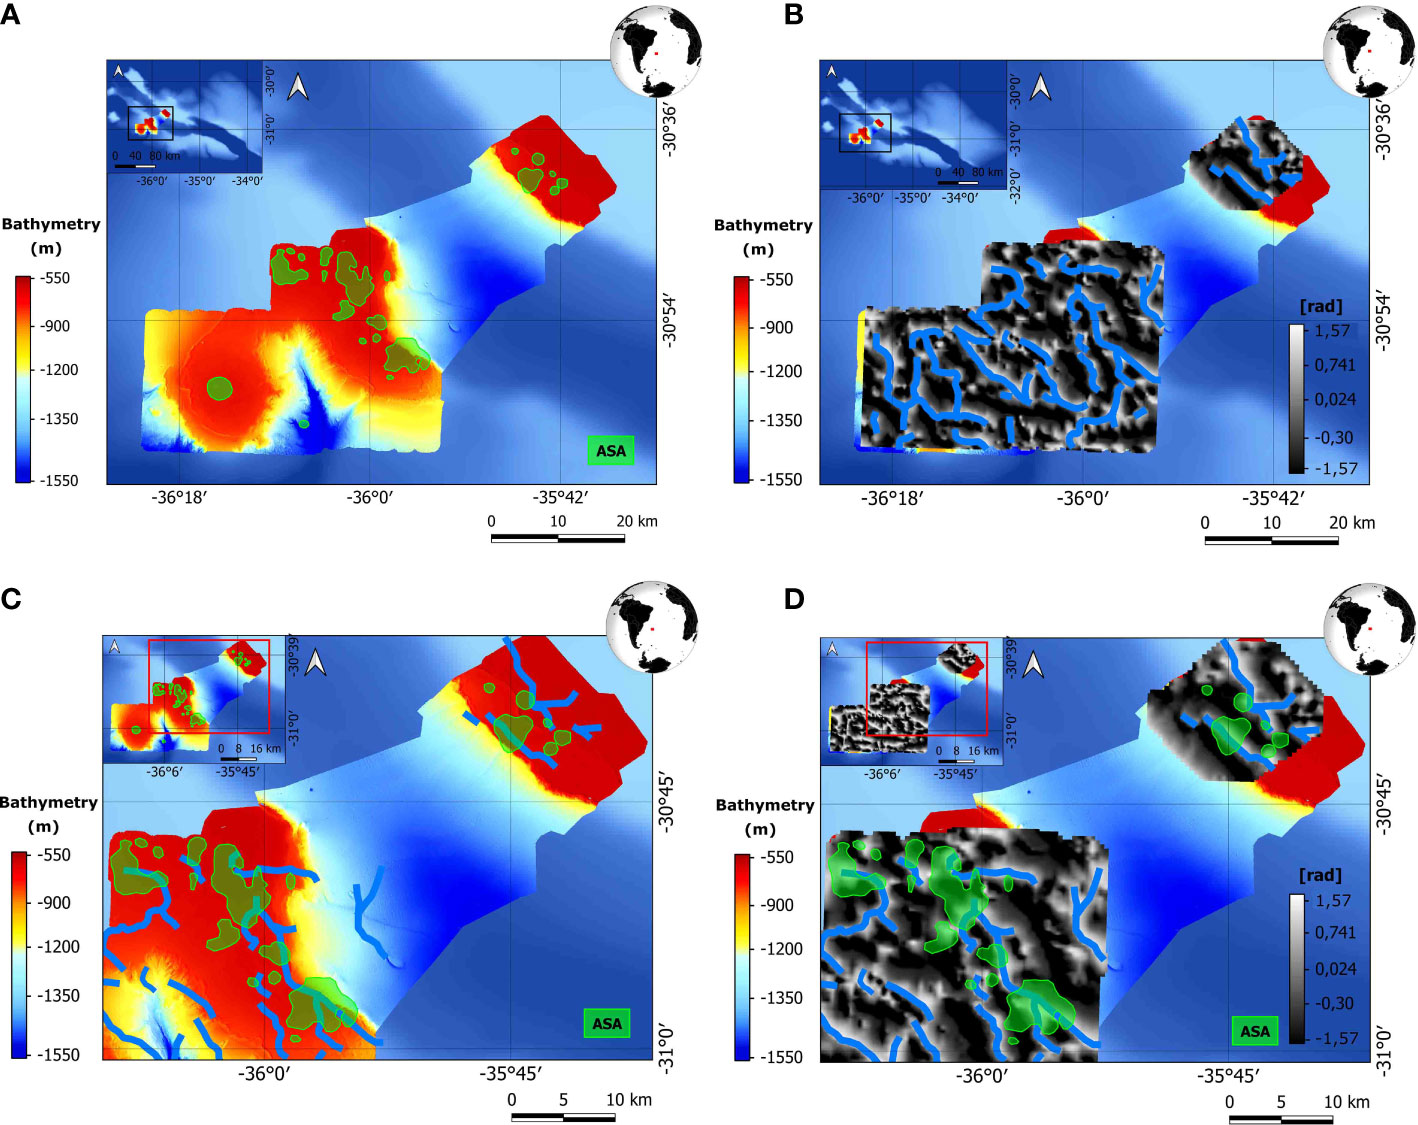
Figure 10 Maps with the Analytic Signal Amplitude (ASA) and Tilt Derivative (TDR) results in the study area. (A) shows the bathymetric map with the main anomalies found by the ASA filter application (in green). (B) shows the TDR filter result in the study area applied over the Reduction to Pole result in both areas (A1 and A2). (C) is a zoom of the bathymetric map indicating the lineaments at the rift margin (in blue) and possible ASA anomalies (in green) that could be associated with it. (D) is a zoom of the TDR map showing the lineaments in the rift margin (in blue) and possible anomalies ASA associated with it (in green).
The magnetic source boundaries defined by the AS3D filtering could be related to nearby lineaments. As defined by Praxedes et al. (2019), the Fault Zone should present less resistance and pressure facilitating the magma intrusion. Consequently, this magma could be related to the basaltic rocks found there.
We associated the TDR lineaments with the rift faults, corroborating with the results of seismic line wsa-10 (Praxedes et al., 2019). One of the RGR origin hypotheses is associated with volcanism from the Tristan da Cunha hotspot and thermal subsidence (Gamboa and Rabinowitz, 1984; O’Connor and Duncan, 1990; Galvão and De Castro, 2017). In this hypothesis, this magmatic event should also have affected the western portion, causing the distension framework and the normal faulting along the region. Based on that, we agree that the rift faults are related to the RGR origin during the Atlantic Ocean opening process, as mentioned by Galvão and De Castro (2017) and Praxedes et al. (2019).
According to Galvão and De Castro (2017), on a local to the regional scale, the Oceanic Fracture Zones coincide with inflections observed in the Cruzeiro do Sul Rift. These inflections are characterized by transform fault and controlled by tectonic events during the rift’s formation (Figure 11). This interpretation agrees with the interpreted magnetic lineaments produced by TDR data. The study area occurs in one of the first infection points of the Rift indicated by lineament 1 (Figure 11A). According to Mohriak et al. (2010), the Rift formation affected the continental and the oceanic crusts, and transcurrent movements caused an intense fracturing along the shear zone and, later, volcanism. This result also agrees with the RGR origin hypothesis, relating the Tristan da Cunha plume to the rift and the lineament connecting it to the Fault Zone.
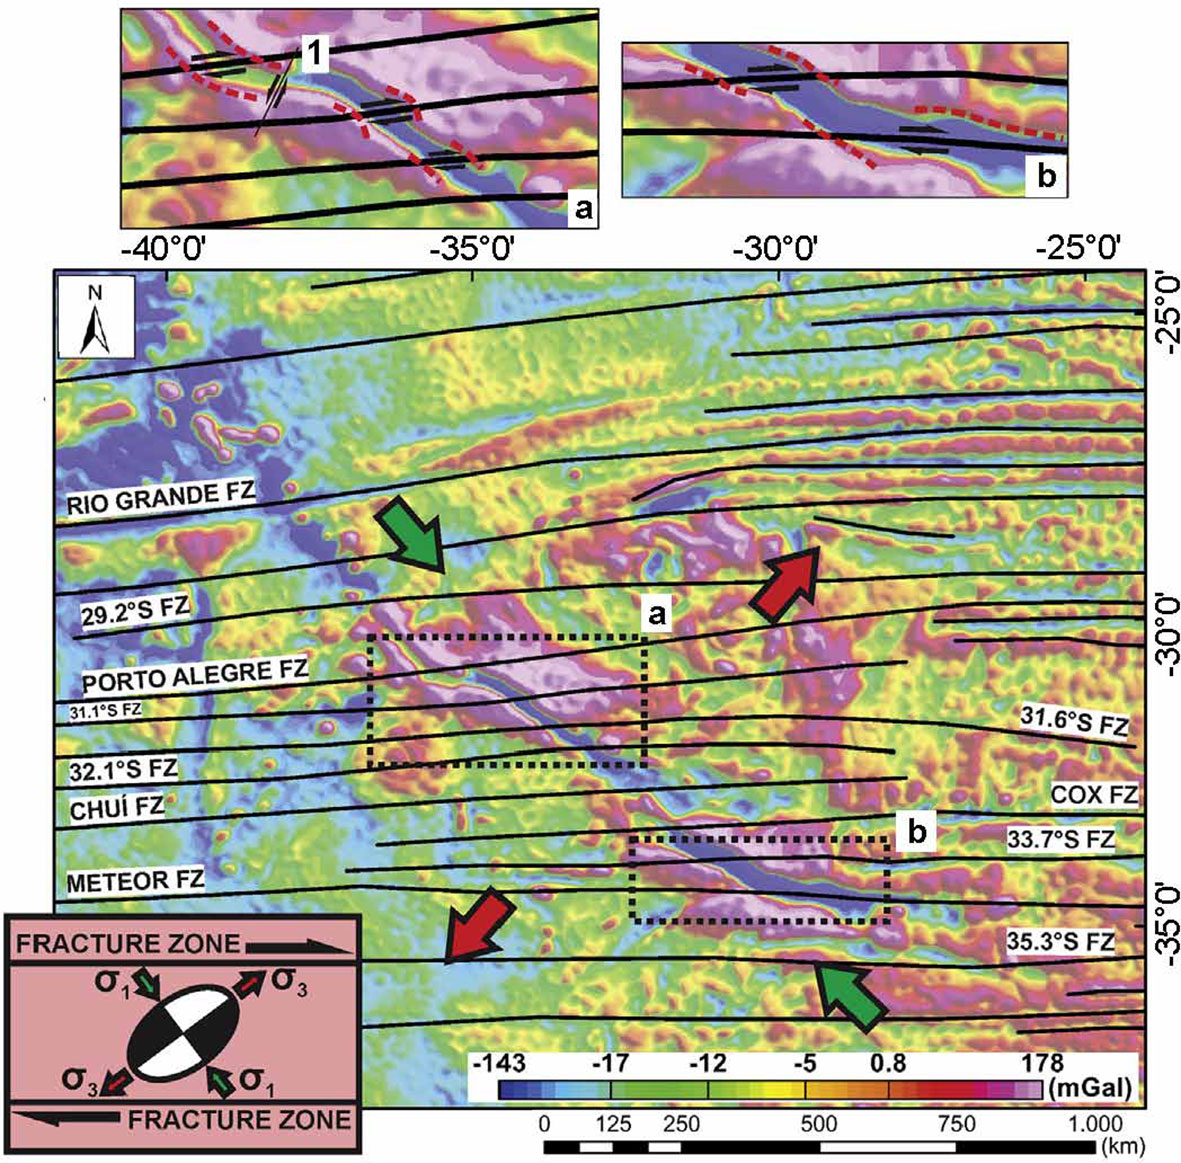
Figure 11 Free-Air anomaly map presenting the tectonic events which originated the Cruzeiro do Sul Rift. FZ = Fracture Zone. (A, B) shows the main inflection points of the Rift in its north and south segments, respectively. 1 is the magnetic lineament that crosses the study area and its inflection (Modified by Galvão and De Castro, 2017).
The sidescan sonar data indicate low and high backscatter signals intercalations, detailing the local geology and relief (Figure 12). The low backscatter signal in subarea M suggested depressions. These depressions probably contain carbonate gravel and crust fragments (Figure 12A) depicted in the slope map as a circular structure (Figures 7, 13). We associated the high backscattering with the hard ground composed of compacted calcarenite and basalt (Murton et al., 2018). It still needs to be made clear how these lithologies originated in this region. Nevertheless, this result corroborates with FeMn crusts, fragments, and basalts in dredges D11 and D12.
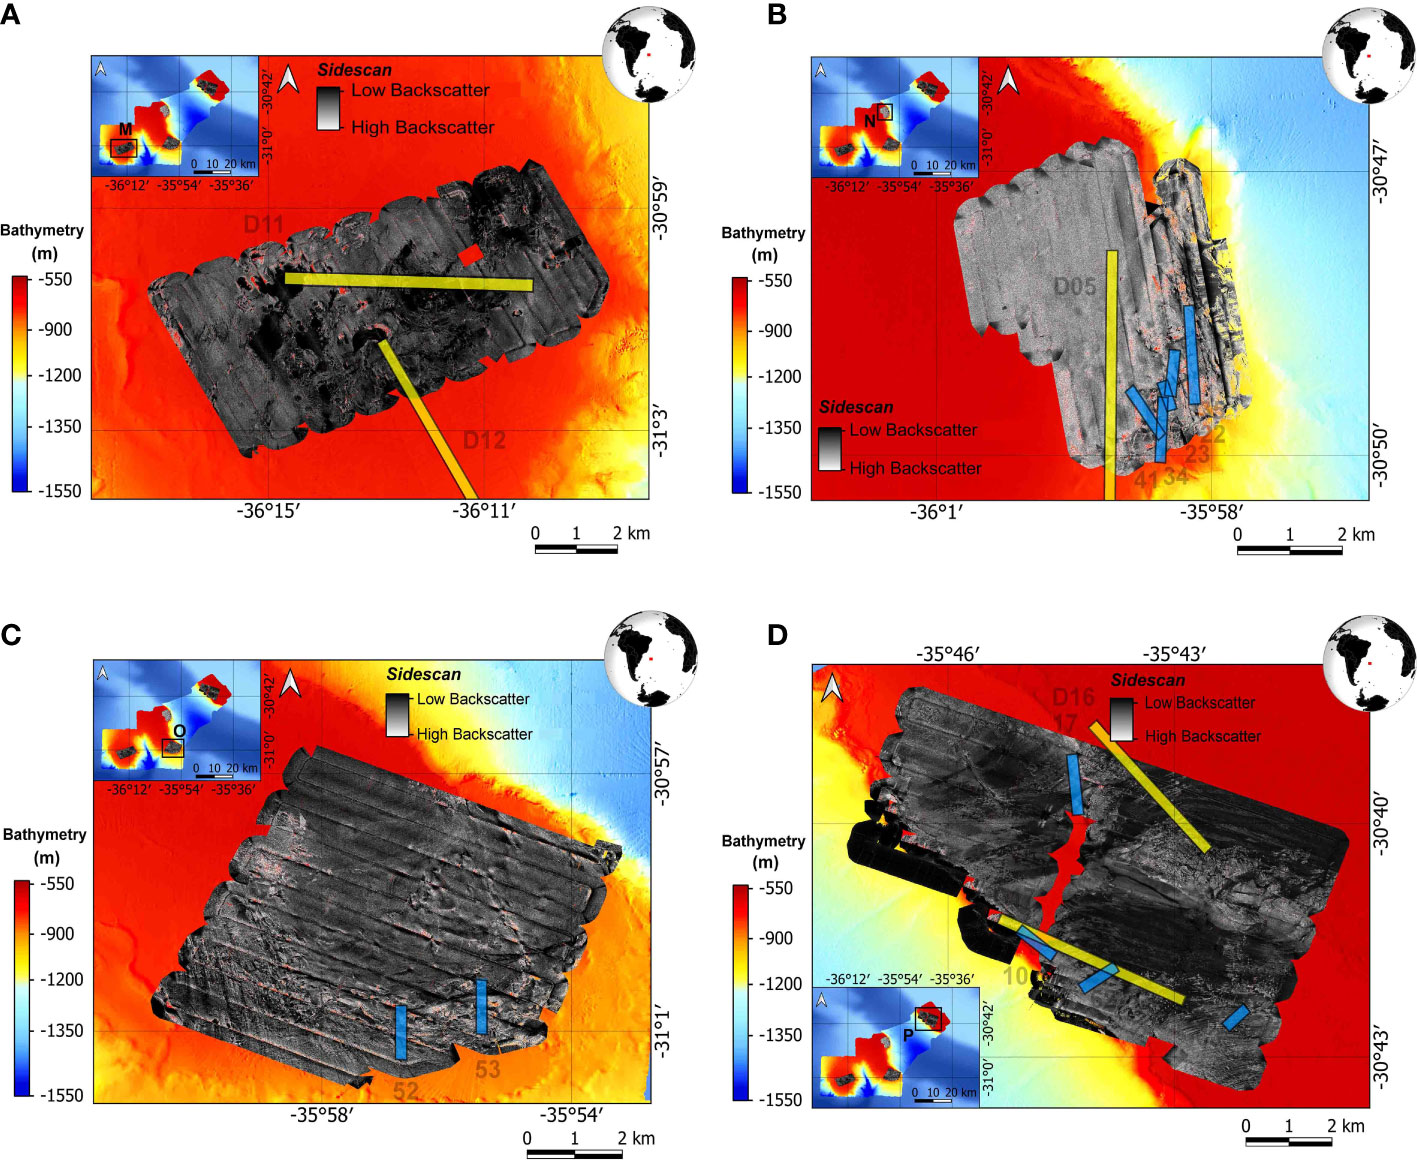
Figure 12 Relief maps obtained through AUV missions with a sidescan sonar, and the dredge operations of the RGR-1 (in yellow) and the DY094 (in blue) cruises: (A) Subarea M with dredges D11 and D12, (B) Subarea N with dredges D05, 22, 23, 34, 35 and 41, (C) Subarea O with dredges 52 e 53, and (D) Subarea P with dredges D16, D17, 10, 17, 62 e 63.
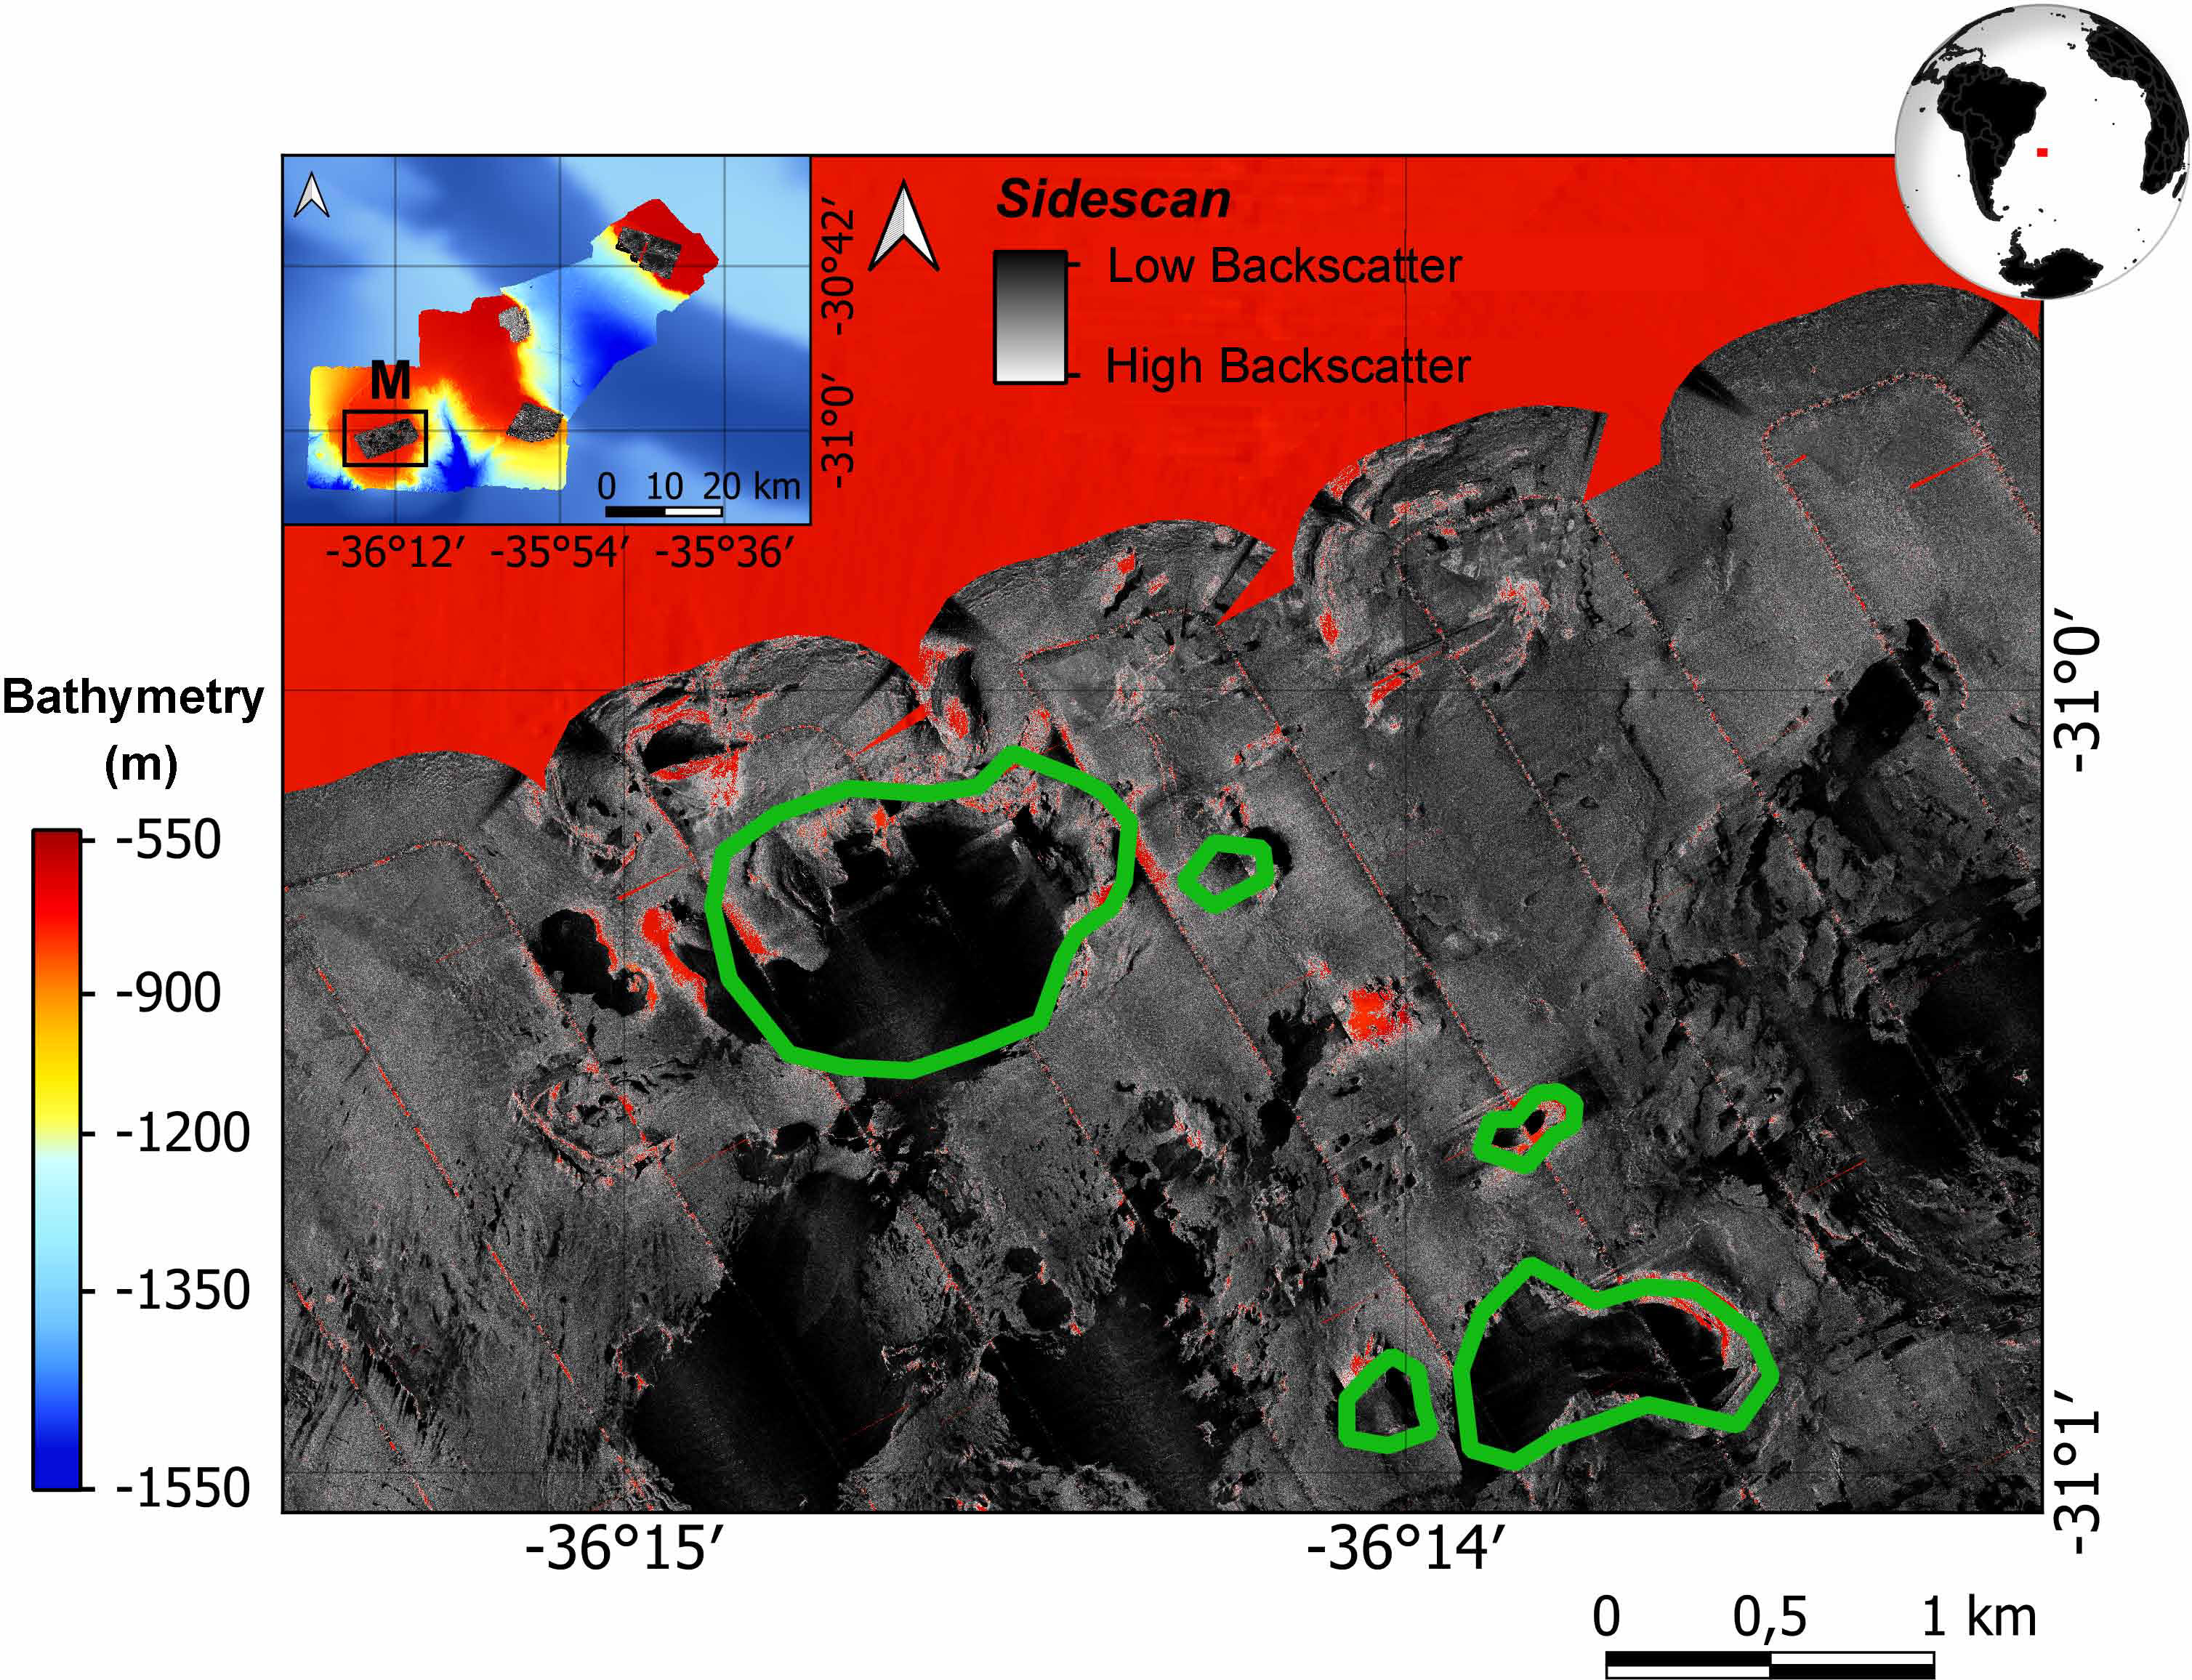
Figure 13 Zoom of the circular structures (shapes produced from the bathymetry) in green coinciding with the depressions (low albedo) found by the sidescan sonar result.
A homogenous albedo shows a hard ground composed of limestone and thin coverage of sediments in Subarea N (Murton et al., 2018). Both basaltic and FeMn crusts were found there in dredges D05, 22, 23, 34, 35, and 41 (Figure 12B), which explains the high backscatter in the area since they were consolidated materials.
The dredge samples 52 and 53 found phosphorite crusts and igneous rocks in Subarea O, a rough terrain shown on the slope (Figure 7). These materials explain the high backscatter in that area. The samples also agree with the hard ground composed of limestone and thin layers of FeMn crusts, as reported by Murton et al., 2018 (Figure 12C).
Finally, the Subarea P displayed lava, massive, fractured rocks hosting thin FeMn crusts, and arcs of sediments over the hard limestone ground (Murton et al., 2018). This result agrees with FeMn and phosphorite crusts in the rough terrain found by the D16, D17, 10, 62, and 63 dredges (Figure 12D). Basaltic rocks also appeared in the D16, D17, 10, 17, and 63 dredges. Both basalt and crusts can explain the high albedo, whereas the low albedo represents the thin sediments in the region.
5 Conclusions
A high negative amplitude anomaly in the southwest region of area A1 depicts a major remanent component, highlighted by an AS3D peak and a negative RTP anomaly. The residual magnetic anomaly results already indicated a reverse polarization in that local. The same area displayed low backscattering in sidescan sonar data, suggesting a different material than the surrounding area. We could not place the nature of such material based on the dredged material, which samples revealed sediments and sporadic FeMn crusts. Our hypothesis for the origin of the remanent magnetization is a non-outcropping intrusive magnetite-rich body hosting a natural remanent magnetization. Underwater volcanic craters, frequent in rift zones, can indicate the presence of an ancient caldera, the possible source of the reverse anomaly. The frequent geomagnetic field reversions during the mid-Miocene support the strong remanence component seen in the anomaly. The craters can also host unconsolidated sediments, which can justify the low backscattering in the sonar data. Another possibility, although less probable, is the presence of biogenic magnetite (magnetotactic bacteria), recurrent in FeMn nodules, as the source of the reverse anomaly.
In area A2, the survey spacing, and line direction largely influenced the magnetic results. The anomalies displayed an elongated behavior accompanying the survey lines. This signature can partly be attributed to the tectonic framework, with NW-SE faulting that delimits the rift zone. Even considering these artifacts, we could interpret the presence of magnetic remanence in the A2 anomalies, as their RTP resulted in asymmetrical reductions displaced from the source limits defined by the AS3D. The dredge operations at the top of the plateau acquired significantly eroded volcanic rocks and FeMn crusts on the basaltic surface.
The magnetic lineaments follow the rift boundaries, suggesting its association with the Fault Zone, a potential area for magma intrusion. This potential suggests that the AS3D anomalies correspond to possible basaltic rocks intruded using the Fault Zone as a pathway. Therefore, the rift faults could be related to the RGR genesis during the Atlantic Ocean opening process.
The geological and sidescan sonar data constrained the interpretation of the magnetic data. All subareas presented basaltic rocks and FeMn crusts, characterized by high backscatter typical in consolidated material. Soft sedimentation or unconsolidated sediments had a low backscatter signal in the sidescan results.
This work added geological, magnetic, and bathymetry data to the current knowledge about the NCSR. The FeMn crusts produce more evident signatures in bathymetric, sidescan sonar, and geological data. Due to their high magnetic susceptibility, the basaltic rocks produced the magnetic signals in the study area. The distribution pattern of the basaltic rocks concentrates them mainly near the fault zone and rift margin. In contrast, the FeMn crusts scattered at the top of the plateau following the representative model of the surface substrate types suggested by Lisniowski et al. (2019). Still, it is necessary to produce more studies about the RGR dynamic, tectonic, geological history, and composition. An integrative model using geophysical and petrophysical data is imperative to better understand the RGR tectonics, magmatism, stratigraphy, and evolution.
Data availability statement
The raw data supporting the conclusions of this article will be made available by the authors, without undue reservation.
Author contributions
PS: writing, data processing and interpretation. VL: data processing, interpretation and writing. YM: data processing, interpretation and writing. DM: interpretation and writing. LJ: coordination, interpretation and writing. All authors contributed to the article and approved the submitted version.
Funding
This work is developed within the projects: 1) “Marine ferromanganese deposits: a major resource of E-tech elements” (process 2014/50820-7) funded by Fundação de Amparo à Pesquisa no Estado de São Paulo (FAPESP), 2) FAPESP process 2016/24946-9, 3) Universidade de São Paulo through the Edital de Apoio a Projetos Integrados de Pesquisa em Áreas Estratégicas, PIPAE (2021.1.10424.1.9) and 4) “Estudo Multidisciplinar de Novos Minerais Estratégicos e Avaliação de Risco da Mineração na Elevação de Rio Grande (Atlântico Sul) – e-MERG”, Ref. Finep nº 0013/21.
Conflict of interest
The authors declare that the research was conducted in the absence of any commercial or financial relationships that could be construed as a potential conflict of interest.
Publisher’s note
All claims expressed in this article are solely those of the authors and do not necessarily represent those of their affiliated organizations, or those of the publisher, the editors and the reviewers. Any product that may be evaluated in this article, or claim that may be made by its manufacturer, is not guaranteed or endorsed by the publisher.
References
Audet P., Mareschal J. C. (2007). Wavelet analysis of the coherence between bouguer gravity and topography: Application to the elastic thickness anisotropy in the Canadian shield. Geophys. J. Int. 168 (1), 287–298. doi: 10.1111/j.1365-246X.2006.03231.x
Baranov V. (1957). A new method for interpretation of aeromagnetic maps: Pseudo-gravimetric anomalies. Geophysics 22 (2), 359–382. doi: 10.1190/1.1438369
Benites M., Hein J. R., Mizell K., Blackburn T., Jovane L. (2020). Genesis and evolution of ferromanganese crusts from the summit of Rio grande rise, southwest Atlantic ocean. Minerals 10 (4), 349. doi: 10.3390/min10040349
Benites M., Hein J. R., Mizell K., Farley K. A., Treffkorn J., Jovane L. (2022). Geochemical insights into formation of enigmatic ironstones from Rio grande rise, south Atlantic ocean. Mar. Geol. 444, 106716. doi: 10.1016/j.margeo.2021.106716
Benites M., Hein J. R., Mizell K., Jovane L. (2021). Miocene Phosphatization of rocks from the summit of Rio grande rise, southwest Atlantic ocean. Paleoceanogr. Paleoclimatol. 36 (9), e2020PA004197. doi: 10.1029/2020PA004197
Blakely R. J. (1996). Potential theory in gravity and magnetic applications (Cambridge: Cambridge University Press).
Constantino R. R., Hackspacher P. C., De Souza I. A., Costa I. S. L. (2017). Basement structures over Rio grande rise from gravity inversion. J. South Am. Earth Sci. 75, 85–91. doi: 10.1016/j.jsames.2017.02.005
Detrick R. S., Sclater J., Thiede J. (1977). The subsidence of aseismic ridges. Earth Planetary Sci. Lett. 34 (2), 185–196. doi: 10.1016/0012-821X(77)90003-6
Dietz R. S., Holden J. C. (1970). Reconstruction of pangaea: Breakup and dispersion of continents, permian to present. J. Geophys. Res. 75 (26), 4939–4956. doi: 10.1029/JB075i026p04939
Dong Y., Li J., Zhang W., Zhang W., Zhao Y., Xiao T., et al. (2016). The detection of magnetotactic bacteria in deep sea sediments from the East pacific manganese nodule province. Environ. Microbiol. Rep. 8 (2), 239–249. doi: 10.1111/1758-2229.12374
Galvão I. L. G., De Castro D. L. (2017). Contribution of global potential field data to the tectonic reconstruction of the Rio grande rise in the south Atlantic. Mar. Petroleum Geol. 86, 932–949. doi: 10.1016/j.marpetgeo.2017.06.048
Gamboa L. A. P., Rabinowitz P. D. (1984). The evolution of the Rio grande rise in the southwest Atlantic ocean. Mar. Geol. 58 (1–2), 35–58. doi: 10.1016/0025-3227(84)90115-4
GEBCO Compilation Group (2020). GEBCO 2020 grid. Monaco: International Hydrographic Organization. doi: 10.5285/a29c5465-b138-234d-e053-6c86abc040b9
Graça M., Stanton N., Kusznir N. (2018). Crustal structure and composition of the Rio grande rise, south Atlantic, from potential field analyses. Abstract retrieved from EGU General Assembly (Vienna: European Geological Union), 1194.
Grant F. S., Dodds J. (1972). MAGMAP FFT processing system development notes (Toronto: Paterson Grant and Watson Limited).
Hassan M. B., Rodelli D., Benites M., Abreu F., Murton B., Jovane L. (2020). Presence of biogenic magnetite in ferromanganese nodules. Environ. Microbiol. Rep. 12 (3), 288–295. doi: 10.1111/1758-2229.12831
Hein J. R., Koschinsky A. (2014). Deep-ocean ferromanganese crusts and nodules. Earth Syst. Environ. Science Treatise Geochem. 13 (2), 273–291. doi: 10.1016/B978-0-08-095975-7.01111-6
Hein J. R., Koschinsky A., Halliday A. N. (2003). Global occurrence of tellurium-rich ferromanganese crusts and a model for the enrichment of tellurium. Geochimica Cosmochimica Acta 67, 1117–1127. doi: 10.1016/S0016-7037(02)01279-6
Jovane L., Hein J. R., Yeo I. A., Benites M., Bergo N. M., Correa P. V. F., et al. (2019). Multidisciplinary scientific cruise to the Rio grande rise. Front. Mar. Sci. 6. doi: 10.3389/fmars.2019.00252
Kaji A. O., Guerra J. V., Fernandes A. M., De Oliveira R. F., Silva C. G., Dos Reis A. T. (2011). Potencial de transporte sedimentar pelas correntes de fundo na região do canal de vema (Atlântico sul). Rev. Bras. Geofísica 29 (2), 385–400. doi: 10.1590/S0102-261X2011000200013
Kumar N. (1979). Origin of “paired” aseismic rises: Ceará and Sierra Leone rises in the equatorial, and the Rio grande rise and Walvis ridge in the south Atlantic. Mar. Geol. 30 (3–4), 175–191. doi: 10.1016/0025-3227(79)90014-8
Lisniowski M. A., Neto C. C. M., Harlamov V., Lopes V. H. R., Frazão E. P., Neto A. A. (2019). Multibeam and video data applied to seabed mapping in the Rio grande rise, SW Atlantic. Abstract retrieved from the GEOHAB Marine Geological Biological Habitat Mapping Conference Abstracts (Eastsound, WA: GeoHab - Marine Geological and Biological Habitat Mapping), Vol. 1. 125–126.
Melo F. F., Barbosa V. C. (2019). Reduction to the pole in Fourier domain–good and bad filtering of real data in Brazil. Abstract retrieved from the 16th International Congress of the Brazilian Geophysical Society (Rio de Janeiro: Brazilian Geophysical Society). doi: 10.22564/16cisbgf2019.240
Miller H. G., Singh V. (1994). Potential field tilt–a new concept for location of potential field sources. J. Appl. geophys. 32 (2–3), 213–217. doi: 10.1016/0926-9851(94)90022-1
Mohriak W. U., Nóbrega M., Odegard M. E., Gomes B. S., Dickson W. G. (2010). Geological and geophysical interpretation of the Rio grande rise, south-eastern Brazilian margin: Extensional tectonics and rifting of continental and oceanic crusts. Petroleum Geosci. 16, 231–245. doi: 10.1144/1354-079309-910
Montserrat F., Guilhon M., Corrêa P. V. F., Bergo N. M., Signori C. N., Tura P. M., et al. (2019). Deep-sea mining on the Rio grande rise (Southwestern atlantic): A review on environmental baseline, ecosystem services and potential impacts. Deep Sea Res. Part I: Oceanogr. Res. Pap. 145, 31–58. doi: 10.1016/j.dsr.2018.12.007
Morgan W. J. (1971). Convection plumes in the lower mantle. Nature 230 (5288), 42–43. doi: 10.1038/230042a0
Murton B. J.. (2018). Cruise report DY094: Rio grande rise. 2018. MarineE-tech project (Centre, Southampton, UK: National Oceanography). Available at: https://www.bodc.ac.uk/resources/inventories/cruise_inventory/reports/dy094.pdf.
Nabighian M. N. (1972). The analytic signal of two-dimensional magnetic bodies with polygonal crosssection: its properties and use for automated anomaly interpretation. Geophysics 37 (3), 507–517. doi: 10.1190/1.1440276
O’Connor J. M., Duncan R. A. (1990). Evolution of the Walvis ridge-Rio grande rise hot spot system: Implications for African and south American plate motions over plumes. J. Geophys. Res.: Solid Earth 95 (B11), 17475–17502. doi: 10.1029/JB095iB11p17475
Praxedes A. G. P., de Castro D. L., Torres L. C., Gambôa L. A. P., Hackspacher P. C. (2019). New insights of the tectonic and sedimentary evolution of the Rio grande rise, south Atlantic ocean. Mar. Petroleum Geol. 110, 335–346. doi: 10.1016/j.marpetgeo.2019.07.035
Roest W. R., Verhoef J., Pilkington M. (1992). Magnetic interpretation using the 3-d analytic signal. Geophysics 57 (1), 116–125. doi: 10.1190/1.1443174
Sager W. W., Thoram S., Engfer D. W., Koppers A. A., Class C. (2021). Late Cretaceous ridge reorganization, microplate formation, and the evolution of the Rio grande rise–Walvis ridge hot spot twins, south Atlantic ocean. Geochem. Geophys. Geosyst. 22 (3), e2020GC009390. doi: 10.1029/2020GC009390
Smith W. H., Sandwell D. T. (1997). Global sea floor topography from satellite altimetry and ship depth soundings. Science 277 (5334), 1956–1962. doi: 10.1126/science.277.5334.1956
Telford W. M., Geldart L. P., Sheriff R. E. (1990). Applied geophysics (Cambridge: Cambridge University Press), 62–75. doi: 10.1017/CBO9781139167932
Ussami N., Chaves C. A. M., Marques L. S., Ernesto M. (2013). Origin of the Rio grande rise–Walvis ridge reviewed integrating palaeogeographic reconstruction, isotope geochemistry and flexural modelling Vol. 369 (London: Geological Society, London, Special Publications), 129–146. doi: 10.1144/SP369.10
Keywords: Rio Grande Rise, ferromanganese crusts, geophysical methods, volcanic rocks, South Atlantic Ocean
Citation: Sergipe PP, Louro V, Marangoni YR, de Moura DS and Jovane L (2023) A study of volcanic rocks and ferromanganese crusts through marine geophysical methods integration in the north portion of Cruzeiro do Sul Rift in the Rio Grande Rise. Front. Mar. Sci. 10:1093108. doi: 10.3389/fmars.2023.1093108
Received: 09 November 2022; Accepted: 15 February 2023;
Published: 27 February 2023.
Edited by:
David Lopes De Castro, Universidade Federal do Rio Grande do Norte, BrazilReviewed by:
Yatheesh Vadakkeyakath, Council of Scientific and Industrial Research (CSIR), IndiaPolina Lemenkova, Université libre de Bruxelles, Belgium
Copyright © 2023 Sergipe, Louro, Marangoni, de Moura and Jovane. This is an open-access article distributed under the terms of the Creative Commons Attribution License (CC BY). The use, distribution or reproduction in other forums is permitted, provided the original author(s) and the copyright owner(s) are credited and that the original publication in this journal is cited, in accordance with accepted academic practice. No use, distribution or reproduction is permitted which does not comply with these terms.
*Correspondence: Luigi Jovane, am92YW5lQHVzcC5icg==