 Sornsiri Phongphattarawat1,2*
 Heather A. Bouman1
 Michael W. Lomas3
 Shubha Sathyendranath4
 Glen A. Tarran4
 Osvaldo Ulloa5,6
 Mikhail V. Zubkov7
- 1Department of Earth Sciences, University of Oxford, Oxford, United Kingdom
- 2Faculty of Technology and Environment, Prince of Songkla University, Phuket, Thailand
- 3Bigelow Laboratory for Ocean Sciences, East Boothbay, ME, United States
- 4Plymouth Marine Laboratory, Plymouth, United Kingdom
- 5Department of Oceanography, University of Concepción, Concepción, Chile
- 6Millenium Institute of Oceanography, Concepción, Chile
- 7Scottish Association for Marine Science, Oban, United Kingdom
Information on the intracellular content and functional diversity of phytoplankton pigments can provide valuable insight on the ecophysiological state of primary producers and the flow of energy within aquatic ecosystems. Combined global datasets of analytical flow cytometry (AFC) cell counts and High-Performance Liquid Chromatography (HPLC) pigment concentrations were used to examine vertical and seasonal variability in the ratios of phytoplankton pigments in relation to indices of cellular photoacclimation. Across all open ocean datasets, the weight-to-weight ratio of photoprotective to photosynthetic pigments showed a strong depth dependence that tracked the vertical decline in the relative availability of light. The Bermuda Atlantic Time-series Study (BATS) dataset revealed a general increase in surface values of the relative concentrations of photoprotective carotenoids from the winter-spring phytoplankton communities dominated by low-light acclimated eukaryotic microalgae to the summer and early autumn communities dominated by high-light acclimated picocyanobacteria. In Prochlorococcus-dominated waters, the vertical decline in the relative contribution of photoprotective pigments to total pigment concentration could be attributed in large part to changes in the cellular content of photosynthetic pigments (PSP) rather than photoprotective pigments (PPP), as evidenced by a depth-dependent increase of the intracellular concentration of the divinyl chlorophyll-a (DVChl-a) whilst the intracellular concentration of the PPP zeaxanthin remained relatively uniform with depth. The ability of Prochlorococcus cells to adjust their DVChl-a cell-1 over a large gradient in light intensity was reflected in more highly variable estimates of carbon-to-Chl-a ratio compared to those reported for other phytoplankton groups. This cellular property is likely the combined result of photoacclimatory changes at the cellular level and a shift in dominant ecotypes. Developing a mechanistic understanding of sources of variability in pigmentation of picocyanobacteria is critical if the pigment markers and bio-optical properties of these cells are to be used to map their biogeography and serve as indicators of photoacclimatory state of subtropical phytoplankton communities more broadly. It would also allow better assessment of effects on, and adaptability of phytoplankton communities in the tropical/subtropical ocean due to climate change.
1 Introduction
Picophytoplankton (cell diameter< 2-3 μm) are the dominant primary producers in the largest biomes on Earth - the subtropical/tropical gyres. It has been estimated that marine picophytoplankton account for ~30% of global phytoplankton carbon biomass (~1 Pg C) (Le Quéré et al., 2005; Buitenhuis et al., 2012), and at least 10% of global net primary production (Visintini et al., 2021). As their oligotrophic habitats are expanding, presumably as a result of global warming (Polovina et al., 2008), it is anticipated there will be an overall shift in the size and community structure of marine phytoplankton. Highly-stratified oligotrophic waters have been shown to favour a dominance of picocyanobacteria, whereas in more dynamic, nutrient-replete environments photosynthetic picoeukaryotes tend to outcompete their cyanobacterial counterparts (Bouman et al., 2011).
Picophytoplankton also differ markedly in their vertical distribution: while Synechococcus often occupies the upper lit layer, Prochlorococcus and picoeukaryotes can be found throughout the euphotic zone in stratified oligotrophic waters (Claustre and Marty, 1995; Partensky et al., 1996; Hickman et al., 2010). The ability of Prochlorococcus to grow at the base of the euphotic zone has been ascribed to high light absorption efficiency resulting from its minute cell size and high concentrations of accessory pigments, in particular divinyl chlorophyll-b (DVChl-b), allowing the cells to harvest extremely low levels of blue light at depth (Moore et al., 1995; Barrera-Rojas et al., 2018). The co-existence of high light (HL) and low light-adapted (LL) ecotypes with variable ratios of DVChl-b to divinyl chlorophyll-a (DVChl-a) (Moore et al., 1998) can also explain the extremely large depth distribution of this genus (Campbell et al., 1994; Hickman et al., 2010). Furthermore, accessory chlorophyll-b and c and a variety of photosynthetic carotenoids with distinct light absorptive properties enable picoeukaryotes to exploit a broad range of light conditions and ensure an efficient harvesting of photons deep within the euphotic zone. The dominance of picoeukaryotes at depth is also linked to their ability to assimilate newly upwelled nitrogen (Claustre and Marty, 1995; Fawcett et al., 2011). In contrast, many strains of Synechococcus contain photosynthetic apparatuses rich in phycoerythrin and phycoerythrobilin which allow them to utilize orange-green photons abundant particularly near the surface of mesotrophic waters (Grébert et al., 2018) where blue light is strongly attenuated due to the presence of dissolved and particulate organic materials, including algal cells.
To derive information on the distribution, taxonomic composition, and productivity of picophytoplankton over larger spatio-temporal scales, various empirical models exploiting satellite observations of ocean color have been proposed (Hirata et al., 2008; Lange et al., 2018). In open ocean waters, variability in sea-surface reflectance is driven primarily by light absorption by phytoplankton pigments, and thus any factors that cause variability in phytoplankton pigment composition within phytoplankton groups could hinder our ability to use pigment data to infer changes in community structure. Moreover, variation in the intracellular composition of light-harvesting pigments induced by changes in environmental forcing, such as the strength of irradiance incident on the sea surface and the intensity of vertical mixing (Dusenberry et al., 1999), would complicate the conversion of pigment biomass measured by remote sensing into phytoplankton carbon (Karl, 1999) and the detection of shifts in community structure using ocean color sensors (Dutkiewicz et al., 2019).
Photoprotective pigments (PPP) have been shown to play an important role in governing the regional- and basin-scale variability in light absorptive properties of phytoplankton in the surface ocean (Babin et al., 1996; Bouman et al., 2000; Letelier et al., 2017). Variation in PPPs is closely linked with the taxonomic structure of phytoplankton communities: the PPP zeaxanthin associated with picocyanobacteria can contribute to a significant fraction of total pigment concentration in warmer, oligotrophic waters (Gieskes et al., 1988; Babin et al., 1996; Bouman et al., 2000), whereas in temperate and polar regions, PPP associated with eukaryotic cells (diadinoxanthin and diatoxanthin) tend to be more important (Johnsen et al., 2018). Within a biogeochemical province, fractional contributions of phytoplankton pigments, including PPPs, could also vary as cells physiologically respond to seasonal and/or vertical variation in available light (Uitz et al., 2008) and such light-dependent changes in pigment composition have been widely observed in cultures (Kulk et al., 2011; Stawiarski et al., 2018). Knowledge of how both photosynthetic and photoprotective pigments vary in the ocean and their relationship to dominant phytoplankton taxa is essential if we are to utilize the distribution of pigment markers and their associated bio-optical signatures to infer the flow of energy through marine ecosystems and to detect major phytoplankton groups.
Following from the points raised above, the first part of this study takes a community-level view of how variations in both the taxonomic composition and photoacclimatory status of phytoplankton influence the relative abundance of PPPs observed across various marine ecosystems both spatially and seasonally. By combining in situ pigment data and flow cytometric measurements of cell abundance, the second part of this study focuses on the photoacclimatory properties of picocyanobacterial populations. We exploit the unique divinyl chlorophylls of Prochlorococcus to examine how the intracellular pigment concentrations of this globally significant genus varies across the oligotrophic open ocean. By converting cell abundances obtained by flow cytometry to carbon biomass using published carbon conversion factors, we estimate the carbon-to-(DV)Chl-a ratio of Prochlorococcus (θPro), and compare these values with those obtained from both bulk estimates of POC : Chl-a obtained in field measurements and from laboratory cultures. Our estimates of θPro are then compared to published values of other picophytoplankton groups to determine whether the pigment-based responses of this model cyanobacterium can serve as an indicator of the photoacclimatory status of open-ocean phytoplankton communities in general.
2 Methods
2.1 Data
Pigment concentrations and cell abundance data used in this study were compiled from measurements carried out during oceanographic campaigns that focused primarily on the tropical and subtropical waters of the Atlantic and Pacific basins (Table 1 and Figure 1). Seawater samples were collected using a conductivity-temperature-depth (CTD) profiler equipped with a rosette of Niskin bottles. Further details on sampling strategies for individual oceanographic datasets can be found in the references provided in Table 1.
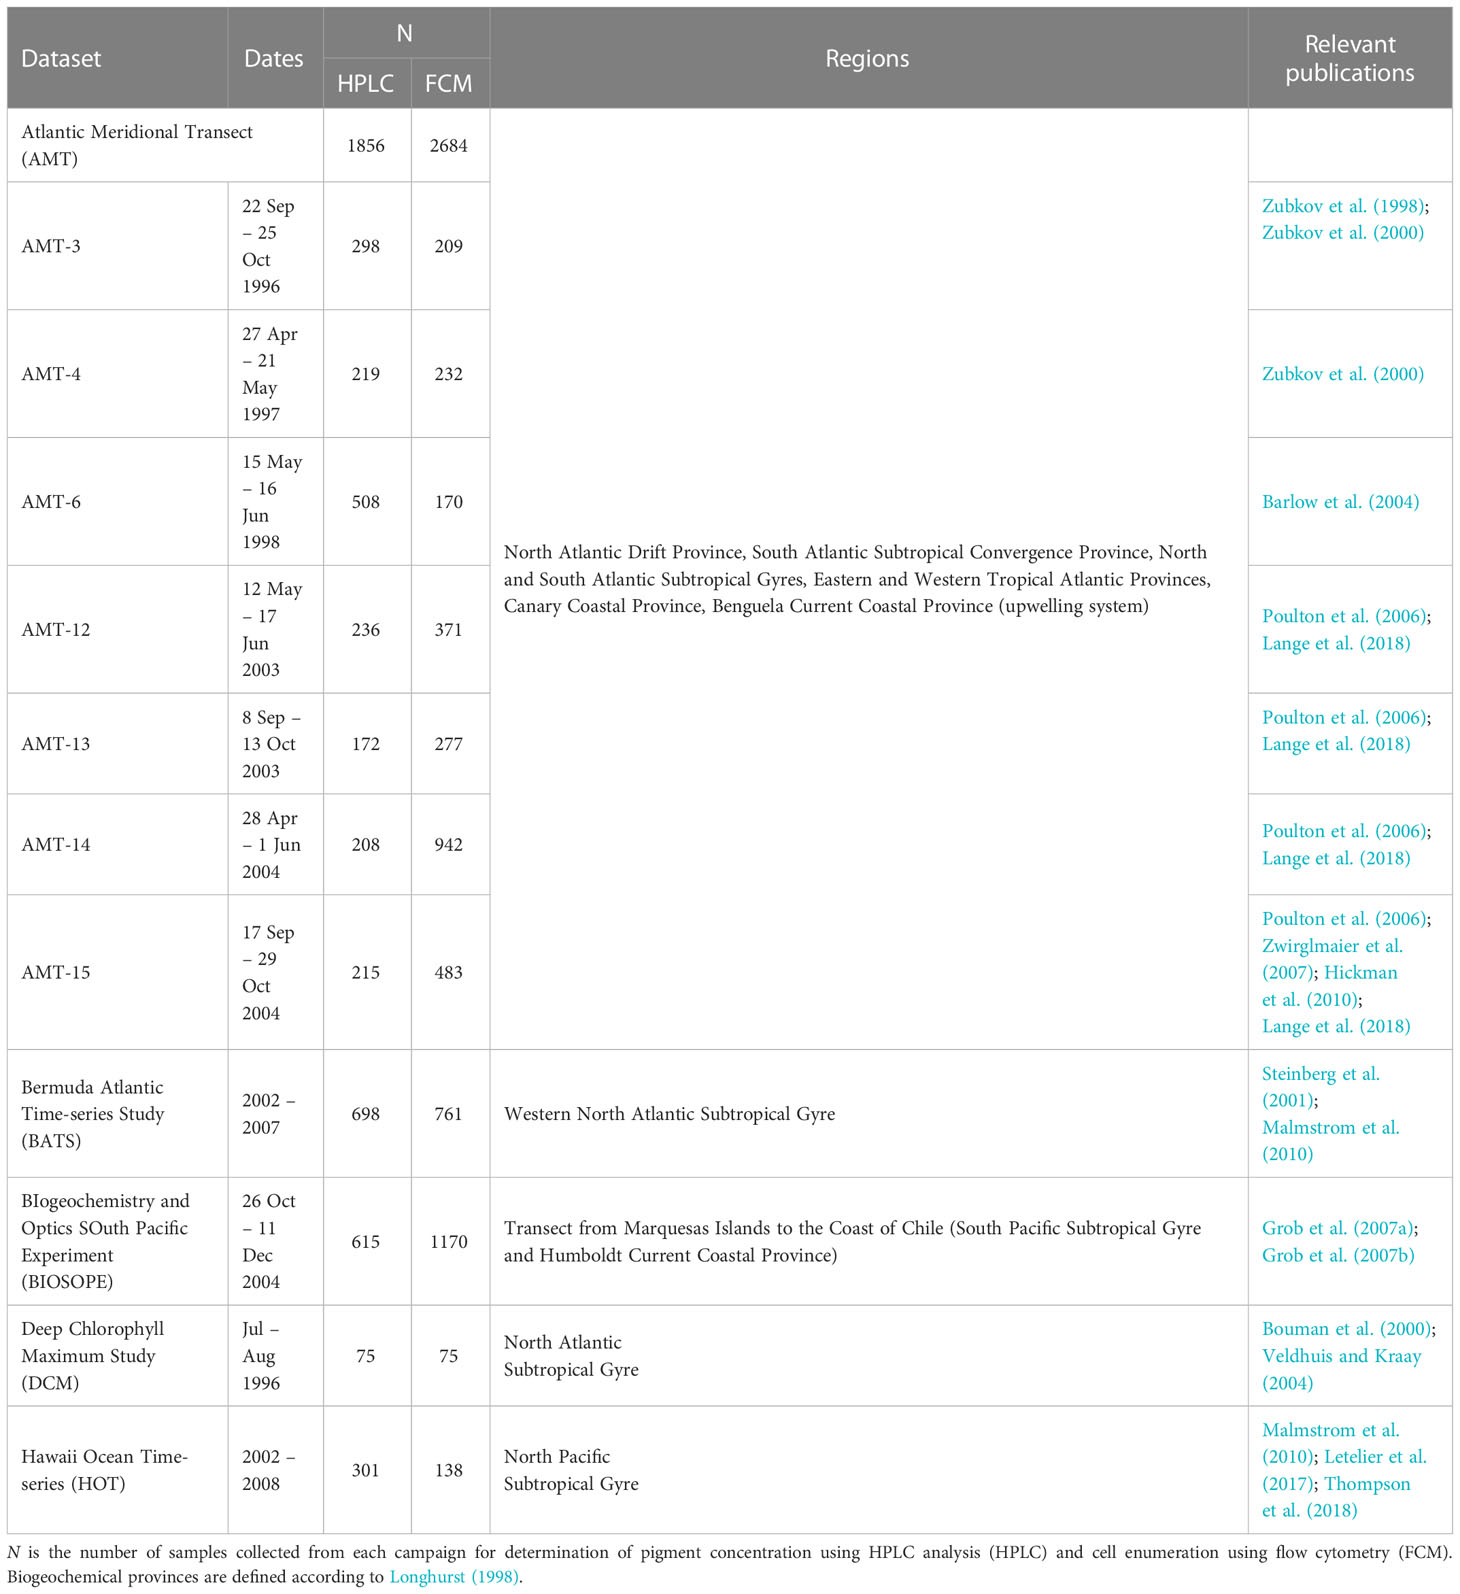
Table 1 Summary of oceanographic campaigns included in the database.
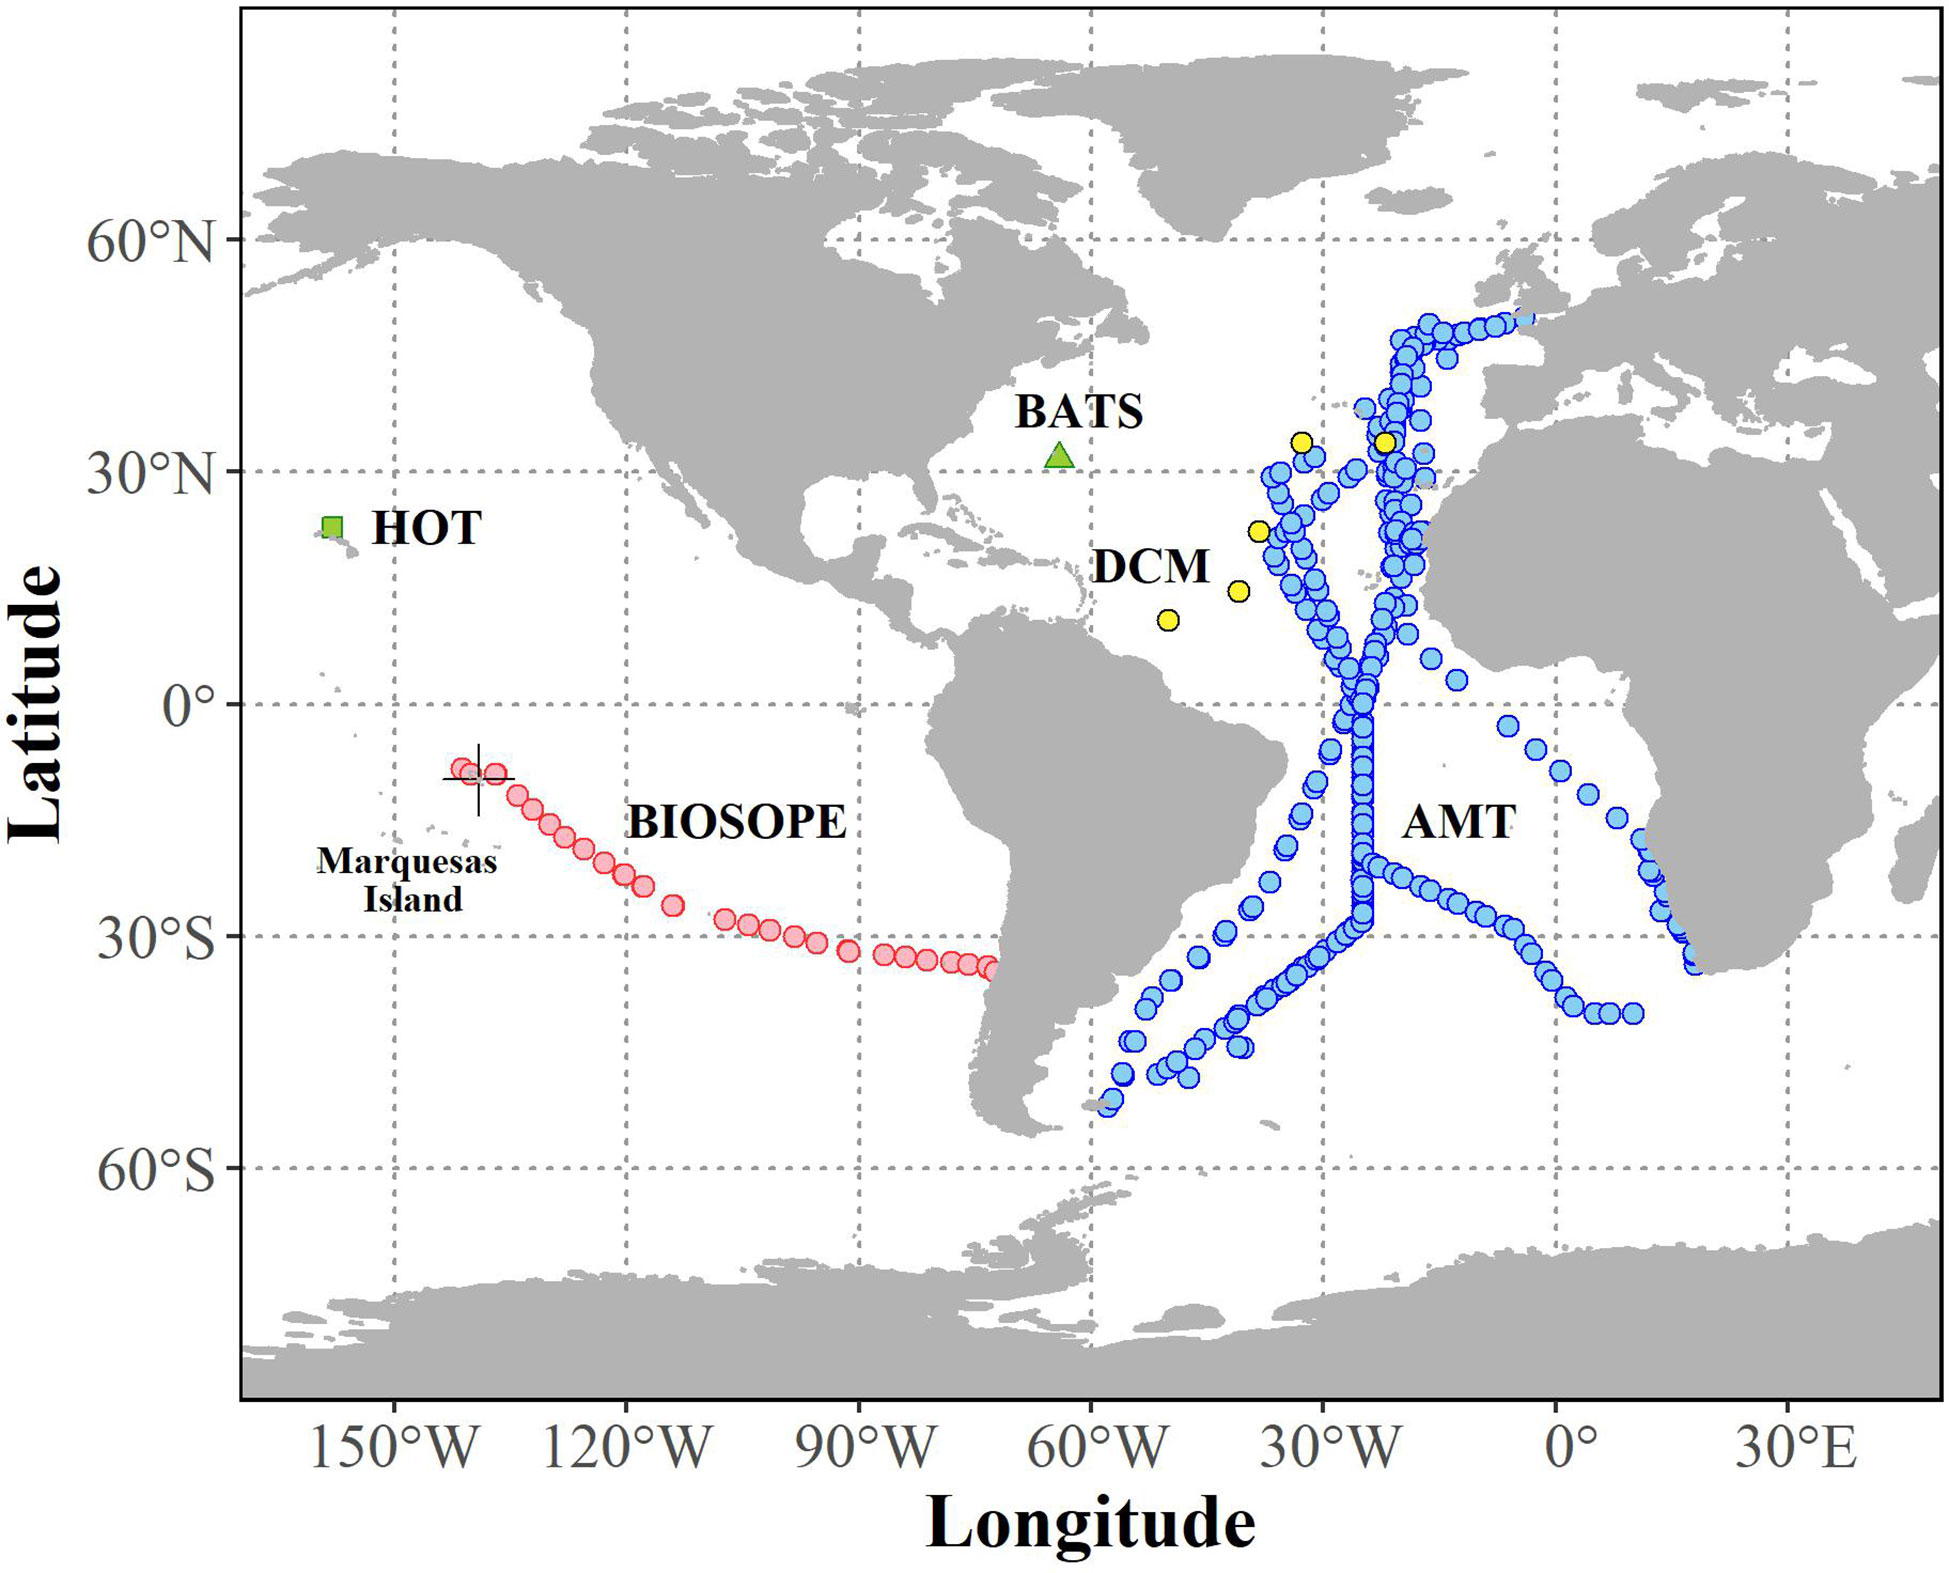
Figure 1 Map showing the distribution of oceanographic datasets of simultaneous measurements of phytoplankton pigment and picocyanobacteria abundance that passed quality assurance (N = 1,934).
2.2 Phytoplankton pigment analysis
Phytoplankton pigments were identified and quantified using High-Performance Liquid Chromatography (HPLC). For each of the datasets, the filtration volumes, organic solvents used for pigment extraction, and corresponding references are summarized in Table 2. Note that DVChl-a and DVChl-b, pigment markers unique to Prochlorococcus, are not available for the Bermuda Atlantic Time-series Study (BATS) as the HPLC method employed did not allow for these pigments to be completely separated from their monovinyl derivatives (Steinberg et al., 2001). A quality check on the HPLC-determined pigment data was conducted using linear regressions (model I) of total accessory pigment concentration on total chlorophyll-a concentration (monovinyl + divinyl Chl-a; TChl-a) (Trees et al., 2000). Outliers with estimated standard deviations greater than 3 in absolute value (Uitz et al., 2006) were removed (final slope = 0.82, R2 = 0.90), reducing the pigment database to 2,960 observations, which was 83% of the original data.
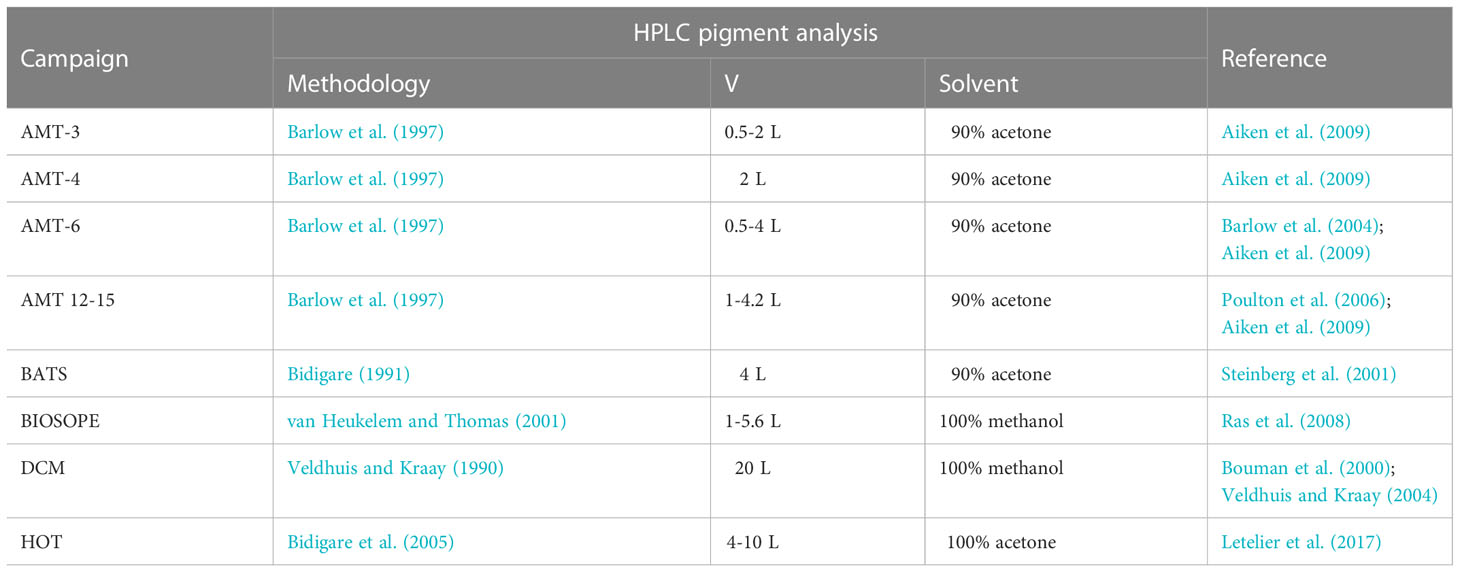
Table 2 Summary of the filtration volume (V), organic solvent used for pigment extraction, and reference for each method used for HPLC pigment analysis for each oceanographic campaign.
2.3 Estimation of picocyanobacteria abundance
Cell counts of the picocyanobacteria Prochlorococcus and Synechococcus were determined by Analytical Flow Cytometry (AFC) on either freshly collected or preserved samples. Synechococcus populations were identified from the orange fluorescence emitted by their characteristic phycoerythrin pigment-protein complex (Moore et al., 1995), and Prochlorococcus populations were distinguished based on their red fluorescence associated with DVChl-a and right-angle light scattering properties (Zubkov et al., 1998). However, Prochlorococcus cells collected from the surface layer of the subtropical gyres typically contain a very low concentration of DVChl-a, which makes it difficult to enumerate the cells accurately using their natural fluorescence signal (Zubkov et al., 1998; Grob et al., 2007a). Therefore, alternative approaches have been developed at different laboratories to estimate the abundance of surface Prochlorococcus populations that are weakly fluorescent as summarized below.
For the BIOSOPE project, Grob et al. (2007a); Grob et al. (2007b) determined the concentration of Prochlorococcus cells with low fluorescence by using the software Cytowin to fit a normal curve to the signal distribution plot. In cases where the fluorescence signal was too dim, the cell number was derived from the pigment DVChl-a assuming an average cell-specific concentration 0.23 fg DVChl-a cell-1 which was intracellular pigment concentration collected within the surface layer above the 5% level of the incident light and corresponded to the lowest possible values reported in Blanchot and Rodier (1996) and Partensky et al. (1999) for surface, HL Prochlorococcus populations. The BIOSOPE samples with Prochlorococcus cell abundances indirectly estimated from DVChl-a (N = 23) were included in our analyses, and they appeared to agree well with the general trends observed for other datasets.
For the AMT (Zubkov et al., 1998; Hartmann et al., 2014; Lange et al., 2018) and DCM datasets (Veldhuis and Kraay, 2004), Prochlorococcus in surface water samples were DNA-stained with fluorescent dyes, such as TOTO-1 (Zubkov et al., 1998), or SYBR Green (Hartmann et al., 2014), or PicoGreen (Veldhuis and Kraay, 2004), prior to analysis by flow cytometry. The staining technique allows for better visualization of the dim Prochlorococcus cells based on the green fluorescence originating from the DNA-binding dyes in addition to their chlorophyll (red) fluorescence and scattering signals.
Flow cytometric measurements for the HOT program between 1990 and 2005, which corresponds to the period when most of the HOT data used in this study were collected, were carried out using a flow cytometer fitted with a 1-W 488-nm laser as described in Campbell and Vaulot (1993). However, the authors noted that the flow cytometer configuration often failed to detect surface populations of Prochlorococcus. Thus, under these circumstances, a laser that generates an excitation beam in the range 457-515 nm was used instead (Olson et al., 1990) so that the excitation energy more closely matches the absorption bands of the DVChl-a and DVChl-b (Olson et al., 1990). This flow cytometer set-up was also optimized to increase the sensitivity of the instrument to detect surface assemblages of Prochlorococcus at the BATS station (DuRand et al., 2001).
2.4 Computation of mixed-layer and euphotic depths
For each of the datasets, the depth of the mixed layer (zm) was calculated from vertical profiles of the potential density (σθ) [kg m-3] obtained from online data repositories. When the online information of σθ was not readily available, the σθ was calculated from temperature and salinity profiles using the ‘swSigmaTheta’ function in the R statistical package ‘oce’ (Kelly, 2018). The zm was defined as the depth at which the σθ was offset from the near surface (10 m) reference value by a threshold value of 0.125 kg m-3 (Bouman et al., 2006).
The euphotic depth (ze) is often considered as the maximum depth in the water column where phytoplankton photosynthesis takes place, and typically corresponds to the depth at which the downwelling irradiance of photosynthetically-available radiation (PAR) decrease to 1% of its surface value (Kirk, 2011). Assuming that the spectrally non-resolved vertical attenuation coefficient for PAR, Kd (PAR) [m-1], is constant with depth, the ze can be estimated from Kd (PAR) using the relation (Kirk, 2011):
Kd (PAR) was converted from the attenuation coefficient at 490 nm, Kd (490) [m-1], using the relationship reported in Morel et al. (2007) for open-ocean (Case I) waters:
The Kd (490) was calculated from TChl-a based on an empirical relationship derived by Morel and Maritorena (2001):
where Kw (490) = 0.0166 m-1 is the attenuation coefficient for pure water at 490 nm, and Chl is the average TChl-a [mg Chl-a m-3] in the mixed layer (Grébert et al., 2018).
Profiles of pigment ratios and intracellular pigment concentrations of picocyanobacteria are presented here as a function of optical depth (the nominal depth divided by the estimated euphotic depth, z/ze). The advantages of using the dimensionless z/ze index rather than nominal depths are twofold. First, it provides an approximation of ambient light conditions at a given depth when in situ vertically-resolved measurements of irradiance were not available (Uitz et al., 2008). Second, as pointed out in Lange et al. (2018), it implicitly carries information about attenuation of light through the water column, which has been shown to be a more effective predictor of long-term changes in phytoplankton pigments and cell abundance in the open ocean than does the instantaneous variation of light intensity expressed in absolute units.
3 Results
3.1 Changes in pigment composition of surface assemblages across contrasting nutrient regimes
Spatial distribution of pigment composition of phytoplankton populations in surface waters across different trophic domains encountered during the BIOSOPE transect in the South Pacific is illustrated in Figure 2. There is a clear relationship between the shoaling of the mixed layer and increased nutrient supply which likely reinforced changes in the relative contribution of PPPs as a result of the combined effect of taxonomic changes and photoacclimation. When we focus on depth-dependent changes in the ratio of PPPs (sum of zeaxanthin (ZEA), diadinoxanthin (DIAD), diatoxanthin (DIAT), violaxanthin (VIOL), alloxanthin (ALLO), and carotenes (CARO)) to the sum of all pigments (referred to in this study as the PPP index) within the oligotrophic samples, we observed a striking systematic increase from productive, upwelling stations to mesotrophic conditions, and to the high-nutrient, low-chlorophyll (HNLC) regions and the (hyper)oligotrophic central gyres (Figure 3A). These trophic-dependent changes that are evident throughout the euphotic zone are likely the result of corresponding shifts in both the photoacclimatory status and the taxonomic composition of phytoplankton communities.
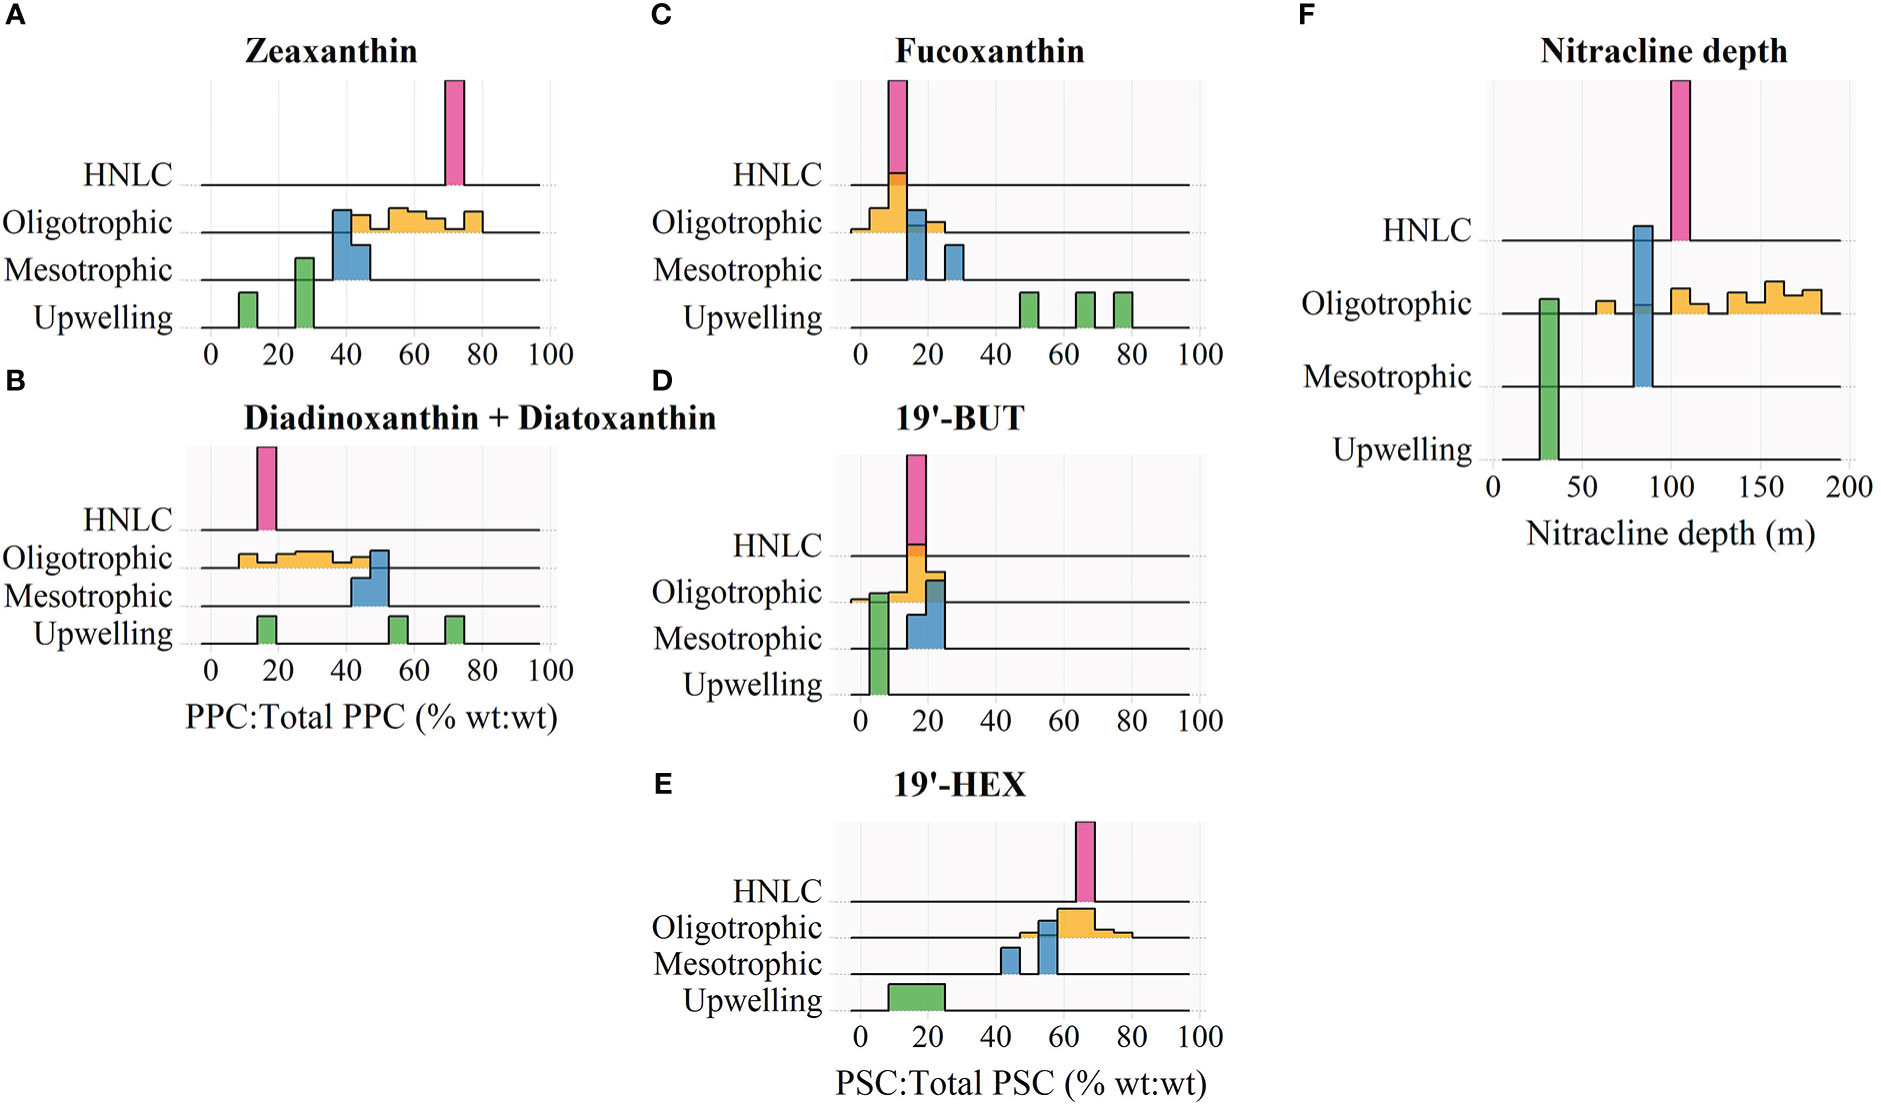
Figure 2 Frequency distributions of the percent contribution of (A) zeaxanthin and (B) diadinoxanthin + diatoxanthin to the total concentration of photoprotective carotenoids (PPC), and the percent contribution of (C) fucoxanthin, (D) 19’-butanoyloxyfucoxanthin (19’-BUT), and (E) 19’-hexanoyloxyfucoxanthin (19’-HEX) to the total concentration of photosynthetic carotenoids (PSC), and (F) the estimated nitracline depth for different trophic domains encountered during the BIOSOPE transect. Pigment contributions were measured in surface waters where z/ze< 0.1.
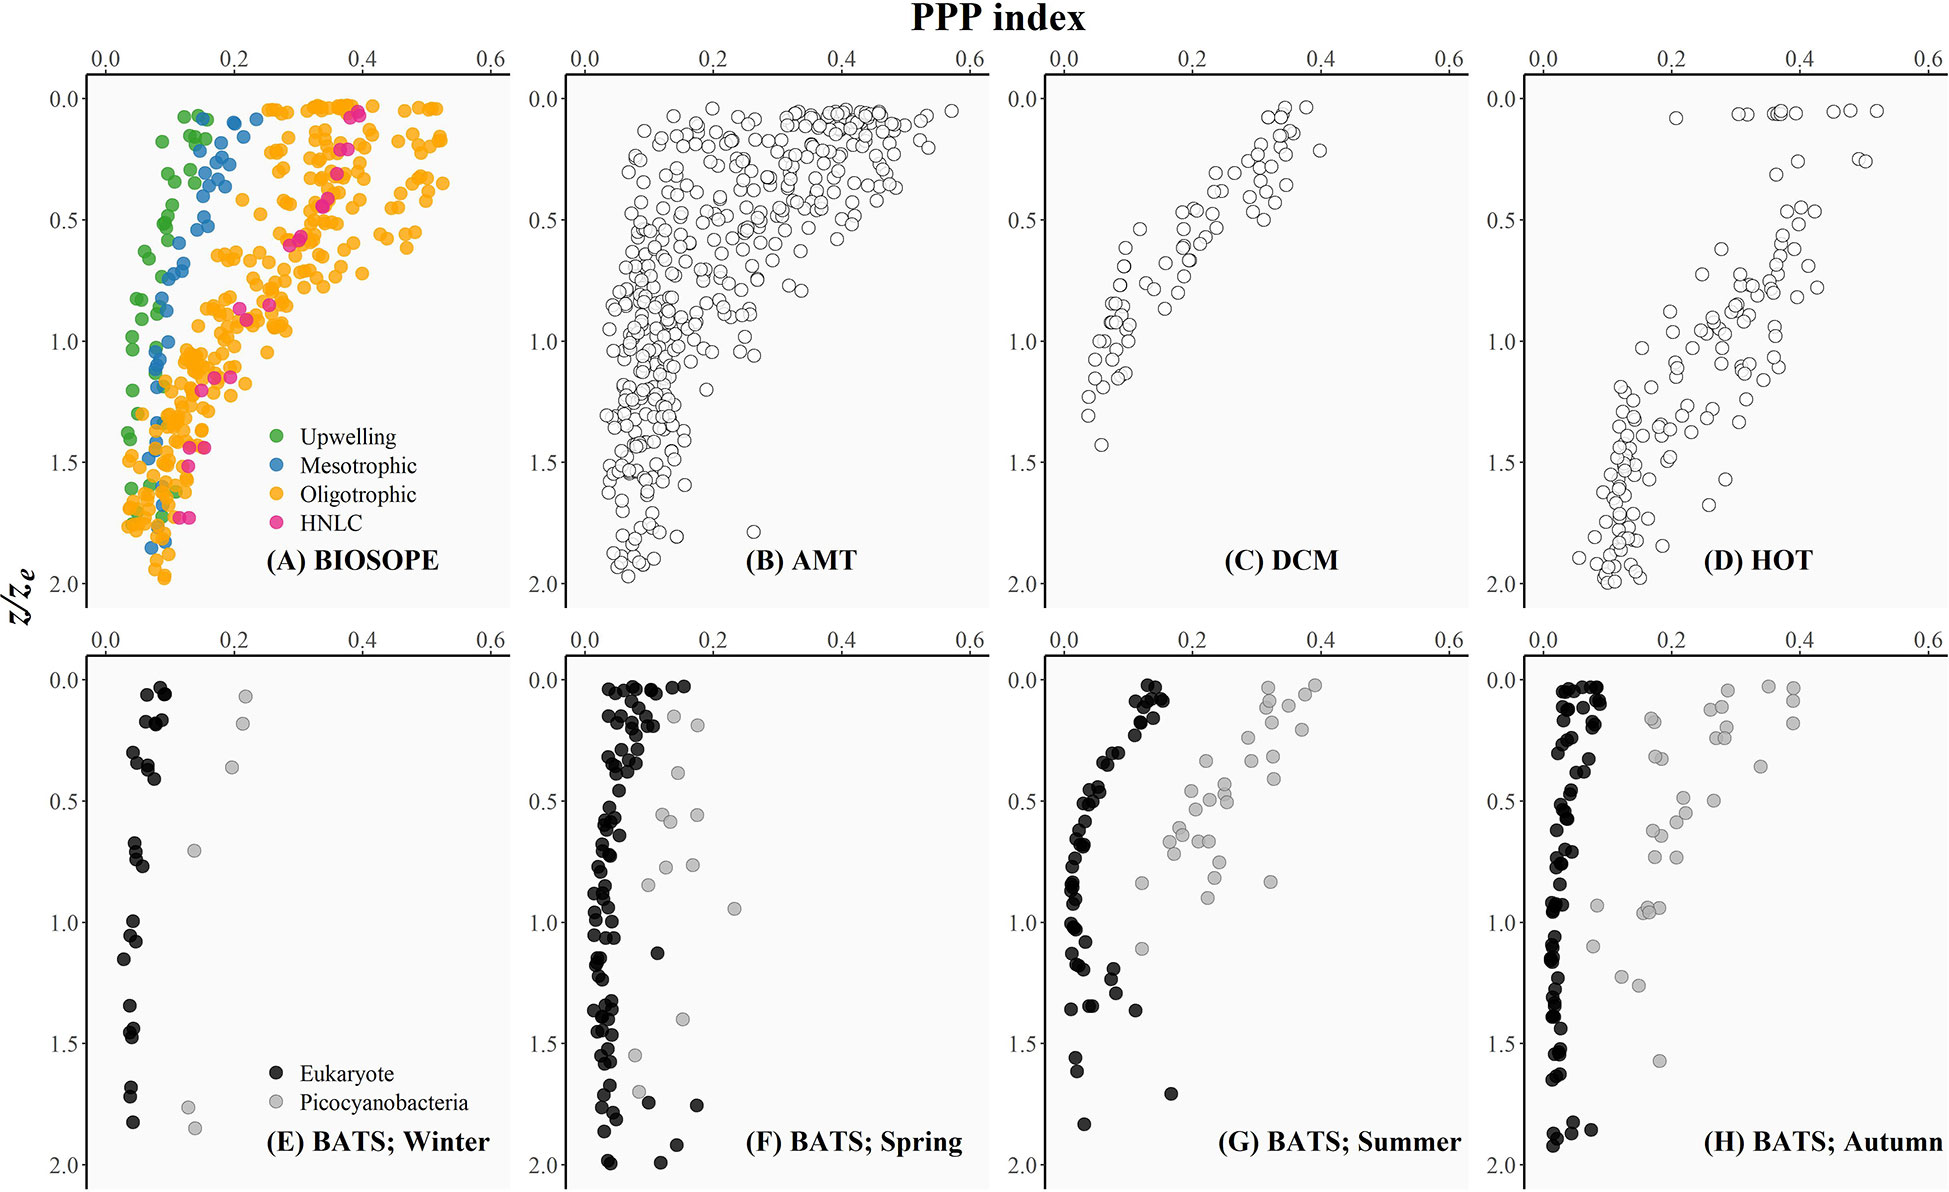
Figure 3 The photoprotective pigment index (PPP index: the ratio of PPPs to the sum of all pigments) plotted as a function of the depth of sampling divided by the depth of the euphotic zone (z/ze) as an index of the underwater light availability for each oceanographic dataset included in this study: (A) BIOSOPE, (B) AMT, (C) DCM, (D) HOT, and (E-H) BATS (see the Methods section for details of each cruise). The BIOSOPE dataset was partitioned into the coastal upwelling, mesotrophic, oligotrophic, and high-nutrient, low-chlorophyll (HNLC) regions as described in Grob et al. (2007a). The BATS time series was roughly divided into seasons: (E) winter (21 December – 20 March), (F) spring (21 March – 20 June), (G) summer (21 June – 20 September), and (H) autumn (21 September – 20 December). For each season, phytoplankton communities were classified into those dominated by eukaryotic taxa (no detectable zeaxanthin; black circles) and those dominated by picocyanobacteria (ratio of zeaxanthin to the sum of all PPPs ≥ 0.6; grey circles).
Given that the BIOSOPE data were all collected within a restricted time period and latitudinal range, variation in incident solar radiation should be minimal and thus differences in the pigment composition of surface phytoplankton communities are most likely primarily caused by shifts in taxonomic structure. Thus, we used the BIOSOPE dataset to explore the relative importance of cyanobacterial- versus eukaryotic-associated pigments in controlling the overall variation in the PPP index covering four major nutrient regimes (eutrophic, mesotrophic, oligotrophic and HNLC). In the HNLC and oligotrophic stations, ZEA, a diagnostic pigment of the picocyanobacteria Synechococcus and Prochlorococcus, accounted for more than half of the total PPP concentration (Figure 2A). On the other hand, DIAD and DIAT, associated with eukaryotic phytoplankton including photosynthetic picoeukaryotes (Dimier et al., 2009), contributed a low percentage (⪅ 30%) to the total PPP budget in these regions (Figure 2B). The relative abundance of ZEA decreased, while that of DIAD + DIAT increased as trophic conditions progressed toward a more productive state, indicating a domain shift from a prokaryote-dominated to a eukaryote-dominated surface phytoplankton community (Karl, 1999; Bouman et al., 2011).
The domain shift in pigment composition was also reflected in a progressive increase in the relative proportion of the photosynthetic pigment (PSP) fucoxanthin (FUCO), which is a pigment marker for diatoms, from oligotrophic open-ocean region to the coastal upwelling zone (Figure 2C). The PSPs chlorophyll-b (Chl-b) and prasinoxanthin (PRAS) along with the PPPs VIOL and neoxanthin (NEOX) were in significant quantities at several upwelling sites (data not shown) and indicated the presence of picoeukaryotic green algae (Ras et al., 2008), such as those in the genus Ostreococcus which has been reported to thrive in various coastal environments (Tragin and Vaulot, 2019). The near ubiquity of 19′-hexanoyloxyfucoxanthin (19′-HEX) throughout the transect (Figure 2E) reflects the cosmopolitan nature of haptophytes (Liu et al., 2009; Swan et al., 2016), and the elevated fraction of this carotenoid observed under oligotrophic conditions and in HNLC waters suggests that some of these cells may fall within the picophytoplankton size fraction (Ras et al., 2008; Liu et al., 2009).
The HNLC stations have surface TChl-a values (0.2-2 mg Chl-a m-3) similar to those of the mesotrophic sites (i.e., near the Marquises Islands, Figure 1), yet they exhibited a markedly higher abundance of picocyanobacteria, especially Prochlorococcus (average of ~200×103 cells mL-1) in surface waters (0-80 m) of the HNLC region compared to ~60 × 103 cells mL--1 at other mesotrophic sites (see also Grob et al., 2007a). This was reflected clearly in a markedly higher relative proportion of ZEA (Figure 2A). The numerical dominance of Prochlorococcus in these low-latitude HNLC waters was associated with highly stable water columns which were likely influenced by the South Pacific Tropical Water (Ras et al., 2008). Molecular studies (Rusch et al., 2010; Malmstrom et al., 2013) have revealed that Prochlorococcus isolated from HNLC regions of the tropical Pacific and Indian Oceans are adapted to iron limitation by reducing their iron requirements through the loss of several genes encoding iron-containing proteins which are mostly involved in the electron transport chain. These HNLC isolates also possess genes that enable them to efficiently acquire iron bound to organic ligands in seawater (Rusch et al., 2010; Malmstrom et al., 2013; Larkrin et al., 2020).
The taxonomic composition of open-ocean phytoplankton communities is governed largely by the supply of nutrients (Cullen et al., 2002). The region in the water column where there is a sharp increase in nitrate concentration is commonly referred to as the nitracline, and its depth, termed the nitracline depth, is widely regarded as an indicator of the supply of the deep-ocean nitrate to the upper mixed layer (Cullen et al., 2002; Cermeño et al., 2008). Along the BIOSOPE transect, the depth of the nitracline was found to increase steadily from the productive upwelling system nearshore to the more oligotrophic open ocean (Figure 2F). In the gyres, the deep nitracline and the corresponding reduced nutrient supply to surface waters resulted in a high abundance of picocyanobacteria indicated by higher values of the PPP index (Figure 3A). As the nitracline shoaled, the surface phytoplankton community structure shifted toward a eukaryote-dominated ecosystem (i.e., higher relative contributions of DIAD + DIAT and FUCO (Figures 2B, C), and lower PPP index values (Figure 3A)) supported by entrainment of new nutrients from depth.
3.2 Vertical changes across oceanic provinces and its seasonal variability
Figure 3 shows that the PPP index decreased vertically coinciding with a reduction in the relative availability of light in the water column as indexed by z/ze (Uitz et al., 2008). For all of the datasets, the magnitude of the PPP index varied appreciably within the surface layer (i.e. z/ze< 0.5), and the values appeared to converge to a minimum below the ~1.5ze depth.
HPLC data from the BATS time series revealed that the PPP index at the sea surface varied seasonally with consistently low and less variable values in winter and spring, and higher and more variable PPP index values observed during the summer-autumn months (Figures 3E–H). The uniformly low PPP index observed during winter (late December to mid-March) (Figure 3E) could be attributed to the combined effect of deep vertical mixing typical of the Sargasso Sea (Steinberg et al., 2001) and a seasonal reduction in incident solar radiation leading to a weakly-stratified water column. Nutrient-replete conditions established previously by deep winter mixing allowed eukaryotic phytoplankton to dominate within the surface layer until early spring (late March to mid-April). The relative similarities in the ambient nutrient and light conditions during winter and spring likely resulted in surface populations dominated by low light-acclimated cells and thus were reflected in the PPP indices for both seasons falling within a relatively similar range (Figures 3E, F). As the upper water column became thermally stratified due to intense solar heating, and the intensity of the wind-driven surface mixing was weakened during the late spring and summer months (late June to mid-September), the mixed layer shoaled such that phytoplankton were confined within the upper mixed layer and thereby continuously exposed to high UV and visible radiation. Photoacclimation of phytoplankton to high-light conditions resulted in an overall increase in the PPP index observed for both eukaryote-dominated and picocyanobacteria-dominated populations (Figure 3G). Picocyanobacterial cells continued to dominate the surface phytoplankton as surface waters became more nutrient-limited during the early autumn (late September to early October) when the sea-surface temperature remained relatively high (> 25°C) and the water-column was strongly stratified. However, as the autumn progressed, surface cooling and a deepening of the mixed layer allowed for the upper water column to be replenished with nutrients and resulted in a phytoplankton community dominated by larger eukaryotic cells acclimated to low-light intensities. This prokaryote-to-eukaryote domain shift occurring intraseasonally between early and late autumn was supported by the contrasting profiles of the PPP index (Figure 3H).
3.3 Photoacclimatory changes in the intracellular pigment content of picocyanobacteria
The BIOSOPE dataset illustrates that domain-specific (prokaryotic to eukaryotic) shifts in gross phytoplankton community structure governs horizontal changes in the relative contribution of photoprotective pigments to total pigment biomass in the surface ocean. However, the strong vertical decline in the PPP index was a striking feature exhibited across the various datasets that span a range of spatial and temporal scales (Figure 3). Since picocyanobacteria have been shown to exhibit tremendous variation in their pigment composition in response to both seasonal and vertical changes in light conditions, we examined the photoacclimatory characteristics of this group at the cellular level via the intracellular content of their diagnostic pigments. Our analyses were focused primarily on the picocyanobacteria-dominated waters of the subtropical and tropical oligotrophic gyres where simultaneous measurements of abundance determined by flow cytometry and pigment concentrations measured using the HPLC method were widely available.
In picocyanobacteria, photoacclimatory changes in the magnitude of the PPP index could be attributed to variation in the intracellular concentration of either photoprotective (Kulk et al., 2011; Mella-Flores et al., 2012), or photosynthetic pigments (Kana et al., 1988; Moore et al., 1995), or both. To assess the relative influences that each of these two major pigment groups has on variation in the PPP index, intracellular concentration of ZEA (Figure 4) found in both picocyanobacterial genera Synechococcus and Prochlorococcus and DVChl-a, which is the major photosynthetic pigment for the genus Prochlorococcus (Figure 5) were plotted against the z/ze index as a proxy for the relative light availability. When calculating the intracellular concentration of ZEA, we partitioned this pigment between the two cyanobacteria groups based on culture observations that have shown that ZEA per cell for Synechococcus is approximately three-times higher than that of Prochlorococcus when grown over a similar range of light intensities (Moore et al., 1995).
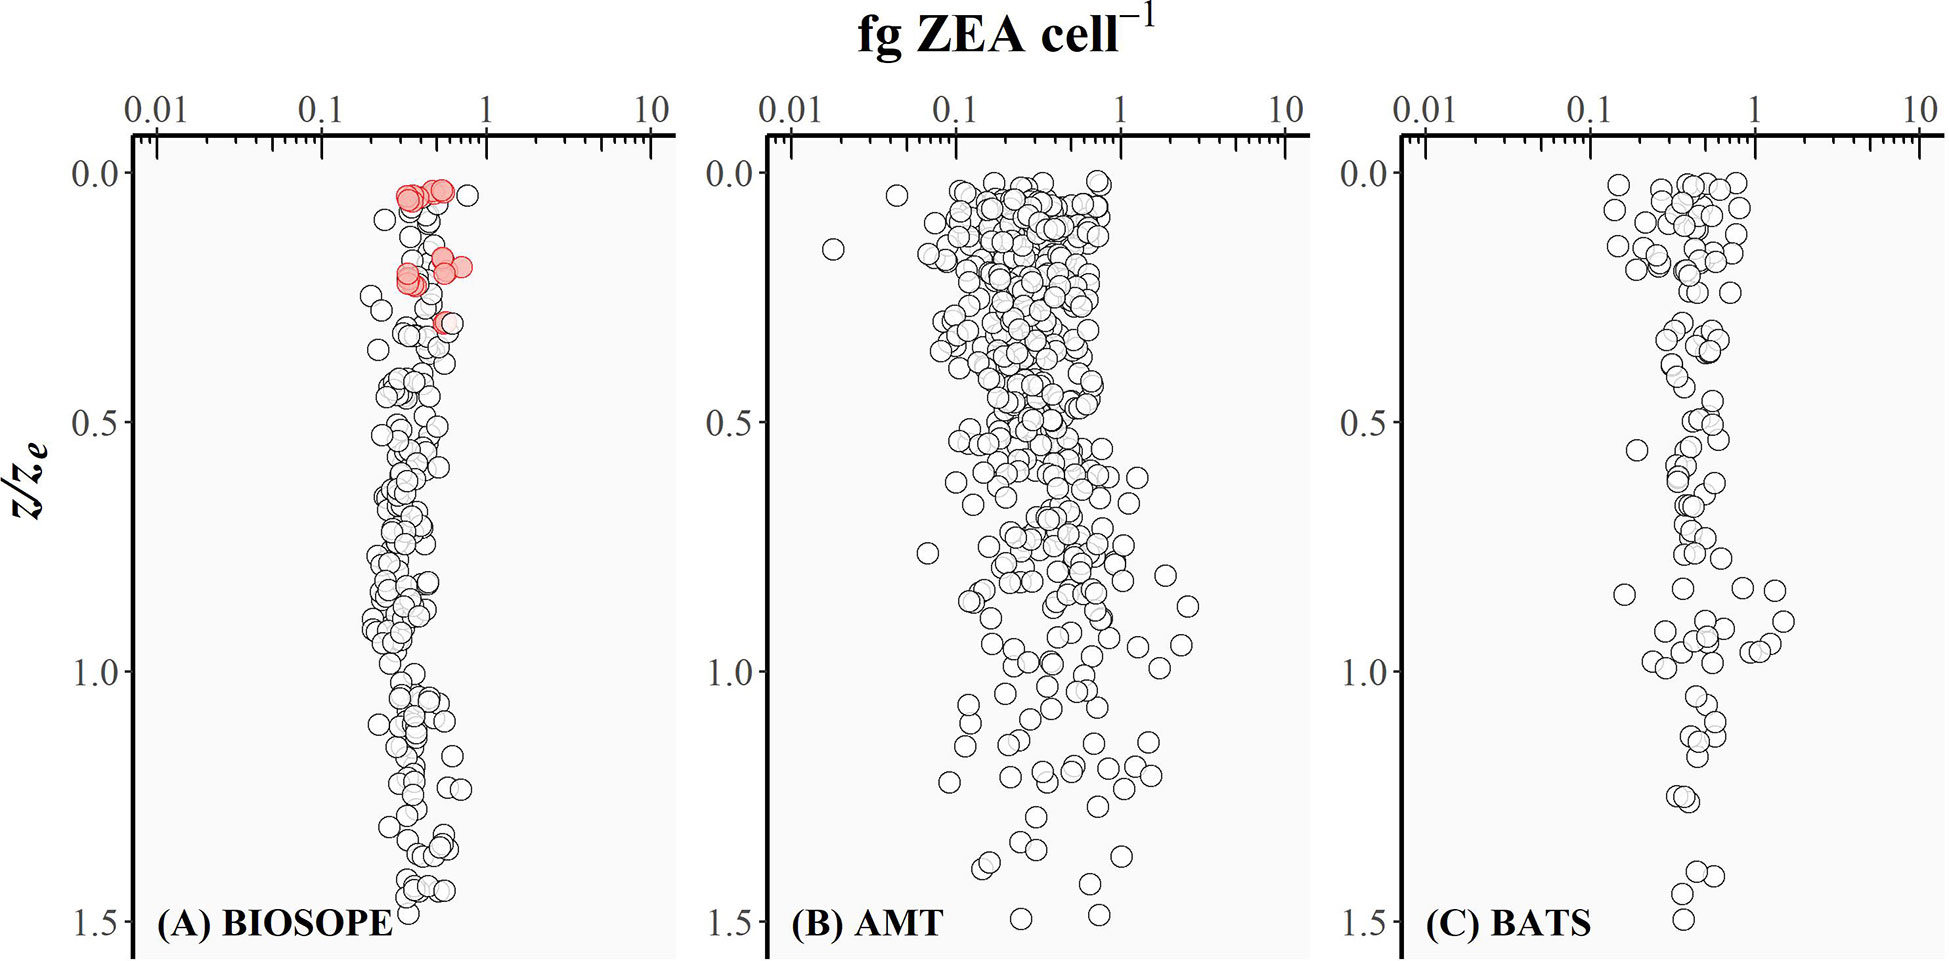
Figure 4 The intracellular concentration of zeaxanthin (fg ZEA cell-1) for picocyanobacteria plotted as a function of the depth of sampling divided by the depth of the euphotic zone (z/ze) for (A) BIOSOPE, (B) AMT, and (C) BATS datasets. Red circles represent the cases where the Prochlorococcus cell number was derived from DVChl-a concentration as the fluorescence signal measured in flow cytometry was too weak.
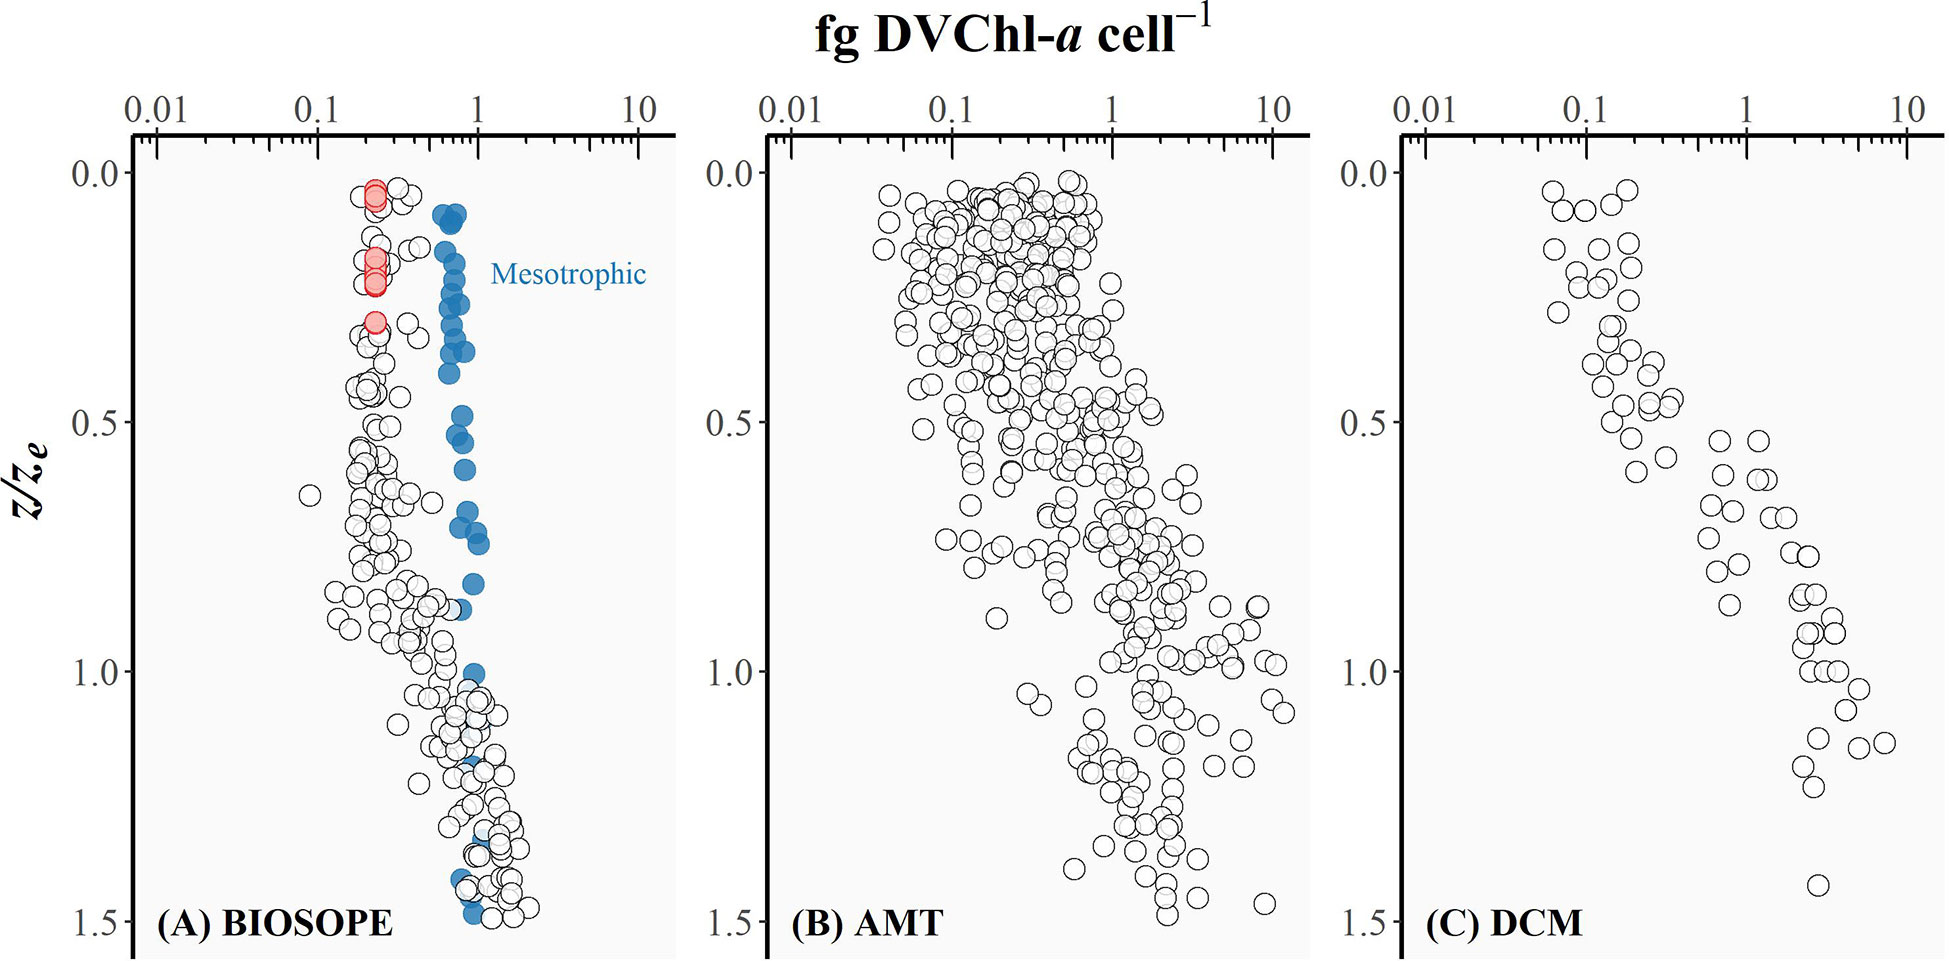
Figure 5 The intracellular concentration of divinyl chlorophyll-a (fg DVChl-a cell-1) for Prochlorococcus plotted as a function of the depth of sampling divided by the depth of the euphotic zone (z/ze) for (A) BIOSOPE, (B) AMT, and (C) DCM datasets. Red circles represent the cases where the Prochlorococcus cell number was derived from DVChl-a concentration as the fluorescence signal measured in flow cytometry was too weak.
The intracellular concentration of ZEA remained relatively uniform from the well-lit surface layer down to the bottom of the euphotic zone (Figure 4), whereas the amount of DVChl-a cell-1 gradually increased with depth (Figure 5). However, for the BIOSOPE dataset, the calculated DVChl-a cell-1 was relatively constant within the top 0-0.5ze layer with most values falling between 0.2-0.3. This is partially the result of the authors estimating Prochlorococcus abundance based on pigment data assuming 0.23 fg DVChl-a cell-1 for surface samples (Figure 5, red circles) where the natural fluorescence of these cells was too low to detect them using flow cytometry (Grob et al., 2007a). In addition, mesotrophic stations sampled during the BIOSOPE cruise off the Marquesas Islands exhibited intracellular concentrations of DVChl-a that were substantially higher (nearly 1.0 fg DVChl-a cell-1) and more uniform over the vertical profile than the rest of the transect (Figure 5, blue circles). Vertical density profiles revealed that these stations were more deeply mixed (mixed layer depths of ~70-100 m compared to< 50 m typically observed at other stations), which would reduce the average daily mixed-layer irradiance for phytoplankton communities. If we assume that Prochlorococcus cells were uniformly mixed throughout the mixed layer, the reduction in the average mixed-layer irradiance would result in an increase in the intracellular concentration of their major light-harvesting pigments and therefore explain the relatively high and uniform DVChl-a cell-1 and low PPP index (Figure 3A, blue circles) measured throughout the water column at these stations.
Uniform ZEA cell-1 values over a range of z/ze values (Figure 4) are reflected in the linear relationship between bulk ZEA concentration and the number of picocyanobacterial cells (Pico) depicted in Figure 6 (log10 Pico = 0.90 log10 ZEA + 3.65, R2 = 0.61). Upper and lower envelopes shown in Figure 6 correspond, respectively, to the maximum (qmax) and minimum (qmin) quantiles (Sathyendranath et al., 2009). Quantile regressions facilitated constraining the variability in values of ZEA cell-1 by allowing outliers that fell outside the computed maximum and minimum quantiles to be identified and removed. The lower and upper bounds could be viewed as being representatives of extremely high-light (surface) and low-light (bottom of the euphotic zone) conditions, respectively. Note that higher ZEA cell-1 values could result from the presence of other cyanobacterial populations not accounted for in the flow cytometry counts, in particular the colonial diazotroph Trichodesmium that is known to be abundant in the North Atlantic Subtropical Gyre.
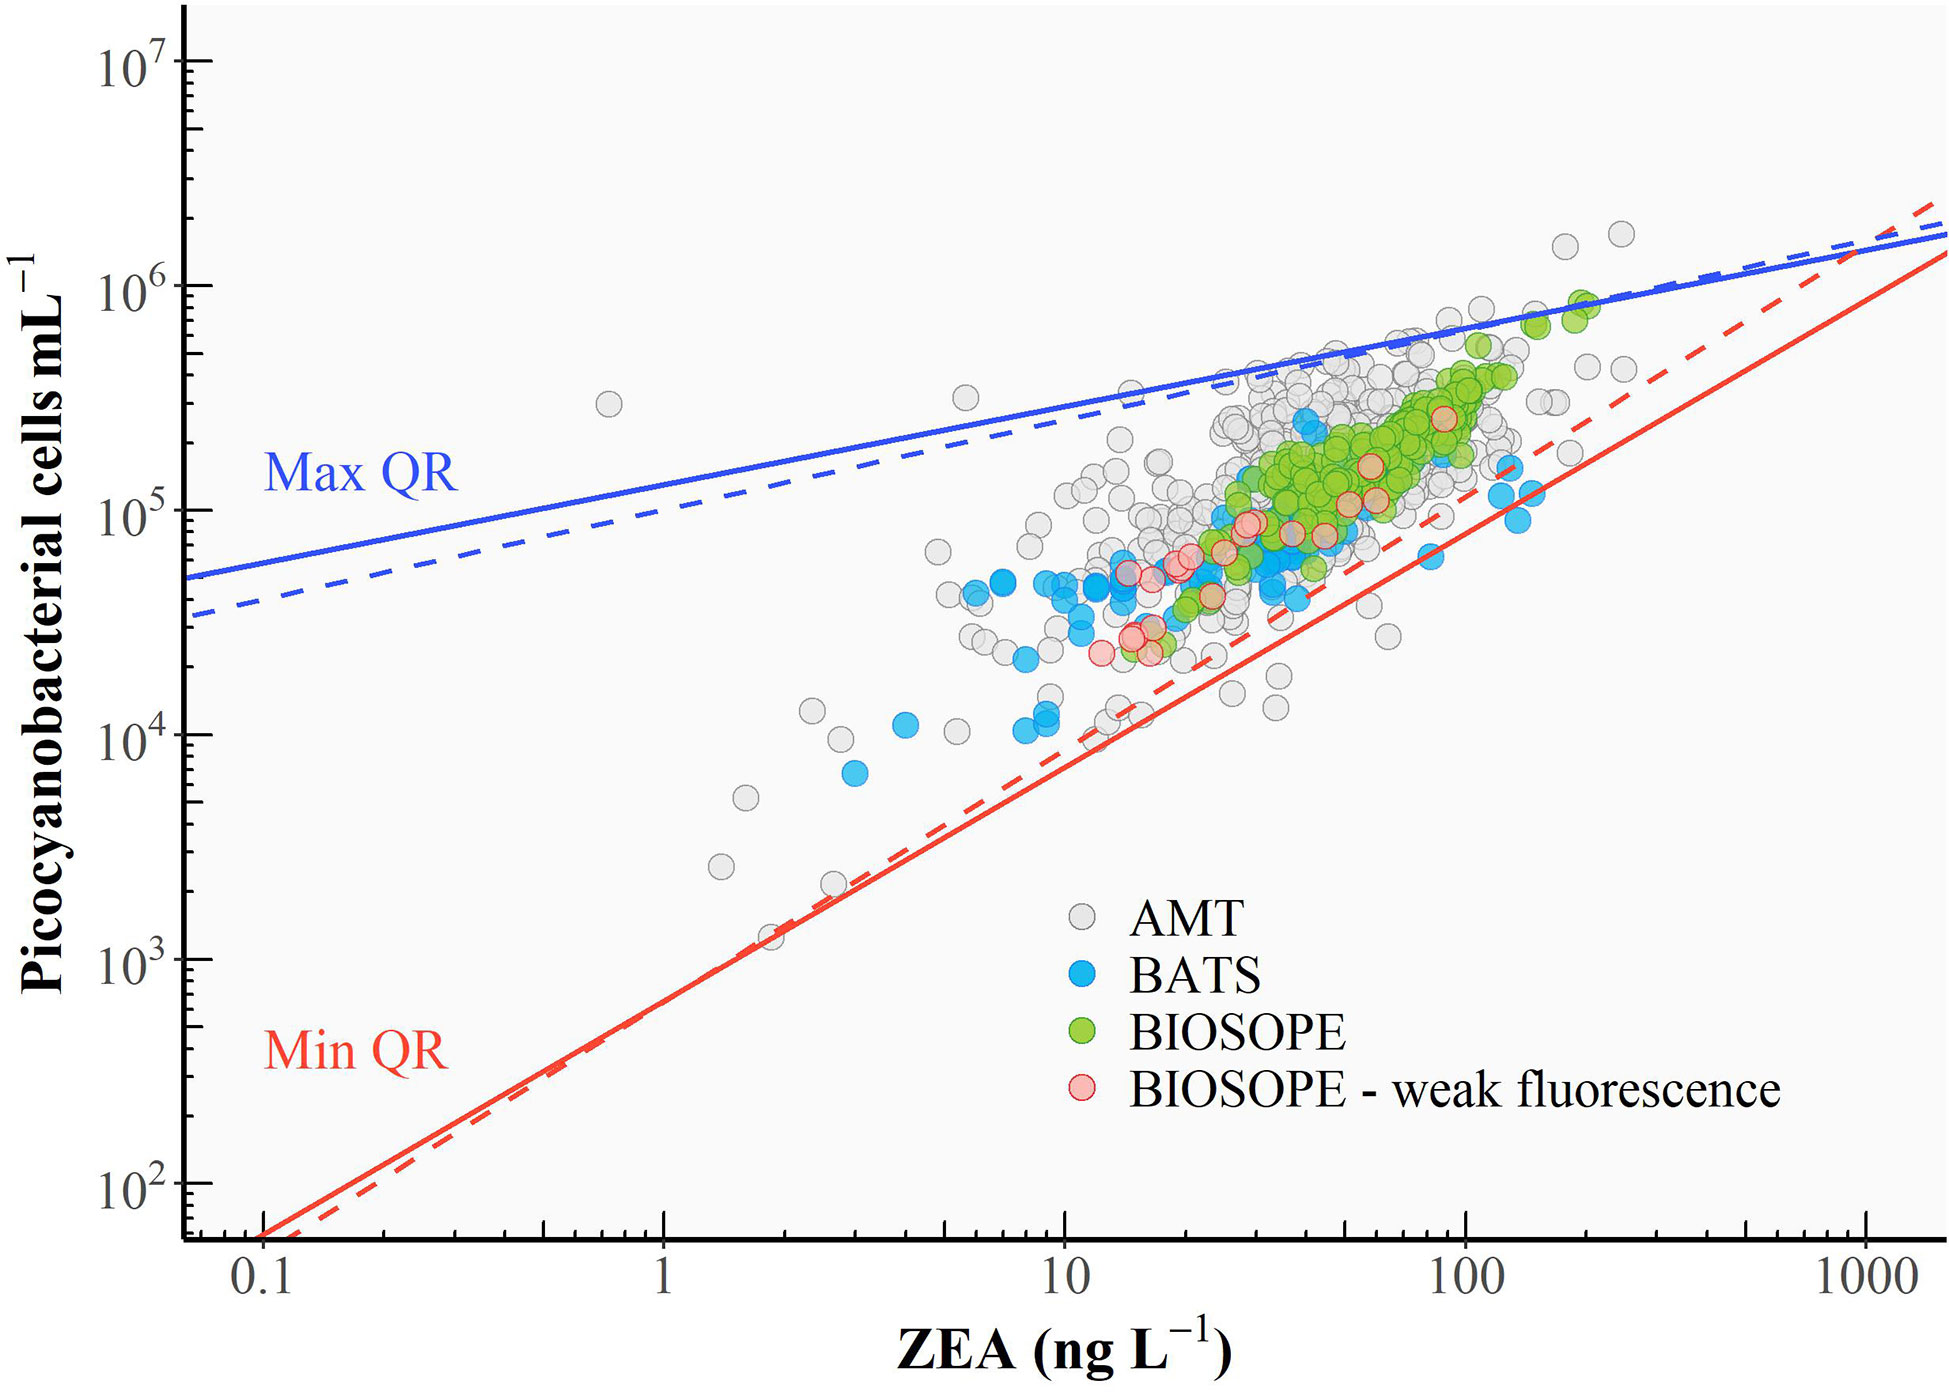
Figure 6 Relationship between cell abundance of picocyanobacteria and the concentration of zeaxanthin (ZEA). A linear regression was performed (black line), and the 95% confidence interval for the linear regression line is shaded in grey. The upper (solid blue line) and lower (solid red line) boundaries correspond to the maximum (99th) and minimum (1st) quantiles, respectively (see text for the calculation). Dashed lines represent the re-fitted quantile regressions after identified outliers were excluded. Red circles represent the cases where the Prochlorococcus cell number was derived from DVChl-a concentration as the fluorescence signal measured in flow cytometry was too weak.
Quantile regressions were also fitted to the plot of DVChl-a concentration against Prochlorococcus cell abundance (Pro) (Figure 7A; log10 Pro = 0.82 log10 DVChl-a + 3.53, R2 = 0.40). In this case, the physiological interpretation of the upper and lower envelopes is the opposite to that for the ZEA-cell abundance relationship (Figure 6): the lower boundary (qmin = 0.01) corresponds to the upper limit of DVChl-a cell-1 for Prochlorococcus cells acclimated to extremely low light, whereas the upper boundary (qmax = 0.99) represents the lower limits of DVChl-a cell-1 resulting from cells photoacclimated to maximum surface irradiances. The overall variability in the relationship between DVChl-a and cell abundance (Figure 7A) was far greater than that of ZEA and cell abundance (Figure 6). This highlights the significance of the photosynthetic pigment fraction in driving changes in the PPP index in picocyanobacterial-dominated systems.
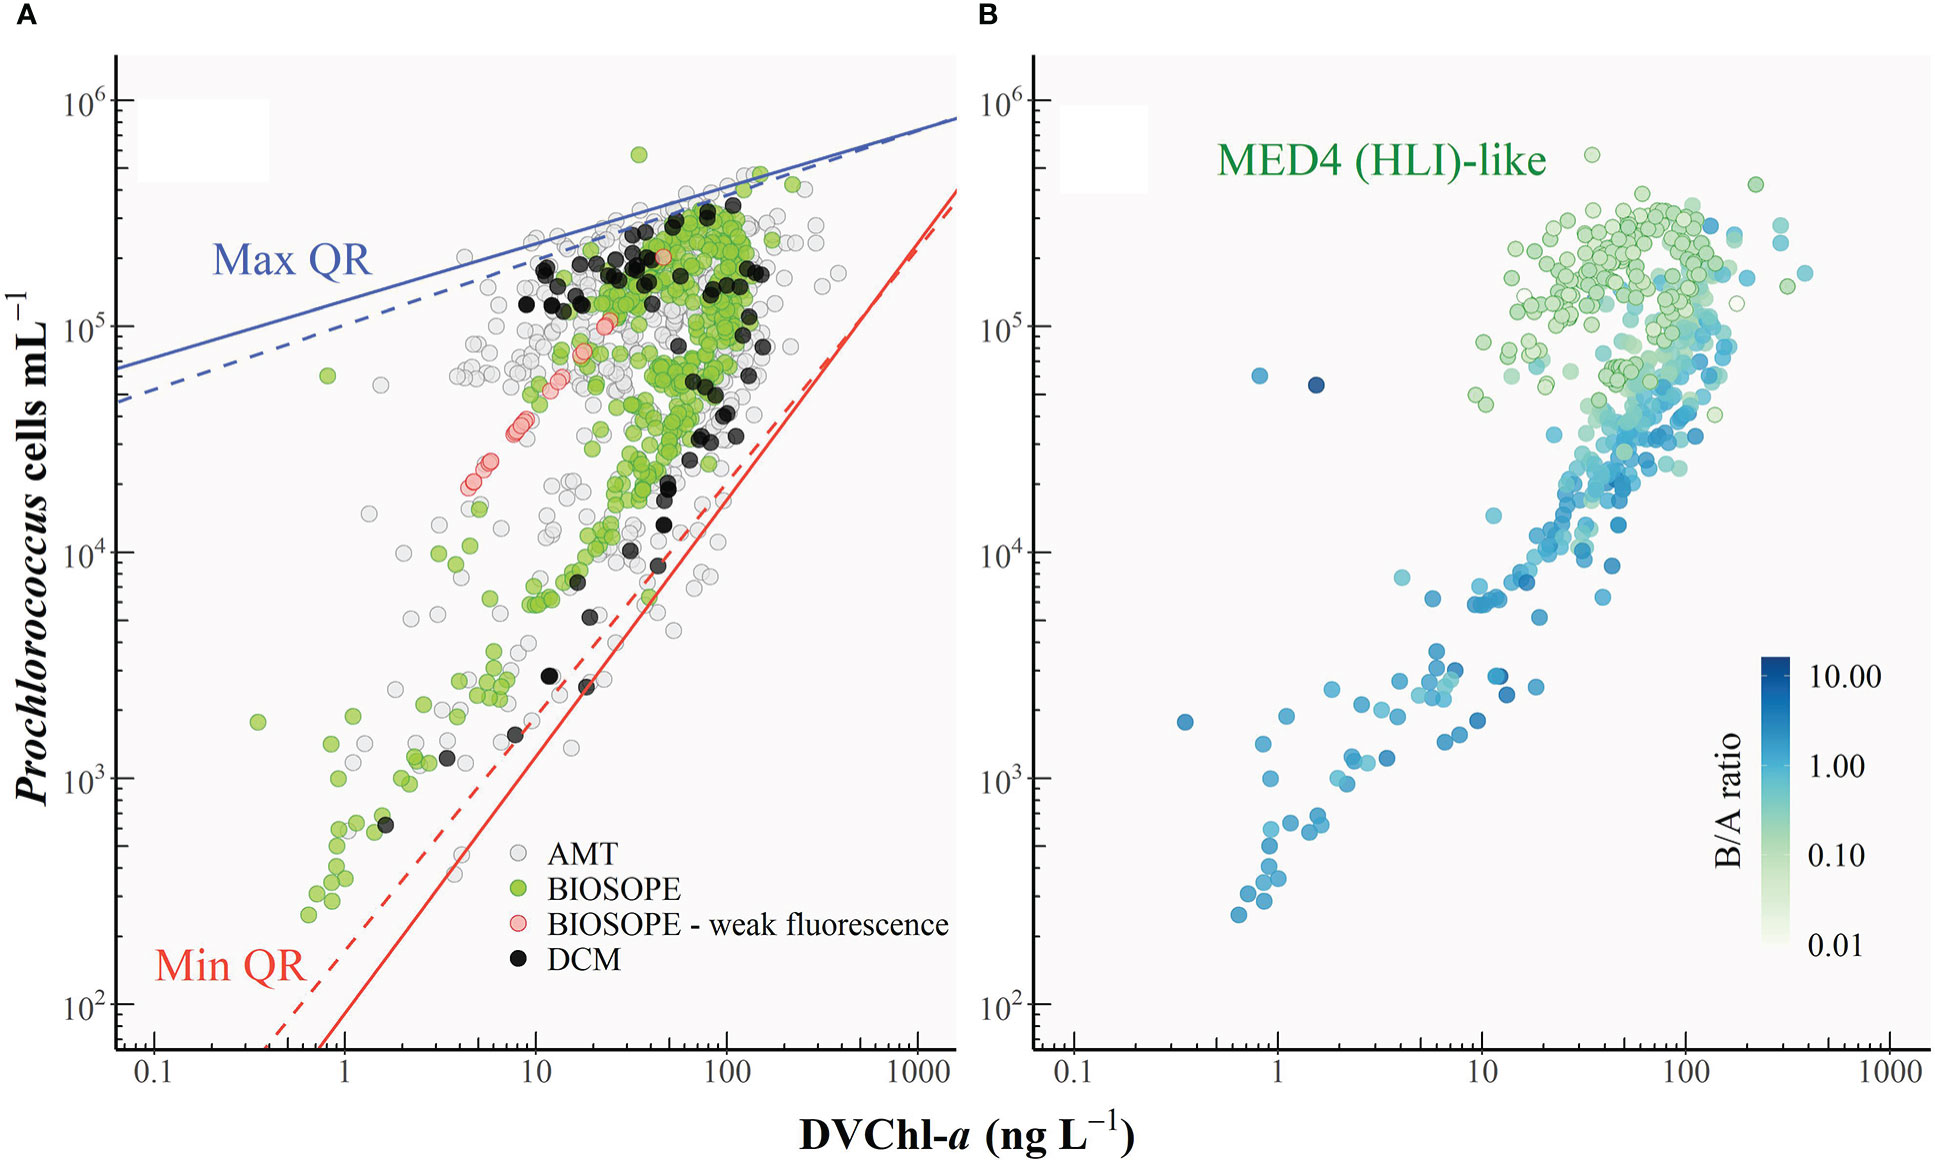
Figure 7 (A) Relationship between Prochlorococcus cell abundance and the concentration of divinyl chlorophyll-a (DVChl-a). The black line represents the line of best fit, and the grey shaded area indicates the 95% confidence interval. The upper (solid blue line) and lower (solid red line) boundaries correspond to the maximum (99th) and minimum (1st) quantiles, respectively. Dashed lines represent the re-fitted quantile regressions after outliers were removed. Red circles represent the cases where the Prochlorococcus cell number was derived from DVChl-a concentration as the fluorescence signal measured in flow cytometry was too weak. (B) As in Figure 7A with symbols coloured according to the weight-to-weight ratio of divinyl chlorophyll-b to divinyl chlorophyll-a (B/A ratio). Prochlorococcus samples with B/A ratios of<0.14 were classified as the MED4 (HLI)-like populations. Note that only a subset of the HPLC dataset could be used for this analysis since for some datasets DVChl-b was not separated from monovinyl Chl-b.
3.4 Estimation of the carbon-to-DVChl-a ratio of Prochlorococcus
The carbon-to-DVChl-a ratio of Prochlorococcus (θPro) was estimated based on simultaneous measurements of cell abundance and the concentration of DVChl-a illustrated in Figure 8. Prochlorococcus cell carbon was estimated from abundances (determined by flow cytometry) using two sets of conversion factors. The first conversion factor of 49 fg C cell-1 (Cailliau et al., 1996) based on the assumption that both HL- and LL-ecotypes have similar carbon contents. In non-axenic cultures of a Prochlorococcus strain, Cailliau and colleagues (1996) derived the cellular carbon contents from flow cytometric cell counts and measurements of particulate organic carbon (POC) that were corrected for the presence of heterotrophic bacteria. Their study found that the values obtained for Prochlorococcus under low and high light were not statistically different, suggesting that this value may be applied to both HL and LL cells.
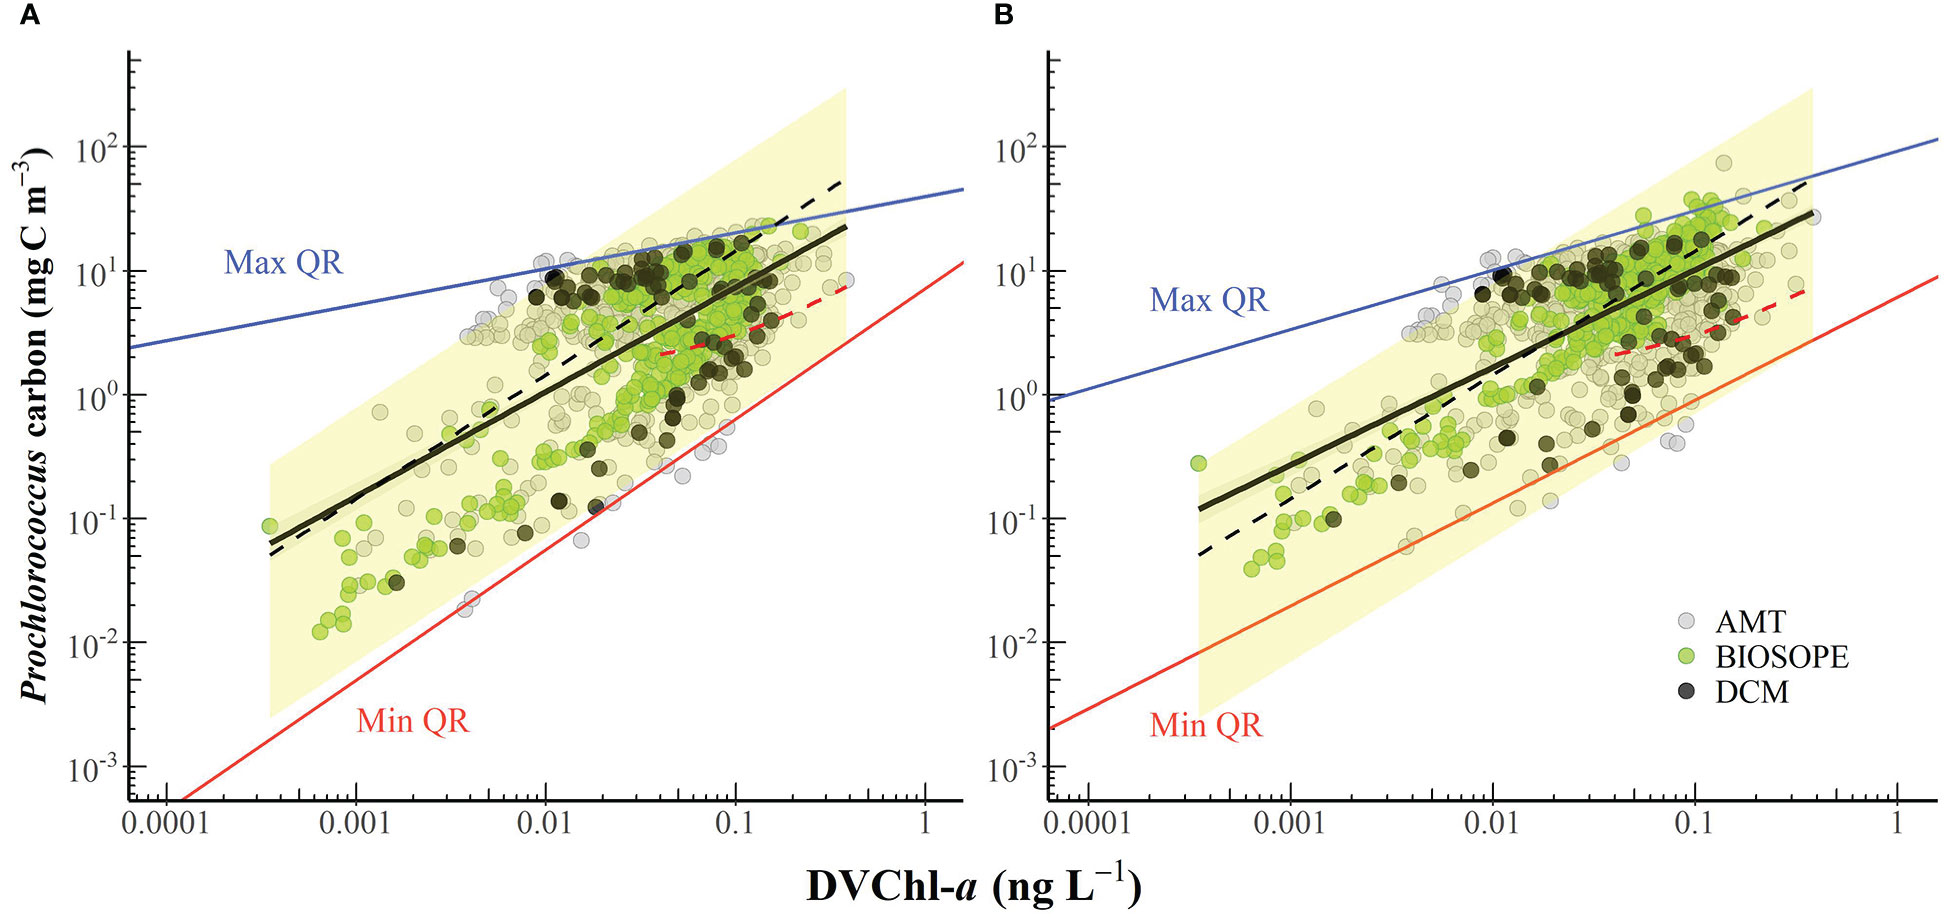
Figure 8 The cell carbon biomass of Prochlorococcus plotted against the concentration of divinyl chlorophyll-a (DVChl-a). Carbon content was converted from cell abundances using the conversion factor of (A) 49 fg C cell-1 (Cailliau et al., 1996) and (B) 52 and 158 fg C cell-1 for euphotic and sub-euphotic populations, respectively (Casey et al., 2013). The black line represents the line of best fit (panel A: log y = 0.843 log x + 1.711, R2 = 0.41; panel B: log y = 0.788 log x + 1.798, R2 = 0.47), and the grey shaded area indicates the 95% confidence interval. The upper (solid blue line) and lower (solid red line) boundaries correspond to the maximum (99th) and minimum (1st) quantiles, respectively. The black dashed line corresponds to the carbon-to-DVChl-a of Prochlorococcus (θPro) of 145 g C (g DVChl-a)-1 reported in Sathyendranath et al. (2009). The red dashed line represents the relationship observed by Latasa et al. (2022) in the northwestern Mediterranean Sea in September 2009 when the measured DVChl-a concentrations were always greater than 0.04 mg m-3. The yellow-shaded area represents the possible range of θPro values reported in the literature.
We also applied conversion factors of 52 and 158 fg C cell-1 (Casey et al., 2013) to Prochlorococcus populations residing within the euphotic (0-120 m) and sub-euphotic zone (> 120 m), respectively, during the period of water-column stratification which is reflected in the presence of a deep chlorophyll maximum. Casey and colleagues (2013) derived the carbon biomass of Prochlorococcus at the BATS stations based on an empirical relationship between flow cytometric forward light scatter and cellular carbon content. Their study found that Prochlorococcus carbon content increases significantly with depth as cells acclimate to low-light conditions potentially by increasing the number of thylakoid membranes to allow increased synthesis of PSPs (Casey et al., 2013).
Values of the cellular carbon content of surface Prochlorococcus populations obtained by both Cailliau et al. (1996) from cultures and Casey et al. (2013) from field samples are comparable to published estimates from other studies [e.g. 53 fg C cell-1 reported in DuRand et al. (2001); 54 fg C cell-1 in Campbell et al. (1994) and Grob et al. (2007b)], although it is important to stress that determination of the carbon content from cell volume has a significant degree of uncertainty since, as pointed out in Bertilsson et al. (2003), the amount of carbon per unit cell volume observed in marine bacteria can vary both between and within species in response to changes in growth conditions. Our choice of conversion factors is therefore based on estimates of Prochlorococcus cellular carbon content derived from direct measurements of POC (Partensky et al., 1999; Bertilsson et al., 2003) and the conversion factors used in this study fall within those obtained from studies of natural picophytoplankton populations.
3.5 Constraining the variability in the estimated θPro
When samples collected from below the 1.5ze depth and potential outliers (Figure 8) were removed, our estimates of θPro varied from 9 to 499 g C (g DVChl-a)-1 for all samples, and θPro values for surface populations (z/ze< 0.1) ranged from 66-361 g C (g DVChl-a)-1. To assess whether the extent of the observed variability in θPro was reasonable, these results were compared with θPro measured in various culture experiments and field studies using an approach outlined in Marañón (2005). Given that (1) the intracellular carbon content of Prochlorococcus previously reported in the literature ranged from about 29 to 158 fg C cell-1 (Casey et al., 2013 and references therein), and (2) the intracellular content of DVChl-a of Prochlorococcus cells subject to extremely high irradiances typical of the subtropical surface ocean (e.g. > 1,000 μmol quanta m-2 s-1) can be as low as ~0.2 fg DVChl-a cell-1 (Blanchot and Rodier, 1996; Grob et al., 2007a) and that of Prochlorococcus growing under very low irradiances (e.g. 7 μmol quanta m-2 s-1) is up to 4.0 fg DVChl-a cell-1 (Partensky et al., 1993; Blanchot et al., 2001), the resulting upper boundary of θPro values should be in the range of 145-790 g C (g DVChl-a)-1 and the lower boundary in the range of 7-40 g C (g DVChl-a)-1. In general, our estimated values of θPro fell within these derived upper and lower limits.
Using open-ocean samples collected from the Northwest Atlantic and the Arabian Sea, Sathyendranath et al. (2009) indirectly estimated an upper bound on θ for different groups of phytoplankton in the field based on quantile linear regressions of POC and Chl-a concentration and obtained an average θPro value of 145 g C (g DVChl-a)-1 for stations classified as Prochlorococcus-dominated. When this average value was superimposed on the scatterplot of Prochlorococcus cell carbon content and DVChl-a concentration (Figure 8), the line of best fit from the Sathyendranath et al. (2009) study lies remarkably closed to the best equation obtained in this study, despite being derived from independent datasets. It should be noted that most of the data used in Sathyendranath et al. (2009) were from samples collected within the top 40 m of the water column, and therefore their estimate likely applies to cells acclimated to mixed-layer light intensities. The estimated value of θPro obtained in the Sathyendranath et al. (2009) study was higher than the average θPro values reported by Blanchot et al. (2001) for surface (0-40 m) Prochlorococcus samples from the oligotrophic (66 g C (g DVChl-a)-1) and HNLC (93 g C (g DVChl-a)-1) regions of the equatorial Pacific (Table 3). It has been shown that Prochlorococcus samples from mesotrophic regions contain more carbon biomass relative to chlorophyll pigment than samples associated with oligotrophic environments (Wei et al., 2019) and this may explain the higher θPro values in the Sathyendranath et al. (2009) study.
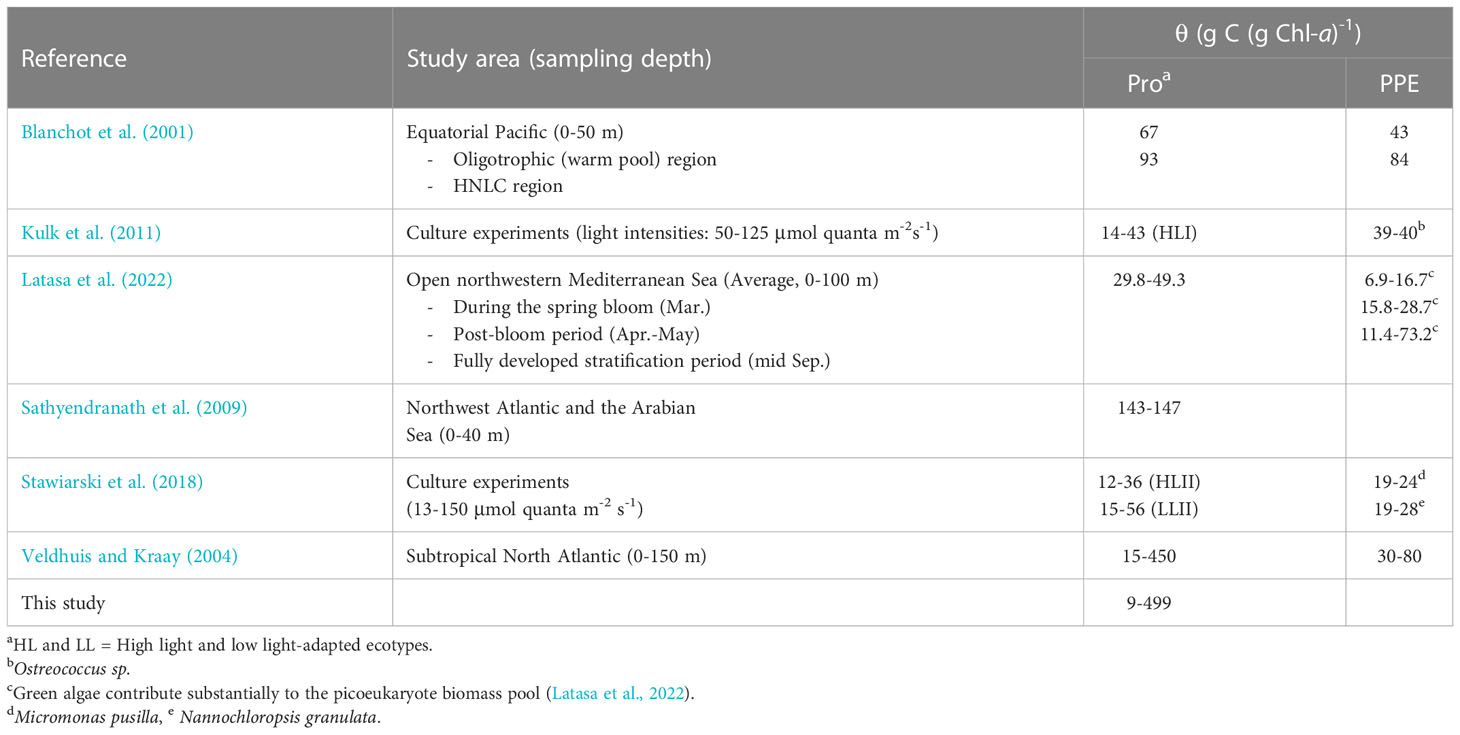
Table 3 Published estimates of carbon-to-(DV)Chl-a ratio (θ) for Prochlorococcus (Pro) and photosynthetic picoeukaryotes (PPE).
4 Discussion
4.1 Photoacclimatory changes in the cellular content of photoprotective and photosynthetic pigments
The vertical patterns in the cellular content of PPPs and PSPs observed in this study are consistent with those obtained by Matsumoto and Ando (2009) who examined vertical profiles of picocyanobacterial pigments in the nutrient-limited western Pacific and found a steady vertical increase in the intracellular Chl-a concentration but no obvious variation in ZEA content. Our findings are also supported by culture experiments. Kana et al. (1988) were amongst the first to observe the constant ZEA cell-1 in nutrient-replete batch cultures of Synechococcus WH7803 grown under different irradiance levels. Similarly, Moore et al. (1995) found that Synechococcus WH8103 and Prochlorococcus MED4 maintained relatively constant cellular content of ZEA under varying irradiances, although for the Prochlorococcus SS120 strain, there was a slight increase with the increased light level. In contrast, the intracellular concentration of (DV)Chl-a was found to decrease significantly at high light for all picocyanobacterial isolates, with the DVChl-a cell-1 of Prochlorococcus being up to six times lower than the Chl-a cell-1 of Synechococcus. A molecular study by Mella-Flores et al. (2012) revealed that Synechococcus WH8103 possess more genes involved in photoprotection and the dissipation of excess energy as heat than Prochlorococcus PCC9511 (very close to the MED4 strain), and that there was a close correlation between expression levels of these genes and diel variations of growth irradiances for Synechococcus which was not always the case for Prochlorococcus. The study also suggested that, rather than intensively inducing a variety of photoprotective mechanisms (including the production of ZEA) as observed in Synechococcus, high light-acclimated Prochlorococcus reduces their energy demand by temporarily down-regulating the synthesis of light-harvesting pigment proteins, ATP formation, and the light-independent reactions of photosynthesis. This is not only to avoid photodamage during a period of high irradiance, but also allows Prochlorococcus cells to generate the energy from photosynthesis that is sufficient to satisfy their minimized energy requirement despite having only low amounts of PSPs to carry out light absorption for photochemistry (Hartmann et al., 2014).
The large dynamic range of DVChl-a cell-1 values observed in our dataset appears to be indicative of the ability of Prochlorococcus to acclimate to a broad range of light conditions (Partensky et al., 1999). Yet, culture experiments by Moore et al. (1995) on Prochlorococcus strains MED4 and SS120 suggested that plasticity in the intracellular content of DVChl-a in different ecotypes may be restricted to a range of light levels not greater than ~2.5 orders of magnitude (Moore et al., 1995; Partensky et al., 1999). The high dynamic range in the DVChl-a cell-1 in the field data can be explained by the combined result of both photoacclimation and a vertical shift in dominant (HL and LL) ecotypes, given the limited range of intracellular pigment content observed in cultures.
Figure 7A shows that data points tended to separate into two clusters: one above the line of best fit corresponding to lower cell-specific DVChl-a concentration, and another below the line of best fit which corresponded to samples exhibiting higher DVChl-a content per cell. These clusters represent two distinct populations of Prochlorococcus cells occupying different vertical niches in the water column. The occurrence of a double or bimodal population is a common feature in flow cytometric studies that have examined the intensity of cellular fluorescence in the red due to DVChl-a (Campbell et al., 1994; Blanchot and Rodier, 1996; Thompson et al., 2018). Dim populations have a lower intracellular concentration of DVChl-a and thus lower cellular fluorescence, and tend to be found within the surface mixed layer. On the other hand, bright populations have markedly higher DVChl-a cell-1 and thus a much stronger fluorescence signal, and typically dominate near the bottom of the euphotic zone. Previous studies (Moore et al., 1998; Moore and Chisholm, 1999) on cultured isolates distinguished the dim and bright Prochlorococcus as HL- and LL-adapted ecotypes, respectively, according to the observation that the dim isolates have lower ratios of DVChl-b to DVChl-a (B/A ratios) than the bright ones over a range of growth irradiances. Molecular studies (Partensky and Garczarek, 2010 and references therein) later confirmed that the two ecotypes differentiated by B/A ratios are, in several ways, genetically distinct.
As illustrated in Figure 7B, ecotype differentiation in Prochlorococcus could account for variation in the intracellular DVChl-a concentration measured in this study. In the absence of genetic information for most of our datasets, B/A ratios were used instead to distinguish ecotypes in Prochlorococcus assemblages, with an increase in B/A ratios indicating a shift from HL ecotype-dominated populations toward populations dominated by LL-adapted strains. Note that only a subset of the HPLC dataset could be used for this analysis since for some datasets, DVChl-b was not separated from monovinyl Chl-b.
Figures 7A, B show a clear separation of HL (lower B/A ratios) and LL ecotypes (higher B/A ratios) based on their DVChl-a cell-1, highlighting how the two Prochlorococcus ecotypes are readily distinguished from each other on the basis of their intracellular pigment concentration. Note, however, that this rather crude pigment criterion for classifying HL and LL ecotype-dominated populations does not reflect the fact that both ecotypes can co-exist. A study by Thompson et al. (2018) conducted at station ALOHA reported the presence of the LL-adapted strain NATL (with relatively high B/A ratios; Rocap et al., 2002) in the surface Prochlorococcus populations characterized by low intracellular chlorophyll concentration. This was likely to be the result of deep vertical mixing of the water column that brought LL ecotype into the surface layer (Bouman et al., 2006; Thompson et al., 2018). The physiological and genetic characteristics that are intermediate between HL and LL ecotypes (Partensky and Garczarek, 2010) and the ability to be better acclimated to high light relative to other members of the same LL ecotype (Rocap et al., 2002; Malmstrom et al., 2010) allow the Prochlorococcus NATL to occupy a larger depth range than other clades (Partensky and Garczarek, 2010).
To examine the impact of shifts in ecotype diversity on variation in DVChl-a cell-1 requires that ecotype abundances were measured using molecular methods for each sample. Since this information was not available for many of the datasets, the B/A ratios were used to assist in the identification of certain Prochlorococcus strains. Comparative culture experiments by Partensky et al. (1993) on the isolates MED4 (HLI), SARG (LLI), and NATL (LLI) grown at different irradiance levels (~7.5-133.0 μmol quanta (white light) m-2 s-1) showed that the relationship between intracellular concentration of DVChl-a and DVChl-b (Figure 2 in Partensky et al., 1993) for the MED4 strain had a regression slope that was markedly different from those for SARG and NATL1 strains. Also, although B/A ratios for all strains exhibited a general decreasing trend with increasing growth irradiances, the B/A ratio of the MED4 strain was always less than 0.14, while those of the SARG and NATL1 strains were never found to fall below this value. The range of B/A ratios of the MED4 isolate reported in Partensky et al. (1993) is comparable to the results of Moore and colleagues (1995) who observed the range between 0.05 and 0.20 (growth irradiance >10-400 μmol quanta (white light) m-2 s-1), and of Rocap et al. (2002) who reported that the MED4 strain acclimating to low light at 18 μmol quanta (white light) m-2 s-1) (~1% of typical surface irradiance at subtropical gyres) had a B/A ratio of 0.20, which is the lowest among the 32 Prochlorococcus strains examined.
Based on the culture study of Partensky et al. (1993), Prochlorococcus samples which were likely to be dominated by the MED4 strain (B/A ratio< 0.14) were identified. As shown in Figure 7B (green outline circles), populations dominated by the MED4-like cells exhibited very low intracellular concentrations of DVChl-a, typical of HLI ecotypes, although the values were somewhat variable. Vertical profiles (data not shown) showed that DVChl-a cell-1 for samples identified as resembling Prochlorococcus HLI populations increased from ca 0.1 near the well-lit surface to up to 1.0 fg DVChl-a cell-1 below the euphotic depth (z/ze > 1). This increase was similar to the range previously observed in culture studies (Moore et al., 1995; Moore and Chisholm, 1999) and suggested photoacclimation in this ecotype.
Thus, the results presented in this study show that variability in DVChl-a cell-1 is likely to be the result of (1) changes in vertical distribution of genetically distinct HL and LL-adapted Prochlorococcus ecotypes, (2) photoacclimation of each ecotype to the local light environment through regulation of the intracellular concentration of the major light-harvesting pigment. The apparent link between genetic diversity and the inherent photophysiological characteristics of Prochlorococcus provides important insight to its ecological success (Johnson and Lin, 2009). Prochlorococcus is able to occupy a broad range of ocean niches from the sea surface to the bottom of the euphotic zone, and as a result, is a significant contributor to global marine primary production (Lange et al., 2018; Visintini et al., 2021). Because of its small and highly-sequenced genome, unique pigmentation, and its rapid identification based on its unique optical signature, Prochlorococcus has been widely used as a model organism for understanding relationships between environmental forcing and microbial processes across vast scales of organization (Partensky and Garczarek, 2010). However, several studies have pointed to differences in photoprotective mechanisms among picocyanobacterial taxa as well as when compared with eukaryotic phytoplankton (e.g. Key et al., 2010; Kulk et al., 2011; Mella-Flores et al., 2012). The question then arises whether Prochlorococcus can serve as an appropriate model for elucidating phytoplankton photoacclimation in general. In other words, are the photoacclimatory characteristics of Prochlorococcus similar to, or different from, those of eukaryotic species, including photosynthetic picoeukaryotes? Since, in many global ocean biogeochemical models, Prochlorococcus is normally classified together with Synechococcus and picoeukaryotes as a ‘pico-autotroph’ functional type (Le Quéré et al., 2005) based on their shared characteristics of being highly effective in nutrient and photon acquisition (Raven, 1998; Le Quéré et al., 2005), it is important to be able to compare photoacclimatory properties of picophytoplankton groups so that it can be justified, from a physiological point of view, whether it is appropriate to combine them into a common biogeochemical functional type.
4.2 Variability in derived carbon-to-DVChl-a ratios for Prochlorococcus
The carbon-to-Chl-a ratio (θ) of phytoplankton is widely used in phytoplankton growth models to represent the photophysiological status of microalgae and to convert Chl-a concentration to estimates of carbon standing stock (Geider, 1987; Geider et al., 1996; Geider et al., 1997; Sathyendranath et al., 2009; Sathyendranath et al., 2020). Studies (Geider, 1987; MacIntyre et al., 2002) have shown that, for various phytoplankton species grown under constant temperature and nutrient-replete conditions, θ increases linearly with increasing light level. Light-dependent variability in θ is the result of photophysiological mechanisms used by the cell to avoid the harmful overexcitation of photosystems under high light by lowering the cellular content of Chl-a and accumulating more carbon reflecting the increase in the photosynthetic utilization of the absorbed light energy. However, when cultures are maintained under constant light levels, θ decreases significantly with increased temperature, suggesting that high temperature may inhibit phytoplankton growth and thus reduce the demand for energy in the form of fixed carbon (Geider et al., 1997). Variation in θ is also regulated strongly by the availability of nutrients, particularly nitrogen which is a major component of the light-harvesting apparatus (Halsey and Jones, 2015). In addition, since the cellular quota of Chl-a differ widely between phytoplankton taxa (MacIntyre et al., 2002), it can be expected that θ also varies across taxa.
The choices of the carbon conversion factor used to convert phytoplankton cell density to carbon biomass could introduce unconstrained variance in our estimates of θPro. The conversion factors used in this study were either directly measured on cultures (Cailliau et al., 1996) or on oligotrophic populations (Casey et al., 2013). In a different approach, Grob et al. (2007a) independently derived the cellular carbon content of Prochlorococcus from total particle beam attenuation coefficient measurements conducted in the South Pacific Subtropical Gyre and obtained a much lower value of 29 fg C cell-1 which is in line with that determined by Zubkov et al. (2000) based on cell volume (by size fractionating filtration) on field samples. Later, Zubkov (2014) carried out alternative measurements of cellular biomass using the 14CO2-tracer method and acquired a considerably low value of 11 fg C cell-1 for surface Prochlorococcus populations in the equatorial and temperate South Atlantic. This suggests that there is no universal cell-specific carbon conversion factor (Veldhuis and Kraay, 2004) and shows that such conversion factors vary widely depending on the method as well as the natural and experimental growth conditions of the cells. Attempts have been made, particularly in culture studies on axenic strains (Bertilsson et al., 2003), to refine taxon-specific conversion factors to aid the assessment of the contribution of the phytoplankton standing stock to the ocean carbon pool. Independent information including the genome size and optical properties (Veldhuis and Kraay, 2004) will also help to improve phytoplankton carbon conversion factors for use in marine biogeochemical studies. As the divergence between clusters of the surface and deep populations lessens when applying a higher conversion factor to deeper samples (Figure 8B) and as the explained amount of variance increases at the same time, we feel that further effort is required to measure the carbon content on natural Prochlorococcus populations in general, and within and below the deep chlorophyll maximum, in particular. Differences in the size distribution of surface and deep Prochlorococcus populations suggest that applying conversion factors based on biovolume may help address the problem of converting cell abundances into carbon standing stocks (Casey et al., 2013).
The high and variable values of θPro observed in this study clearly demonstrate that Prochlorococcus has tremendous physiological plasticity to acclimate to the wide range of environmental conditions in which it lives. In general, picocyanobacteria tend to have higher and more variable θ than eukaryotic micro- and nanophytoplankton (i.e. diatoms, dinoflagellates, and nano-prymnesiophytes (Veldhuis and Kraay, 2004; Sathyendranath et al., 2009). Larger eukaryotes, notably diatoms which are known to be successful in fluctuating light environments (more deeply mixed waters) (Claustre et al., 1994), have been shown to be intrinsically less sensitive to photodamage not only owing to their large cell size and corresponding high pigment packaging (Key et al., 2010), but also because they are able to maintain their constitutive resource investments in photoprotection under varying light regimes (Talmy et al., 2013; Halsey and Jones, 2015), which in turn is reflected in a relatively stable θ. In contrast, small picocyanobacteria, which are adapted to more stable water columns, can adjust the proportion of cellular resources allocated to light-harvesting apparatus in response to shifts in irradiance (Talmy et al., 2013), resulting in highly variable intracellular concentrations of photosynthetic pigments (Moore et al., 1995) and thus θ. However, within the picoplankton size range, it remains unclear whether cyanobacteria significantly differ from photosynthetic eukaryotes with respect to variation in θ since studies that directly compare the θ values of the two picophytoplankton groups under similar growth conditions are rare (Table 3).
In comparison to picocyanobacteria, picoeukaryotes have been found to be better adapted to grow in ocean habitats characterized by more extreme physical dynamics (Bouman et al., 2011). Laboratory studies (Kulk et al., 2011; Stawiarski et al., 2018) have demonstrated that photosynthetic picoeukaryotes are able to maintain the high growth rates over a wide range of irradiances and are less affected by photoinhibition at high light. Therefore, it is reasonable to anticipate that our estimates of θPro should be higher and more variable than those of picoeukaryotes. This expectation is consistent with the findings of Veldhuis and Kraay (2004) who examined flow cytometry samples from oligotrophic subtropical waters of the North Atlantic using an independent approach for converting cellular DNA content to phytoplankton carbon biomass. The study showed that θPro decreased substantially from a maximum of 450 g C (g DVChl-a)-1 at the surface to a minimum of 15 g C (g DVChl-a)-1 at 150 m, whereas θ of the collective pico- and nanoeukaryote communities also decreased with depth, although to a much lesser extent (3-7 fold variation) with surface values of 30-80 g C (g Chl-a)-1. The reduced vertical variation in θ observed for photosynthetic eukaryotes was likely due in part to a co-variation of cell pigment content and size as reflected by the increases in both the intracellular concentration of Chl-a and the genome size (proportional to cell size) with depth. A culture experiment by Kulk et al. (2011) also showed that θPro varied from 14 ± 1.27 to 43 ± 1.17 g C (g DVChl-a)-1 under variable light intensities (50-125 μmol quanta m-2 s-1), while the observed range for the picoeukaryote Ostreococcus sp. was only between 39 ± 1.89 and 40 ± 0.99 g C (g DVChl-a)-1. Determining whether the observed differences in the overall variability in θ between picophytoplankton populations reported here is the result of changes in the inherent difference in photoadaption or an artifact of not accounting for shifts in cell size within natural populations should be a focus of future research as it will allow us to leverage the wealth of global data on their abundance and pigment markers in order to better represent these globally-significant primary producers in the ocean carbon cycle.
5 Conclusions
The wealth of pigment and flow cytometry data obtained from a range of open-ocean environments allowed examination of the vertical variation in the photoprotective pigment (PPP) index and relation to photoacclimatory responses of individual phytoplankton cells through changes in their intracellular pigment complement, in particular the relative concentrations of PPPs and photosynthetic pigments (PSP).
The PPP index varied significantly in response to depth-dependent changes in the underwater light conditions (indexed by the dimensionless depth z/ze), photoacclimatory status, and gross phytoplankton community structure (determined by pigment markers and cell counts). Vertical variability in the PPP index was especially pronounced in the subtropical gyres and low-latitude HNLC regions, and observations from the BATS time series showed that there is also a seasonal component to changes in the PPP index: the summer and early autumn surface communities dominated by high-light acclimated picocyanobacteria were characterized by a higher PPP index, which was largely caused by the presence of a strongly stratified water column.
At the cellular level, variation in the PPP index in Prochlorococcus was found to be associated primarily with changes in the intracellular concentration of DVChl-a rather than PPPs. The marked increase in DVChl-a cell-1 with depth was the result of both a photoacclimatory response to low light through increasing the intracellular concentration of DVChl-a in order to harvest sufficient light to support net growth and a shift from high light-acclimated (HL) to low light-acclimated (LL) ecotypes which are inherently more pigmented as a result of evolutionary adaptation to low-light conditions.
The vertical partitioning of ecotypes allows this marine picocyanobacterium to adapt to a wide range of light and nutrient conditions which is also reflected by the observed variability in derived values of θPro computed from flow cytometry counts, pigment data, and published conversion factors. Estimates of θPro appeared to be far more variable than θ values for eukaryotic phytoplankton reported in the literature, implying that Prochlorococcus is more sensitive to changes in growth irradiance and must therefore regulate the cellular constituents involved in light harvesting and photoprotection, whereas microalgae have been shown to be more resilient to changes in light history (Claustre et al., 1994) and less vulnerable to photodamage at high light (Key et al., 2010).
These results serve to underscore the importance of considering the physiological plasticity of different phytoplankton groups when using pigments and cell counts as proxies of phytoplankton biomass or chemotaxonomic markers. The unique pigment signatures of Prochlorococcus can be used to not only map their distribution but also provide insight into variation in the physiological status of the natural populations of this globally-significant cyanobacterium, which can, in turn, aid us in understanding how the long-term effect of global warming and its anticipated impact on upper ocean stratification may affect this genus that dominates a large fraction of the global ocean. Developing a mechanistic understanding of how Chl-a, PSPs, and PPPs change relative to one another at the cellular level across different taxa and how they change in response to environmental forcing is required if these pigments are to be used to derive estimates of phytoplankton carbon biomass, taxa, and θ from in situ and satellites observations.
Data availability statement
Publicly available datasets were analyzed in this study. This data can be found here: https://www.bodc.ac.uk/data/bodc_database/samples/ (pigment and AFC data; AMT dataset); http://batsftp.bios.edu/BATS/bottle/ (pigment and AFC data; BATS dataset); http://www.obs-vlfr.fr/proof/php/x_datalist.php?xxop=biosope&xxcamp=biosope (pigment and AFC data; BIOSOPE dataset) https://doi.org/10.1594/PANGAEA.93815 (pigment data, DCM dataset); https://doi.org/10.1594/PANGAEA.761718 (AFC data, DCM dataset); https://www.bodc.ac.uk/data/bodc_database/ctd/search/ (CTD profiles; AMT dataset); http://batsftp.bios.edu/BATS/prelim/ctd/ (CTD profiles; BATS dataset); http://www.obs-vlfr.fr/proof/php/bio_log_basicfiles.php (CTD profiles; BIOSOPE dataset); https://doi.org/10.1594/PANGAEA.761693 (CTD profiles; DCM dataset).
Author contributions
HB conceived the study. SP analyzed the data. HB and SP drafted the manuscript. All authors contributed to the writing of the manuscript, and approved the submitted version.
Funding
SP’s studentship at the University of Oxford was funded by the Ministry of Education, Royal Thai Government through the Development and Promotion of Science and Technology Talents (DPST) Project. HB’s work was supported by the European Space Agency’s BICEP Project. BATS program recognizes support from the National Science Foundation Chemical and Biological Oceanography Programs through the following awards: OCE 0326885, OCE 0752366, and OCE- 0801991. GT’s involvement was supported through the Atlantic Meridional Transect Program, funded by the UK Natural Environment Research Council through its National Capability Long-term Single Centre Science Programme, Climate Linked Atlantic Section Science (grant number NE/R015953/1). The BIOSOPE project is part of the LEFE-CYBER program and is funded by the Centre National de la Recherche Scientifique (CNRS), the Insitut des Science de l’Univers (INSU), the Centre National d’Etudes Saptiales (CNES), ESA, NASA, and the Natural Science and Engineering Research Council of Canada (NSERC). SS also acknowledges support from Simons. Foundation Project Collaboration on Computational Biogeochemical Modeling of Marine Ecosystems (CBIOMES; 549947, SS). The Atlantic Meridional Transect is funded by the UK Natural Environment Research Council through its National Capability Longterm Single Centre Science Programme, Climate Linked Atlantic Sector Science (grant number NE/R015953/1). This study contributes to the international IMBeR project and is contribution number 387 of the AMT program.
Conflict of interest
The authors declare that the research was conducted in the absence of any commercial or financial relationships that could be construed as a potential conflict of interest.
Publisher’s note
All claims expressed in this article are solely those of the authors and do not necessarily represent those of their affiliated organizations, or those of the publisher, the editors and the reviewers. Any product that may be evaluated in this article, or claim that may be made by its manufacturer, is not guaranteed or endorsed by the publisher.
References
Aiken J., Pradhan Y., Barlow R. G., Lavender S. J., Poulton A., Hardman-Mountford N. J. (2009). Phytoplankton pigments and functional types in the Atlantic ocean: a decadal assessment 1995-2005. Deep. Sea. Res. Part II: Top. Stud. Oceanogr. 56 (15), 899–917. doi: 10.1016/j.dsr2.2008.09.017
Babin M., Morel A., Claustre H., Bricaud A., Kolber Z., Falkowski P. G. (1996). Nitrogen- and irradiance-dependent variations of the maximum quantum yield of carbon fixation in eutrophic, mesotrophic and oligotrophic marine systems. Deep-Sea Res. I: Oceanogr. Res. Pap. 43 (8), 1241–1272. doi: 10.1016/0967-0637(96)00058-1
Barlow R. G., Aiken J., Moore G. F., Holligan P. M., Lavender S. J. (2004). Pigment adaptations in surface phytoplankton along the eastern boundary of the Atlantic ocean. Mar. Ecol. Prog. Ser. 281, 13–26. doi: 10.3354/meps281013
Barlow R. G., Cummings D. G., Gibb S. W. (1997). Improved resolution of mono- and divinyl chlorophylls a and b and zeaxanthin and lutein in phytoplankton extracts using reverse phase c-8 HPLC. Mar. Ecol. Prog. Ser. 161, 303–307. doi: 10.3354/meps161303
Barrera-Rojas J., de la Vara L. G., Ríos-Castro E., Leyva-Castillo L. E., Gómez-Lojero C. (2018). The distribution of divinyl chlorophylls a and b and the presence of ferredoxin-NADP+ reductase in Prochlorococcus marinus MIT9313 thylakoid membranes. Heliyon. 4, e01100. doi: 10.1016/j.heliyon.2018.e01100
Bertilsson S., Berglund O., Karl D. M., Chisholm S. W. (2003). Elemental composition of marine Prochlorococcus and Synechococcus: implications for the ecological stoichiometry of the sea. Limnol. Oceanogr. 48 (5), 1721–1731. doi: 10.4319/lo.2003.48.5.1721
Bidigare R. R. (1991). “Analysis of algal chlorophylls and carotenoids,” in Marine particles: Analysis and characterization. Eds. Hurd D. C., Spencer D. W. (Washington D.C: American Geophysical Union), 119–123.
Bidigare R. R., Van Heukelem L., Trees C. C. (2005). “Analysis of algal pigments by high-performance liquid chromatography,” in Algal culturing techniques. Ed. Andersen R. A. (Burlington, MA: Academic Press), 432–435.
Blanchot J., André J. M., Navarette C., Neveux J., Radenac M. H. (2001). Picophytoplankton in the equatorial pacific: vertical distributions in the warm pool and in the high nutrient low chlorophyll conditions. Deep-Sea Res. I: Oceanogr. Res. Pap. 48 (1), 297–314. doi: 10.1016/S0967-0637(00)00063-7
Blanchot J., Rodier M. (1996). Picophytoplankton abundance and biomass in the western tropical pacific ocean during the 1992 El nino year: results from flow cytometry. Deep-Sea Res. I: Oceanogr. Res. Pap. 43 (6), 877–895. doi: 10.1016/0967-0637(96)00026-X
Bouman H. A., Platt T., Kraay G. W., Sathyendranath S., Irwin B. D. (2000). Bio-optical properties of the subtropical north atlantic. i. vertical variability. Mar. Ecol. Prog. Ser. 200, 3–18. doi: 10.3354/meps200003
Bouman H. A., Ulloa O., Barlow R. G., Li W. K. W., Platt T., Zwirglmaier K., et al. (2011). Water-column stratification governs the community structure of subtropical marine picophytoplankton. Environ. Microbiol. Rep. 3 (4), 473–482. doi: 10.1111/j.1758-2229.2011.00241.x
Bouman H. A., Ulloa O., Scanlan D. J., Zwirglmaier K., Li W. K. W., Platt T., et al. (2006). Oceanographic basis of the global surface distribution of Prochlorococcus ecotypes. Science. 312 (5775), 918–921. doi: 10.1126/science.1122692
Buitenhuis E. T., Li W. K. W., Vaulot D., Lomas M. W., Landry M. R., Partensky F., et al. (2012). Picophytoplankton biomass distribution in the global ocean. Earth Syst. Sci. Data. 4 (1), 37–46. doi: 10.5194/essd-4-37-2012
Cailliau C., Claustre H., Vidussi F., Marie D., Vaulot D. (1996). Carbon biomass, and gross growth rates as estimated from 14C pigment labelling, during photoacclimation in Prochlorococcus CCMP 1378. Mar. Ecol. Prog. Ser. 145, 209–221. doi: 10.3354/meps145209
Campbell L., Nolla H. A., Vaulot D. (1994). The importance of Prochlorococcus to community structure in the central north pacific ocean. Limnol. Oceanogr. 39 (4), 954–961. doi: 10.4319/lo.1994.39.4.0954
Campbell L., Vaulot D. (1993). Photosynthetic picoplankton community structure in the subtropical north pacific ocean near Hawaii (station ALOHA). Deep-Sea Res. I: Oceanogr. Res. Pap. 40 (10), 2043–2060. doi: 10.1016/0967-0637(93)90044-4
Casey J. R., Aucan J. P., Goldberg S. R., Lomas M. W. (2013). Changes in partition of carbon amongst photosynthetic pico- and nano-plankton groups in the Sargasso Sea in response to changes in the north Atlantic oscillation. Deep-Sea Res. Part II: Top. Stud. Oceanogr. 93, 58–70. doi: 10.1016/j.dsr2.2013.02.002
Cermeño P., Dutkiewicz S., Harris R. P., Follows M. J., Schofield O. M., Falkowski P. G. (2008). The role of nutricline depth in regulating the ocean carbon cycle. Proc. Natl. Acad. Sci. U.S.A. 105 (51), 20344–20349. doi: 10.1073/pnas.0811302106
Claustre H., Kerhervé P., Marty J.-C., Prieur L. (1994). Phytoplankton photoadaptation related to some frontal physical processes. J. Mar. Syst. 5 (3–5), 251–265. doi: 10.1016/0924-7963(94)90050-7
Claustre H., Marty J.-C. (1995). Specific phytoplankton biomasses and their relation to primary production in the subtropical north Atlantic. Deep-Sea Res. I: Oceanogr. Res. Pap. 42 (8), 1475–1493. doi: 10.1016/0967-0637(95)00053-9
Cullen J. J., Franks P. J. S., Karl D. M., Longhurst A. R. (2002). “Physical influences on marine ecosystem dynamics,” in The Sea, vol. Vol. 12 . Eds. Robinson A. R., McCarthy J. J., Rothschild B. J. (New York: John Willey & Sons), 297–336.
Dimier C., Giovanni S., Ferdinando T., Brunet C. (2009). Comparative ecophysiology of the xanthophyll cycle in six marine phytoplanktonic species. Protist. 160 (3), 397–411. doi: 10.1016/j.protis.2009.03.001
DuRand M. D., Olson R. J., Chisholm S. W. (2001). Phytoplankton population dynamics at the Bermuda Atlantic time-series station in the Sargasso Sea. Deep. Sea. Res. Part II: Top. Stud. Oceanogr. 48 (8–9), 1983–2003. doi: 10.1016/S0967-0645(00)00166-1
Dusenberry J. A., Olson R. J., Chisholm S. W. (1999). Frequency distributions of phytoplankton single-cell fluorescence and vertical mixing in the surface ocean. Limnol. Oceanogr. 44 (2), 431–435. doi: 10.4319/lo.1999.44.2.0431
Dutkiewicz S., Hickman A. E., Jahn O., Henson S., Beaulieu C., Monier E. (2019). Ocean colour signature of climate change. Nat. Commun. 10, 578. doi: 10.1038/s41467-019-08457-x
Fawcett S. E., Lomas M. W., Casey J. R., Ward B. B., Sigman D. M. (2011). Assimilation of upwelled nitrate by small eukaryotes in the Sargasso Sea. Nat. Geosci. 4 (10), 717–722. doi: 10.1038/ngeo1265
Geider R. J. (1987). Light and temperature dependence of the carbon to chlorophyll a ratio in microalgae and cyanobacteria: implications for physiology and growth of phytoplankton. New Phytol. 106 (1), 1–34. doi: 10.1111/j.1469-8137.1987.tb04788.x
Geider R. J., MacIntyre H. L., Kana T. M. (1996). A dynamic model of photoadaptation in phytoplankton. Limnol. Oceanogr. 41, 1–15. doi: 10.4319/lo.1996.41.1.0001
Geider R. J., MacIntyre H. L., Kana T. M. (1997). Dynamic model of phytoplankton growth and acclimation: responses of the balanced growth rate and the chlorophyll a:carbon ratio to light, nutrient-limitation and temperature. Mar. Ecol. Prog. Ser. 148, 187–200. doi: 10.3354/meps148187
Gieskes W. W. C., Kraay G. W., Nontji A., Setiapermana D., Sutomo (1988). Monsoonal alternation of a mixed and a layered structure in the phytoplankton of the euphotic zone of the banda Sea (Indonesia): a mathematical analysis of algal pigment fingerprints. Neth. J. Sea Res. 22, 123–137. doi: 10.1016/0077-7579(88)90016-6
Grébert T., Doré H., Partensky F., Farrant G. K., Boss E. S., Picheral M., et al. (2018). Light color acclimation is a key process in the global ocean distribution of Synechococcus cyanobacteria. Proc. Natl. Acad. Sci. U.S.A. 115 (9), E2010–E2019. doi: 10.1073/pnas.1717069115
Grob C., Ulloa O., Claustre H., Huot Y., Alarcón G., Marie D. (2007a). Contribution of picoplankton to the total particulate organic carbon (POC) concentration in the eastern south pacific. Biogeosciences. 4, 837–852. doi: 10.5194/bgd-4-1461-2007
Grob C., Ulloa O., Li W. K. W., Alarcón G., Fukasawa M., Watanabe S. (2007b). Picoplankton abundance and biomass across the eastern south pacific ocean along latitude 32.5°S. Mar. Ecol. Prog. Ser. 332, 53–62. doi: 10.3354/meps332053
Halsey K. H., Jones B. M. (2015). Phytoplankton strategies for photosynthetic energy allocation. Annu. Rev. Mar. Sci. 7 (1), 265–297. doi: 10.1146/annurev-marine-010814-015813
Hartmann M., Gomez-Pereira P., Grob C., Ostrowski M., Scanlan D. J., Zubkov M. V. (2014). Efficient CO2 fixation by surface Prochlorococcus in the Atlantic ocean. ISME J. 8 (11), 2280–2289. doi: 10.1038/ismej.2014.56
Hickman A. E., Dutkiewicz S., Williams R. G., Follows M. J. (2010). Modelling the effects of chromatic adaptation on phytoplankton community structure in the oligotrophic ocean. Mar. Ecol. Prog. Ser. 406, 1–17. doi: 10.3354/meps08588
Hirata T., Aiken J., Hardman-Mountford N. J., Smyth T. J., Barlow R. G. (2008). An absorption model to determine phytoplankton size classes from satellite ocean colour. Remote Sens. Environ. 112 (6), 3153–3159. doi: 10.1016/j.rse.2008.03.011
Johnsen G., Norli M., Moline M. A., Robbins I., Quillfeldt C., Von Sørensen K., et al. (2018). The advective origin of an under-ice spring bloom in the Arctic ocean using multiple observational platforms. Polar Biol. 41, 1197–1216. doi: 10.1007/s00300-018-2278-5
Johnson Z. I., Lin Y. (2009). Prochlorococcus: approved for export. Proc. Natl. Acad. Sci. U.S.A. 106 (26), 10400–104001. doi: 10.1073/pnas.0905187106
Kana T. M., Glibert P. M., Goericke R., Welschmeyer N. A. (1988). Zeaxanthin and β-carotene in Synechococcus WH7803 respond differently to irradiance. Limnol. Oceanogr. 33 (6), 1623–1627. doi: 10.4319/lo.1988.33.6part2.1623
Karl D. M. (1999). A sea of change: biogeochemical variability in the north pacific subtropical gyre. Ecosystems. 2 (3), 181–214. doi: 10.1007/s100219900068
Key T., McCarthy A., Campbell D. A., Six C., Roy S., Finkel Z. V. (2010). Cell size trade-offs govern light exploitation strategies in marine phytoplankton. Environ. Microbiol. 12 (1), 95–104. doi: 10.1111/j.1462-2920.2009.02046.x
Kirk J. T. O. (2011). Light and photosynthesis in aquatic ecosystems (3rd ed.) (Cambridge: Cambridge University Press). doi: 10.1017/CBO9781139168212
Kulk G., de Poll W. H., Visser R. J. W., Buma A. G. J. (2011). Distinct differences in photoacclimation potential between prokaryotic and eukaryotic oceanic phytoplankton. J. Exp. Mar. Biol. Ecol. 398 (1–2), 63–72. doi: 10.1016/j.jembe.2010.12.011
Lange P. K., Brewin R. J. W., Dall’Olmo G., Tarran G. A., Sathyendranath S., Zubkov M. V., et al. (2018). Scratching beneath the surface: a model to predict the vertical distribution of Prochlorococcus using remote sensing. Remote Sens. 10 (6), 847. doi: 10.3390/rs10060847
Larkrin A. A., Moreno A. R., Fagan A. J., Fowlds A., Ruiz A., Martinty A. C. (2020). Persistent El niño driven shifts in marine cyanobacteria populations. PLos One 15 (9), e0238405. doi: 10.1371/journal.pone.0238405
Latasa M., Scharek R., Morán X. A. G., Gutiérrez-Rodríguez A., Emelianov M., Salat J., et al. (2022). Dynamics of phytoplankton groups in three contrasting situations of the open NW Mediterranean Sea revealed by pigment, microscopy, and flow cytometry analyses. Prog. Oceanogr. 201, 102737. doi: 10.1016/j.pocean.2021.102737
Le Quéré C., Harrison S. P., Colin Prentice I., Buitenhuis E. T., Aumont O., Bopp L., et al. (2005). Ecosystem dynamics based on plankton functional types for global ocean biogeochemistry models. Glob. Change Biol. 11, 2016–2040. doi: 10.1111/j.1365-2486.2005.1004.x
Letelier R. M., White A. E., Bidigare R. R., Barone B., Church M. J., Karl D. M. (2017). Light absorption by phytoplankton in the north pacific subtropical gyre. Limnol. Oceanogr. 62, 1526–1540. doi: 10.1002/lno.10515
Liu H., Probert I., Uitz J., Claustre H., Aris-Brosou S., Frada M., et al. (2009). Extreme diversity in noncalcifying haptophytes explains a major pigment paradox in the open oceans. Proc. Nat. Acad. Sci. 106, 12803–12808. doi: 0.1073/pnas.0905841106
MacIntyre H. L., Kana T. M., Anning T., Geider R. J. (2002). Photoacclimation of photosynthesis irradiance response curves and photosynthetic pigments in microalgae and cyanobacteria. J. Physiol. 38 (1), 17–38. doi: 10.0000/135184797337543
Malmstrom R. R., Coe A., Kettler G. C., Martiny A. C., Frias-Lopez J., Zinser E. R., et al. (2010). Temporal dynamics of Prochlorococcus ecotypes in the Atlantic and pacific oceans. ISME J. 4, 1252–1264. doi: 10.1038/ismej.2010.60
Malmstrom R. R., Rodrigue S., Huang K. H., Kelly L., Kern S. E., Thompson A., et al. (2013). Ecology of uncultured Prochlorococcus clades revealed through single-cell genomics and biogeographic analysis. ISME J. 7 (1), 184–198. doi: 10.1038/ismej.2012.89
Marañón E. (2005). Phytoplankton growth rates in the Atlantic subtropical gyres. Limnol. Oceanogr. 50 (1), 299–310. doi: 10.4319/lo.2005.50.1.0299
Matsumoto K., Ando K. (2009). Use of cyanobacterial pigments to characterize the ocean surface mixed layer in the western pacific warm pool. J. Mar. Syst. 75, 245–252. doi: 10.1016/j.jmarsys.2008.10.007
Mella-Flores D., Six C., Ratin M., Partensky F., Boutte C., Le Corguille G., et al. (2012). Prochlorococcus and Synechococcus have evolved different adaptive mechanisms to cope with light and UV stress. Front. Microbiol. 3 (285). doi: 10.3389/fmicb.2012.00285
Moore L. R., Chisholm S. W. (1999). Photophysiology of the marine cyanobacterium Prochlorococcus: ecotypic differences among cultured isolates. Limnol. Oceanogr. 44, 628–638. doi: 10.4319/lo.1999.44.3.0628
Moore L. R., Goericke R., Chisholm S. W. (1995). Comparative physiology of Synechococcus and Prochlorococcus: influence of light and temperature on growth, pigment, fluorescence and absorptive properties. Mar. Ecol. Prog. Ser. 116, 259–275. doi: 10.3354/meps116259
Moore L. R., Rocap G., Chisholm S. W. (1998). Physiology and molecular phylogeny of coexisting Prochlorococcus ecotypes. Nature. 393, 464–467. doi: 10.1038/30965
Morel A., Huot Y., Gentili B., Werdell P. J., Hooker S. B., Franz B. A. (2007). Examining the consistency of products derived from various ocean color sensors in open ocean (Case I) waters in the perspective of a multi-sensor approach. Remote Sens. Environ. 111, 69–88. doi: 10.1016/j.rse.2007.03.012
Morel A., Maritorena S. (2001). Bio-optical properties of oceanic waters: a reappraisal. J. Geophys. Res. Oceans. 106 (C4), 7163–7180. doi: 10.1029/2000JC000319
Olson R. J., Chisholm S. W., Zettler E. R., Altabet M. A., Dusenberry J. A. (1990). Spatial and temporal distributions of prochlorophytes picoplankton in the north Atlantic ocean. Deep-Sea Res. I: Oceanogr. Res. Pap. 37 (6), 1033–1051. doi: 10.1016/0198-0149(90)90109-9
Partensky F., Blanchot J., Latoine F., Neveux J., Marie D. (1996). Vertical structure of picophytoplankton at different trophic sites of the tropical northeastern Atlantic ocean. Deep-Sea Res. I: Oceanogr. Res. Pap. 43 (8), 1191–1213. doi: 10.1016/0967-0637(96)00056-8
Partensky F., Garczarek L. (2010). Prochlorococcus: advantages and limits of minimalism. Annu. Rev. Mar. Sci. 2, 305–331. doi: 10.1146/annurev-marine-120308-081034
Partensky F., Hess W. R., Vaulot D. (1999). Prochlorococcus, a marine photosynthetic prokaryote of global significance. Microbiol. Mol. Biol. Rev. 63 (1), 106–127. doi: 10.1128/MMBR.63.1.106-127.1999
Partensky F., Hoepffner N., Li W. K. W., Ulloa O., Vaulot D. (1993). Photoacclimation of Prochlorococcus sp. (Prochlorophyta) strains isolated from the north Atlantic and the Mediterranean Sea. Plant Physiol. 101, 285–296. doi: 10.1104/pp.101.1.285
Polovina J. J., Howell E. A., Abecassis M. (2008). Ocean’s least productive waters are expanding. Geophys. Res. Lett. 35 (3), L03618. doi: 10.1029/2007GL031745
Poulton A. J., Holligan P. M., Hickman A. E., Kim Y.-N. K., Adey T. R., Stinchcombe M. C., et al. (2006). Phytoplankton carbon fixation, chlorophyll-biomass and diagnostic pigments in the Atlantic ocean. Deep. Sea. Res. Part II: Top. Stud. Oceanogr. 53, 1593–1610. doi: 10.1016/j.dsr2.2006.05.007
Ras J., Claustre H., Uitz J. (2008). Spatial variability of phytoplankton pigment distributions in the subtropical south pacific ocean: comparison between in situ and predicted data. Biogeosciences. 5, 353–369. doi: 10.5194/bg-5-353-2008
Raven J. A. (1998). The twelfth tansley lecture. small is beautiful: the picophytoplankton. Funct. Ecol. 12 (4), 503–513. doi: 10.1046/j.1365-2435.1998.00233.x
Rocap G., Distel D. L., Waterbury J. B., Chisholm S. W. (2002). Resolution of Prochlorococcus and Synechococcus ecotypes by using 16S-23S ribosomal DNA internal transcribed spacer sequences. Appl. Environ. Microbiol. 68 (3), 1180–1191. doi: 10.1128/AEM.68.3.1180-1191.2002
Rusch D. B., Martiny A. C., Dupont C. L., Halpern A. L., Venter J. C. (2010). Characterization of Prochlorococcus clades from iron-depleted oceanic regions. Proc. Natl. Acad. Sci. U.S.A. 107 (37), 16184–16189. doi: 10.1073/pnas.1009513107
Sathyendranath S., Platt T., Kovač Ž., Dingle J., Jackson T., Brewin R. J. W., et al. (2020). Reconciling models of primary production and photoacclimation. Appl. Opt. 59 (10), 100–114. doi: 10.1364/AO.386252
Sathyendranath S., Stuart V., Nair A., Oka K., Nakane T., Bouman H. A., et al. (2009). Carbon-to-chlorophyll ratio and growth rate of phytoplankton in the sea. Mar. Ecol. Prog. Ser. 383, 73–84. doi: 10.3354/meps07998
Stawiarski B., Buitenhuis E. T., Fallens M. (2018). The physiological response of seven strains of picophytoplankton to light, and its representation in a dynamic photosynthesis model. Limnol. Oceanogr. 63, S367–S380. doi: 10.1002/lno.10745
Steinberg D. K., Carlson C. A., Bates N. R., Johnson R. J., Michaels A. F., Knap A. H. (2001). Overview of the US JGOFS Bermuda Atlantic time-series study (BATS): a decade-scale look at ocean biology and biogeochemistry. Deep. Sea. Res. Part II: Top. Stud. Oceanogr. 48, 1405–1447. doi: 10.1016/S0967-0645(00)00148-X
Swan C. M., Vogt M., Gruber N., Laufkoetter C. (2016). A global seasonal surface ocean climatology of phytoplankton types based on CHEMTAX analysis of HPLC pigments. Deep-Sea Res. I: Oceanogr. Res. Pap. 109, 137–156. doi: 10.1016/j.dsr.2015.12.002
Talmy D., Blackford J., Hardman-Mountford N. J., Dumbrell A. J., Geider R. J. (2013). An optimality model of photoadaptation in contrasting aquatic light regimes. Limnol. Oceanogr. 58 (5), 1802–1818. doi: 10.4319/lo.2013.58.5.1802
Thompson A. W., van den Engh G. J., Ahlgren N. A., Kouba K., Ward S., Wilson S. T., et al. (2018). Dynamics of Prochlorococcus diversity and photoacclimation during short-term shifts in water column stratification at station ALOHA. Front. Mar. Sci. 5. doi: 10.3389/fmars.2018.00488
Tragin M., Vaulot D. (2019). Novel diversity within marine mamiellophyceae (Chlorophyta) unveiled by metabarcoding. Sci. Rep. 9, 5190. doi: 10.1038/s41598-019-41680-6
Trees C. C., Clark D. K., Bidigare R. R., Ondrusek M. E., Mueller J. L. (2000). Accessory pigments versus chlorophyll a concentrations within the euphotic zone: a ubiquitous relationship. Limnol. Oceanogr. 45 (5), 1130–1143. doi: 10.4319/lo.2000.45.5.1130
Uitz J., Claustre H., Morel A., Hooker S. B. (2006). Vertical distribution of phytoplankton communities in open ocean: an assessment based on surface chlorophyll. J. Geophys. Res. Oceans. 111 (8), C08005. doi: 10.1029/2005JC003207
Uitz J., Huot Y., Bruyant F., Babin M., Claustre H. (2008). Relating phytoplankton photophysiological properties to community structure on large scales. Limnol. Oceanogr. 53 (2), 614–630. doi: 10.4319/lo.2008.53.2.0614
van Heukelem L., Thomas C. S. (2001). Computer-assisted high performance liquid chromatography method development with applications to the isolation and analysis of phytoplankton pigments. J. Chromatogr. A. 910 (1), 31–49. doi: 10.1016/S0378-4347(00)00603-4
Veldhuis M. J. W., Kraay G. W. (1990). Vertical distribution and pigment composition of a picoplanktonic prochlorophyte in the subtropical north Atlantic: a combined study of HPLC-analysis of pigments and flow cytometry. Mar. Ecol. Prog. Ser. 68, 121–127. doi: 10.3354/MEPS068121
Veldhuis M. J. W., Kraay G. W. (2004). Phytoplankton in the subtropical Atlantic ocean: towards a better assessment of biomass and composition. Deep-Sea Res. I: Oceanogr. Res. Pap. 51 (4), 507–530. doi: 10.1016/j.dsr.2003.12.002
Visintini N., Martiny A. C., Flombaum P. (2021). Prochlorococcus, Synechococcus, and picoeukaryotic phytoplankton abundances in the global ocean. Limnol. Oceanogr. Lett 6, 207–215. doi: 10.1002/lol2.10188
Wei Y., Sun J., Zhang X., Wang J., Huang K. (2019). Picophytoplankton size and biomass around equatorial eastern Indian ocean. MicrobiologyOpen. 8 (2), e629. doi: 10.1002/mbo3.629
Zubkov M. V. (2014). Faster growth of the major prokaryotic versus eukaryotic CO2 fixers in the oligotrophic ocean. Nat. Commun. 5, 3376. doi: 10.1038/ncomms4776
Zubkov M. V., Sleigh M. A., Burkill P. H., Leakey R. J. G. (2000). Picoplankton community structure on the Atlantic meridional transect: a comparison between seasons. Prog. Oceanogr. 45, 369–386. doi: 10.1016/S0079-6611(00)00008-2
Zubkov M. V., Sleigh M. A., Tarran G. A., Burkill P. H., Leakey R. J. G. (1998). Picoplanktonic community structure on an Atlantic transect from 50°N to 50°S. Deep-Sea Res. I: Oceanogr. Res. Pap. 45, 1339–1355. doi: 10.1016/S0967-0637(98)00015-6
Keywords: picocyanobacteria, Prochlorococcus, pigments, photoacclimation, phytoplankton, carbon-to-chlorophyll ratio
Citation: Phongphattarawat S, Bouman HA, Lomas MW, Sathyendranath S, Tarran GA, Ulloa O and Zubkov MV (2023) Ecophysiological basis of spatiotemporal patterns in picophytoplankton pigments in the global ocean. Front. Mar. Sci. 10:1112177. doi: 10.3389/fmars.2023.1112177
Received: 30 November 2022; Accepted: 30 January 2023;
Published: 14 February 2023.
Edited by:
Laura Lorenzoni, National Aeronautics and Space Administration (NASA), United StatesReviewed by:
François Ribalet, University of Washington, United StatesAlex J. Poulton, Heriot-Watt University, United Kingdom
Copyright © 2023 Phongphattarawat, Bouman, Lomas, Sathyendranath, Tarran, Ulloa and Zubkov. This is an open-access article distributed under the terms of the Creative Commons Attribution License (CC BY). The use, distribution or reproduction in other forums is permitted, provided the original author(s) and the copyright owner(s) are credited and that the original publication in this journal is cited, in accordance with accepted academic practice. No use, distribution or reproduction is permitted which does not comply with these terms.
*Correspondence: Sornsiri Phongphattarawat, c29ybnNpcmkucEBwaHVrZXQucHN1LmFjLnRo