Abstract
Nitrous oxide (N2O) is a potent greenhouse gas and ozone depleting substance, with the ocean accounting for about one third of global emissions. In marine environments, a significant amount of N2O is produced by biological processes in Oxygen Deficient Zones (ODZs). While recent technological advances are making surface N2O concentration more available, high temporal and spatial resolution water-column N2O concentration data are relatively scarce, limiting global N2O ocean models’ predictive capability. We present a N2O concentration, stable isotopic composition and isotopomer dataset of unprecedently large spatial coverage and depth resolution in the broader Pacific, crossing both the eastern tropical South and North Pacific Ocean ODZs collected as part of the GO-SHIP P18 repeat hydrography program in 2016/2017. We complement these data with dissolved gases (nitrogen, oxygen, argon) and nitrate isotope data to investigate the pathways controlling N2O production in relation to apparent oxygen utilization and fixed nitrogen loss. N2O yield significantly increased under low oxygen conditions near the ODZs. Keeling plot analysis revealed different N2O sources above the ODZs under different oxygen regimes. Our stable isotopic data and relationships between the N2O added by microbial processes (ΔN2O) and dissolved inorganic nitrogen (DIN) deficit confirm increased N2O production by denitrification under low oxygen conditions near the oxycline where the largest N2O accumulations were observed. The slope for δ18O-N2O versus site preference (SP, the difference between the central (α) and outer (β) N atoms in the linear N2O molecule) in the eastern tropical North Pacific ODZ was lower than expected for pure N2O reduction, likely because of the observed decrease in δ15Nβ. This trend is consistent with prior ODZ studies and attributed to concurrent production of N2O from nitrite with a low δ15N or denitrification with a SP >0‰. We estimated apparent isotope effects for N2O consumption in the ETNP ODZ of 3.6‰ for 15Nbulk, 9.4‰ for 15Nα, -2.3‰ for 15Nβ, 12.0‰ for 18O, and 11.7‰ for SP. These values were generally within ranges previously reported for previous laboratory and field experiments.
1 Introduction
Nitrous oxide (N2O) is mainly produced by microbial processes and contributes to climate change as a tropospheric greenhouse gas approximately 275 times more potent than CO2 on a per molecule basis (Forster et al., 2021). N2O produced at the Earth’s surface has a long atmospheric residence time of more than 100 years and is the main source of ozone-depleting nitric-oxide radicals in the stratosphere (Nevison and Holland, 1997; Ravishankara et al., 2009). Biogeochemical models estimate that the ocean accounts for about one third of global N2O emissions (Freing et al., 2012; Ciais et al., 2013; Tian et al., 2020; Forster et al., 2021) with a global oceanic flux estimate of 4.2 ± 1.0 Tg N y-1 (Yang et al., 2020). Coastal upwelling systems associated with Oxygen Deficient Zones (ODZs) account for up to 35% of the oceanic N2O total emissions (Bakker et al., 2014; Arévalo-Martínez et al., 2015; Yang et al., 2020), yet temporal variability from these productive coastal waters is still not well quantified.
N2O is produced in oxic ocean waters as a by-product of nitrification through the oxidation of hydroxylamine (NH2OH), an intermediate during ammonia (NH3) oxidation to nitrite (NO2-) by both archaeal and bacterial nitrifiers (Caranto and Lancaster, 2017) (Figure 1). Under low oxygen (O2)-conditions, ammonia oxidizing bacteria (AOB) produce N2O by nitrifier-denitrification, the sequential NO2- reduction to N2O during respiration (Goreau et al., 1980; Wrage et al., 2001; Frame and Casciotti, 2010). N2O is also produced by ammonia oxidizing archaea (AOA) following a hybrid pathway where one atom in the N2O molecule is derived from NH3 (e.g., NH2OH) and the other from NO2- (Trimmer et al., 2016). N2O production by nitrification leads to strong positive correlations between Apparent Oxygen Utilization (AOU) and ΔN2O (i.e., the difference between N2O measured and at atmospheric equilibrium) and nitrate (NO3-) concentrations (Yoshinari and Knowles, 1976; Cohen and Gordon, 1979; Nevison et al., 2003). N2O production yield per NO2- generated during nitrification by either AOA or AOB is generally low, varying from 0 to 2% of NO3- production (Yoshida et al., 1989; Frame and Casciotti, 2010; Santoro et al., 2010; Santoro et al., 2011; Löscher et al., 2012; Ryabenko et al., 2012) but is generally higher for AOB (Hink et al., 2017a; Hink et al., 2017b) and enhanced under low-O2 conditions according to both culture and field observations (up to 10% at low O2; Goreau et al., 1980; Ji et al., 2015).
Figure 1
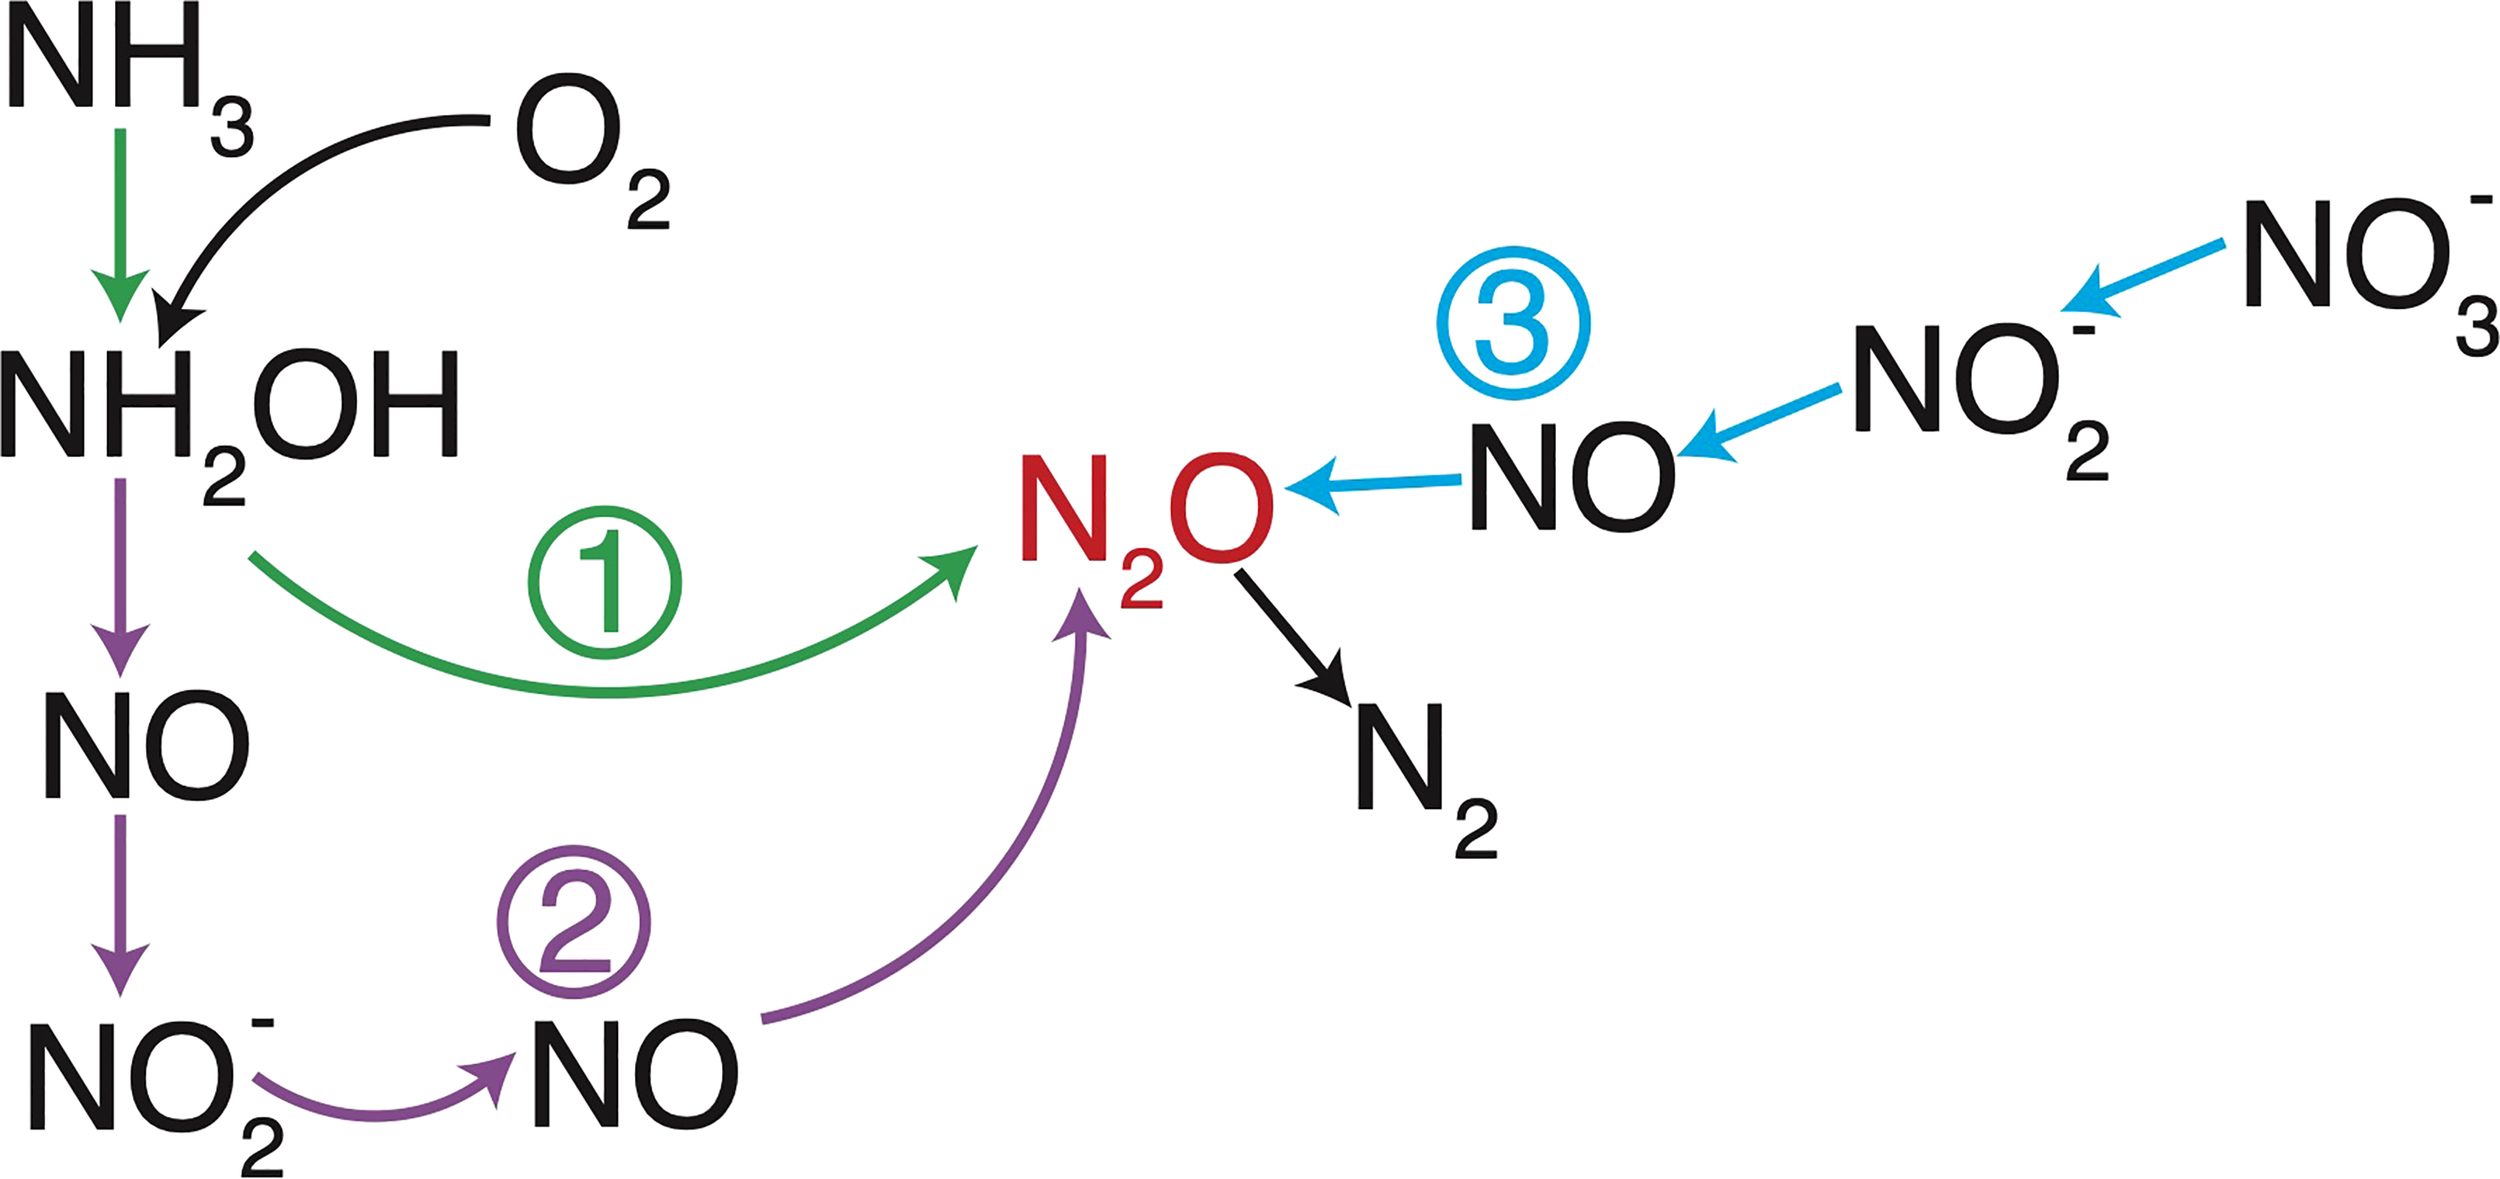
N2O production and consumption processes. N2O is produced by hydroxylamine oxidation (1, green) or nitrifier-denitrification (2, purple) during ammonia oxidation and denitrification (3, light blue) by bacteria and archaea. Modified from Bourbonnais et al. (2021).
Under anoxic conditions, denitrification, the sequential reduction of NO3-, NO2-, and NO to N2O, both produces and consumes N2O. Enhanced N2O production occurs under low-O2 conditions (generally below 10 µmol kg-1; Frey et al., 2020) due to different O2 sensitivities for the different steps involved in denitrification, with nitrous oxide reductase being inhibited by even nanomolar O2 concentrations (Dalsgaard et al., 2014). N2O produced by incomplete denitrification significantly accumulates in low-O2 conditions near the upper oxycline in the eastern tropical North Pacific (ETNP) and eastern tropical South Pacific (ETSP) ODZs (e.g., Ji et al., 2015; Kock et al., 2016; Bourbonnais et al., 2017; Casciotti et al., 2018; Frey et al., 2020; Kelly et al., 2021; Monreal et al., 2022). High N2O accumulations of up to 1 μmol L-1 were observed in surface waters off the Peru coast, where anoxic waters from the ETSP ODZ are continuously upwelled (Arévalo-Martínez et al., 2015). N2O accumulation is caused by a decoupling between N2O production and its reduction to N2 by denitrification, the latter process being less O2 tolerant (Dalsgaard et al., 2014). N2O is generally completely reduced to non-bioavailable N2 in anoxic waters. ODZs are thus generally net N2O sinks, with concentrations near or below atmospheric equilibrium concentrations (Bange et al., 2001; Yamagishi et al., 2007; Kock et al., 2016).
Natural stable isotopes are broadly used as tracers of N-cycle processes in the ocean which integrate over space and time (e.g., Sigman et al., 2005; Altabet, 2006; Bourbonnais et al., 2009; Bourbonnais et al., 2015). The N2O molecule contains both bulk (δ15N and δ18O) and, given its asymmetric arrangement of atoms, 15N site specific signatures that are valuable for identifying production and consumption processes. Bulk δ15N and δ18O are expressed as:
Units are in parts per thousand or per mil (‰) and R is the ratio of 15N/14N or 18O/16O. Reference materials are atmospheric N2 for N (scale AIR-N2) and mean ocean water for O (scale Vienna Standard Mean Ocean Water, V-SMOW). The bulk isotopic composition (δ15N and δ18O) of N2O depends in part on the isotopic composition of its substrates. For instance, for hydroxylamine oxidation, bulk N2O δ15N and δ18O depend on the δ15N of the source NH3 and δ18O of dissolved O2. Conversely for nitrifier-denitrification and denitrification, N2O δ15N and δ18O is dependent on the δ15N and δ18O of source NO3- and/or NO2- (Ostrom and Ostrom, 2012). Additionally, significant O exchange usually occurs between NO2- and H2O during N2O production by nitrifier-denitrification or denitrification (Buchwald and Casciotti, 2010; Kool et al., 2011), which acts to decouple the δ18O values of source and product.
Isotopic fractionation during nitrification and denitrification is the other major influence on the δ15N and δ18O of N2O. Kinetic isotope fractionation occurs as the molecules containing the lighter isotopes (e.g., 14N, 16O) react more quickly leaving the residual substrate enriched in heavier isotopes (e.g., 15N and 18O). The isotope effect (ε) is defined by:
where k1 and k2 are the specific reaction rates for the lighter and heavier isotope, respectively. N and O isotope effects (15ε, 18ε) during N2O production and consumption vary substantially in laboratory culture as well as in the environment (Bourbonnais et al., 2017 and references therein).
In contrast to bulk isotope values, N2O Site Preference (SP) is independent of initial isotopic composition of the substrate (Toyoda et al., 2002; Schmidt et al., 2004; Sutka et al., 2006). Thus, SP is generally process-dependent and can be used as a tracer to identify the source of N2O. SP is calculated from the difference in δ15N between the central (α) and outer (β) N atoms in the linear, asymmetrical N2O molecule (NNO):
Non-zero SP arises from the differential biochemical bond making and breaking experienced by each of the two N atoms as a consequence of their different molecular positions. Low SP isotopic signatures (-11 to 0‰) are associated with N2O production via NO2- reduction by nitrifier-denitrification or denitrification. Much higher SP values are indicative of abiotic N2O formation (Heil et al., 2014) or production by hydroxylamine oxidation (30-36‰) (Sutka et al., 2006; Frame and Casciotti, 2010). N2O isotopic signatures have consequently been classified into distinct compositional fields used to evaluate the relative contribution from different processes (e.g., Wankel et al., 2017 and reference therein). However, SP does increase as a result of isotope fractionation during consumption by denitrification as discussed above (Yamagishi et al., 2005; Ostrom et al., 2007; Yamagishi et al., 2007).
The main objectives of this study are to better understand nitrous oxide (N2O) distribution and production mechanisms along the meridional P18 transect in the eastern Pacific sampled as part of the U.S. GO-SHIP program (Figure 2). We sampled at an unprecedently high spatial resolution to investigate how N2O dynamics respond to changes in O2 concentrations and dissolved inorganic nitrogen (DIN) loss. We then evaluated pathways responsible for N2O production in sub-oxic waters (O2 > 5 μmol kg-1) overlying the ETNP and ETSP ODZs as well as deep waters using stable isotopes and isotopomers and Keeling plot analysis. We also investigated N2O cycling within the ETNP ODZ and estimated apparent isotope effects for N2O consumption.
Figure 2
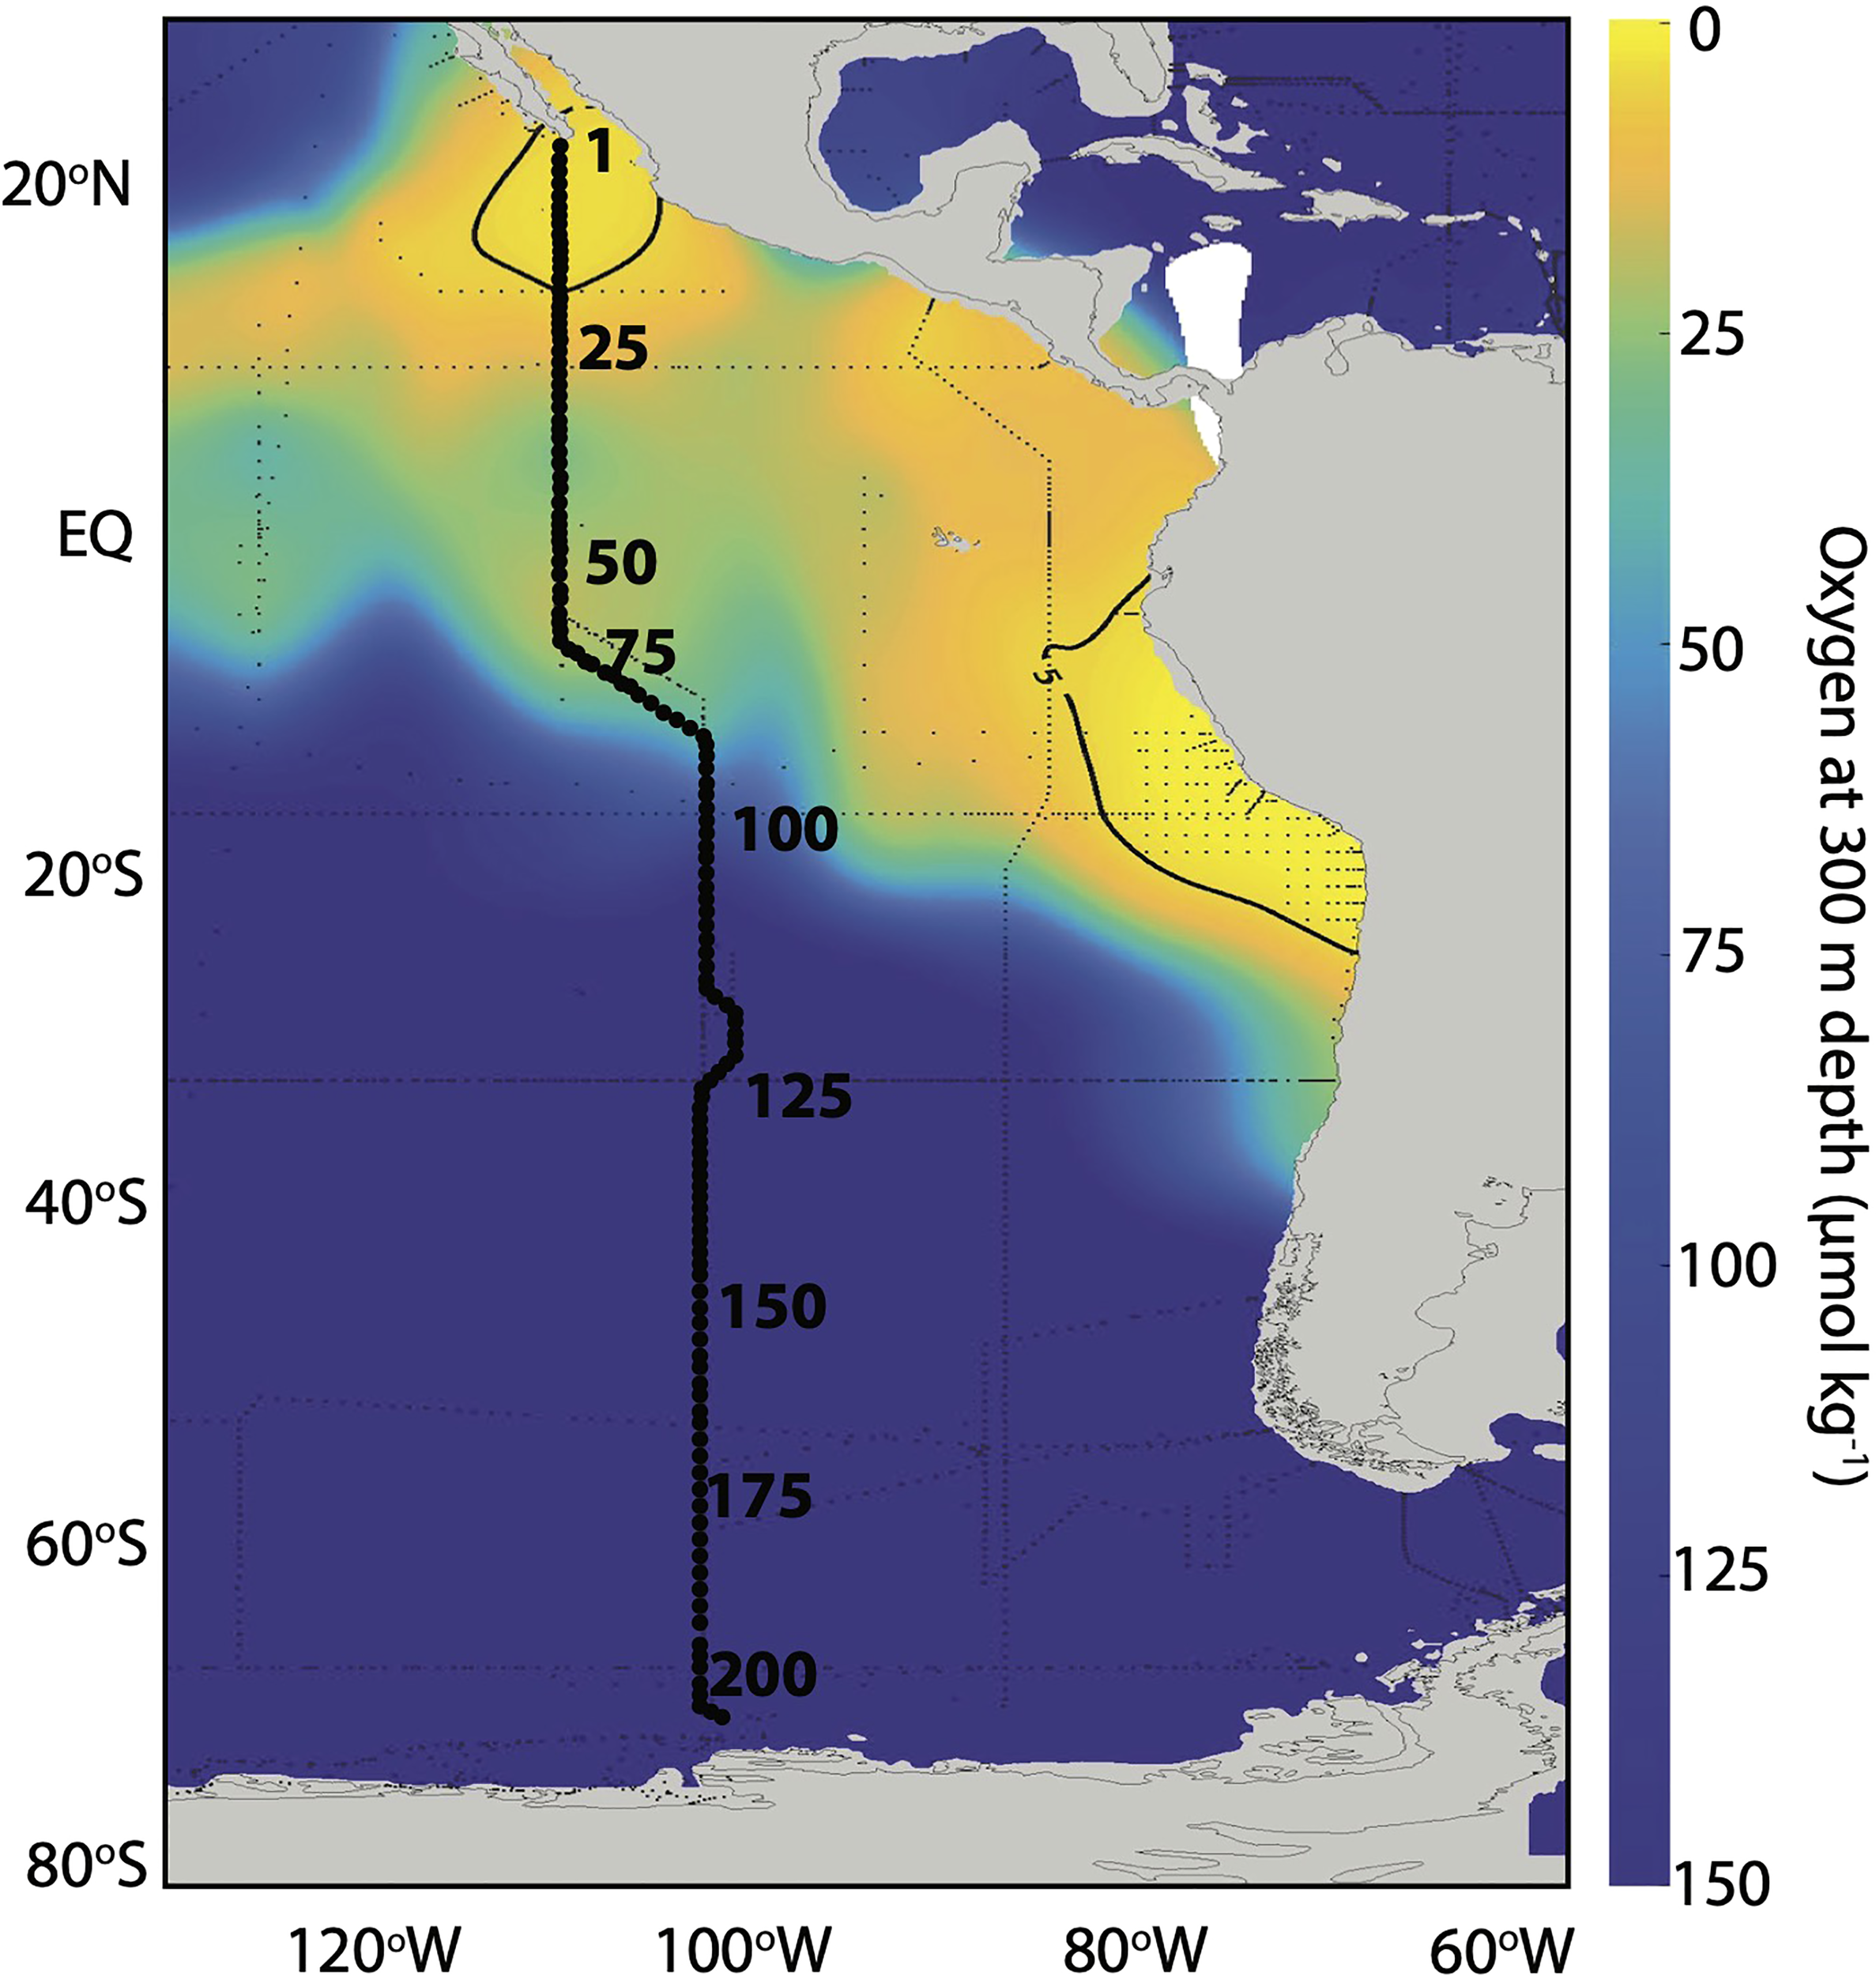
Stations sampled as part of the U.S. GO-SHIP Program along the P18 section in 2016/2017. Representative station numbers (every 25 stations) are shown along the transect. Colors indicate O2 concentration at 300 m depth from the Global Ocean Data Analysis Project (GLODAPv2.2022). The 5 µmol kg-1 O2 contour is shown.
2 Methods
The U.S. GO-SHIP Program conducted a hydrographic survey along the P18 section in 2016/2017 (Figure 2). Core physical and biogeochemical data from the cruise (e.g., temperature and salinity, O2 and nutrient concentrations, transient tracers, radiocarbon) are publicly available at https://cchdo.ucsd.edu/cruise/33RO20161119. Samples for N2/Ar were collected every ~2 degrees latitude during leg 1 at 25 stations in total. N2O stable isotope and isotopomer samples were collected at 44 stations, every ~2 degrees latitude during leg 1 and every 3 to 4 degrees during leg 2, except between 3°N and 3°S where the resolution was increased to ~1 degree. Samples for δ15N of NO3- analysis were collected during leg 1 at every degree of latitude, but only analyzed at station 32 in the ETNP and stations 53, 55, 62, 68, 74, 78, 90, 92, 96, 100, 104, 108 and 112 near the equator and the ETNP. We usually collected water column profiles from the surface to 2000 m depth, with deeper profiles at 3 stations.
2.1 N2/Ar
N2/Ar and δ15N2 samples were collected and preserved as in Charoenpong et al. (2014) and analyzed at the University of Massachusetts Dartmouth (UMass Dartmouth). In total, approximately 600 samples were collected in 60 mL serum bottles. Water samples were pumped, at 5 to 10 ml min-1, through a continuous sparger which transfers dissolved gases quantitatively to a continuous flow of helium (He) carrier gas. Analysis time was about 10 minutes. Carrier gas was passed through water, carbon dioxide (CO2), and software selectable hot-copper O2 traps before admittance via an open split to an isotope-ratio mass spectrometer (IRMS). The GV IsoPrime IRMS was fitted with collectors for simultaneous measurement of N2 (masses 28 and 29), O2 (masses 32, 33, and 34), and Ar (mass 40). Gas and isotopic ratios were measured against artificial compressed gas mixtures of N2, O2, and Ar close to expected dissolved gas ratios. Reproducibility of N2/Ar measurements were better than 0.5‰. Daily calibration against an atmosphere reference (water equilibrated with air) was carried out at precisely controlled temperatures of 10.0 and 20.0°C. Excess (biogenic) N2 was calculated against equilibrium values expected from in situ temperature and salinity as in Charoenpong et al. (2014). Subtraction of the background N2 excess was done as in Bourbonnais et al. (2015) using N2/Ar values in source waters near the equator.
2.2 N2O concentrations, stable isotopes and isotopomers
Samples for dissolved N2O were collected in a similar fashion as for dissolved O2/N2/Ar samples. Tygon tubing was attached to the Niskin bottle and a 165 mL serum glass bottle was filled and overflowed with seawater at least 2 times before capping with a butyl stopper and crimp sealed with aluminum. This procedure was executed underwater in a plastic container to avoid air bubbles. After collection, 0.2 mL of a saturated HgCl2 solution was injected to prevent biological activity. In total, approximately 800 samples were collected.
Samples were analyzed at UMass Dartmouth using a GV IsoPrime Continuous Flow, MultiCollector, IRMS (CF-MC-IRMS) coupled to an automated gas extraction as described in Bourbonnais et al. (2017). The collector configuration included masses 30, 31 for the NO+ fragment of N2O (used for the determination of δ15Nα) and 44, 45, and 46 (used for the determination of δ15Nbulk and δ18O). Briefly, dissolved N2O was pumped through a gas extractor, completely extracted through bubbling with a continuous flow of He and concentrated and purified in a purge-trap system. CO2 and H2O vapor were removed using chemical and cryogenic traps. N2O was cryo-focused with two liquid N2 traps and passed through a capillary gas chromatography (GC) column prior to IRMS analysis. Results were reproducible even at low N2O concentration (down to ~5 nmol L-1). N2O concentrations in our samples were calculated from relative peak heights between the samples and a seawater standard of known N2O concentration equilibrated with seawater at 5°C (12.5 nmol L-1 at salinity 34 as calculated using the Weiss and Price (1980) equation). Equilibrium N2O concentrations at depth were calculated using historical reconstructions of atmospheric N2O and water mass age distributions estimated from chlorofluorocarbon and sulfur hexafluoride tracers as described in section 2.4.
The N2O concentrations measured with our IRMS agreed well with those measured independently using gas chromatography and an electron capture detector (ECD) at sea during the same research expedition (data available at https://cchdo.ucsd.edu/cruise/33RO20161119).
The reproducibility of δ15Nbulk, the average of δ15Nα and δ15Nβ, δ18O and SP as well as any instrumental drift were determined from measurements of the 5°C seawater standard distributed throughout an analytical run. We calibrated measurements and corrected for scrambling between the α and β positions (Westley et al., 2007) using four N2O standards covering a large range of SP (as well as δ15Nbulk and δ18O) composition (see Mohn et al., 2014). These standards were analyzed in duplicate for each run to quantify the scrambling effect and potential offsets, and we iteratively solved for the different calibration parameters as described in Frame and Casciotti (2010) and Mohn et al. (2014). Correction for isobaric interference from 17O was included in these procedures. Standard deviations for triplicate measurements of our N2O standards were typically below 0.1‰ for δ15Nbulk N2O, 0.1‰ for δ18O-N2O and 1.0‰ for SP, which were comparable to values reported by Mohn et al. (2014).
2.3 Nitrate isotopes
The δ15N of NO3- was measured using the Ti (III) reduction method for nitrate conversion to N2O (Altabet et al., 2019). The product N2O was purified and analyzed at UMass Dartmouth using a GV Isoprime continuous flow IRMS equipped with a custom purge trap extraction system and a PAL autosampler. Target sample size was 10 nmoles. Samples were standardized using a three-point correction with the international standards IAEA-N3 (δ15N = 4.7‰ vs AIR), USGS-34 (δ15N = -1.8‰ vs AIR) and USGS-35 (2.7‰ vs AIR). The isotope ratios are expressed in δ (‰) relative to AIR for N. The average standard deviation for duplicate samples was better than ± 0.3‰ for δ15N.
2.4 Calculation of N2O at equilibrium using transit time distributions
In the same water parcel as N2O, three transient tracers [chlorofluorocarbon (CFC)-11, CFC-12, and sulfur hexafluoride (SF6)] were measured, each of which are affected by mixing differently due to their differing atmospheric histories. This concurrence provides a means of estimating, from multiple tracer ages, the impact of mixing on the ages. To estimate mean ventilation timescales, age distributions, otherwise known as transit-time distributions (TTDs), were approximated using the inverse Gaussian form:
where Γ is the mean age and Δ is the width, or standard deviation, of the distribution (Waugh et al., 2003).
Each water sample’s measured CFC-11, CFC-12, and SF6 were matched to a TTD lookup table (Stanley et al., 2012; Sonnerup et al., 2015) that allowed for Δ/Γ to range, in 0.1 increments, from 0.3 up to 1.8, the range that can be constrained by those three tracers (Stöven et al., 2015), and included each TTD’s atmospheric N2O, below. The matching criterion was within ± 3 σ of the combined tracer measurement and tracer saturation level uncertainties. The saturation levels dominate the uncertainty. Saturation levels of CFC-11, CFC-12, and SF6 were estimated from the outcropping region of the respective isopycnals.
2.4.1 N2O atmospheric history
The N2O atmospheric history post-1800 was estimated using the polynomial fit presented in Freing et al. (2009), updated to the present using annual global mean N2O atmospheric mixing ratios from the NOAA Earth System Research Laboratory (ESRL) Global Monitoring Division (https://www.esrl.noaa.gov/gmd/hats/combined/N2O.html). Pre-1800, a constant N2O mixing ratio of 274.81 ppb was used.
2.4.2 Using TTDs to constrain biogenic N2O
The total N2O in a water parcel (N2Oobs) is the sum of N2O from two different sources: 1) equilibrated from the atmosphere at the time it was last at the surface (N2Obkg) and 2) added from microbial processes (ΔN2O or N2Oprod):
where XN2O is the atmospheric mixing ratio of N2O, P is the atmospheric pressure, and FT,S is the temperature and salinity dependent solubility of N2O in seawater (Weiss and Price, 1980). The N2O mixing ratio of the TTDs for each water parcel were calculated using the atmospheric history of N2O. The TTDs’ N2O mixing ratio were used to calculate the N2O concentration at atmospheric equilibrium (N2Obkg) for each water sample. For values where the CFC-11 was below detection (< 0.001 pmol kg-1), an atmospheric N2O mixing ratio of 274.81 ppb was used.
2.5 Keeling plot analysis
In order to determine the sources of high ΔN2O near the oxycline in the ETNP and ETSP ODZs, the isotopic and isotopomer compositions of the N2O produced within given water masses and at different O2 concentrations were estimated using Keeling plot analysis (Keeling, 1961; Pataki et al., 2003; Yamagishi et al., 2007; Fujii et al., 2013; Casciotti et al., 2018). The isotopic composition of source N2O was determined using equation 5 and:
where the obs, prod and bkg subscripts refer to N2O measured, newly produced and at equilibrium, respectively.
Rearranging equations 5 and 7 gives:
The intercepts of the linear regression between the inverse of measured N2O concentration and the δ15Nbulk, δ15Nα, δ15Nβ, δ18O and SP thus represents the isotopic composition of produced N2O.
2.6 Isotope effects during N2O consumption
We estimated isotope effects associated with N2O consumption in the ETNP ODZ using a closed-system Rayleigh model (Mariotti et al., 1981). Only data in the ETNP ODZ at [O2] < 5 µmol kg-1 where N2O consumption occurs were selected for this analysis.
where δ15N2O is the δ15Nbulk, δ15Nα, δ15Nβ, δ18O or SP for samples at O2 < 5 µmol kg-1 (mostly in the ETNP ODZ), and the subscript refers to N2O measured and initial concentrations and isotopic values before the onset of N2O consumption. The isotope effects were estimated as the slopes of the linear regressions between δN2O versus -ln[N2O], -ln[N2O] being an approximation of the [N2O]obs/[N2O]initial term.
3 Results
3.1 Water mass characterization
Water masses were characterized according to Emery (2001). The main surface water (0 – 500 m depth) masses along the P18 transects, listed from north to south with potential temperature and absolute salinity ranges in brackets, were Eastern North Pacific Central Water (ENPCW; 12.0-20°C; 34.2-35.0), Eastern North Pacific Transition Water (ENPTW; 11.0-20.0°C, 33.3-34.3), Pacific Equatorial Water (PEW; 7.0-23.0°C, 34.5-36.0), Eastern South Pacific Central Water (ESPCW; 8.0-24°C; 34.4-36.4), Eastern South Pacific Transition Water (ESPTW; 14.0-20.0°C; 34.6-35.2), and Antarctic Surface Water (AASW; -1.0-1.0°C, 34.0-34.6). Intermediate water masses (500 – 1500 m depth) include Eastern South Pacific Intermediate Water (ESPIW; 10.0–12.0°C, 34.0-34.3) and Antarctic Intermediate Water (2-10°C, 33.8-34.5). Circumpolar Deep Water (CDW; 0.1-2.0°C, 34.62-34.73) was observed below 1500 m depth (Figure 3).
Figure 3
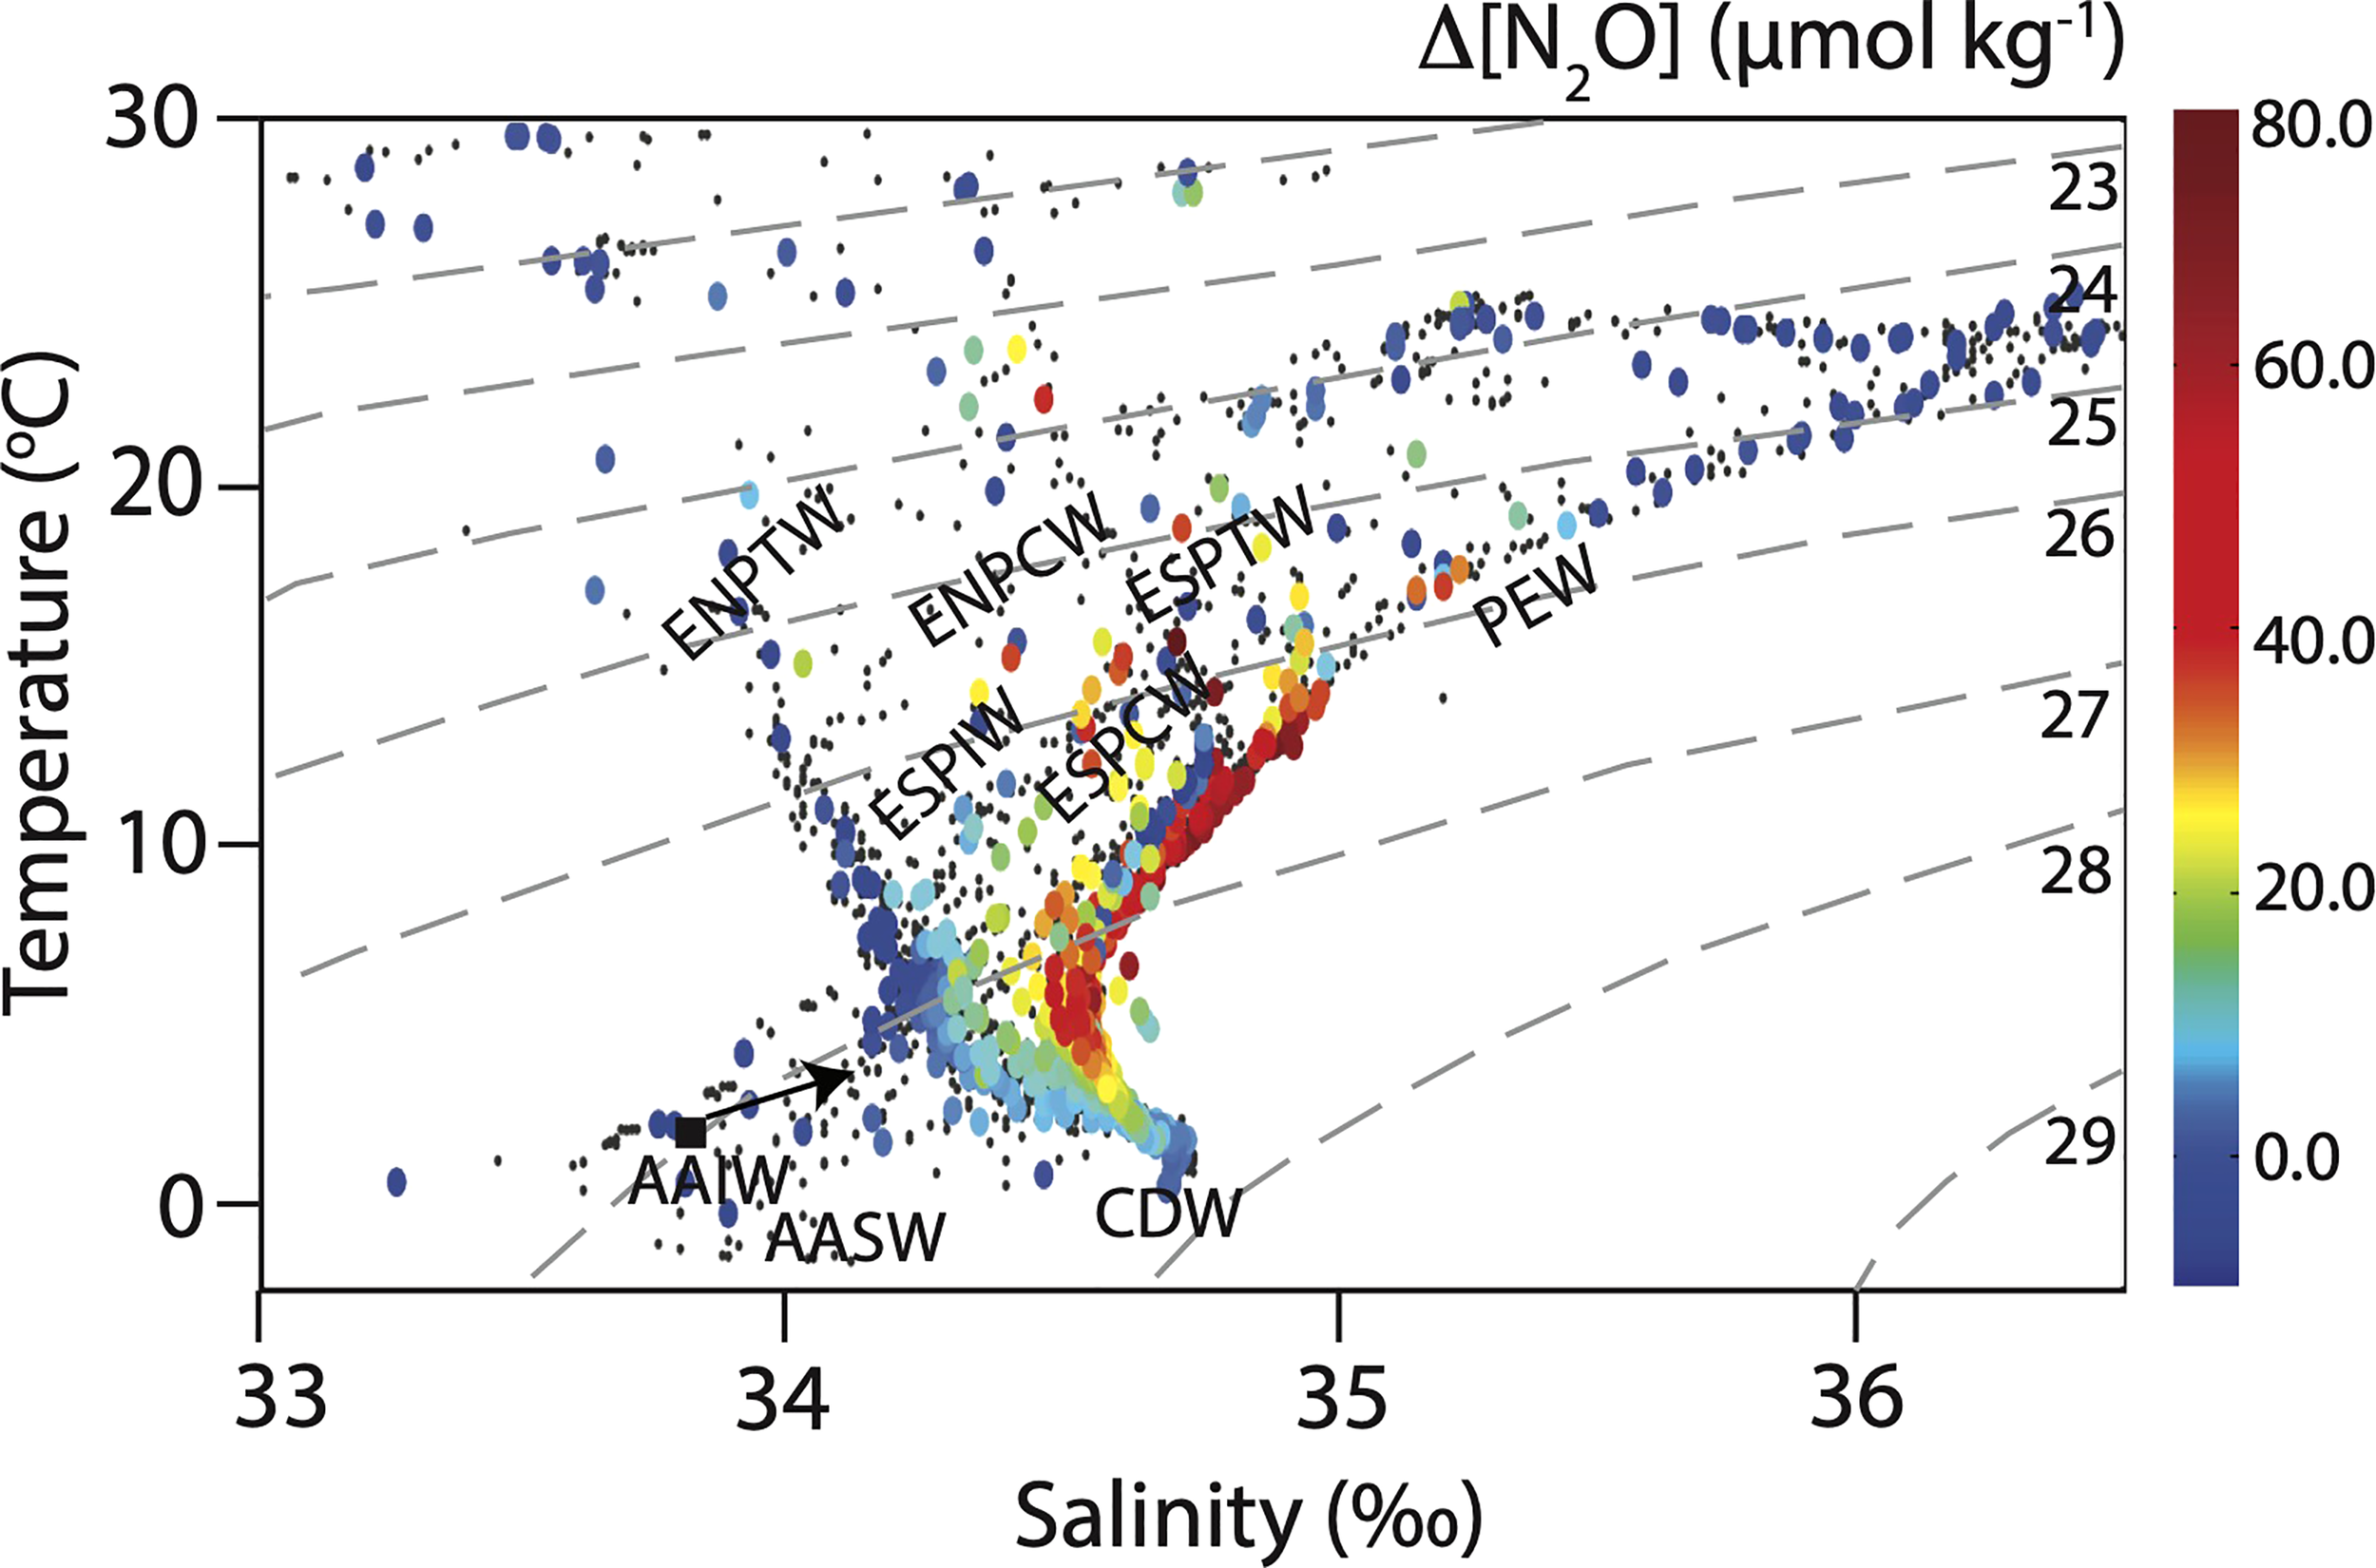
Potential temperature-absolute salinity plot showing the main water masses along the P18 transect from discrete water samples and ΔN2O values as the color of the symbols (color bar). Smaller black dots indicate samples for which ΔN2O was not measured. The different water masses abbreviations are for deep waters: Circumpolar Deep Water (CDW), intermediate waters: Eastern South Pacific Intermediate Water (ESPIW), and Antarctic Intermediate Water (AAIW), and surface waters: Pacific Equatorial Water (PEW), Eastern South Pacific Transition Water (ESPTW), Eastern South Pacific Central Water (ESPCW), Eastern North Pacific Central Water (ENPCW), Eastern North Pacific Transition Water (ENPTW), and Antarctic Surface Water (AASW). Lines of equal potential density (sigma-theta (σθ)) are shown (dashed grey lines).
3.2 Distribution of O2, nutrient concentrations, NO3- isotopes, DIN deficit and biogenic N
The P18 transects crossed the ETNP ODZ and the fringe of the ETSP ODZ. O2 concentrations decreased to < 5 µmol kg-1 between 120 m and 845 m depth in the northernmost part of the transect in the ETNP ODZ. In the ETSP, O2 concentrations generally remained > 5 µmol kg-1, except at few stations/depths between 4.5°S and 9.7°S and 195 and 495 m depth. The oxycline depth varied between 70 m at 10.5°N to 285 m at 16°S (Figure 4A).
Figure 4
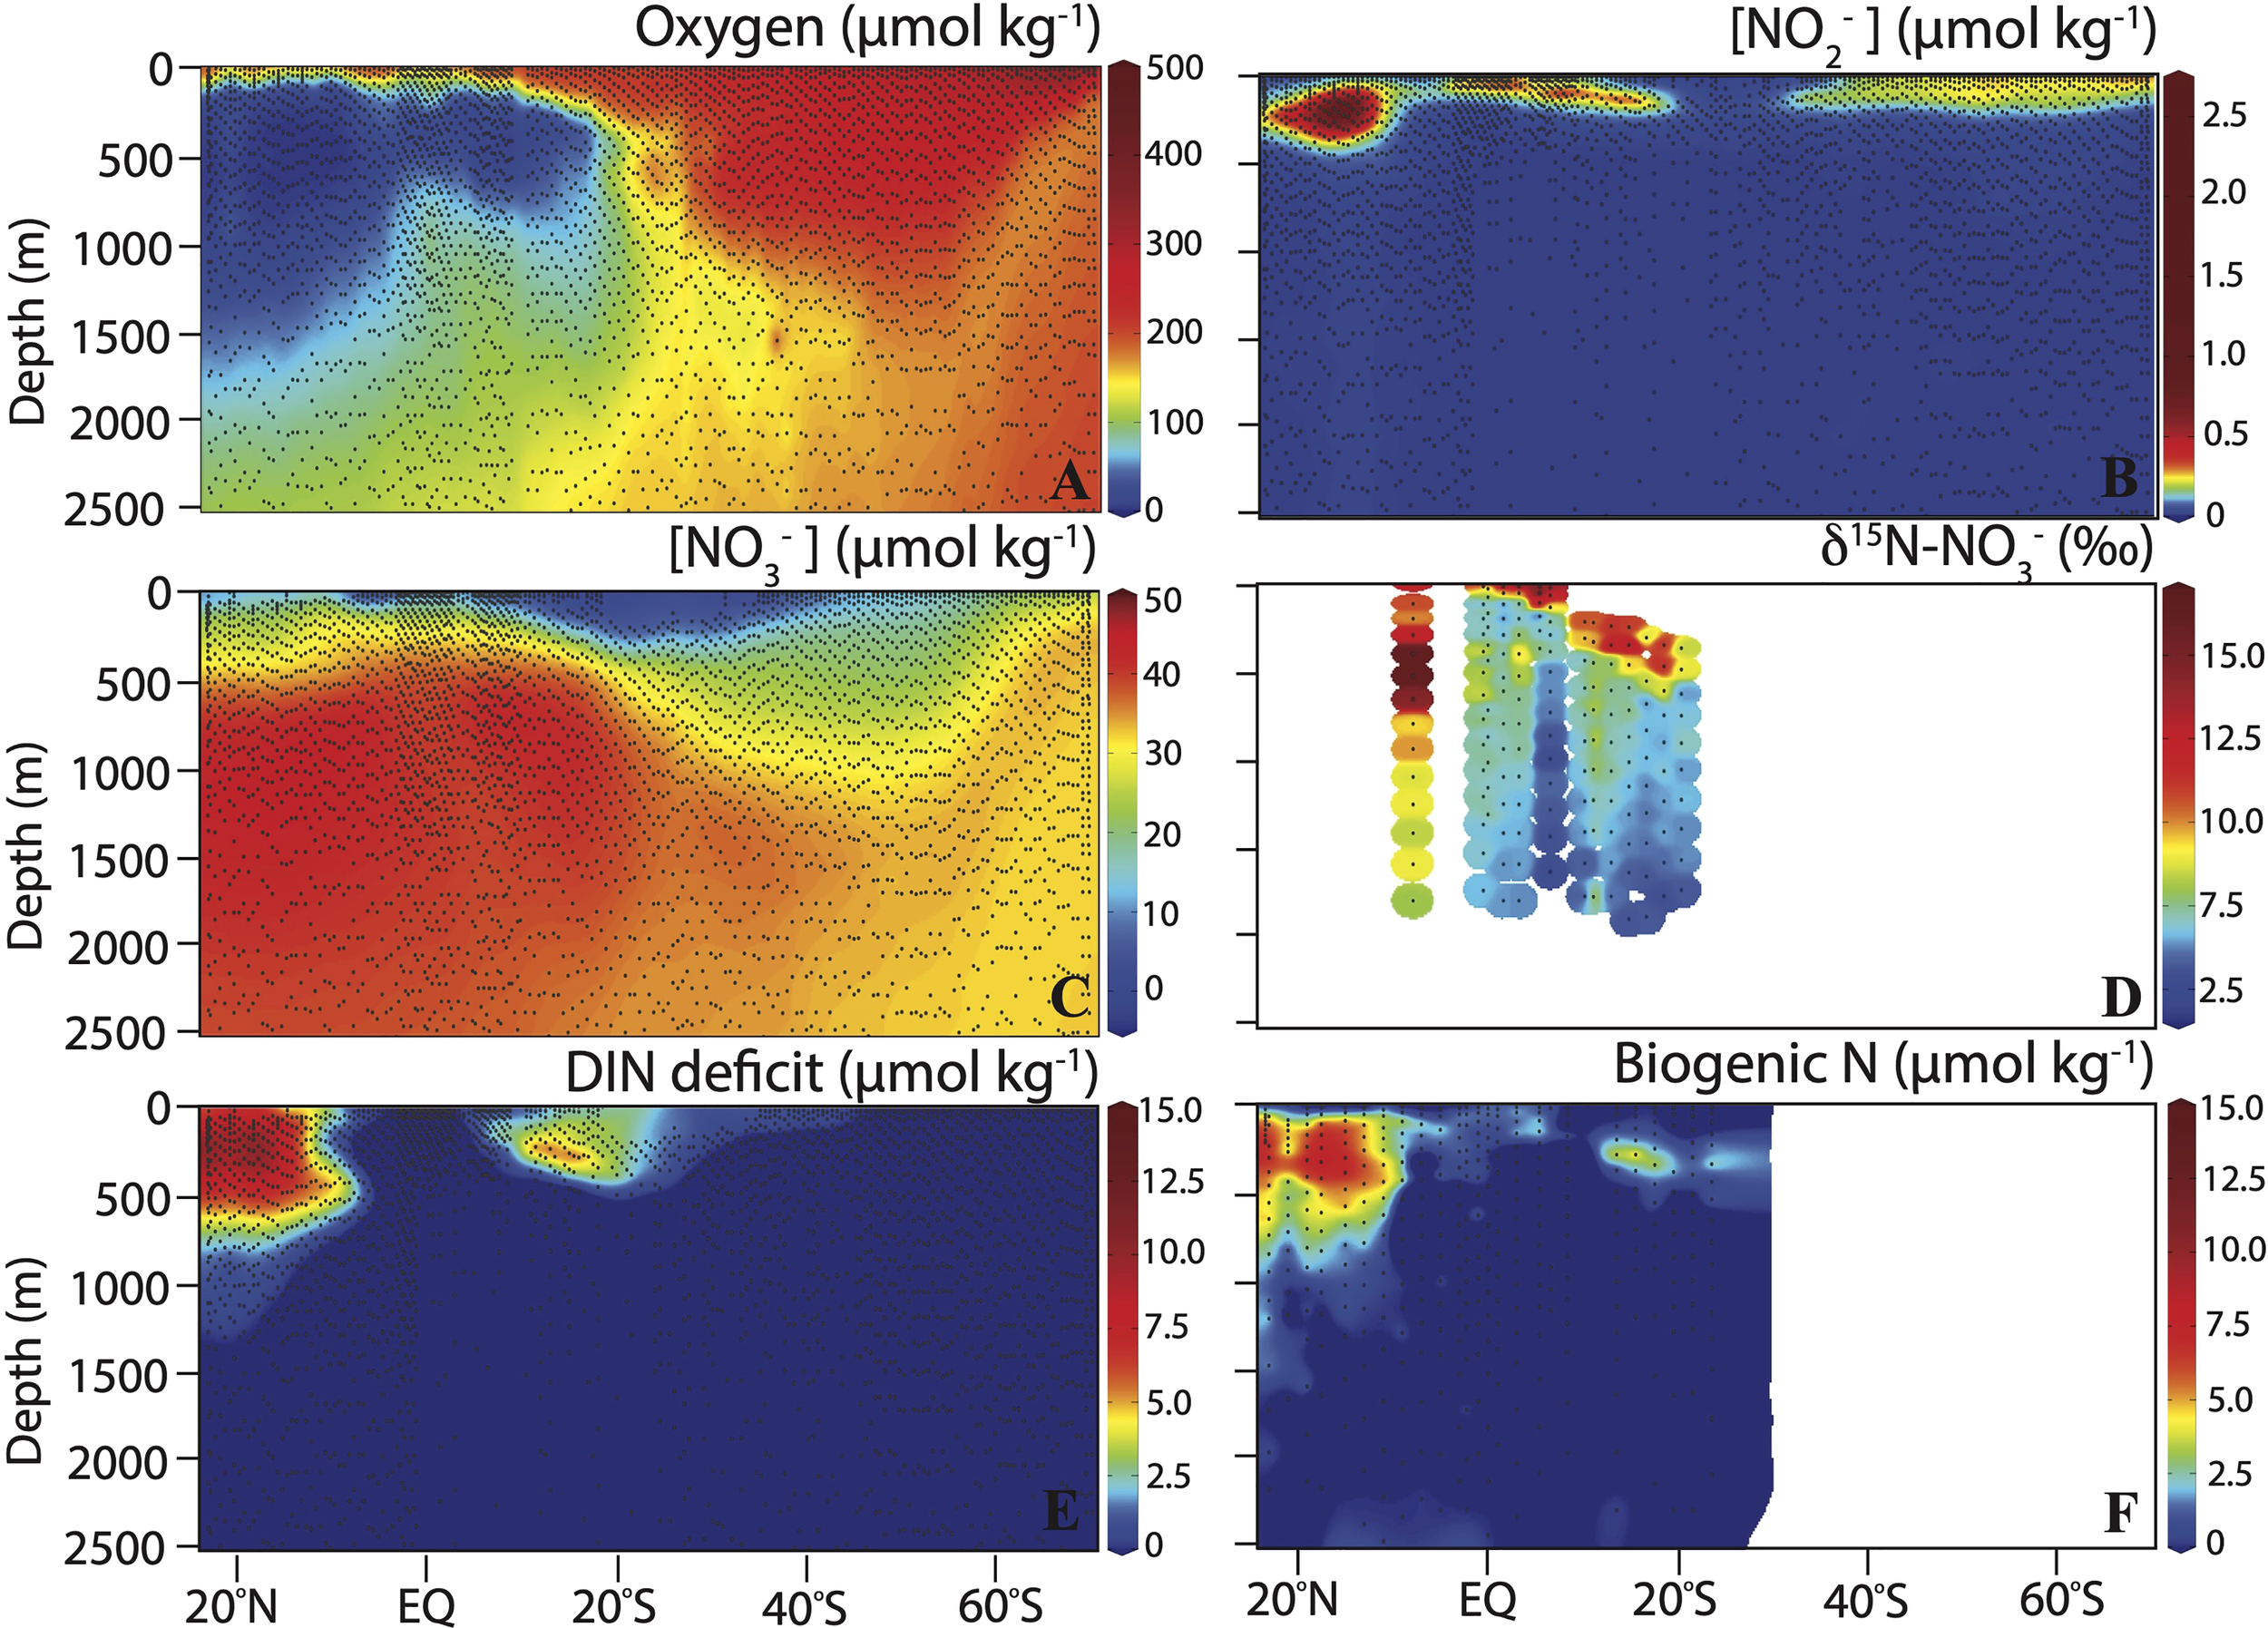
Section plots showing (A) dissolved O2 concentration, (B) NO2- concentration, (C) NO3- concentration, (D) δ15N-NO3-, (E) DIN deficit calculated from nutrient concentrations, and (F) biogenic N (calculated from N2/Ar measurements) along the P18 transect in 2016/2017.
Nitrite concentrations were generally low (<2.7 µmol kg-1), with highest concentrations between 13°N and 16°N and 110 m to 285 m depth in the ETNP ODZ. Nitrite also accumulated at the fringe of the ETSP ODZ, with maximum concentrations between 7.5°S and 16.5°S near 100 m depth. Modest nitrite accumulations (<0.5 µmol kg-1) were also observed in the upper 200 m from 34°S to 60°S (Figure 4B). Nitrate concentrations were generally depleted in surface waters, with the deepest maximum nitracline found at 350 m depth in the oligotrophic subtropical South Pacific from 21°S to 31.5°S (Figure 4C). A high δ15N of NO3- of up to ~15‰ was observed in surface waters (Figure 4D), as expected following fractionation during NO3- assimilation by phytoplankton (Altabet, 2001; Granger et al., 2004). Nitrate concentrations were moderate in the upper 500 m of the ETNP ODZ (minimum [NO3-] of 21 µmol kg-1), corresponding to ENPCW. The δ15N of NO3- was also elevated in the ODZ (up to 16.7‰ at 8.5°N and 425 m depth), consistent with fractionation during denitrification (Cline and Kaplan, 1975; Granger et al., 2008). Nitrate accumulation of up to 45 µmol kg-1were observed between 625 and 1750 m depth and was more pronounced in the ETNP. Nitrate concentrations remained relatively constant below 2000 m depth, with higher concentrations (~38 µmol kg-1) in the northern portion of the transect compared to the South (~33 µmol kg-1) (Figures 4C, D).
The DIN deficit (Howell et al., 1997) was calculated using the following equations:
where DINexp is the concentrations of dissolved inorganic nitrogen expected assuming Redfield stoichiometry (typically 16N:1P), DINobs is the concentration of nitrate plus nitrite measured and m and b are the slope and intercept, respectively, of the relationship between DIN and phosphate (PO43-) concentrations for source waters outside of the ETNP and ETSP ODZs. DINexp was calculated according to Chang et al. (2010; Chang et al., 2012). DIN deficit was particularly elevated (up to 13.75 µmol kg-1) between 50 and 580 m depth in the ETNP ODZ. DIN deficit was also elevated at the fringes of the ETSP ODZ, with values of up to 12.4 µmol kg-1 at 9.7°S and 205 m depth. Biogenic N derived from N2/Ar data (as µmol N kg-1) were generally comparable to DIN deficit, although generally a bit lower. Discrepancy between these two measurements could be caused by collection (N2/Ar was not a prioritized gas sample during the P18 cruise) and/or storage effects for the N2/Ar samples (Figures 4E, F).
3.3 ΔN2O, N2O stable isotopes and isotopomers
The largest ΔN2O accumulation of 75.7 nmol kg-1 at [O2] < 5 µmol kg-1 was observed at a depth of 95 m (σθ = 25.65), near the oxycline in the ENPCW water mass in the ETNP ODZ (14.5°N) (Figure 5A). High ΔN2O of up to 73 nmol kg-1 were also observed under low-O2 conditions (15 µmol kg-1) at the fringe of the ETSP ODZ (7-9°S) at 180-195 m depth (σθ = 26.4), which corresponds to the PEW water mass (Figures 3, 5). Overall, elevated ΔN2O concentrations (>30 nmol kg-1 were observed from the northern portion of the P18 transect to about 20°S, clearly associated with low-O2 waters from the ETNP and ETSP ODZs. In contrast, slightly negative ΔN2O (undersaturation) (~-1 nmol kg-1) values were observed in surface waters at the southern part of the transect associated with the subduction of AASW forming AAIW (Emery, 2001). Rapid cooling and sinking of surface water, with insufficient time for re-equilibration with the atmosphere, is likely causing the observed N2O undersaturation in near surface waters in this region. A slight increase in ΔN2O (up to ~20 nmol kg-1) was observed from 60°S to 20°S in AAIW waters. Negative ΔN2O (minimum of ~-5 nmol kg-1) were observed within the anoxic zone (O2 < 5 µmol kg-1) of the ETNP (Figure 5A).
Figure 5
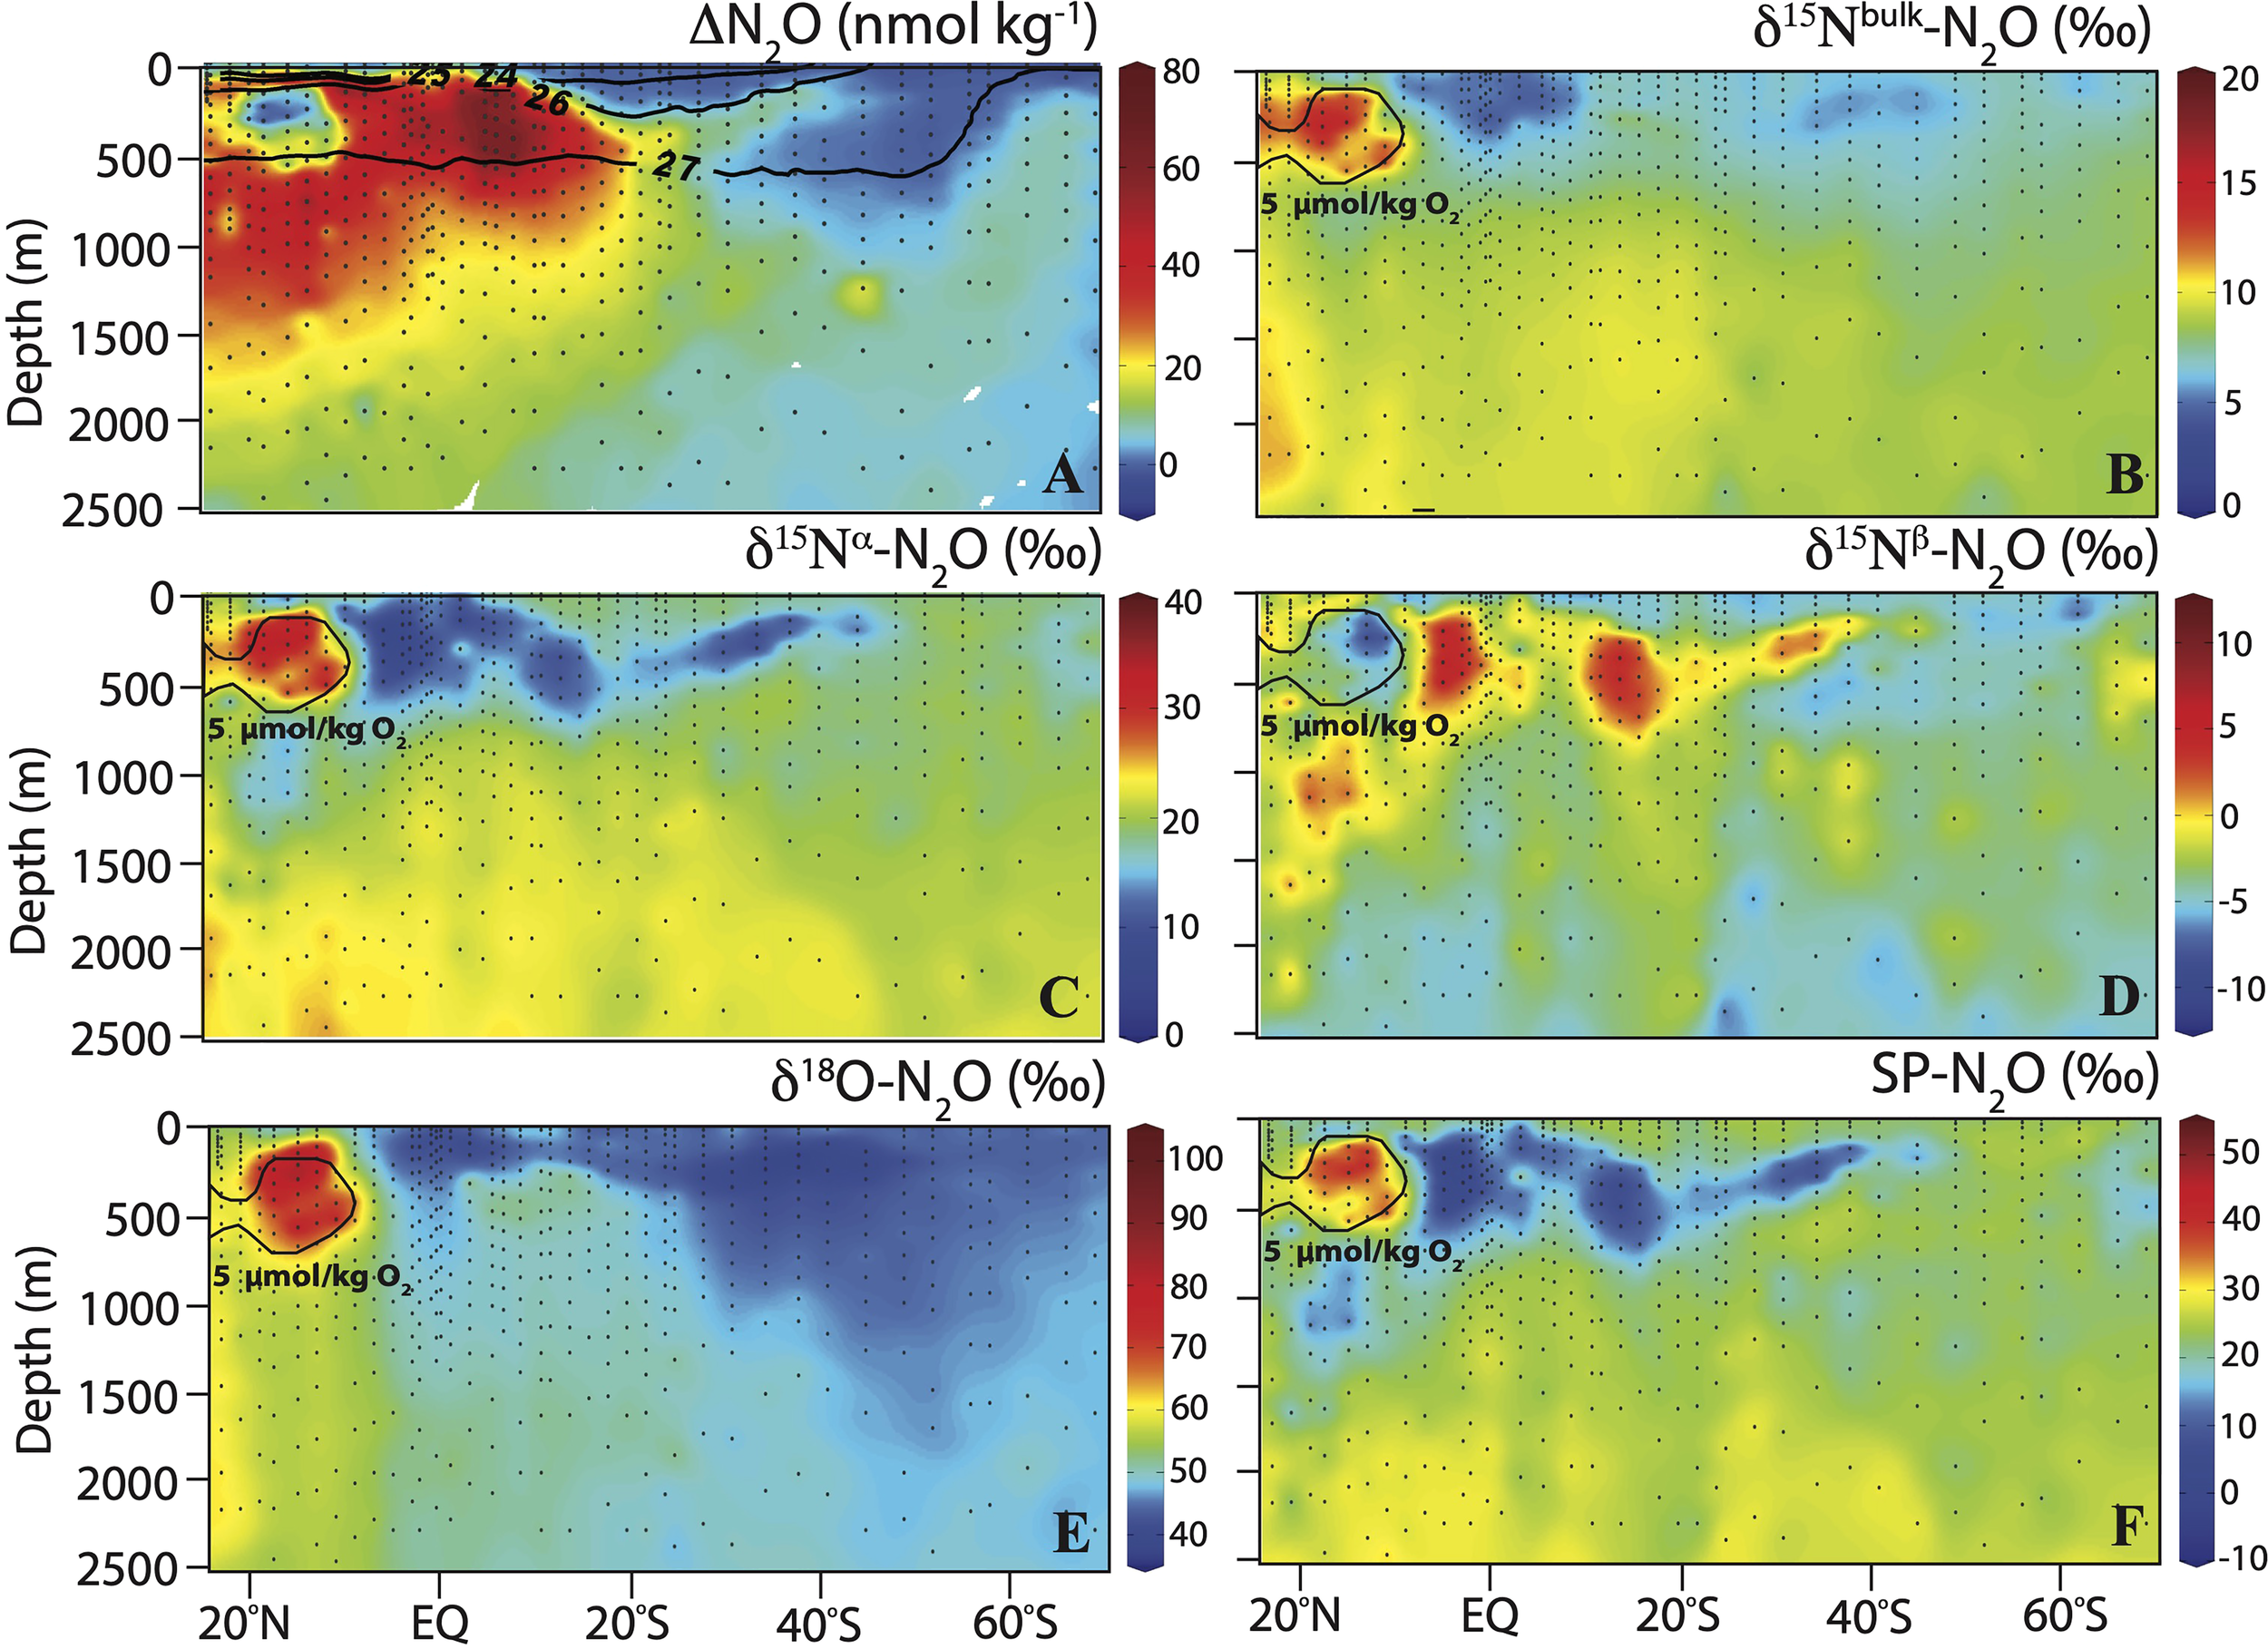
Section plots of (A) ΔN2O with sigma-theta (σθ; kg m-3) in overlay, (B) δ15Nbulk-N2O, (C) δ15Nα-N2O, (D) δ15Nβ-N2O, (E) δ18O-N2O, and (F) SP-N2O along the P18 transect. The 5 µmol kg-1 O2 contour in the ETNP is shown in (B–F).
The δ15Nbulk-N2O was lowest in the first 500 m depth near the equator, with values less than 5‰, indicating production (Figure 5B). The highest δ15Nbulk-N2O values (up to 18‰) were observed within the ETNP ODZ, consistent with the observed low ΔN2O and indicating net consumption (Ostrom et al., 2007). δ15Nbulk-N2O remained approximately 8 to 10‰ in waters deeper than 1000 m depth. The δ15Nα-N2O nearly followed the same distribution pattern as δ15Nbulk-N2O, with overall higher values (up to 42.5‰) in the ETNP ODZ (Figure 5C). The δ15Nβ-N2O contrasted with the δ15Nbulk-N2O and δ15Nα-N2O distributions, with highest values (up to 9.4‰) within the first 500 m flanking the equator and lowest values (minimum of -11.3‰) in the ETNP ODZ (Figure 5D). The δ18O-N2O decreased along the north-south gradient of the P18 transect, with highest values (up 100‰) in the ETNP ODZ (Figure 5E). δ18O-N2O remained fairly constant below 2000 m depth and increased from ~48 to 56‰ in CDW from south to north along the P18 transect. SP distribution was similar to that of δ15Nα-N2O, with lowest values (minimum of -6.1‰) in low O2 waters (>5 µmol kg-1) in the upper 500 m near the equator and highest values (up to 49‰) in the ETNP ODZ (Figure 5F). In AASW and AAIW at the southern portion of the transect near Antarctica, δ15Nbulk, δ15Nα, δ15Nβ, δ18O and SP were close to atmospheric N2O values (6.2‰ for δ15Nbulk, 15.8‰ for δ15Nα, -3.4‰ for δ15Nβ, 44.3‰ for δ18O and 19.2‰ for SP; Kelly et al., 2021). The isotopic signatures of N2O, together with the observed slight N2O undersaturation, indicate no N2O production in this region.
3.4 Relationships between ΔN2O, AOU and N deficit
The ratio between ΔN2O/AOU, indicative of cumulative N2O production yield, increased at low O2 concentration to 0.3 (Figure 6A). Other high ΔN2O/AOU ratios observed at higher O2 concentrations were clearly influenced by the contrasting effect of photosynthesis on AOU, as indicated by higher pH at these shallower isopycnal ranges (Supplementary materials, Figure S1). The lowest SPs were observed at highest ΔN2O and ΔN2O/AOU ratios (Figure 6B). Positive relationships between ΔN2O and AOU were observed in surface waters σθ < 26 kg m-3 in the ETNP and ETSP (Supplementary materials, Figure S2). No significant relationship between ΔN2O and AOU was observed at 26 < σθ < 27 kg m-3 where highest ΔN2O values were generally observed.
Figure 6
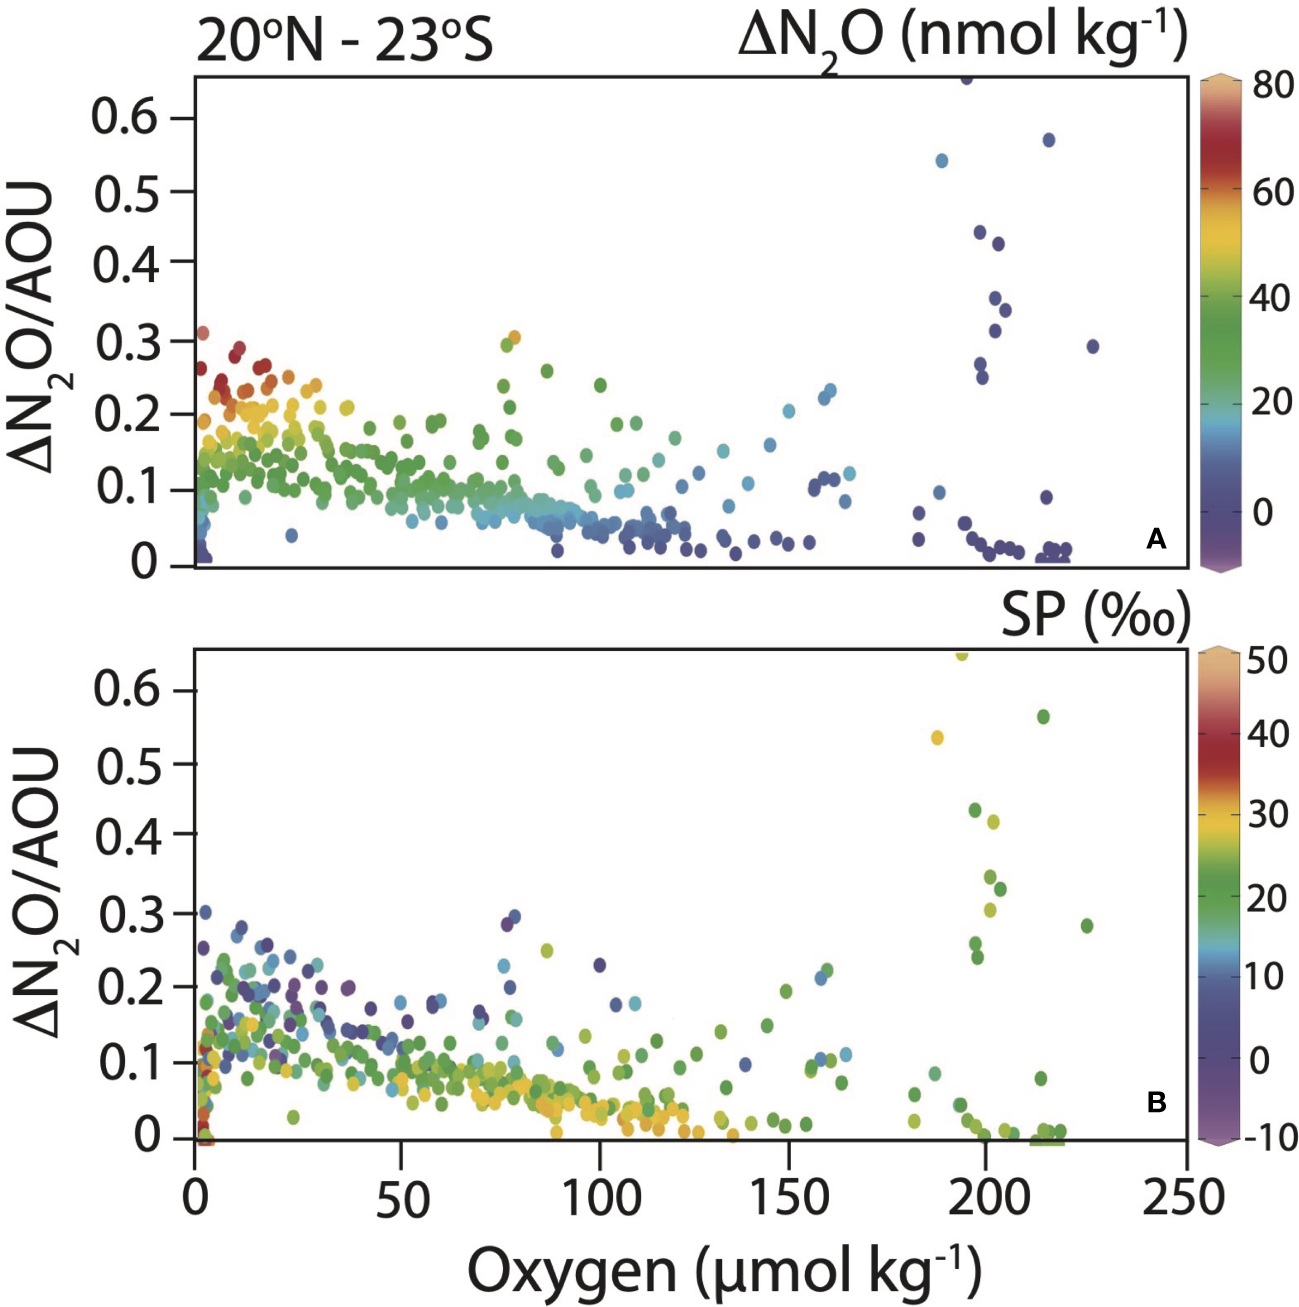
ΔN2O/AOU versus O2 concentration showing increased N2O production yield (associated with low SP) under low O2 conditions. ΔN2O (A) and SP (B) are shown as the color of the symbols (see color bars).
Significant positive relationships between ΔN2O and DIN deficit were observed in the ETNP (18.5°N – Equator), with an increased slope toward deeper isopycnals where highest ΔN2O were observed. A significant positive relationship between ΔN2O and DIN deficit was also observed in the ETSP (Equator – 13°S) for the isopycnal range 26 < σθ < 27 kg m-3. No such relationship was observed in the ETSP surface waters (σθ < 26 kg m-3) (Figure 7).
Figure 7
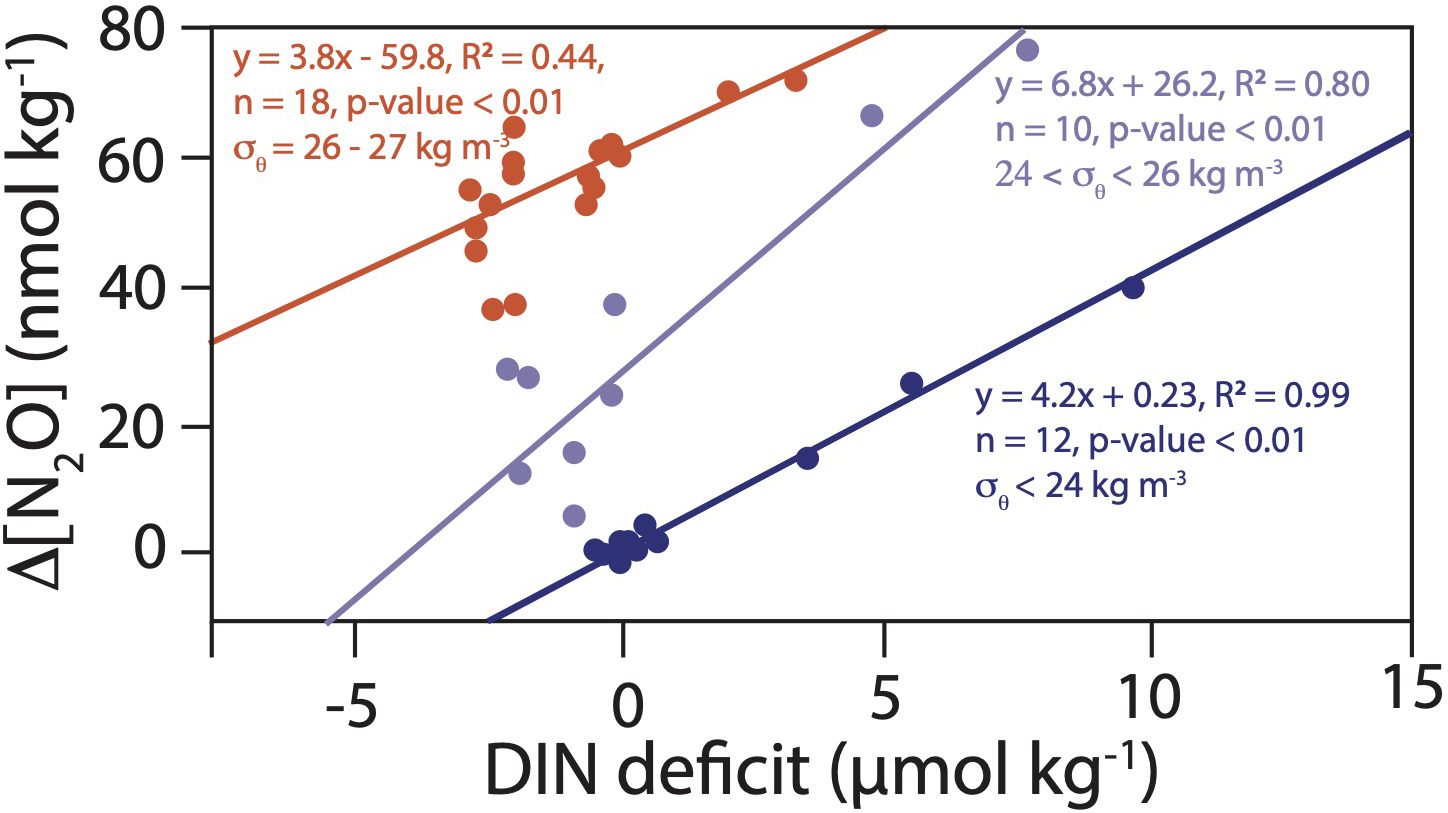
DIN deficit versus ΔN2O for the ETNP (18°N – Equator) (blue dots and lines) and ETSP (Equator – 13S) (red dots and line). In the ETNP, the light and dark blue dots and lines represent different isopycnal ranges.
4 Discussion
4.1 Sources of the highest ΔN2O accumulations near the oxycline in the ETNP and ETSP
We observed relatively high N2O concentrations of up to 84 nmol kg-1 (940% supersaturation) near the upper oxycline in offshore waters along the P18 section crossing the ETNP ODZ and the fringe of the ETSP ODZ. High N2O concentrations of up to ~100 nmol kg-1 were also observed offshore near the oxycline in the ETNP ODZ (Trimmer et al., 2016; Kelly et al., 2021). At offshore stations in the ETSP ODZ, Casciotti et al. (2018) observed N2O concentrations were up to ~70 nmol kg-1, comparable to observations along the P18 line. In contrast, Bourbonnais et al. (2017) observed much higher N2O concentrations of up to ~190 nmol kg-1 in coastal surface waters off Peru in the ETSP ODZ. Differences in N2O accumulation observed between these different studies appear to mostly relate to productivity (e.g., coastal versus offshore), but there is also evidence for dynamic N2O cycling at offshore stations. For instance, the El Niño-Southern Oscillation and mesoscale processes such as eddies have been shown to influence N2O distribution (e.g., Arévalo-Martínez et al., 2016; Ji et al., 2019; Babbin et al., 2020; Monreal et al., 2022)
Yield of N2O from nitrification increased toward lower [O2], as also observed in previous studies (e.g., Ryabenko et al., 2012; Ji et al., 2015; Ji et al., 2018; Frey et al., 2020) (Figure 6). If we assume that 138 moles of O2 are reduced for 16 moles of NH4+ nitrified (Ward, 2008), a yield of up to 0.5% N-N2O mol produced per mol NH4+ oxidized is obtained considering the highest ΔN2O/AOU slope of 0.3. A 0.5% yield falls in the range observed in the Pacific Ocean (Yoshida et al., 1989), but is lower than the maximum N2O production yield for nitrification reported for 15N-labeled incubation studies (up to ~3% in the ETSP ODZ) (Ji et al., 2018; Frey et al., 2020). However, while nitrification is clearly occurring in surface waters along the P18 transect, as shown by correlations between ΔN2O and AOU, the data deviate from this relationship on isopycnals where the highest ΔN2O were observed near the ODZ oxycline (Supplementary materials, Figure S2).
Two different sources of N2O were observed from the Keeling plot analysis in both the ETNP and ETSP for [O2] > 5 µmol kg-1 and σθ < 27 kg m-3 (Figures 8, 9). A break-point analysis was performed in R using the package “segmented” (Muggeo, 2003; Muggeo and Muggeo, 2017) as described in Kelly et al. (2021). The breakpoint was around 33 nmol kg-1 (1/[N2O] = 0.03) in both regions. Coincidentally, this analysis divided the data into two main O2 regimes: 5 µmol kg-1 < [O2] < 100 µmol kg-1 and [O2] > 100 µmol kg-1 (Table 1). It should be noted that highest ΔN2O in the ETNP were observed at [O2] below 5 µmol kg-1 and were thus not included in the Keeling plot analysis. Kelly et al. (2021) found a clear relationship between distinct N2O sources and [NO2-], with highest N2O accumulation at elevated [NO2-] (up to ~1 µmol kg-1) in the ETNP. In contrast to Kelly et al. (2021), no such relationship was observed when restricting the dataset to the same isopycnal range (σθ ≤ 25 kg m-3).
Figure 8
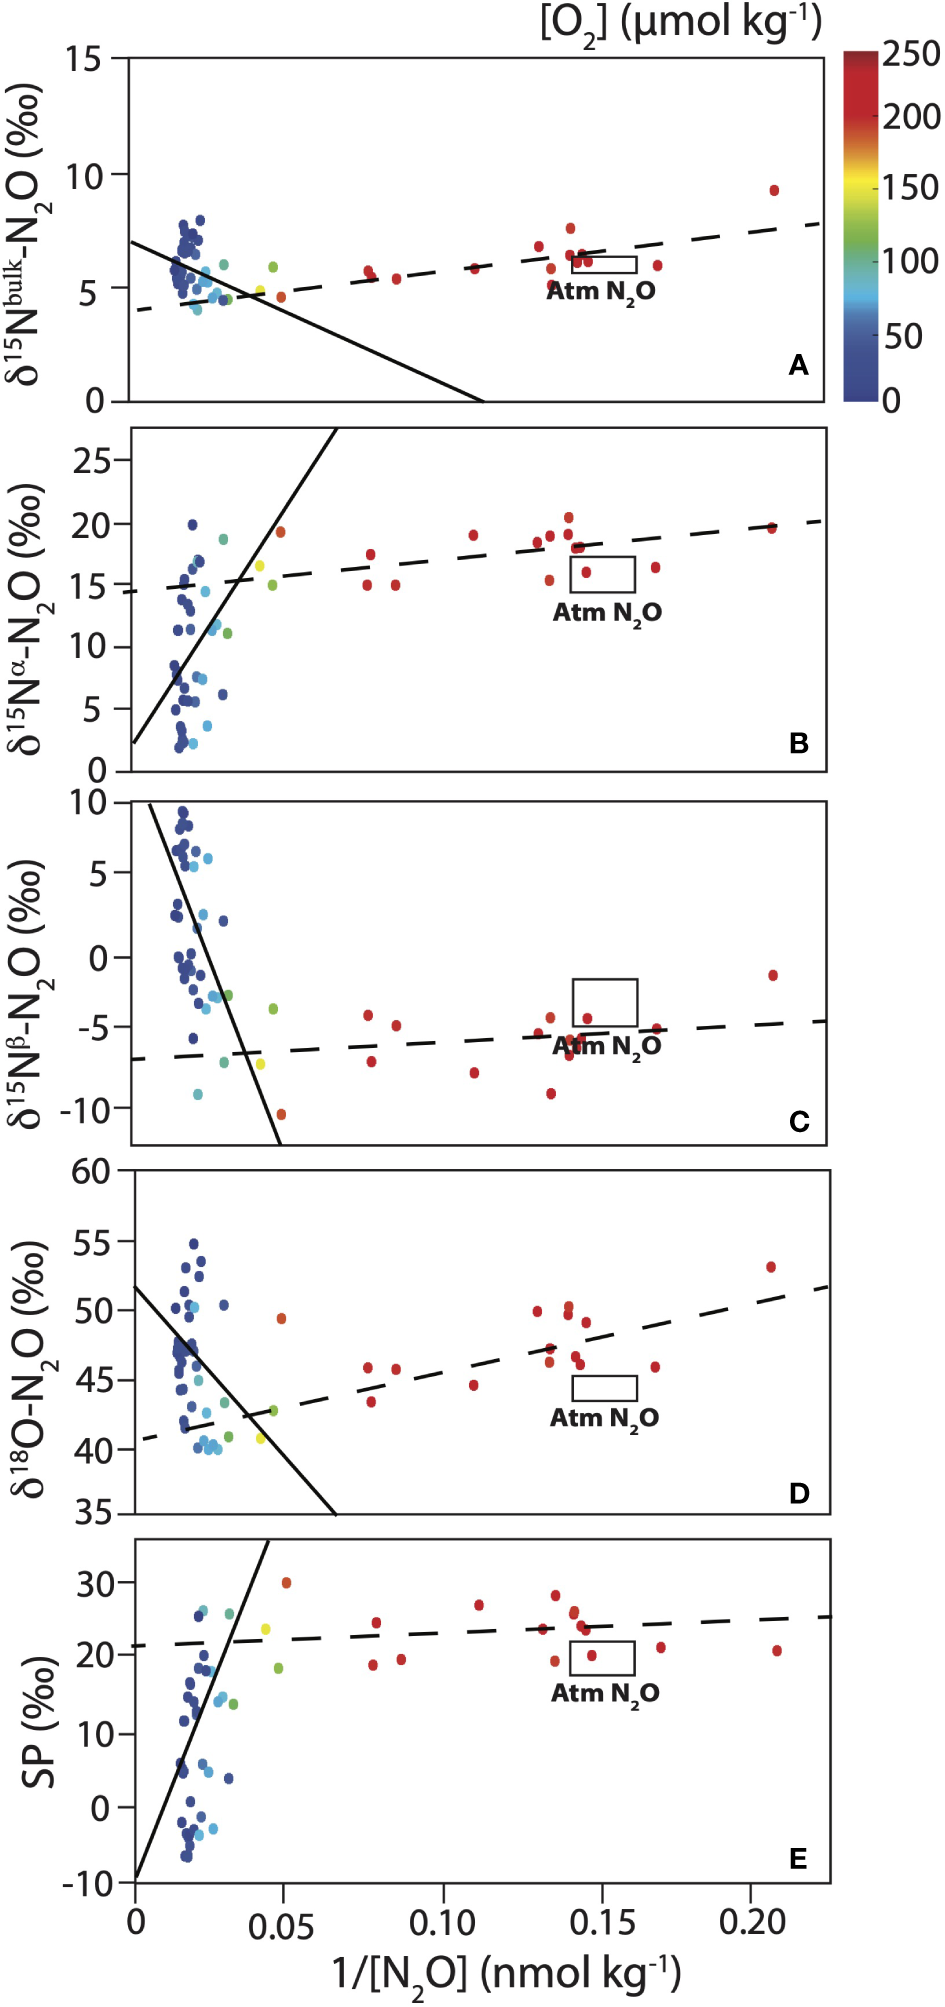
Keeling plot analysis for the ETNP (18°N – Equator) for (A) δ15Nbulk, (B) δ15Nα, (C) δ15Nβ, (D) δ18O and (E) SP of N2O (in ‰). Black lines are linear regressions (full line: 5 µmol kg-1 < [O2] < 100 µmol/kg and dashed line: [O2] > 100 µmol kg-1). O2 concentrations are shown as the color of the symbols (see color bar in top panel). Atmosphere N2O isotopic values are shown as a rectangle (from Kelly et al., 2021). See Table 1 for intercept, R2 and p-value for the linear regressions.
Figure 9
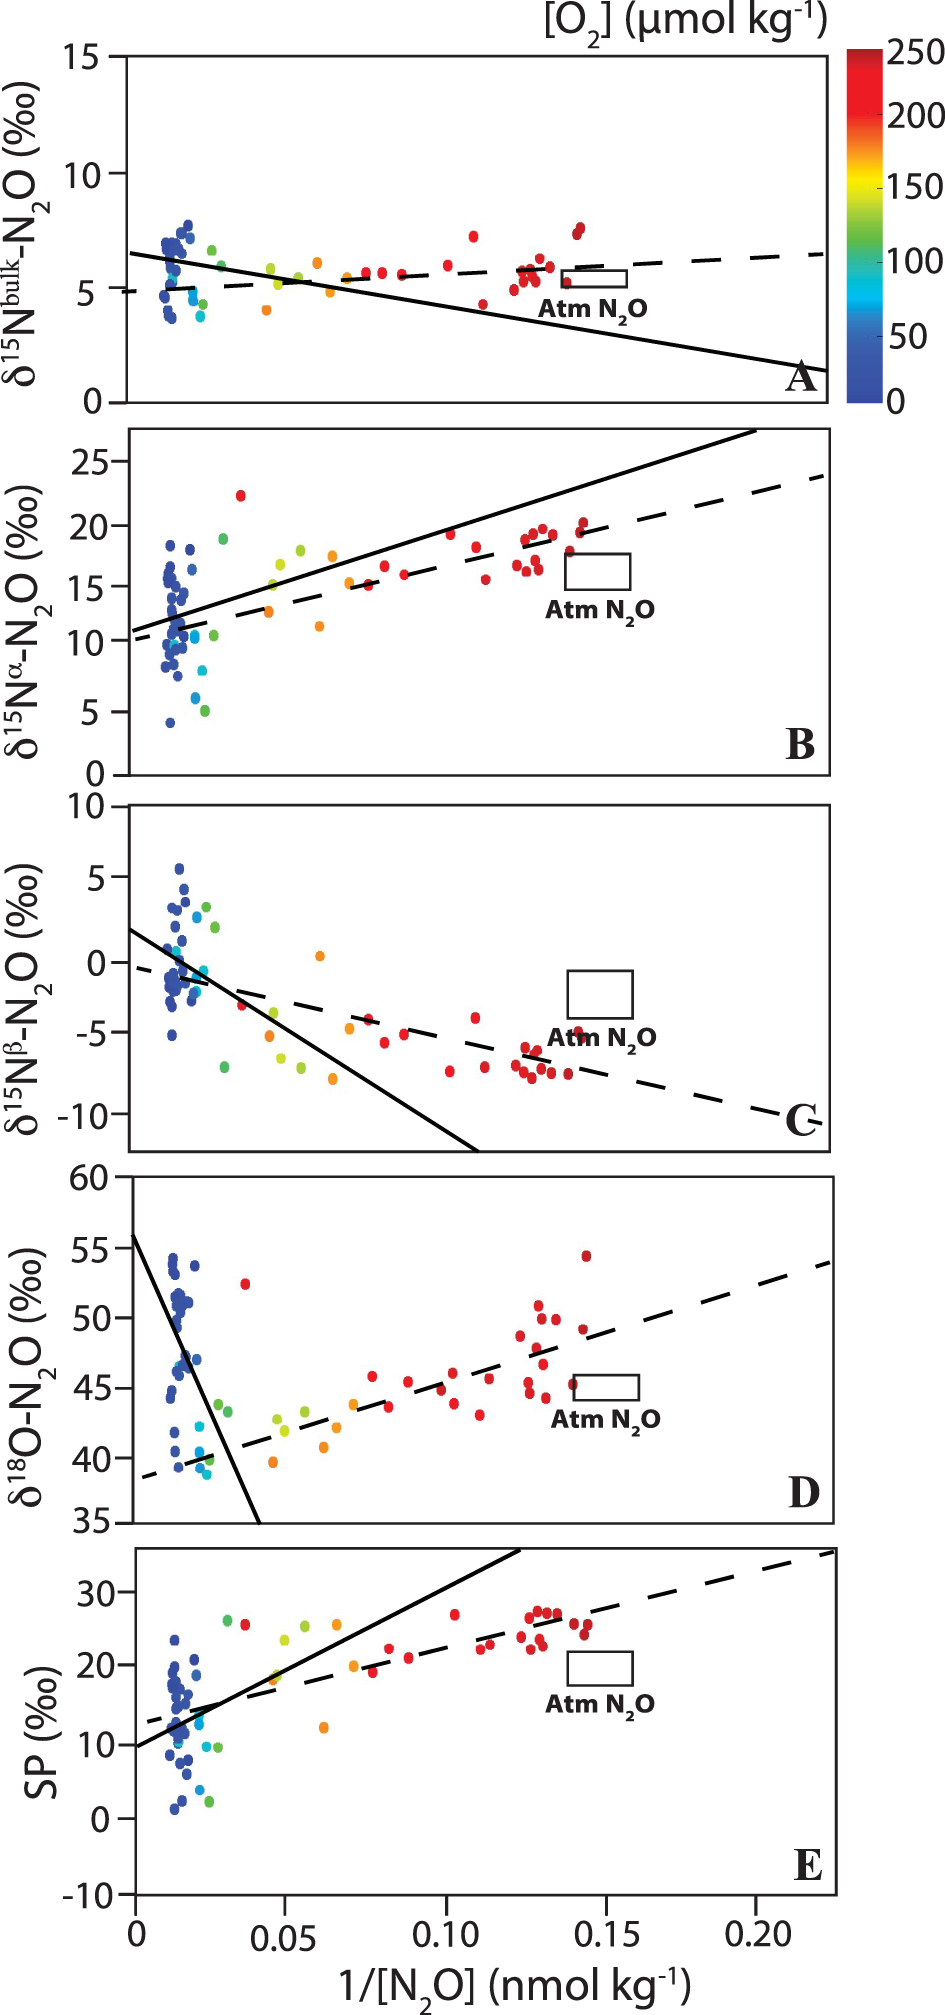
Keeling plot analysis for the ETSP (Equator – 13°S) for (A) δ15Nbulk, (B) δ15Nα, (C) δ15Nβ, (D) δ18O and (E) SP of N2O (in ‰). Black lines are linear regressions (full line: 5 µmol kg-1 < [O2] < 100 µmol kg-1 and dashed line: [O2] > 100 µmol kg-1). O2 concentrations are shown as the color of the symbols (see color bar in top panel). Atmosphere N2O isotopic values are shown as a rectangle (from Kelly et al., 2021). See Table 1 for intercept, R2 and p-value for the linear regressions.
Table 1
| δ15Nbulk-N2O | δ15Nα-N2O | δ15Nβ-N2O | δ18O-N2O | SP | |
|---|---|---|---|---|---|
| ETNP (18.5°N – EQ) | |||||
| 100 µmol kg-1 > [O2] > 5 µmol kg-1 (27 > σθ > 23.3 kg m-3) (n = 37) | |||||
| Intercept | 7.2 ± 0.8 | 2.7 ± 4.0 | 11.7 ± 3.5 | 52.3 ± 3.2 | -9.0 ± 7.3 |
| R2 | 0.079 | 0.086 | 0.19 | 0.10 | 0.14 |
| p-value | 0.09 | 0.08 | <0.01 | 0.06 | 0.02 |
| [O2] > 100 µmol kg-1(surface, σθ < 25.7 kg m-3) (n = 18) | |||||
| Intercept | 4.0 ± 0.4 | 12.3 ± 14.7 | -6.5 ± 1.4 | 40.8 ± 1.4 | 20.7 ± 2.5 |
| R2 | 0.59 | 0.038 | 0.045 | 0.54 | 0.06 |
| p-value | <0.01 | 0.4 | 0.4 | <0.01 | 0.3 |
| Deep waters, σθ > 27.3 kg m-3 (n = 47) | |||||
| Intercept | 9.1 ± 5.0 | 16.8 ± 1.1 | 1.4 ± 0.9 | 52.7 ± 1.7 | 15.4 ± 2.0 |
| R2 | 0.01 | 0.39 | 0.46 | 0.020 | 0.45 |
| p-value | 0.6 | <0.01 | <0.01 | 0.4 | <0.01 |
| ETSP (13°S – EQ) | |||||
| 100 µmol kg-1 > [O2] > 5 µmol kg-1(27 > σθ > 26 kg m-3) (n = 34) | |||||
| Intercept | 6.3 ± 0.9 | 11.0 ± 2.6 | 1.6 ± 2.0 | 55.7 ± 3.3 | 9.5 ± 4.3 |
| R2 | 0.0056 | 0.0084 | 0.035 | 0.17 | 0.020 |
| p-value | 0.7 | 0.6 | 0.3 | 0.01 | 0.4 |
| [O2] > 100 µmol kg-1 (surface waters, σθ < 26 kg m-3) (n = 26) | |||||
| Intercept | 4.9 ± 0.4 | 10.6 ± 1.2 | -0.7 ± 1.2 | 38.3 ± 1.2 | 11.3 ± 2.2 |
| R2 | 0.12 | 0.54 | 0.37 | 0.59 | 0.49 |
| p-value | 0.08 | <0.01 | <0.01 | <0.01 | <0.01 |
| Deep waters, σθ > 27 kg m-3 (n = 26) | |||||
| Intercept | 7.0 ± 0.2 | 17.0 ± 0.9 | -3.0 ± 1.0 | 45.5 ± 0.7 | 20.0 ± 1.8 |
| R2 | 0.67 | 0.34 | 0.0068 | 0.41 | 0.14 |
| p-value | <0.01 | <0.01 | 0.5 | <0.01 | <0.01 |
| AAIW | |||||
| Intercept | 9.4 ± 0.3 | 18.1 ± 0.8 | 0.8 ± 0.6 | 52.5 ± 0.6 | 17.2 ± 1.4 |
| R2 | 0.42 | 0.020 | 0.42 | 0.67 | 0.19 |
| p-value | <0.01 | 0.2 | <0.01 | <0.01 | <0.01 |
| Casciotti et al. (2018) - ETSP | |||||
| Surface | 6.1 ± 1.4 | na | na | 53.0 ± 3.1 | 5.4 ± 4.4 |
| Oxycline | 7.5 ± 2.2 | na | na | 50.7 ± 3.6 | 9.3 ± 2.4 |
| Deep | 6.6 ± 0.6 | na | na | 54.3 ± 0.6 | 20.1 ± 0.5 |
| Kelly et al. (2021) – ETNP | |||||
| Surface | na | 6.6 ± 0.5 | 0.6 ± 0.5 | 46.3 ± 0.5 | 6.6 ± 2.3 |
| Oxycline | na | 2.9 ± 1.4 | -3.8 ± 0.9 | 53.1 ± 1.3 | 5.9 ± 0.8 |
| Deep | 6.2 ± 1.0 | 16.8 ± 0. | -4.5 ± 0.6 | 57.3 ± 0.8 | 21.3 ± 1.0 |
| Atmosphere-equilibrated seawater (Kelly et al., 2021) | 6.2 ± 0.4 | 15.8 ± 1.4 | -3.4 ± 1.6 | 44.3 ± 0.8 | 19.2 ± 2.9 |
Intercept (in ‰), R2, and p-values of linear regressions for Keeling plot analysis under different O2 regimes and regions/water masses along the P18 line.
Standard error of the intercept is reported. P-value associated with a confidence level >90% are in bold. Atmospheric values are from Kelly et al. (2021). na means non available. AAIW temperature and salinity ranges are defined as in Emery (2001) (section 3.1).
The δ15Nbulk of source N2O varied from 4.0 to 7.2‰ (Table 1). δ15Nbulk is affected by the δ15N of the substrate and fractionation effects during N2O production (e.g., Sutka et al., 2006; Frame et al., 2014; Bourbonnais et al., 2017). Similar δ15Nbulk values for source N2O were reported in the ETSP (Casciotti et al., 2018). These values fall within the expected range for the δ15N of remineralized NH4+, the substrate for nitrification, assuming a δ15N of sinking particulate matter of 3-15‰ (Altabet et al., 1999; Altabet, 2001; Berelson et al., 2015) in the eastern Pacific and a modest isotope effect during ammonification (Altabet, 1988). N2O could also be produced by denitrification as the δ15N of NO3- observed in this study (4.5-15.4‰) was also similar to observed δ15Nbulk-N2O values. However, the upper range in δ15N values for these substrates is needed to reproduce the observed δ15Nbulk-N2O during nitrification and denitrification as both processes are expected to add a lower δ15N due to isotopic fractionation, unless the substrate is completely consumed, or the reaction is diffusion limited (see Table 1 in Bourbonnais et al., 2017 for a compilation of ε associated with these processes and Ostrom and Ostrom, 2012; Frame et al., 2014).
A high δ18O (52.3‰) and relatively low δ15Nα (2.7‰) and SP (-9.0‰) were estimated for source N2O in the ETNP just above the ODZ corresponding to highest ΔN2O accumulations. In contrast, δ15Nbulk, δ15Nα, δ15Nβ, δ18O and SP of source N2O in surface waters ([O2] higher than 100 µmol kg-1) were more comparable to atmospheric signatures (Table 1). In the ETSP, the δ15Nα (11.0‰), δ18O (55.7‰) and SP (9.5‰) of source N2O were higher than in the ETNP near the oxycline and the SP in oxic surface waters (11.3‰) was significantly lower. The isotopic values of source N2O observed in surface waters overlying the ODZ in the ETSP contrasted with the values estimated by Casciotti et al. (2018). For instance, the δ18O was significantly lower and the SP was higher than the values reported by Casciotti et al. (2018) (Table 1). These differences were likely caused by spatial and/or temporal heterogeneity. Moreover, P18 only crossed the fringe of the ETSP ODZ, with [O2] generally higher than 5 µmol kg-1, except at a few stations/depths.
The stable isotopic and isotopomer signatures observed at the highest ΔN2O and lowest [O2] near the oxycline in both the ETNP and ETSP are consistent with production from denitrification or nitrifier-denitrification. SP is particularly useful for differentiating N2O production processes as it is mainly pathway dependent and independent of the isotopic composition of the substrate (Schmidt et al., 2004; Sutka et al., 2004). For instance, formation of N2O during bacterial denitrification occurs by combining two NO molecules following a trans mechanism (Toyoda et al., 2005; Magyar, 2017). This mechanism involves the asymmetrical intermediate trans-hyponitrite (-ONNO-) bridging two iron centers; the α N atom and the O comes from NO bonded to Feheme and the β N atom comes from NO bonded to FeB. If the precursor NO molecules are derived from the same substrate, this mechanism causes little difference between the δ15N of the α and β N atoms, resulting in a low SP (see Magyar, 2017 for more detail). In contrast, during N2O formation according to a cis mechanism, a first NO molecule binds to one or the other iron center with the second NO molecule binding directly to the first NO, forming a symmetrical intermediate. Cleavage of 14N-O bond is preferred over 15N-O bond, leading to enrichment of the α position and a higher SP. Thus, N2O produced by nitrification, either by archaea and bacteria, is generally associated with a high SP of 30-38‰ consistent with a cis-formation mechanism (Sutka et al., 2003; Sutka et al., 2004; Frame and Casciotti, 2010; Santoro et al., 2011; Löscher et al., 2012) whereas denitrification and nitrifier-nitrification are associated with much lower SPs (~ - 10 to 0‰) (Sutka et al., 2003; Sutka et al., 2004; Toyoda et al., 2005; Frame and Casciotti, 2010).
N2O produced by denitrification is associated with a low SP of ~ -5 to 0‰ and adds a relatively low δ15N (especially at the α position) with an isotope effect (15ε) ranging from 13-37‰ (Barford et al., 1999; Sutka et al., 2003; Sutka et al., 2004; Toyoda et al., 2005; Sutka et al., 2006; Frame and Casciotti, 2010). On the other hand, branching fractionation, i.e., the preferential loss of 16O relative to 18O during NO3- reduction to N2O, is expected to lead to high δ18O-N2O values (Casciotti et al., 2002; Frame et al., 2014). The δ18O-N2O is affected by both the branching isotope effects (18ϵ) of 25-30‰ for NO3- reduction to NO2- and 10-12‰ during NO2- reduction to N2O during denitrification as well as the equilibration of NO2- O isotope with water (Casciotti et al., 2007; Casciotti and Buchwald, 2012). Nitrifier-denitrification is associated with a SP of -10-0‰ and adds a lower δ15N compared to denitrification due to a larger 15ε ranging from 31-58‰. Furthermore, an effective O isotope effect (18ϵ) of 8-12‰ was reported for NO2- reduction to N2O during nitrifier denitrification (Sutka et al., 2003; Sutka et al., 2004; Sutka et al., 2006; Frame and Casciotti, 2010). Newly produced δ18O-N2O values during nitrification and nitrifier denitrification are thus generally lower (13-35‰; Snider et al., 2012). Accordingly, low source δ18O-N2O values were observed at [O2] > 100 µmol kg-1 in the ETNP and ETSP whereas higher values were observed at deeper isopycnal ranges overlying the ODZs (Table 1), consistent with the dominance of N2O production by nitrification in surface waters and denitrification at lower O2 concentrations near the oxycline.
Kelly et al. (2021) similarly observed two distinctive sources of N2O in the ETNP above the σθ < 25 kg m-3 isopycnal. SPs of 6-8‰ were observed. Based on an isotopic mass balance and assuming that the SPs for N2O produced during nitrification and denitrification are 30-38‰ and 0‰, respectively (Sutka et al., 2003; Sutka et al., 2004; Toyoda et al., 2005; Frame and Casciotti, 2010; Santoro et al., 2011; Löscher et al., 2012), about 80% of the N2O production was attributed to denitrification or nitrifier-denitrification. Bourbonnais et al. (2017) and Casciotti et al. (2018) also observed low SPs (-3 to 10‰) corresponding to large ΔN2O accumulation near the oxycline above the ETSP ODZ. The much lower SP observed in the ETNP in this study (-9‰) preclude any contribution from nitrification. The higher SP (9.5‰) for source N2O observed at low [O2] near the fringe of the ETSP ODZ suggests a relatively minor contribution from nitrification (~1/3) and is consistent with the value reported by Casciotti et al. (2018). However, hybrid N2O formation by archaea, where one atom is derived from nitric oxide (NO; from NO2-) and the other from hydroxylamine (NH2OH; from NH4+) was shown to be an important production pathway in marine environments and could possibly contribute to endmember signatures estimated from the Keeling plot analysis (Stieglmeier et al., 2014; Kozlowski et al., 2016; Trimmer et al., 2016; Frame et al., 2017). Frey et al. (2020) showed that hybrid N2O production accounts for 70-85% of the total N2O production from NH4+ oxidation using 15N-labeled incubation experiments in the ETSP. SP may, in part, reflect the relative δ15N of the substrates for the α and β positions during hybrid archaeal N2O production rather than being indicative of a particular pathway (Casciotti et al., 2018). Therefore, if lower SP could be produced by archaeal hybrid N2O production, the fraction of denitrification needed to explain low SP signatures associated with high N2O supersaturations observed above or in the ODZs in this and previous studies would further decrease (Bourbonnais et al., 2017; Casciotti et al., 2018; Kelly et al., 2021).
The observed relationships between ΔN2O and DIN deficit at isopycnals σθ < 26 kg m-3 and the absence of clear relationships between ΔN2O and [NO2-] further support a role for denitrification (rather than nitrifier-denitrification) as the dominant N2O production pathway in both the ETSP and the ETNP. The decreased slope for the ΔN2O versus DIN deficit relationship toward surface isopycnal ranges observed in the ETNP suggests decreased N2O yield at higher [O2] concentrations or mixing/dilution of N2O produced by denitrification advected from below, especially for upwelling waters near the equator. The δ15N of NO3- provides more insights into N2O sources yet these measurements were mostly available at ETSP stations. A plot of SP versus Δ15N (δ15N-NO3- - δ15N-N2O) showed that some of the highest ΔN2O datapoint indeed fell within the expected compositional fields for N2O production by bacterial denitrification (Δδ15N= 0-35‰, SP: -5-0‰) (Wankel et al. (2017) and references therein, Supplementary Figure S3). Some high ΔN2O were associated with relatively high SPs (> 10‰), showing the overprinting effect of N2O consumption during denitrification (Ostrom et al., 2007). Compositional field analysis (Figure S3) also suggests production by either archaeal and bacterial ammonia oxidation at higher [O2] and lower ΔN2O. Bourbonnais et al. (2017) also invoked incomplete denitrification as a major pathway for extreme N2O accumulation in newly upwelled surface waters off Peru based on the absence of a relationship between ΔN2O and apparent O2 utilization and significant relationships between NO3- and N2O isotopes. The dominance of denitrification for N2O production near the oxycline is also supported by 15N-tracer incubation studies in the ETSP ODZ. N2O production rates were indeed one order of magnitude higher for denitrification compared to ammonia oxidation under low-O2 conditions at the ΔN2O maximum just above the ETSP ODZ (Ji et al., 2015; Frey et al., 2020).
4.2 Sources of N2O below the ETNP and ETSP ODZs and in AAIW
N2O sources in deep ETNP and ETSP were also investigated using Keeling plot analysis (Supplementary materials, Figure S4 and Table 1). A deeper isopycnal range (σθ > 27.3 kg m-3was selected for the ETNP due to the deeper ODZ at this location as in a previous study (Kelly et al., 2021). An isopycnal range with σθ > 27 kg m-3 was selected for the ETSP comparable to the σθ range in Casciotti et al. (2018). N2O source values of 9.1‰ (δ15Nbulk), 16.8‰ (δ15Nα), 1.4‰ (δ15Nβ), 52.7‰ (δ18O) and 15.4‰ (SP) were estimated below the ETNP ODZ (Table 1). In the ETSP, the Keeling plot analysis revealed values of 7.0‰ (δ15Nbulk), 17.0‰ (δ15Nα), -3.0‰ (δ15Nβ), 45.5‰ (δ18O) and 20.0‰ (SP). The generally higher δ15Nβ as well as lower δ18O and SP compared to prior studies (Casciotti et al., 2018; Kelly et al., 2021) might be the result of a lesser influence from N2O production and consumption in the ODZ since our analysis also included equatorial waters. Overall, these isotopic signatures suggest the dominance of N2O production by nitrification in deeper waters below the ETNP and ESTP ODZs. In fact, our results are more in line with a N2O source from nitrification as a relatively low δ18O is expected for this process (i.e., 13-35‰; Snider et al., 2012).
The sources of N2O were investigated by restricting the Keeling plot analysis for the absolute salinity/potential temperature ranges characteristic of AAIW as described in section 3.1. The analysis was restricted to 60°S to 20°S, even if the northernmost extent of AAIW is found below the ETNP, to eliminate possible effects of the ETNP and ETSP ODZs on N2O production in this water mass.
ΔN2O clearly increased from -0.89 nmol kg-1 (-7.4% supersaturation) at 52°S to up to 20.6 nmol kg-1 (180% supersaturation) in the intermediate water mass AAIW (Figure 5), which is comparable to values observed by Carrasco et al. (2017). Keeling plot analysis revealed a N2O source with a δ15Nbulk = 9.4‰, δ15Nα = 18.1‰, δ15Nβ = 0.8‰, δ18O = 52.5‰, and SP = 17.2‰ (Table 1). The relatively high SP suggests that N2O is mainly derived from nitrification, consistent with previous studies (Casciotti et al., 2018; Toyoda et al., 2019; Kelly et al., 2021). The positive significant relationship observed between ΔN2O and AOU in the AAIW water mass observed in this study and Carrasco et al. (2017) further supports this interpretation (Supplementary materials, Figure S2). The lower δ15Nβ and higher δ18O and SP might reflect the influence of N2O consumption in the ODZs in these prior studies.
4.3 Isotopic signatures of N2O consumption in the ETNP
High values of δ15Nα, δ18O and SP and low or negative ΔN2O were observed at [O2] < 5 µmol kg-1 in the ETNP ODZ, which are clear signatures of N2O consumption (Figure 5). During N2O reduction to N2 gas, the N-O bond is broken, leaving the remaining substrate (N2O) enriched in 15N and 18O. The α position in N2O is preferentially enriched in 15N compared to the β position since it is directly attached to the O atom being cleaved (e.g., Popp et al., 2002; Toyoda et al., 2002). Thus, ε for the α N atom (6.6-9.1‰) and δ18O (10.9-15‰) are relatively large with only a small or negligible ε for β N atom (Ostrom et al., 2007). Notably, while δ15Nα and δ18O increased in the ODZ, δ15Nβ generally decreased, as also observed in previous ETNP and ETSP ODZ studies (Bourbonnais et al., 2017; Casciotti et al., 2018; Kelly et al., 2021) (Figure 5). This trend is not expected during pure N2O consumption.
The slope for the relationship between δ18O versus and δ15Nα (1.6 ± 0.1) was indistinguishable from the expected slope (i.e., 1.7) during N2O consumption in soils and pure denitrifier cultures (Ostrom et al., 2007). However, the observed slope for δ18O-N2O versus SP (0.8 ± 0.1) clearly deviated from the expected value of 2.2 for pure N2O reduction (Ostrom et al., 2007) (Figure 10). A wider range of 1.3-3.3 for δ18O versus SP during consumption by denitrification was also reported for soil mesocosms, which is still higher than the slope observed in this study (Lewicka-Szczebak et al., 2017). This observation is consistent with previous studies in marine ODZs, reporting slopes for δ18O versus SP ranging between (0.9-1.8) (Bourbonnais et al., 2017; Casciotti et al., 2018; Kelly et al., 2021). For instance, in the ODZ off Peru, the slope for increase in δ18O-N2O versus SP deviates from what is expected during pure denitrification, mostly due to a decrease in δ15Nβ within the ODZ (Bourbonnais et al., 2017; Casciotti et al., 2018). This trend showing a decreasing δ15Nβ associated with high δ18O-N2O has also been observed in other ODZs and marine anoxic environments (Yamagishi et al., 2005; Westley et al., 2006; Yamagishi et al., 2007; Farías et al., 2009; Kelly et al., 2021). The cause for the decreasing δ15Nβ in the ODZ will be further discussed below.
Figure 10
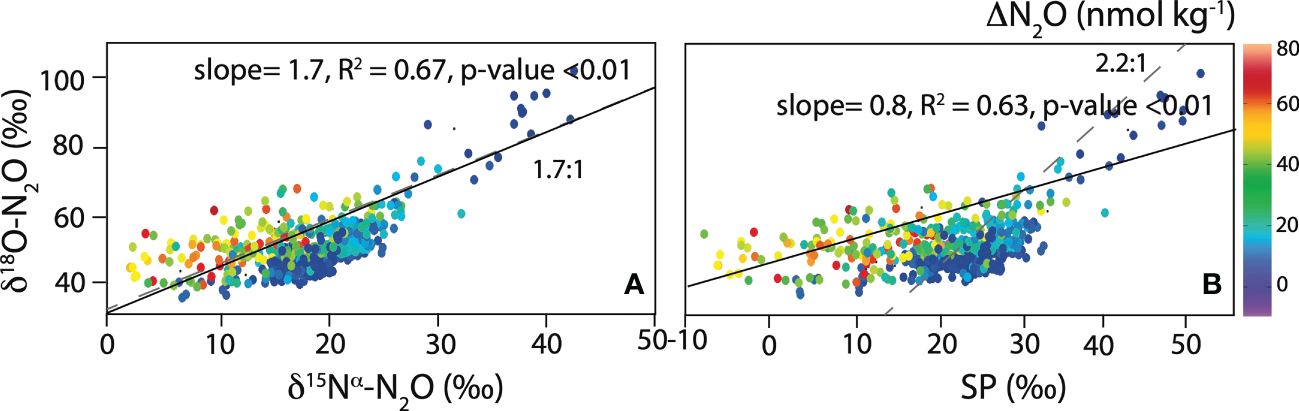
δ18N-N2O versus (A) δ15Nα-N2O, and (B) SP. The slope expected for pure denitrification is indicated with dashed grey lines (Ostrom et al., 2007). ΔN2O concentrations are shown as the color of the symbols (see color bar in top panel). Linear regressions for O2 < 5 µmol kg-1 are shown with black lines.
In this study, apparent isotope effects (εapp) were derived for all isopycnal ranges within the ETNP ODZ at [O2] < 5 µmol kg-1, where N2O consumption is known to occur (Dalsgaard et al., 2014). This approach was used in Casciotti et al. (2018) to further investigate if a decrease in ε18O or increase in εSP could explain the deviation from the expected slope for δ18O-N2O versus SP during pure N2O consumption in the ETSP ODZ. Apparent isotope effects calculated for all isopycnal ranges were 3.6‰ for 15Nbulk, 9.4‰ for 15Nα, -2.3‰ for 15Nβ, 12.0‰ for 18O and 11.7‰ for SP (Table 2 and Figure 11). The εapp for 15Nbulk was slightly lower than the range reported for pure culture by Ostrom et al. (2007). Yet, the εapp for 15Nα and 15Nβ were comparable to values (11.8‰ and -2‰, respectively) estimated by Kelly et al. (2021) in the ETNP ODZ. Notably, the negative isotope effect for 15Nβ indicates a decrease in δ15Nβ as N2O is reduced to N2 within the ODZ. The ε for 18O calculated in this study was significantly lower than the values (14.5 – 20.2‰) estimated in other ODZ marine field studies (Casciotti et al., 2018; Kelly et al., 2021), but comprised within the range observed for pure culture (10.9 – 15‰) (Ostrom et al., 2007). The ε for SP was higher than for pure culture (5.0 – 6.8‰) but comparable to values estimated in the ETSP ODZ (11.6 – 17.5‰) (Casciotti et al., 2018). Casciotti et al. (2018) observed different apparent isotope effects at different isopycnal ranges within the ETSP ODZ. They observed a decrease in the ε18O within the ODZ (from 25.6‰ in the upper, to 19.6‰ in the middle and 14.5‰ in the lower ODZ) while the εSP increased slightly and then decreased (17.5‰ in the upper to 21.7‰ in the middle to 11.6‰ in the lower ODZ). A more detailed analysis by isopycnal ranges (upper, middle, and lower ODZ) could however not reproduce observed trends in Casciotti et al. (2018) for the P18 transect. For instance, εapp for 18O (13.9‰ in the upper ODZ to 11.4‰ in the middle, and 16.2‰ in the lower ODZ) and SP (14.2‰ in the upper ODZ to 7.5‰ in the middle, and 17.9‰ in the lower ODZ) both decreased toward the middle ODZ and then increased in the deeper ODZ (Supplementary materials, Figure S5). The slope for ε18O versus εSP also gradually decreased from 1.6 to 0.65 instead of being lowest in the middle ODZ. Irrespective of the observed trends, using a modeling approach and isotope values of substrates (NO3- and N18O2-) during denitrification, previous studies attributed the lower ε18O:εSP to an increase in SP due to a decrease in δ15Nβ rather than a decrease in ε18O or increase in εSP in both the ETNP and ESTP ODZs (Casciotti et al., 2018; Kelly et al., 2021).
Table 2
| This study | Ostrom et al. (2007) Pure culture | Casciotti et al. (2018) ETSP ODZ | Kelly et al. (2021) ETNP ODZ | |
|---|---|---|---|---|
| ϵ15Nbulk | 3.6 ± 0.4 R2 = 0.65, P < 0.01 | 4.1 – 6.6 | na | na |
| ϵ15Nα | 9.4 ± 0.9 R2 = 0.66, P < 0.01 | 6.6 – 9.1 | na | 11.8 ± 2.5 |
| ϵ15Nβ | -2.3 ± 0.6 R2 = 0.20, P < 0.01 | 1.6 – 2.2 | na | -2.0 ± 2.0 |
| ϵ18O | 12.0 ± 1.3 R2 = 0.60, P < 0.01 | 10.9 – 15.0 | 14.5 – 25.6 | 20.2 ± 6.1 |
| ϵSP | 11.7 ± 1.4 R2 = 0.57, P < 0.01 | 5.0 - 6.8 | 11.6 – 17.5 | na |
| ϵ18O/ϵ15Nbulk | 3.4 ± 0.5 R2 = 0.91, P < 0.01 | 2.5 ± 0.2 | na | na |
| ϵ18O/ϵSP | 1.0 ± 0.2 | 2.2 | 0.9 – 1.5 | na |
Apparent isotope effects for N2O consumption (in ‰) calculated using a closed system Rayleigh model for 15Nbulk, 15Nα, 15Nβ, 18O and SP for the ETNP.
Only samples with [O2] < 5 µmol kg-1 were considered. Isotope effects observed in pure laboratory culture and field studies in the ETNP and ETSP ODZs are also listed (Ostrom et al., 2007; Casciotti et al., 2018; Kelly et al., 2021). Standard error of the slope is shown. na means non available.
Figure 11
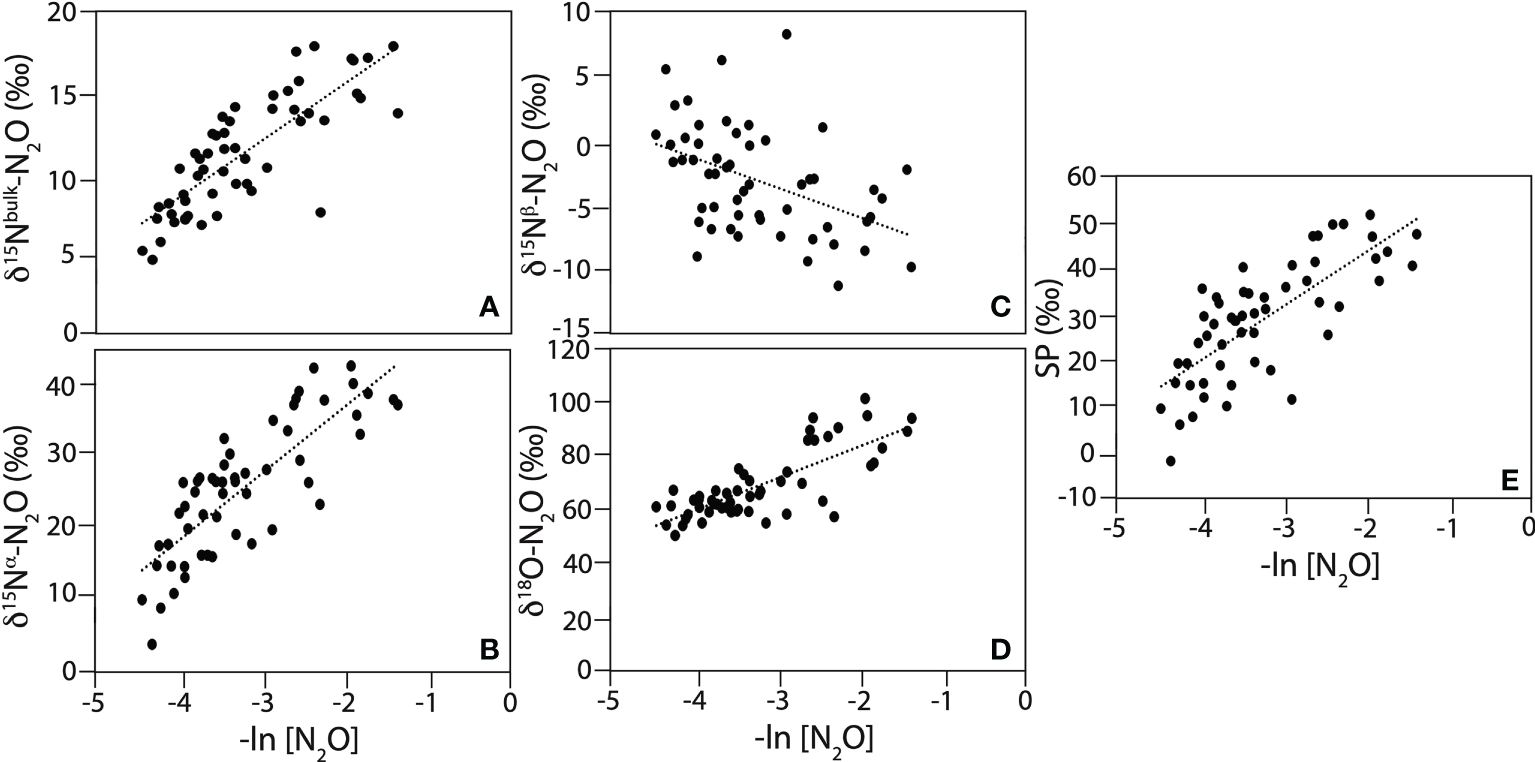
Apparent isotope effects for (A) δ15Nbulk-N2O, (B) δ15Nα-N2O, (C) δ15Nβ-N2O, (D) δ18O-N2O, and (E) SP calculated for [O2] < 5 µmol kg-1. Black lines are linear regressions. Linear regression outputs are reported in Table 2.
Several hypotheses have been proposed to explain the decreasing δ15Nβ in ODZ waters, including concurrent N2O production via denitrification of NO3- with a site preference >0‰ (Schmidt et al., 2004; Casciotti et al., 2018; Kelly et al., 2021). Rate experiments as well as prior stable abundance isotopic studies suggest concurrent N2O production and consumption as well as a rapid N2O turnover in the ODZ (Farías et al., 2009; Babbin et al., 2015; Ji et al., 2015; Bourbonnais et al., 2017; Casciotti et al., 2018; Frey et al., 2020; Kelly et al., 2021). Casciotti et al. (2018) modeled N2O cycling at steady-state in the ODZ using both δ15N and δ18O of substrate molecules (NO2- and NO3-) during denitrification. N2O isotopic signatures were only reproduced when NO3- was used as the substrate and implying a site preference >0‰ (i.e., greater fractionation at the 15Nβ position relative to the 15Nα) during N2O production by denitrification. This suggests that an internal (rather than ambient) pool of NO2- is used during denitrification as further discussed in Casciotti et al. (2018). Accordingly, a relatively long residence time was estimated for ambient NO2- (in the order of months) in the primary NO2- maximum and low-O2 waters based on rates of abiotic O isotope exchange between nitrite and water (Buchwald and Casciotti, 2013; Bourbonnais et al., 2015). In another modeling study, a non-steady-state N2O cycling as well as an ambient NO2- substrate source (with a δ15N as low as -30‰) or a SP of ~25‰ during concurrent N2O production by denitrification were required to explain the observed low δ15Nβ values in the ETNP ODZ (Kelly et al., 2021). The low δ15Nβ of N2O could also result from an alternate mechanism in the ODZ, such as N2O production from AO archaea and bacteria, which is associated with a high SP (30-38‰; Sutka et al., 2003; Sutka et al., 2004; Frame and Casciotti, 2010; Santoro et al., 2011; Löscher et al., 2012). For instance, an archaeal AO isolated from ODZs (Nitrosopumilus maritimus) produced both N2 and O2 under dark anaerobic conditions, following a pathway that involves N2O as an intermediate (Kraft et al., 2022). Yet, N2O production rates from AO based on 15N-labeled experiments were relatively low (up to 0.1 nmol L-1 d-1) and generally at least one order of magnitude lower than N2O production rates from NO3- (denitrification) under anoxic conditions in the ETSP ODZ (Frey et al., 2020).
The idea of denitrification with a site preference >0‰ is not new (i.e., see Schmidt et al., 2004). Several studies invoked N2O production during denitrification with a site preference >0‰ in the ETNP and ETSP ODZs and Canadian Arctic bottom waters influenced by sedimentary processes (Casciotti et al., 2018; Lehmann et al., 2019; Kelly et al., 2021). Some variability in the SP of N2O produced by denitrification was reported for different bacterial strains. For instance, Toyoda et al. (2005) observed a high SP of 22 to 24‰ for N2O production during denitrification by Pseudomonas fluorescens, suggesting a symmetrical intermediate (i.e., cis formation mechanism). These observations for denitrifying bacteria are analogous to the wide range of SPs (15.8 – 37.1‰) that have been reported for different fungal species and strains (Maeda et al., 2015; Lazo-Murphy et al., 2022). These data challenge the conventional view that fungal denitrification fits into narrow compositional fields with relatively high SP values. Similarly, it is possible that denitrifying microbial consortia thriving under different O2 regimes are associated with variable SPs, but this hypothesis remains to be verified.
5 Concluding remarks
This study presents oceanic N2O concentration, stable isotope and isotopomer data of unprecedently high spatial resolution along the P18 line in the eastern Pacific sampled in 2016/2017. Highest ΔN2O accumulations (up to 940% supersaturation) were observed close to the oxycline in both the ETNP and the fringe of the ETSP ODZ. N2O yield from AOU increased at lower [O2], consistent with previous studies. Keeling plot analysis identified two distinct sources of N2O at different [O2] regimes. At lower [O2] concentrations close to the oxycline in both ODZs, where highest ΔN2O were observed, SP of source N2O was relatively low, suggesting production from denitrification (or nitrifier-denitrification). Relationships between ΔN2O and DIN deficit and the isotopic composition of δ15N of the substrate (NO3-) further suggest that denitrification is the dominant process at low [O2] concentrations. SP generally increased in more oxygenated surface waters, suggesting a greater contribution from nitrification. The isotopic composition of source N2O in deeper waters of the ETNP and ETSP as well as in AAIW also suggested that nitrification was the main pathway for N2O formation.
The δ18O versus δ15Nα relationship showed a slope characteristic of N2O consumption during denitrification in low O2 waters. Isotope effects calculated for N2O consumption were consistent with previous field and laboratory studies (Ostrom et al., 2007; Casciotti et al., 2018; Kelly et al., 2021). Yet, δ15Nβ decreased (rather than the predicted no change or slight increase during denitrification) in the ODZ, which was also observed by previous studies (e.g., Bourbonnais et al., 2017; Casciotti et al., 2018; and Kelly et al., 2021). These signatures are best explained by concurrent N2O production (from NO3- or NO2-) with a site preference >0‰, an ambient NO2- source with a low δ15N and non-steady-state conditions (e.g., Kelly et al., 2021). Clearly, more research is needed to elucidate the SP and its variability for diverse denitrifying bacterial strains living in marine ODZs as current values are mostly from terrestrial environments (e.g., Toyoda et al., 2005). Some contribution from an alternative N2O production pathway is also possible, for example anaerobic AO (see Kraft et al., 2022).
This study establishes a benchmark against which to evaluate changes in N2O cycling for future decadal occupations of the P18 line. ODZ are currently expanding (Stramma et al., 2013), with unknown impacts on N2O cycling. The vertical expansion of ODZs not only increases the volume of low-O2 waters where N2O is potentially produced but also increases N2O exchange with the atmosphere. However, co-occurring warming causes stronger stratification, which could reduce mixing and N2O outgassing to the atmosphere. At this point, it is unclear which mechanism will dominate. Thus, more observational data is needed to evaluate the impacts of ODZs expansion on marine N2O cycling and atmospheric emissions.
Statements
Data availability statement
The datasets presented in this study can be found in online repositories. The names of the repository/repositories and accession number(s) can be found below: https://cchdo.ucsd.edu/cruise/33RO20161119.
Author contributions
AB, SD, and MA designed the study. AB analyzed stable isotope and isotopomer samples. BC analyzed N2O concentration and CFC/SF6 samples and RS calculated the transit time distributions. AB wrote the manuscript with input from all co-authors. All authors contributed to the article and approved the submitted version.
Funding
This study was funded through a GO-SHIP National Science Foundation (NSF) postdoctoral Fellowship to AB (NSF OCE-1437015) and NSF OCE-2023545 that covered publication costs. MA and SD acknowledge support from NSF (OCE-1851361 and OCE-1947822). BC and RS were supported by the National Oceanic and Atmospheric Administration’s Global Ocean Monitoring and Observations program.
Acknowledgments
We thank the captain and crew of the NOAA R/V Ronald Brown for their support during the P18 research expedition. We also thank the scientific party, especially Brendan Carter, chief scientist during leg 1 of P18 and Alexander Sidelev for collecting N2O stable isotope and isotopomer samples during leg 2.
Conflict of interest
The authors declare that the research was conducted in the absence of any commercial or financial relationships that could be construed as a potential conflict of interest.
Publisher’s note
All claims expressed in this article are solely those of the authors and do not necessarily represent those of their affiliated organizations, or those of the publisher, the editors and the reviewers. Any product that may be evaluated in this article, or claim that may be made by its manufacturer, is not guaranteed or endorsed by the publisher.
Supplementary material
The Supplementary Material for this article can be found online at: https://www.frontiersin.org/articles/10.3389/fmars.2023.1137064/full#supplementary-material
References
1
AltabetM. A. (1988). Variations in nitrogen isotopic composition between sinking and suspended particles: Implications for nitrogen cycling and particle transformation in the open ocean. Deep Sea Res. Part A. Oceanographic Res. Papers35 (4), 535–554. doi: 10.1016/0198-0149(88)90130-6
2
AltabetM. A. (2001). Nitrogen isotopic evidence for micronutrient control of fractional NO3– utilization in the equatorial pacific. Limnol. Oceanogr.46 (2), 368–380. doi: 10.4319/lo.2001.46.2.0368
3
AltabetM. A. (2006). “Isotopic tracers of the marine nitrogen cycle: present and past,” in Marine organic matter: Chemical and biological markers. the handbook of environmental chemistry. Ed. VolkmanJ. (Berlin: Springer-Verlag), pp251–pp293.
4
AltabetM. A.PilskalnC.ThunellR.PrideC.SigmanD.ChavezF.et al. (1999). The nitrogen isotope biogeochemistry of sinking particles from the margin of the Eastern north pacific. Deep Sea Res. Part I: Oceanographic Res. Papers46 (4), 655–679. doi: 10.1016/S0967-0637(98)00084-3
5
AltabetM. A.WassenaarL. I.DouenceC.RoyR. (2019). A Ti (III) reduction method for one-step conversion of seawater and freshwater nitrate into N2O for stable isotopic analysis of 15N/14N, 18O/16O and 17O/16O. Rapid Commun. Mass Spectrometry33 (15), 1227–1239. doi: 10.1002/rcm.8454
6
Arévalo-MartínezD. L.KockA.LöscherC. R.SchmitzR. A.BangeH. W. (2015). Massive nitrous oxide emissions from the tropical south pacific ocean. Nat. Geosci.8 (7), 530–533. doi: 10.1038/ngeo2469
7
Arévalo-MartínezD. L.KockA.LöscherC. R.SchmitzR. A.StrammaL.BangeH. W. (2016). Influence of mesoscale eddies on the distribution of nitrous oxide in the eastern tropical south pacific. Biogeosciences13 (4), 1105–1118. doi: 10.5194/bg-13-1105-2016
8
BabbinA. R.BianchiD.JayakumarA.WardB. B. (2015). Rapid nitrous oxide cycling in the suboxic ocean. Science348 (6239), 1127–1129. doi: 10.1126/science.aaa8380
9
BabbinA. R.BolesE. L.MühleJ.WeissR. F. (2020). On the natural spatio-temporal heterogeneity of south pacific nitrous oxide. Nat. Commun.11 (1), 1–9. doi: 10.1038/s41467-020-17509-6
10
BakkerD. C.BangeH. W.GruberN.JohannessenT.Upstill-GoddardR. C.BorgesA. V.et al. (2014). Air-sea interactions of natural long-lived greenhouse gases (CO2, N2O, CH4) in a changing climate. Ocean-Atmosphere Interactions of Gases and Particles. (Switzerland AG: Springer Nature), pp113–169.
11
BangeH. W.AndreaeM. O.LalS.LawC. S.NaqviS. W. A.PatraP. K.et al. (2001). Nitrous oxide emissions from the Arabian Sea: A synthesis. Atmospheric Chem. Phys.1 (1), 61–71. doi: 10.5194/acp-1-61-2001
12
BarfordC. C.MontoyaJ. P.AltabetM. A.MitchellR. (1999). Steady-state nitrogen isotope effects of N2 and N2O production in paracoccus denitrificans. Appl. Environ. Microbiol.65 (3), 989–994. doi: 10.1128/AEM.65.3.989-994.1999
13
BerelsonW. M.HaskellW. Z.IIProkopenkoM.KnappA. N.HammondD. E.RollinsN.et al. (2015). Biogenic particle flux and benthic remineralization in the Eastern tropical south pacific. Deep Sea Res. Part I: Oceanographic Res. Papers99, 23–34. doi: 10.1016/j.dsr.2014.12.006
14
BourbonnaisA.AltabetM. A.CharoenpongC. N.LarkumJ.HuH.BangeH. W.et al. (2015). N-loss isotope effects in the Peru oxygen minimum zone studied using a mesoscale eddy as a natural tracer experiment. Global Biogeochemical Cycles29 (6), 793–811. doi: 10.1002/2014GB005001
15
BourbonnaisA.LehmannM. F.WaniekJ. J.Schulz-BullD. E. (2009). Nitrate isotope anomalies reflect N2 fixation in the Azores front region (subtropical NE Atlantic). J. Geophys. Res.: Oceans114 (C3). doi: 10.1029/2007JC004617
16
BourbonnaisA.LetscherR. T.BangeH. W.EchevinV.LarkumJ.MohnJ.et al. (2017). N2O production and consumption from stable isotopic and concentration data in the Peruvian coastal upwelling system. Global Biogeochemical Cycles31 (4), 678–698. doi: 10.1002/2016GB005567
17
BourbonnaisA.FreyC.SunX.BristowL. A.JayakumarA.OstromN. E.et al. (2021). Protocols for assessing transformation rates of nitrous oxide in the water column. Front. Mar. Sci.8, 611937. doi: 10.3389/fmars.2021.611937
18
BuchwaldC.CasciottiK. L. (2010). Oxygen isotopic fractionation and exchange during bacterial nitrite oxidation. Limnol. Oceanogr.55 (3), 1064–1074. doi: 10.4319/lo.2010.55.3.1064
19
BuchwaldC.CasciottiK. L. (2013). Isotopic ratios of nitrite as tracers of the sources and age of oceanic nitrite. Nat. Geosci.6(4), 308–313.
20
CarantoJ. D.LancasterK. M. (2017). Nitric oxide is an obligate bacterial nitrification intermediate produced by hydroxylamine oxidoreductase. Proc. Natl. Acad. Sci.114 (31), 8217–8222. doi: 10.1073/pnas.1704504114
21
CarrascoC.KarstensenJ.FariasL. (2017). On the nitrous oxide accumulation in intermediate waters of the eastern south pacific ocean. Front. Mar. Sci.4, 24. doi: 10.3389/fmars.2017.00024
22
CasciottiK. L.BöhlkeJ. K.McIlvinM. R.MroczkowskiS. J.HannonJ. E. (2007). Oxygen isotopes in nitrite: Analysis, calibration, and equilibration. Analytical Chem.79 (6), 2427–2436. doi: 10.1021/ac061598h
23
CasciottiK. L.BuchwaldC. (2012). Insights on the marine microbial nitrogen cycle from isotopic approaches to nitrification. Front. Microbiol.3, 356. doi: 10.3389/fmicb.2012.00356
24
CasciottiK. L.ForbesM.VedamatiJ.PetersB. D.MartinT. S.MordyC. W. (2018). Nitrous oxide cycling in the Eastern tropical south pacific as inferred from isotopic and isotopomeric data. Deep Sea Res. Part II: Topical Stud. Oceanogr.156, 155–167. doi: 10.1016/j.dsr2.2018.07.014
25
CasciottiK. L.SigmanD. M.HastingsM. G.BöhlkeJ. K.HilkertA. (2002). Measurement of the oxygen isotopic composition of nitrate in seawater and freshwater using the denitrifier method. Analytical Chem.74 (19), 4905–4912. doi: 10.1021/ac020113w
26
ChangB. X.DevolA. H.EmersonS. R. (2010). Denitrification and the nitrogen gas excess in the eastern tropical south pacific oxygen deficient zone. Deep Sea Res. Part I: Oceanographic Res. Papers57 (9), 1092–1101. doi: 10.1016/j.dsr.2010.05.009
27
ChangB. X.DevolA. H.EmersonS. R. (2012). Fixed nitrogen loss from the eastern tropical north pacific and Arabian Sea oxygen deficient zones determined from measurements of N2: Ar. Global Biogeochem. Cycles26 (3). doi: 10.1029/2011GB004207
28
CharoenpongC. N.BristowL. A.AltabetM. A. (2014). A continuous flow isotope ratio mass spectrometry method for high precision determination of dissolved gas ratios and isotopic composition. Limnol. Oceanogr.: Methods12 (5), 323–337. doi: 10.4319/lom.2014.12.323
29
CiaisP.SabineC.BalaG.BoppL.BrovkinV.CanadellJ.et al. (2013). Carbon and Other Biogeochemical Cycles. In: Climate Change 2013: The Physical Science Basis. Contribution of Working Group I to the Fifth Assessment Report of the Intergovernmental Panel on Climate Change [StockerT. F.QinD.PlattnerG.-K.TignorM.AllenS. K.BoschungJ.et al (eds.)]. Cambridge University Press, Cambridge, United Kingdom and New York, NY, USA, pp465, pp570.
30
ClineJ. D.KaplanI. R. (1975). Isotopic fractionation of dissolved nitrate during denitrification in the eastern tropical north pacific ocean. Mar. Chem.3 (4), 271–299. doi: 10.1016/0304-4203(75)90009-2
31
CohenY.GordonL. I. (1979). Nitrous oxide production in the ocean. J. Geophys. Res.: Oceans84 (C1), 347–353. doi: 10.1029/JC084iC01p00347
32
DalsgaardT.StewartF. J.ThamdrupB.De BrabandereL.RevsbechN. P.UlloaO.et al. (2014). Oxygen at nanomolar levels reversibly suppresses process rates and gene expression in anammox and denitrification in the oxygen minimum zone off northern Chile. MBio5 (6), e01966–e01914. doi: 10.1128/mBio.01966-14
33
EmeryW. J. (2001). Water types and water masses. Encyclopedia ocean Sci.6, 3179–3187. doi: 10.1006/rwos.2001.0108
34
FaríasL.Castro-GonzálezM.CornejoM.CharpentierJ.FaúndezJ.BoontanonN.et al. (2009). Denitrification and nitrous oxide cycling within the upper oxycline of the eastern tropical south pacific oxygen minimum zone. Limnol. Oceanogr.54 (1), 132–144. doi: 10.4319/lo.2009.54.1.0132
35
ForsterP.StorelvmoT.ArmourK.CollinsW.DufresneJ.-L.FrameD.et al. (2021). “The earth’s energy budget, climate feedbacks, and climate sensitivity,” in Climate change 2021: The physical science basis. contribution of working group I to the sixth assessment report of the intergovernmental panel on climate change. Eds. [Masson-DelmotteV.ZhaiP.PiraniA.ConnorsS. L.PéanC.BergerS.CaudN.ChenY.GoldfarbL.GomisM. I.HuangM.LeitzellK.LonnoyE.MatthewsJ. B. R.MaycockT. K.WaterfieldT.YelekçiO.YuR.ZhouB. (Cambridge, United Kingdom and New York, NY, USA: Cambridge University Press), pp923–p1054. doi: 10.1017/9781009157896.009
36
FrameC. H.CasciottiK. L. (2010). Biogeochemical controls and isotopic signatures of nitrous oxide production by a marine ammonia-oxidizing bacterium. Biogeosciences7 (9), 2695–2709. doi: 10.5194/bg-7-2695-2010
37
FrameC. H.DealE.NevisonC. D.CasciottiK. L. (2014). N2O production in the eastern south Atlantic: Analysis of N2O stable isotopic and concentration data. Global Biogeochemical Cycles28 (11), 1262–1278. doi: 10.1002/2013GB004790
38
FrameC. H.LauE.NolanE. J.IVGoepfertT. J.LehmannM. F. (2017). Acidification enhances hybrid N2O production associated with aquatic ammonia-oxidizing microorganisms. Front. Microbiol.7, 2104. doi: 10.3389/fmicb.2016.02104
39
FreingA.WallaceD. W.BangeH. W. (2012). Global oceanic production of nitrous oxide. Philos. Trans. R. Soc. B: Biol. Sci.367 (1593), 1245–1255. doi: 10.1098/rstb.2011.0360
40
FreingA.WallaceD. W. R.TanhuaT.WalterS.BangeH. W. (2009). North Atlantic production of nitrous oxide in the context of changing atmospheric levels. Global Biogeochemical Cycles23, 13. doi: 10.1029/2009gb003472
41
FreyC.BangeH. W.AchterbergE. P.JayakumarA.LöscherC. R.Arévalo-MartínezD. L.et al. (2020). Regulation of nitrous oxide production in low-oxygen waters off the coast of Peru. Biogeosciences17 (8), 2263–2287. doi: 10.5194/bg-17-2263-2020
42
FujiiA.ToyodaS.YoshidaO.WatanabeS.SasakiK. I.YoshidaN. (2013). Distribution of nitrous oxide dissolved in water masses in the eastern subtropical north pacific and its origin inferred from isotopomer analysis. J. Oceanogr.69 (2), 147–157. doi: 10.1007/s10872-012-0162-4
43
GoreauT. J.KaplanW. A.WofsyS. C.McElroyM. B.ValoisF. W.WatsonS. W. (1980). Production of NO2- and N2O by nitrifying bacteria at reduced concentrations of oxygen. Appl. Environ. Microbiol.40 (3), 526–532. doi: 10.1128/aem.40.3.526-532.1980
44
GrangerJ.SigmanD. M.LehmannM. F.TortellP. D. (2008). Nitrogen and oxygen isotope fractionation during dissimilatory nitrate reduction by denitrifying bacteria. Limnol. Oceanogr.53 (6), 2533–2545. doi: 10.4319/lo.2008.53.6.2533
45
GrangerJ.SigmanD. M.NeedobaJ. A.HarrisonP. J. (2004). Coupled nitrogen and oxygen isotope fractionation of nitrate during assimilation by cultures of marine phytoplankton. Limnol. Oceanogr.49 (5), 1763–1773. doi: 10.4319/lo.2004.49.5.1763
46
HeilJ.WolfB.BrüggemannN.EmmeneggerL.TuzsonB.VereeckenH.et al. (2014). Site-specific 15N isotopic signatures of abiotically produced N2O. Geochimica Cosmochimica Acta139, 72–82. doi: 10.1016/j.gca.2014.04.037
47
HinkL.LycusP.Gubry-RanginC.FrostegårdÅ.NicolG. W.ProsserJ. I.et al. (2017a). Kinetics of NH3-oxidation, NO-turnover, N2O-production and electron flow during oxygen depletion in model bacterial and archaeal ammonia oxidisers. Environ. Microbiol.19 (12), 4882–4896. doi: 10.1111/1462-2920.13914
48
HinkL.NicolG. W.ProsserJ. I. (2017b). Archaea produce lower yields of N2O than bacteria during aerobic ammonia oxidation in soil. Environ. Microbiol.19 (12), 4829–4837.
49
HowellE. A.DoneyS. C.FineR. A.OlsonD. B. (1997). Geochemical estimates of denitrification rates for the Arabian Sea and bay of Bengal during WOCE. Geophys. Res. Lett.24, 2549–2552. doi: 10.1029/97GL01538
50
JiQ.AltabetM. A.BangeH. W.GracoM. I.MaX.Arévalo-MartínezD. L.et al. (2019). Investigating the effect of El niño on nitrous oxide distribution in the eastern tropical south pacific. Biogeosciences16 (9), 2079–2093. doi: 10.5194/bg-16-2079-2019
51
JiQ.BabbinA. R.JayakumarA.OleynikS.WardB. B. (2015). Nitrous oxide production by nitrification and denitrification in the Eastern tropical south pacific oxygen minimum zone. Geophys. Res. Lett.42 (24), 10–755. doi: 10.1002/2015GL066853
52
JiQ.BuitenhuisE.SuntharalingamP.SarmientoJ. L.WardB. B. (2018). Global nitrous oxide production determined by oxygen sensitivity of nitrification and denitrification. Global Biogeochemical Cycles32 (12), 1790–1802. doi: 10.1029/2018GB005887
53
KeelingC. D. (1961). The concentration and isotopic abundances of carbon dioxide in rural and marine air. Geochimica Cosmochimica Acta24 (3-4), 277–298. doi: 10.1016/0016-7037(61)90023-0
54
KellyC. L.TravisN. M.BayaP. A.CasciottiK. L. (2021). Quantifying nitrous oxide cycling regimes in the Eastern tropical north pacific ocean with isotopomer analysis. Global Biogeochemical Cycles35 (2), e2020GB006637. doi: 10.1029/2020GB006637
55
KockA.Arévalo-MartínezD. L.LöscherC. R.BangeH. W. (2016). Extreme N2O accumulation in the coastal oxygen minimum zone off Peru. Biogeosciences13 (3), 827–840. doi: 10.5194/bg-13-827-2016
56
KoolD. M.DolfingJ.WrageN.Van GroenigenJ. W. (2011). Nitrifier denitrification as a distinct and significant source of nitrous oxide from soil. Soil Biol. Biochem.43 (1), 174–178. doi: 10.1016/j.soilbio.2010.09.030
57
KozlowskiJ. A.StieglmeierM.SchleperC.KlotzM. G.SteinL. Y. (2016). Pathways and key intermediates required for obligate aerobic ammonia-dependent chemolithotrophy in bacteria and thaumarchaeota. ISME J.10 (8), 1836–1845. doi: 10.1038/ismej.2016.2
58
KraftB.JehmlichN.LarsenM.BristowL. A.KönnekeM.ThamdrupB.et al. (2022). Oxygen and nitrogen production by an ammonia-oxidizing archaeon. Science375 (6576), 97–100. doi: 10.1126/science.abe6733
59
Lazo-MurphyB. M.LarsonS.StainesS.BruckH.McHenryJ.BourbonnaisA.et al. (2022). Nitrous oxide production and isotopomer composition by fungi isolated from salt marsh sediments. Front. Mar. Sci.9, 2645. doi: 10.3389/fmars.2022.1098508
60
LehmannN.KienastM.GrangerJ.BourbonnaisA.AltabetM. A.TremblayJ.É. (2019). Remote western Arctic nutrients fuel remineralization in deep Baffin bay. Global Biogeochemical Cycles33 (6), 649–667. doi: 10.1029/2018GB006134
61
Lewicka-SzczebakD.AugustinJ.GiesemannA.WellR. (2017). Quantifying N2O reduction to N2 based on N2O isotopocules–validation with independent methods (helium incubation and 15N gas flux method). Biogeosciences14 (3), 711–732. doi: 10.5194/bg-14-711-2017
62
LöscherC. R.KockA.KönnekeM.LaRocheJ.BangeH. W.SchmitzR. A. (2012). Production of oceanic nitrous oxide by ammonia-oxidizing archaea. Biogeosciences9 (7), 2419–2429. doi: 10.5194/bg-9-2419-2012
63
MaedaK.SporA.Edel-HermannV.HeraudC.BreuilM. C.BizouardF.et al. (2015). N2O production, a widespread trait in fungi. Sci. Rep.5 (1), 9697. doi: 10.1038/srep09697
64
MagyarP. M. (2017). Insights into pathways of nitrous oxide generation from novel isotopologue measurements. Dissertation (Ph.D.), California Institute of Technology, 119 pp. doi: 10.7907/Z93776RJ
65
MariottiA.GermonJ. C.HubertP.KaiserP.LetolleR.TardieuxA.et al. (1981). Experimental determination of nitrogen kinetic isotope fractionation: some principles; illustration for the denitrification and nitrification processes. Plant Soil62 (3), 413–430. doi: 10.1007/BF02374138
66
MohnJ.WolfB.ToyodaS.LinC. T.LiangM. C.BrüggemannN.et al. (2014). Interlaboratory assessment of nitrous oxide isotopomer analysis by isotope ratio mass spectrometry and laser spectroscopy: current status and perspectives. Rapid Commun. Mass Spectrometry28 (18), 1995–2007. doi: 10.1002/rcm.6982
67
MonrealP. J.KellyC. L.TravisN. M.CasciottiK. L. (2022). Identifying the sources and drivers of nitrous oxide accumulation in the eddy-influenced Eastern tropical north pacific oxygen-deficient zone. Glob. Biogeochem. Cycles36 (6), e2022GB007310. doi: 10.1007/BF02374138
68
MuggeoV. M. (2003). Estimating regression models with unknown break‐points. Stat. Med.22(19), 3055–3071. doi: 10.1002/sim.1545
69
MuggeoV. M.MuggeoM. V. M. (2017). Package ‘segmented’. Biometrika58 (525-534), 516.
70
NevisonC.ButlerJ. H.ElkinsJ. W. (2003). Global distribution of N2O and the ΔN2O-AOU yield in the subsurface ocean. Global Biogeochemical Cycles17 (4). doi: 10.1029/2003GB002068
71
NevisonC.HollandE. (1997). A reexamination of the impact of anthropogenically fixed nitrogen on atmospheric N2O and the stratospheric O3 layer. J. Geophys. Res.: Atmospheres102 (D21), 25519–25536. doi: 10.1029/97JD02391
72
OstromN. E.OstromP. H. (2012). “The isotopomers of nitrous oxide: analytical considerations and application to resolution of microbial production pathways,” in Handbook of environmental isotope geochemistry (Berlin, Heidelberg: Springer), pp453–pp476. doi: 10.1029/2006JG000287
73
OstromN. E.PittA.SutkaR.OstromP. H.GrandyA. S.HuizingaK. M.et al. (2007). Isotopologue effects during N2O reduction in soils and in pure cultures of denitrifiers. J. Geophys. Res.: Biogeosciences112 (G2). doi: 10.1029/2006JG000287
74
PatakiD. E.EhleringerJ. R.FlanaganL. B.YakirD.BowlingD. R.StillC. J.et al. (2003). The application and interpretation of keeling plots in terrestrial carbon cycle research. Global Biogeochem. Cycles17 (1). doi: 10.1029/2001GB001850
75
PoppB. N.WestleyM. B.ToyodaS.MiwaT.DoreJ. E.YoshidaN.et al. (2002). Nitrogen and oxygen isotopomeric constraints on the origins and sea-to-air flux of N2O in the oligotrophic subtropical north pacific gyre. Global Biogeochemical Cycles16 (4), 12–11. doi: 10.1029/2001GB001806
76
RavishankaraA. R.DanielJ. S.PortmannR. W. (2009). Nitrous oxide (N2O): the dominant ozone-depleting substance emitted in the 21st century. Science326 (5949), 123–125. doi: 10.1126/science.1176985
77
RyabenkoE.KockA.BangeH. W.AltabetM. A.WallaceD. W. R. (2012). Contrasting biogeochemistry of nitrogen in the Atlantic and pacific oxygen minimum zones. Biogeosciences9, 203–215. doi: 10.5194/bg-9-203-2012
78
SantoroA. E.BuchwaldC.McIlvinM. R.CasciottiK. L. (2011). Isotopic signature of N2O produced by marine ammonia-oxidizing archaea. Science333 (6047), 1282–1285. doi: 10.1126/science.1208239
79
SantoroA. E.CasciottiK. L.FrancisC. A. (2010). Activity, abundance and diversity of nitrifying archaea and bacteria in the central California current. Environ. Microbiol.12 (7), 1989–2006. doi: 10.1111/j.1462-2920.2010.02205.x
80
SchmidtH. L.WernerR. A.YoshidaN.WellR. (2004). Is the isotopic composition of nitrous oxide an indicator for its origin from nitrification or denitrification? a theoretical approach from referred data and microbiological and enzyme kinetic aspects. Rapid Commun. Mass Spectrometry18 (18), 2036–2040. doi: 10.1002/rcm.1586
81
SigmanD. M.GrangerJ.DiFioreP. J.LehmannM. M.HoR.CaneG.et al. (2005). Coupled nitrogen and oxygen isotope measurements of nitrate along the eastern north pacific margin. Global Biogeochemical Cycles19 (4). doi: 10.1029/2005GB002458
82
SniderD. M.VenkiteswaranJ. J.SchiffS. L.SpoelstraJ. (2012). Deciphering the oxygen isotope composition of nitrous oxide produced by nitrification. Global Change Biol.18 (1), 356–370. doi: 10.1111/j.1365-2486.2011.02547.x
83
SonnerupR. E.MeckingS.BullisterJ. L.WarnerM. J. (2015). Transit time distributions and oxygen utilization rates from chlorofluorocarbons and sulfur hexafluoride in the southeast pacific ocean. J. Geophys. Res. Ocean.120, doi:10.1002/2015JC010781. doi: 10.1002/2015JC010781
84
StanleyR. H. R.DoneyS. C.JenkinsW. J.LottD. E. (2012). Apparent oxygen utilization rates calculated from tritium and helium-3 profiles at the Bermuda Atlantic time-series study site. Biogeosciences9 (6), 1969–1983. doi: 10.5194/bg-9-1969-2012
85
StieglmeierM.MooshammerM.KitzlerB.WanekW.Zechmeister-Boltenste. rnS.RichterA.et al. (2014). Aerobic nitrous oxide production through n-nitrosating hybrid formation in ammonia-oxidizing archaea. ISME J.8 (5), 1135–1146. doi: 10.1038/ismej.2013.220
86
StövenT.TanhuaT.HoppemaM.BullisterJ. L. (2015). Perspectives of transient tracer applications and limiting cases. Ocean Sci.11 (5), 699–718. doi: 10.5194/os-11-699-2015
87
StrammaL.BangeH. W.CzeschelR.LorenzoA.FrankM. (2013). On the role of mesoscale eddies for the biological productivity and biogeochemistry in the eastern tropical Pacific Ocean off Peru. Biogeosciences10 (11), 7293–7306. doi: 10.5194/bg-10-7293-2013
88
SutkaR. L.OstromN. E.OstromP. H.BreznakJ. A.GandhiH.PittA. J.et al. (2006). Distinguishing nitrous oxide production from nitrification and denitrification on the basis of isotopomer abundances. Appl. Environ. Microbiol.72 (1), 638–644. doi: 10.1128/AEM.72.1.638-644.2006
89
SutkaR. L.OstromN. E.OstromP. H.GandhiH.BreznakJ. A. (2003). Nitrogen isotopomer site preference of N2O produced by nitrosomonas europaea and methylococcus capsulatus bath. Rapid Commun. Mass Spectrometry17 (7), 738–745. doi: 10.1002/rcm.968
90
SutkaR. L.OstromN. E.OstromP. H.PhanikumarM. S. (2004). Stable nitrogen isotope dynamics of dissolved nitrate in a transect from the north pacific subtropical gyre to the Eastern tropical north pacific. Geochimica Cosmochimica Acta68 (3), 517–527. doi: 10.1016/S0016-7037(03)00483-6
91
TianH.XuR.CanadellJ. G.ThompsonR. L.WiniwarterW.SuntharalingamP.et al. (2020). A comprehensive quantification of global nitrous oxide sources and sinks. Nature586, 248–256. doi: 10.1038/s41586-020-2780-0
92
ToyodaS.MutobeH.YamagishiH.YoshidaN.TanjiY. (2005). Fractionation of N2O isotopomers during production by denitrifier. Soil Biol. Biochem.37 (8), 1535–1545. doi: 10.1016/j.soilbio.2005.01.009
93
ToyodaS.YoshidaN.MiwaT.MatsuiY.YamagishiH.TsunogaiU.et al. (2002). Production mechanism and global budget of N2O inferred from its isotopomers in the western north pacific. Geophys. Res. Lett.29 (3), 7–1. doi: 10.1029/2001GL014311
94
ToyodaS.YoshidaO.YamagishiH.FujiiA.YoshidaN.WatanabeS. (2019). Identifying the origin of nitrous oxide dissolved in deep ocean by concentration and isotopocule analyses. Sci. Rep.9 (1), 1–9. doi: 10.1038/s41598-019-44224-0
95
TrimmerM.ChronopoulouP. M.MaanojaS. T.Upstill-GoddardR. C.KitidisV.PurdyK. J. (2016). Nitrous oxide as a function of oxygen and archaeal gene abundance in the north pacific. Nat. Commun.7 (1), 1–10. doi: 10.1038/ncomms13451
96
WankelS. D.ZiebisW.BuchwaldC.CharoenpongC.de BeerD.DentingerJ.et al. (2017). Evidence for fungal and chemodenitrification based N2O flux from nitrogen impacted coastal sediments. Nat. Commun.8 (1), 1–11. doi: 10.1038/ncomms15595
97
WardB. B. (2008). “Nitrification in marine systems,” in Nitrogen in the marine environment. Eds. CaponeD. G.BronkD. A.MulhollandM. R.CarpenterE. J. (Elsevier, San Diego, California: Academic Press), pp199–pp261.
98
WaughD. W.HallT. M.HaineT. W. N. (2003). Relationships among tracer ages. J. Geophys. Research-Oceans108 (C5), 16. doi: 10.1029/2002jc001325
99
WeissR. F.PriceB. A. (1980). Nitrous oxide solubility in water and seawater. Mar. Chem.8 (4), 347–359. doi: 10.1016/0304-4203(80)90024-9
100
WestleyM. B.PoppB. N.RustT. M. (2007). The calibration of the intramolecular nitrogen isotope distribution in nitrous oxide measured by isotope ratio mass spectrometry. Rapid Commun. Mass Spectrometry21 (3), 391–405. doi: 10.1002/rcm.2828
101
WestleyM. B.YamagishiH.PoppB. N.YoshidaN. (2006). Nitrous oxide cycling in the black Sea inferred from stable isotope and isotopomer distributions. Deep Sea Res. Part II: Topical Stud. Oceanogr.53, 1802–1816. doi: 10.1016/j.dsr2.2006.03.012
102
WrageN.VelthofG. L.Van BeusichemM. L.OenemaO. (2001). Role of nitrifier denitrification in the production of nitrous oxide. Soil Biol. Biochem.33 (12-13), 1723–1732. doi: 10.1016/S0038-0717(01)00096-7
103
YamagishiH.WestleyM. B.PoppB. N.ToyodaS.YoshidaN.WatanabeS.et al. (2007). Role of nitrification and denitrification on the nitrous oxide cycle in the eastern tropical north pacific and gulf of California. J. Geophys. Res.: Biogeosciences112 (G2). doi: 10.1029/2006JG000227
104
YamagishiH.YoshidaN.ToyodaS.PoppB. N.WestleyM. B.WatanabeS. (2005). Contributions of denitrification and mixing on the distribution of nitrous oxide in the north pacific. Geophys. Res. Lett.32 (4). doi: 10.1029/2004GL021458
105
YangS.ChangB. X.WarnerM. J.WeberT. S.BourbonnaisA. M.SantoroA. E.et al. (2020). Global reconstruction reduces the uncertainty of oceanic nitrous oxide emissions and reveals a vigorous seasonal cycle. Proc. Natl. Acad. Sci.117 (22), 11954–11960. doi: 10.1073/pnas.1921914117
106
YoshidaN.MorimotoH.HiranoM.KoikeI.MatsuoS.WadaE.et al. (1989). Nitrification rates and 15N abundances of N2O and NO3- in the western north pacific. Nature342 (6252), 895–897.
107
YoshinariT.KnowlesR. (1976). Acetylene inhibition of nitrous oxide reduction by denitrifying bacteria. Biochem. Biophys. Res. Commun.69 (3), 705–710. doi: 10.1016/0006-291X(76)90932-3
Summary
Keywords
nitrous oxide, greenhouse gas, stable isotopes, isotopomers, oxygen deficient zones, eastern South Pacific Ocean, eastern North Pacific Ocean, Southern Ocean
Citation
Bourbonnais A, Chang BX, Sonnerup RE, Doney SC and Altabet MA (2023) Marine N2O cycling from high spatial resolution concentration, stable isotopic and isotopomer measurements along a meridional transect in the eastern Pacific Ocean. Front. Mar. Sci. 10:1137064. doi: 10.3389/fmars.2023.1137064
Received
03 January 2023
Accepted
31 March 2023
Published
12 May 2023
Volume
10 - 2023
Edited by
Sanjeev Kumar, Physical Research Laboratory, India
Reviewed by
Damian L. Arévalo-Martínez, Radboud University, Netherlands; Sohiko Kameyama, Hokkaido University, Japan
Updates
Copyright
© 2023 Bourbonnais, Chang, Sonnerup, Doney and Altabet.
This is an open-access article distributed under the terms of the Creative Commons Attribution License (CC BY). The use, distribution or reproduction in other forums is permitted, provided the original author(s) and the copyright owner(s) are credited and that the original publication in this journal is cited, in accordance with accepted academic practice. No use, distribution or reproduction is permitted which does not comply with these terms.
*Correspondence: Annie Bourbonnais, abourbonnais@seoe.sc.edu
This article was submitted to Marine Biogeochemistry, a section of the journal Frontiers in Marine Science
Disclaimer
All claims expressed in this article are solely those of the authors and do not necessarily represent those of their affiliated organizations, or those of the publisher, the editors and the reviewers. Any product that may be evaluated in this article or claim that may be made by its manufacturer is not guaranteed or endorsed by the publisher.