 Lazic Tamara1,2†
 Bruno Fosso1*†
 Balech Bachir3
 Corriero Giuseppe1
 Gristina Michele4
 Marzano Marinella3
 Pesole Graziano1,3,5
 Santamaria Monica6
 Cataldo Pierri1
- 1Department of Biosciences, Biotechnologies and Environment, University of Bari, Bari, Italy
- 2IUCN SSC Seahorse, Pipefish and Seadragon Specialist Group
- 3National Research Council (CNR), Institute of Biomembrane, Bioenergetics and Molecular Biotechnology (IBIOM), Bari, Italy
- 4National Research Council (CNR), Institute of Anthropic Impacts and Sustainability in Marine Environment (IAS), Palermo, Italy
- 5Consorzio Interuniversitario Biotecnologie, Trieste, Italy
- 6Department of Soil, Plant and Food Science, University of Bari, Bari, Italy
Seahorses are small sedentary fish considered flagship species of the conservation efforts. They are particularly vulnerable to human pressures because inhabiting threatened coastal ecosystems. Indeed, the worldwide decline of local populations in the last decades led to the inclusion of all seahorse species on the IUCN Red List, where most species, including Hippocampus guttulatus, were classified as ‘‘Data Deficient’’ on a global level due to the lack of relative data on several biological and ecological traits. Because of such sensitive conservation status, improvement of the current knowledge on the diet composition of wild animals and its differences among habitats could be of great importance as it could help understanding the way the environment is exploited. In the present study, we used a non-invasive DNA metabarcoding technique to further elucidate long-snouted seahorse diet and expand our understanding of prey choice among different habitats. We identified 24 families, 22 genera and 26 species, and according to the results, most of the seahorse samples contained taxa such as Amphipoda, Decapoda, Isopoda, and Mysida. Several non-native species were discovered in the diet, suggesting their dietary incorporation that could mirror high anthropogenic impacts and habitat modifications. We found significant differences in the diet composition among investigated habitats, thus indicating trophic flexibility of H. guttulatus among diverse habitats, a characteristic that may be essential for the resilience of this iconic yet sensitive species.
1 Introduction
Effective biodiversity conservation depends on a good understanding of the relationships between species or populations and their environment (Bremner, 2008; Díaz-Abad et al., 2022). Identifying dietary items is necessary to acknowledge prey preference and availability in a given habitat but also to account for trophic interactions when designing species protection (Hamann et al., 2010; Díaz-Abad et al., 2022). Indeed, food is considered the most fundamental resource for the species’ survival (Wang et al., 2022) as it directly influences critical traits such as body condition (Rothman et al., 2012) and reproduction (Cameron, 1996). Distribution and abundance of prey items, however, can strongly depend on environmental conditions, so predator species may be forced to modify their diets in case of eventual disturbances and/or other external pressures (Gainsbury and Meiri, 2017; Gül and Griffen, 2020). In species conservation management, understanding dietary preferences is crucial for both identifying resource requirements and predator population dynamics (Ward et al., 2012; Shao et al., 2021).
Worldwide, pressures on marine ecosystems have caused extensive modifications and/or degradation of coastal habitats (Hughes et al., 2017; Thibaut et al., 2017). Seahorses (Hippocampus spp.) mostly occur in threatened coastal ecosystems (Hernandez-Urcera et al., 2021; Pierri et al., 2022) and are, therefore, particularly vulnerable (IUCN, 2022). They are sedentary species whose low mobility make them sensitive to fluctuations of feeding resources at local scale as they are not able to swim over long distances in search of food (Foster and Vincent, 2004). Many studies indicated that seahorse populations declined in the past decades, and although exact causes remain unknown, habitat modifications/degradation and illegal fisheries seem main responsible (Correia et al., 2015; Pierri et al., 2021). Therefore, all seahorse species were included on the International Union for Conservation of Nature (IUCN) Red List of Threatened Species (IUCN, 2022) where many species, including the long-snouted seahorse Hippocampus guttulatus, were classified as ‘‘Data Deficient’’ on a global level (Pollom, 2017) due to the lack of information on distribution (Pierri et al., 2022), population trends (IUCN, 2022) and biodiversity-related data (Heard et al., 2019).
Seahorse distribution seems directly influenced by prey availability (Curtis and Vincent, 2006; Gristina et al., 2015; Ape et al., 2019). These fish are ambush predators that usually rely on their vision to capture prey (Kuiter, 2000). In uncovered areas, they practice a “sit-and-wait” predation strategy (Tipton and Bell, 1988; James and Heck, 1994) and rarely swim in search of food (Kendrick and Hyndes, 2005; Felício et al., 2006). Diet and foraging strategies are well documented in many scientific studies showing that seahorses principally consume epibenthic invertebrates (e.g., harpacticoid copepods, amphipods, nematodes, polychaetes), thus reflecting not only their sedentary behavior but also habitat-specific biodiversity (Kendrick and Hyndes, 2005; Castro et al., 2008; Kitsos et al., 2008; Yip et al., 2015; Ape et al., 2019). Up to date, most studies on seahorse diet employed morphological examination of gut or stomach contents, through stomach flushing or by biochemical means (e.g., Kitsos et al., 2008; Gurkan et al., 2011; Valladares et al., 2017; Ape et al., 2019; Valladares and Planas, 2021). The next-generation sequencing (NGS) technologies, combined with the expansion of DNA barcode databases (Hebert et al., 2003), has recently allowed to perform diet analysis in many fish species (e.g., Taguchi et al., 2014), including seahorses (Lazic et al., 2021; Kim et al., 2022). The analysis of the DNA barcode sequences of consumed items from fecal material indicated that DNA metabarcoding is an effective tool for studying seahorse diets (Lazic et al., 2021). Indeed, these powerful and non-invasive methods can provide accurate dietary profiles for many individuals and result in extended knowledge of foraging ecology.
In this study, we analyzed fecal samples of H. guttulatus from four preferential habitats in Mar Piccolo of Taranto (for this area; see Gristina et al., 2015; Gristina et al., 2017) where seahorses have recently faced a severe population decline of approximately 90% (Gristina et al., 2015; Pierri et al., 2021). We aimed at widening the knowledge of the diet of wild long-snouted seahorses by using broad-coverage metazoan DNA metabarcoding primers and investigating whether diet composition changes among different habitats. The applied protocol has been recently developed in laboratory conditions (Lazic et al., 2021) and here has been applied to wild populations. In this context, the study of the dietary composition across different habitats while using non-invasive technique could offer an important tool to help plan conservation actions that aim at reversing negative population trends.
2 Materials and methods
2.1 Study area
Mar Piccolo of Taranto is located at the northern end of the Gulf of Taranto, with a total surface area of approximately 20.63 km2 (Figure 1). Surrounded by urban development, heavy industries and civil and military shipyards, the water body of Mar Piccolo is affected by heavy metals, hydrocarbons, pesticides, and organic waste (Cardellicchio et al., 2007; Petronio et al., 2012). Across the entire basin, natural rocky substrates are reduced, while the seafloor is dominated by soft sediments that vary from mud to mixed sands. They are sparsely covered by patches of Cymodocea nodosa, scattered tufts of brown algae (Cystoseira spp.) and large algal beds of Cladophora prolifera (Cecere and Petrocelli, 2009). Hard substrates, mainly of anthropogenic origin (wood poles of mussel farms, stone walls along the coastline, rocks, ropes, and discarded material), support an algal turf principally constituted of perennial Cystoseira spp. and other frondose algae (i.e., Corallina elongata, Dictyopteris spp.) (for further description see Gristina et al., 2015; Gristina et al., 2017).
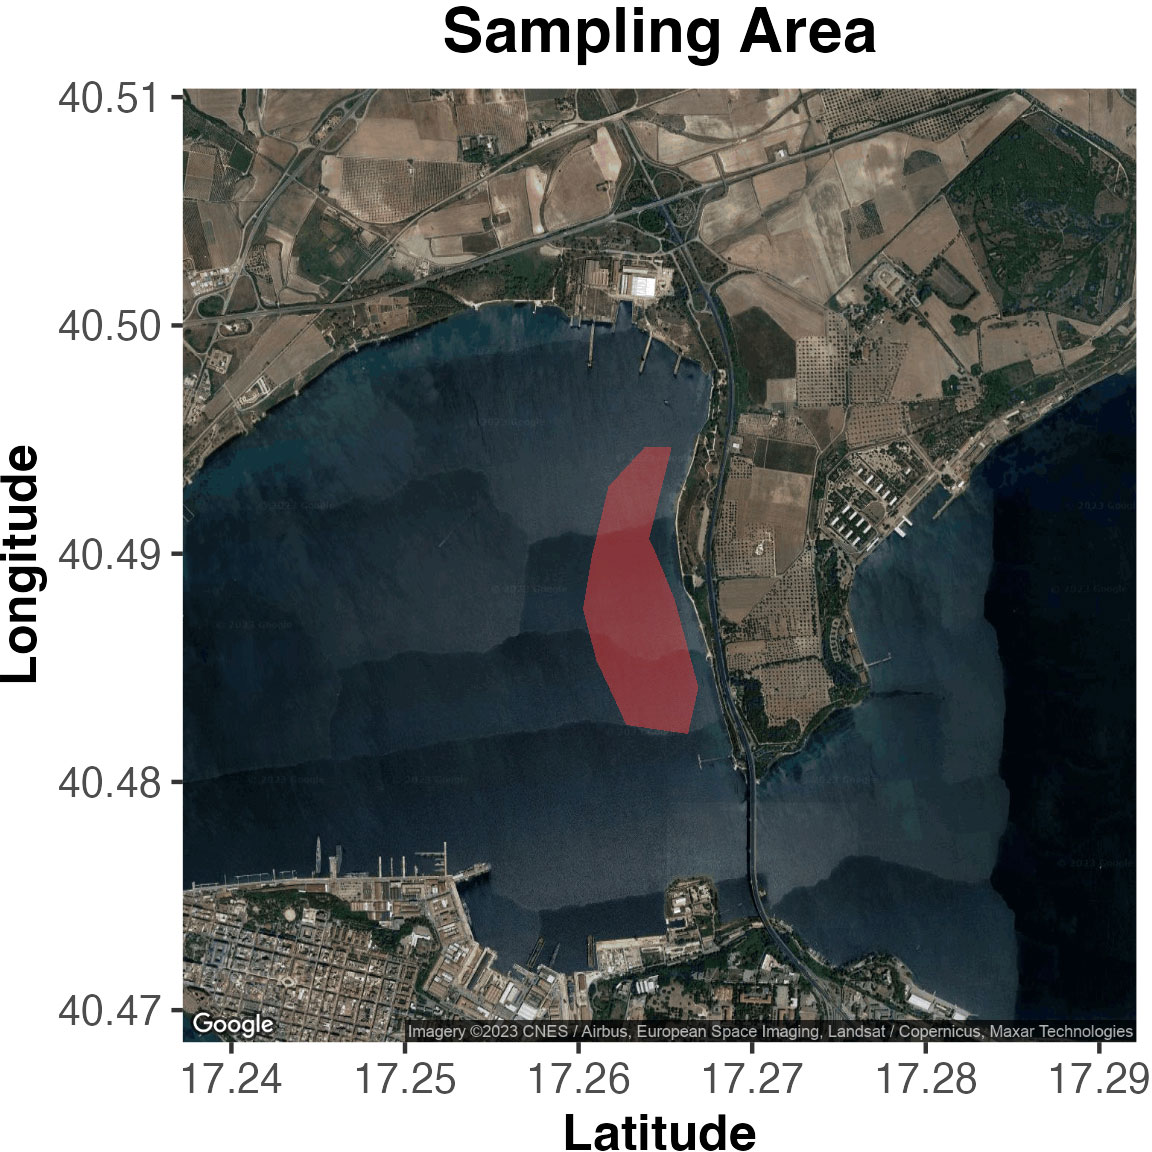
Figure 1 Map of the sampling area in the Mar Piccolo of Taranto.
2.2 Sample collection
Forty non-reproductive adult long-snouted seahorses were captured by diving at Mar Piccolo of Taranto. Although at least six different habitats were described at this site (Gristina et al., 2017), this study focused on the four most extensive habitats: (1) Cladophora prolifera (onwards C. prolifera) at 6 m of depth (n=10), (2) vertical stone wall (onwards stone wall) with abundant algae (C. elongata, Cystoseira sp. and Dictyota dichotoma) and filter feeders (sabellids, ascidians, demosponges) at 0.3 – 0.6 m of depth (n=10), (3) unvegetated sandy bottom (onwards sandy bottom) mixed with organogenous concretions (bivalve and gastropod shells) and small stones at 1.6 – 2.2 m of depth (n=10), and (4) poles of mussel farms (onwards poles) colonized by rich sessile filter-feeder fauna (bivalves, demosponges, sabellids, bryozoans and ascidians) at 3.3 – 4.2 m of depth (n=10) (for further description of habitats see Gristina et al., 2015; Gristina et al., 2017). Captured seahorses were individually placed in small aerated 2L tanks filled with surrounding seawater. Each tank was then filtered through 0.2 μm pore-size polycarbonate filters. Produced fecal samples (total n=33; C. prolifera=9, stone wall=9, sandy bottom=9, poles=6) were collected by syphoning, preserved in 96% ethanol, and stored at −20°C for further examination. All animals were immediately released to the original capture site in perfect health conditions. To exclude host contamination, H. guttulatus Cox1 amplicon sequence, produced during the previous research (Lazic et al., 2021) and available on GenBank (OQ291591), was used in subsequent analysis.
2.3 DNA extraction
For each sample, 50 mg of feces were selected and then used for the total genomic DNA extraction by using FastDNA SPIN kit for soil (BIO 101, Carlsbad, Canada) following the manufacturer’s instructions. Cell lysis was achieved by bead beating in FastPrep Instrument (BIO 101) at speed 6 for 40 s. Qualitative and quantitative DNA assessment was carried out using PicoGreen®dsDNA quantitation assay (Invitrogen, Carlsbad, California) and agarose gel (1%) electrophoresis. DNA extraction blanks (sterile distilled water) were prepared and processed together with the samples to exclude contamination related to the extraction reagents and procedure. DNA extracts were stored at −20°C before amplification by PCR.
2.4 Cox1 library preparation and sequencing
Amplicon libraries were prepared from 0.5 ng of extracted DNA. The adopted strategy is described in detail by Manzari et al. (2015). The primer pair used for amplification of the mitochondrial Cytochrome oxidase subunit 1 (Cox1) gene was mlCOIintF_NextFor and dgHCO2198_NextRev (Next_For: 5′-TCGTCGGCAGCGTCAGATGTGTATAAGAGACAG-3′, and Next_Rev: 5′GTCTCGTGGGCTCGGAGATGTGTATAAGAGACAG-3′) (Leray et al., 2013), designed to contain (from 5′ to 3′ ends) transposon Nextera sequences (Nextera DNA sample preparation guide, Illumina). RNase/Dnase-free Molecular Biology Grade water (Ambion) was used as a negative control of PCR amplification. Equimolar quantities of the purified amplicons were pooled and subjected to 2×250 bp paired-end sequencing on the Illumina MiSeq platform. To increase the genetic diversity of the sequenced samples, as required by the MiSeq platform, a phage PhiX genomic DNA library was added to the mix and co-sequenced (Kozich et al., 2013).
2.5 Taxonomic characterization of seahorses’ preys
The quality of raw Cox1 sequence data was checked using FastQC (available at: http://www.bioinformatics.babraham.ac.uk/projects/fastqc/) and multiQC (Ewels et al., 2016). Illumina adapters and PCR primers were removed from raw reads using cutadapt (Martin, 2011). Retained paired-end (PE) reads were denoised into ASVs (Amplicon Sequence Variants) (Callahan et al., 2017) by applying DADA2 (version 1.18) (Callahan et al., 2016). ASVs were taxonomically annotated using a modified version of BioMaS (Bioinformatic analysis of Metagenomic amplicons) (Fosso et al., 2015) working on MetaCOXI (Balech et al., 2022) and MIDORI (Leray et al., 2018) as reference databases. Dynamic sequence similarity threshold was adopted to improve the ASVs classification accuracy (species at 97%, genus at 95%, family at 93%, class at 91%, order at 88%, and phylum at 78%) as in Lotus pipeline (Hildebrand et al., 2014). Unassigned ASVs were additionally aligned against nt and nr collections using the blastn (Mount, 2007) and diamond blastx (Buchfink et al., 2015) tools, respectively. All ASV sequences partially mapped on different reference sequences were labelled as chimeric and removed from subsequent analysis. Retained sequences were taxonomically annotated using TANGO (Alonso-Alemany et al., 2014; Fosso et al., 2018) at the same similarity percentage thresholds described above. Contaminant ASVs were identified using decontam (Davis et al., 2018); alignment against the human genome (Pruesse et al., 2007) allowed the removal of additional noise sources.
R packages phyloseq (1.26.1) (McMurdie and Holmes, 2013) and vegan (2.5.6) (Oksanen, 2022) were used to measure alpha and beta diversity. For this purpose, ASVs counts were normalized by rarefaction (depth values settled to 45,000). Shannon and inversed Simpson indexes were used as measures of alpha diversity (i.e., intra-sample diversity), while Bray–Curtis dissimilarity matrix was used to measure beta diversity (i.e., inter-sample diversity). The Nonmetric Multidimensional Scaling (NMDS) was applied to beta-diversity matrix to obtain graphical representations of the observed dissimilarities. Statistical differences in alpha diversity indexes were measured by Wilcoxon (W) test. PERMANOVA (Permutational Multivariate analysis of variance) was performed to infer the contribution of explanatory variables in beta diversity data partitioning by applying 999 permutations. The contribution of individual species to the overall Bray–Curtis dissimilarity was achieved by SIMPER analysis with 999 permutations. The functions metaNDS, adonis and simper of the Vegan package (Oksanen, 2022) were used to perform NMDS, PERMANOVA and SIMPER analysis, respectively.
3 Results
3.1 Overall sequencing results
Libraries of dual indexed amplicons of 420 bp were successfully sequenced on the MiSeq platform using 2 × 250 bp paired end (PE) sequencing strategy. Overall, approximately 8 million PE reads (mean 242,645 ± 54,990 SD) were generated across all samples. After trimming, merging and denoising procedures, approximately 87% of the produced PE reads were retained, resulting in a total of 683 ASVs. According to the ecological metrics, data were normalized by rarefaction to 45,000 sequences. Nine samples were discarded as they contained less sequences than the imposed rarefaction depth and were dominated by H. guttulatus Cox1 gene sequences.
3.2 Seahorse diet
Shannon index values (Figure 2) indicated statistically significant differences among stone wall and C. prolifera and stone wall and sandy bottom samples (p-value ≤ 0.05). Stone wall samples were characterized by the highest alpha-diversity values compared to other sampling sites (stone wall: 2.13 ± 0.93, C. prolifera: 0.80 ± 0.41, sandy bottom: 0.88 ± 0.63, poles: 0.76 ± 0.78). Simpson Index (Supplementary Figure 1) indicated a similar trend and revealed statistically relevant differences (p-value ≤ 0.05) between stone wall and C. prolifera samples (stone wall: 0.74 ± 0.17, C. prolifera: 0.42 ± 0.21, sandy bottom: 0.37 ± 0.24, poles: 0.34 ± 0.34).
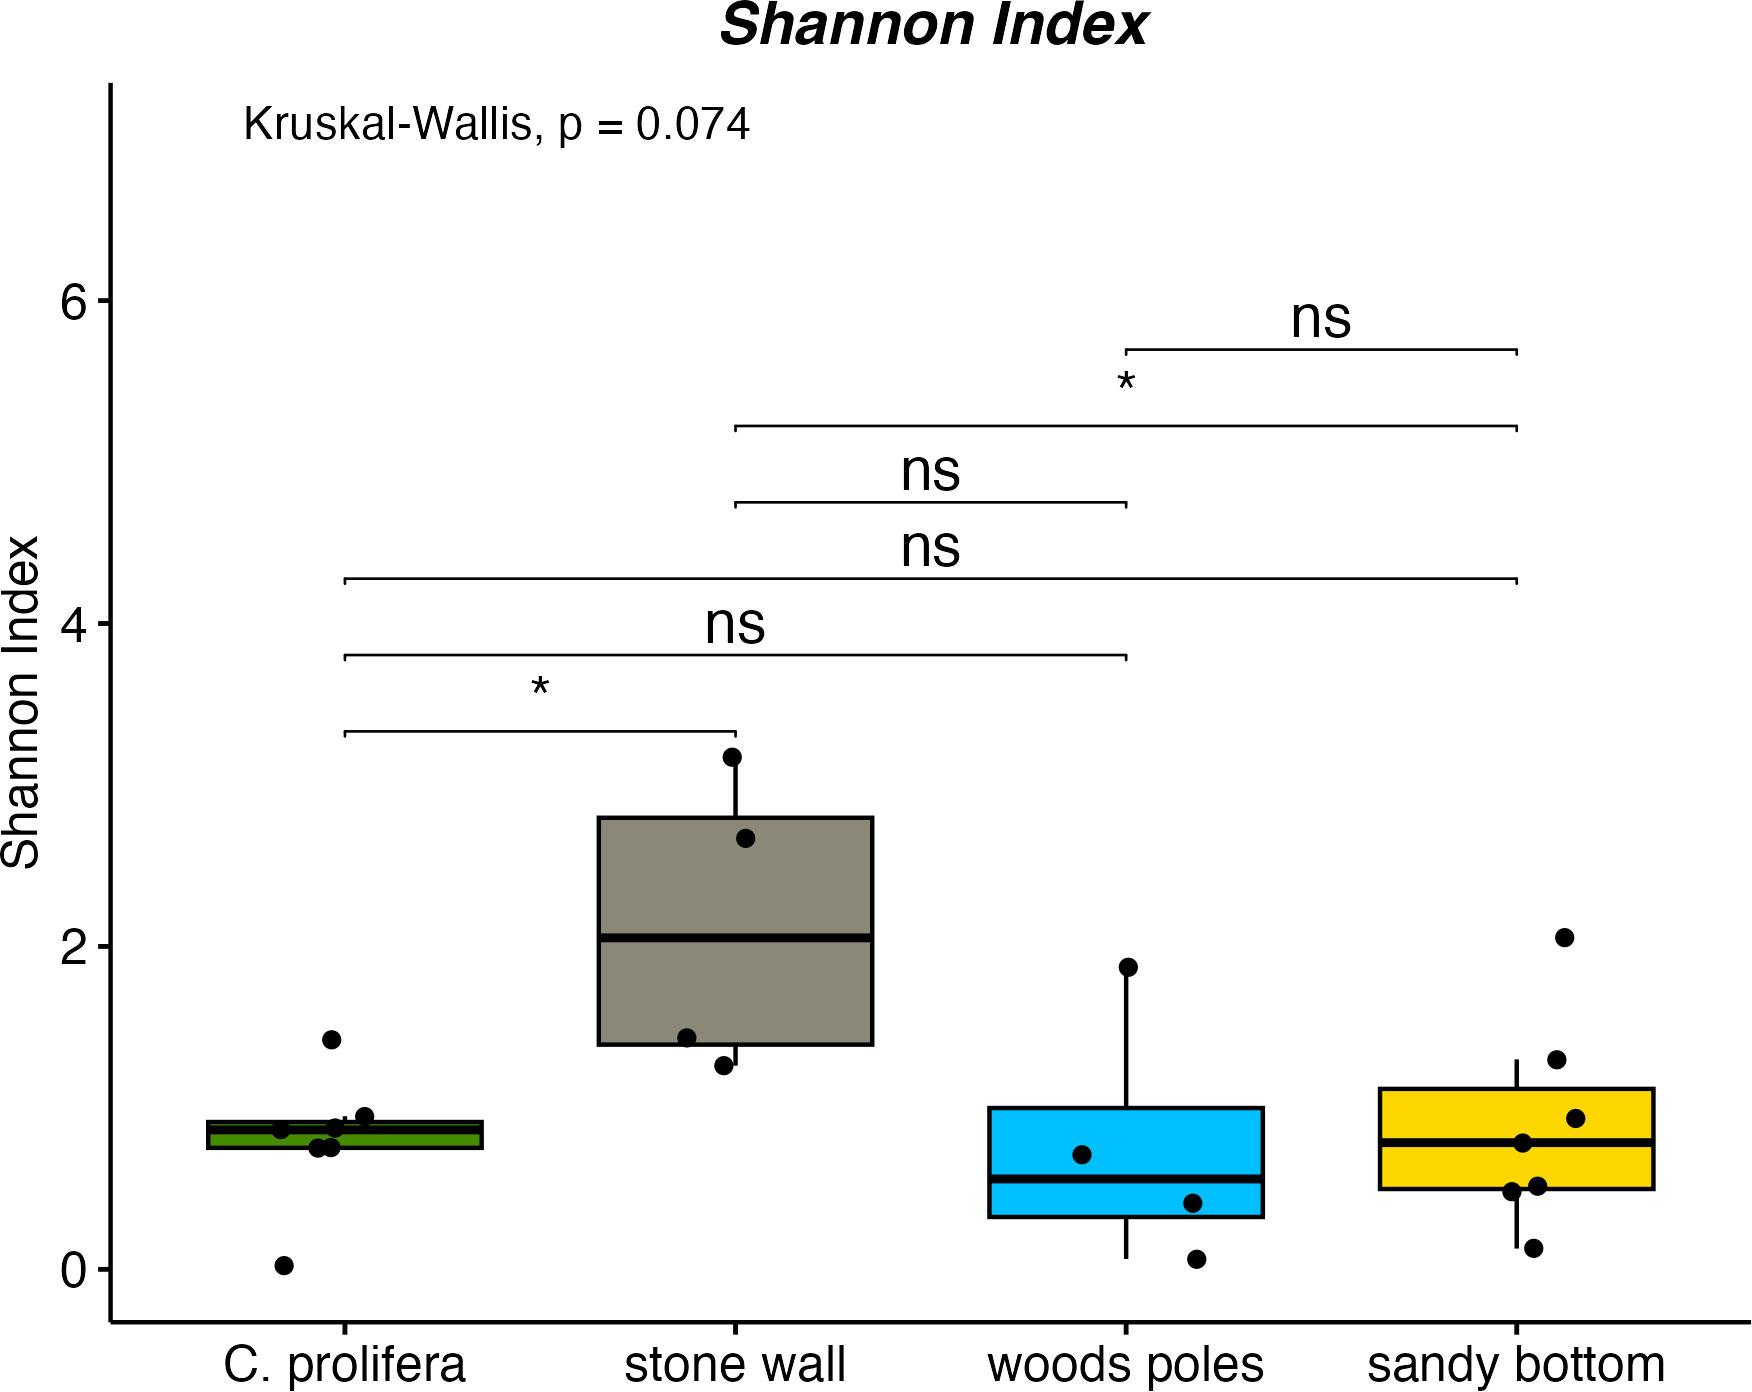
Figure 2 Shannon index for investigated habitats. * means "p-value ≤ 0.05" and "ns" means not significant.
Beta diversity values (Figure 3), measured using Bray-Curtis dissimilarity metrics and plotted using nMDS (non-metric Multi-Dimensional Scaling), indicated no clear separation of samples among different habitats. However, PERMANOVA (Table 1) highlighted that approximately 21% of data variability is associated with the sampling site.
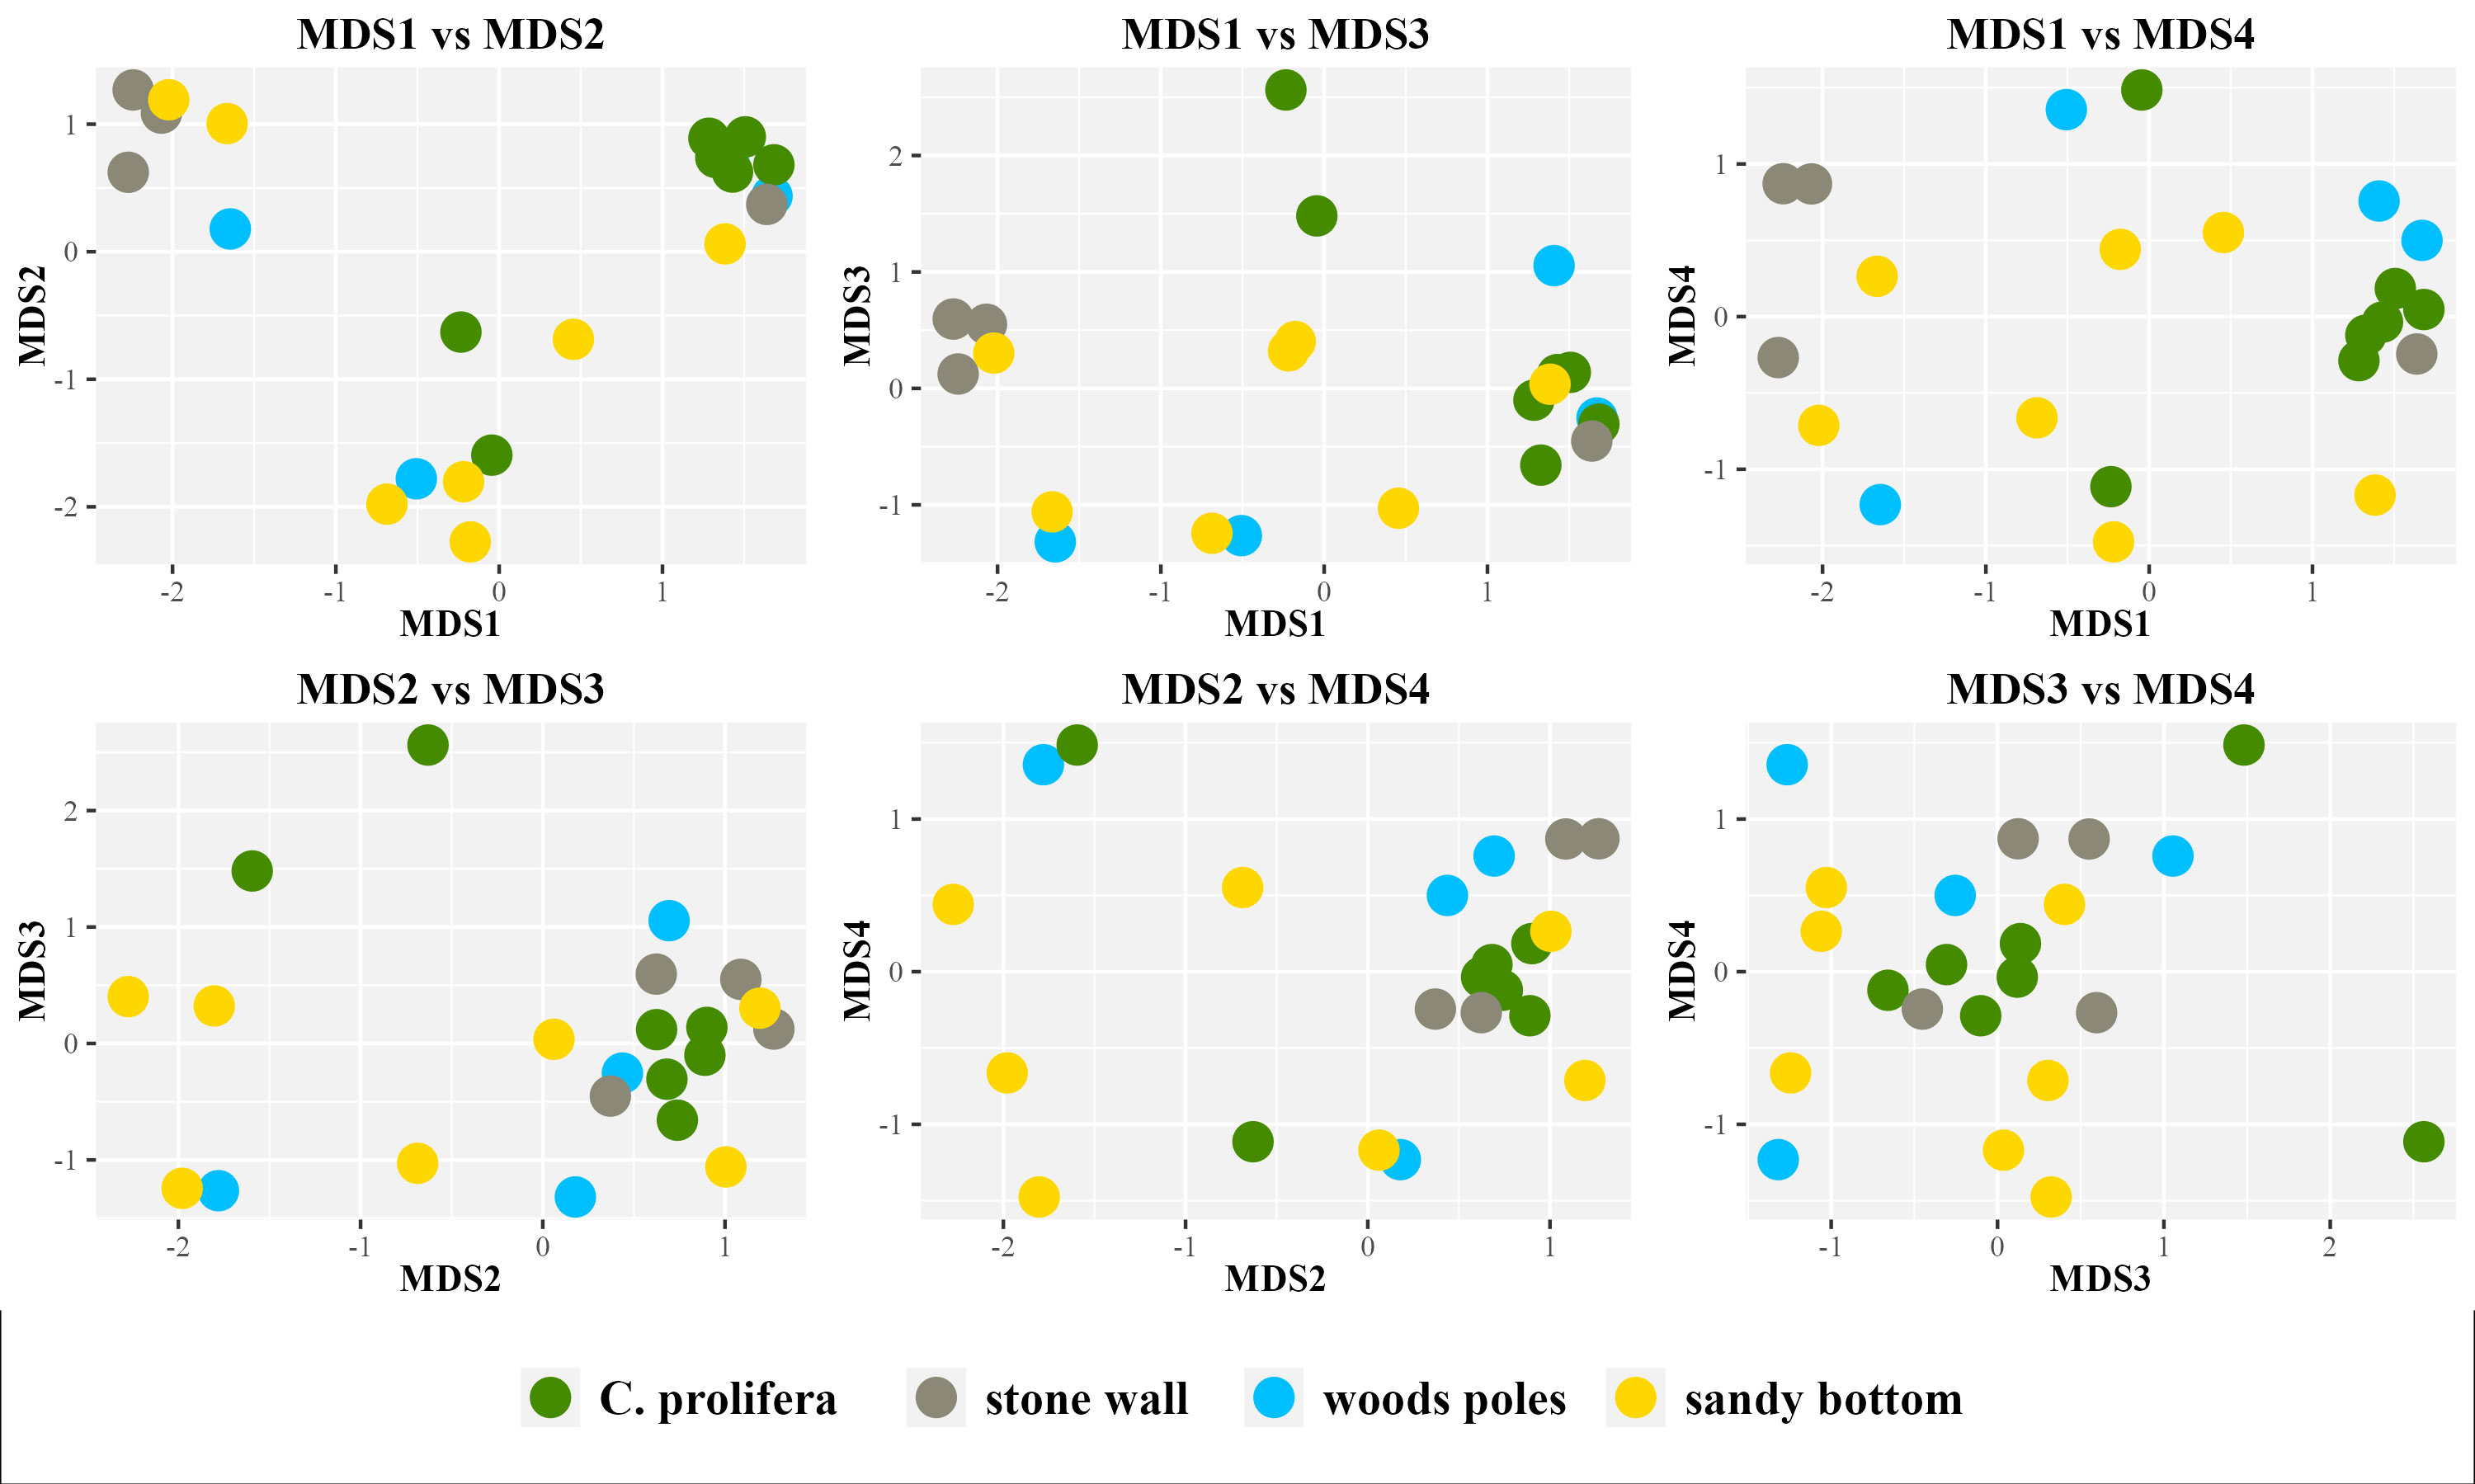
Figure 3 nMDS plot based on the Bray-Curtis dissimilarity matrix. Stress=0.09. nMDS was inferred using four dimensions and up to 100 iterations. All possible combinations of inferred MDS are shown.

Table 1 PERMANOVA results.
In accordance with alpha diversity indices, SIMPER analysis (Table 2) identified stone wall ASVs contributing the most to the differences between groups. Nonetheless, the highest amount of explained between-group diversity was observed in the comparison in which sandy bottom samples were involved. These results could be probably explained by a large intra-group variability as observed in alpha (Figure 2; Supplementary Figure 1) and beta (Figure 3) diversity plots.
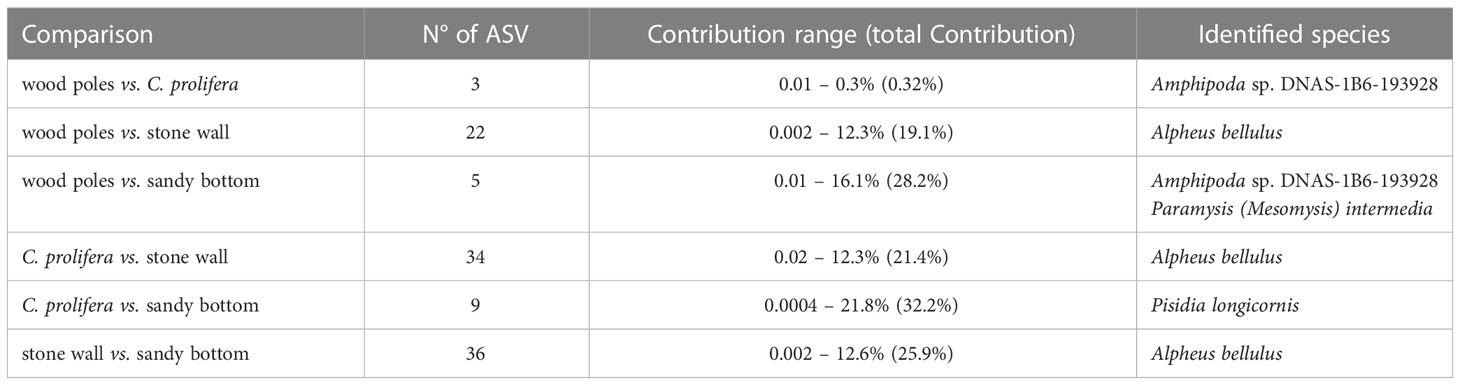
Table 2 Results of SIMPER analysis: the number of ASVs significantly (p-values ≤ 0.05) contributing to between group diversity, contribution (portion of the diversity) range and identified species.
In terms of taxa, we identified 24 families, 22 genera and 26 species. At level of classes, Malacostraca, Gastropoda, and Polychaeta were the most observed (Table 3), and were represented by nine orders (Amphipoda, Isopoda, Decapoda, Mysida, Trochida, Phyllodocida, Sabellida, Terebellida, and Eunicida). Although with low abundances, several other classes were also detected, including Insecta, Gymnolaemata, Demospongiae and Ascidacea. Malacostracan crustaceans were the predominant food item for all habitats and had relatively high abundances (range 1 – 99,98%). There were differences in specific taxa identified among different habitats (Table 3), but also some overlap. For instance, genus Munna was present in samples from stone wall, C. prolifera and wood poles, but was absent on sandy bottom. Furthermore, the most consumed diet item differed among habitats; in samples of wood poles, for instance, the most abundant genera were Paramysis (Arthropoda, 16.05% ± 39.31% in one out of six samples) and Athanas (Arthropoda, 11.41% ± 27.96, %, in one sample), in samples from C. prolifera, the most observed was Munna (Arthropoda, 11.56% ± 33.09%, in five samples out of nine), while on sandy bottom, the most abundant were Caprella (Arthropoda, 10.88% ± 32.61%, in three samples out of nine) and Paramysis (Arthropoda, 10.30% ± 30.85%, in four samples). The same principle was also observed at the species level, where the most consumed prey differed among habitats. Indeed, on wood poles, the samples presented high content of Amphipoda sp. (Arthropoda, 22.27% ± 27.96%, in three out of six samples) and Paramysis (Mesomysis) intermedia (16.05% ± 39.31%, in one sample); in C. prolifera, the most abundant was Munna japonica (11.56% ± 33.09%, in five out of nine samples); on stone wall, Steromphala adansonii (Mollusca, 4.73% ± 12.75%, in five samples) and; on sandy bottom, the most consumed was P. (M.) intermedia (10.30% ± 30.85%, in four samples). The abundance of unassigned sequences at the species level ranged between 0.11% and 100%.
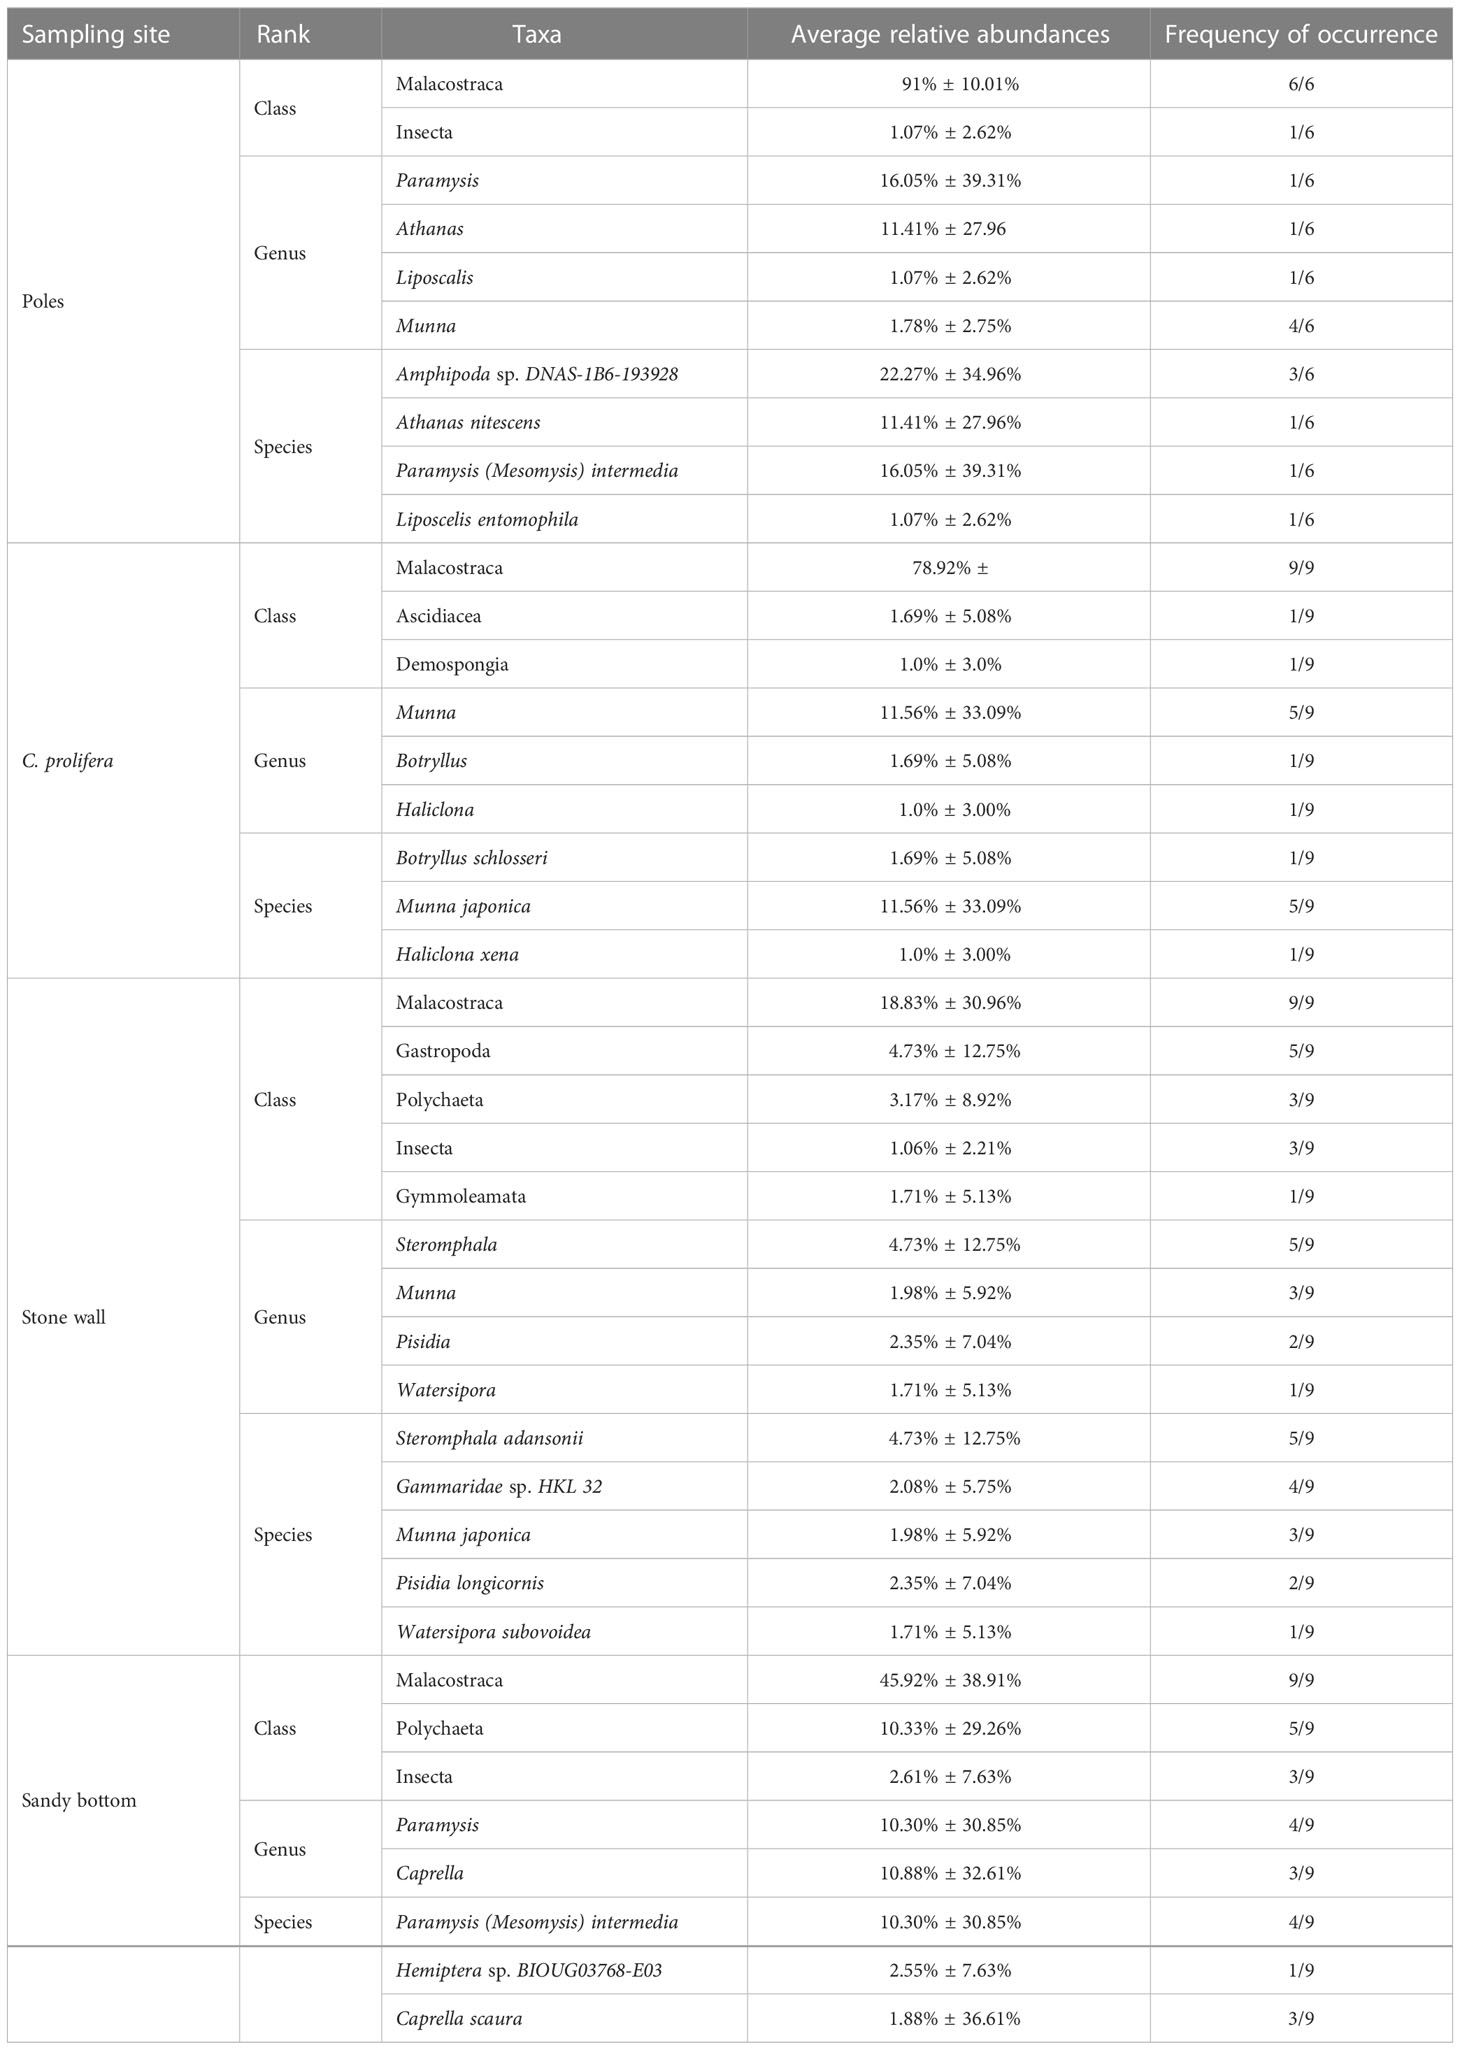
Table 3 The most abundant (relative abundance ≥ 1%) classes, genera, and species for each sampling site.
4 Discussion
This study used DNA metabarcoding of feces to investigate the diet of long-snouted seahorses in several most extensive habitats at Mar Piccolo of Taranto and indicated that this technique is suitable for dietary assessment of wild seahorses, following previous laboratory findings (Lazic et al., 2021). Compared to other diet studies (Kitsos et al., 2008; Gurkan et al., 2011; Ape et al., 2019) using morphological analysis of undigested food remains, our study reached a more extensive taxonomic characterization, especially for small-sized and soft-bodied prey. Among all habitats, seahorses mainly preyed on crustaceans, followed by polychaetes and gastropods. Our results expand the existing knowledge on seahorse diet and elucidate differences in dietary composition among different habitats, detecting prey types previously missed by visual methods, all of which were plausible due to records from the same study site (Ape et al., 2019; Pierri pers. comment). Indeed, the analysis revealed several species that have, to our knowledge, not been identified before as seahorse preys, namely Caprella scaura (Amphipoda, Arthropoda), Paramysis (Mesomysis) intermedia (Mysida, Arthropoda) and Steromphala adansonii (Gastropoda, Mollusca).
Most of the samples contained crustacean taxa such as Amphipoda, Isopoda, Decapoda and Mysida; in three out of four investigated habitats, seahorses frequently fed on Munna japonica (Isopoda, Arthropoda). Such finding is interesting as this species seems non-native to the Mediterranean Sea (Lazic et al., 2021). Several other non-native species were also detected in the diet, including C. scaura and Alpheus bellulus (Decapoda, Arthropoda). H. guttulatus had ingested other invertebrates as well, including gastropods, among which species S. adansonii resulted frequently selected on sandy bottom and stone wall. Several insect, sponge and ascidians were also found in the stomach contents, but hardly any of the identified ones served as food. Such taxa could have been the result of secondary predation or were eaten passively with effective prey items (Kim et al., 2022), in accordance with previous studies highlighting reliability of DNA-based methods for detecting indirect predation (e.g., Sheppard et al., 2005). Seahorses usually ingest their prey via a strong suction action down their tubular snout (Bergert and Wainwright, 1997; Woods, 2002). Indeed, the presence of this unlikely prey items was not a common occurrence, and their ingestion could also have occurred accidentally during ingestion of effective prey since small crustaceans frequently live and hide in sessile benthic organisms such as sponges. It is not possible to reliably distinguish between primary, secondary, or accidentally ingested prey items using DNA or visual analyses of gut contents, however, inferences can be made based on the overall composition of the gut contents, which for seahorses are usually dominated by a mix of crustacean species (Woods, 2002; Castro et al., 2008; Storero and González, 2008; Gurkan et al., 2011; Valladares et al., 2017; Manning et al., 2019). The likely secondary and/or accidental prey items may be useful in providing some insights of the food webs and habitats that the primary prey species rely on. Among these unlikely prey items, we also identified non-native species, such as Haliclystus tenuis (Staurozoa, Cnidaria) (Holst and Laakmann, 2019), thus pointing out that the gained data could also help at evaluating ecosystem structure and health.
The general pattern that H. guttulatus eats different prey items among different habitats has also been found in another study at the same site which indicated stone wall habitats as the most diversified in terms of species biodiversity probably due to complexity of algal turfs (Ape et al., 2019). Seahorses are showing trophic flexibility and can modify their foraging strategy depending on the habitat complexity (James and Heck, 1994; Felício et al., 2006; Ape et al., 2019) by catching the prey that is more accessible in a specific habitat (Ape et al., 2019) and that can fit into their mouth (Wilson and Vincent, 1998). The studies of Ryer (1988) and Franzoi et al. (1993) on species of the genus Syngnathus indicated that the availability of prey species influences the consumption rates and contribution to the diet (Oliveira et al., 2007). In this regard, frequent consumption of several prey items may indicate their higher availability at Mar Piccolo of Taranto rather than seahorse dietary preference. In addition to crustaceans, gastropod S. adansonii seems to be important in the diet of seahorses. Although adults of this species are relatively large, and it is possible that seahorses preyed on its larvae, there are indications that seahorses can extract large-sized prey from its shell and suck it while integer (Ape et al., 2019). Indeed, many fish species select larger prey items as more energy can be obtained by this choice (Gerking, 1994).
Notably, the present results were more accurate and consistent in terms of identified species than observed in previous studies on the diet of the long-snouted seahorses (Kitsos et al., 2008; Gurkan et al., 2011; Ape et al., 2019; Valladares and Planas, 2021). Indeed, many prey taxa discovered in this study were identified at the species level, while previous work (Ape et al., 2019) at Taranto Mar Piccolo only provided identification at the order or family level. Although this method could be useful in detecting species that would be otherwise difficult to observe, identification of prey DNA in fecal samples, however, depend on many factors, including differential digestion of soft-bodied and hard-bodied prey, variable gut transition times for different prey components and prey types (Nielsen et al., 2018), and choice of target sequences (Weber and Lundgren, 2009). Furthermore, this approach is strongly limited by the reference databases, whose level of completeness represents one of the most critical issues in DNA-based species diversity analyses. We used several databases available, but the capacity to identify diet items could still be improved by creating representative, possibly local, databases at least at the family level to limit misidentifications or unassigned sequences (Santos and Branco, 2011). Furthermore, the diet results presented in this study provide a single snapshot of what the animals had eaten in recent feeding events and although seahorses have limited swimming abilities (Curtis and Vincent, 2006; Caldwell and Vincent, 2013; Pierri et al., 2020), it could not be excluded that some displacement among habitats however occurred. Since both biomass and species composition of local communities can vary over time, mainly because of natural or human-induced impacts, samples should be collected at different periods of time, encompassing any existing variations. This is particularly important when having in mind that several dietary detections were of non-native species that could de facto act as dietary replacements. Mar Piccolo of Taranto is one of the most heavily polluted and human-impacted water bodies in southern Italy (Cardellicchio et al., 2007; Petronio et al., 2012) and the dietary incorporation of non-native species could mirror high anthropogenic impacts and habitat modifications.
Using a non-invasive and accurate molecular technique, our findings further elucidate long-snouted seahorse diet and expand our understanding of prey choice. However, future studies should evaluate how diets change by season as both availability and need may differ. Management goals should probably target different habitats during different periods of year and hopefully emblematic seahorses may be able to respond positively to these management actions.
Data availability statement
The datasets presented in this study can be found in online repositories. The names of the repository/repositories and accession number(s) can be found below: https://www.ncbi.nlm.nih.gov/, PRJNA918558.
Ethics statement
Ethical review and approval was not required for the animal study because according to the art. 2 of D.P.R. 1639/1968 the Department of Biosciences, Biotechnologies and Environment is legally accredited for permission of fishing for scientific purposes. Moreover according to art. 2 of D. Lg. 26 04/03/2016, which recipes the European regulation 2010/63/EU about the protection of animals involved in scientific researches, for “practices not likely to cause pain, suffering, distress or lasting damage equivalent to or greater than that caused by the insertion of a needle according to good veterinary practice” it is not required the authorization of an Ethical review and approval. Indeed, according to art. 2 of D. Lg. 26 04/03/2016 in this study during all activities involving seahorses, no damaging, sacrificing, or experimenting was performed on animals.
Author contributions
LT, BF, BB, MM, SM, PG, and CP conceived the ideas and designed the methodology. LT, CG, GM, and PC collected the data. BF analyzed the data. LT, BF, and CP led the writing of the manuscript. All authors contributed to the article and approved the submitted version.
Acknowledgments
The content of this manuscript has been presented in part at the 2022 IEEE International Workshop on Metrology for the Sea, T. Lazic et al., “Assessment of Hippocampus guttulatus diet using DNA metabarcoding of feces,” 2022 IEEE International Workshop on Metrology for the Sea; Learning to Measure Sea Health Parameters (MetroSea), Milazzo, Italy, 2022, pp. 549-553, doi: 10.1109/MetroSea55331.2022.9950965].”
Conflict of interest
The authors declare that the research was conducted in the absence of any commercial or financial relationships that could be construed as a potential conflict of interest.
Publisher’s note
All claims expressed in this article are solely those of the authors and do not necessarily represent those of their affiliated organizations, or those of the publisher, the editors and the reviewers. Any product that may be evaluated in this article, or claim that may be made by its manufacturer, is not guaranteed or endorsed by the publisher.
Supplementary material
The Supplementary Material for this article can be found online at: https://www.frontiersin.org/articles/10.3389/fmars.2023.1138279/full#supplementary-material
References
Alonso-Alemany D., Barré A., Beretta S., Bonizzoni P., Nikolski M., Valiente G. (2014). Further steps in TANGO: Improved taxonomic assignment in metagenomics. Bioinformatics 30, 17–23. doi: 10.1093/bioinformatics/btt256
Ape F., Corriero G., Mirto S., Pierri C., Lazic T., Gristina M. (2019). Trophic flexibility and prey selection of the wild long-snouted seahorse hippocampus guttulatus cuvier 1829 in three coastal habitats. Estuar. Coast. Shelf Sci. 224, 1–10. doi: 10.1016/j.ecss.2019.04.034
Balech B., Sandionigi A., Marzano M., Pesole G., Santamaria M. (2022). MetaCOXI: an integrated collection of metazoan mitochondrial cytochrome oxidase subunit-I DNA sequences. Database 2022, baab084. doi: 10.1093/database/baab084
Bergert B., Wainwright P. C. (1997). Morphology and kinematics of prey capture in the syngnathid fishes hippocampus erectus and syngnathus floridae. Mar. Biol. 127, 563–565. doi: 10.1007/s002270050046
Bremner J. (2008). Species’ traits and ecological functioning in marine conservation and management. J. Exp. Mar. Biol. Ecol. 366, 37–47. doi: 10.1016/j.jembe.2008.07.007
Buchfink B., Xie C., Huson D. H. (2015). Fast and sensitive protein alignment using DIAMOND. Nat. Methods 12, 59–60. doi: 10.1038/nmeth.3176
Caldwell I. R., Vincent A. C. J. (2013). A sedentary fish on the move: Effects of displacement on long-snouted seahorse (Hippocampus guttulatus cuvier) movement and habitat use. Environ. Biol. Fish. 96, 67–75. doi: 10.1007/s10641-012-0023-4
Callahan B. J., McMurdie P. J., Holmes S. P. (2017). Exact sequence variants should replace operational taxonomic units in marker-gene data analysis. ISME J. 11, 2639–2643. doi: 10.1038/ismej.2017.119
Callahan B. J., McMurdie P. J., Rosen M. J., Han A. W., Johnson A. J. A., Holmes S. P. (2016). DADA2: High-resolution sample inference from illumina amplicon data. Nat. Methods 13, 581. doi: 10.1038/nmeth.3869
Cameron J. L. (1996). Regulation of reproductive hormone secretion in primates by short-term changes in nutrition. Rev. Reprod. 1, 117–126. doi: 10.1530/ror.0.0010117
Cardellicchio N., Buccolieri A., Giandomenico S., Lopez L., Pizzulli L., Spada L. (2007). Organic pollutants (PAHs, PCBs) in sediments from the mar piccolo in taranto (Ionian Sea, southern Italy). Mar. pollut. Bull. 55, 451–458. doi: 10.1016/j.marpolbul.2007.09.007
Castro A. L. C., De Farias Diniz A., Martins I. Z., Vendel A. L., De Oliveira T. P. R., De Lucena Rosa I. M. (2008). Assessing diet composition of seahorses in the wild using a non-destructive method: Hippocampus reidi (Teleostei: syngnathidae) as a study-case. Neotrop. Ichthyol. 6, 637–644. doi: 10.1590/S1679-62252008000400012
Cecere E., Petrocelli A. (2009). “The mar piccolo of taranto,” in Flora and vegetation of the Italian transitional water systems. Eds. Cecere E., Petrocelli A., Sfriso A., Izzo G. (algal beds of Cladophora prolifera:CoRiLa. Multigraf, Spinea, Venezia), 195–227.
Correia M., Caldwell I. R., Koldewey H. J., Andrade J. P., Palma J. (2015). Seahorse (Hippocampinae) population fluctuations in the ria Formosa lagoon, south Portugal. J. Fish Biol. 87, 679–690. doi: 10.1111/jfb.12748
Curtis J. M. R., Vincent A. C. J. (2006). Life history of an unusual marine fish: Survival, growth and movement patterns of hippocampus guttulatus cuvier 1829. J. Fish Biol. 68, 707–733. doi: 10.1111/j.0022-1112.2006.00952.x
Davis N. M., Proctor D. M., Holmes S. P., Relman D. A., Callahan B. J. (2018). Simple statistical identification and removal of contaminant sequences in marker-gene and metagenomics data. Microbiome 6, 226. doi: 10.1186/s40168-018-0605-2
Díaz-Abad L., Bacco-Mannina N., Madeira F. M., Neiva J., Aires T., Serrao E. A., et al. (2022). eDNA metabarcoding for diet analyses of green sea turtles (Chelonia mydas). Mar. Biol. 169, 18. doi: 10.1007/s00227-021-04002-x
Ewels P., Magnusson M., Lundin S., Kaller M. (2016). MultiQC: Summarize analysis results for multiple tools and samples in a single report. Bioinform. 32, 3047–3048. doi: 10.1093/bioinformatics/btw354
Felício A. K. C., Rosa I. L., Souto A., Freitas R. H. A. (2006). Feeding behavior of the longsnout seahorse hippocampus reidi ginsburg 1933. J. Ethol. 24, 219–225. doi: 10.1007/s10164-005-0189-8
Fosso B., Pesole G., Rosselló F., Valiente G. (2018). Unbiased taxonomic annotation of metagenomic samples. J. Comput. Biol. 25, 348–360. doi: 10.1089/cmb.2017.0144
Fosso B., Santamaria M., Marzano M., Alonso-Alemany D., Valiente G., Donvito G., et al. (2015). BioMaS: A modular pipeline for bioinformatic analysis of metagenomic AmpliconS. BMC Bioinform. 16, 203. doi: 10.1186/s12859-015-0595-z
Foster S. J., Vincent A. C. J. (2004). The life history and ecology of seahorses, hippocampus spp.: implications for conservation and management. J. Fish Biol. 65, 1–61. doi: 10.1111/j.0022-1112.2004.00429.x
Franzoi P., Maccagnani R., Rossi R., Ceccherelli V. U. (1993). Life cycles and feeding habits of syngnathus taenionotus and s. abaster (Pisces, syngnathidae) in a brackish bay of the po river delta (Adriatic Sea). Mar. Ecol. Prog. Ser. 97, 71–81. doi: 10.3354/MEPS097071
Gainsbury S., Meiri S. (2017). The latitudinal diversity gradient and interspecific competition: No global relationship between lizard dietary niche breadth and species richness global ecol. Biogeogr 26, 563–572. doi: 10.1111/geb.12560
Gristina M., Cardone F., Carlucci R., Castellano L., Passarelli S., Corriero G. (2015). Abundance, distribution and habitat preference of hippocampus guttulatus and hippocampus hippocampus in a semi-enclosed central Mediterranean marine area. Mar. Ecol. 36, 57–66. doi: 10.1111/maec.12116
Gristina M., Cardone F., Desiderato A., Mucciolo S., Lazic T., Corriero G. (2017). Habitat use in juvenile and adult life stages of the sedentary fish hippocampus guttulatus. Hydrobiologia 784, 9–19. doi: 10.1007/s10750-016-2818-3
Gül M. R., Griffen B. D. (2020). Diet, energy storage, and reproductive condition in a bioindicator species across beaches with different levels of human disturbance. Ecol. Indicat. 117, 106636. doi: 10.1016/j.ecolind.2020.106636
Gurkan S., Taskavak E., Sever T. M., Akalin S. (2011). Gut contents of two European seahorses hippocampus hippocampus and hippocampus guttulatus in the Aegean Sea, coasts of Turkey. Pakistan J. Zool. 43, 1197–1201.
Hamann M., Godfrey M. H., Seminoff J. A., Arthur K., Barata P. C. R., Bjorndal K. A., et al. (2010). Global research priorities for sea turtles: Informing management and conservation in the 21st century. Endanger. Spec. Res. 11, 245–269. doi: 10.3354/esr00279
Heard J., Chen J. P., Wen C. K. C. (2019). Citizen science yields first records of hippocampus japapigu and hippocampus denise (Syngnathidae) from Taiwan: A hotspot for pygmy seahorse diversity. Zookeys 883, 83–90. doi: 10.3897/zookeys.883.39662
Hebert P. D. N., Cywinska A., Ball S. L., De Waard J. R. (2003). Biological identifications through DNA barcodes. Proc. Biol. Sci. 270, 313–321. doi: 10.1098/rspb.2002.2218
Hernandez-Urcera J., Murillo F. J., Regueira M., Cabanellas-Reboredo M., Planas M. (2021). Preferential habitats prediction in syngnathids using species distribution models. Mar. Environ. Res. 172, 105488. doi: 10.1016/j.marenvres.2021.105488
Hildebrand F., Tadeo R., Voigt A. Y., Bork P., Raes J. (2014). LotuS: An efficient and user-friendly OTU processing pipeline. Microbiome 2, 30. doi: 10.1186/2049-2618-2-30
Holst S., Laakmann S. (2019). First record of the stalked jellyfish haliclystus tenuis kishinouye 1910 (Cnidaria: Staurozoa) in Atlantic waters. Mar. Biodiv 49, 1061–1066. doi: 10.1007/s12526-018-0888-3
Hughes T. P., Kerry J. T., Álvarez-Noriega M., Álvarez-Romero J. G., Anderson K. D., Baird A. H., et al. (2017). Global warming and recurrent mass bleaching of corals. Nature 543, 373–377. doi: 10.1038/nature21707
IUCN (2022) The IUCN red list of threatened species. Available at: http://www.iucnredlist.org (Accessed December 20, 2022).
James P. L., Heck K. (1994). The effects of habitat complexity and light intensity on ambush predation within a simulated seagrass habitat. J. Exp. Mar. Biol. Ecol. 176, 187–200. doi: 10.1016/0022-0981(94)90184-8
Kendrick A. J., Hyndes G. A. (2005). Variations in the dietary compositions of morphologically diverse syngnathid fishes. Environ. Biol. Fish. 72, 415–427. doi: 10.1007/s10641-004-2597-y
Kim M. J., Kim H. W., Lee S. R., Kim N. Y., Lee Y. J., Joo H. T., et al. (2022). Feeding strategy of the wild Korean seahorse (Hippocampus haema). J. Mar. Sci. Eng. 10, 357. doi: 10.3390/jmse10030357
Kitsos M. S., Tzomos T., Anagnostopoulou L., Koukouras A. (2008). Diet composition of the seahorses, hippocampus guttulatus cuvier 1829 and hippocampus hippocampus (L. 1758) (teleostei, syngnathidae) in the Aegean Sea. J. Fish Biol. 72, 1259–1267. doi: 10.1111/j.1095-8649.2007.01789.x
Kozich J. J., Westcott S. L., Baxter N. T., Highlander S. K., Schloss P. D. (2013). Development of a dual-index sequencing strategy and curation pipeline for analyzing amplicon sequence data on the MiSeq illumina sequencing platform. Appl. Environ. Microbiol. 79, 5112–5120. doi: 10.1128/AEM.01043-13
Kuiter R. H. (2000). Seahorses, pipefishes and their relatives: A comprehensive guide to syngnathiformes (Chorleywood, UK: TMC Publishing).
Lazic T., Pierri C., Corriero G., Balech B., Cardone F., Deflorio M., et al. (2021). Evaluating the efficiency of DNA metabarcoding to analyze the diet of hippocampus guttulatus (Teleostea: Syngnathidae). Life 11, 998. doi: 10.3390/life11100998
Leray M., Ho S. L., Lin I. J., Machida R. J. (2018). MIDORI server: A webserver for taxonomic assignment of unknown metazoan mitochondrial-encoded sequences using a curated database. Bioinformatics 34, 3753–3754. doi: 10.1093/bioinformatics/bty454
Leray M., Yang J. Y., Meyer C. P., Mills S. C., Agudelo N., Ranwez V., et al. (2013). A new versatile primer set targeting a short fragment of the mitochondrial COI region for metabarcoding metazoan diversity: Application for characterizing coral reef fish gut contents. Front. Zool 10, 34. doi: 10.1186/1742-9994-10-34
Manning C. G., Foster S. J., Vincent A. C. J. (2019). A review of the diets and feeding behaviours of a family of biologically diverse marine fishes (Family syngnathidae). Rev. Fish Biol. Fish. 29, 197–221. doi: 10.1007/s11160-019-09549-z
Manzari C., Fosso B., Marzano M., Annese A., Caprioli R., D’Erchia A. M., et al. (2015). The influence of invasive jellyfish blooms on the aquatic microbiome in a coastal lagoon (Varano, SE Italy) detected by an illumina-based deep sequencing strategy. Biol. Invasions 17, 923–940. doi: 10.1007/s10530-014-0810-2
Martin M. (2011). Cutadapt removes adapter sequences from high-throughput sequencing reads. EMBnet. J. 17, 10–12. doi: 10.14806/ej.17.1.200
McMurdie P. J., Holmes S. (2013). Phyloseq: An r package for reproducible interactive analysis and graphics of microbiome census data. PloS One 8, e61217. doi: 10.1371/journal.pone.0061217
Mount D. W. (2007). Using the basic local alignment search tool (BLAST). Cold Spring Harb. Protoc. 2007, pdb.top17. doi: 10.1101/pdb.top17
Nielsen J. M., Clare E. L., Hayden B., Brett M. T., Kratina P. (2018). Diet tracing in ecology: Method comparison and selection. Methods Ecol. Evol. 9, 278–291. doi: 10.1111/2041-210X.12869
Oksanen J. (2022) Vegan: An introduction to ordination. Available at: https://CRAN.R-project.org/package=vegan (Accessed August 1 2022).
Oliveira F., Erzini K., Gonçalves J. M. S. (2007). Feeding habits of the deep-snouted pipefish syngnathus typhle in a temperate coastal lagoon. Estuar. Coast. Shelf Sci. 72, 337–347. doi: 10.1016/j.ecss.2006.11.003
Petronio B., Cardellicchio N., Calace N., Pietroletti M., Pietrantonio M., Caliandro L. (2012). Spatial and temporal heavy metal concentration (Cu, Pb, zn, Hg, fe, Mn, Hg) in sediments of the mar piccolo in taranto (Ionian Sea, Italy). Water Air Soil pollut. 223, 863–875. doi: 10.1007/s11270-011-0908-4
Pierri C., Cardone F., Corriero G., Lazic T., Quattrocchi F., Alabiso G., et al. (2021). Density decline in a Mediterranean seahorse population: Natural fluctuations or new emerging threats? Front. Mar. Sci. 8. doi: 10.3389/fmars.2021.692068
Pierri C., Lazic T., Corriero G., Cardone F., Onen Tarantini S., Desiderato A., et al. (2020). Site fidelity of hippocampus guttulatus cuvier 1829 at mar piccolo of taranto (Southern italy; Ionian Sea). Environ. Biol. Fish 103, 1105–1118. doi: 10.1007/s10641-020-01008-0
Pierri C., Lazic T., Gristina M., Corriero G., Sinopoli M. (2022). Large-Scale distribution of the European seahorses (Hippocampus rafinesque 1810): A systematic review. Biology 11, 325. doi: 10.3390/biology11020325
Pollom R. (2017)Hippocampus guttulatus. In: The IUCN red list of threatened species. Available at: https://www.iucnredlist.org/species/41006/67617766 (Accessed December 10, 2022).
Pruesse E., Quast C., Knittel K., Fuchs B. M., Ludwig W., Peplies J., et al. (2007). SILVA: A comprehensive online resource for quality checked and aligned ribosomal RNA sequence data compatible with ARB. Nucleic Acids Res. 35, 7188–7196. doi: 10.1093/nar/gkm864
Rothman J. M., Chapman C. A., Van Soest P. J. (2012). Methods in primate nutritional ecology: A user’s guide. Int. J. Primatol. 33, 542–566. doi: 10.1007/s10764-011-9568-x
Ryer C. H. (1988). Pipefish foraging: Effects of fish size, prey size and altered habitat complexity. Mar. Ecol. Prog. Ser. 48, 37–45. doi: 10.3354/meps048037
Santos A. M., Branco M. (2011). The quality of name-based species records in databases. Trends Ecol. Evol. 27, 6–7. doi: 10.1016/j.tree.2011.10.004
Shao X., Lu Q., Xiong M., Bu H., Shi X., Wang D., et al. (2021). Prey partitioning and livestock consumption in the world’s richest large carnivore assemblage. Curr. Biol. 31, 4887–4897. doi: 10.1016/j.cub.2021.08.067
Sheppard S. K., Bell J., Sunderland K. D., Fenlon J., Skervin D., Symondson W. O. C. (2005). Detection of secondary predation by PCR analyses of the gut contents of invertebrate generalist predators. Mol. Ecol. 14, 4461–4468. doi: 10.1111/j.1365-294X.2005.02742.x
Storero L. P., González R. A. (2008). Feeding habits of the seahorse hippocampus patagonicus in San Antonio bay (Patagonia, Argentina). J. Mar. Biol. Assoc. U. K 88, 1503–1508. doi: 10.1017/S0025315408002506
Taguchi T., Miura Y., Krueger D., Sugiura S. (2014). Utilizing stomach content and faecal DNA analysis techniques to assess the feeding behaviour of largemouth bass micropterus salmoides and bluegill lepomis macrochirus. J. Fish. Biol. 84, 1271–1288. doi: 10.1111/jfb.12341
Thibaut T., Blanfuné A., Boudouresque C. F., Personnic S., Ruitton S., Ballesteros E., et al. (2017). An ecosystem-based approach to assess the status of Mediterranean algae-dominated shallow rocky reefs. Mar. Poll. Bull. 117, 311–329. doi: 10.1016/j.marpolbul.2017.01.029
Tipton K., Bell S. S. (1988). Foraging patterns of two syngnathid fishes: Importance of harpacticoid copepods. Mar. Ecol. Prog. 21, 31–43. doi: 10.3354/meps047031
Valladares S., Planas M. (2021). Nutrient incorporation in first feeding seahorses evidenced by stable carbon isotopes. Animals 11, 470. doi: 10.3390/ani11020470
Valladares S., Soto D. X., Planas M. (2017). Dietary composition of endangered seahorses determined by stable isotope analysis. Mar. Freshw. Res. 68, 831–839. doi: 10.1071/MF16013
Wang B., Li Y., Zhang G., Yang J., Deng C., Hu H., et al. (2022). Seasonal variations in the plant diet of the Chinese monal revealed by fecal DNA metabarcoding analysis. Avian Res. 13, 100034. doi: 10.1016/j.avrs.2022.100034
Ward E. J., Levin P. S., Lance M. M., Jeffries S. J., Acevedo-Gutierrez A. (2012). Integrating diet and movement data to identify hot spots of predation risk and areas of conservation concern for endangered species. Conserv. Lett. 5, 37–47. doi: 10.1111/j.1755-263X.2011.00210.x
Weber D., Lundgren J. (2009). Detection of predation using qPCR: Effect of prey quantity, elapsed time, chaser diet, and sample preservation on detectable quantity of prey DNA. J. Insect Sci. 9, 12. doi: 10.1673/031.009.4101
Wilson M. J., Vincent A. C. J. (1998). Preliminary success in closing the life cycle of exploited seahorse species, hippocampus spp., in captivity. Aq. Sci. Conser. 2, 179–196. doi: 10.1023/A:1009629130932
Woods C. M. C. (2002). Natural diet of the seahorse hippocampus abdominalis. New Zeal. J. Mar. Freshw. Res. 36, 655–660. doi: 10.1080/00288330.2002.9517121
Keywords: seahorses, Hippocampus guttulatus, diet, syngnathidae, Mar Piccolo of Taranto, DNA metabarcoding
Citation: Tamara L, Fosso B, Bachir B, Giuseppe C, Michele G, Marinella M, Graziano P, Monica S and Pierri C (2023) Hippocampus guttulatus diet based on DNA metabarcoding. Front. Mar. Sci. 10:1138279. doi: 10.3389/fmars.2023.1138279
Received: 05 January 2023; Accepted: 06 March 2023;
Published: 17 March 2023.
Edited by:
Renato Crespo Pereira, Fluminense Federal University, BrazilReviewed by:
Marco Arculeo, University of Palermo, ItalyFrancesca Ape, National Research Council (CNR), Italy
Simone Mirto, National Research Council (CNR), Italy
Copyright © 2023 Tamara, Fosso, Bachir, Giuseppe, Michele, Marinella, Graziano, Monica and Pierri. This is an open-access article distributed under the terms of the Creative Commons Attribution License (CC BY). The use, distribution or reproduction in other forums is permitted, provided the original author(s) and the copyright owner(s) are credited and that the original publication in this journal is cited, in accordance with accepted academic practice. No use, distribution or reproduction is permitted which does not comply with these terms.
*Correspondence: Bruno Fosso, YnJ1bm8uZm9zc29AdW5pYmEuaXQ=
†These authors have contributed equally to this work