 Henrik Svedäng
 Viktor Thunell
 Ale Pålsson1,3
 Sofia A. Wikström
 Martin J. Whitehouse
- 1Baltic Sea Centre, Stockholm University, Stockholm, Sweden
- 2Department of Aquatic Resources, Institute of Coastal Research, Swedish University of Agricultural Sciences, Öregrund, Sweden
- 3Depatment of History, Uppsala University, Uppsala, Sweden
- 4NordSIM Laboratory, Swedish Museum of Natural History, Stockholm, Sweden
by Svedäng H, Thunell V, Pålsson A, Wikström SA and Whitehouse MJ (2020) Front. Mar. Sci. 7:565. doi: 10.3389/fmars.2020.00565
In the published article, the ratios between otolith width (OW) and fish length (FL) for the latter part of the study, i.e., from 2005-2015, had been erroneously measured, which led to a systematic bias.
This error might have arisen from overlooking changes in ocular magnifications. Since the otolith radii were measured from digital images, the error could also have been introduced in scaling the size relationships from the images. Since the publication, additional otoliths have been analyzed, coming from a period before 1995. These otoliths showed the opposite relationship for the OW/FL ratio, i.e., relatively smaller otoliths during periods of enhanced growth, which is to be expected according to previous studies (e.g., Mosegaard et al., 1988). We hence remeasured the otoliths in this study in order to see whether a scaling error had been introduced or not.
A correction has been made to the Abstract section, page 1. The corrected sentence appears below:
“Here we show that the otoliths were similar or larger at a given fish size, and the ratio of N/Ca has increased over the studied period.”
A correction has been made to the Morphometrics section, page 8, first and second paragraphs. The corrected paragraphs appear below:
“The otoliths tended to become bigger over time, i.e., the ratios between otolith width (OW) and fish length (FL) increased marginally between the start and the end of the study period (Table 5, Figure 8). This pattern was more marked in younger age groups. All otoliths exhibited a similar relationship between OW and FL (Figure 9). ANOVA results and pairwise comparisons (Tukey multiple comparisons of means) indicated that OW/FL increased over time, as the ratios were significantly larger in 2010 compared to 1995 (Table 6).
The two proxies used to study metabolic changes, OW/FL and mean post-larval N-content, were found not to be related (linear regression, p=0.34, adjusted r2 = 0.02, Figure S3)”.
A correction has been made to the Discussion section, pages 8-9, third paragraph. The corrected sentences appear below:
“Records on in this study suggests that OW/FL in EBC have been rather constant or increased marginally. However, otoliths could also become smaller due to decreased metabolic rates even though they are expressing identical somatic growth rates (Mosegaard et al., 1988). Experimental studies on Atlantic cod and Atlantic salmon (Salmo salar) suggest that proportionality between otolith size and somatic size may not always be affected by experienced differential energy allocation patterns (Aubin-Horth and Dodson, 2002; Høie et al., 2003)”.
A correction has been made to the Discussion section, page 9, fourth paragraph.
The corrected sentence appears below:
“Therefore, the present observations indicate reduced individual growth rates rather than higher metabolic rates”.
A correction has been made to the Discussion section, page 10, fifth paragraph.
The corrected sentence appears below:
“It is hence possible that the observed early maturation in EBC has been induced by growth retardation in size groups around 20 cm, i.e., in size groups whose condition has remained stable (Casini et al., 2016)”.
A correction has been made to the Discussion section, page 11, ninth paragraph.
The corrected sentence appears below:
“The progressively higher water temperature in the Baltic Sea since the mid-1990s due to climate change (Kniebusch et al., 2019) may have led to a thermal habitat with potential to affect OW/FL. However, metabolic changes may not always result in changed proportionality between otolithic and somatic growth (Aubin-Horth and Dodson, 2002)”.
A correction has been made to the Discussion section, page 11, tenth paragraph.
The corrected sentence appears below:
“Further studies are needed to understand better the driver of the higher feeding rate and how it is connected to the decreased productivity of the EBC”.
A correction has been made to the Legend of Figure 8, page 10. The corrected legend appears below:
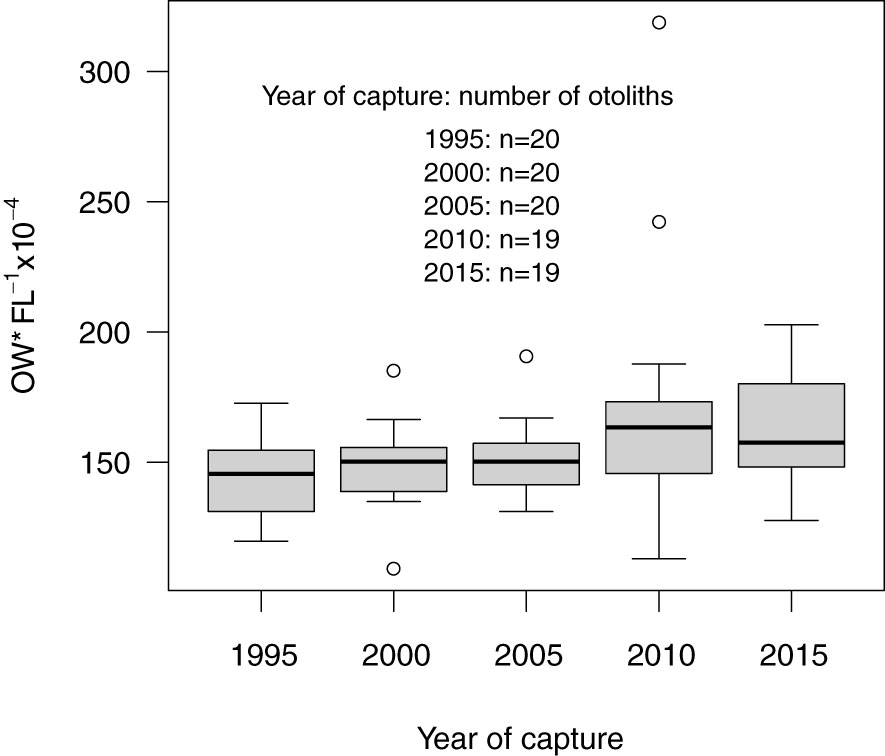
Figure 8 Boxplot of the otolith width (µmeter) in relation to fish length (cm) for all cod included in the study by the year of capture. Boxplots show median, interquartile ranges (box), ranges (vertical lines) and outliers (points). Sample sizes are given in the figure.
A correction has been made to the Legend of Figure 9, page 10. The corrected legend appears below:
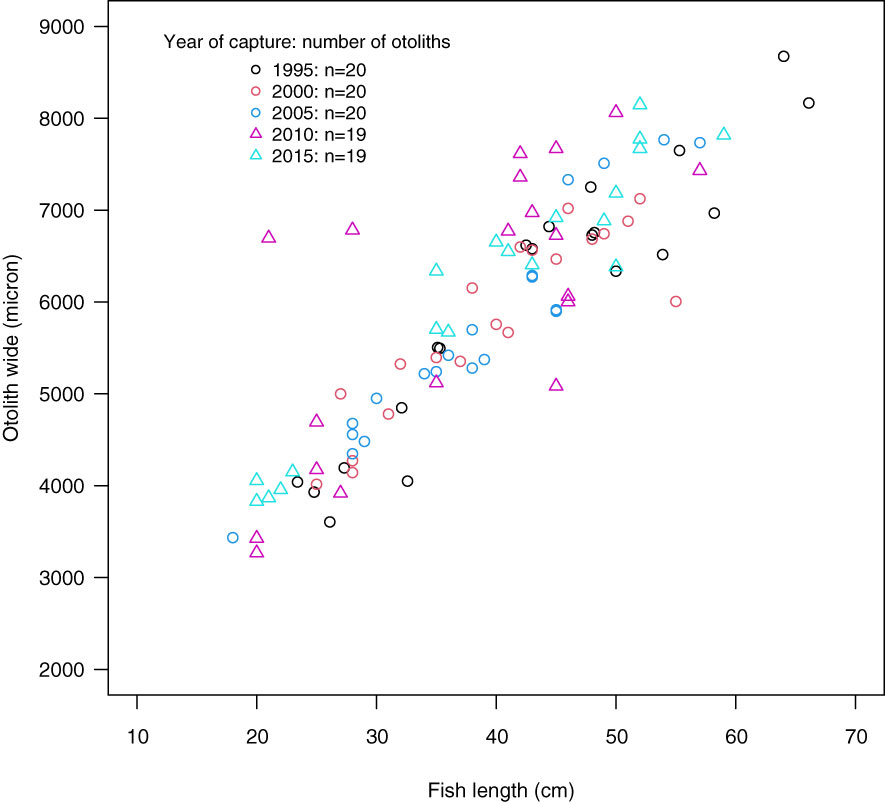
Figure 9 The ratio between otolith width (OW) and fish length (FL) by the year of capture.
A correction has been made to Table 5, page 10. The corrected table appears below:
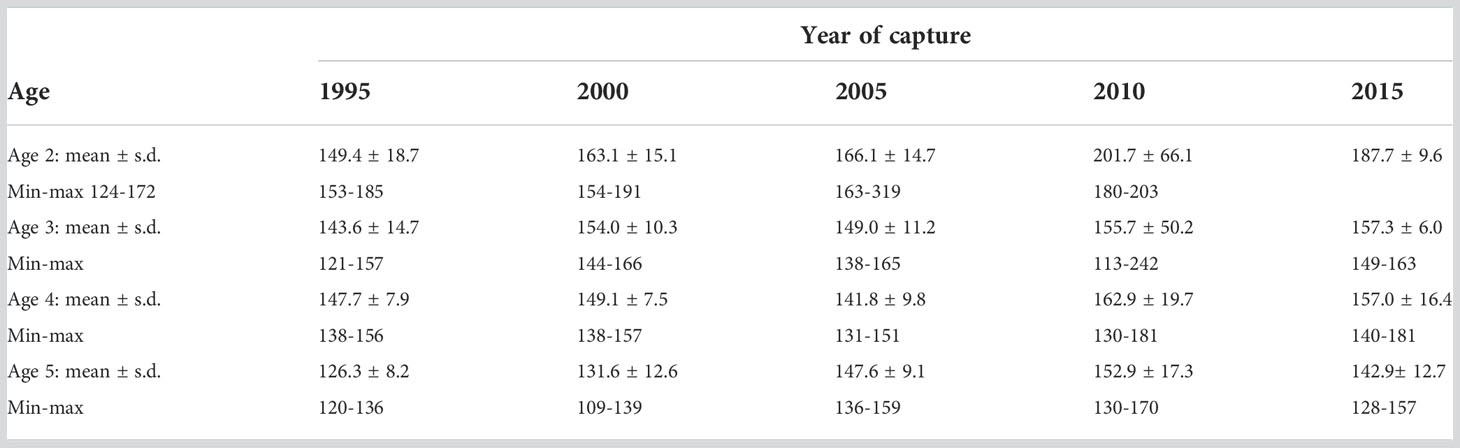
Table 5 The mean ( ± s.d.), minimum, and maximum values of the ratio between otolith width and fish length (OW/FL) are shown by year of capture.
A correction has been made to Table 6, page 11. The corrected table appears below:
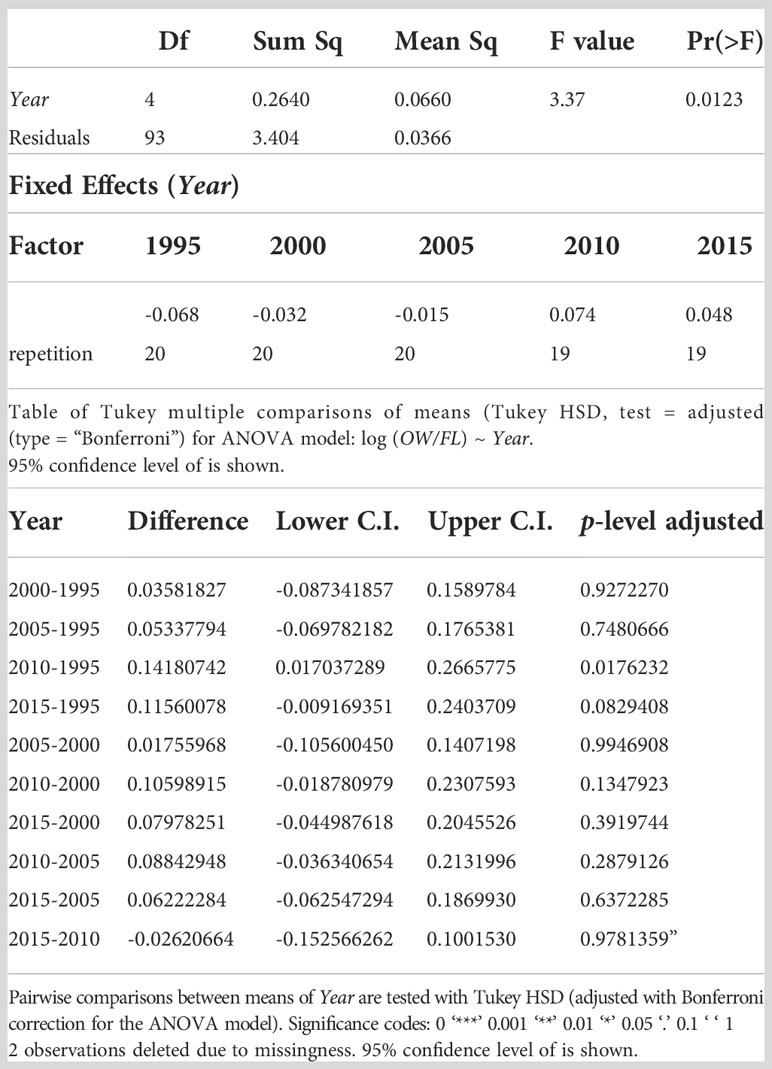
Table 6 Summary of ANOVA results for logarithmically transformed OW/FL-values with year of sampling (Year) as fixed factor.
A correction was made to Figure 3 within the Supplementary Materials.
Supplementary Figure S3 has been changed according to a revision of the relative otolith size (otolith width/ fish length). The scatter plot shows the mean post larval N-content by year versus the relative otolith size for all cod included in the study. A linear regression line is fitted to the data (p=0.34, adjusted r2=0.02). Year of capture: Black points – 1995, red points – 2000, blue points – 2005, pink triangles – 2010, light blue triangles – 2015.
The authors apologize for this error and state that this does not change the scientific conclusions of the article in any way. The original article has been updated.
Publisher’s note
All claims expressed in this article are solely those of the authors and do not necessarily represent those of their affiliated organizations, or those of the publisher, the editors and the reviewers. Any product that may be evaluated in this article, or claim that may be made by its manufacturer, is not guaranteed or endorsed by the publisher.
References
Aubin-Horth N., Dodson J. J. (2002). Impact of differential energy allocation in Atlantic salmon (Salmo salar) precocious males on otolith–somatic size proportionality: a longitudinal approach. Can. J. Fish. Aquat. Sci. 59, 1575–1583. doi: 10.1139/f02-124
Keywords: Baltic cod, ecosystem change, food quality, growth, otolith microchemistry, protein uptake
Citation: Svedäng H, Thunell V, Pålsson A, Wikström SA and Whitehouse MJ (2023) Corrigendum: Compensatory feeding in Eastern Baltic cod (Gadus morhua): recent shifts in otolith growth and nitrogen content suggest unprecedented metabolic changes. Front. Mar. Sci. 10:1154309. doi: 10.3389/fmars.2023.1154309
Received: 30 January 2023; Accepted: 12 April 2023;
Published: 31 May 2023.
Edited by:
Pedro Morais, Florida International University, United StatesReviewed by:
Malte Willmes, Norwegian Institute for Nature Research (NINA), NorwayCopyright © 2023 Svedäng, Thunell, Pålsson, Wikström and Whitehouse. This is an open-access article distributed under the terms of the Creative Commons Attribution License (CC BY). The use, distribution or reproduction in other forums is permitted, provided the original author(s) and the copyright owner(s) are credited and that the original publication in this journal is cited, in accordance with accepted academic practice. No use, distribution or reproduction is permitted which does not comply with these terms.
*Correspondence: Henrik Svedäng, aGVucmlrLnN2ZWRhbmdAc3Uuc2U=
†ORCID: Henrik Svedäng, orcid.org/0000-0002-3639-7105
Sofia A. Wikström, orcid.org/0000-0003-3508-2109
Martin J. Whitehouse, orcid.org/0000-0003-2227-577X