Abstract
The New York-New Jersey (NY-NJ) Harbour Estuary and surrounding waters support the largest port along the U.S. East Coast, commercial and recreational fishing, and a burgeoning offshore wind energy industry. Despite the high level of anthropogenic use, cetacean sightings have increased in recent years. Here, we investigated the spatiotemporal distribution of harbour porpoise in the NY-NJ Harbour Estuary from 2018–2020 using six archival acoustic recorders. Generalised additive mixed models were used to explore the relationship between weekly harbour porpoise presence and environmental variables. Harbour porpoises were detected at low levels year-round, with seasonal peaks in presence in winter to spring (February to June). Sea surface temperature and chlorophyll-a concentration were significant predictors of harbour porpoise presence, although the relationship warrants further investigation. Our results provide valuable insight into harbour porpoise distribution in the NY-NJ Harbour Estuary, which is likely related to oceanographic processes affecting prey availability. This information is timely for informing mitigation and management actions for forthcoming offshore wind energy development. Harbour porpoises are vulnerable to a range of anthropogenic impacts that have led to population declines in other regions, and therefore further research efforts are recommended for the NY-NJ Harbour Estuary and greater New York Bight.
1 Introduction
The harbour porpoise (Phocoena phocoena) is a typically cryptic species, found widely distributed in the Northern Hemisphere in temperate, subarctic, and arctic waters (Bjørge and Tolley, 2018). Three subspecies are recognised currently: Atlantic harbour porpoise (P.p. phocoena), Pacific harbour porpoise (P.p. vomerina), and Black Sea harbour porpoise (P.p. relicta), although further subspecies designations are possible given the relatively narrow home range and widespread distribution across different ocean basins (North Atlantic Marine Mammal Commission (NAMMC) and the Norwegian Institute of Marine Research (NIMR), 2019). Harbour porpoises tend to move seasonally between estuaries and bays in coastal waters to more offshore waters where they take advantage of different foraging opportunities (Nielsen et al., 2018), and therefore habitat ranges overlap with human high-use areas for at least part of the year (Nachtsheim et al., 2021). Consequently, anthropogenic threats have led to the steady decline of a number of populations, which are now classified as endangered (i.e., Black Sea harbour porpoise) or critically endangered (i.e., the Baltic Proper harbour porpoise) by the International Union for Conservation of Nature (IUCN; Hammond et al., 2002; Carlén et al., 2021). Recent IUCN assessments have listed the species globally as Least Concern as the species remains widespread across the Northern Hemisphere and there is no evidence that threats are resulting in global population decline (Braulik et al., 2020). However, as discussed by Braulik et al. (2020), many populations warrant separate assessment and particularly in light of conservation concerns and renewed pressures from fisheries, coastal development, pollution, and climate driven habitat shifts.
Harbour porpoises are particularly susceptible to anthropogenic disturbance given their predominantly coastal distributions, including river mouths and bays (NMFS, 2021), and because they are a relatively short-lived species with high metabolic demands (Read and Hohn, 1995; Kastelein et al., 1997; Wisniewska et al., 2016) and require a consistent source of energy-rich prey to thrive (Spitz et al., 2012; Andreasen et al., 2017; Hoekendijk et al., 2017). While harbour porpoises can likely survive short periods (~12+ hours) of little to no energy intake (Booth, 2020), under certain conditions, harbour porpoises (particularly juveniles) have been found to forage almost continuously to meet their metabolic requirements for survival (Wisniewska et al., 2016). Increased levels of anthropogenic noise, for example, can lead to habitat displacement and reduced time spent foraging, which could have serious implications for individual and population fitness due to their reliance on an almost constant food source (Wisniewska et al., 2018).
In the Northwest Atlantic population, harbour porpoises move along the east coast of the United States from North Carolina to Canada (NMFS, 2021). Four populations have been recognised: Gulf of Maine/Bay of Fundy, Gulf of St. Lawrence, Newfoundland, and Greenland (Gaskin, 1984; Gaskin, 1992; Johnston, 1995; Read and Hohn, 1995; Wang et al., 1996; Westgate et al., 1997; Westgate and Tolley, 1999). The Gulf of Maine/Bay of Fundy stock is believed to make up the majority of harbour porpoises in the Northwest Atlantic (~60%; Rosel et al., 1999; Hiltunen, 2006), with the current best population estimate of 95,543 (CV=0.31; NMFS, 2021). There can however be considerable overlap in seasonal range use by the different populations. In New York – New Jersey waters for example, ~60% of the population was found to be from the Gulf of Maine/Bay of Fundy stock, ~25% from Newfoundland, 12% from the Gulf of St. Lawrence and less than 3% from the Greenland stock (Rosel et al., 1999; Hiltunen, 2006; NMFS, 2021). Seasonal movements into the Mid-Atlantic region tend to occur in the fall and winter before moving north to breed in cooler waters (North Atlantic Marine Mammal Commission (NAMMC) and the Norwegian Institute of Marine Research (NIMR), 2019). In waters off New York –New Jersey, harbour porpoises have been documented primarily during the winter months (Sadove and Cardinale, 1993; NMFS, 2021), however there is little known about the current specific seasonal distribution (New York State Department of Environment and Conservation (NYSDEC) Species of Greatest Conservation Need (SGCN), 2013). Current data are therefore required to evaluate the present distribution patterns and the potential impacts to harbour porpoises in this region (North Atlantic Marine Mammal Commission (NAMMC) and the Norwegian Institute of Marine Research (NIMR), 2019).
Although harbour porpoises are not listed under the Endangered Species Act or considered to be a strategic stock (NMFS, 2021), they are designated as a species of special concern by the state of New York (New York State Department of Environment and Conservation (NYSDEC) Species of Greatest Conservation Need (SGCN), 2013). The broader U.S. Atlantic population is believed to be slowly increasing (North Atlantic Marine Mammal Commission (NAMMC) and the Norwegian Institute of Marine Research (NIMR), 2019), thanks largely to reduced pressures from bycatch in the western Atlantic (Braulik et al., 2020). However, in the Northwest Atlantic, harbour porpoises are still vulnerable to fisheries bycatch (NMFS, 2021), contaminants (Hall et al., 2006), ship traffic (Terhune, 2015; Oakley et al., 2017), habitat modifications from dredging (Todd et al., 2015), and offshore wind energy development (Carstensen et al., 2006; Dähne et al., 2013; Benjamins et al., 2017). Expanding offshore wind development in the Mid-Atlantic are cause for concern given known impacts to harbour porpoise from wind farm construction in other regions (e.g., Scheidat et al., 2011; Dähne et al., 2013; Brandt et al., 2018; Nabe-Nielsen et al., 2018; Graham et al., 2019). In Europe, for example, harbour porpoises have been shown to move away from offshore wind farm construction activities (Carstensen et al., 2006), which can lead to long term habitat displacement if noise exposure levels continue (Nabe-Nielsen et al., 2018).
For the Gulf of Maine/Bay of Fundy population, the majority of information on harbour porpoise ecology and habitat use are outdated, particularly in light of potential distribution shifts in response to climate change (Kleisner et al., 2017; Wingfield et al., 2017). The U.S. Northeast Continental Shelf region has been identified as undergoing major northward shifts in species distribution due to warming oceans (see Kleisner et al., 2017). The Gulf of Maine in particular is experiencing rapid changes in sea surface temperature (SST; Pershing et al., 2015; Kleisner et al., 2017), and harbour porpoise distributions are associated with certain SSTs (Wingfield et al., 2017). In the greater Atlantic population, the SSTs associated with harbour porpoise presence seem to depend on the population, as well as the interactions among other static and dynamic variables affecting prey availability (e.g., see Wingfield et al., 2017; Nielsen et al., 2018). Harbour porpoises in the Northwest Atlantic are known to remain in concentrated, productive areas for days to weeks before making rapid movements to new areas, where movement is once again spatially restricted (Read and Westgate, 1997; Teilmann, 2000). Rapid oceanographic changes in common feeding areas for harbour porpoises are likely leading to both inter- and intra-annual shifts in distribution across their range, as seen in the waters off Maryland from 2014–2016 (Wingfield et al., 2017). Considering that harbour porpoise tend to inhabit coastal areas where they may overlap with heavily populated coastal regions, a better understanding of these distribution shifts and the relationship to oceanographic variables is vital for informing management actions for this species.
Of particular relevance given their biology and behaviour, harbour porpoises can be difficult to study using visual survey methods as they are small, tend to be solitary or only travel in small groups, and they surface rapidly (Hammond et al., 2002). Passive Acoustic Monitoring (PAM) methods can therefore be an effective detection method, given that harbour porpoises are highly vocal and produce stereotyped, high-frequency narrow-band echolocation clicks used primarily for navigation, foraging, and communication (Linnenschmidt et al., 2012; Cosentino et al., 2019). As clicks are high frequency (centre frequency of 130kHz), harbour porpoises have not been a focus of other PAM survey efforts in the New York Bight (NYB) which targeted the lower frequency vocalisations of baleen whales (i.e., Muirhead et al., 2018). Here we explore harbour porpoise distribution in and around the New York-New Jersey (NY-NJ) Harbour Estuary, and how presence relates to environmental variables, over a two-year period using archival passive acoustic recorders. Previously, harbour porpoises have only been documented in this area through strandings reports and sparse historical sightings data (Sadove and Cardinale, 1993; NMFS, 2013; North Atlantic Marine Mammal Commission (NAMMC) and the Norwegian Institute of Marine Research (NIMR), 2019). The Port of New York and New Jersey is the largest and busiest port on the eastern seaboard, and surrounding waters are used intensely by both commercial and recreational vessels, fishing, tourism and, more recently, the offshore wind industry (BOEM, 2020). This study provides valuable information about the spatiotemporal distribution of harbour porpoises and the relationship to key environmental variables in the already heavily impacted NY-NJ Harbour Estuary, providing information that can inform management of this little-known species in the face of increasing anthropogenic pressures.
2 Materials and methods
2.1 Study area
The NY-NJ Harbour Estuary encompasses the Upper and Lower New York Bay and flows out into the greater NYB, which extends from Cape May, New Jersey to Montauk, New York. The NY-NJ Harbour Estuary contains one of the largest ports on the eastern seaboard and major shipping lanes run through the NYB and into the Port of NY-NJ (Figure 1). The NY-NJ Harbour Estuary has marked seasonal fluctuations in SST (Balcom et al., 2008), high oceanic flushing, and river discharge leading to gradations in water quality (Taillie et al., 2020) and variations in chlorophyll-a concentration (Taillie et al., 2020).
Figure 1
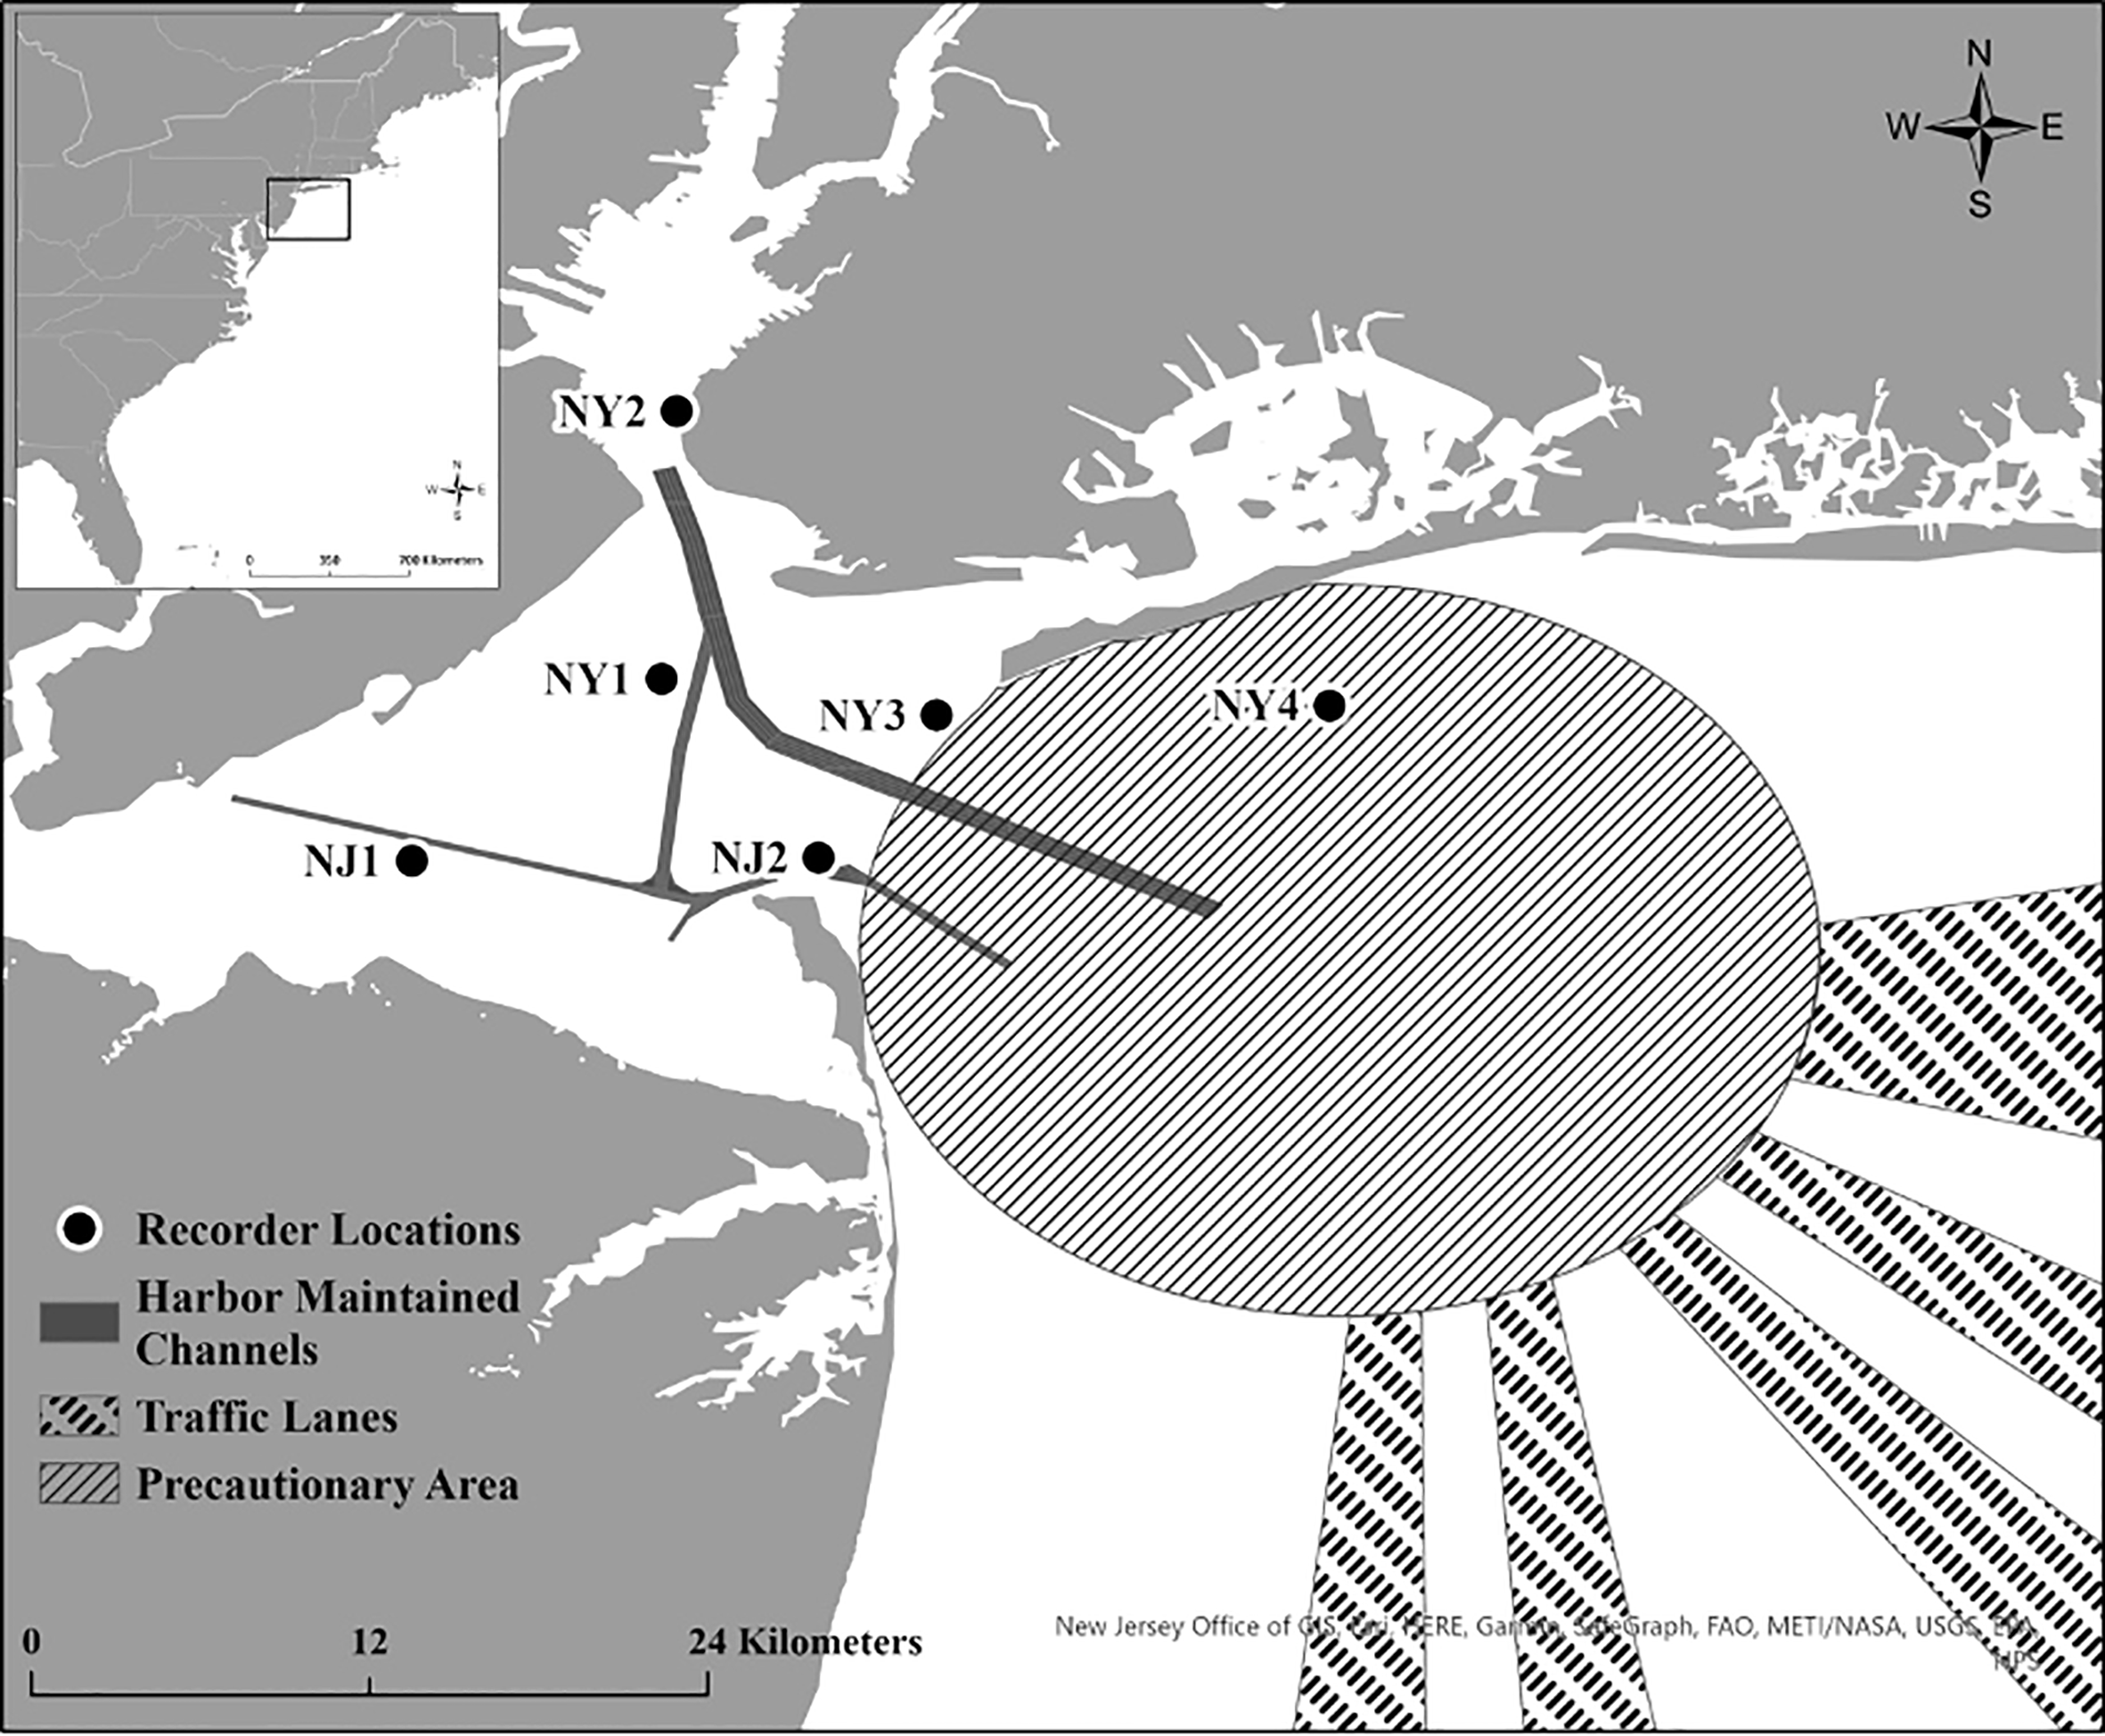
Location of the six acoustic recorders in the New York-New Jersey Harbour Estuary that were deployed from October 2018 to October 2020. Harbour Maintained Channels, Traffic Lanes and Precautionary Areas are also shown on the map. The study area location relative to the U.S. East Coast is displayed in the top left inset map.
2.2 Acoustic deployment information
Six SoundTrap ST300 HF recorders were deployed in and around the Upper and Lower New York Bay from October 4, 2018 to October 6, 2020. Four acoustic recorders were deployed at strategic locations throughout the Lower Bay (NJ1, NJ2, NY1, NY3 in Figure 1), one recorder was placed at the entrance to the Upper Bay (NY2), and one recorder was also placed at Rockaway Reef (NY4), located in close proximity to the NY-NJ Harbour Estuary entrance. Due to some equipment failure and logistical constraints, particularly surrounding the COVID-19 pandemic, not all units were deployed during each deployment or some units failed to record for the entire duration of certain deployments (see Table 1). Four recorders were deployed for the first and second deployments (total deployment duration = 174 days), six recorders were deployed for the third, fourth, and fifth deployments (total deployment duration = 448 days), and three recorders were deployed for the sixth deployment (total deployment duration = 99 days). The recorders were all deployed in the relatively shallow waters of the NY-NJ Harbour Estuary at a range of depths from 7 m to 12 m depending on deployment location.
Table 1
| Recorder ID |
No. Deployed | First Date Deployed | Last Date Retrieved | Total Recording Days |
|---|---|---|---|---|
| NJ1 | 5 | 10/4/18 | 6/16/20 | 543 |
| NJ2* | 6 | 10/4/18 | 10/6/20 | 482 |
| NY1 | 6 | 10/4/18 | 10/6/20 | 548 |
| NY2 | 3 | 4/4/19 | 6/16/20 | 324 |
| NY3 | 6 | 10/4/18 | 10/6/20 | 621 |
| NY4 | 3 | 4/4/19 | 6/16/20 | 248 |
Acoustic recorder deployment and retrieval information and the total number of recording days analysed per recorder over the duration of the project.
*NJ2 failed to record for the entire duration of two separate deployments due to battery issues.
The SoundTrap ST300 HF recorders were set to record at 96 kHz, with an effective bandwidth of 20–48,000 Hz (± 3dB), to record both mysticete and odontocete species. The units were also equipped with an inbuilt harbour porpoise click detector that operates over the effective bandwidth of the recorder (20–150,000 Hz ± 3dB), and isolates probable high frequency harbour porpoise clicks before storing snippets of corresponding data for post processing and verification (see Ocean Instruments, 2021). Click detector parameters were set to a low detection threshold (see Ocean Instruments, 2021) in order to maximize detector sensitivity in the presumed high-noise environment of the NY-NJ Harbour Estuary. Due to limitations with data storage capacity and battery life when recording at high frequencies, the click detector and corresponding snippet storing tool allowed for longer deployment times, which were necessary given logistical constraints of retrieving and re-deploying units. All units were set to record on a duty cycle of 20 min on/40 min off.
2.3 Acoustic analysis
Click detection data were imported into PAMGuard using the SoundTrap Click Detector module (v. 2.01.03; Gillespie et al., 2009) and custom click classifiers were built in PAMGuard (v. 2.01.03) to classify harbour porpoise clicks. These custom parameters were a test frequency band of 110–150 kHz and control band of 40–90 kHz (Cosentino et al., 2019), minimum energy difference of 12 dB (Clausen et al., 2019), peak frequency range of 125–145 kHz (Alonso and Nuuttila, 2014), click length measured over 80% of total energy (Cosentino et al., 2019), click length range of 0.05–0.175 ms (Cosentino et al., 2019), and max amount of time between detections of 125 ms (Clausen et al., 2019). All other parameters were kept at their default values. Once porpoise clicks were detected and classified by the customised detector, the binary files with detected clicks were imported into R (v. 3.4.3; R Core Team, 2021).
2.4 Temporal and spatial variation in harbour porpoise presence
Any minutes that contained at least 25 harbour porpoise clicks were considered porpoise positive minutes (PPM; Clausen et al., 2019). Days containing at least one PPM were considered porpoise positive days (PPD). In order to verify that this threshold was sufficient for correctly identifying PPD, a manual review was done by visually assessing the click detector output for harbour porpoise click trains within the PAMGuard Click Detector module. There was 97% agreement for identifying PPD between the manual review and the automated detector when using a 25 porpoise click per minute minimum threshold. To investigate spatiotemporal variability in porpoise presence, the proportion of monthly and seasonal PPD was calculated for each recorder. The overall temporal distribution of harbour porpoise in the NY-NJ Harbour Estuary was explored by calculating mean weekly PPD across all recorders to match the temporal resolution of the environmental covariates. Seasons were delineated according to the calendar dates of the equinox and solstice for 2018–2020, resulting in the following divisions: fall (September 22–December 20, 2018 and 2020; September 23–December 20, 2019), winter (December 21–March 19, 2018 and 2019; December 21–March 18, 2020), spring (March 20–June 20, 2018 and 2019; March 19–June 19, 2020), and summer (June 21–September 21, 2018; June 21–September 22, 2019; June 21–September 21, 2020). Spatiotemporal trends in porpoise presence were further explored using a Generalised Additive Mixed Modelling (GAMM) framework.
2.5 Environmental data
Due to their high metabolic demands (Read and Hohn, 1995; Kastelein et al., 1997; Wisniewska et al., 2016), prey distribution is assumed to be a key factor influencing habitat preferences in harbour porpoises. However, prey distribution data are not always available at relevant spatial and temporal scales due to sampling challenges, and when this occurs environmental variables can be used as proxies for prey distribution (e.g., Torres et al., 2008; Forney et al., 2012; Thorne et al., 2017; Wingfield et al., 2017; Pérez-Jorge et al., 2020). Information on prey densities and distribution within the NY-NJ harbour estuary was either not publicly available and/or at fine enough temporal and spatial scales to be used in analyses. Thus, environmental covariates were used as a proxy for prey distribution, and were determined for each location and each deployment. Bathymetric features have been linked with harbour porpoise movements (e.g., Nielsen et al., 2018), distance to shore, slope, and depth were included in the analysis. These were calculated in ArcGIS Pro (v. 10.7.1) using the bathymetry map from the ESRI Living Atlas database (esri.com). Both SST and chlorophyll-a concentration have been significantly correlated with harbour porpoise distributions (e.g. Wingfield et al., 2017); we included SST (°C) using the Operational Sea Surface Temperature and Sea Ice Analysis (OSTIA) dataset from the UK Met Office and surface chlorophyll-a concentration (mg m-3) was determined using NOAA’s Visible Infrared Imaging Radiometer Suite (VIIRS) sensor. For surface chlorophyll-a concentration and SST, we determined the mean weekly value for a 1 km radius around each recorder. Each week was matched with a season using the calendar dates of the equinox and solstice for 2018–2020 as listed above. Weeks split between seasons were assigned to the season that had the highest proportion of days represented.
2.6 Generalised additive mixed models
Temporal patterns in harbour porpoise presence and relationship to environmental variables in the NY-NJ Harbour Estuary were investigated using GAMMs in R (R Core Team, 2021) using the gam function in the mgcv library (Wood, 2021). Correlation between environmental variables (i.e., distance to shore, slope, and depth) was assessed prior to fitting the models using Spearman’s rank correlation in the base cor.test function in R. Slope and distance to shore were significantly positively correlated and therefore slope was excluded from further analyses (Spearman rank correlation, rs = 0.27, N = 315, P < 0.001). A GAMM was fitted to the dependent response variable, number of PPD per week. Predictor variables were distance to shore (m), depth (m), weekly mean chlorophyll-a concentration (mg m-3) and weekly mean SST (°C). Deployment location (NJ1, NJ2, NY1, NY3) was included as a random effect to control for potential variation in acoustic presence by location (Pedersen et al., 2019).
The locations NY2 and NY4 had a number of gaps in data due to equipment failure or deployment limitations and were excluded from the GAMM analysis. Deployment year (Year 1: October 2018–September 2019; Year 2: October 2019–October 2020) was also included as a random effect within the models to account for a data gap caused by the delayed retrieval and redeployment of recorders during the COVID-19 pandemic. A Tweedie distribution (Tweedie, 1984) was used for the model as it is well suited for zero-inflated count data (Wood et al., 2016; Ahonen et al., 2021). A backward stepwise regression was used in model selection with the least significant variable (based on the approximate p-values produced by gam) removed in each iteration. Model 1 included all predictor variables, and model 3 only included weekly mean chlorophyll-a concentration (mg m-3) and weekly mean SST (°C). Model selection was based on model diagnostics, the statistical significance of model terms, and the adjusted R-squared value. The model with the lowest Akaike’s Information Criterion (AIC) score was considered the optimal model to be used in the final analysis (Bursac et al., 2008), and this model was evaluated using model diagnostics plots produced by the gam.check function to ensure assumptions were not violated.
3 Results
A total of 2766 days of acoustic recordings were collected from October 2018 to October 2020 across the six recording sites in the NY-NJ Harbour Estuary. There were 134 PPD detected across all recorders. Harbour porpoises were detected in all months of the year on at least one recorder (Figure 2A), with a higher proportion of days with detections occurring between January–May or winter–spring (Figures 2B, 3) on most recorders.
Figure 2
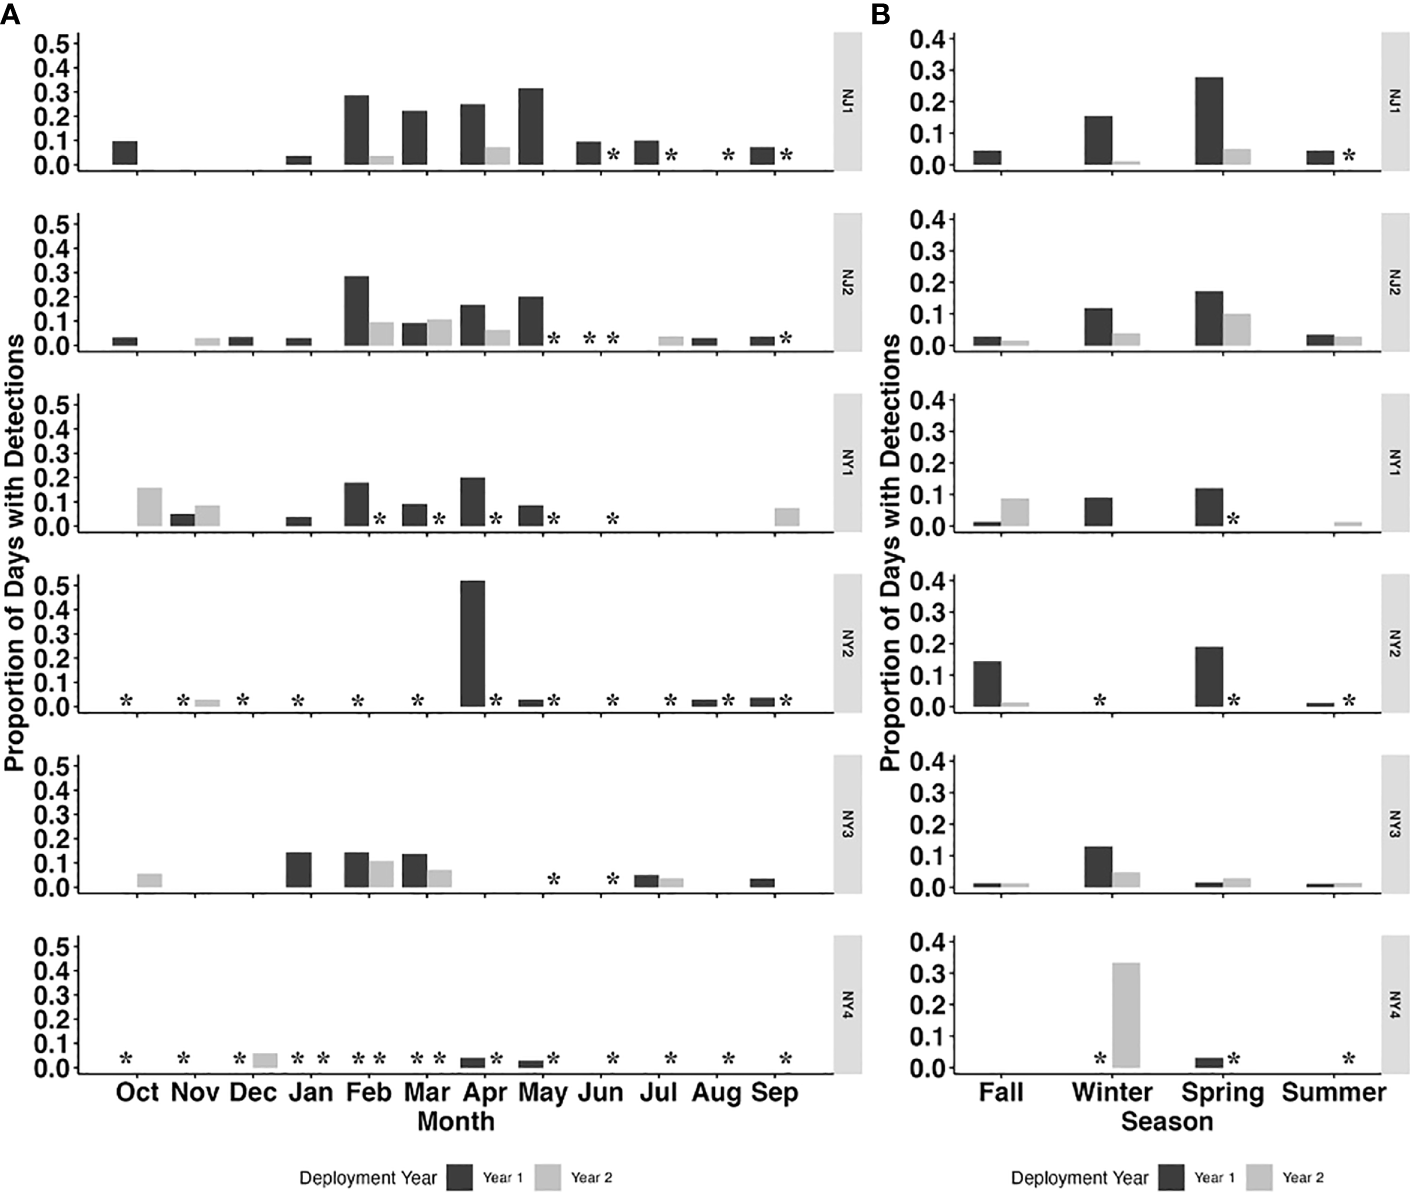
Proportion of porpoise positive days (PPD) per month (A) and season (B) for each deployment year (Year 1: October 2018 – September 2019; Year 2: October 2019 – October 2020) across all six recorder locations (NJ1, NJ2, NY1, NY2, NY3 and NY4). Asterisks indicate periods with no data.
Figure 3
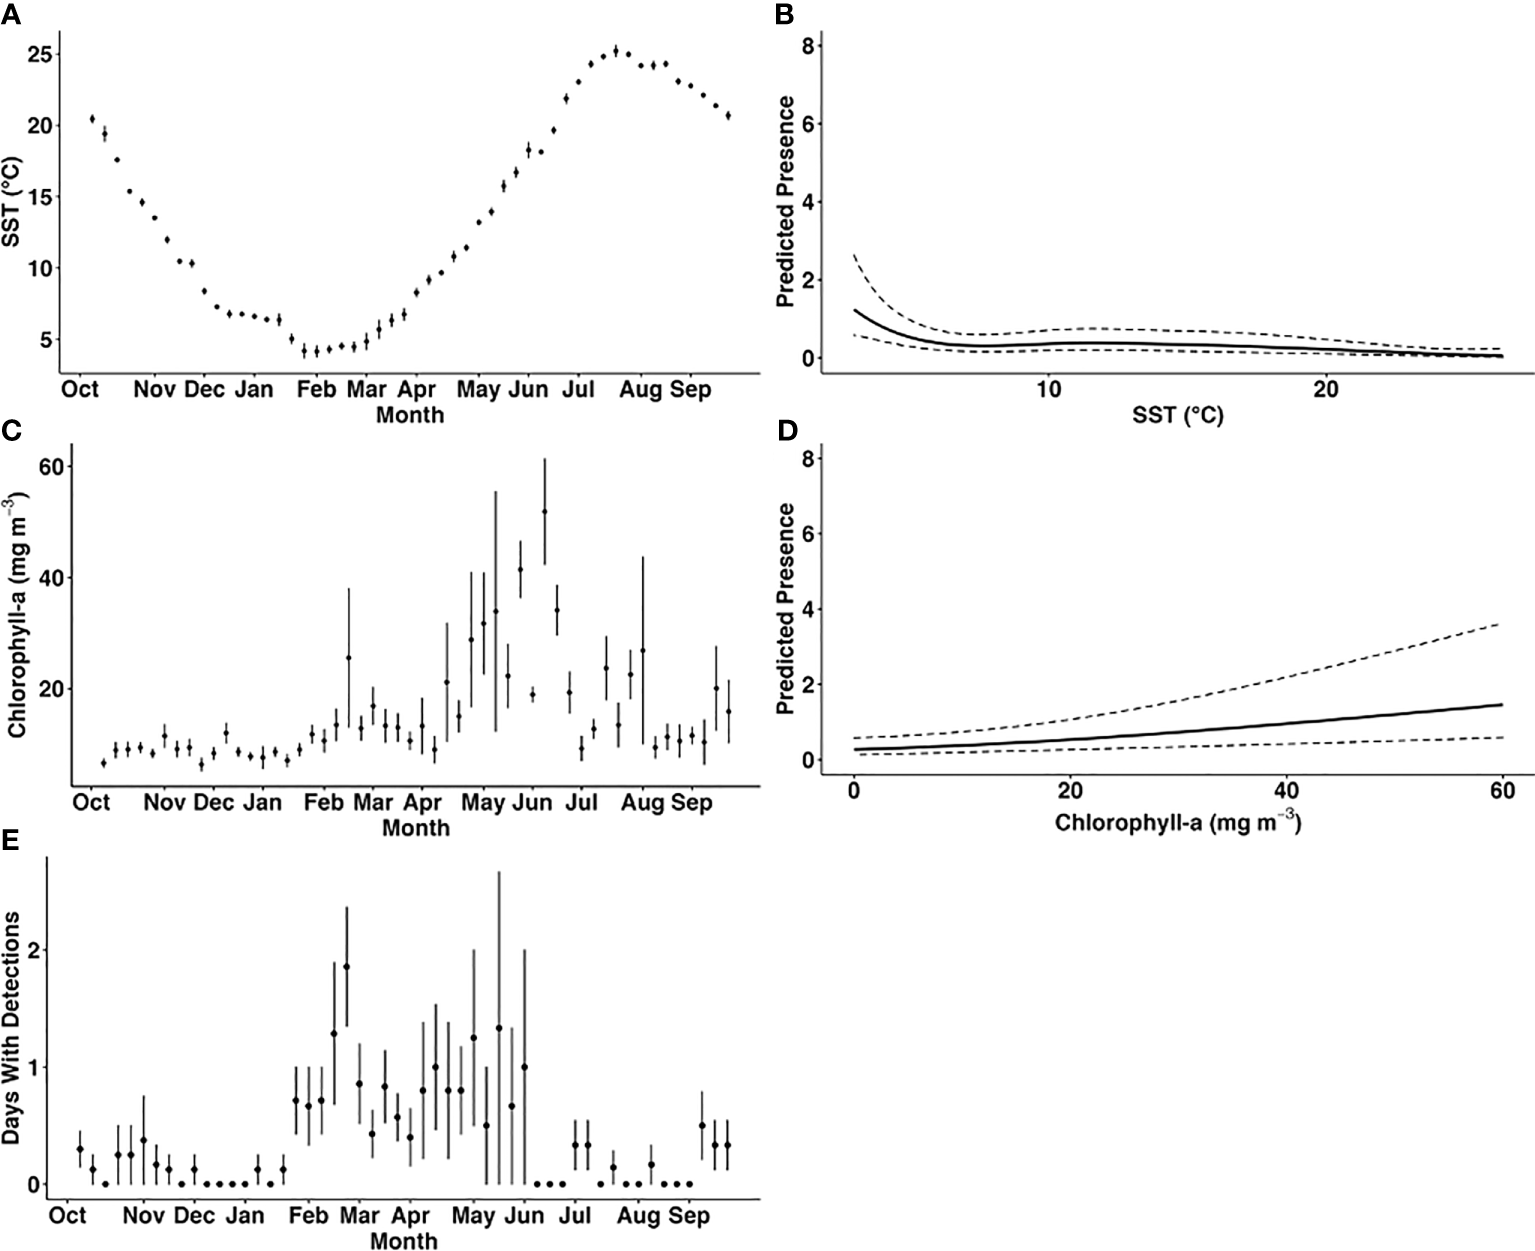
Observed variation in mean weekly sea surface temperature (°C; (A)), mean weekly concentration of chlorophyll-a (mg m-3; C) and mean number of days with harbour porpoise detections per week throughout the year across all recorders and deployments (E) compared with the predicted presence of harbour porpoise (B, D). Harbour porpoise presence was predicted using the best fitting generalised additive mixed model (model 1), and the relationship between the number of days per week with acoustic detections and the significant predictor variables weekly average sea surface temperature (B), and chlorophyll-a concentration (D) was examined. The dashed lines indicate the 95% confidence interval of the predicted values.
The recorder locations with the highest number of detections occurred in NJ waters, with NJ1 (45) and NJ2 (28) having the highest number of total PPD (Table 2; Figures 2A, B). NY1 and NY3 had the highest total PPD out of the recorders located off of NY (23 and 20, respectively), while NY1 and NY2 had the highest percentage of days with porpoise click detections (4% and 5%, respectively) relative to total recording days. There were few detections on NY4 (Table 2; Figures 2A, B, 3).
Table 2
| Recorder ID | No. Deployed | Total PPD | Total Recording Days | % PPD |
|---|---|---|---|---|
| NJ1 | 5 | 45 | 543 | 8% |
| NJ2 | 6 | 28 | 482 | 6% |
| NY1 | 6 | 23 | 548 | 4% |
| NY2 | 3 | 15 | 324 | 5% |
| NY3 | 6 | 20 | 621 | 3% |
| NY4 | 3 | 3 | 248 | 1% |
The number of porpoise positive days (PPD) for each recorder location and the percentage (%) of PPD relative to the total number of recording days.
The optimal GAMM (model 1; Table 3) included distance to shore, depth, weekly mean SST, and weekly mean chlorophyll-a concentration and yielded the lowest AIC score. Weekly mean SST and weekly mean chlorophyll-a concentration were found to be significant predictors of harbour porpoise presence (Table 3; Figures 3A–E). The mean number of PPD per week was highest from February to June (Figure 3E). SST was a significant predictor of harbour porpoise presence, with a peak in weekly PPD occurring when SSTs were below 5°C (Figure 3B). The plot of observed mean weekly SST throughout the study period (Figure 3A) indicates that water temperatures ranged from 4–18°C from February to June when there was greater detected harbour porpoise presence (Figure 3E). A significant positive relationship was found between predicted harbour porpoise presence and chlorophyll-a concentration (Figure 3D), although the time period with the highest observed porpoise presence (February to June) corresponded to mean weekly chlorophyll-a concentrations between 9.0 – 41.4 mg m-3 (Figure 3D).
Table 3
| Model # and terms included | Significance of parametric coefficients | Significance of Smooth Terms | Model Fit | |||||||||
|---|---|---|---|---|---|---|---|---|---|---|---|---|
| Intercept | SE | t - value | p - value | Term | EDF | df | F statistic | p - value | R2 | Deviance Explained | AIC | |
| 1: PPD ~ s(distance) + s(depth) + s(SST) + s(CHLA) |
-1.34 | 0.42 | -3.18 | 0.002 | distance | 1 | 1 | 2.03 | 0.16 | 0.31 | 29.2% | 273.93 |
| depth | 1 | 1 | 2.99 | 0.09 | ||||||||
| SST | 4.17 | 5.12 | 7.55 | <0.001 | ||||||||
| CHLA | 1.81 | 2.27 | 9.13 | <0.001 | ||||||||
| 2: PPD ~ s(depth) + s(SST) + s(CHLA) |
-1.31 | 0.32 | -4.14 | <0.001 | depth | 1.11 | 1.16 | 3.87 | 0.07 | 0.31 | 28.3% | 275.50 |
| SST | 4.15 | 5.09 | 7.30 | <0.001 | ||||||||
| CHLA | 1.99 | 2.50 | 9.68 | <0.001 | ||||||||
| 3: PPD ~ s(SST) + s(CHLA) |
-1.32 | 0.20 | -6.58 | <0.001 | SST | 4.30 | 5.27 | 7.58 | <0.001 | 0.29 | 26.0% | 276.82 |
| CHLA | 1.94 | 2.43 | 13.74 | <0.001 | ||||||||
Summary of generalised additive mixed models (GAMMs) used to assess temporal variation in acoustic presence of harbour porpoise in the New York-New Jersey Harbour Estuary.
In the table, PPD represents the number of days per week with acoustic harbour porpoise detections, SST represents weekly mean sea surface temperature (°C) and CHLA represents weekly mean chlorophyll-a concentration (mg m-3). The model with the lowest AIC score and highest deviance explained was model 1 with distance to shore (m), depth (m), weekly mean SST, and weekly mean chlorophyll-a concentration as predictor variables. Significant p-values (p < 0.05) are highlighted in bold.
4 Discussion
Harbour porpoises were detected year-round on at least one recorder in the NY-NJ Harbour Estuary with a peak in detection from February to June. The peak in harbour porpoise presence over winter and spring in the Harbour Estuary area is consistent with a previous study from further south in Maryland, where presence of harbour porpoises peaked from January to May (Wingfield et al., 2017). We found there were extended ‘peaks’ in harbour porpoise presence at some recorders into June, and even July in the NY-NJ Harbour Estuary (Figure 2A). As the NY-NJ Harbour Estuary is further north than Maryland, presence into later months could be expected as harbour porpoise migrate north to breed in the cooler waters in the Bay of Fundy and Gulf of Maine in summer and fall (Sadove and Cardinale, 1993; NMFS, 2013; North Atlantic Marine Mammal Commission (NAMMC) and the Norwegian Institute of Marine Research (NIMR), 2019). Earlier studies however, documented presence in the Mid-Atlantic region primarily during fall and peaking in winter months, which was also reflected in the strandings records (Sadove and Cardinale, 1993; Polacheck et al., 1995; NMFS, 2013; North Atlantic Marine Mammal Commission (NAMMC) and the Norwegian Institute of Marine Research (NIMR), 2019). The discrepancies in seasonal distribution found between earlier studies (conducted ~10–30 years ago) and those conducted more recently (current study and Wingfield et al., 2017) may represent seasonal range shifts, as seen by numerous marine species in the Northwest Atlantic due to large scale climate driven changes affecting prey distribution (Nye et al., 2009; Pinsky et al., 2020). However, this may also be an artefact of the timing of surveys and different survey methods used (acoustic vs. shipboard and aerial survey methods) and warrants further investigation. Nonetheless, our study findings of peak distribution over winter and spring provides valuable information on contemporary presence in the human-dominated NY-NJ Harbour Estuary area.
In addition to this clear seasonal peak in harbour porpoise presence, there were also detections (although at lower levels) of harbour porpoise across all months of the year (Figures 2A, B). Year-round distribution of harbour porpoise occurs in the Gulf of Maine and Bay of Fundy, with clear seasonal peaks occurring from summer to fall and with strandings reported in all months of the year in Maine and Massachusetts (Polacheck et al., 1995). In Maryland, acoustic detections of harbour porpoises were also recorded at lower levels in months outside of the peak in detections from January – May, although there were no detections reported in June – August (Wingfield et al., 2017). Given that the distribution of harbour porpoise is thought to be primarily driven by prey availability (Sveegaard et al., 2012; Gilles et al., 2016), one plausible explanation for their year-round presence in the NY-NJ Harbour Estuary is the presence of preferred prey species. A number of preferred harbour porpoise prey species are abundant in the NY-NJ Harbour Estuary and greater NYB (Waldman et al., 2006; USACE, 2015). Atlantic herring (Clupea harengus) are known to be an important prey species within the diets of Gulf of Maine/Bay of Fundy harbour porpoises (Smith and Gaskin, 1974; Recchia and Read, 1989; Braulik et al., 2020). Since the majority of harbour porpoises found within the NYB belong to the Gulf of Maine/Bay of Fundy stock, Atlantic herring are likely a preferred prey species within this region as well. Within the NY-NJ harbour estuary, Atlantic herring densities peaked during spring (April – June) based on bottom trawl surveys conducted from 2002 – 2010 (USACE, 2015). Additionally, the biomass of Atlantic herring was higher in the spring (February – April) compared to the fall (September – December) within the broader NYB (Figure 4) based trawl surveys conducted from 2010 – 2019 by the Northeast Fisheries Science Center (NEFSC; Curtice et al., 2019; see www.northeastoceandata.org). Together, these estimated peaks in herring presence mirror the peak in harbour porpoise echolocation behaviour found in this study. Outside of the peak seasons, the acoustic presence of harbour porpoises in the area may reflect these animals taking advantage of other foraging opportunities rather than migrating further north or moving to deeper waters. Heide-Jorgenson et al. (2011) found that harbour porpoises in West Greenland adapted to warming waters by staying longer in the area and taking advantage of an abundance of a different prey species, including Atlantic cod (Gadus morhua) and capelin (Mallotus villosus). Within the broader NYB, the biomass of Atlantic cod was slightly higher in the spring (February – April) compared to the fall (September – December) based on NEFSC trawl surveys (Figure 4; Curtice et al., 2019). Other cetaceans in the study area, including humpback whales (Megaptera novaeangliae) and bottlenose dolphins (Tursiops truncatus) have been observed feeding on Atlantic menhaden (Brevoortia tyrannus) and sand lance (Ammodytes sp.; King et al., 2021; WCS unpub. data), and in the Northeast Atlantic, sand lance are substantial component of harbour porpoise diets (Santos et al., 2004), indicating that these prey species may also be a preferred prey item for porpoise in the NYB. Overall, harbour porpoise movements along the Northwest Atlantic and interaction with particular prey species are not well understood (NMFS, 2021), and particularly within the NYB. Here we provide novel information on year-round presence of harbour porpoise, with seasonal peaks in late winter and spring, in the NY-NJ Harbour Estuary; an important baseline to focus future efforts that correlate presence with preferred prey species.
Figure 4
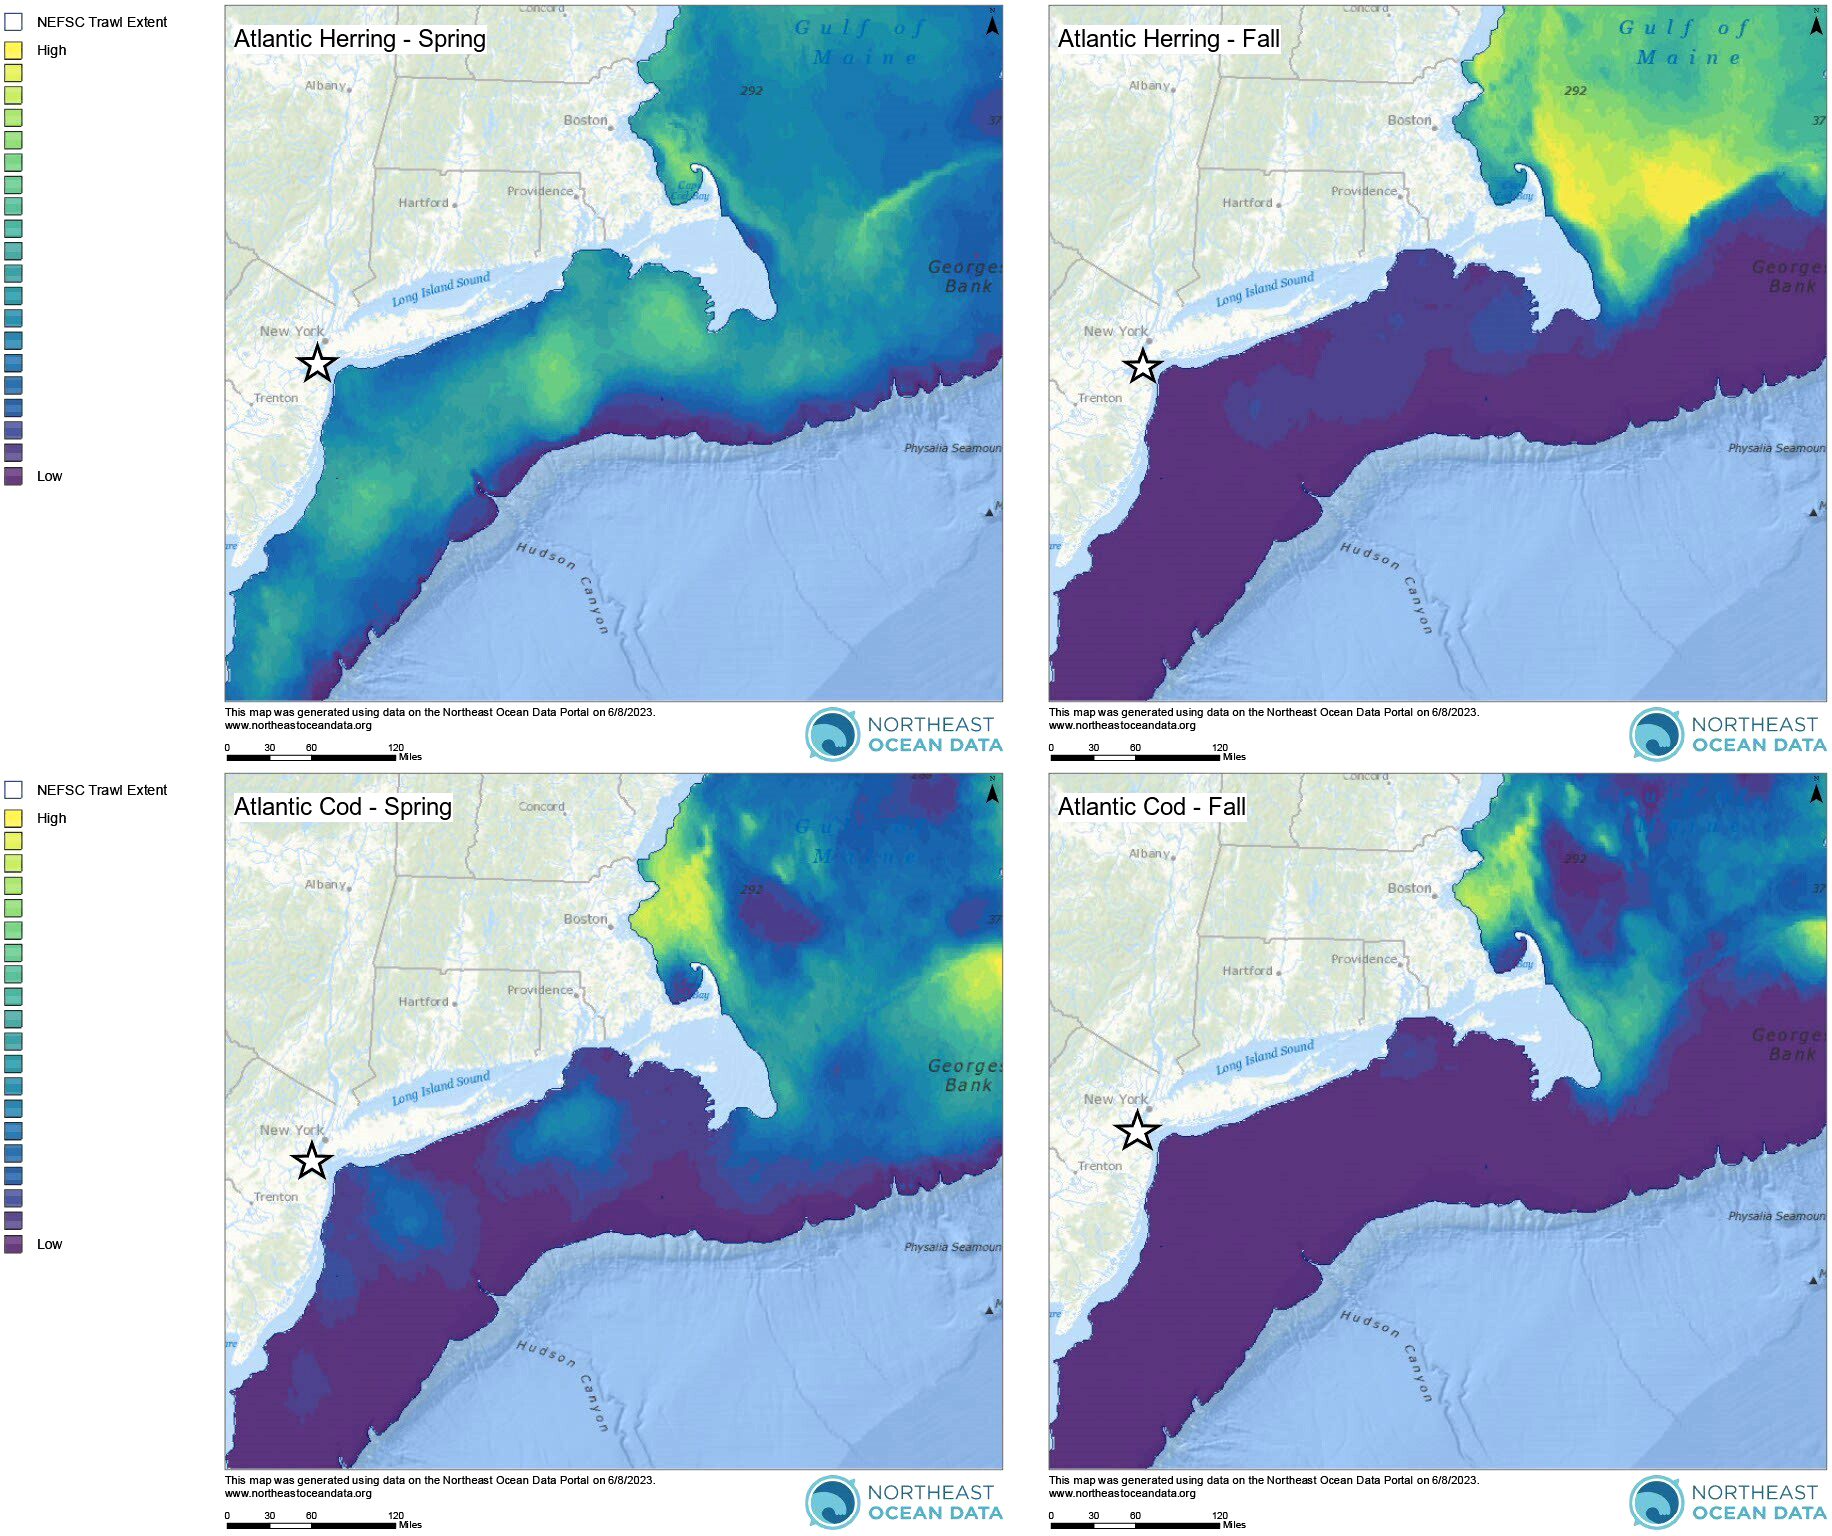
Seasonal interpolated biomass of Atlantic herring and Atlantic cod along the U.S. East Coast. Spring surveys were conducted from February – April and fall surveys were conducted from September – December in 2010 – 2019. The white star indicates the NY-NJ Harbour Estuary. All maps are from the Northeast Ocean Data Portal (NROC, 2009) and are based on trawl survey data from the Northeast Fisheries Science Center (NEFSC). See Curtice et al., 2019 for further details on all survey and modelling methodologies.
Although we have no associated prey data at relevant spatial and temporal scales in the NY-NJ Harbour Estuary to include in the models, harbour porpoise presence is likely related to prey availability, which is driven by local and regional scale oceanographic processes, as suggested by Wingfield et al. (2017). Chlorophyll-a concentration is often used as a proxy for understanding predator and prey distribution (e.g., Soldevilla et al., 2011) and was found to be a significant predictor of harbour porpoise presence in our study. The modelled predicted presence increased at higher chlorophyll-a concentrations (Figure 3D), and the observed peak in harbour porpoise presence from February to June corresponded with mean chlorophyll-a concentrations between 9.0 – 41.4 mg m-3 (Figure 3C). Interestingly, mean weekly chlorophyll-a concentrations across all locations from February – June was higher in Year 1 (21.4 mg m-3) compared to Year 2 (9.54 mg m-3). Additionally, the weekly proportion of PPD during these months was higher in Year 1 relative to Year 2 (Figure 2A). Other studies have also reported a significant relationship between harbour porpoise presence and chlorophyll-a concentration, with increased presence during high levels of chlorophyll-a (Wingfield et al., 2017; Stalder et al., 2020). However, the chlorophyll-a concentrations reported for the NY-NJ Harbour Estuary are considerably higher than those reported by Wingfield et al. (2017) off the coast of Maryland, which ranged from ~1–7.4 mg m-3. Of note is that due to the warming trend in SSTs in the region, there has been an increase in upwelling events in the NYB (including the NY-NJ Harbour Estuary), which bring cool, nutrient rich waters to the surface (Murphy et al., 2021). These upwelling events are linked to increased chlorophyll-a concentration, which in turn can lead to increased foraging opportunities (Glenn et al., 2004; Murphy et al., 2021). Heim et al. (2021) quantified ecological indicators for the NYB and found that monthly chlorophyll-a concentrations showed considerable inter-annual variability from 1995 – 2020, but that there was a significant decreasing trend over time, particularly in April and November – January, which could be a factor in the apparent shift in harbour porpoise presence in the region from fall – winter (Sadove and Cardinale, 1993; Polacheck et al., 1995; NMFS, 2013; North Atlantic Marine Mammal Commission (NAMMC) and the Norwegian Institute of Marine Research (NIMR), 2019) to winter – spring (current study; Wingfield et al., 2017). The overall chlorophyll-a concentrations in the study region varied considerably, ranging from 1.0-127.1 mg m-3, with an overall mean chlorophyll-a concentration of 13.75 ± 13.4 mg m-3. Chlorophyll-a concentrations above 20 mg m-3 are considered unhealthy for the NY-NJ Harbour Estuary, with potential for eutrophication of the ecosystem (Taillie et al., 2020). How this relationship between upwelling events, highly variable chlorophyll-a concentrations, and the availability of key prey species influences harbour porpoise distribution needs to be further examined.
The extended presence of harbour porpoise in the NY-NJ Harbour Estuary during summer and fall means that animals are subjected to a wide range of SSTs (~4–18°C; Figure 3A). The modelled relationship to SST indicated that harbour porpoises preferred water temperatures below 5°C (Figure 3B), and the plot of mean weekly SST throughout the study period (Figure 3A) indicated that water temperatures ranged from 4–7°C during February and March, which also corresponded with higher observed harbour porpoise presence. In the Mid-Atlantic, Roberts et al. (2016) predicted greater harbour porpoise presence at lower SSTs. Similarly, Wingfield et al. (2017) found that in Maryland, the peak in harbour porpoise detections occurred at 5°C, which the authors hypothesised was due to the increased presence of herring, a preferred prey species, at cooler temperatures. Although we did find a peak in predicted harbour porpoise presence below 5°C, there were still detections at a range of SSTs up to 24°C. Despite the fact that harbour porpoises are reported to prefer cooler water temperatures, there are reports of harbour porpoise inhabiting areas with seasonally higher SSTs, such as the North Sea (Gilles et al., 2011) and Wales (Isojunno et al., 2012). As discussed previously, the NY-NJ Harbour Estuary and greater NYB experiences localised fluctuations in SST through upwelling events, a phenomenon that is increasing under a changing climate (Murphy et al., 2021). From June 1–September 20 2019, Murphy et al. (2021) found three major upwelling events averaging 6.5 days (maximum 17.66 days) and accounting for 33% of the days during summer in an area overlapping with the NY-NJ Harbour Estuary. Although harbour porpoises were expected to be absent, our study documented low levels of PPDs at some locations throughout June – September 2019 (Figure 2A). It is plausible to consider that the localised upwelling events of cool water may have created opportunities for extended foraging for a proportion of the population in the nearshore typically warmer waters of the NY-NJ Harbour Estuary and surrounding coastal areas into summer and fall; however, this relationship will need to be further explored in future studies.
Harbour porpoise distribution varied over the 2-year study within the NY-NJ Harbour Estuary. Wingfield et al. (2017) also found a high degree of variability in harbour porpoise detections off Maryland, which the authors suggested was due to both localised and regional scale shifts in biological and oceanographic conditions. In the Bay of Fundy, Johnston et al. (2005) found that harbour porpoises tended to spend more time around areas with greater vorticity and along localised fronts where prey tended to aggregate. Predictable fine-scale oceanographic features, such as those found around headlands and islands, tend to aggregate prey and facilitate foraging for pelagic predators (Wolanski and Hammer, 1988; Johnston et al., 2005). The two recorders with the highest number of PPD were NJ1 and NJ2 (Figure 1; Table 2). NJ2 was located in a high current area, adjacent to a headland and therefore is likely a prime area for aggregating prey. This location was also found to have high bottlenose dolphin foraging activity throughout the same study period (Trabue et al., 2022). NJ1 was located in Raritan Bay (an interior region of the Harbour Estuary), where currents were less strong, however increased harbour porpoise presence in this area may be due to other biological and oceanographic conditions not investigated during this study. Varying ocean noise conditions may also impact the detectability of harbour porpoises over space and time due to masking in high noise conditions (i.e., see Erbe et al., 2019). Shipping traffic is pervasive in the NY-NJ Harbour Estuary and the detection range of marine species at different recorders may be impacted by proximity to shipping channels. Although the direct impact of shipping traffic on harbour porpoise detection range was not evaluated in this study, we present an overlay of vessel transit counts relative to PPDs at each location (Figure 5); these initial comparisons indicated that vessel transit counts did not change drastically across seasons and years (Figure 5), and therefore is unlikely to be a factor in the temporal variability found in harbour porpoise presence. Both NJ1 and NJ2, which recorded the highest number of PPDs, are away from the major shipping lanes, although they are adjacent to minor shipping channels, and would expect to be less impacted by noise than NY1 and NY2 (Figure 5). However, NY3 and NY4, located in areas further away from shipping lanes (and presumably would have less noise exposure) had the lowest number of PPDs (Figure 5); this may imply that other factors, and potentially other noise sources, such as localised weather events, recreational vessels and development activities may be impacting the spatial variability found in harbour porpoise presence across the NY-NJ Harbour Estuary. At NY2, located in the Upper Bay in an area with higher vessel traffic, the standardised seasonal proportion of PPD was elevated during spring of deployment Year 1, which may reflect an abundance of prey in this area during that period (Figure 5). Further research incorporating temporal and spatial variability in ambient noise conditions and interactions with other environmental variables, such as SST which may also affect sound propagation, will be the focus of further research and included into future harbour porpoise distribution models. The NY-NJ Harbour Estuary is a dynamic environment currently undergoing rapid changes due to a changing climate and anthropogenic development (Pirani et al., 2018; Murphy et al., 2021). Long-term monitoring of harbour porpoise, as well as other cetacean species, and investigating interactions with environmental variables and prey is vital for better understanding how species will be impacted by a changing climate and the increasing anthropogenic pressures facing this already heavily human-dominated region.
Figure 5
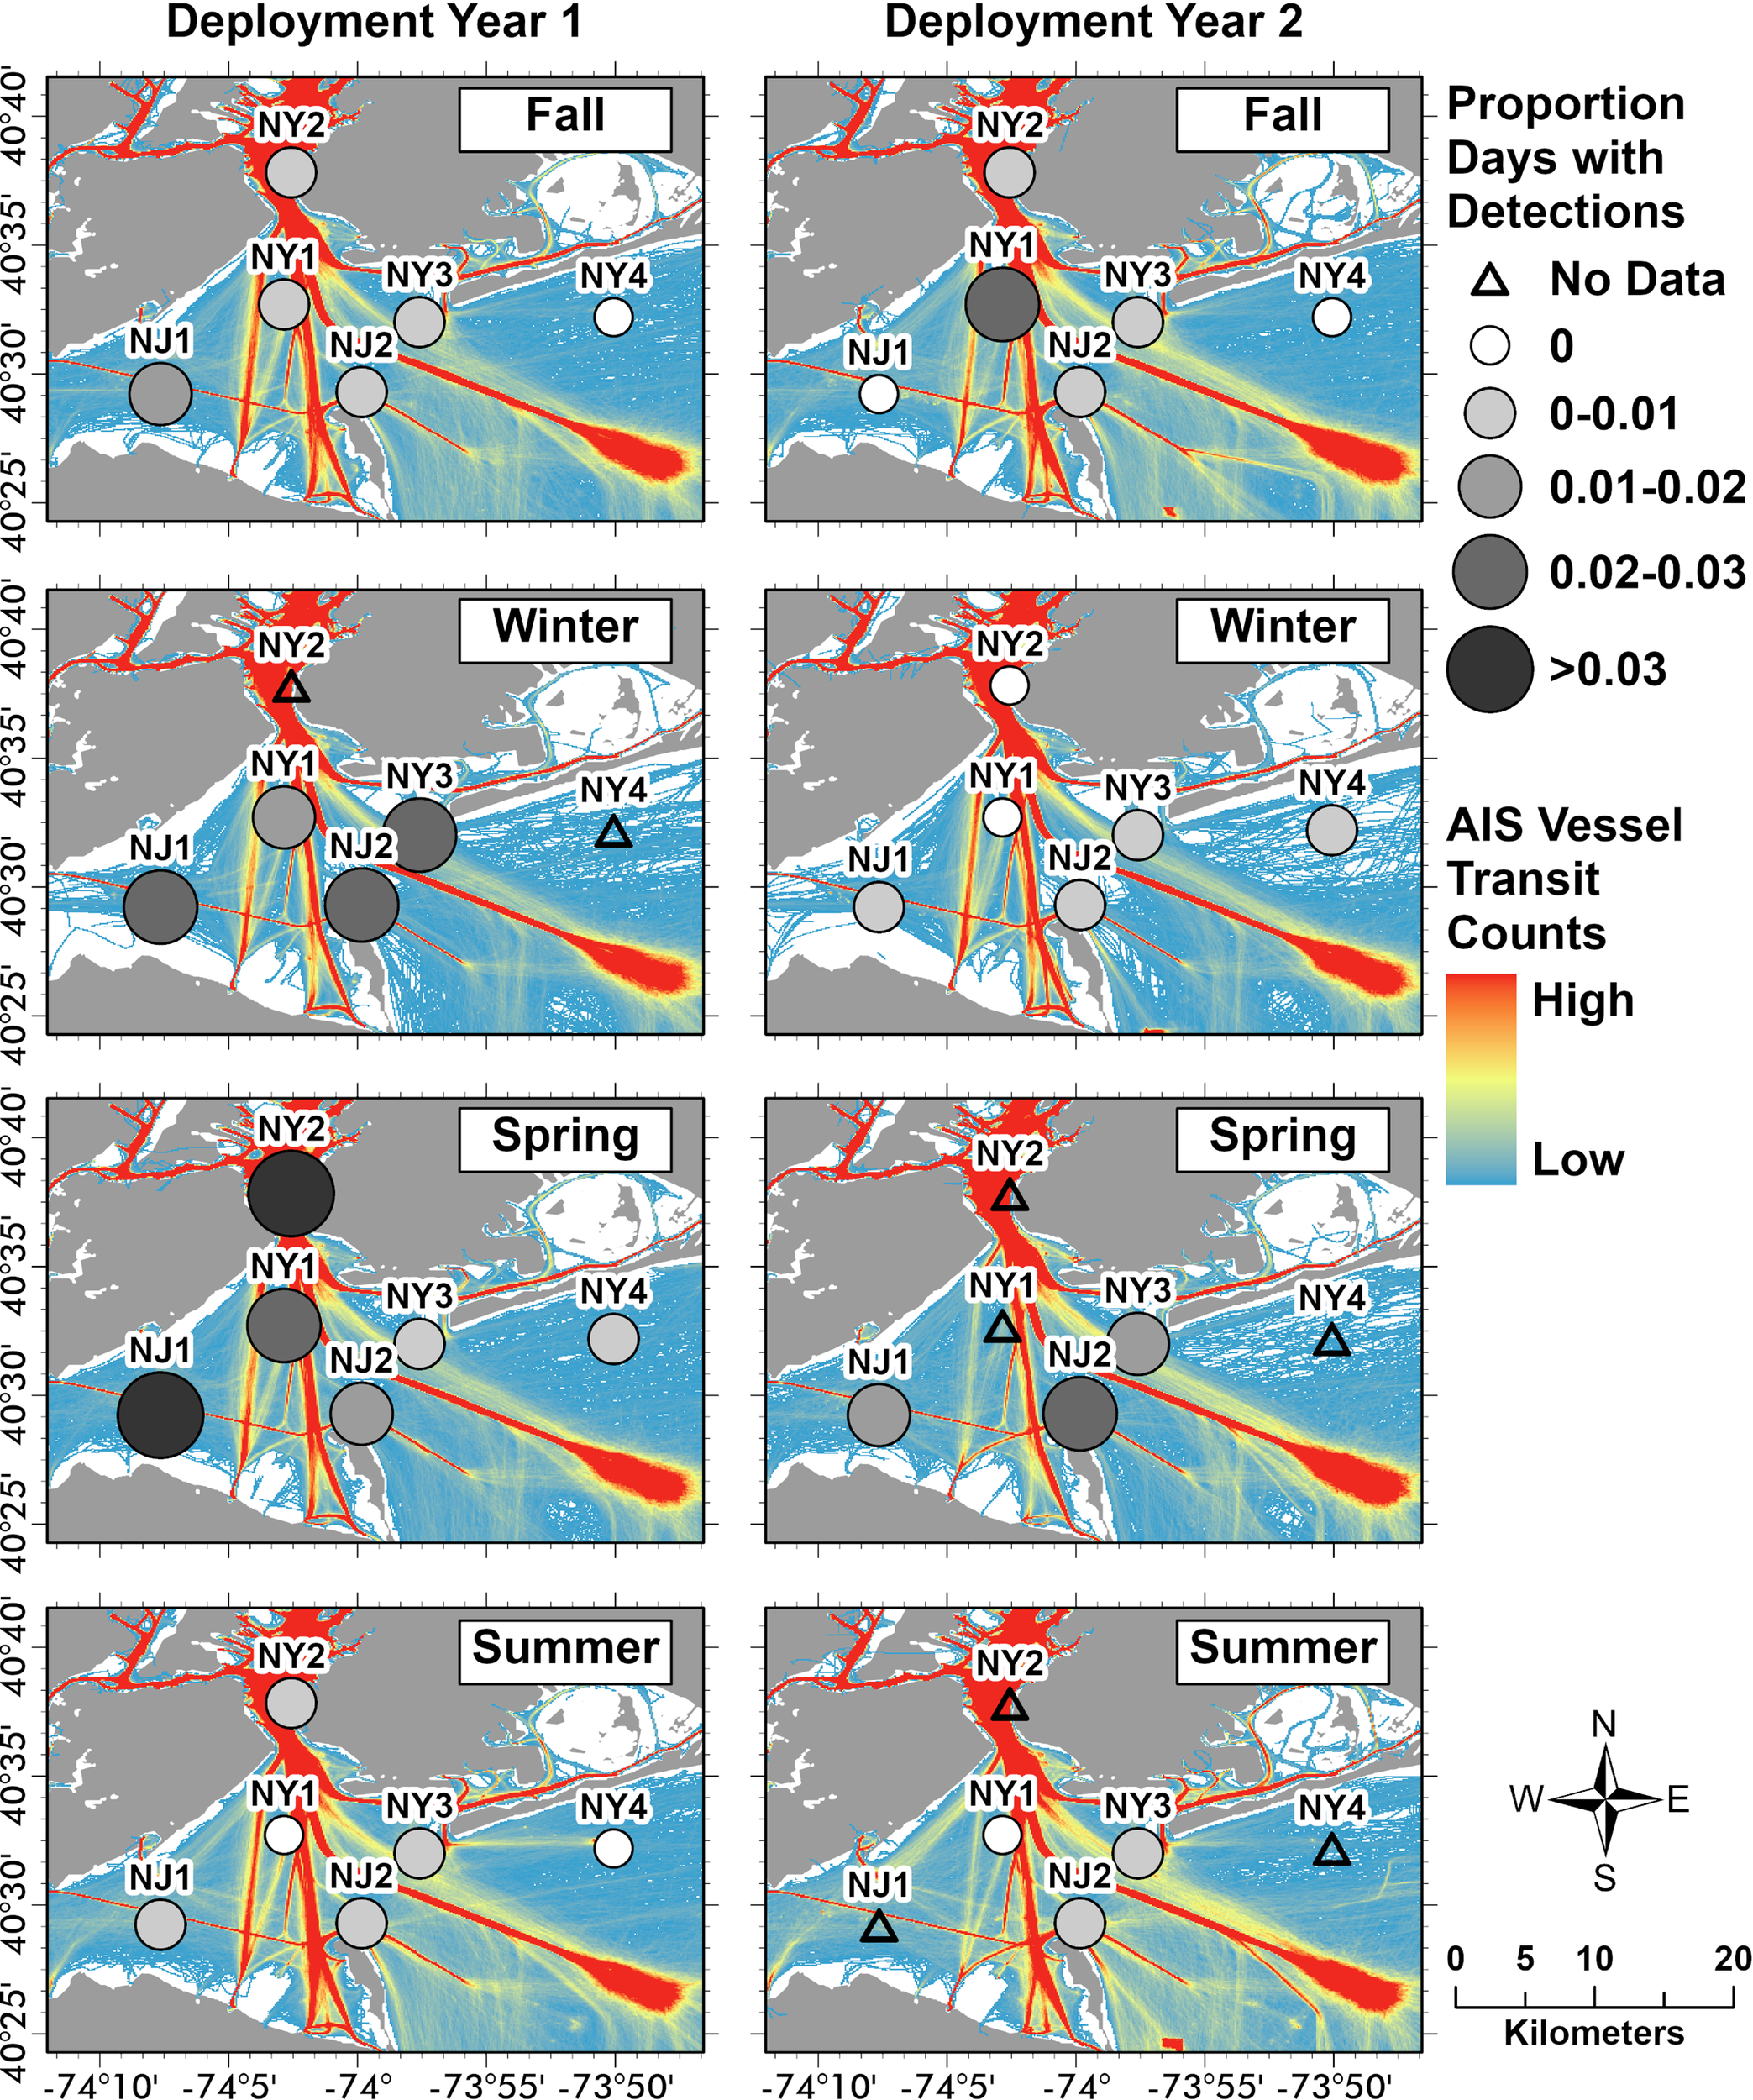
AIS vessel transit counts and the proportion of porpoise positive days (PPD) per season and deployment year. Monthly vessel transit counts based on Automatic Identification Systems (AIS) records from all vessel types were obtained from the Northeast Ocean Data Portal (NROC, 2009). Monthly AIS records included all vessel types and were summarised at a 100 x 100 m cell resolution (Fontenault, 2020a; Fontenault, 2020b; Fontenault, 2021). We summed these monthly vessel transit counts (per 100 x 100 m cell) by season and deployment year (Year 1: October 2018–September 2019; Year 2: October 2019–October 2020) using the raster calculator function in ArcGIS Pro (v. 10.7.1; ESRI, 2021). Seasonal divisions used were as follows: fall (October–November, 2018; September–November, 2019; September–October, 2020), winter (December–February, 2018–2020), spring (March–May, 2019–2020), and summer (June–August, 2019–2020). The seasonal proportions of PPD were standardised using the cumulative total number of recording days from all locations per season and deployment year and using the same seasonal definitions as the AIS data.
4.1 Conservation implications
Prior to this study, there was little known about harbour porpoise presence in the NY-NJ Harbour Estuary. The presence of this acoustically sensitive species in the NY-NJ Harbour Estuary, despite the high level of anthropogenic activity already taking place, may suggest that some individuals are habituating to a high level of disturbance, or that the foraging opportunities in this area outweigh the potential impacts. However, there is little information related to potential impacts to this species from anthropogenic disturbance in such a heavily human dominated area. As one of the busiest waterways along the U.S. East Coast, cetacean species inhabiting waters of the NYB and the NY-NJ Harbour Estuary are facing numerous threats including increasing shipping traffic, increased ocean noise levels, expanding offshore wind development, and climate change (BOEM, 2020; King et al., 2021). Across the broader Northwest Atlantic, and in other areas across their range, harbour porpoises are known to be particularly vulnerable to fisheries bycatch, contaminants, ship traffic, habitat modifications, and offshore wind energy development (Carstensen et al., 2006; Hall et al., 2006; Dähne et al., 2013; Terhune, 2015; Todd et al., 2015; Benjamins et al., 2017; Oakley et al., 2017; NMFS, 2021). Despite these threats, harbour porpoise populations are thought to be stable or even increasing across the greater Atlantic (North Atlantic Marine Mammal Commission (NAMMC) and the Norwegian Institute of Marine Research (NIMR), 2019), which is believed to be due to a reduction in fisheries bycatch pressures (Braulik et al., 2020). However, emerging threats for the Northwest Atlantic, including climate driven shifts in oceanographic conditions (Pershing et al., 2015; Kleisner et al., 2017) and the introduction and rapid expansion of offshore wind energy development in the region (BOEM, 2020), are cause for concern. In other human high-use areas, such as the Baltic Sea, harbour porpoise populations are now critically endangered due to similar anthropogenic pressures (Carlén et al., 2021). The impacts from offshore wind energy development on harbour porpoise populations has been a large focus of studies from Europe (i.e., Dähne et al., 2013; Brandt et al., 2018), however as the offshore wind energy industry is only just beginning off the U.S. East Coast, there is an urgent need for focused studies in this region. Currently, the lack of information on harbour porpoise ecology and habitat use for the Gulf of Maine/Bay of Fundy population (North Atlantic Marine Mammal Commission (NAMMC) and the Norwegian Institute of Marine Research (NIMR), 2019) impedes the development and implementation of effective conservation actions.
The NYB is currently slated for rapid expansion of offshore wind energy development (BOEM, 2020), with wind farm construction commencing within the next few years. It is vital therefore, to establish a baseline understanding of harbour porpoise distribution and habitat use prior to any wind farm construction and/or increased vessel activity to support OSW development. Although the wind energy areas (WEAs) in the NYB will be placed further offshore from the study area, vessel traffic within the NY-NJ Harbour Estuary will likely increase as vessels transit between shore and the WEAs, which in turn may lead to disturbance and contribute to already elevated ocean noise levels. Previous work characterising broadscale ambient noise levels in the NYB found that these waters experienced the highest equivalent sound levels compared to other locations along the eastern seaboard in 2008–2009 (Rice et al., 2014), and these elevated noise levels extend into the NYB apex and NY-NJ Harbour Estuary (Estabrook et al., 2021; WCS unpub. data). Furthermore, there is the potential for one of the cable landing sites to transverse through the NY-NJ Harbour Estuary (Tetra Tech, 2022), which will require significant habitat modification that could lead to displacement. The year-round and seasonal peaks in harbour porpoise presence found in the already heavily human dominated NY-NJ Harbour Estuary provides an important baseline understanding of harbour porpoise distribution in this region. However, further research is warranted both within the NY-NJ Harbour Estuary and the greater NYB, and particularly in relation to the forthcoming offshore wind energy development and expected continuation of climate driven shifts in distribution. In particular, it is imperative that harbour porpoises are considered and incorporated into management and mitigation actions developed in the NYB and greater Northwest Atlantic in the coming years to ensure adequate protection for this vulnerable species.
4.2 Study considerations
The GAMM models were a relatively poor fit to the data, with only ~29% of the deviance explained. This suggests that some of the variability driving harbour porpoise distribution in the NY-NJ Harbour Estuary is due to factors not measured and included in our study. Future studies would likely benefit from the inclusion of prey density or distribution data; however, this information was not available at the spatial (i.e., within the NY-NJ harbour estuary vs. along the coast outside of the estuary) or temporal (i.e., weekly vs. seasonal) scales required to be included in this study. The issue of low deviance explained in modelling cetacean occurrence is also common, particularly at fine temporal scales (Best et al., 2012; Forney et al., 2012; Temple et al., 2016; Wingfield et al., 2017). Wingfield et al. (2017) found that model performance differed between offshore and nearshore sites in Maryland, where offshore models that included SST and chlorophyll-a concentration explained a much higher percentage of the deviance in weekly porpoise occurrence compared to the nearshore models. The authors attributed this model performance variance between the two locations as an indication that the nearshore models were missing important environmental variables influencing harbour porpoise distribution. Tidal parameters were identified as one factor that may help to improve model fit, as has been demonstrated in other studies (Marubini et al., 2009; Embling et al., 2010). Tidal parameters were not included in our models for the NY-NJ Harbour Estuary, primarily because of the weekly time resolution used for the model parameters. Further research in the NY-NJ Harbour Estuary and in the greater NYB would benefit from incorporating additional static and dynamic variables to better understand the factors driving harbour porpoise distribution in the region.
The rate of harbour porpoise detection was relatively low when compared to other regions where harbour porpoises are present (e.g., see Wingfield et al., 2017). A lower detection rate could be due to the fact that the high frequency harbour porpoise clicks tend to only propagate out to approximately 1000 m (Clausen et al., 2011), and the detection range would be vastly reduced in high-noise environments such as those experienced in the NY-NJ Harbour Estuary area (see Rice et al., 2014 for noise levels in the general vicinity). Therefore, if harbour porpoises are foraging in the area, they would only be detectable in close proximity to the recorders, and may therefore be easily missed as the mean distance between recorders was 10.18 km (range: 5.94 – 15.1 km). The presence of harbour porpoise found in this study may therefore be an under-estimate and warrants further study. Clausen et al. (2019) found that high ambient noise levels affected click detection function for different recorder types, although broadband recorders, like that used in this study, were least affected. While there may be fewer missed detections, there is a greater risk of false positive detections by broadband recorders (Clausen et al., 2019). However, we used conservative click detection parameters to help minimize the issue of false positive detections as well as manually verifying porpoise clicks. Further research, perhaps using additional recorders placed in the high use areas identified (i.e., NJ1 and NJ2), and even in combination with the more conservative C-POD technology used widely to study harbour porpoise in other areas (i.e. Clausen et al., 2019), would be beneficial to further understand harbour porpoise presence in the NY-NJ Harbour Estuary and surrounding area.
4.3 Conclusion
This study provides important baseline information about the temporal and spatial variability in harbour porpoise distribution and interaction with environmental variables in the human-dominated NY-NJ Harbour Estuary. Given there are already a range of potential threats to harbour porpoises in the area, this data is vital for informing marine spatial planning and conservation strategies, particularly in light of the increasing anthropogenic pressures this region is facing from offshore wind energy development and increasing shipping (BOEM, 2020). Harbour porpoises are known to be vulnerable to anthropogenic disturbance and therefore continued and expanded monitoring of harbour porpoise presence and habitat use will be critical for effective conservation efforts moving forward. This not only applies to our study area, but also the greater NYB and Mid-Atlantic region, as more information about this cryptic species is needed in light of the expected shifts in distribution with a changing climate (Nye et al., 2009; Pinsky et al., 2020).
Statements
Data availability statement
The dataset used to model harbour porpoise presence in relation to environmental variables has been added to Dryad. Dataset unique identifier: doi: 10.5061/dryad.31zcrjdn3.
Ethics statement
This manuscript does not include any studies or research performed by the authors that involved direct contact with animals. The research contained herein was a passive acoustic monitoring study and therefore no animals were directly encountered. A research permit to deploy the acoustic recorders was obtained from the United States Army Corps of Engineers (Permit no. NAN-2018-00708-EME).
Author contributions
MR and HR conceived of and designed the study; MR coordinated the study; MR, HR, CK-N, and ST collected the data; MR, CK-N, SS, and ST analysed the data; and MR wrote the manuscript. All co-authors edited the manuscript, gave final approval for publication and agree to be held accountable for the work performed therein. All authors contributed to the article and approved the submitted version.
Funding
This study was supported by a grant to the Wildlife Conservation Society from the Hudson River Foundation (Grant Number 001/17E).
Acknowledgments
We gratefully appreciate the generous support of the Hudson River Foundation, NY-NJ Harbour and Estuary Program, and the Tibor T. Polgar Fellowship. We are thankful for all the efforts and contributions of the following individuals that helped make this project a success: Dennis Suszkowski, Jim Lodge, Rob Pirani, Clay Hiles, Helena Andreyko, Anita Murray, Emily Chou, Kristi Collum, Stephanie Adamczak, Emily Strickland, Jon Dohlin, Joe Gessert, Shane Paradis, the New York Aquarium Dive Team volunteers, the New York Seascape Team, Jim Miller, Joe DePalma, John McMurray, and Dana Tricarico. Finally, we would like to thank Emily Chou and reviewers for their efforts editing the manuscript.
Conflict of interest
The authors declare that the research was conducted in the absence of any commercial or financial relationships that could be construed as a potential conflict of interest.
Publisher’s note
All claims expressed in this article are solely those of the authors and do not necessarily represent those of their affiliated organizations, or those of the publisher, the editors and the reviewers. Any product that may be evaluated in this article, or claim that may be made by its manufacturer, is not guaranteed or endorsed by the publisher.
References
1
Ahonen H. Stafford K. M. Lydersen C. Berchok C. L. Moore S. E. Kovacs K. M. (2021). Interannual variability in acoustic detection of blue and fin whale calls in the Northeast Atlantic High Arctic between 2008 and 2018. End Spec Res.45, 209–224. doi: 10.3354/esr01132
2
Alonso M. S. Nuuttila H. K. (2014). Detection rates of wild harbour porpoises and bottlenose dolphins using static acoustic click loggers vary with depth. Bioacoustics24 (2), 101–110. doi: 10.1080/09524622.2014.980319
3
Andreasen H. Ross S. D. Siebert U. Andersen N. G. Ronnenberg K. Gilles A. (2017). Diet composition and food consumption rate of harbor porpoises (Phocoena phocoena) in the western Baltic Sea. Mar. Mamm Sci.33 (4), 1053–1079. doi: 10.1111/mms.12421
4
Balcom P. H. Hammerschmidt C. R. Fitzgerald W. F. Lamborg C. H. O’Connor J. (2008). Seasonal distributions and cycling of mercury and methylmercury in the waters of New York/New Jersey harbor estuary. Mar. Chem.109, 1–17. doi: 10.1016/j.marchem.2007.09.005
5
Benjamins S. Van Geel N. Hastie G. Elliot J. Wilson B. (2017). Harbour porpoise distribution can vary at small spatiotemporal scales in energetic habitats. Deep-Sea Res. II141, 191–202. doi: 10.1016/j.dsr2.2016.07.002
6
Best B. D. Halpin P. N. Read A. J. Fujioka E. Good C. P. LaBrecque E. A. et al . (2012). Online cetacean habitat modelling system for the US east coast and gulf of Mexico. Endang Species Res.18, 1–15. doi: 10.3354/esr00430
7
Bjørge A. Tolley K. A. (2018). Encyclopedia of marine mammals. 3 ed. Eds. WürsigB. J. G. M.ThewissenK. M.Kovacs (Cambridge, Massachusetts: Academic Press), 448–451, ISBN: 9780128043271.
8
BOEM . (2020). New York bight. Available at: https://www.boem.gov/renewable-energy/state-activities/new-york-bight (Accessed 2021 July 1).
9
Booth C. G. (2020). Food for thought: harbor porpoise foraging behaviour and diet inform vulnerability to disturbance. Mar. Mamm Sci.36 (1), 195–208. doi: 10.1111/mms.12632
10
Brandt M. J. Dragon A. C. Diederichs A. Bellmann M. A. Wahl V. Piper W. et al . (2018). Disturbance of harbour porpoises during construction of the first seven offshore wind farms in Germany. Mar. Ecol. Prog. Ser.596, 213–232. doi: 10.3354/meps12560
11
Braulik G. Minton G. Amano M. Bjørge A. (2020). “Phocoena phocoena,” in The IUCN red list of threatened species, 2020, e.T17027A50369903. doi: 10.2305/IUCN.UK.2020-2.RLTS.T17027A50369903.en
12
Bursac Z. Gauss C. H. Williams D. K. Hosmer D. W. (2008). Purposeful selection of variables in logistic regression. Source Code Biol. Med.3, 17. doi: 10.1186/1751-0473-3-17
13
Carlén I. Nunny L. Simmonds M. P. (2021). Out of sight, out of mind: how conservation is failing European porpoises. Front. Mar. Sci.8. doi: 10.3389/fmars.2021.617478
14
Carstensen J. Henriksen O. D. Teilmann J. (2006). Impacts of offshore wind farm construction on harbour porpoises: acoustic monitoring of echolocation activity using porpoise detectors (T-PODS). Mar. Ecol. Prog. Ser.321, 295–308. doi: 10.3354/meps321295
15
Clausen K. T. Tougaard K. Carstensen J. Delefosse M. Teilmann J. (2019). Noise affects porpoise click detections - the magnitude of the effect depends on logger type and detection filter settings. Bioacoustics28 (5), 443–458. doi: 10.1080/09524622.2018.1477071
16
Clausen K. T. Wahlberg M. Beedholm K. Deruiter S. Madsen P. T. (2011). Click communication in harbour porpoises Phocoena phocoena. Bioacoustics20 (1), 1–28. doi: 10.1080/09524622.2011.9753630
17
Cosentino M. Guarato F. Tougaard J. Nairn D. Jackson J. C. Windmill J. (2019). Porpoise click classifier (PorCC): a high-accuracy classifier to study harbor porpoises (Phocoena phocoena) in the wild. J. Acoust Soc.145, 3427–3434. doi: 10.1121/1.5110908
18
Curtice C. Cleary J. Schumenchia E. Halpin P. N. (2019). Marine-life data and analysis team (MDAT) technical report on the methods and development of marine-life data to support regional ocean planning and management (Durham, North Carolina: Prepared on behalf of the Marine-life Data and Analysis Team (MDAT). Available at: https://seamap.env.duke.edu/models/mdat/MDAT-Technical-Report.pdf.
19
Dähne M. Gilles A. Lucke K. Peschko V. Adler S. Krugel K. et al . (2013). Effects of pile-driving on harbor porpoises (Phocoena phocoena) at the first offshore wind farm in Germany. Environ. Res. Lett.8, 1–15. doi: 10.1088/1748-9326/8/2/025002
20
Embling C. B. Gillibrand P. A. Gordon J. Shrimpton J. Stevick P. T. Hammond P. S. (2010). Using habitat models to identify suitable sites for marine protected areas for harbour porpoises (Phocoena phocoena). Biol. Conserv.143 (2), 267–279. doi: 10.1016/j.biocon.2009.09.005
21
Erbe C. Marley S. A. Schoeman R. P. Smith J. N. Trigg L. E. Embling C. B. (2019). The effects of ship noise on marine mammals – a review. Front. Mar. Sci.6. doi: 10.3389/fmars.2019.00606
22
ESRI . (2021). ArcGIS pro: release 10.7.1 (Redlands, California: Environmental Systems Research Institute).
23
Estabrook B. J. Hodge K. B. Salisbury D. P. Rahaman A. Ponirakis D. Harris D. V. et al . (2021). Final Report for New York Bight Whale Monitoring Passive Acoustic Surveys October 2017-October 2020. Contract C009925, (East Setauket, NY: New York State Department of Environmental Conservation).
24
Fontenault J. (2020a). All monthly vessel transit counts from – 2018 AIS Northeast and mid-Atlantic United States. Available at: https://www.northeastoceandata.org/files/metadata/Themes/AIS/AllAISVesselTransitCounts2018_Monthly.pdf.
25
Fontenault J. (2020b). All monthly vessel transit counts from – 2019 AIS Northeast and mid-Atlantic United States. Available at: https://www.northeastoceandata.org/files/metadata/Themes/AIS/AllAISVesselTransitCounts2019_Monthly.pdf.
26
Fontenault J. (2021). All monthly vessel transit counts from – 2020 AIS Northeast and mid-Atlantic United States. Available at: https://www.northeastoceandata.org/files/metadata/Themes/AIS/AllAISVesselTransitCounts2020_Monthly.pdf.
27
Forney K. A. Ferguson M. C. Becker E. A. Fiedler P. C. Redfern J. V. Barlow J. et al . (2012). Habitat-based spatial models of cetacean density in the eastern Pacific Ocean. Endang Species Res.16, 113–133. doi: 10.3354/esr00393
28
Gaskin D. E. (1984). Harbor porpoise, Phocoena phocoena (L.): regional populations, status and information on direct and indirect catches. Rep. Int. Whal. Comm.34, 569–586.
29
Gaskin D. E. (1992). The status of the harbor porpoise, Phocoena phocoena in Canada. Can. Field-Nat106, 36–54.
30
Gilles A. Adler S. Kaschner K. Scheidat M. Siebert U. (2011). Modelling harbour porpoise seasonal density as a function of the German bight environment: implications for management. End Spec Res.14, 157–169. doi: 10.3354/esr00344
31
Gilles A. Viquerat S. Becker E. A. Forney K. A. Geelhoed S. C. V. Haelters J. et al . (2016). Seasonal habitat-based density models for a marine top predator, the harbor porpoise, in a dynamic environment. Ecosphere7 (6), e01367. doi: 10.1002/ecs2.1367
32
Gillespie D. Mellinger D. Gordon J. Mclaren D. Redmond P. McHugh R. et al . (2009). PAMGUARD: semiautomated, open source software for real-time acoustic detection and localization of cetaceans. J. Acoust Soc. Am.30, 54–62. doi: 10.1121/1.4808713
33
Glenn S. Arnone R. Bergmann T. Bissett P. W. Crowley M. Cullen J. T. et al . (2004). Biogeochemical impact of summertime coastal upwelling on the New Jersey shelf. J. Geophys Res. Oceans109 (12), 1–15. doi: 10.1029/2003JC002265
34
Graham I. M. Merchant N. D. Farcas A. Barton T. R. Cheney B. Bono S. et al . (2019). Harbour porpoise responses to pile-driving diminish over time. R Soc. Open Sci.6 (6), 190335. doi: 10.1098/rsos.190335
35
Hall A. J. Hugunin K. Deaville R. Law R. J. Allchin C. R. Jepson P. D. (2006). The risk of infection from polychlorinates biphenyl exposure in the harbor porpoise (Phocoena phocoena): a case-control approach. Environ. Health Perspect.114 (5), 704–711. doi: 10.1289/ehp.8222
36
Hammond P. S. Berggren P. Benke H. Borchers D. L. Collet A. Heide-Jorgensen M. P. et al . (2002). Abundance of harbour porpoise and other cetaceans in the North Sea and adjacent waters. J. Appl. Ecol.39, 361–376. doi: 10.1046/j.1365-2664.2002.00713.x
37
Heide-Jorgenson M. P. Iversen M. Nielsen N. H. Lockyer C. Stern H. Ribergaard M. H. (2011). Harbour porpoises respond to climate change. Ecol. Evol.1, 579–585. doi: 10.1002/ece3.51
38
Heim K. C. Thorne L. H. Warren J. D. Link J. S. Nye J. A. (2021). Marine ecosystem indicators are sensitive to ecosystem boundaries and spatial scale. Ecol. Indic.125, 107522. doi: 10.1016/j.ecolind.2021.107522
39
Hiltunen K. H. (2006). “Mixed-stock analysis of harbor porpoise (Phocoena phocoena) along the U.S. mid-Atlantic coast using microsatellite DNA markers. [M.S. Thesis]. (Charleston, South Carolina: The College of Charleston), 92pp.
40
Hoekendijk J. P. A. Spitz J. Read A. J. Leopold M. F. Fontaine M. C. (2017). Resilience of harbor porpoises to anthropogenic disturbance: must they really feed continuously? Mar. Mamm Sci.34 (1), 258–264. doi: 10.1111/mms.12446
41
Isojunno S. Matthiopooulos J. Evans P. G. H. (2012). Harbour porpoise habitat preferences: robust spatio-temporal inferences from opportunistic data. Mar. Ecol. Prog. Ser.448, 155–170. doi: 10.3354/meps09415
42
Johnston D. W. (1995). Spatial and temporal differences in heavy metal concentrations in the tissues of harbor porpoises (Phocoena phocoena l.) from the western north Atlantic. [M.S. Thesis]. (Guelph, Ontario, Canada: University of Guelph), 152.
43
Johnston D. W. Westgate A. J. Read A. G. (2005). Effects of fine-scale oceanographic features on the distribution and movements of harbour porpoises phocoena phocoena in the bay of fundy. Mar. Ecol. Prog. Ser.295, 279–293. doi: 10.3354/meps295279
44
Kastelein R. A. Hardeman J. Boer H. (1997). “Food consumption and body weight of harbour porpoises (Phocoena phocoena),” in The biology of the harbour porpoise. Eds. ReadA. J.WiepkemaP. R.NachtigallP. E. (Woerden, Netherlands: De Spil Publishers), 217–233.
45
King C. D. Chou E. Rekdahl M. L. Trabue S. G. Rosenbaum H. C. (2021). Baleen whale distribution, behaviour and overlap with anthropogenic activity in coastal regions of the New York bight. Mar. Biol. Res.17 (4), 320–400. doi: 10.1080/17451000.2021.1967993
46
Kleisner K. Fogarty M. Mcgee S. Hare J. Morét S. Perretti C. et al . (2017). Marine species distribution shifts on the U.S. Northeast Continental Shelf under continued ocean warming. Prog. Oceanogr.153 (5), 24–36. doi: 10.1016/j.pocean.2017.04.001
47
Linnenschmidt M. Kloepper L. N. Wahlberg M. Nachtigall P. E. (2012). Stereotypical rapid source level regulation in the harbor porpoise biosonar. Naturwissenschaften99, 767–771. doi: 10.1007/s00114-012-0948-7
48
Marubini F. Gimona A. Evans P. G. H. Wright P. J. Pierce G. J. (2009). Habitat preferences and interannual variability in occurrence of the harbour porpoise Phocoena phocoena off northwest Scotland. Mar. Ecol. Prog. Ser.381, 297–310. doi: 10.3354/meps07893
49
Muirhead C. A. Warde A. M. Biedron I. S. Mihnovets A. N. Clark C. W. Rice A. N. (2018). Seasonal acoustic occurrence of blue, fin, and North Atlantic right whales in the New York bight. Aquat Conserv: Mar. Freshw. Ecosyst.28 (3), 744–753. doi: 10.1002/aqc.2874
50
Murphy S. C. Nazzaro L. J. Simkins J. Oliver M. J. Kohut J. Crowley M. et al . (2021). Persistent upwelling in the mid-Atlantic bight detected using gap-filled, high-resolution satellite SST. Remote Sens Environ.262, 112487. doi: 10.1016/j.rse.2021.112487
51
Nabe-Nielsen J. van Beest F. M. Grimm V. Sibly R. M. Teilmann J. Thompson P. M. (2018). Predicting the impacts of anthropogenic disturbance on marine populations. Conserv. Lett.11 (5), e12563. doi: 10.1111/conl.12563
52
Nachtsheim D. A. Viquerat S. Ramírez-Martínez N. C. Unger B. Siebert U. Gilles A. (2021). Small cetacean in a human high-use area: trends in harbor porpoise abundance in the North Sea over two decades. Front. Mar. Sci.7. doi: 10.3389/fmars.2020.606609
53
New York State Department of Environment and Conservation (NYSDEC) Species of Greatest Conservation Need (SGCN) . (2013). Species status assessment report for New York. Available at: https://www.dec.ny.gov/docs/wildlife_pdf/hpsgcnwhales.pdf.
54
Nielsen N. H. Teilmann J. Sveegaard S. Hansen R. G. Sinding M. H. S. Dietz R. et al . (2018). Oceanic movements, site fidelity and deep diving behavior in harbor porpoises from Greenland show limited similarities to animals from the North Sea. Mar. Ecol. Prog. Ser.597, 259–272. doi: 10.3354/meps12588
55
NMFS . (2013). Marine mammal stock assessment reports. Available at: https://www.fisheries.noaa.gov/national/marine-mammal-protection/marine-mammal-stock-assessment-reports-species-stock#cetaceans—porpoises.
56
NMFS . (2021). Marine mammal stock assessment reports. Available at: https://www.fisheries.noaa.gov/national/marine-mammal-protection/marine-mammal-stock-assessment-reports-species-stock#cetaceans—porpoises.
57
North Atlantic Marine Mammal Commission (NAMMC) and the Norwegian Institute of Marine Research (NIMR) . (2019). Report of joint IMR/NAMMCO international workshop on the status of harbour porpoises in the North Atlantic. (Tromsø, Norway: North Atlantic Marine Mammal Commission). Available at: https://nammco.no/wp-content/uploads/2020/03/final-report_hpws_2018_rev2020.pdf.
58
Northeast Regional Ocean Council (NROC) . (2009). Northeast Ocean Data Portal. Available at: https://www.northeastoceandata.org. Date accessed: 06/03/2023.
59
Nye J. A. Link J. S. Hare J. A. Overholtz W. J. (2009). Changing spatial distribution of fish stocks in relation to climate and population size on the Northeast United States continental shelf. Mar. Ecol. Prog. Ser.393, 111–129. doi: 10.3354/meps08220
60
Oakley J. A. Williams A. T. Thomas T. (2017). Reactions of harbor porpoise (Phocoena phocoena) to vessel traffic in the coastal waters of South West Wales, UK. Ocean Coast. Manag138, 158–169. doi: 10.1016/j.ocecoaman.2017.01.003
61
Ocean Instruments . (2021). SoundTrap ST300 and ST400 series user guide. Available at: http://www.oceaninstruments.co.nz/wp-content/uploads/2015/04/ST-User-Guide.pdf.
62
Pedersen E. J. Miller D. L. Simpson G. L. Ross N. (2019). Hierarchical generalized additive models in ecology: an introduction with mgcv. PeerJ7, e6876. doi: 10.7717/peerj.6876
63
Pérez-Jorge S. Tobeña M. Prieto R. Vandeperre F. Calmettes B. Lehodey P. et al . (2020). Environmental drivers of large-scale movements of baleen whales in the mid-North Atlantic Ocean. Divers. Distrib.26, 683–698. doi: 10.1111/ddi.13038
64
Pershing A. J. Alexander M. A. Hernandez C. M. Kerr L. A. Le Bris A. Mills K. E. et al . (2015). Slow adaptation in the face of rapid warming leads to collapse of the gulf of Maine cod fishery. Science350 (6262), 809–812. doi: 10.1126/science.aac9819
65
Pinsky M. L. Selden R. L. Kitchel Z. J. (2020). Climate-driven shifts in marine species ranges: scaling from organisms to communities. Ann. Rev. Mar. Sci.12, 153–179. doi: 10.1146/annurev-marine-010419-010916
66
Pirani R. Stinnette I. Da Silva R. Lerman-Sinkoff S. Lodge J. Giudicelli A. et al . (2018). NY-NJ harbor & estuary program action agenda 2017-2022 (New York, NY: Hudson River Foundation).
67
Polacheck T. Wenzel F. W. Early G. (1995). What do stranding data say about harbor porpoises (Phocoena phocoena)? Rep. Int. Whal. Comm., SC/42/SM39 169–179.
68
R Core Team . (2021). R: a language and environment for statistical computing (Vienna, Austria: R Foundation for Statistical Computing). Available at: https://www.R-project.org/.
69
Read A. J. Hohn A. A. (1995). Life in the fast lane: the life history of harbor porpoises from the gulf of Maine. Mar. Mamm. Sci.11 (4), 423–440. doi: 10.1111/j.1748-7692.1995.tb00667.x
70
Read A. J. Westgate A. J. (1997). Monitoring the movements of harbor porpoise (Phocoena phocoena) with satellite telemetry. Mar. Biol.130, 315–322. doi: 10.1007/s002270050251
71
Recchia C. A. Read A. J. (1989). Stomach contents of harbour porpoises (Phocoena phocoena (L.)) from the bay of fundy. Can. J. Zool67, 2140–2146. doi: 10.1139/z89-304
72
Rice A. N. Tielens J. T. Estabrook B. J. Muirhead C. A. Rahaman A. Guerra M. et al . (2014). Variation in ocean acoustic environments along the western North Atlantic coast: a case study in context of the right whale migration route. Ecol. Inform21, 89–99. doi: 10.1016/j.ecoinf.2014.01.005
73
Roberts J. J. Best B. D. Mannocci L. Fujioka E. Halpin P. N. Palka D. L. et al . (2016). Habitat-based cetacean density models for the U.S. Atlantic and gulf of Mexico. Sci. Rep.6, 22615. doi: 10.1038/srep22615
74
Rosel P. E. France S. C. Wang J. Y. Kocher T. D. (1999). Genetic structure of harbor porpoise phocoena phocoena in the northwest Atlantic based on mitochondrial and nuclear markers. Mol. Ecol.8, S41–S54. doi: 10.1046/j.1365-294x.1999.00758.x
75
Sadove S. S. Cardinale P. (1993). Species composition and distribution of marine mammals and sea turtles in the New York Bight (Hampton Bays, New York: Okeanos Ocean Research Foundation).
76
Santos M. B. Pierce G. J. Learmonth J. A. Reid R. J. Ross H. M. Patterson I. A. P. et al . (2004). Variability in the diet of harbor porpoises (Phocoena phocoena) in Scottish waters 1992-2003. Mar. Mamm Sci.20, 1–27. doi: 10.1111/j.1748-7692.2004.tb01138.x
77
Scheidat M. Tougaard J. Brasseur S. Carstensen J. Van Polanen Petel T. Teilmann J. et al . (2011). Harbour porpoises (Phocoena phocoena) and wind farms: a case study in the Dutch North Sea. Environ. Res. Lett.6, 1–10. doi: 10.1088/1748-9326/6/2/025102
78
Smith G. J. Gaskin D. E. (1974). The diet of harbor porpoises (Phocoena phocoena (L.)) in coastal waters of eastern Canada, with special reference to the Bay of Fundy. Can. J. Zool52, 777–782. doi: 10.1139/z74-102
79
Soldevilla M. S. Wiggins S. M. Hildebrand J. A. Oleson E. M. Ferguson M. C. (2011). Risso’s and pacific white-sided dolphin habitat modeling from passive acoustic monitoring. Mar. Ecol. Prog. Ser.423, 247–260. doi: 10.3354/meps08927
80
Spitz J. Trites A. W. Becquet V. Brind’Amour A. Cherel Y. Galois R. et al . (2012). Cost of living dictates what whales, dolphins and porpoises eat: the importance of prey quality on predator foraging strategies. PLoS One7 (11), e50096. doi: 10.1371/journal.pone.0050096
81
Stalder D. van Beest F. M. Sveegaard S. Dietz R. Teilmann J. Nabe-Nielsen J. (2020). Influence of environmental variability on harbour porpoise movement. Mar. Ecol. Prog. Ser.648, 207–219. doi: 10.3354/meps13412
82
Sveegaard S. Nabe-Nielsen J. Stæhr K. J. Jensen T. F. Mouritsen K. N. Teilmann J. (2012). Spatial interactions between marine predators and their prey: herring abundance as a driver for the distributions of mackerel and harbour porpoise. Mar. Ecol. Prog. Ser.468, 245–253. doi: 10.3354/meps09959
83
Taillie D. M. O’Neil J. M. Dennison W. C. (2020). Water quality gradients and trends in New York harbor. Reg. Stud. Mar. Sci.33, 100922. doi: 10.1016/j.rsma.2019.100922
84
Teilmann J. (2000). The behavior and sensory abilities of harbor porpoises (Phocoena phocoena) in relation to bycatch in Danish gillnet fishery. [PhD Thesis]. (Odense, Denmark: University of Southern Denmark), 219.
85
Temple A. J. Tregenza N. Amir O. A. Jiddawi N. Berggren P. (2016). Spatial and temporal variations in the occurrence and foraging activity of coastal dolphins in Menai Bay, Zanzibar, Tanzania. PLoS One11 (3), e0148995. doi: 10.1371/journal.pone.0148995
86
Terhune J. (2015). “Harbor porpoise presence near oil tankers,” in Proceedings of the acoustics week in Canada (Canada: Canadian Acoustical Association), vol. 43. Available at: https://jcaa.caa-aca.ca/index.php/jcaa/article/view/2755.
87
Tetra Tech . (2022). “Empire Offshore Wind: Empire Wind Project (EW1 and EW2) Construction and Operations Plan Volume 1: Project Information.,” Report prepared for Equinor (Washington, District of Columbia: Bureau of Ocean Energy Management). Available at: https://www.boem.gov/renewable-energy/public-eow-cop-volume-1.
88
Thorne L. F. Foley H. J. Baird R. W. Webster D. L. Swaim Z. T. Read A. J. (2017). Movement and foraging behavior of short-finned pilot whales in the mid-Atlantic bight: importance of bathymetric features and implications for management. Mar. Ecol. Prog. Ser.584, 245–257. doi: 10.3354/meps12371
89
Todd V. L. G. Todd I. B. Gardiner J. C. Morrin E. C. N. MacPherson N. A. DiMarzio N. A. et al . (2015). A review of impacts on marine dredging activities on marine mammals. ICES J. Mar. Sci.72 (2), 328–340. doi: 10.1093/icesjms/fsu187
90
Torres L. G. Read A. J. Halpin P. (2008). Fine-scale habitat modeling of a top marine predator: do prey data improve predictive capacity? Ecol. Appl.18, 1702–1717. doi: 10.1890/07-1455.1
91
Trabue S. G. Rekdahl M. L. King C. D. Strindberg S. Adamczak S. K. Rosenbaum H. C. (2022). Spatiotemporal trends in bottlenose dolphin foraging behavior and relationship to environmental variables in a highly urbanized estuary. Mar. Ecol. Prog. Ser.690, 219–235. doi: 10.3354/meps14041
92
Tweedie M. C. K. (1984). “An index which distinguishes between some important exponential families,” in Statistics: Applications and New Directions. Proceedings of the Indian Statistical Institute Golden Jubilee International Conference. Eds. GhoshJ. K.RoyJ. (Calcutta: Indian Statistical Institute), 579–604.
93
USACE . (2015). Demersel fish assemblages of New York/New Jersey harbor and near-shore fish communities of New York Bight. report for the New York and New Jersey harbor deepening project. Available at: https://www.nan.usace.army.mil/Portals/37/docs/harbor/Biological%20and%20Physical%20Monitoring/ABS%20Multiple%20Summary%20Reports/NYD_ABS_Demersal_Fish_Assemblages_FINAL_14October2015_V2GraphicUpdate.pdf.
94
Waldman J. R. Lake T. Schmidt R. E. (2006). “Biodiversity and zoogeography of the fishes of the Hudson river watershed and estuary,” in Hudson River fishes and their environment. Eds. WaldmanJ.LimburgK.StrayerD. (Bethesda, Maryland: American Fisheries Society) 51, 129–150.
95
Wang J. Y. Gaskin D. E. White B. N. (1996). Mitochondrial DNA analysis of the harbor porpoise, (Phocoena phocoena), subpopulations in North American waters. Can. J. Fish Aquat Sci.53, 1632–1645. doi: 10.1139/f96-095
96
Westgate A. J. Muir D. C. G. Gaskin D. E. Kingsley M. C. S. (1997). Concentrations and accumulation patterns of organochlorine contaminants in the blubber of harbor porpoises, Phocoena phocoena, from the coast of Newfoundland, the Gulf of St. Lawrence, and the Bay of Fundy/Gulf of Maine. Envir pollut.95, 105–119. doi: 10.1016/s0269-7491(96)00073-5
97
Westgate A. J. Tolley K. A. (1999). Geographical differences in organochlorine contaminants in harbor porpoises Phocoena phocoena from the Western North Atlantic. Mar. Ecol. Prog. Ser.177, 255–268. doi: 10.3354/meps177255
98
Wingfield J. E. O’Brien M. Lyubchich V. Roberts J. J. Halpin P. H. Rice A. N. et al . (2017). Year-round spatiotemporal distribution of harbour porpoises within and around the Maryland wind energy area. PLoS One12 (5), e0176653. doi: 10.1371/journal.pone.0176653
99
Wisniewska D. M. Johnson M. Teilmann J. Rojano-Doñate L. Shearer J. Sveegaard S. et al . (2016). Ultra-high foraging rates of harbor porpoises make them vulnerable to anthropogenic disturbance. Curr. Biol.26, 1–6. doi: 10.1016/j.cub.2016.03.069
100
Wisniewska D. M. Johnson M Teilmann J. Siebert U. Galatius A. Dietz R. Madsen P. T. (2018). High rates of vessel noise disrupt foraging behavior in wild harbor porpoises (Phocoena phocoena). Proc. R Soc. B285, 20172314. doi: 10.1098/rspb.2017.2314
101
Wolanski E. Hammer W. M. (1988). Topographically controlled fronts in the ocean and their biological influence. Science241, 177–181. doi: 10.1126/science.241.4862.177
102
Wood S. (2021). Mixed GAM computation vehicle with automatic smoothness estimation. Available at: https://cran.r-project.org/web/packages/mgcv/mgcv.pdf.
103
Wood S. N. Pya N. Säfken B. (2016). Smoothing parameter and model selection for general smooth models. J. Am. Stat. Assoc.111, 1548–1563. doi: 10.1080/01621459.2016.1180986
Summary
Keywords
harbour porpoise, Phocoena phocoena , passive acoustic monitoring, urban ecology, New York Bight
Citation
Rekdahl ML, Trabue SG, King-Nolan CD, Strindberg S and Rosenbaum HC (2023) Hardly seen, often heard: acoustic presence of harbour porpoises (Phocoena phocoena) in one of the most urbanised estuaries in the world. Front. Mar. Sci. 10:1167945. doi: 10.3389/fmars.2023.1167945
Received
17 February 2023
Accepted
21 June 2023
Published
20 July 2023
Volume
10 - 2023
Edited by
Molly E. Lutcavage, University of Massachusetts Boston, United States
Reviewed by
Roberto Carlucci, University of Bari Aldo Moro, Italy; Scott D. Kraus, New England Aquarium, United States
Updates
Copyright
© 2023 Rekdahl, Trabue, King-Nolan, Strindberg and Rosenbaum.
This is an open-access article distributed under the terms of the Creative Commons Attribution License (CC BY). The use, distribution or reproduction in other forums is permitted, provided the original author(s) and the copyright owner(s) are credited and that the original publication in this journal is cited, in accordance with accepted academic practice. No use, distribution or reproduction is permitted which does not comply with these terms.
*Correspondence: Melinda L. Rekdahl, mrekdahl@wcs.org
†ORCID: Melinda L. Rekdahl, https://orcid.org/0000-0002-0575-435X
Disclaimer
All claims expressed in this article are solely those of the authors and do not necessarily represent those of their affiliated organizations, or those of the publisher, the editors and the reviewers. Any product that may be evaluated in this article or claim that may be made by its manufacturer is not guaranteed or endorsed by the publisher.