 Cong Zhou
 Di Zhang
 Xiangqi Yi
 John Beardall
 Kunshan Gao
- 1State Key Laboratory of Marine Environmental Science & College of Environment and Ecology, Xiamen University, Xiamen, China
- 2School of Ocean, Yantai University, Yantai, China
- 3School of Biological Sciences, Monash University, Clayton, VIC, Australia
- 4Co-Innovation Center of Jiangsu Marine Bio-industry Technology, Jiangsu Ocean University, Lianyungang, China
Ocean warming is suggested to exert profound effects on phytoplankton physiology and growth. Here, we investigated how the coccolithophore Emiliania huxleyi (BOF 92, a non-calcifying strain) responded to changes in temperature in short- and long-term thermal treatments. The specific growth rate after 10 days of acclimation increased gradually with increasing temperatures (14, 17, 21, 24, 28°C) and peaked at ~23°C, followed by a significant decrease to 28°C. Chlorophyll a content, cell size, photosynthetic rate, and respiratory rate increased significantly from 14°C to 24°C, but the cellular particulate organic carbon (POC) and nitrogen (PON) showed the lowest values at the optimal temperature. In contrast, during long-term thermal treatments at 17°C and 21°C for 656 days (~790 generations for 17°C treatment; ~830 generations for 21°C treatment), the warming significantly stimulated the growth in the first 34 days and the last 162 days, but there was no significant difference in specific growth rate from Day 35 to Day 493. Chlorophyll a content, cell size, cellular POC/PON, and the ratio of POC to PON, showed no significant difference between the warming and control for most of the duration of the long-term exposure. The warming-selected population did not acquire persistent traits in terms of growth and cell quotas of POC and PON, which resumed to the levels in the control temperature treatment after about 9 generations in the shift test. In summary, our results indicate that warming by 4°C (17°C and 21°C) enhanced the growth, but did not result in adaptative changes in E. huxleyi (BOF 92) over a growth period of about 800 generations, reflecting that mild or non-stressful warming treatment to E. huxleyi isolated from cold seas does not alter its phenotypic plasticity.
1 Introduction
The anthropogenic emissions of greenhouse gases are responsible for global and ocean warming. Under a business-as-usual emissions scenario (Shared Socioeconomic Pathway 5-8.5, SSP5-8.5), global warming will increase the global mean temperature by up to 4.3°C (Masson-Delmotte et al., 2021), with the ocean surface temperature being predicted to rise by 2.34-2.82°C by the end of this century (Pörtner et al., 2019). Warming could alter phytoplankton physiological functions by regulating cell metabolism via controlling the activities of various enzyme-related reactions (Raven and Geider, 1988; Gillooly et al., 2001).
As a major group of marine phytoplankton, coccolithophores can not only perform photosynthesis to convert inorganic carbon to organic carbon thereby driving the biological carbon pump but also release CO2 through calcification in what has been described as a carbonate reverse pump (Rost and Riebesell, 2004). Photosynthetic carbon fixation by coccolithophores has been reported to account for about 10% of marine primary production (Poulton et al., 2007), and their calcification has been reported to account for about 50% of the global pelagic calcium carbonate production, with an average output of about 0.8 Pg y-1 (Geisen et al., 2002; Balch et al., 2007). Emiliania huxleyi is the most widely distributed species of coccolithophorid (Bach et al., 2013) and its physiological responses to environmental fluctuations have been intensively investigated. For example, in E. huxleyi CCMP371, both the photosynthesis and growth rate were significantly improved by elevated temperature (4°C), even under low light conditions (Feng et al., 2008). Under elevated temperatures, both calcification and photosynthesis rates in E. huxleyi CS369 were found to be positively correlated (Xu et al., 2011). In E. huxleyi CCMP373, warming (from 17°C to 21°C) increased the specific growth rate by 2.9% but decreased its cell size from 5.2 μm to 4.0 μm (Arnold et al., 2013). However, our understanding of the warming effects on coccolithophores is mainly based on short-term studies, and little has been documented on the effects of long-term warming (Schlüter et al., 2014; Listmann et al., 2016). While these two studies observed adaptative responses to warming in E. huxleyi after having been grown for 400-500 generations, evolutionary changes may depend on the thermal ranges to which the microalgae were exposed. Rapid adaptation to warming within hundreds of generations has also been reported in other phytoplankton species (Padfield et al., 2015; Schaum et al., 2018; Cheng et al., 2022; Jin et al., 2022). In particular, Schaum et al. (2018) reported that specific adaptations to moderate warming (26°C, which was lower than the optimal growth temperature) were more rapid than those to severe warming (32°C, which was higher than the optimal growth temperature) in Thalassiosira pseudonana CCMP 1335. E. huxleyi is a cosmopolitan species with a worldwide distribution (Holligan et al., 1983), and intraspecific differences in response to environmental changes have been widely reported (Leonardos and Geider, 2005; McKew et al., 2015; Zhang et al., 2023). Therefore, evaluating the adaptative potential of E. huxleyi strains isolated from different sites is essential for predicting the responses and feedbacks of this globally important phytoplankton species to ocean warming. In the present study, we have carried out both a short-term and a long-term experiment, to investigate the effects of seawater warming on E. huxleyi BOF 92 as well as a shift experiment in which cells grown at elevated temperature were shifted back to the original conditions. We did not observe adaptative changes to warming after cultures had been grown over 800 generations.
2 Materials and methods
2.1 Experimental setup of the short- and long-term cultures
Emiliania huxleyi BOF 92 was established in 1993 from strain 5/90/25j, which was originally isolated in 1990 from the North Atlantic by John C. Green (Paasche et al., 1996; Paasche, 1999). In the present study, this strain was obtained from Jimei University (Xiamen, China). The E. huxleyi strain was initially able to calcify but lost the capacity for calcification after having been cultured in the laboratory (Nanninga and Tyrrell, 1996), and did not resume the capability to calcify as shown in a recent study (Fu and Gao, 2022). A modified IMR medium (Eppley et al., 1967), with = 24.7 μM and = 2.5 μM, was used to culture the E. huxleyi cells. The photon flux was set at 100 μmol photons m-2 s-1 (measured by a US-SQS/WB spherical micro quantum sensor, Walz, Germany) with a 12:12 light:dark period. For the short-term experiment, the culture temperature was set at five different levels, 14°C, 17°C, 21°C, 24°C, and 28°C. During the short-term experiment, sterilized seawater with the addition of IMR nutrients was renewed every 3 days to achieve stable carbonate chemistry (Gao, 2021), and the cell concentrations were 1.5-2.0×10⁴ cells ml-1and and 8.0-15.0×10⁴ cells ml-1 after and before the medium renewal, respectively. All vessels were sterilized by autoclave to avoid contaminations. Periodic microscopic examination verified that the cultures remained mono-algal, but we cannot guarantee the axenic nature of the cultures. Three independent replicates for each treatment were grown for about ten generations (≥10), and various physiological parameters were collected at the end of this period.
The stock culture of Emiliania huxleyi BOF 92 has been maintained for many years at 17°C, which represents the annual mean temperature of its isolation site. For the long-term warming experiments, 17°C and 21°C were selected as control and seawater warming treatments, respectively. Three independent replicate cultures were used for each treatment. The long-term semi-continuous culture lasted for 656 days from March 6, 2019 to December 21, 2020. The light conditions and nutrients used in the long-term culture were the same as those in the short-term experiment. The sterilized seawater with the addition of IMR nutrients was renewed every 5-10 days, and the cell concentration before dilution ranged 5.0-10×104 cell ml-1 and was set at ~500 cells ml-1 after each dilution. The growth was recorded and cells were regularly collected before dilution throughout the experiment except from Day 348 (February 17, 2020) to Day 437 (May 16, 2020). In this period, the cultures were diluted regularly but not sampled for measurements of physiological parameters due to the COVID-19 pandemic.
2.2 Measurements of specific growth rate, cell diameter, and Chl a content
The specific growth rate and cell size (diameter) were measured using a Z-2™ Coulter particle Count and Size Analyzer (Beckman Coulter, USA), and the particle size range was set as 3-8 μm. The specific growth rate (μ) was calculated as: , where C2 and C1 were the cell concentrations at time T2 and T1, respectively. The number of generations (G) was estimated as:
To determine the cellular contents of chlorophyll a (Chl a), cells were collected on the GF/F membrane (Whatman, 25mm, USA) by suction filtration within a pressure of 0.01MPa to prevent cell damage from excessive pressure. The collected samples were extracted overnight in 10 ml of absolute methanol at 4°C in darkness. After centrifugation (5000g for 10 minutes), the absorption values of the supernatant were measured with a UV-VIS spectrophotometer (DU800, Beckman Coulter, USA) across the wavelength range 400-800nm. The concentrations of Chl a were calculated according to Porra (2002),
where Ax is the absorbance under the x-wavelength, VE is the volume of the methanol extraction, VC is the volume of the algae solution, and C is the concentration of algae cells (cells ml-1).
2.3 Short-term thermal response curve for growth
In short-term experiments, the measured specific growth rate of E. huxleyi cultured at 14°C, 17°C, 21°C, 24°C, and 28°C was fitted to temperature according to Schoolfield et al. (1981) and Padfield et al. (2016):
where μ(T) represents the specific growth rate at temperature T (kelvin - K), Ea is the activation energy (eV) for growth, Eh is the deactivation energy (eV) characterizing high-temperature-induced inactivation above the deactivation temperature Th (K), k is Boltzmann’s constant with a value of 8.62×10⁻⁵ eV K-1, and Tc represents the reference temperature (17°C, 290.15K). The optimum growth temperature (Topt) was calculated from Tc, Th, Ea, and Eh as (Yi et al., 2020):
2.4 Photosynthetic oxygen evolution and dark respiration rates
In the short-term experiment, net photosynthesis and dark respiration rates of E.huxleyi cells were determined using a Clark-type oxygen electrode (Hansatech, Norfolk, UK) under the growth temperatures and irradiance (100 µmol photons m−2 s−1). Cells were gently collected on polycarbonate membranes (1.2 μm, Millipore, Ireland) and resuspended with sterilized seawater. The resuspended cells were placed in an oxygen electrode chamber equipped with a magnetic stirrer. Both net photosynthesis rate and dark respiration rate were measured for 10 minutes and calculated from the slope of oxygen concentration vs time. After measurement, the resuspended cells were counted by the Z-2™ Coulter particle Count and Size Analyzer, and the calculated photosynthesis and respiration rates are presented as oxygen concentration change per cell per hour (fmol O2 cell-1 h-1).
2.5 POC and PON analysis
Cells were collected onto pre-combusted (450°C for 6h) Whatman GF/F membranes (25 mm) and frozen at -20°C. Before the measurement, the filter membranes were placed in a closed container filled with HCl for 24 hours to completely remove any inorganic carbon and then dried in an oven at 80°C for 24 hours. Subsequently, all the filters were analyzed by a Perkin Elmer Series II CHNS/O Analyzer 2400 (Perkin Elmer Waltham, MA). Production rates (P) of particulate organic nitrogen (PON) and particulate organic carbon (POC) were calculated as P (pg cell-1 d-1) = specific growth rate (d-1) × cellular PON or POC content (pg cell-1), respectively.
2.6 Measurements of chlorophyll fluorescence
A Multi-color PAM fluorescence monitoring system (Walz, Effeltrich, Germany) was employed to measure the photosynthetic performance of E. huxleyi cells in the short-term experiment. The minimal fluorescence (Fo) for 15 minutes dark-adapted cells was induced by a modulated red measuring light of low irradiance (~5 μmol photons m-2 s-1), maximum fluorescence (Fm) was measured during a 0.8 s saturating flash (~10,000 μmol photons m-2 s-1), steady-state fluorescence (F) was monitored periodically under a ~100 μmol photons m-2 s-1 actinic light, and the 0.8 s saturating flash was applied to induce the maximum fluorescence under actinic light (Fm’). The maximum quantum yield of photosystem II (PSII) (Fv/Fm), the effective quantum yield of PSII (YII), and the non-photochemical quenching (NPQ) were calculated as (Fm-Fo)/Fm, (Fm’-F)/Fm’, and (Fm – Fm’)/Fm’, respectively. For the measurements of rapid light curves, cells were illuminated for 20 s with 10 incremental steps of increasing actinic irradiance (PAR). A saturation flash was applied following each irradiance to generate corresponding F and Fm’ values. Relative electron transport rates (rETR) were calculated as (Fm’-F)/Fm’ × PAR. Photosynthetic parameters α (photosynthetic light harvesting efficiency), β (a photoinhibition constant), and rETRs (potential rETR maximum without photoinhibition) were obtained by fitting the rETR data to the function (Platt et al., 1980): rETR = rETRs × [1 - e -α×PAR/rETRs] × e -β×PAR/rETRs. The minimum saturating light intensity, Ik, was calculated as rETRmax/α, and the maximal rETR, rETRmax, was calculated as .
2.7 Shift experiment
After having been grown in their respective temperature conditions for 656 days, corresponding to ~790 generations for 17°C and ~830 generations for 21°C, cells were transferred to the reciprocal temperature to acclimate for another 7 days (~9 generations). Such shift experiments were used to evaluate whether evolutionary changes stemming from the selection environment occurred (Tong et al., 2017 and references therein). The specific growth rates, the cellular POC, PON contents, as well as the ratio of POC/PON were measured in the shift experiment.
2.8 Data analysis
Data analyses were performed with SPSS19.0 (SPSS Inc., Chicago, USA) or R language (version 4.1.1). One-way ANOVA with post-hoc Tukey HSD test was used to test the differences among treatments in the short-term experiment. The homogeneity of variance was examined using Levene’s test. Differences were considered to be significant at p< 0.05. For data collected in the long-term experiment, generalized additive models (GAMs) were built (R language and package “mgcv”) to test the effects of warming on the time series of specific growth rate, diameter, Chl a content, and cellular contents of POC and PON (van Rij et al., 2019). The GAMs for the time series of Chl a, POC, and PON contents indicated that these parameters changed linearly with time, so linear mixed effects modes (LMMs) were used instead (R language and package “nlme”; Pinheiro and Bates, 2006). The pairwise comparisons between control and warming treatments on each day were achieved using the R packages “itsadug” and “emmeans” for GAMs and LMMs, respectively. The building, selection, and validation of the statistical models followed the principles and guidelines provided in Pinheiro and Bates (2006); Zuur et al. (2009) and Wood (2017). The tested statistical models and the corresponding values of the Akaike information criterion (AIC) are presented in the Supplementary Material (Table S1-8), and AIC values were calculated using the R language function “AIC”.
3 Results
3.1 Short-term warming effects
As shown in Figure 1A, the specific growth rate (SGR) of E. huxleyi in short-term cultures displayed a significant difference among the five temperature treatments (One-way ANOVA, p< 0.05), with an increase from 14°C to 23°C and a sharp decrease from 23°C to 28°C (post-hoc Tukey HSD test, p<0.05 for all pairwise comparisons). The cells survived at 28°C but cannot replicate, so the calculated SGR was about 0. Diameters measured by the Z-2™ Coulter (Figure 1B) indicated that the size of cultured cells was significantly larger under the highest temperature conditions (One-way ANOVA, p<0.05). Compared with 14°C, the average cell diameter increased by 29.1% at 28°C (post-hoc Tukey HSD test, p<0.05). Since cells cultured at 28°C could not be harvested in sufficient numbers, only 4 temperature treatments, i.e. 14°C, 17°C, 21°C, and 24°C, were analyzed for photosynthetic and respiratory performance. As with SGR, both photosynthetic O2 evolution and respiratory rates increased gradually with temperature and peaked at 24°C (Figure 1C). In these four various temperature treatments (at 14°C, 17°C, 21°C and 24°C), the O2 evolution rates were 5.1, 8.3, 12.7, and 26.8 fmol O2 cell-1 h-1, and the respiratory rates were 6.3, 7.4, 10.1 and 15.1 fmol O2 cell-1 h-1, respectively. Due to the low-density of E. huxleyi cells cultured in our long-term experiment, insufficient cells were available to measure both photosynthetic O2 evolution and respiratory rates. Results from the short-term thermal response curve for growth (Figure 1A) showed that the activation energy Ea, the deactivation energy Eh, and the deactivation temperature Th were 0.34 eV, 17.80 eV, and 24.62°C (297.77 K), respectively. The calculated optimal growth temperature for E. huxleyi BOF 92 was around 22.9°C (296.1 K).
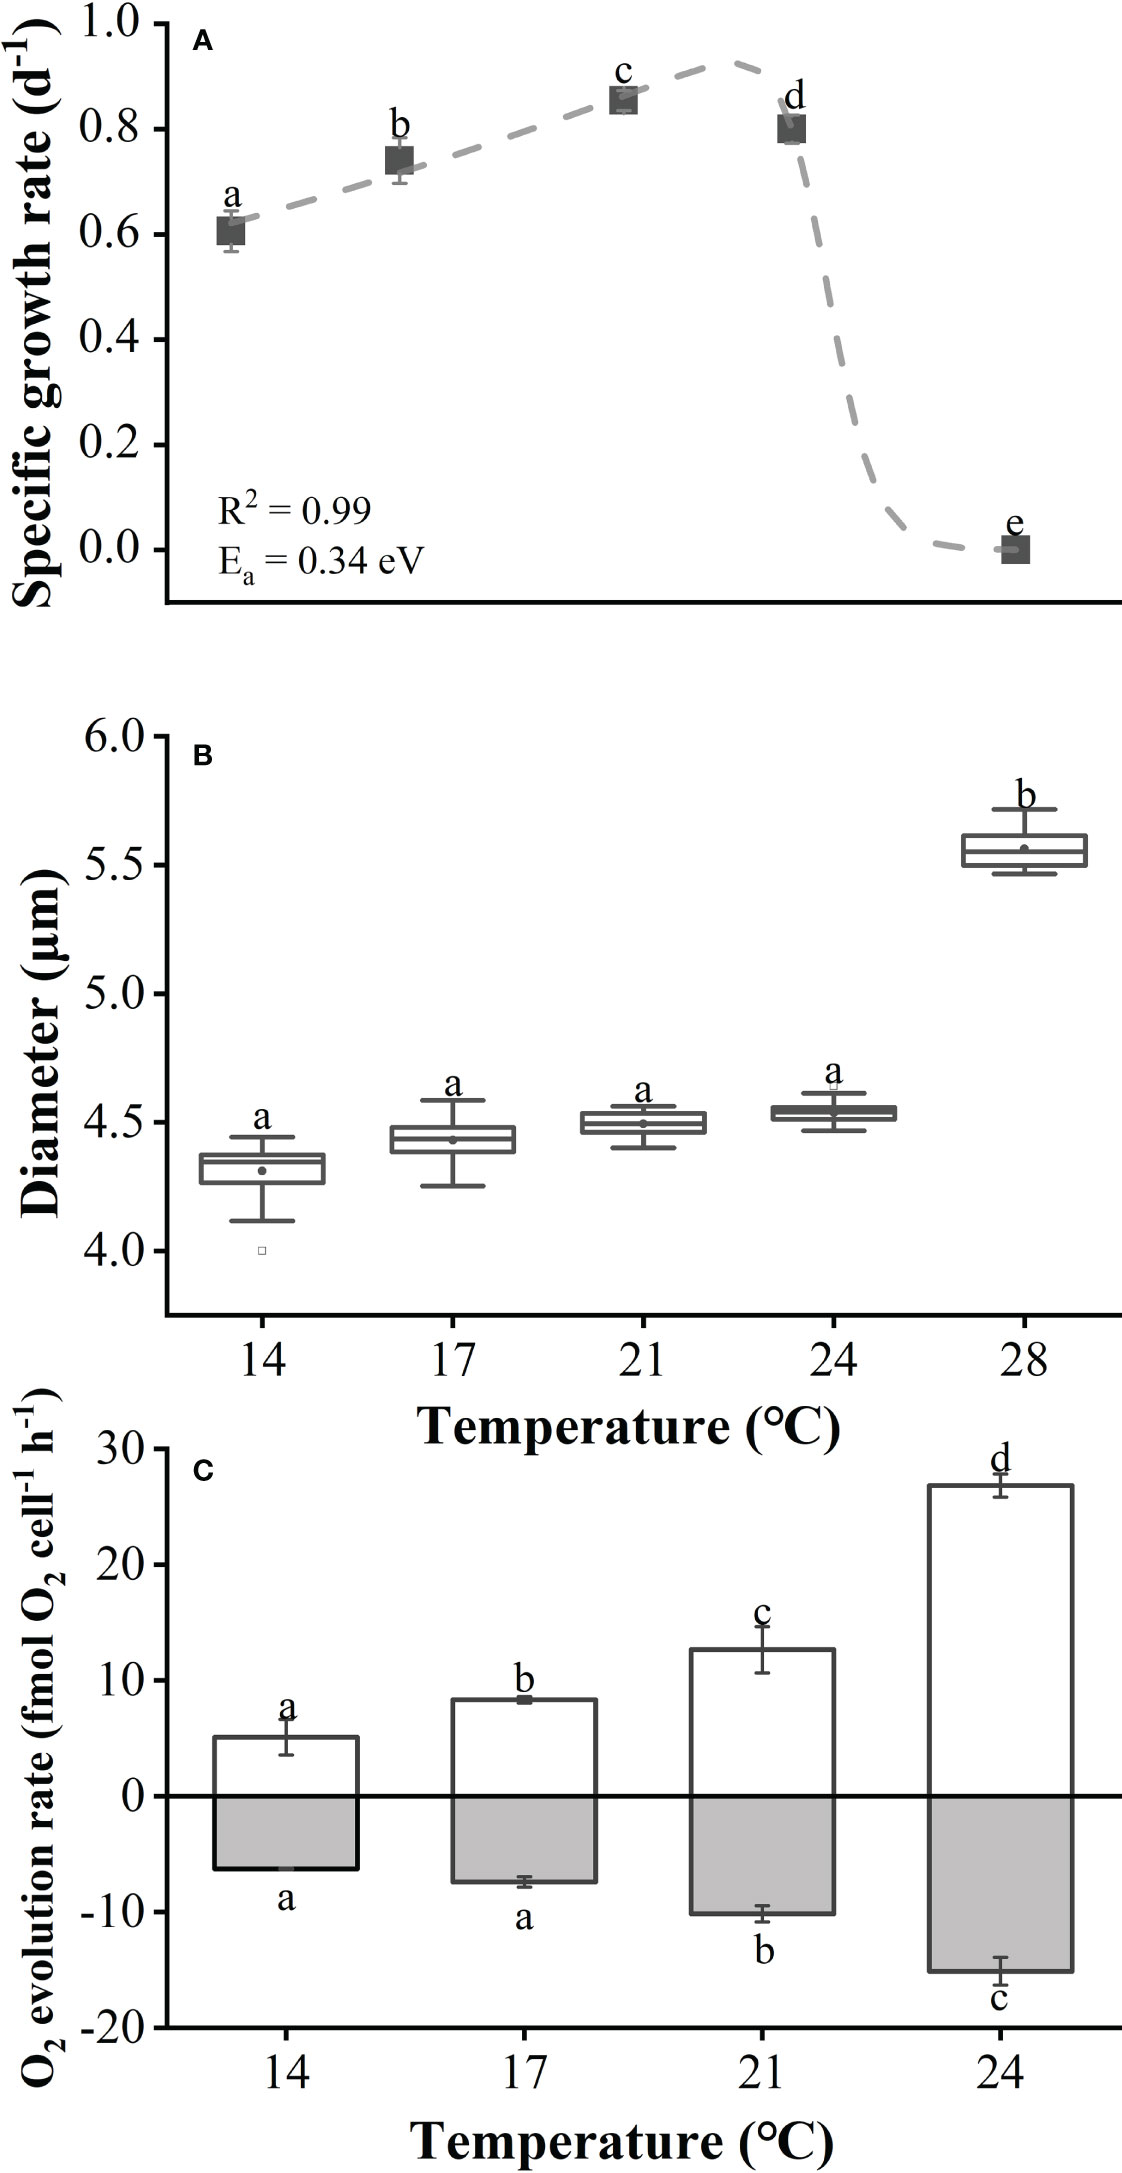
Figure 1 Specific growth rate (A), cell diameter (B) and the net photosynthesis rates and dark respiration rates (C) of Emiliania huxleyi BOF92 as a function of growth temperatures. The data was obtained after the cells had acclimated to the growth temperatures for 7-10 days (about 10 generations). Data are mean ± SD (n=3), the different letters above the bars indicate a significant difference between the treatments (p< 0.05, One-way ANOVA).
With the increasing temperature, cellular Chl a content increased gradually, displaying the maximum value of ~0.25 pg cell-1 and a significant difference at 24°C (One-way ANOVA, p<0.05, Figure 2A), while the cellular contents of POC and PON showed no significant change between 17°C and 21°C (post-hoc Tukey HSD test, p=0.372 and 0.418, respectively, Figure 2B). Compared with 17°C or 21°C, the POC and PON contents of cells grown at 14°C or 24°C were significantly higher by ~ 5% (post-hoc Tukey HSD test, p<0.05, Figure 2B). The ratios of POC to PON of cells grown under different temperatures remained within the range of 7.5 to 8.2. In terms of POC and PON production rate, values mainly depended on SGR and were positively correlated with increasing temperature (Figure 2C).
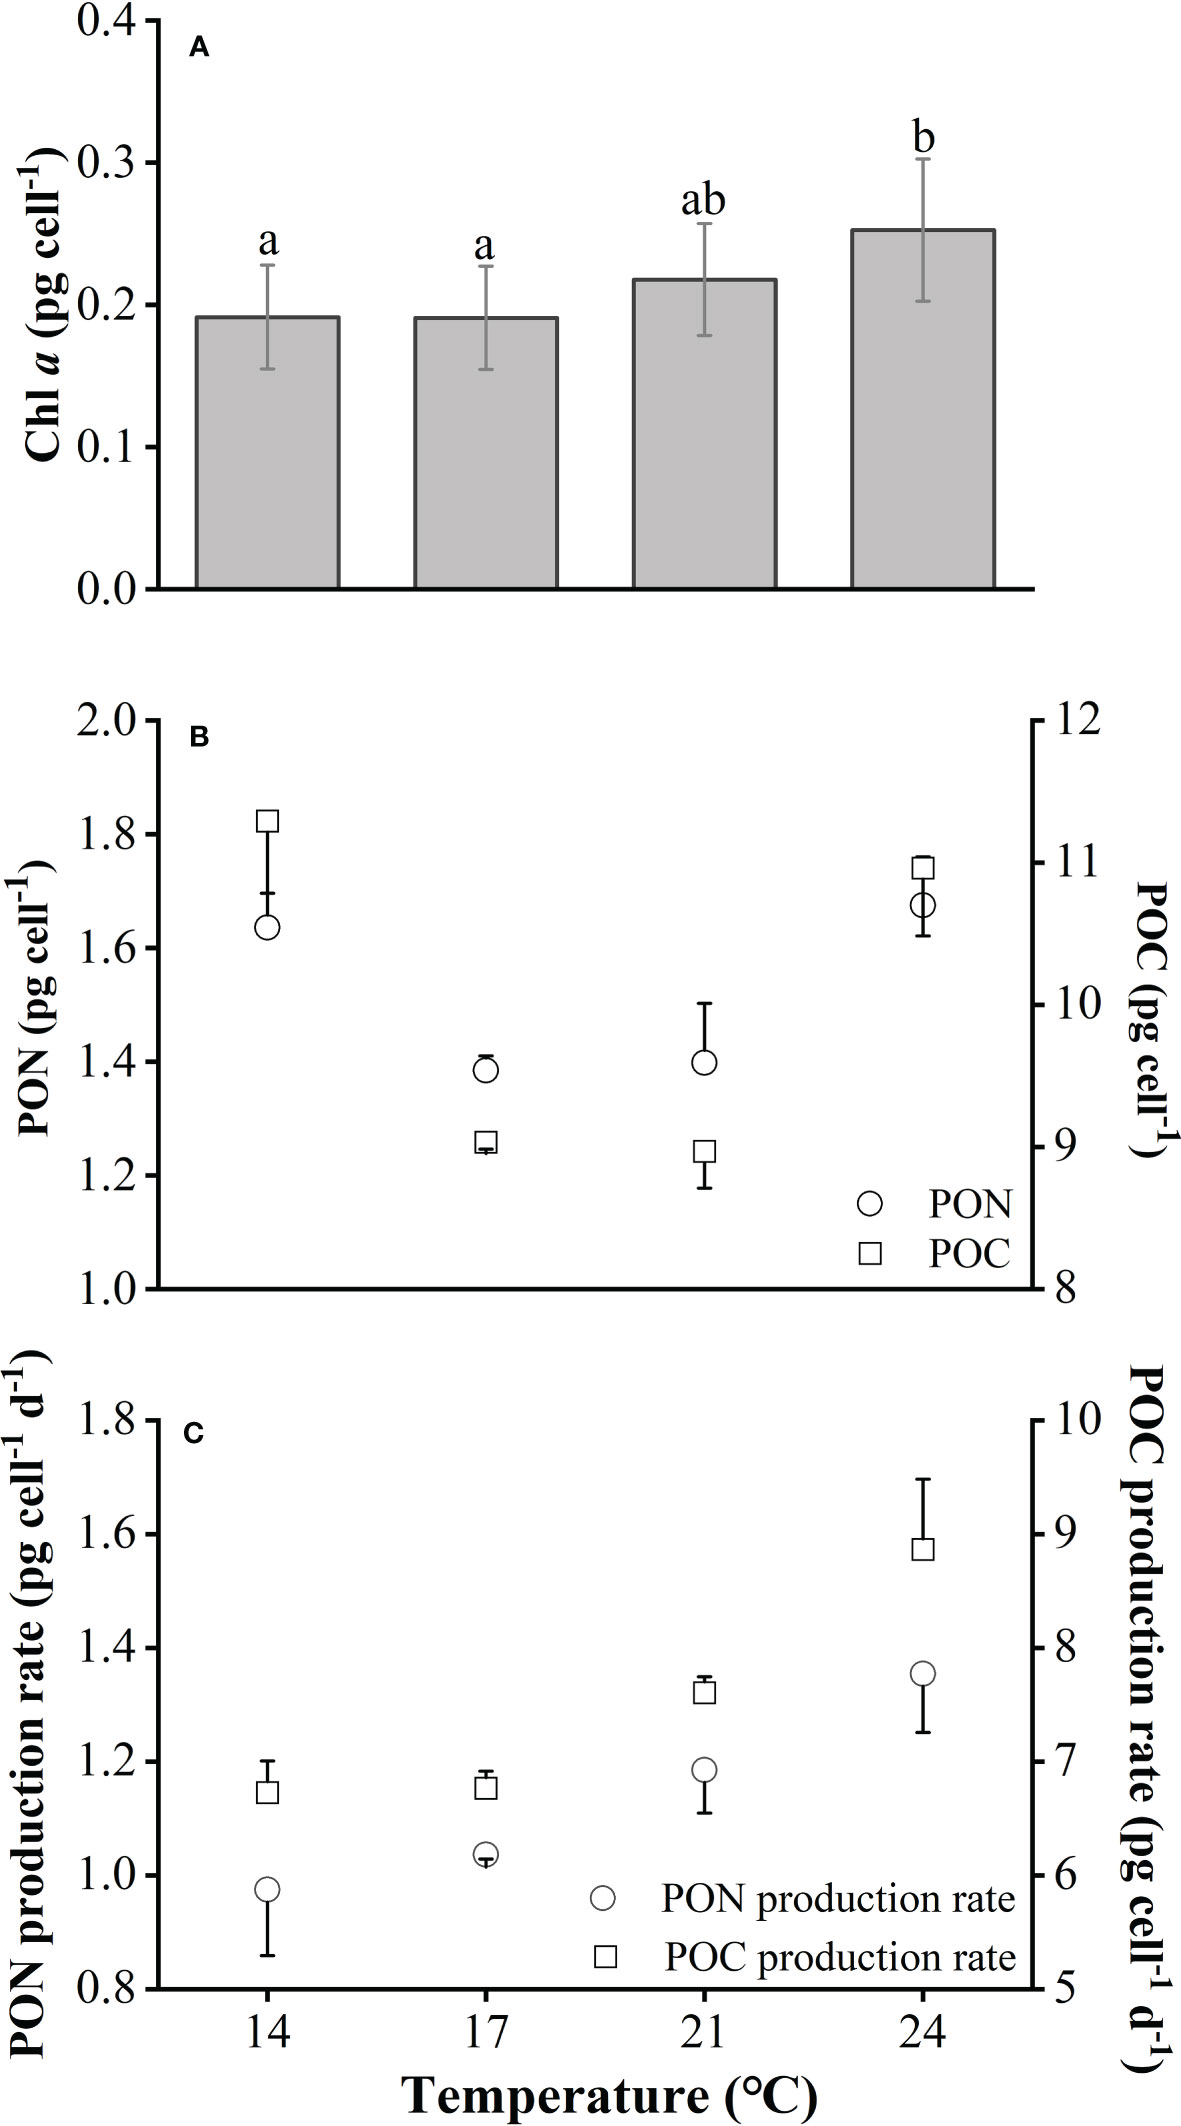
Figure 2 Cellular chlorophyll a content (Chl a) (A), POC and PON contents (B) and their production rate (C) of Emiliania huxleyi BOF92 cultured under short-term exposure to a range of temperatures. Data are mean ± SD (n=3).
The chlorophyll fluorescence parameters determined using the Multi-color PAM are shown in Table 1. The maximum photochemical efficiency (Fv/Fm) and effective photochemical efficiency (Y(II)) of coccolithophores photosystem II showed no significant difference among the five different culture temperature conditions (One-way ANOVA, p = 0.75 for Fv/Fm, p = 0.66 for Y(II)), with an average value of Fv/Fm from 0.64 to 0.66 and an average value of Y(II) from 0.53 to 0.59. The value of rETRmax at 17°C was significantly higher than that of cells grown under the other temperature treatments, which were 20.6% (post-hoc Tukey HSD test, p<0.05), 25.3% (post-hoc Tukey HSD test, p<0.05), and 59.8% (post-hoc Tukey HSD test, p<0.01) higher than at 14°C, 21°C, and 24°C, respectively. The light utilization efficiency, i.e. values of α, exhibited the highest value under 24°C, which was significantly higher than that of cultures grown at 14°C, 17°C and 21°C (post-hoc Tukey HSD test, p<0.05 for 14°C and 17°C, p<0.01 for 21°C). In terms of β, the degree of photoinhibition, no significant difference was observed between cells grown at 14°C and 17°C (post-hoc Tukey HSD test, p=0.797), but its value was significantly higher than that of cells from the two elevated temperatures (post-hoc Tukey HSD test, p<0.05 for both 21°C and 24°C). Similarly, variation of the minimum saturation light intensity (Ik) also showed the highest value at 17°C, which was significantly higher than those of two elevated temperatures (post-hoc Tukey HSD test, p<0.05 for both 21°C and 24°C).

Table 1 The maximum relative electron transfer rate (rETRmax), the apparent photosynthetic efficiency (α), the degree of photoinhibition(β) and the initial light saturation point (Ik, μmol photons m-2 s-1) fitted from rapid light curves as well as the maximum photochemical quantum yields (Fv/Fm), effective photochemical quantum yields (Y(II)) and non-photochemical quenching values (NPQ) for Emiliania huxleyi BOF92 cultured under short-term exposure to a range of temperatures.
3.2 Long-term warming effects
During the long-term culture (656 days) at 17°C and 21°C, cells had been growing for ~790 and ~830 generations, respectively. The average SGRs under 17°C was 0.84 d-1 which was slightly lower than that (0.88 d-1) at 21°C; the elevated seawater temperature thus increased the growth of E. huxleyi by 5.28% (Figure 3A, Supplementary Table S2). The GAM analysis demonstrated that throughout the whole process, the elevated seawater temperature significantly improved SGR in the first 34 days and last 162 days, and no significant difference in SGR was detected between the control and warming treatments from Day 35 to Day 493 (Figure 3B). The average cell diameter in control and warming treatments were 4.59 μm and 4.64 μm, respectively (Figure 3C; Supplementary Table S4). Although the GAM analysis found that the elevated temperature did enlarge the cell size (Wald tests, p<0.001, Table S4), the pairwise comparisons between control and warming treatments at each day showed no significant difference on most days (Figure 3D). Similar results were also observed in the cellular Chl a content (Wald tests, p=0.0205 for temperature, Figure 4, Table S6).
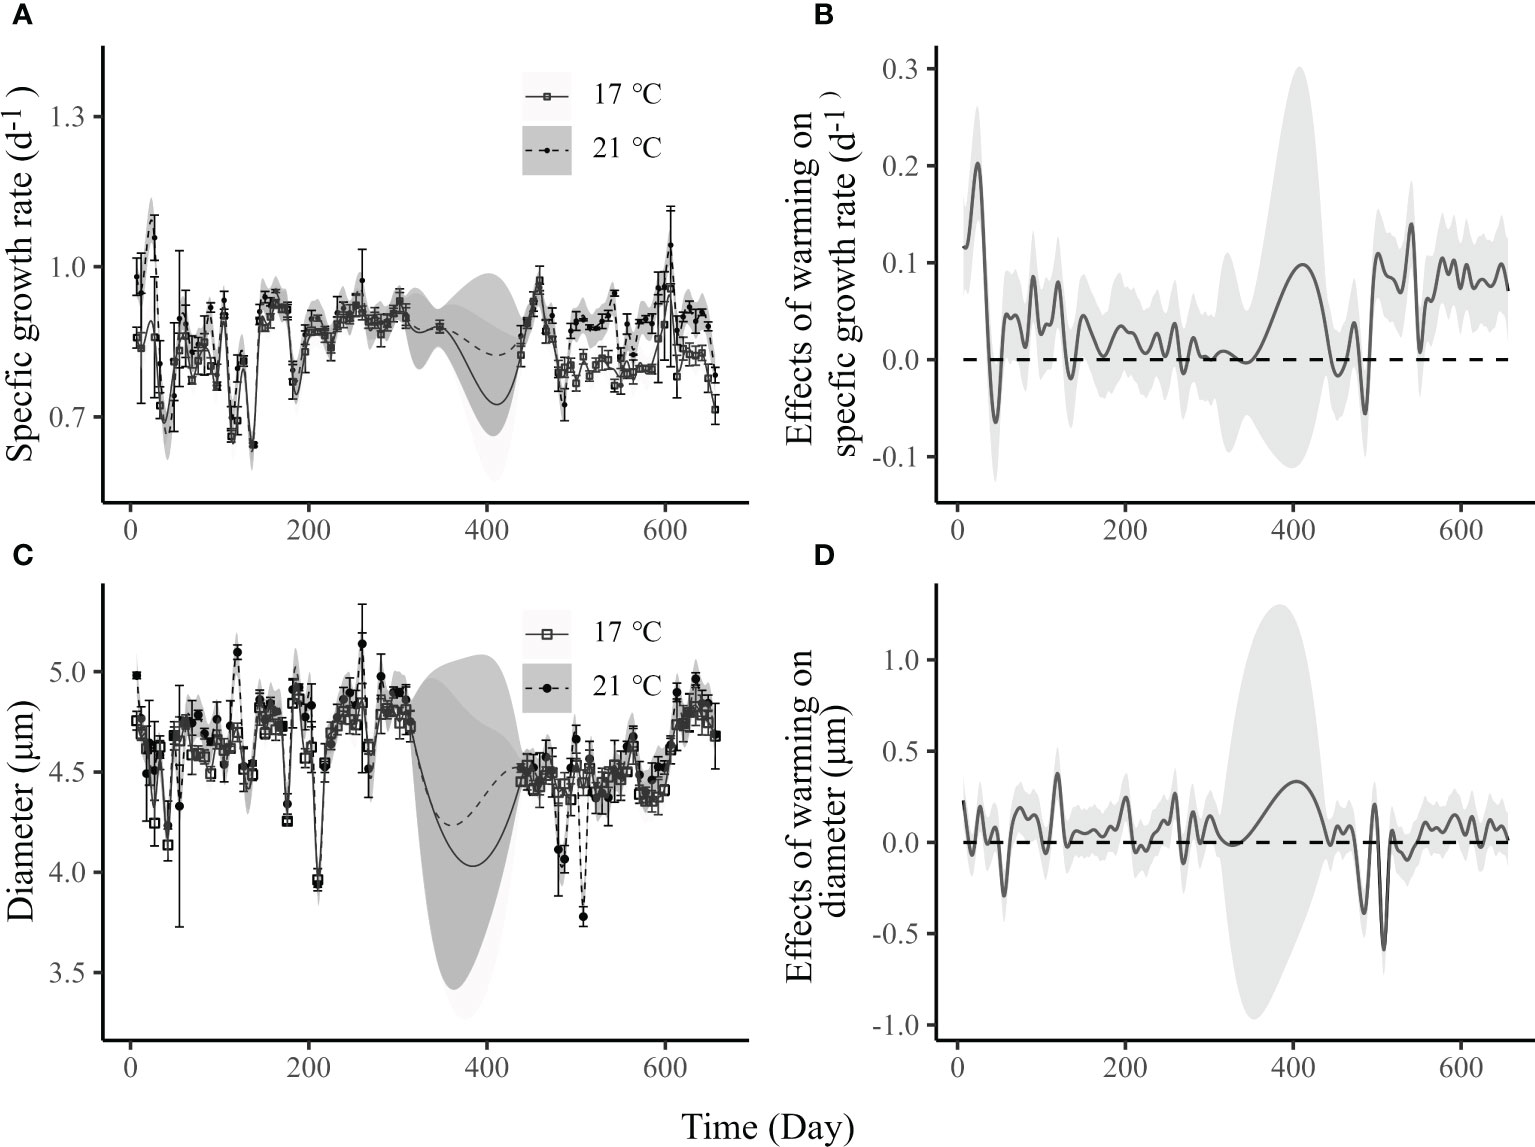
Figure 3 The specific growth rate (A) and cell diameter (C) of Emiliania huxleyi BOF92 cultured under 17°C (~790 generations) and 21°C (~830 generations) over the course of the long-term warming experiment; differences in specific growth rate (B) and cell diameter (D) between 21°C and 17°C treatments. Data are mean ± SD (n=3). Lines with shadow represents the mean with 95% confidential intervals estimated by the generalized additive model. The large uncertainty around Day 400 is due to lack of sampling during the COVID-19 epidemic. In panel B and D, significant differences between the control and warming treatments at certain days are justified by the lack of intersection of the 95% confidence intervals and the x axis.
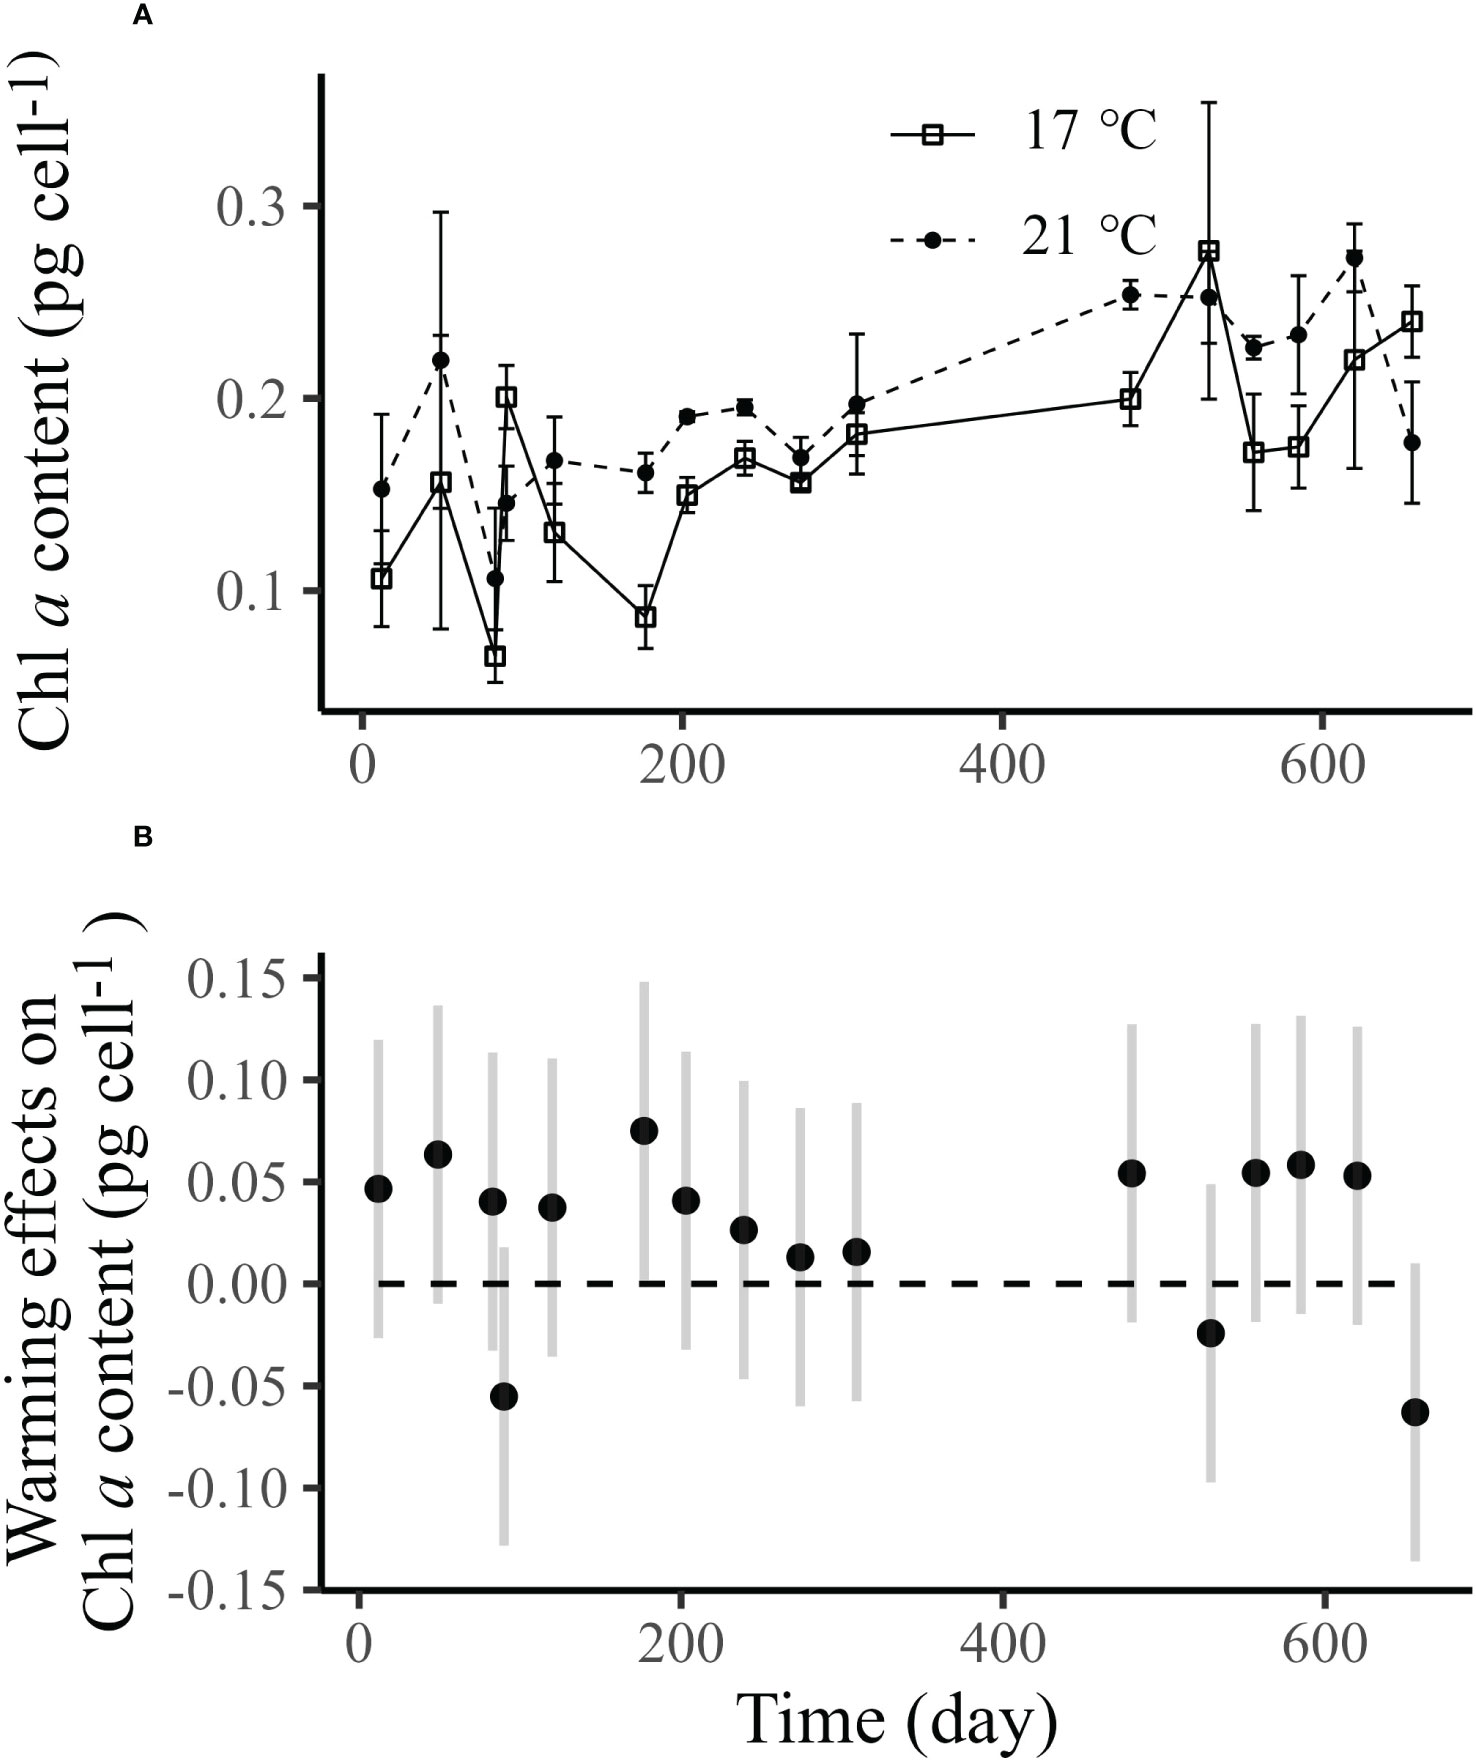
Figure 4 Panel (A) is the cellular chlorophyll a content of Emiliania huxleyi BOF92 cultured under 17°C (~790 generations) and 21°C (~830 generations) over the course of long-term seawater warming experiment, and data are mean ± SD (n=3). Panel B shows the differences of cell diameter between 21°C and 17°C, and data are means with 95% confidential intervals estimated by the linear mixed-effect model. In panel (B), significant differences between the control and warming treatments at certain days are justified by the lack of intersection of the 95% confidence intervals and the x axis.
During the long-term culture at 17°C and 21°C, no significant differences (Supplementary Table S8) were observed in both cellular contents of POC (Figure 5A) and PON (Figure 5B), as well as in the ratio of POC to PON (Figure 5C). However, there was a trend that the cellular contents of POC and PON increased gradually with the time. This was supported by the analysis based on the linear mixed-effects model, which indicated that both the cellular contents of POC and PON were significantly affected by the time (Wald tests, p<0.001, Supplementary Table S8).
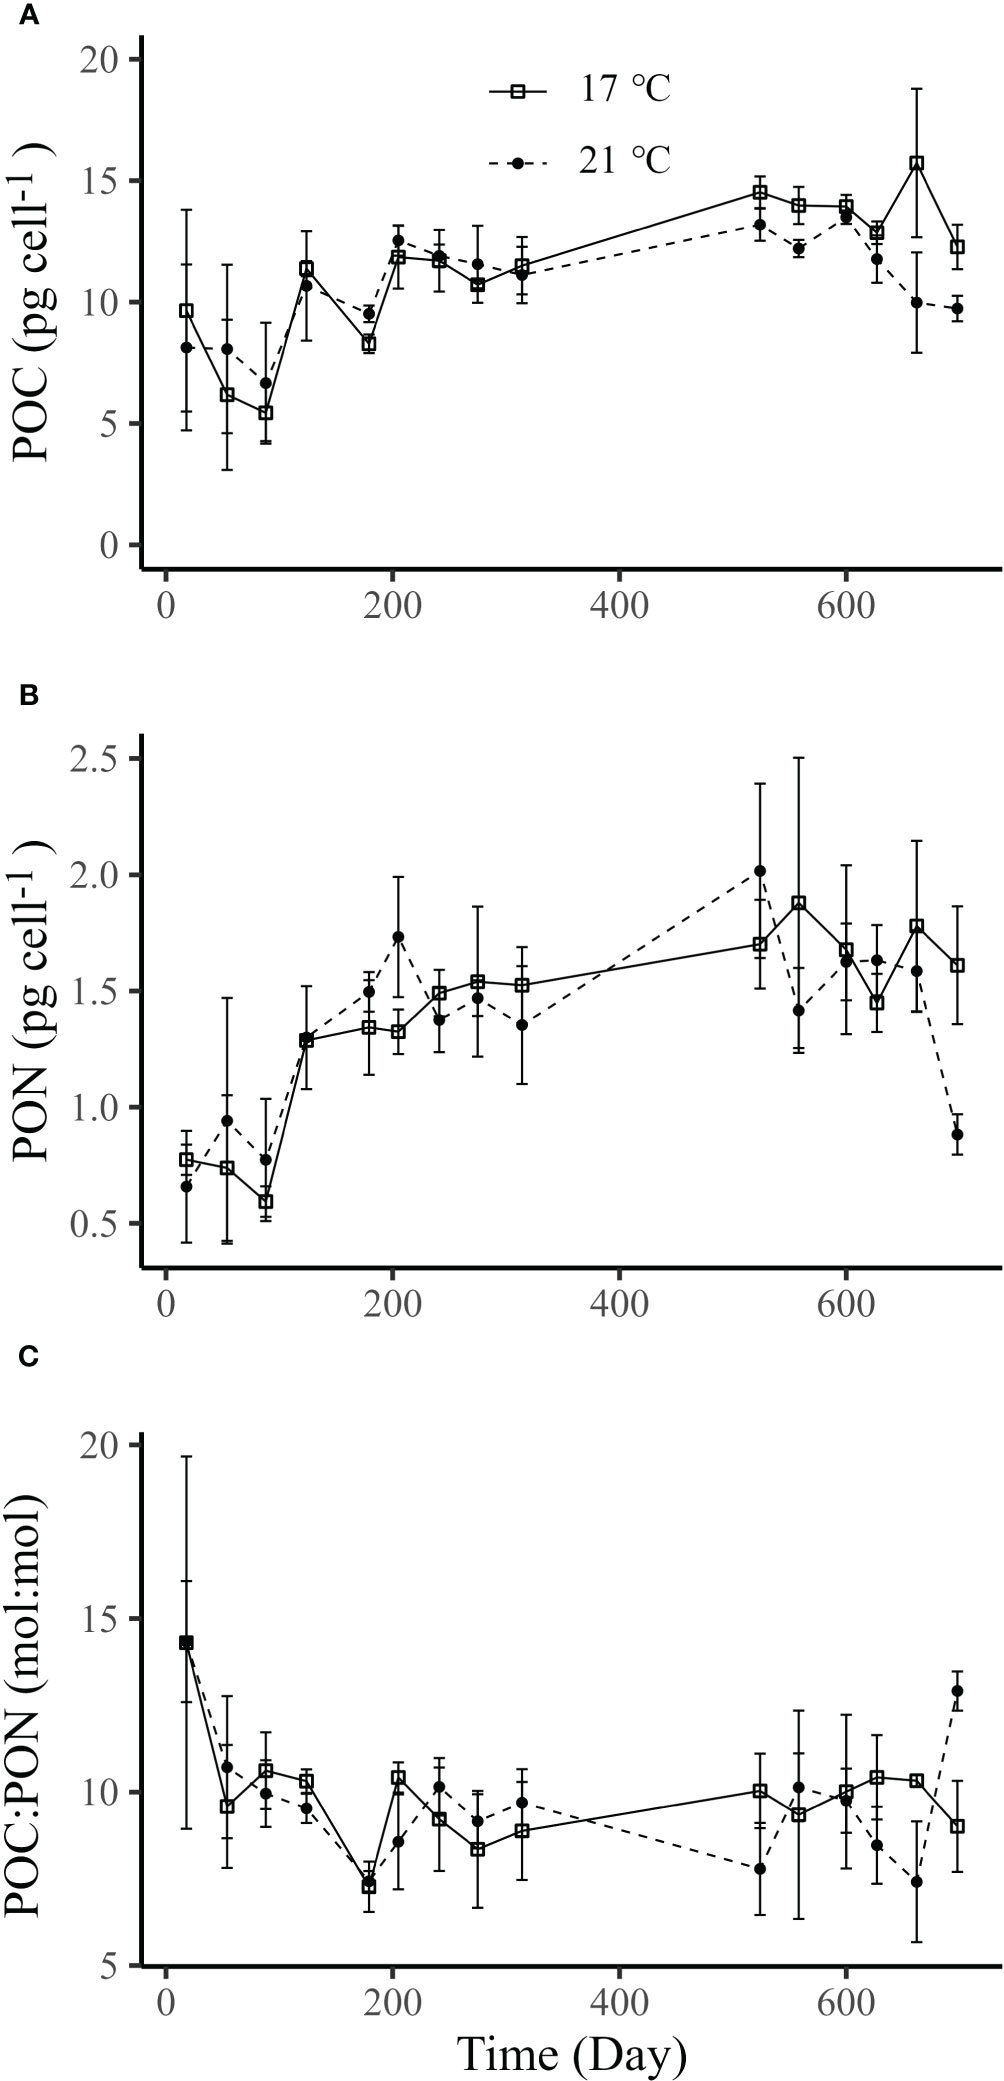
Figure 5 Cellular POC (A), PON contents (B) and POC/PON ratio (C) of Emiliania huxleyi BOF92 cultured under 17°C (~790 generations) and 21°C (~830 generations) over the course of the long-term seawater warming experiment. Data are mean ± SD (n=3).
3.3 Shift experiments
After the 17°C-selection cells were acclimated to 21°C for 7 days, their SGR significantly increased by 22% compared to the cells continuously grown at 17°C (post-hoc Tukey HSD test, p<0.05). In contrast, SGR was observed to decrease by 14%, as cells were transferred from 21°C to 17°C (post-hoc Tukey HSD test, p<0.05, Figure 6A). Changes of temperatures showed no significant effects on cellular POC contents, PON contents, as well as the ratio of POC to PON (Figure 6B for POC contents, 6C for PON contents, 6D for POC : PON). These results suggested that no adaptative changes occurred during the long-term seawater warming treatments.
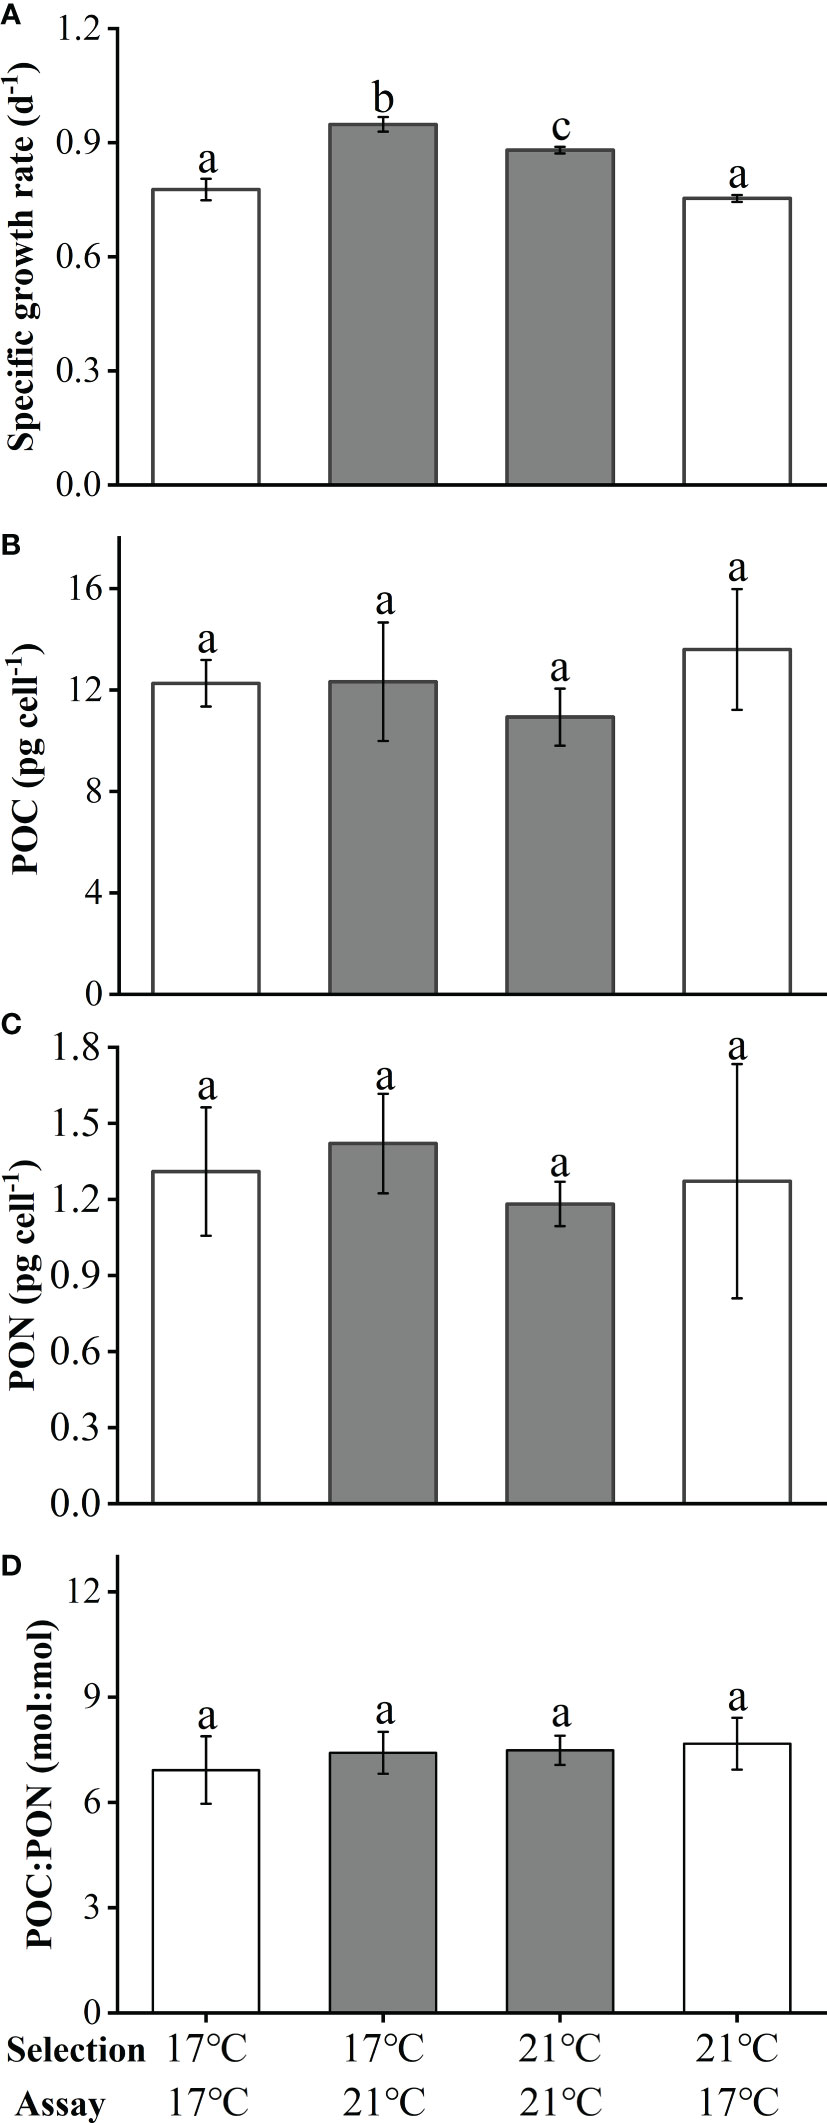
Figure 6 The specific growth rate (A), cellular POC (B), PON contents (C) and POC/PON ratio (D) of Emiliania huxleyi BOF92 during the shift experiment. Data are mean ± SD (n=3), the different letters indicate a significant difference between the treatments (p< 0.05, One-way ANOVA).
4 Discussion
In the present study, warming (21°C vs. 17°C) resulted in a steady increase of the specific growth rate after ~600 generations until about 800 generations, showing similar warming-induced enhancement as in the short acclimation. However, there were no evolutionary traits observed. This finding indicates that non-stressful warming may not bring about any adaptation over the generations span employed here.
4.1 Physiological responses to temperature change
Acceleration of metabolic activity at elevated temperatures is a common response among phytoplankton, which could further prompt their growth (Lund, 1949; Feng et al., 2008; Schaum et al., 2017). However, the temperature rising from 21°C to 24°C further increased photosynthesis and respiration but reduced specific growth rate in the present work. The temperature elevation from 21°C to 24°C stimulated the ability to obtain carbon but also increased the cellular demand for carbon due to increased respiration, leading to reduced rate of growth. Since cellular POC production rates play an important role in global carbon cycles (Poulton et al., 2007), warming from 17°C to 21°C over 800 generations promoted the role of E. huxleyi BOF 92 in primary productivity.
While the annual mean temperature of its isolation site was about 17°C, the optimal growth temperature and the upper thermal limit of E. huxleyi BOF 92 were found in this work to be ~23°C and ~28°C, respectively. This supports the general understanding that the optimal temperatures of phytoplankton strains from high latitude oceans are considerably higher than their mean annual temperatures (Thomas et al., 2012; Brandenburg et al., 2019). Therefore, Emiliania huxleyi living in high latitude oceans might benefit from ocean warming irrespective of other environmental changes that would synchronously occur with it. That the cell size increased at thermal stress (28°C) in this study can be attributed to retardation of nutrient utilization by the cells, leading to reduced cell division (Smith and Kalff, 1982; Savage et al., 2004; Litchman et al., 2007; Marañón, 2015).
4.2 Inconsistent warming effects on growth in the long-term experiment
In the long-term selection experiment, varied response of phytoplankton to warming has been recognized to be related to evolutionary adaptation. For example, in a green alga Chlorella vulgaris, population growth was initially (~10 generations) limited at a high temperature because its respiration was more sensitive to temperature than photosynthesis, leading to less carbon utilization for growth (Padfield et al., 2016). However, after acclimating for 100 generations under the elevated temperature, the down-regulation of respiration would drive phytoplankton to overcome the metabolic constraint and allocate more fixed carbon to growth (Padfield et al., 2016). In Chlamydomonas reinhardtii, the increase in photosynthetic rate, but not a trade-off between respiration and growth, was suggested to be the main adaptive response to warming (Schaum et al., 2017). For E. huxleyi BOF 92 examined in this work, warming at 21°C increased its cellular photosynthesis and respiration increased by 53% and 37%, respectively, compared to 17°C (Figure 1C). Such stimulations to both photosynthesis and respiration may be the main reason for the enhancement of growth observed in the early stage of the culture period, but was inconsistent with the lack of effect in the middle stage of the culture period. On the other hand, the growth enhancement after ~600 generations and the shift experiment indicated that selection cultures at 21°C did not bring about any adaptation due to the warming, though both cell quotas of POC and PON gradually increased with duration time (Figure 5). This implies that the non-stressful warming only resulted in plastic acclimatory changes over about 800 generations. In a recently published work on the diatom Skeletonema dohrnii (Cheng et al., 2022), warming (24°C vs. 20°C; 28°C vs. 20°C) significantly decreased the cellular POC and PON contents after 300 generations of selection, but the changes were completely recovered after 700 generations of selection. This variation of POC and PON contents was accompanied by significant proteome plasticity (Cheng et al., 2022). The mechanism behind the inconsistent warming effects on growth in our long-term experiment is unclear. Since we did not obtain proteomic or transcriptomic data, future work is needed to link the phenotypic responses to the molecular responses, which may help interpret similar phenomena (Schaum et al., 2018; Jin et al., 2022).
The result that warming-selected cells over about 800 generations shifted back to their ancestral traits (Figure 6) suggest that E. huxleyi cells maintained their phenotypic plasticity. While warming could increase the fitness of phytoplankton (Schlüter et al., 2014; Listmann et al., 2016), evolutionary changes can be dependent on thermal stress levels or latitudes. In warm seas, some diatoms adapted to warming with trade-offs in photosynthetic efficiency and growth rate (Jin and Agustí, 2018). By contrast, the warming treatment (21 °C) for E. huxleyi BOF 92 from high latitude in our study was below its optimal growth temperature (~23°C), resulting in no adaptation over 800 generations. This implies that mild warming treatment that exerts no selective pressure can hardly give rise to evolutionary change (Xu et al., 2023).
In terms of the long-term adaptation of phytoplankton to environmental changes, its evolutionary process seems to be strain-specific (Supplementary material, Table S9). In coccolithophorids, the existence of coccoliths, i.e. the calcification process, could affect its adaptability to environmental changes. For example, in non-calcified Gephyrocapsa oceanica NIES-1318, elevated pCO2 initially prompted its growth and carbon, nitrogen assimilation rates from generations ~670 to ~1550 (Jin et al., 2013). However, in the same strain with coccoliths, high CO2-selected populations exhibited reduced growth and calcification rates and enhanced POC and PON production (Tong et al., 2018). E. huxleyi BOF 92 cultured in the present study used to be a calcified strain (Paasche, 1999), but lost its calcification capability during the laboratory cultures which lasted for about 30 years. Low light, high nutrients and absence of solar ultraviolet radiations might be responsible for the loss of ability to calcify (Paasche, 2002 and references therein; Guan and Gao, 2010). Nevertheless, the naked cells exhibit the same other morphological features as those of calcified cells (Paasche, 2002), and the measured growth rate and cell size were also comparable with previous reports (Paasche, 1999). Our data in the present study may partially imply the physiological responses of E. huxleyi BOF 92 to future warming, but may not be representative of all E. huxleyi generally, bearing in mind that this strain might differ genetically from its ancestral form.
Increasing temperature is a key factor that directly determines phytoplankton distribution, production, and metabolic function (Morán et al., 2010; Thomas et al., 2012; Toseland et al., 2013). Its interaction with other environmental drivers, e.g., light irradiance, has also been reported to affect the acclimation of phytoplankton to temperature change (Feng et al., 2008; Edwards et al., 2016). The growth irradiance used in this study (100 μmol photons m-2 s-1) is lower than the saturating irradiancies for both growth and photosynthesis (> 200 μmol photons m-2 s-1) of E. huxleyi BOF 92 (Nanninga and Tyrrell, 1996; Paasche, 2002). Higher irradiance can stimulate the growth and reproduction of E. huxleyi BOF 92, resulting in shorter generation times. Theory predicts that populations with shorter generation times evolve faster because of the accumulation of more DNA replication errors per unit time (Weller and Wu, 2015). Therefore, growing E. huxleyi BOF 92 population under higher and more favorable irradiance might promote its adaptation to warming. In addition, the increasing seawater temperature induced by additional atmospheric CO2 accumulation is accompanied by other environmental changes, such as ocean acidification. Studies exploring the adaptative responses of phytoplankton to the combination of ocean warming and acidification suggest that ocean warming might exert a greater impact than ocean acidification and the latter might serve as a modulating factor (Schlüter et al., 2014; Zhong et al., 2021; Jin et al., 2022; Xu et al., 2023; Supplementary Material Table S9). For phytoplankton living in the natural dynamic environment, either an acclimation or an adaptation strategy is essential in determining “winners” and “losers” under the influences of climate changes (Somero, 2010). Different timescales of exposure to a perturbation can result in similar or different physiological responses of phytoplankton species from different regions; when mild warming treatment is applied to phytoplankton strains isolated from cold seas, as in the present work, phenotypic plasticity prevails.
Data availability statement
The original contributions presented in the study are included in the article/Supplementary Material. Further inquiries can be directed to the corresponding author.
Author contributions
KG designed the experiments, CZ, DZ performed the experiments, DZ, XY wrote the original draft, JB, KG reviewed and edited the manuscript. All authors contributed to the article and approved the submitted version.
Funding
This study was supported by the national key R&D program (2022YFC3105303) and National Natural Science Foundation of China (41721005, 41890803).
Acknowledgments
The authors are grateful to the laboratory engineers Xianglan Zeng and Wenyan Zhao for their logistical and technical support and to Dr. Liming Qu for helping maintaining the algal cultures during COVID-19 pandemic.
Conflict of interest
The authors declare that the research was conducted in the absence of any commercial or financial relationships that could be construed as a potential conflict of interest.
Publisher’s note
All claims expressed in this article are solely those of the authors and do not necessarily represent those of their affiliated organizations, or those of the publisher, the editors and the reviewers. Any product that may be evaluated in this article, or claim that may be made by its manufacturer, is not guaranteed or endorsed by the publisher.
Supplementary material
The Supplementary Material for this article can be found online at: https://www.frontiersin.org/articles/10.3389/fmars.2023.1211804/full#supplementary-material
References
Arnold H. E., Kerrison P., Steinke M. (2013). Interacting effects of ocean acidification and warming on growth and DMS-production in the haptophyte coccolithophore Emiliania huxleyi. Global Change Biol. 19 (4), 1007–1016. doi: 10.1111/gcb.12105
Bach L. T., Mackinder L. C., Schulz K. G., Wheeler G., Schroeder D. C., Brownlee C., et al. (2013). Dissecting the impact of CO2 and pH on the mechanisms of photosynthesis and calcification in the coccolithophore Emiliania huxleyi. New Phytol. 199 (1), 121–134. doi: 10.1111/nph.12225
Balch W., Drapeau D., Bowler B., Booth E. (2007). Prediction of pelagic calcification rates using satellite measurements. Deep Sea Res. Part II: Topical Stud. Oceanography 54 (5-7), 478–495. doi: 10.1016/j.dsr2.2006.12.006
Brandenburg K. M., Velthuis M., Van de Waal D. B. (2019). Meta-analysis reveals enhanced growth of marine harmful algae from temperate regions with warming and elevated CO2 levels. Global Change Biol. 25 (8), 2607–2618. doi: 10.1111/gcb.14678
Cheng L.-M., Zhang S.-F., Xie Z.-X., Li D.-X., Lin L., Wang M.-H., et al. (2022). Metabolic adaptation of a globally important diatom following 700 generations of selection under a warmer temperature. Environ. Sci. Technol. 56 (8), 5247–5255. doi: 10.1021/acs.est.1c08584
Edwards K. F., Thomas M. K., Klausmeier C. A., Litchman E. (2016). Phytoplankton growth and the interaction of light and temperature: a synthesis at the species and community level. Limnology Oceanography 61 (4), 1232–1244. doi: 10.1002/lno.10282
Eppley R. W., Holmes R. W., Strickland J. D. (1967). Sinking rates of marine phytoplankton measured with a fluorometer. J. Exp. Mar. Biol. Ecol. 1 (2), 191–208. doi: 10.1016/0022-0981(67)90014-7
Feng Y., Warner M. E., Zhang Y., Sun J., Fu F. X., Rose J. M., et al. (2008). Interactive effects of increased pCO2, temperature and irradiance on the marine coccolithophore Emiliania huxleyi (Prymnesiophyceae). Eur. J. Phycology 43 (1), 87–98. doi: 10.1080/09670260701664674
Fu Q., Gao K. (2022). Reduced salinity exacerbates the viral infection on the coccolithophorid Emiliania huxleyi at elevated pCO2. Front. Mar. Sci. 9. doi: 10.3389/fmars.2022.1091476
Gao K. (2021). Approaches and involved principles to control pH/pCO2 stability in algal cultures. J. Appl. Phycology 33 (6), 3497–3505. doi: 10.1007/s10811-021-02585-y
Geisen M., Billard C., Broerse A. T., Cros L., Probert I., Young J. R. (2002). Life-cycle associations involving pairs of holococcolithophorid species: intraspecific variation or cryptic speciation? Eur. J. Phycology 37 (4), 531–550. doi: 10.1017/S0967026202003852
Gillooly J. F., Brown J. H., West G. B., Savage V. M., Charnov E. L. (2001). Effects of size and temperature on metabolic rate. Science 293 (5538), 2248–2251. doi: 10.1126/science.1061967
Guan W., Gao K. (2010). Impacts of UV radiation on photosynthesis and growth of the coccolithophore Emiliania huxleyi (Haptophyceae). Environ. Exp. Bot. 67 (3), 502–508. doi: 10.1016/j.envexpbot.2009.08.003
Holligan P. M., Viollier M., Harbour D. S., Camus P., Champagne-Philippe M. (1983). Satellite and ship studies of coccolithophore production along a continental shelf edge. Nature 304 (5924), 339–342. doi: 10.1038/304339a0
Jin P., Agustí S. (2018). Fast adaptation of tropical diatoms to increased warming with trade-offs. Sci. Rep. 8 (1), 17771. doi: 10.1038/s41598-018-36091-y
Jin P., Gao K., Beardall J. (2013). Evolutionary responses of a coccolithophorid gephyrocapsa oceanica to ocean acidification. Evolution 67 (7), 1869–1878. doi: 10.1111/evo.12112
Jin P., Wan J., Zhou Y., Gao K., Beardall J., Lin J., et al. (2022). Increased genetic diversity loss and genetic differentiation in a model marine diatom adapted to ocean warming compared to high CO2. ISME J. 16 (11), 2587–2598. doi: 10.1038/s41396-022-01302-y
Leonardos K., Geider R. J. (2005). Elevated atmospheric carbon dioxide increases organic carbon fixation by Emiliania huxleyi (haptophyta), under nutrient-limited high-light conditions. J. Phycology 41, 1196–1203. doi: 10.1111/j.1529-8817.2005.00152.x
Listmann L., LeRoch M., Schlüter L., Thomas M. K., Reusch T. B. H. (2016). Swift thermal reaction norm evolution in a key marine phytoplankton species. Evolutionary Appl. 9 (9), 1156–1164. doi: 10.1111/eva.12362
Litchman E., Klausmeier C. A., Schofield O. M., Falkowski P. G. (2007). The role of functional traits and trade-offs in structuring phytoplankton communities: scaling from cellular to ecosystem level. Ecol. Lett. 10 (12), 1170–1181. doi: 10.1111/j.1461-0248.2007.01117.x
Lund J. W. G. (1949). Studies on asterionella: i. the origin and nature of the cells producing seasonal maxima. J. Ecol. 37, 389–419. doi: 10.2307/2256614
Marañón E. (2015). Cell size as a key determinant of phytoplankton metabolism and community structure. Annu. Rev. Mar. Sci. 7, 241–264. doi: 10.1146/annurev-marine-010814-015955
Masson-Delmotte V., Zhai P., Pirani A., Connors S. L., Péan C., Chen Y., et al. (2021). IPCC 2021: climate change 2021: the physical science basis. contribution of working group I to the sixth assessment report of the intergovernmental panel on climate change (Cambridge: Cambridge University Press).
McKew B. A., Metodieva G., Raines C. A., Metodiev M. V., Geider R. J. (2015). Acclimation of Emiliania huxley) to nutrient limitation involves precise modification of the proteome to scavenge alternative sources of n and p. Environ. Microbiol. 17 (10), 4050–4062. doi: 10.1111/1462-2920.12957
Morán X. A. G., López-Urrutia Ángel., Calvo-Díaz A., Li W. K. (2010). Increasing importance of small phytoplankton in a warmer ocean. Global Change Biol. 16 (3), 1137–1144. doi: 10.1111/j.1365-2486.2009.01960.x
Nanninga H. J., Tyrrell T. (1996). Importance of light for the formation of algal blooms by Emiliania huxleyi. Mar. Ecol. Prog. Ser. 136, 195–203. doi: 10.3354/meps136195
Paasche E. (1999). Reduced coccolith calcite production under light-limited growth: a comparative study of three clones of Emiliania huxleyi (Prymnesiophyceae). Phycologia 38 (6), 508–516. doi: 10.2216/i0031-8884-38-6-508.1
Paasche E. (2002). A review of the coccolithophorid Emiliania huxleyi (Prymnesiophyceae), with particular reference to growth, coccolith formation, and calcification-photosynthesis interactions. Phycologia 40 (6), 503–529. doi: 10.2216/i0031-8884-40-6-503.1
Paasche E., Brubak S., Skattebøl S., Young J. R., Green J. C. (1996). Growth and calcification in the coccolithophorid Emiliania huxleyi (Haptophyceae) at low salinities. Phycologia 35 (5), 394–403. doi: 10.2216/i0031-8884-35-5-394.1
Padfield D., Yvon-Durocher G., Buckling A., Jennings S., Yvon-Durocher G. (2016). Rapid evolution of metabolic traits explains thermal adaptation in phytoplankton. Ecol. Lett. 19 (2), 133–142. doi: 10.1111/ele.12545
Platt T. G. C. L., Gallegos C. L., Harrison W. G. (1980). Photoinhibition of photosynthesis in natural assemblages of marine phytoplankton. J. Mar. Res. 38, 687–701.
Porra R. J. (2002). The chequered history of the development and use of simultaneous equations for the accurate determination of chlorophylls a and b. Photosynthesis Res. 73, 149–156. doi: 10.1023/A:1020470224740
Pörtner H.-O., Roberts D. C., Masson-Delmotte V., Zhai P., Tignor M., Poloczanska E., et al. (2019). “IPCC special report on the ocean and cryosphere in a changing climate,” in IPCC intergovernmental panel on climate change, vol. 1. (Cambridge, UK and New York, NY, USA: Cambridge University Press).
Poulton A. J., Adey T. R., Balch W. M., Holligan P. M. (2007). Relating coccolithophore calcification rates to phytoplankton community dynamics: regional differences and implications for carbon export. Deep Sea Res. Part II: Topical Stud. Oceanography 54 (5-7), 538–557. doi: 10.1016/j.dsr2.2006.12.003
Raven J. A., Geider R. J. (1988). Temperature and algal growth. New Phytol. 110 (4), 441–461. doi: 10.1111/j.1469-8137.1988.tb00282.x
Rost B., Riebesell U. (2004). Coccolithophores and the biological pump: responses to environmental changes (Berlin, Heidelberg: Coccolithophores, Springer), 99–125.
Savage V. M., Gillooly J. F., Brown J. H., West G. B., Charnov E. L. (2004). Effects of body size and temperature on population growth. Am. Nat. 163 (3), 429–441. doi: 10.1086/381872
Schaum C. E., Barton S., Bestion E., Buckling A., Garcia-Carreras B., Lopez P., et al. (2017). Adaptation of phytoplankton to a decade of experimental warming linked to increased photosynthesis. Nat. Ecol. Evol. 1 (4), 0094. doi: 10.1038/s41559-017-0094
Schaum C. E., Buckling A., Smirnoff N., Studholme D. J., Yvon-Durocher G. (2018). Environmental fluctuations accelerate molecular evolution of thermal tolerance in a marine diatom. Nat. Commun. 9 (1), 1719. doi: 10.1038/s41467-018-03906-5
Schlüter L., Lohbeck K. T., Gutowska M. A., Gröger J. P., Riebesell U., Reusch T. B. H. (2014). Adaptation of a globally important coccolithophore to ocean warming and acidification. Nat. Climate Change 4 (11), 1024–1030. doi: 10.1038/nclimate2379
Schoolfield R. M., Sharpe P. J. H., Magnuson C. E. (1981). Non-linear regression of biological temperature-dependent rate models based on absolute reaction-rate theory. J. Theor. Biol. 88 (4), 719–731. doi: 10.1016/0022-5193(81)90246-0
Smith R. E., Kalff J. (1982). Size-dependent phosphorus uptake kinetics and cell quota in phytoplankton. J. Phycology 18 (2), 275–284. doi: 10.1111/j.1529-8817.1982.tb03184.x
Somero G. N. (2010). The physiology of climate change: how potentials for acclimatization and genetic adaptation will determine ‘winners’ and ‘losers’. J. Exp. Biol. 213 (6), 912–920. doi: 10.1242/jeb.037473
Thomas M. K., Kremer C. T., Klausmeier C. A., Litchman E. (2012). A global pattern of thermal adaptation in marine phytoplankton. Science 338 (6110), 1085–1088. doi: 10.1126/science.1224836
Tong S., Gao K., Hutchins D. A. (2018). Adaptive evolution in the coccolithophore Gephyrocapsa oceanica following 1,000 generations of selection under elevated CO2. Global Change Biol. 24 (7), 3055–3064. doi: 10.1111/gcb.14065
Toseland A., Daines S. J., Clark J. R., Kirkham A., Strauss J., Uhlig C., et al. (2013). The impact of temperature on marine phytoplankton resource allocation and metabolism. Nat. Climate Change 3 (11), 979–984. doi: 10.1038/nclimate1989
van Rij J., Hendriks P., van Rijn H., Baayen R. H., Wood S. N. (2019). Analyzing the time course of pupillometric data. Trends Hearing 23, 2331216519832483. doi: 10.1177/2331216519832483
Weller C., Wu M. (2015). A generation-time effect on the rate of molecular evolution in bacteria. Evolution 69 (3), 643–652. doi: 10.1111/evo.12597
Xu K., Gao K., Villafañe V. E., Helbling E. W. (2011). Photosynthetic responses of Emiliania huxleyi to UV radiation and elevated temperature: roles of calcified coccoliths. Biogeosciences 8 (6), 1441–1452. doi: 10.5194/bg-8-1441-2011
Xu D., Zheng G., Brennan G., Wang Z., Jiang T., Sun K., et al. (2023). Plastic responses lead to increased neurotoxin production in the diatom Pseudo-nitzschia under ocean warming and acidification. ISME J. 17, 525–536. doi: 10.1038/s41396-023-01370-8
Yi X., Fu F. X., Hutchins D. A., Gao K. (2020). Light availability modulates the effects of warming in a marine N2 fixer. Biogeosciences 17 (4), 1169–1180. doi: 10.5194/bg-17-1169-2020
Zhang Y., Zhang Y., Ma S., Chen H., Li J., Li Z., et al. (2023). Reallocation of elemental content and macromolecules in the coccolithophore Emiliania huxleyi to acclimate to climate change. Biogeosciences 20 (7), 1299–1312. doi: 10.5194/bg-20-1299-2023
Zhong J., Guo Y., Liang Z., Huang Q., Lu H., Pan J., et al. (2021). Adaptation of a marine diatom to ocean acidification and warming reveals constraints and trade-offs. Sci. Total Environ. 771, 145167. doi: 10.1016/j.scitotenv.2021.145167
Keywords: Emiliania huxleyi, seawater warming, growth, photosynthesis, phytoplankton
Citation: Zhou C, Zhang D, Yi X, Beardall J and Gao K (2023) No adaptation to warming after selection for 800 generations in the coccolithophore Emiliania huxleyi BOF 92. Front. Mar. Sci. 10:1211804. doi: 10.3389/fmars.2023.1211804
Received: 25 April 2023; Accepted: 08 June 2023;
Published: 26 June 2023.
Edited by:
Zhaohe Luo, Ministry of Natural Resources, ChinaReviewed by:
Jianrong Xia, Guangzhou University, ChinaGustaaf Marinus Hallegraeff, University of Tasmania, Australia
Copyright © 2023 Zhou, Zhang, Yi, Beardall and Gao. This is an open-access article distributed under the terms of the Creative Commons Attribution License (CC BY). The use, distribution or reproduction in other forums is permitted, provided the original author(s) and the copyright owner(s) are credited and that the original publication in this journal is cited, in accordance with accepted academic practice. No use, distribution or reproduction is permitted which does not comply with these terms.
*Correspondence: Kunshan Gao, a3NnYW9AeG11LmVkdS5jbg==
†These authors have contributed equally to this work and share first authorship