 Natalia Gorska1*
 Beata Schmidt2
 Jan Marcin Węsławski3Miłosz Grabowski1
 Agata Dragan-Górska1Joanna Szczucka1Agnieszka Beszczynska-Möller4
- 1Marine Acoustics Laboratory, Marine Physics Department, Institute of Oceanology Polish Academy of Sciences (PAS), Sopot, Poland
- 2Department of Fisheries Oceanography and Marine Ecology, National Marine Fisheries Research Institute, Gdynia, Poland
- 3Marine Ecology Department, Institute of Oceanology PAS, Sopot, Poland
- 4Observation Oceanography Laboratory, Physical Oceanography Department, Institute of Oceanology Polish Academy of Sciences (PAS), Sopot, Poland
Introduction: Kongsfjorden is being impacted by climate warming, which has fostered the increase of abundance of Atlantic fish (e.g. Atlantic cod, Gadus morhua), fish that are non-endemic for Kongsfjorden. The growth and high predation potential of Atlantic fish may affect the survival of polar cod (Boreogadus saida), native species of the Kongsfjorden, a species with ecological and economic value. This means that it is important to monitor the impact of climate change on the fjord fish community. This, as well as the experience of the successful use of hydroacoustic techniques in the fjord, encouraged us to continue in 2022 the hydroacoustic study of fish that began in 2013 and 2014. Our main goal was to understand and confirm how the fish community in Kongsfjorden has changed over the last decade under the influence of global warming.
Methods: Our approach aimed not only to replicate the previous research conducted in 2013 and 2014, based on the same methodology for collecting and analyzing hydroacoustic data, but also to compare the newly acquired data with the results available in the previous publications. The histograms of fish target strength (a measure of sound backscatter by an individual) were analyzed and the fish spatial distribution (regarding thermohaline structure and “predator-prey” relationships) was acoustically observed.
Results: The presence of native polar cod and non-endemic Atlantic cod in the Kongsfjorden was shown. Furthermore, during the study period, an increase in fish size diversity was observed, which suggests change in the food web and a decline in native polar cod. It was confirmed that the process of establishment of non-Arctic species Atlantic cod in Kongsfjorden continues.
Discussion: We went beyond the spatial and temporal constraints of previous Kongsfjorden studies, taking into account fjord fish communities over a wider area and over the long term. Therefore, our understanding of climate warming impact on the fish community of Kongsfjorden has been deepened. Further progress necessitates annual hydroacoustic observation of the fjord fish community accompanied by biological sampling.
1 Introduction
The arctic ecosystem is extremely sensitive to climate warming (Hassol, 2004; Pavlov et al., 2013). Climate change, inducing temperature increase, is causing an overall northward shift of boreal fish species toward the Arctic and favoring the establishment of non-arctic species (Drinkwater, 2005; Renaud et al., 2012; Christiansen et al., 2014; Ottersen et al., 2014; Berge et al., 2015a; Fossheim et al., 2015; Brand and Fischer, 2016; Kunz et al., 2016; Misund et al., 2016; Baschek et al., 2017; Fey and Węsławski, 2017; Fischer et al., 2017; Ingvaldsen et al., 2017; Geoffroy et al., 2019; Brand et al., 2022; Giacalone et al., 2022; Snoeijs-Leijonmalm et al., 2022).
Svalbard’s fjords, like Kongsfjorden, are also experiencing these consequences of climate warming. For example, the overall temperature increase of Atlantic water, carried by the West Spitsbergen Current (WSC, Beszczynska-Möller et al., 2012), has caused increased warm inflows into Kongsfjorden (Hop et al., 2019; Payne and Roesler, 2019). This supports the increase of abundance of Atlantic fish (e.g. Atlantic cod Gadus morhua, and haddock Melanogrammus aeglefinus), which are non-endemic for Kongsfjorden (Renaud et al., 2012; Berge et al., 2015a; Brand and Fischer, 2016; Kunz et al., 2016; Baschek et al., 2017; Fey and Węsławski, 2017; Fischer et al., 2017; Brand et al., 2022).
In Kongsfjorden, adult Atlantic cod have been occasionally caught in commercial fishing nets since the 1880s (Brand et al., 2022). Since 2004, a significant increase in adult Atlantic cod abundance has been documented (Renaud et al., 2012; Berge et al., 2015b). The spawning of adults inside the fjord and Atlantic cod juveniles being caught in nets has been observed since 2008 (Berge et al., 2015b, Brand et al., 2022).
The increases in abundance of Atlantic cod (Gadus morhua), their high predation potential, and food competition may impact on the persistence of the polar cod Boreogadus saida (e.g. Fey and Węsławski, 2017), the abundant local species of the Kongsfjorden (Hop et al., 2002). Therefore, it is important to understand the effects of climate change on the fjord’s highly diverse ecosystem, including fish stocks.
Kongsfjorden has been protected from the fishing industry since 2000 (Sysselmannen regulations, https://www.sysselmesteren.no/en/laws-and-regulations/); thus, no commercial fishery data are available and sparse research cruises are the only source of information about the fish community. This and the difficult conditions of conducting research in the Arctic fjords makes it important to adopt a comprehensive approach using all possible research techniques. Kongsfjorden’s history of fish research goes beyond traditional contact (Renaud et al., 2012; Berge et al., 2015a; Brand and Fischer, 2016; Kunz et al., 2016; Baschek et al., 2017; Fey and Węsławski, 2017; Fischer et al., 2017; Brand et al., 2022) and optical methods (Baschek et al., 2017; Fischer et al., 2017). Hydroacoustic techniques have also been used (Keskinen et al., 2004; Renaud et al., 2012; Berge et al., 2015a; Szczucka et al., 2017; Giacalone et al., 2021; Giacalone et al., 2022).
Different hydroacoustic instruments have been successfully employed to detect fish spatial distribution in Kongsfjorden, to estimate their biomass, and to identify the species. Diel Vertical Migration (DVM) of organisms has been studied using split beam echosounders for polar cod (Keskinen et al., 2004) and an Acoustic Zooplankton and Fish Profiler (AZFP) for fish and zooplankton (Berge et al., 2015a). Renaud et al. (2012) in 2008 detected the aggregations of pelagic organisms using an EK-60 multifrequency hydroacoustic profiler in order to define what depth strata would be targeted for fish collections. Szczucka et al. (2017) estimated fish biomass and defined fish spatial distribution in Kongsfjorden using split beam echosounders. Giacalone et al (2021; 2022). classified fish species in the fjord analyzing the backscatter data collected by a multibeam echosounder.
Hydroacoustic techniques, which are non-invasive and allow the investigation of large marine areas in a relatively short time, have provided reliable effective information on the state of fish resources in Kongsfjorden. Additionally, the use of hydroacoustics has no “depth limitations”, in contrast to biological research, for which collecting biological material at a greater depth could encounter some difficulties.
The aforementioned importance of monitoring Kongsfjorden’s fish community and the experience of successfully applying hydroacoustic techniques in the fjord encouraged us to continue the hydroacoustic study of fish in the fjord in 2022, a study that was started in 2013 and 2014 by Szczucka et al. (2017). The hypothesis for this study comes from the fact that the original Arctic ecosystem of Kongsfjorden was characterized by a single pelagic small and abundant fish – the polar cod (Hop et al., 2002). As the warming proceeded, a non-endemic species - Atlantic cod – arrived, and size frequency changed from near-unimodal to bimodal (Szczucka et al., 2017). Here we want to check if this process continues, i.e. whether the size structure of fish in the warmed Kongsfjorden becomes more complex as an effect of increased biodiversity and complexity of the local food web, as proposed by Węsławski et al. (2017). Our main goal was to understand how the fish community in the fjord has changed over the last decade under the influence of climate warming. Particular attention was paid to juvenile Atlantic cod, as knowledge about its occurrence in Kongsfjorden has been rather fragmentary.
Our approach consisted of two parts. The first involved repeating the research conducted by Szczucka et al. (2017) in 2013 and 2014, using the same methodology for collecting and analyzing hydroacoustic data. The second was to compare the data newly acquired in 2022 with the archival data collected in 2013 and 2014 as well as with the available published results obtained in other research periods (Keskinen et al., 2004; Giacalone et al., 2021; Giacalone et al., 2022).
In order to explain the shifts in fish community, the differences in the fjord’s thermohaline structure, found in the studied years, were considered, as well as changes in the predator-prey relationships.
In our study we collected hydroacoustic data using split beam echosounders and were interested in the statistical distributions (histograms) of fish target strength (TS). This characteristic is used to describe how effective fish backscatters incident sound are (e.g. acoustic wave generated by echosounder) (Simmonds and MacLennan, 2005). In other words, TS is a measure of the backscattering by individual fish. This characteristic is controlled by fish length, fish species, and fish behavior (Simmonds and MacLennan, 2005). By studying the distributions of TS, information on fish length and species could be obtained.
If the hydroacoustic studies of fish in Kongsfjorden so far concern only selected years (Keskinen et al., 2004; Renaud et al., 2012; Berge et al., 2015a; Szczucka et al., 2017; Giacalone et al., 2021; Giacalone et al., 2022), we sought to get out of this constraint and look at fish community changes in a more long-term perspective.
Moreover, we have gone beyond the spatial limitations of the previous studies at Kongsfjorden due to using hydroacoustic techniques. Our predecessors collected data at selected stations in the shallower part of the fjord (e.g. Brand et al., 2022), at one station (Keskinen et al., 2004), or along one short transect (Giacalone et al., 2022). Our transects are much longer and include both the shallower and deeper parts of the Kongsfjorden.
2 Materials and methods
2.1 Measurements
2.1.1 Survey design
The hydroacoustic and hydrographic (temperature and salinity) data, used in the analysis, were collected in Kongsfjorden. This fjord, being oriented from Southeast to Northwest, is located in the northern part of the West Spitsbergen coast at about 79°N and 11°-12°E (Figure 1). The absence of the sill at the fjord mouth allows for exchanging the fjord and shelf waters. Kongsfjorden is strongly influenced by warmer Atlantic waters, carried by the West Spitsbergen Current (Figure 1) (Svendsen et al., 2002; Cottier et al., 2005; Promińska et al., 2017; Tverberg et al., 2019; De Rovere et al., 2022).
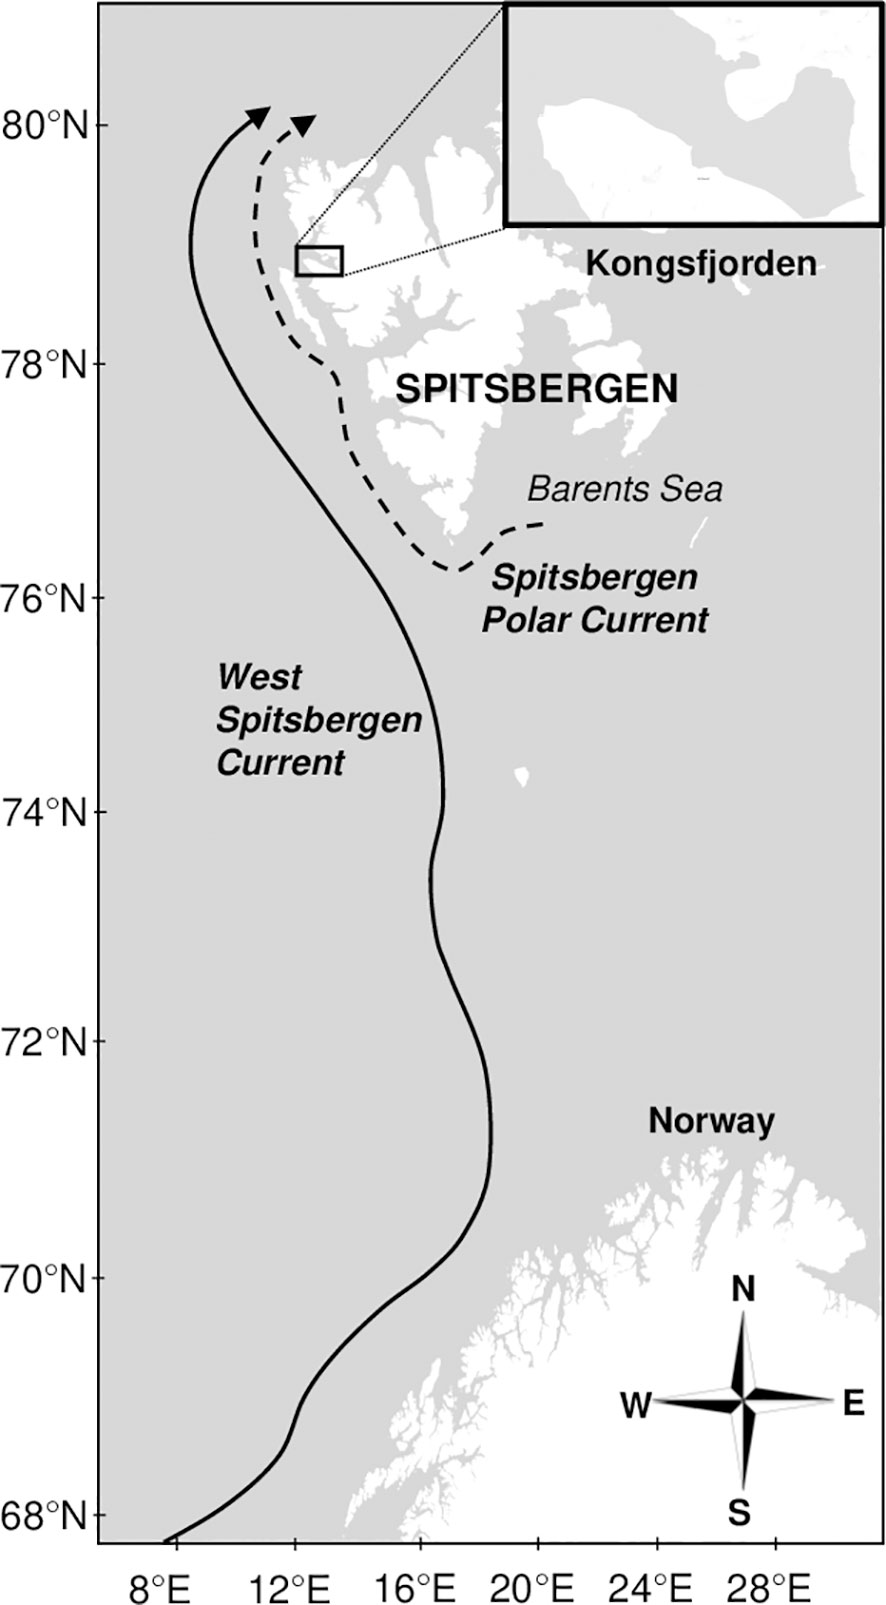
Figure 1 Study area. Map of Spitsbergen created with GeoMapApp (www.geomapapp.org).
In all three years, the measurements were collecyed on board R/V Oceania in the first decade of August. Dates and times of the data collection on different transects are presented for different years in Table 1.
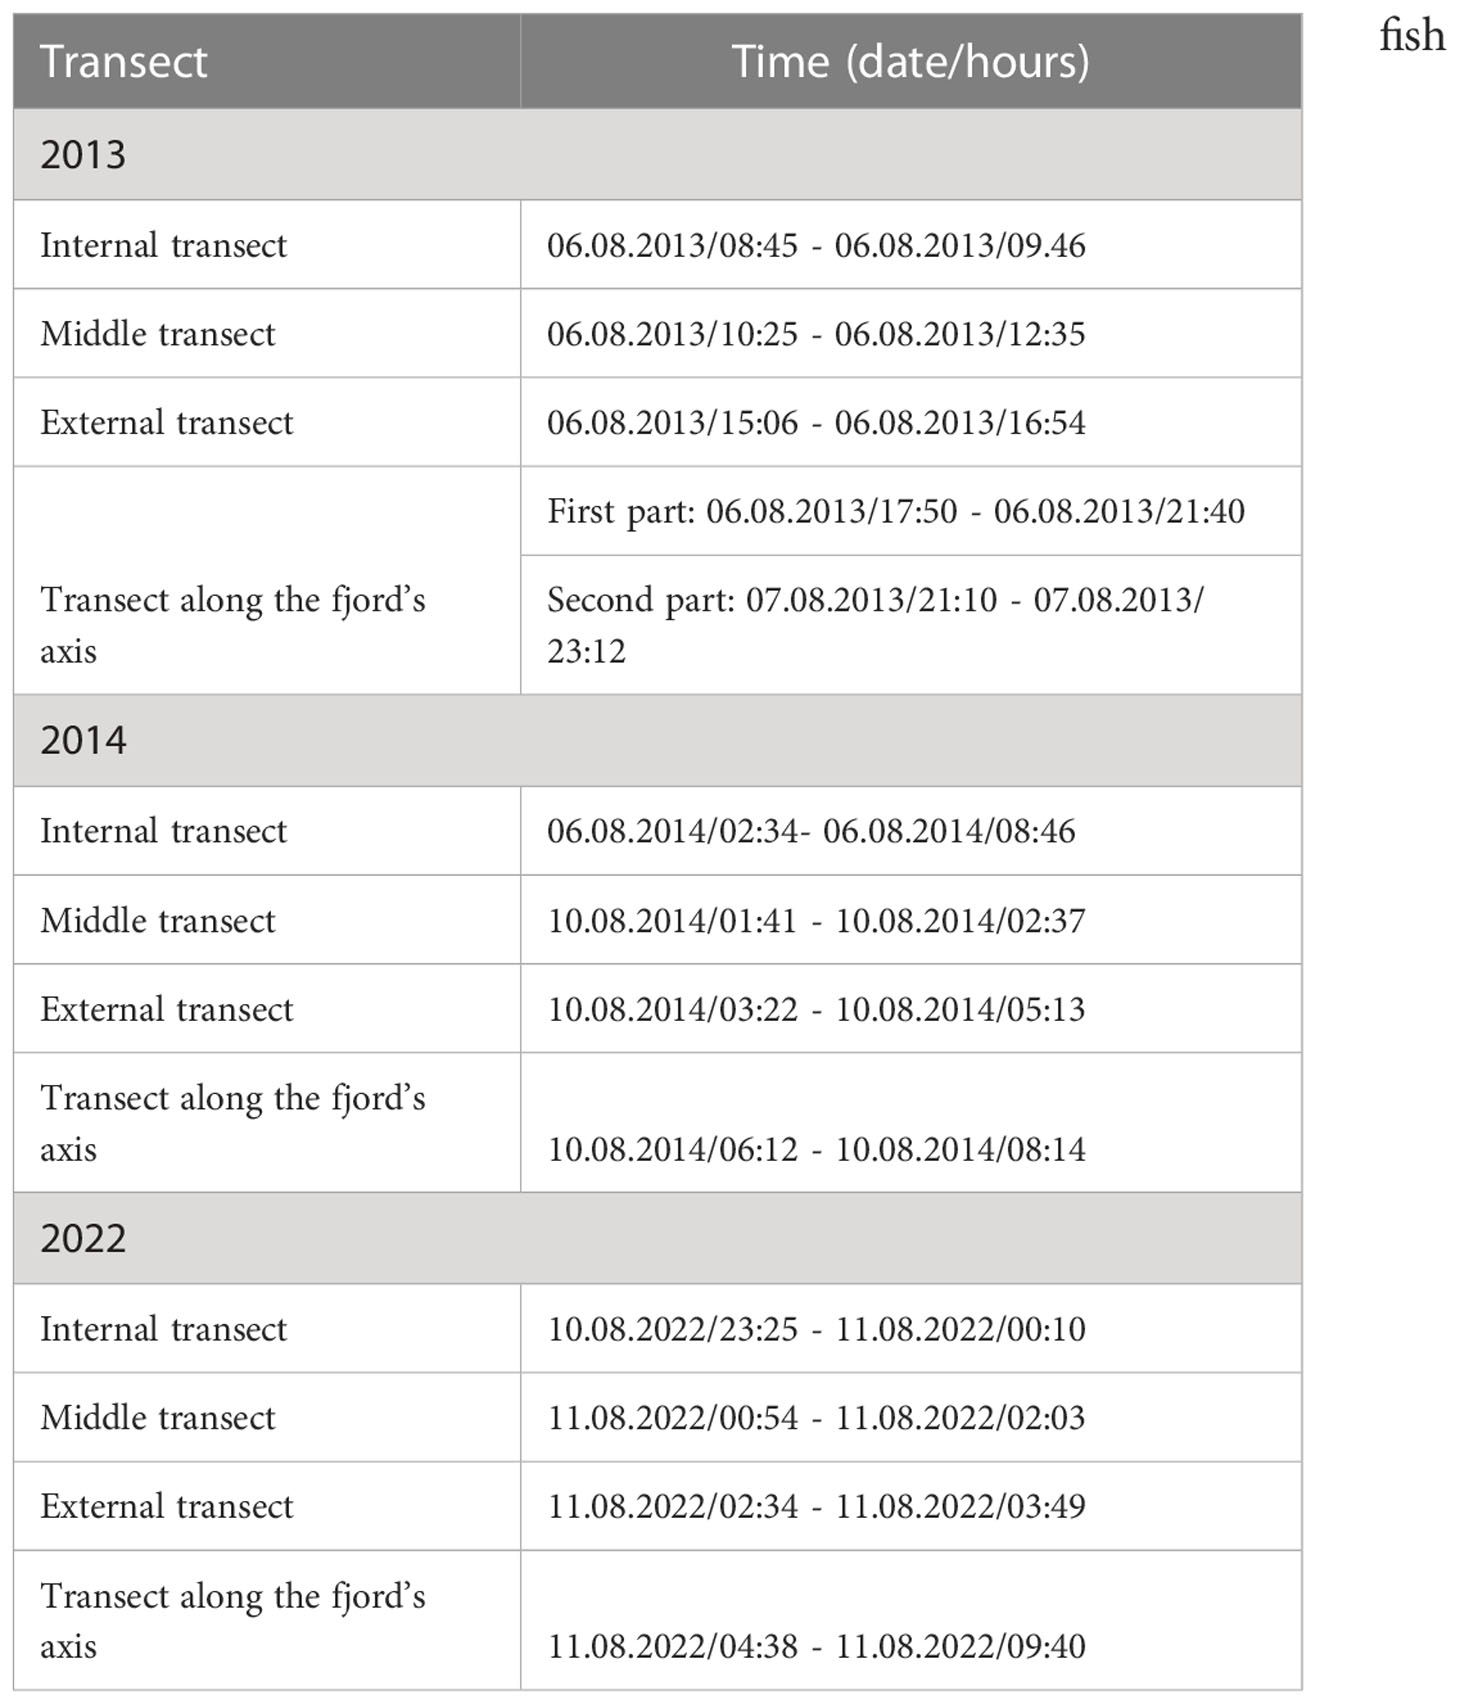
Table 1 Dates and times of the data collection on the selected transects (2013, 2014, and 2022 surveys).
Unfortunately, no fish samples from the water column were available to ground-truth the hydroacoustic data. However, in the interpretation of the results, we took into account that the two above-mentioned species belonging to the Gadidae family (Gadus morhua and Boreogadus saida) dominate the fish community in Kongsfjorden (Keskinen et al., 2004; Renaud et al., 2012; Berge et al., 2015a; Brand and Fischer, 2016; Kunz et al., 2016; Baschek et al., 2017; Fey and Węsławski, 2017; Fischer et al., 2017; Szczucka et al., 2017; Giacalone et al., 2021; Brand et al., 2022; Giacalone et al., 2022). Other less numerous species were listed in Berge et al. (2015b): capelin, haddock, herring, and mackerel.
2.1.2 Hydroacoustic data collection
A total of about 80.7 nautical miles of acoustic transects were sampled (27 Nm in 2013, 26.7 Nm in 2014 and about 27 Nm – in 2022). The hydroacoustic measurements have been conducted along four transects (Figure 2A). One of them was along the fjord axis extending from the mouth of the fjord to the easternmost glacier. Three additional transverse transects were perpendicular to the axial section. They were named as external (closest to the fjord’s mouth), middle, and internal (furthest from the fjord’s mouth) transects. Different colors of transects in the figure correspond to different study years: blue – 2013, red – 2014, and black – 2022.
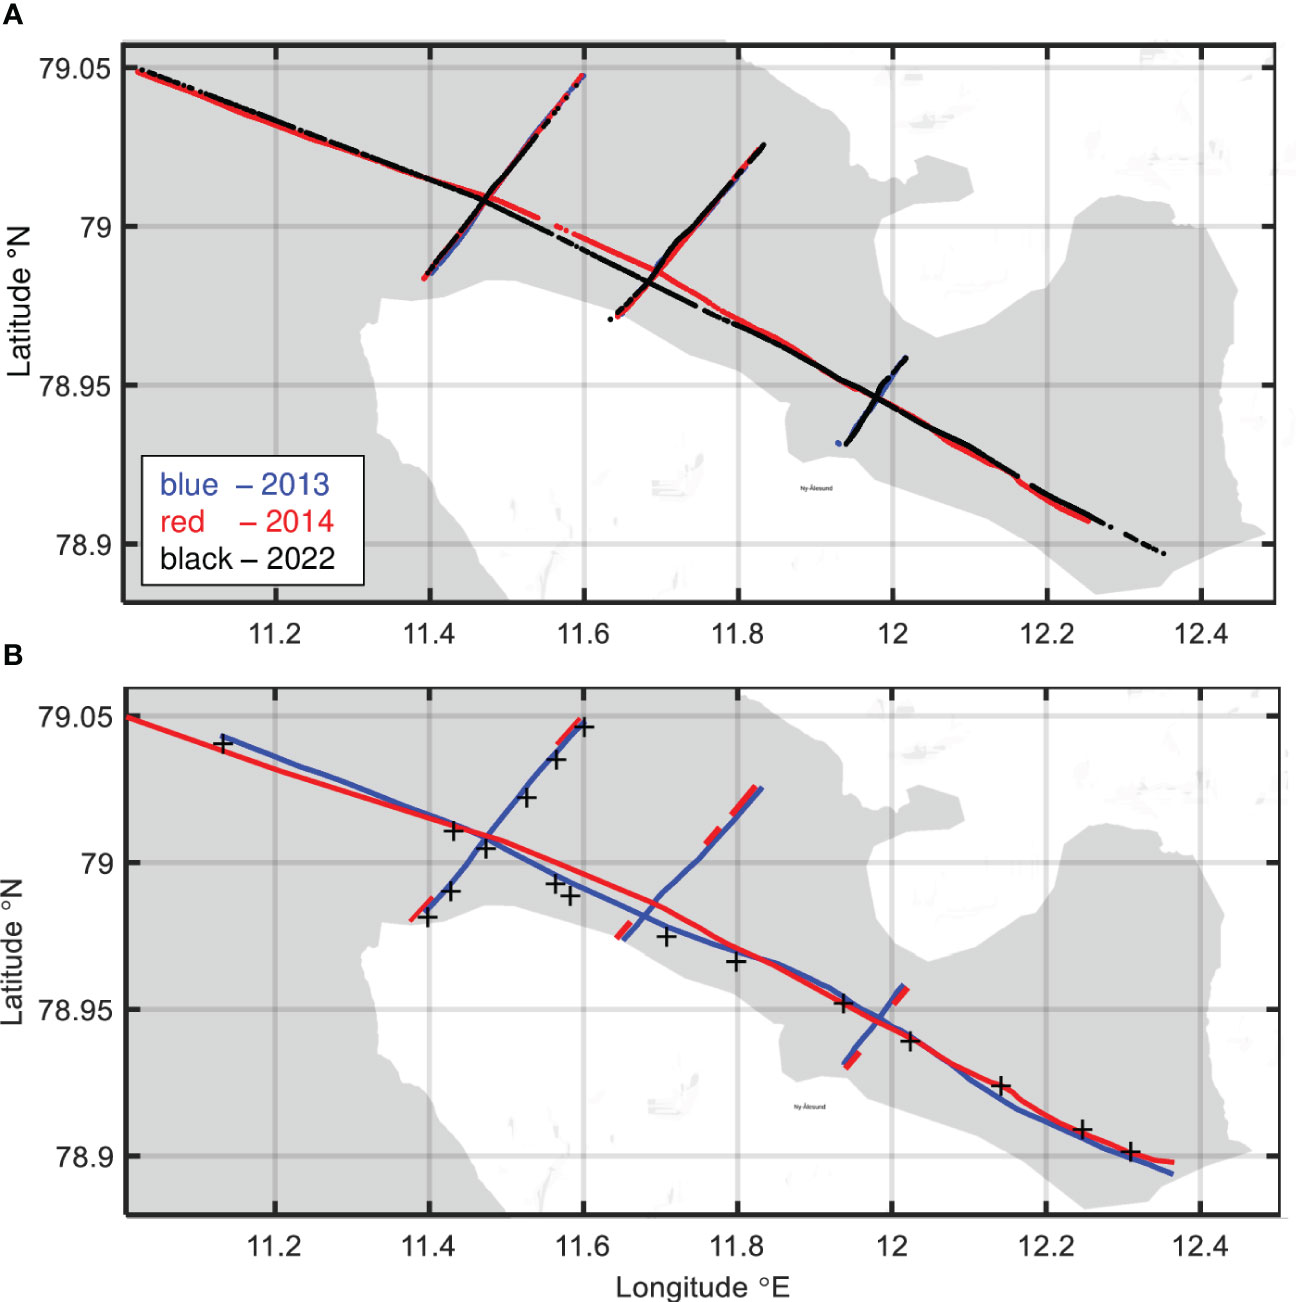
Figure 2 Transects along which the hydroacoustic data were collected (A). CTD sections: (B) transects (lines) and stations (stars). Different colors of lines and stars correspond to different study years: blue – to 2013, red – to 2014, and black – to 2022. Google maps (n.d.) was used to create the figure.
The tracks followed varied slightly between the years. The curves indicating the external or middle transects coincide for all three years. The figure does not show transect along the axis in 2013 and the internal transect in 2014. This is due to the lack of hydroacoustic data for these transects, caused by unforeseen damage of data files at the data analysis stage. The gaps in hydroacoustic data are also listed in Table 2, which shows the availability of data for further analysis.
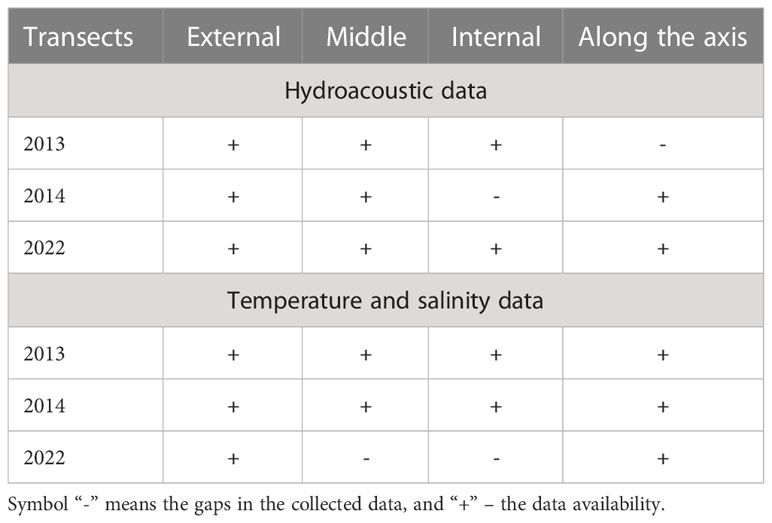
Table 2 The data availability for different transects in 2013, 2014, and 2022.
Backscattering data were collected using Simrad EK60 echosounder equipped with a split beam transducer operating at a frequency of 70 kHz. Its beam width was 7 degrees from the acoustic axis at -3 dB level. The 256 ms pulse length and 2 s-1 - ping rate were set in 2013 and 2014. In 2022, these parameters were respectively 1.024 ms and 1 s-1. In all three years the power setting of 525 W was used. The acoustic transducer was mounted on a rigid frame attached to the broadside of the vessel, approximately 1 m below the sea surface.
Just prior to the survey, the echosounder was calibrated with the standard sphere method (Foote et al., 1987; Kongsberg Maritime, 2012). Hydroacoustic data were collected with dedicated Simrad ER60 software and stored digitally in a raw format for later analysis.
2.1.3 CTD data sampling
In 2013 and 2014, in parallel with hydroacoustic data sampling (along the same transects), temperature and salinity were continuously measured using a towed profiling system equipped with a Sea-Bird Scientific SBE49 FastCat CTD sensor (Promińska et al., 2017). In Figure 2B, the transects are marked with blue and red lines for years 2013 and 2014 respectively. The locations of CTD sections and a total number of the collected profiles varied between the two years (Figure 2B).
In 2013 and 2014, the CTD sensor was calibrated prior to the cruise and initially accurate to ±0.002°C for temperature and ±0.0003 S/m for salinity. CTD profiles were measured in the full water column with the spatial horizontal resolution of a few km when the vessel moved at a speed of about 3 knots.
In 2022, unlike previous years, vertical temperature and salinity profiles were not measured concurrently with the hydroacoustic measurements. Measurements were carried out at stations (black stars in Figure 2B) located along the longitudinal transect (along the axis of the fjord) and the external transverse transect, where hydroacoustic data had previously been collected. CTD data was not collected along the middle and internal transects in 2022 (see Table 2).
In 2022, CTD data were obtained with the Sea-Bird Scientific 911+ CTD system. The double sets of temperature and salinity sensors were calibrated prior to the cruise and their initial accuracies were ±0.001°C and ±0.0003 S/m, respectively.
2.2 Data analysis
2.2.1 Target strength calculations
The target strength analysis was performed to compare the TS histograms of individual fish present in the study area and to examine the spatial distribution of fish of different target strengths. The raw data were processed using Echoview 4.9 (Myriax Software, Hobart, Tasmania). The analysis was performed following the methodology as described by Szczucka et al. (2017).
In the first step, the single target detection algorithm with the following parameters was used with: a minimum TS value of -70 dB a minimum and maximum echo length ratio of 0.7 and 1.3 respectively, a maximum beam compensation of 6 dB, and a maximum standard deviation of axis angle of 0.6°. Additionally, single target detections were filtered to exclude all targets >3° off the beam axis of transducer.
In the next step, a fish tracking algorithm was applied to reduce the stochastic error of the individual single target measurements (Simmonds and MacLennan, 2005). The algorithm identified the groups of extracted single targets that show similar patterns of systematic movement and are assumed to be generated by the same fish. The fish tracking criteria were as follows: minimum number of single targets in track: 3; minimum number of pings in track: 3; and maximum gap between single targets in track: 2. For each individual fish track, the mean TS value, mean depth, and geographical position were calculated.
The 12084 individual fish of different target strengths were selected for further analysis.
2.2.2 CTD data analysis
The temperature and salinity data collected with the SBE49 and SBE911+ CTD systems were processed with the SBE Data Processing Software following the recommended steps and parameters for each system and then vertically averaged into the 1 dbar bins. The vertical profiles of temperature and salinity were analyzed and visualized using the MATLAB software (version R2020b update 6).
3 Results
3.1 Interannual variability of fish size structure
3.1.1 TS-histograms: three fish groups
In Figure 3, the histograms of target strength are presented for three years: 2013 (plot A), 2014 (plot B), and 2022 (plot C). For each year the plot was generated for the data collected during the whole survey.
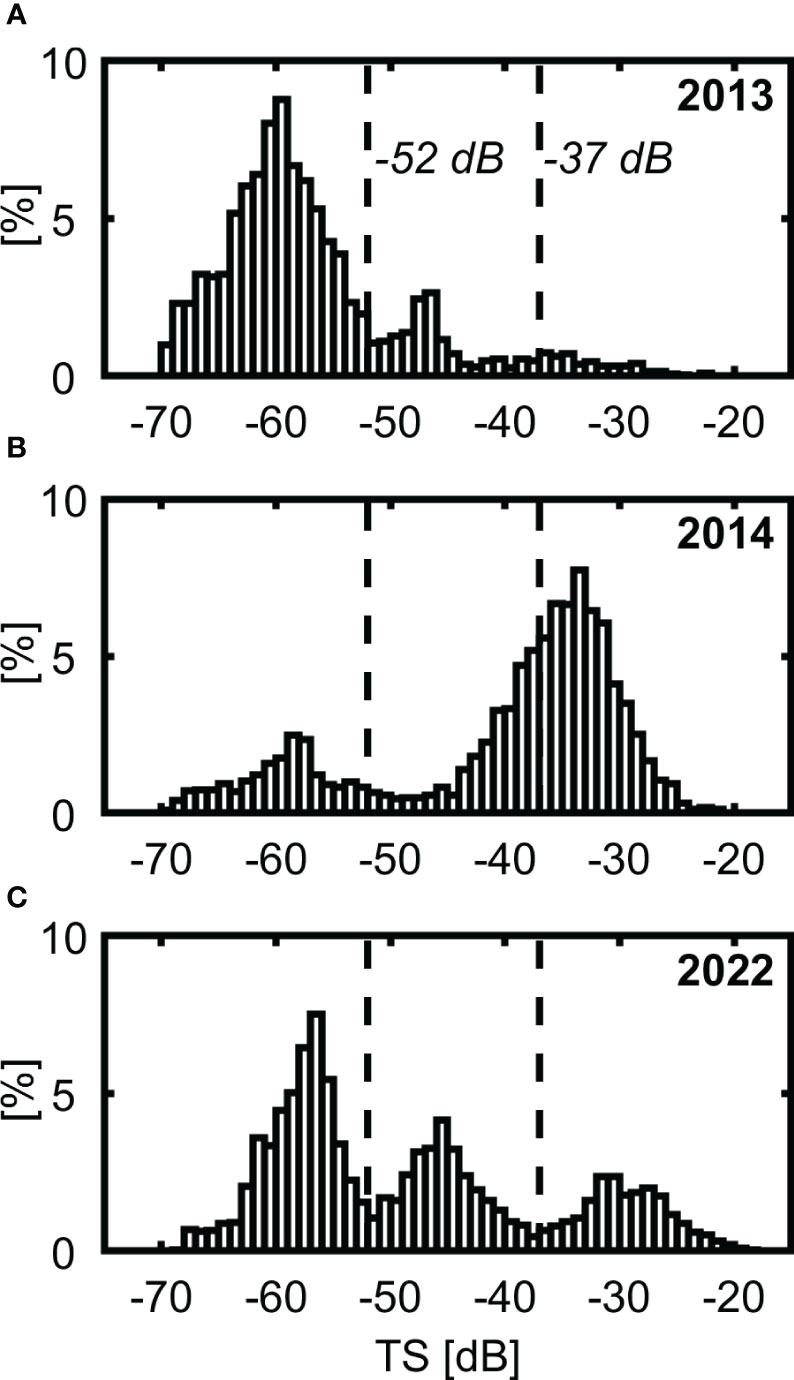
Figure 3 TS-histograms for different years: 2013 (A), 2014 (B), 2022 (C).
Based on the histograms, the three groups of fish could be selected: the first mode corresponds to a group of fish named “small fish” (lower TS - mode with TS< - 52 dB), the second one – “medium fish” (intermediate TS-mode with - 52 dB ≤ TS < - 37 dB), and the last mode – “large fish” (higher TS - mode with TS ≥ - 37 dB). The boundaries between the groups are indicated by vertical solid black lines for all years in Figure 3. The choice of these dB - thresholds (limit values) is explained below in section 4.1.
The proposed names of groups are justified by the fact that the length of fish is one of the main parameters controlling fish TS (Simmonds and MacLennan, 2005) and that the larger the fish length is, the higher the TS. Throughout the manuscript, fish belonging to the groups “small fish”, “medium fish”, and “large fish” are named small, medium, and large fish respectively.
The figure demonstrates that, for fish with TS smaller than about -52 dB, the distribution is unimodal for all three years. However, for fish with TS larger than -52 dB, the bimodal distributions were observed in 2013 and 2022 and was unimodal in 2014.
We want to point out that the “medium fish” group was not numerous in 2013, was absent in 2014, and only in 2022 did its role grow significantly. On the other hand, the figure shows that the role of the “small fish” was the most prominent in 2013 (Figure 3A).
3.1.2 Trends in variability of fish size structure
To generate Figure 4, demonstrating the interannual variability of the size composition of the fish community in Kongsfjorden, the same data as for Figure 3 has been used: each year, the number of individuals in each class of fish was calculated for the entire study. A blue color in the figure corresponds to the “small fish” group, green color to “medium fish”, and brown color to “large fish”. The figure demonstrates that the percentage of small fish was the highest in 2013 (80%), while in 2014 and 2022 it was 19,6% and 48,9% respectively. This means that the total percentage of medium and large fish increased from 20% in 2013 to 80,4% in 2014 and to 51,1% in 2022. It is also worth emphasizing the growing trend in the share of medium fish: 14,8% in 2013, 26,6% in 2014, and 30,1% in 2022.
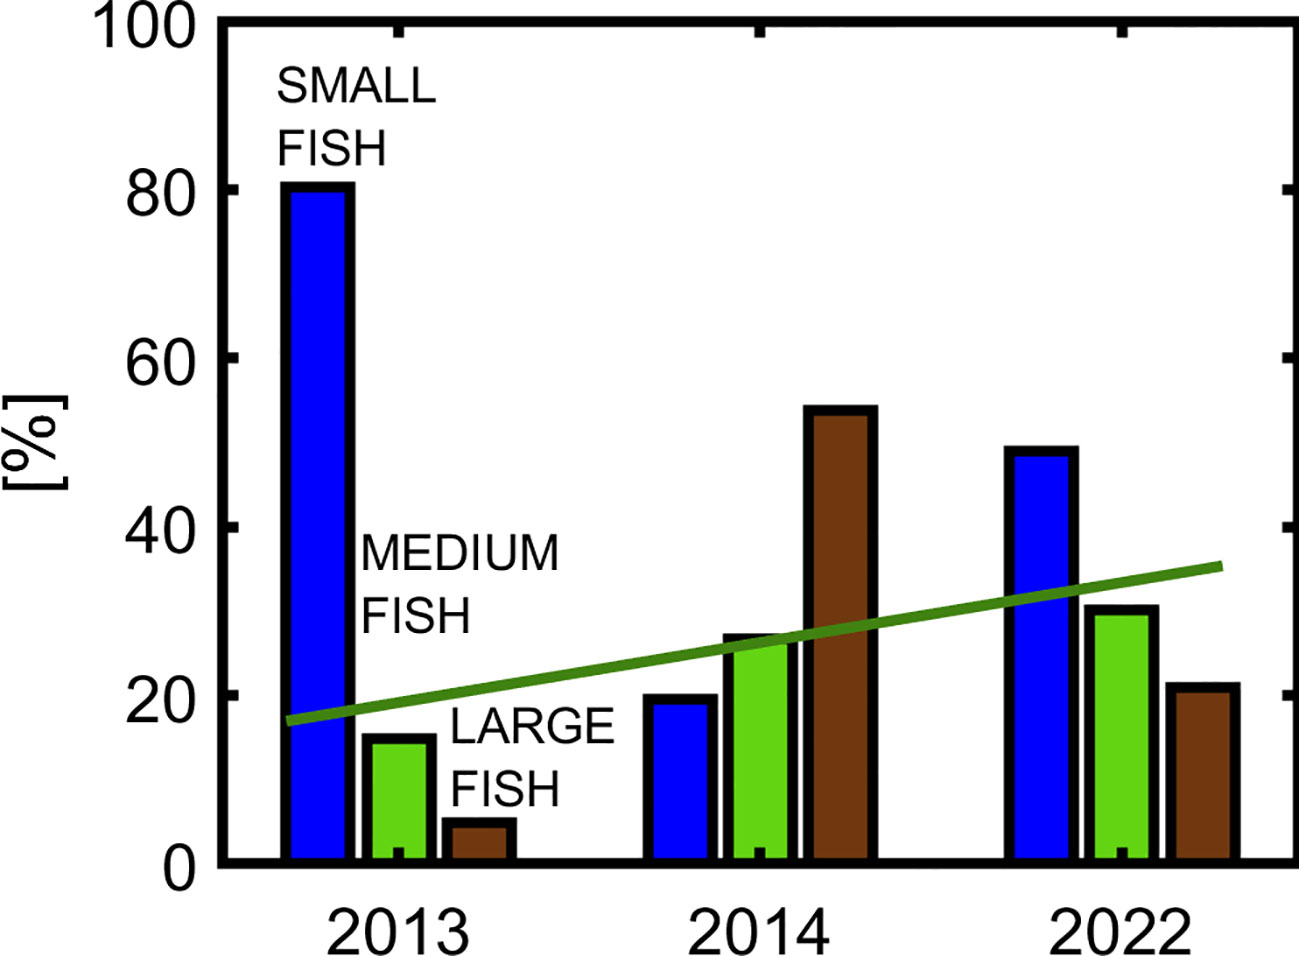
Figure 4 Size composition of the fish community in Kongsfjorden in 2013, 2014, and 2022.
3.2 Fish spatial distribution
To understand how the groups of small, medium, and large fish relate to the two fish species dominant in the fjord (native polar cod and Atlantic cod), the spatial distributions of fish of different TS were considered. Fish spatial distribution is governed by a series of factors: e.g. the thermohaline structure of the water column, temperature and salinity preferences of fish, “predator-prey” relationship, fish behavior, and eating habits. Understanding the influence of these factors on the three groups of fish will help to identify these groups.
The effect of the thermohaline structure and “predator-prey” relationships on the depth dependence of fish target strength was analyzed using hydroacoustic and CTD data collected along all transects over the entire three-year study period. The comparison among years were made separately for each type of transects. The main regularities have been demonstrated. Figure 5 illustrates these main regularities comparing results obtained for three transects: an external one (2013) and transects along the fjord axis (2014 and 2022).
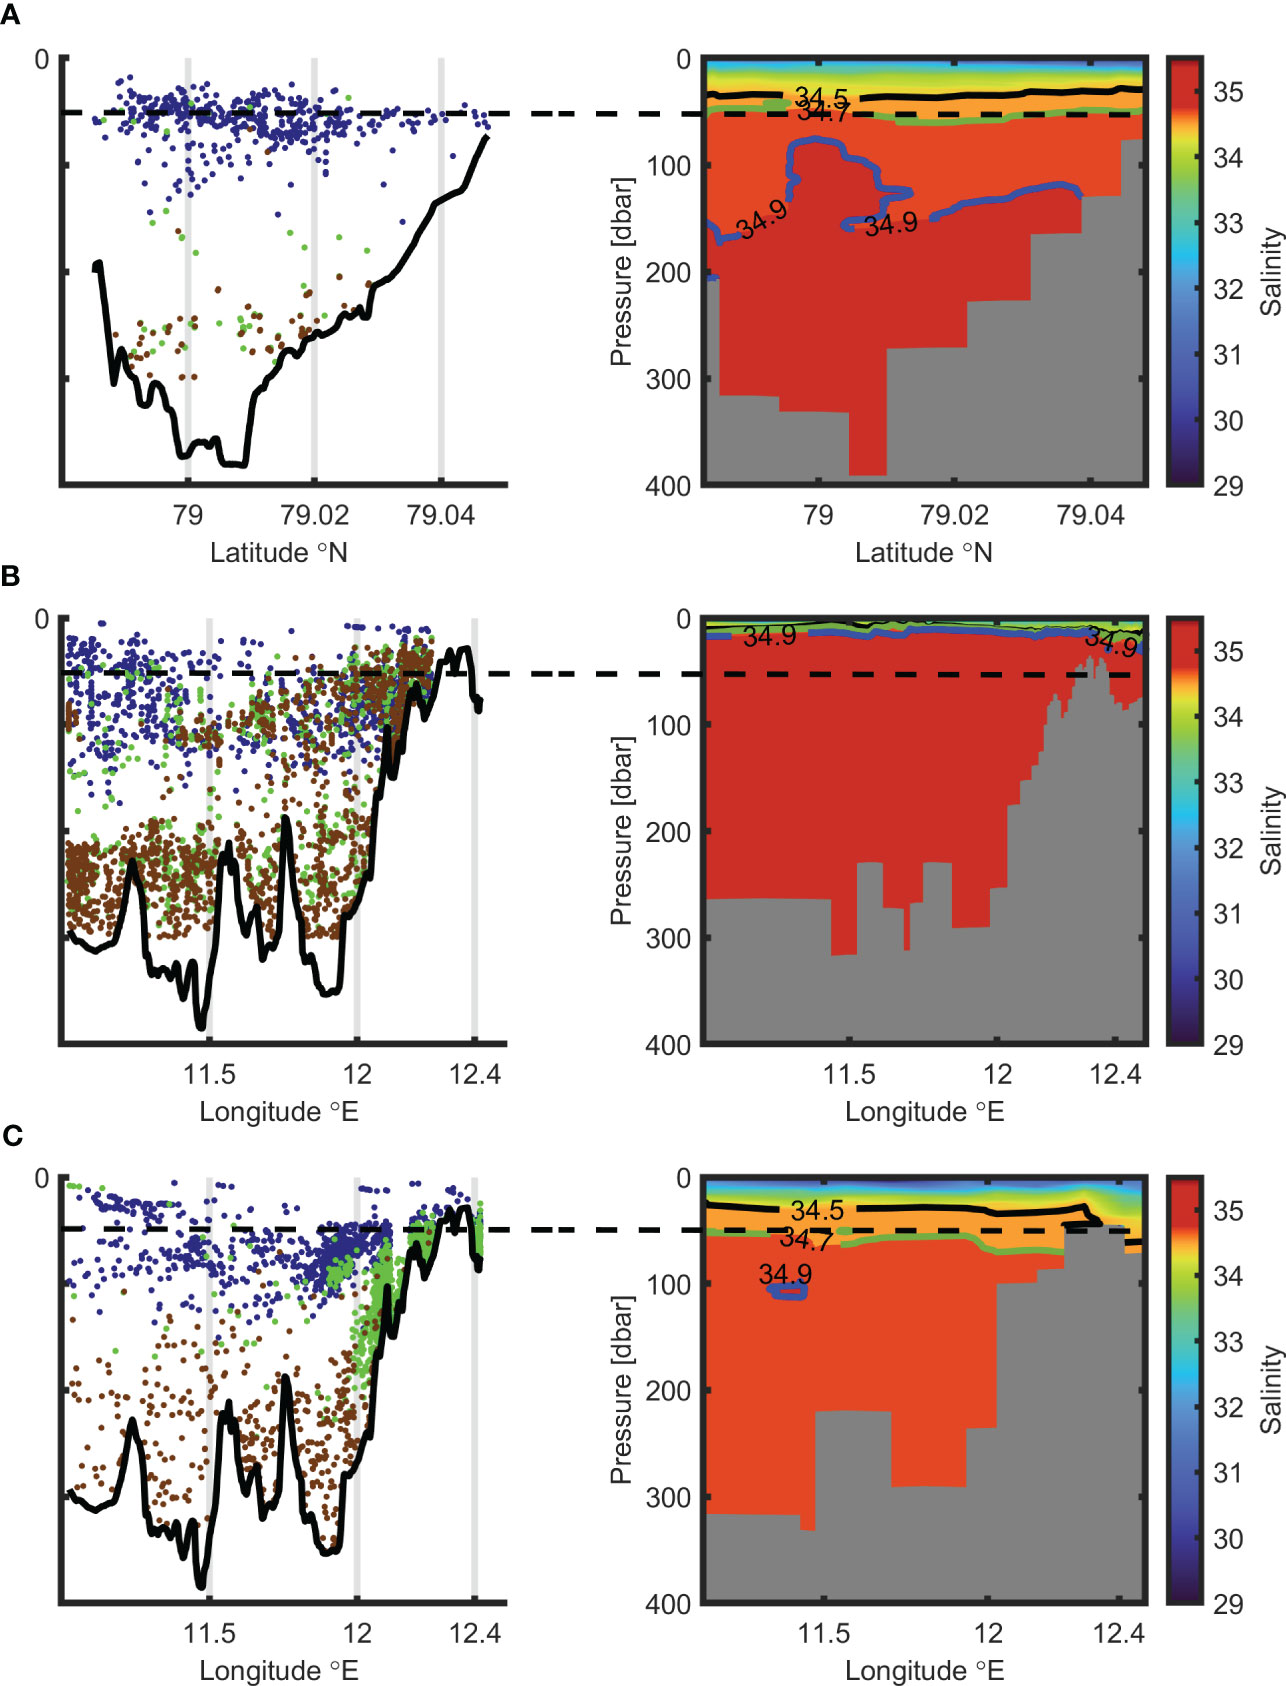
Figure 5 Spatial distribution of fish of different fish size groups [left panels in each plot (A–C)] and salinity spatial distributions [right panels in each plot (A–C)]. Small, medium, and large fish are indicated by blue, green, and brown dots respectively (in left panels). The boundary between AW and TAW is presented by a blue line, the boundary between TAW and IW by a green line, and the boundary between IW and SW by a black line (in right panels). Black dashed line indicates the depth 50 m. Plots (A–C) refer to years 2013, 2014, and 2022 respectively.
3.2.1 TS vs depth: impact of thermohaline structure
Figure 5 depicts the impact of the thermohaline structure on depth dependence of TS. Figures 5A–C present the results for years 2013, 2014, and 2022 respectively. Figures 5B, C show the transect along the fjord axis (Figure 2), while Figure 5A presents the transverse external transect (we have no data for the transect along the fjord for this year, see Table 2). The left panels of each plot A - C show the spatial distribution of fish, belonging to the three groups: “small fish” (blue dots), “medium fish” (green dots), and “large fish” (brown dots). The right panels of the plots present the salinity spatial distribution along the transects. The boundary between Atlantic Water mass (AW) and Transformed Atlantic Water (TAW) is presented with a blue line, while the boundary between TAW and Intermediate Water (IW) is presented with a green line. The boundary between IW and Surface Water (SW) is indicated by a black line. The temperature and salinity ranges of different water masses have been selected following the classification employed by Svendsen et al. (2002); Nilsen et al. (2016), and Promińska et al. (2018).
A comparison of left and right panels of each plot demonstrates that in all years the small fish (blue dots) are not sensitive to water mass properties. For example, in 2013 and 2022, respectively, 34% and 28% of all small fish were above the boundary between waters of Atlantic and non-Atlantic origin. The boundary was at about 50 m depth (green lines in Figures 5A, C). Unlike the “small fish” group, large and medium fish can only be found in the Atlantic origin waters (AW and TAW). Figure 5 also demonstrates that in all years a significant number of medium and large fish were in waters of Atlantic origin below the boundary between waters of the Atlantic and not Atlantic, both in the shallow and deep part of the fjord, e.g. in 2013 and 2022 only about 5% of all medium and large fish exceeded this boundary.
The presented effect of the type of water masses on the spatial distribution of fish of different size groups is also confirmed by the comparison of Figure 5B with Figures 5A and C. In 2014 (Figure 5B), medium and large fish were closer to the surface than they were in 2013 (Figure 5A) and 2022 (Figure 5C). The reason is that the boundary between waters of the Atlantic and non-Atlantic origin was significantly shallower in 2014. It was just below the surface, while in 2013 and 2022 it was about 50 meters below it. In 2014, 15% of all individuals from “medium fish” and “large fish” groups were found in shallow waters over 50 m deep. This percentage is 3 times higher than in 2013 and 2022.
In all years, large fish were found close to the bottom in the deep part of the fjord. However, in 2014 (Figure 5B), when AW filled the shallow part of the fjord, large fish were also found mainly near the bottom, but in both the shallow and deep parts of the fjord. Interestingly, unlike in other years, in 2022 (Figure 5C) medium fish were mainly found near the bottom in the shallow part of the fjord filled by TAW.
3.2.2 TS vs. depth: “predator-prey” relationships
As mentioned above, the “predator-prey” relationship is one of the factors that could impact on the fish spatial distribution. Smaller fish (e.g., polar and juvenile Atlantic cod in Kongsfjorden) look for a spatial niche providing protection from predators and cannibalization by larger specimens, e.g., adult Atlantic cod (Brand et al., 2022). Taking this into account, we were curious how this might affect the mutual spatial distribution of three fish groups selected for the analysis (“small fish”, “medium fish”, and “large fish”).
The “small fish” group (blue dots in Figure 5) occupied different spatial areas compared to the areas occupied by large fish (brown dots in the figure). Figures 5A, C (for years 2013 and 2022 respectively) demonstrate that small fish (blue dots) occupied mainly the top part (not deeper than 150m) of the water column, while large fish were closer to the bottom (not shallower than 200m).
The “medium fish” and the “large fish” groups were spatially separated in 2022 (Figure 5C), while in previous years (Figures 5A, B) they occupied the same areas. In 2022, the medium fish were mainly present in the shallower part of the fjord near the bottom, while the large fish were found near the bottom, but in the deeper part. In 2013 and 2014 these two groups mixed in the same areas.
3.2.3 TS vs. depth for the “middle fish” group: the difference between 2013 and 2022 years
An additional comparison of fish spatial distributions has been conducted for years 2013 and 2022. In these two years, a similar vertical distribution of waters of Atlantic origin was observed: below 50 meters in both years (the right panels in Figures 5A, C). This excluded the temperature and salinity structure as possible reasons for the difference in fish spatial distribution between these years. The difference, demonstrated below, should be controlled by other factors.
Comparisons were made for each group of fish (“small fish”, “medium fish”, and “large fish”) along each of the three transverse transects: external, middle, and internal (Figure 2A). The transect along the fjord was not considered due to a lack of hydroacoustic data in 2013 (Table 2).
The difference between 2013 and 2022 was observed only for the “middle fish” group. It is presented in Figure 6 for the three selected transects: external (plot A), middle (plot B), and internal (plot C). In each plot the mean depth positions (black points) with the maximum and minimum depths (bars) and the 25% and 75% percentiles (rectangles) are presented for 2013 (on the left) and 2022 (on the right). Figure 6 shows that for all selected transects (plots A – C) mean depth of the spatial distributions of medium fish was shallower in 2022. The mean values in 2022 are smaller than 150 m depth, while in 2013 they are larger than this depth.
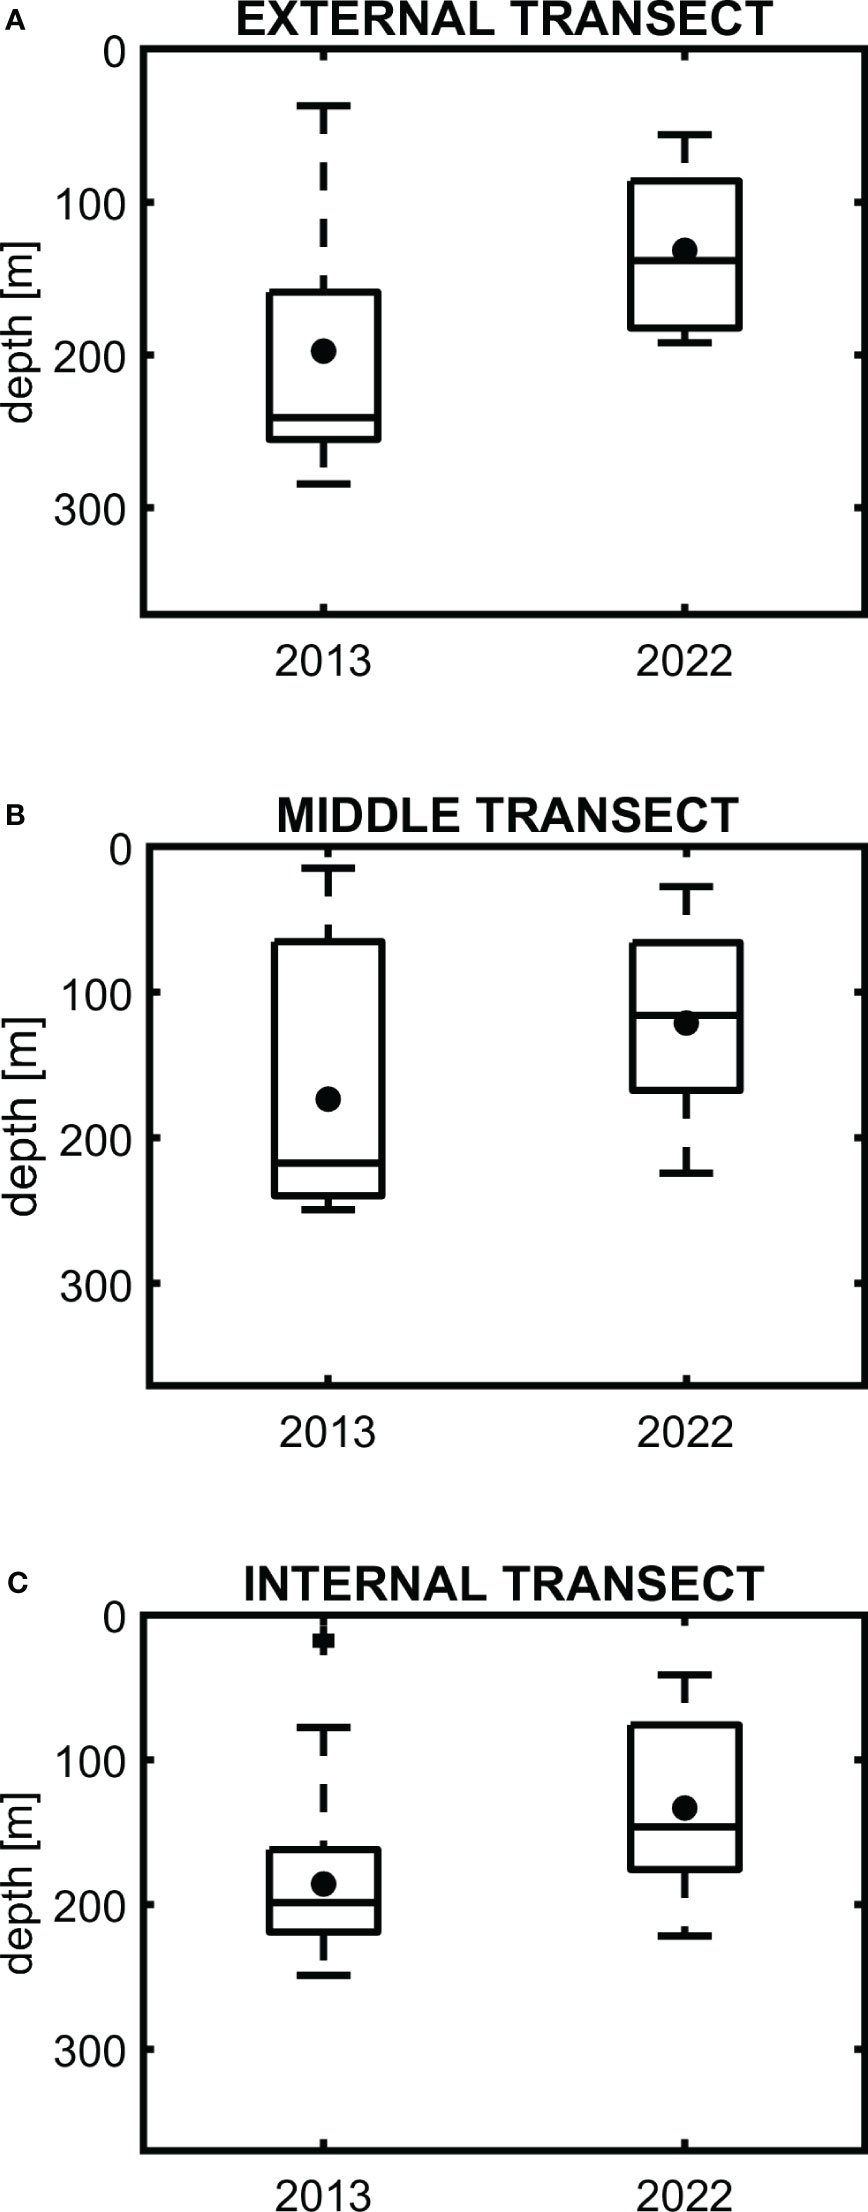
Figure 6 The mean depth of medium size fish (●) with maximum and minimum depths (bars) and 25% and 75% percentiles (rectangles) for data collected along the transverse transects [external transect – (A), middle transect – (B), and internal transect – (C)], in 2013 and 2022.
The presence of medium-size fish in the top water column in 2022 is also confirmed by Figure 7. Plots A, B, and C in the figure are generated respectively for the external, middle, and internal transects. In each plot, the left column corresponds to 2013 and the right one to 2022. The percentage of medium-size fish in the first 150 meters under the surface is marked with a white color, while deeper than 150 meters is shown by a grey color. We can see that in 2013 about 70% - 81% of fish were observed deeper than 150 meters. These percentages were 77%, 70%, and 81% at external, middle, and internal transects respectively. In 2022, 51% to 70% of organisms were shallower than 150 meters. These percentages were 54,5%, 70%, and 51% at external, middle, and internal transects respectively.
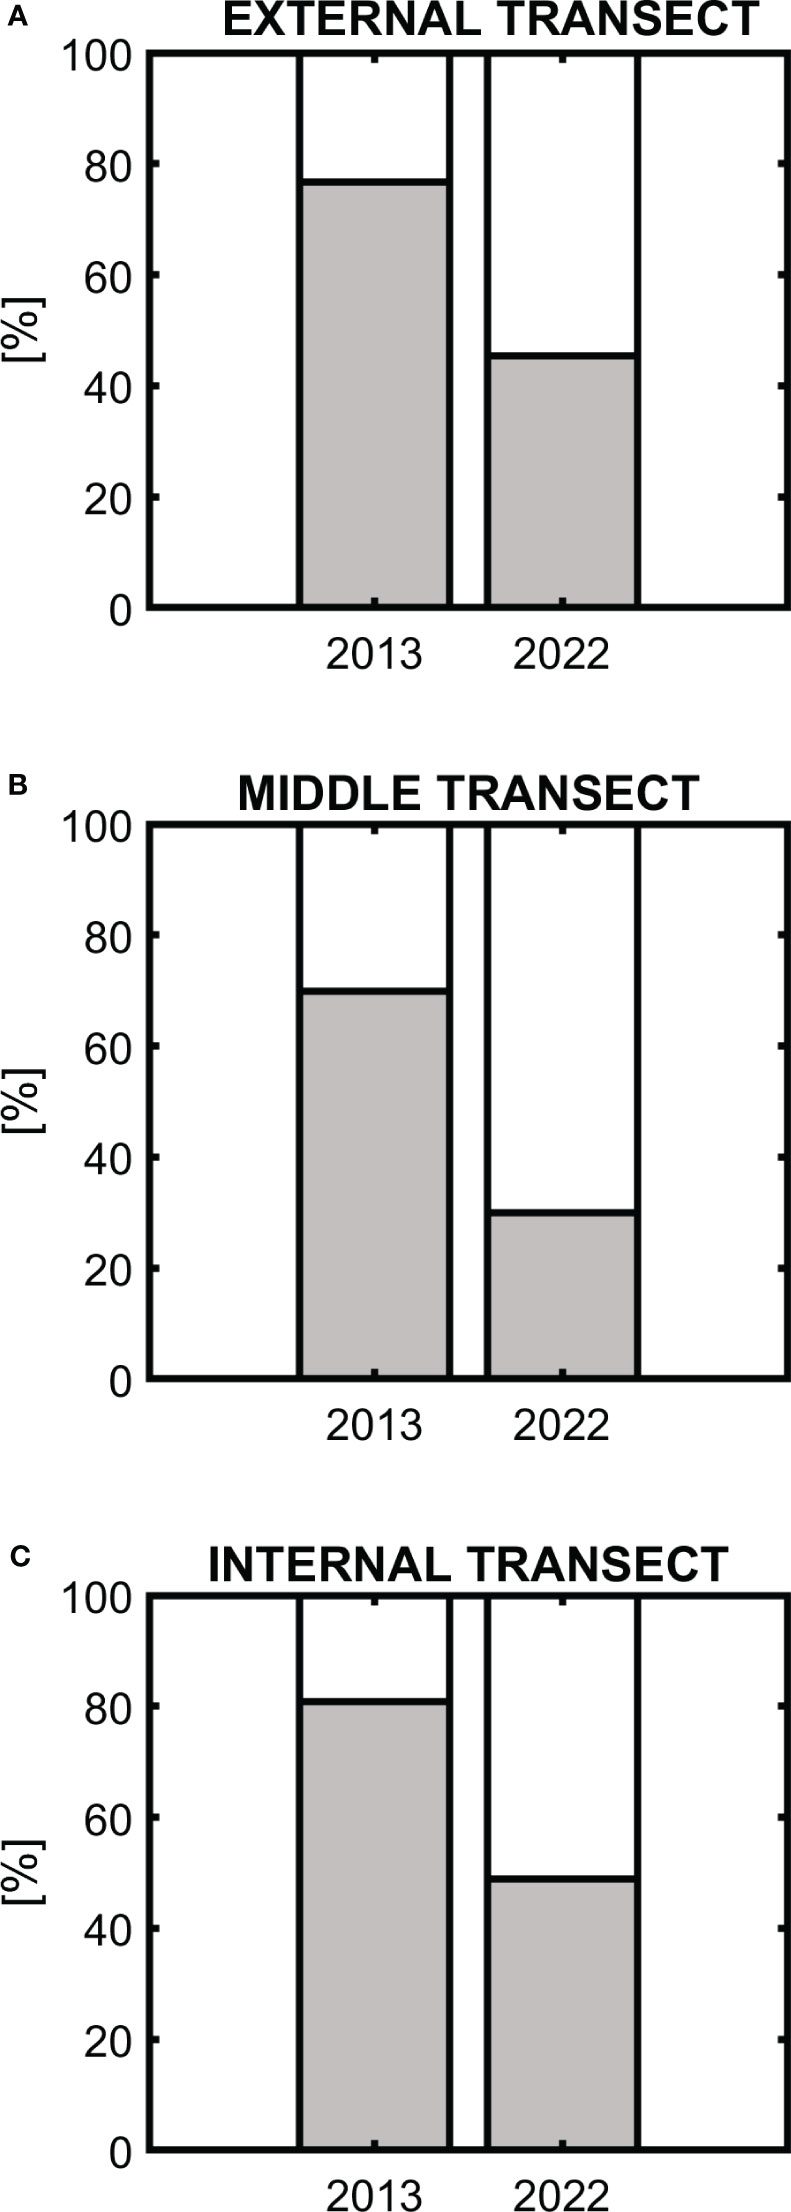
Figure 7 Percentage of medium-size fish in the first 150 meters under the surface (white part of the columns) and deeper than 150 meters (grey part of the columns) for the data collected along the transverse transects [external transect – (A), middle transect – (B), and internal transect – (C)], in 2013 and 2022.
4 Discussion
As the overall temperature of the Atlantic water, carried by the West Spitsbergen Current, increased (Beszczynska-Möller et al., 2012) and warm inflows into Kongsfjorden increased (Hop et al., 2019; Payne and Roesler, 2019), the fish TS distribution changed from near-unimodal (Figure 3A, year 2013) to bimodal (Figure 3B year 2014) (see also Szczucka et al., 2017) and to trimodal in 2022 (Figure 3C). Taking into account that fish TS is strongly controlled by its length, and the longer the fish, the higher the TS (Simmonds and MacLennan, 2005), we state that the size structure of fish in warmer Kongsfjorden waters becomes more complex; this process was observed in 2013 and 2014 and continued in 2022. In this section we will focus on whether an effect of increased biodiversity and complexity of the local food web is occurring, as proposed by Węsławski et al. (2017) To answer this, it should be understood how the modes in histograms in Figure 3 (modes of low TS, medium TS, and high TS) (Figure 3) related to the fish species dominant in the fjord. We address this by analyzing both the fish backscattering properties and acoustically observed fish behavior.
4.1 Interannual variability of fish size structure and species composition
To understand the histograms shown in Figure 3, it is important to recall that two main fish species were found in Kongsfjorsen after 2004, both in biological and hydroacoustic surveys (Keskinen et al., 2004; Renaud et al., 2012; Berge et al., 2015a; Brand and Fischer, 2016; Kunz et al., 2016; Baschek et al., 2017; Fey and Węsławski, 2017; Fischer et al., 2017; Szczucka et al., 2017; Giacalone et al., 2021; Brand et al., 2022; Giacalone et al., 2022). They are the native species polar cod and the non-endemic species Atlantic cod. Moreover, taking into account that Atlantic cod has spawning grounds in Kongsfjorden (Brand et al., 2022) and reproduces between December and June (Cohen et al., 1990), both juveniles and adults could be present in the fjord in the study period (in the first decade of August). These factors were considered when explaining the histograms in Figure 3.
How can the groups of small-, middle-, and large-sized fish (Figure 3) be related to the two fish species dominant in the fjord? Firstly, according to Figure 5 (Geoffroy et al., 2016), target strength of polar cod at 38 kHz is not larger than about - 50dB. Unfortunately, there is no TS data for polar cod at 70 kHz acoustic frequency. Therefore, considering TS values at 38 kHz, and the fact that at 70 kHz the TS can be about 2-3 dB lower than at 38 kHz, depending on the fish species (Pedersen and Korneliussen, 2009), we suggest that the first mode of all three histograms (Figures 3A–C) corresponds to polar cod. Fish of this species were not included in the other two groups, namely “middle fish” and “large fish”. A detailed visual examination of the histograms confirmed that the value “- 52 dB” is a reasonable upper boundary for this low TS – mode (PDF minimum is near this value).
Secondly, the upper boundary of the histograms is about -22 dB. According to (Johannesson and Mitson, 1983), it is a maximum observed value of target strength of adult Atlantic cod. It confirms a supposition that the third mode could present the adult Atlantic cod. This also supports our suggestion that the second and third mode in 2013 and 2022, and the second mode in 2014 (TS> -52 dB), are related to Atlantic cod. The difference between the “middle fish” and “large fish” groups of Atlantic cod is not visible only in 2014.
The boundary between the “medium fish” and “large fish” groups in the histograms was set at “-37 dB”, near which the PDF minimum was observed. This applies not only to the histograms shown in Figure 3, but to all trimodal histograms obtained for individual transects for all three years (not shown here).To the best of our knowledge, TS data at 70 kHz for juvenile Atlantic cod, which was intended to indicate the boundary, are not available in publications.
Thirdly, the decreasing role of the “small fish” group (the role was the most prominent in 2013) and increasing importance of “middle fish” and “large fish” groups (Figures 3, 4) is in accordance with the observations of the northward shift of Atlantic fish (Atlantic cod) toward the Arctic, triggered by climate warming (Drinkwater, 2005; Renaud et al., 2012; Christiansen et al., 2014; Ottersen et al., 2014; Berge et al., 2015a; Fossheim et al., 2015; Brand and Fischer, 2016; Kunz et al., 2016; Misund et al., 2016; Baschek et al., 2017; Fey and Węsławski, 2017; Fischer et al., 2017; Ingvaldsen et al., 2017; Geoffroy et al., 2019; Brand et al., 2022; Giacalone et al., 2022; Snoeijs-Leijonmalm et al., 2022). Moreover, the percentage growth of the “middle fish” group, demonstrated in Figure 4, agrees well with the increasing role of the juvenile Atlantic cod (Brand et al., 2022).
Fourthly, the acoustically observed behavior of all three fish groups, as it is discussed below, confirmed that polar cod dominated the “small fish” group, while Atlantic cod was found in “medium fish” and “large fish” groups. It is highly likely that juvenile individuals belong to the “medium fish” group, while adult individuals to the “large fish” group.
4.2 Fish spatial distribution vs fish species
To understand how groups of small, medium, and large fish can be related to polar cod, juvenile Atlantic cod, and adult Atlantic cod, the spatial distribution of fish of different TSs for different years has been considered in Section 3.2 and will be discussed below.
4.2.1 Fish species vs. impact of thermohaline structure on depth dependence of fish TS
A lack of sensitivity of “small fish” group to the water type, demonstrated in Subsection 3.2.1 (Figure 5), confirms that this group is formed of polar cod, which as a native species is perfectly adapted to all types of fjord waters. The fact that small fish could be found both in the deeper and shallower parts of the fjord also indicates that the native polar cod belonged to this group (Brand et al., 2022).
The behavior of “medium fish” and “large fish” groups, presented in Subsection 3.2.1, means that the Atlantic cod belonged to these two groups. Firstly, it is confirmed by the presence of these two fish groups only in the waters of Atlantic origin: Atlantic Water and Transformed Atlantic Water (Renaud et al., 2012).
Secondly, the fact that the large fish were found mainly close to the bottom (brown points in Figure 5) confirms that the “large fish” group consisted of adult Atlantic cod. Adult Atlantic cod is a demersal fish as it lives and feeds on or near the bottom (e.g. Beamish, 1966; Rose and Leggett, 1990; Arnold, 1994; Giacalone et al., 2022).
Thirdly, the presence of medium-size fish both in the water column and near the bottom in the deeper and shallower parts of Kongsfjorden in 2014 (Figure 5B, left panel) and around the bottom in the shallower part in 2022 (Figure 5C, left panel) indicates that these may be juvenile Atlantic cod, which could be found in both the littoral and sub-littoral waters (Brand and Fischer, 2016; Brand et al., 2022).
4.2.2 Fish species vs impact of “predator-prey” relationships on depth dependence of fish TS
To understand how to explain the spatial separation of different groups of fish, discussed in Section 3.2.2, we used not only the data we collected, but also the published results obtained in 2004 by Keskinen et al. (2004) and in 2016 by Giacalone et al. (2022). The comparison is presented in Table 3. The study period and locations as well as information on the spatial separation of three fish groups (“small fish”, “medium fish”, and “large fish”) are presented in the table. The studies were conducted in the same season (mainly in August) and in close areas.
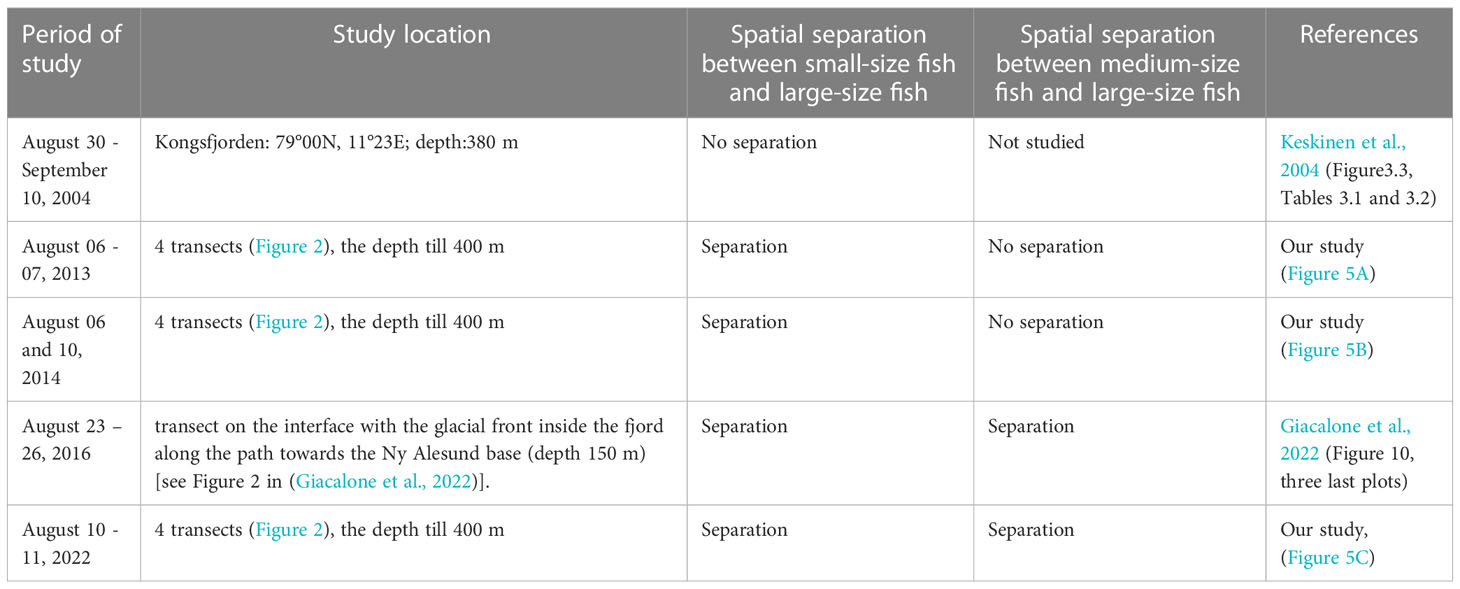
Table 3 Small, medium, and large fish - the spatial separation.
Keskinen et al. (2004) proved this by trawling the presence of two groups of fish, namely polar cod and adult Atlantic cod, which we name in Table 3 as “small fish” and “large fish”. Giacalone et al. (2022) observed three fish groups differing in their backscatter properties and their school morphometry. They suggested that these three groups were polar cod, juvenile Atlantic cod, and adult Atlantic cod (these groups are also named as “small fish”, “middle fish”, and “large fish” in the table).
The lack of the separation between polar cod and adult Atlantic cod in 2004 was confirmed by Keskinen et al. (2004) by trawling at middle depths and near the bottom. However, after 2004, we (in 2013, 2014, and 2022) and Giacalone et al. (2022) (in 2016) observed the separation between small and large fish.
Taking into account
- the “predator-prey” relationship between adult Atlantic cod and polar cod,
- the facts that the values of the target strength of the “small fish” group are in accordance with TSs of polar cod, while the maximum TS values of the “large fish” group are in accordance with the maximum TS of adult Atlantic cod (see Sub-section 4.1), and
- the spatial distributions of small and large fish in regard to the type of water (see subsection 4.2.1)
it can be inferred that the separation confirms that the “small fish group” consisted of polar cod, while the “large fish” group included adult Atlantic cod. The appearance of the separation only after 2004 may have been due to the fact that a significant increase in the abundance of adult Atlantic cod, which could affect fish separation, was documented only after 2004 (Renaud et al., 2012; Berge et al., 2015b).
The spatial separation between “medium fish” and “large fish” groups has looked different over the years. The separation was first observed in Kongsfjorden in 2016 by Giacalone et al. (2022) and was confirmed in our study in 2022.
Taking into account that
- polar cod did not belong to the group of “medium fish” (see subsection 4.1),
- a “large fish” group consisted of adult Atlantic cod,
- the possible presence of juveniles of Atlantic cod in Kongsfjorden during the study period,
- the spatial distributions of medium fish in regard to the type of water (see subsection 4.2.1), and
- known cannibalism of adult Atlantic cod in relation to its juveniles
it can be concluded that the clear spatial division between “medium fish” and “large fish” groups in 2022 strongly suggests that the group “medium fish” included juveniles of Atlantic cod.
The history of the separation between “medium fish” and “large fish” groups confirms this conclusion. The lack of the separation between medium fish and large fish till 2016 could be explained by the fact that the spawning of Atlantic cod inside the fjord only began in 2008 and after this year the Atlantic cod juveniles were regularly caught (Berge et al., 2015b; Brand et al., 2022). It could be that the juveniles in years 2013 and 2014 was not so abundant as in 2016 and 2022. The abundance increase prompted them to find the spatial niche to avoid cannibalism from adult Atlantic cod. An increasing share of medium-sized fish (juvenile Atlantic cod), demonstrated in subsection 3.1, confirms this.
4.2.3 The difference in depth distributions of TS of middle-size fish between 2013 and 2022
Interpretation of the results presented in Figures 6, 7 encountered difficulties due to the insufficient amount of the measured data collected. To explain the results, we put forward two hypotheses and presented some arguments justifying these hypotheses, but unfortunately their complete confirmation requires additional study.
The first hypothesis aims to explain the difference in vertical spatial distributions between 2013 and 2022 as a result of the separation between “medium fish” and “large fish” groups, discussed in the previous section. The difference consisted of the presence of medium fish at shallow depths in 2022. Perhaps the mentioned increase of medium fish abundance prompted them in 2022 to flee from the cannibalism of adult Atlantic cod, which prefer benthic conditions, to upper water layers.
Given that in 2013 and 2022, data were collected during the “day” (08.45 – 17.00 UTC) and “night” (00.10 – 04.00 UTC) periods (Table 1), respectively, the second hypothesis proposes an interpretation of the results, taking into account the possible Diel Vertical Migration (DVM) of medium-size fish. Previous studies (Falk-Petersen et al., 2008; Last et al., 2020; Pettitt-Wade et al., 2021) have confirmed that biological clocks of marine organisms are important for shaping their daily activities at high latitudes, and there are some confirmations that organisms could perform DVM in the Arctic during the Polar Night or Polar Day.
It has been shown (Figures 6, 7) that during the “day” (2013) medium-size fish were closer to the seabed than during the “night” (2022). This is in agreement with the known DVM strategy of not large fish, just like juvenile Atlantic cod, which could be prey to many predators. This strategy is motivated by predation risk and includes descending into darker water masses during daylight (Clark and Levy, 1988; Rosland and Giske, 1994; Strand and Huse, 2007). It is in agreement with the confirmations presented above that the “medium fish” group could consist of juvenile Atlantic cod.
The presented difference between 2013 and 2022 for medium-size fish has not been observed for the “large fish” group. This is also in agreement with the previous conclusions that this group included adult Atlantic cod. The lack of the described DVM strategy for large-size fish is because that these fish have only a few predators (Pálsson, 1994) and predation risk is not the main motivation of their vertical movement. Diel variations of vertical distribution pattern of adult Atlantic cod, different than for medium-size fish, have been presented in Godø and Michalsen (2000) and Strand and Huse (2007).
The considered difference between the years has not been confirmed for the “small fish” group. It could be another argument that this group consisted of polar cod. There is no published evidence available that polar cod performs DVM at such high latitudes.
We carefully checked the echograms obtained along all transects in all three years. The inspection showed that, in 2013, several schools of fish were observed. It was the only year in which the research was conducted in “day” time. In the years 2014 and 2022 (“night” surveys), fish were dispersed in the water column in the echograms. Schooling fish during the day and their dispersal during the night are typical of many fish species that perform DVM (Pavlov and Kasumyan, 2000).
The presented arguments only partially justify the second hypothesis. For its reliable verification, the DVM study of fish in a selected location should be performed during multi-day continuous hydroacoustic observations, both during the day and at night (e.g. Simmonds and MacLennan, 2005; Benoit et al., 2010). Hydroacoustic measurements should be accompanied by biological sampling to correctly interpret the backscatter data obtained.
5 Summary
The presence of three fish size classes in the fjord has been demonstrated based on the analysis of target strength histograms of individual fish. The obtained information on the behavior of the classes (e.g. fish spatial distributions in regard to thermohaline structure or “prey-predators” relationships) has confirmed that the groups of small, medium, and large fish could consist of polar cod, juvenile Atlantic cod, and adult Atlantic cod respectively.
It was shown that the process of establishment of Atlantic cod (adults and juveniles), a non-Arctic species, continues in Kongsfjorden. The size structure of fish in warmed Kongsfjorden becomes more complicated: size frequency changes from a near-unimodal distribution (2013) to trimodal distribution (2022) due to the increasing abundance of juvenile Atlantic cod. It has been confirmed by the following results:
1. A decrease in the percentage of polar cod from 80% in 2013 to 48,9% in 2022 as well as an increase in the percentage of juveniles of Atlantic cod from 14,8% in 2013 to 30,1% in 2022.
2. The increase of abundance of adult Atlantic cod in the Kongsfjorden has also been confirmed by appearance after 2004 of the spatial separation of small (polar cod) and large fish (adult Atlantic cod), which have a “prey - predator” relationship.
3. The increasing abundance of the juveniles after 2016 has also been confirmed by the fact that the spatial separation of medium fish (juvenile Atlantic cod) and large fish (adult Atlantic cod with cannibalistic habits) has been observed only in the later studies in 2016 and 2022.
Due to the value of the obtained results, we believe that further hydroacoustic studies of the fish community in Kongsfjorden, together with the collection of biological samples, are important.
Data availability statement
The raw data supporting the conclusions of this article will be made available by the authors, without undue reservation.
Author contributions
NG designed the study with JW, BS, and JS. MG and AB-M collected the data and preformed the field surveys. BS and AD-G analyzed the collected data and produced the figures. NG, JW and BS contributed results interpretation output. NG and MW wrote the manuscript. All authors commented on the manuscript. All authors contributed to the article and approved the submitted version.
Funding
This work was supported by the GAME project of the National Science Centre no. DEC-2012/04/A/NZ8/00661; the GLAERE project of the Norwegian Funding Mechanism no. DZP/POL-Nor/1876/2013; and the ARK project financed by the Norwegian Research Council.
Acknowledgments
We greatly appreciate the scientific and technical crews of r/v Oceania who supported us in the data collection.
Conflict of interest
The authors declare that the research was conducted in the absence of any commercial or financial relationships that could be construed as a potential conflict of interest.
Publisher’s note
All claims expressed in this article are solely those of the authors and do not necessarily represent those of their affiliated organizations, or those of the publisher, the editors and the reviewers. Any product that may be evaluated in this article, or claim that may be made by its manufacturer, is not guaranteed or endorsed by the publisher.
References
Arnold G. (1994). Movements of cod (Gadus morhua L.) in relation to the tidal streams in the southern North Sea. ICES J. Mar. Sci. 51, 207–232. doi: 10.1006/jmsc.1994.1021
Baschek B., Schroeder F., Brix H., Riethmüller R., Badewien T. H., Breitbach G., et al. (2017). The coastal observing system for Northern and Arctic Seas (COSYNA). Ocean Sci. 13, 379–410. doi: 10.5194/os-13-379-2017
Beamish F. W. H. (1966). Vertical migration by demersal fish in the Northwest Atlantic. J. Fish. Res. Board Can. 23, 109–139. doi: 10.1139/f66-009
Benoit D., Simard Y., Gagné J., Geoffroy M., Fortier L. (2010). From polar night to midnight sun: photoperiod, seal predation, and the diel vertical migrations of polar cod (Boreogadus saida) under landfast ice in the Arctic Ocean. Polar Biol. 33, 1505–1520. doi: 10.1007/s00300-010-0840-x
Berge J., Daase M., Renaud P. E., Ambrose W. G., Darnis G., Last K. S., et al. (2015a). Unexpected levels of biological activity during the polar night offer new perspectives on a warming Arctic. Curr. Biol. 25, 2555–2561. doi: 10.1016/j.cub.2015.08.024
Berge J., Heggland K., Lønne O. J., Cottier F., Hop H., Gabrielsen G. W., et al. (2015b). First records of Atlantic mackerel (Scomber scombrus) from the Svalbard archipelago, Norway, with possible explanations for the extension of its distribution. Arctic 68, 54. doi: 10.14430/arctic4455
Beszczynska-Möller A., Fahrbach E., Schauer U., Hansen E. (2012). Variability in Atlantic water temperature and transport at the entrance to the Arctic Ocean 1997–2010. ICES J. Mar. Sci. 69, 852–863. doi: 10.1093/icesjms/fss056
Brand M., Fischer P. (2016). Species composition and abundance of the shallow water fish community of Kongsfjorden, Svalbard. Polar Biol. 39, 2155–2167. doi: 10.1007/s00300-016-2022-y
Brand M., Spotowitz L., Mark F. C., Berge J., Langhelle E. L., Węsławski J. M., et al. (2022). Age class composition and growth of Atlantic cod (Gadus morhua) in the shallow water zone of Kongsfjorden, Svalbard. Polar Biol. 46, 53–65. doi: 10.1007/s00300-022-03098-1
Christiansen J. S., Mecklenburg C. W., Karamushko O. V. (2014). Arctic Marine fishes and their fisheries in light of global change. Glob. Change Biol. 20, 352–359. doi: 10.1111/gcb.12395
Clark C. W., Levy D. A. (1988). Diel vertical migrations by juvenile sockeye salmon and the antipredation window. Am. Nat. 131, 271–290. doi: 10.1086/284789
Cohen D. M., Inada T., Scialabba N., and (1990). FAO species catalogue. v. 10: Gadiform fishes of the world (Order Gadiformes). An annotated and illustrated catalogue of cods, hakes, grenadiers and other gadiform fishes known to date. FAO Fish. Synopsis No. 125, Vol. 10. Rome, FAO. 1990. 442 p. Available at: https://www.fao.org/publications/card/ru/c/T0243E.
Cottier F., Tverberg V., Inall M., Svendsen H., Nilsen F., Griffiths C. (2005). Water mass modification in an Arctic fjord through cross-shelf exchange: the seasonal hydrography of Kongsfjorden, Svalbard. J. Geophys. Res. 110, C12005. doi: 10.1029/2004JC002757
De Rovere F., Langone L., Schroeder K., Miserocchi S., Giglio F., Aliani S., et al. (2022). Water masses variability in inner Kongsfjorden (Svalbard) during 2010–2020. Front. Mar. Sci. 9. doi: 10.3389/fmars.2022.741075
Drinkwater K. F. (2005). The response of Atlantic cod (Gadus morhua) to future climate change. ICES J. Mar. Sci. 62, 1327–1337. doi: 10.1016/j.icesjms.2005.05.015
Falk-Petersen S., Leu E., Berge J., Kwasniewski S., Nygård H., Røstad A., et al. (2008). Vertical migration in high Arctic waters during autumn 2004. Deep-Sea Res. PT I 55, 2275–2284. doi: 10.1016/j.dsr2.2008.05.010
Fey D. P., Węsławski J. M. (2017). Age, growth rate, and otolith growth of polar cod (Boreogadus saida) in two fjords of Svalbard, Kongsfjorden and rijpfjorden. Oceanologia 59, 576–584. doi: 10.1016/j.oceano.2017.03.011
Fischer P., Schwanitz M., Loth R., Posner U., Brand M., Schröder F. (2017). First year of practical experiences of the new Arctic AWIPEV-COSYNA cabled underwater observatory in Kongsfjorden, Spitsbergen. Ocean Sci. 13, 259–272. doi: 10.5194/os-13-259-2017
Foote K. G., Knudsen H. P., Vestnes G., MacLennan D. N., Simmonds E. J. (1987). Calibration of acoustic instruments for fish density estimation: a practical guide. ICES Cooperative Res. Rep. 144.
Fossheim M., Primicerio R., Johannesen E., Ingvaldsen R. B., Aschan M. M., Dolgov A. V. (2015). Recent warming leads to a rapid borealization of fish communities in the Arctic. Nat. Clim. Change 5, 673–677. doi: 10.1038/nclimate2647
Geoffroy M., Daase M., Cusa M., Darnis G., Graeve M., Santana Hernández N., et al. (2019). Mesopelagic sound scattering layers of the high Arctic: seasonal variations in biomass, species assemblage, and trophic relationships. Front. Mar. Sci. 6. doi: 10.3389/fmars.2019.00364
Geoffroy M., Majewski A., LeBlanc M., Gauthier S., Walkusz W., Reist J. D., et al. (2016). Vertical segregation of age-0 and age-1+ polar cod (Boreogadus saida) over the annual cycle in the Canadian Beaufort Sea. Polar Biol. 39, 1023–1037. doi: 10.1007/s00300-015-1811-z
Giacalone G., Barra M., Bonanno A., Basilone G., Fontana I., Calabrò M., et al. (2022). A pattern recognition approach to identify biological clusters acquired by acoustic multi-beam in Kongsfjorden. Environ. Modell. Software 152, 105401. doi: 10.1016/j.envsoft.2022.105401
Giacalone G., Lo Bosco G., Barra M., Bonanno A., Buscaino G., et al (2021). “Pattern classification from multi-beam acoustic data acquired in Kongsfjorden,” in Lecture notes in computer science, vol. 12666. Springer, Cham., 55–64.
Godø O. R., Michalsen K. (2000). Migratory behaviour of north-east Arctic cod, studied by use of data storage tags. Fish Res. 48, 127–140. doi: 10.1016/S0165-7836(00)00177-6
Google (n.d.). Map of Kongsfjord. Available at: https://www.google.pl/maps/place/9982+Kongsfjord,+Norwegia/@78.9659113,11.9092815,10.33z/data=!4m6!3m5!1s0x45ca5d2d2dee7985:0xfa8259e09b2642da!8m2!3d70.7204952!4d29.3191137!16s%2Fm%2F0wkp9fm?entry=ttu (Accessed: 6 May 2023).
Hassol S. J. (2004). Impacts of a warming arctic: arctic climate impact assessment. rep. Cambridge University Press, pp. 1–146, ISBN 0521617782.
Hop H., Cottier F., Berge J. (2019). “Autonomous marine observatories in Kongsfjorden, Svalbard,” in The Ecosystem of Kongsfjorden, Svalbard. Advances in Polar Ecology. Eds. Hop H., Wiencke C. (Berlin: Springer International Publishing), 515–533. doi: 10.1007/978-3-319-46425-1_13
Hop H., Pearson T., Hegseth E. N., Kovacs K. M., Wiencke C., Kwasniewski S., et al. (2002). The marine ecosystem of Kongsfjorden, Svalbard. Polar Res. 21, 167–208. doi: 10.1111/j.1751-8369.2002.tb00073.x
Ingvaldsen R. B., Gjøsæter H., Ona E., Michalsen K. (2017). Atlantic Cod (Gadus morhua) feeding over deep water in the high Arctic. Polar Biol. 40, 2105–2111. doi: 10.1007/s00300-017-2115-2
Johannesson K. A., Mitson R. B. (1983). Fisheries acoustics-a practical manual for aquatic biomass estimation. FAO Fish Tech. Pap. 240, 249.
Keskinen E., Leu E., Nygård H., Røstad A., Thormar j (2004). New findings of diel vertical migration in high Arctic ecosystems. Svalbard, Norway: University Centre Publication Series (UNIS), Report AB320. Available at: https://bibsys-yb.alma.exlibrisgroup.com/view/delivery/47BIBSYS_UNIS/128349900002259 [Accessed July 11, 2023].
Kongsberg Maritime AS (2012). Simrad EK60 scientific echosounder - reference manual (Horten, Norway: Release 2.4.X).
Kunz K. L., Frickenhaus S., Hardenberg S., Johansen T., Leo E., Pörtner H.-O., et al. (2016). New encounters in Arctic waters: a comparison of metabolism and performance of polar cod (Boreogadus saida) and Atlantic cod (Gadus morhua) under ocean acidification and warming. Polar Biol. 39, 1137–1153. doi: 10.1007/s00300-016-1932-z
Last K. S., Häfker N. S., Hendrick V. J., Meyer B., Tran D., Piccolin F., Eds., Berge J., Johnsen G., Cohen J. H., and (2020). “Biological clocks and rhythms in polar organisms,” in Polar night marine ecology: life and light in the dead of night. and , Springer, Cham., 217–240. doi: 10.1007/978-3-030-33208-2_8
Misund O. A., Heggland K., Skogseth R., Falck E., Gjøsæter H., Sundet J., et al. (2016). Norwegian fisheries in the Svalbard zone since 1980. Regulations, profitability and warming waters affect landings. Polar Sci. 10, 312–322. doi: 10.1016/j.polar.2016.02.001
Nilsen F., Skogseth R., Vaardal-Lunde J., Inall M. (2016). A simple shelf circulation model: intrusion of Atlantic water on the West spitsbergen shelf. J. Phys. Oceanogr. 46, 1209–1230. doi: 10.1175/JPO-D-15-0058.1
Ottersen G., Bogstad B., Yaragina N. A., Stige L. C., Vikebø F. B., Dalpadado P. (2014). A review of early life history dynamics of barents Sea cod (Gadus morhua). ICES J. Mar. Sci. 71, 2064–2087. doi: 10.1093/icesjms/fsu037
Pálsson O. K. (1994). A review of the trophic interactions of cod stocks in the North Atlantic. ICES Mar. Sci. Symp. 198, 553–575.
Pavlov D. S., Kasumyan A. O. (2000). Patterns and mechanisms of schooling behavior in fish: a review. J. Ichthyol. 40, S163–S 231.
Pavlov A. K., Tverberg V., Ivanov B. V., Nilsen F., Falk-Petersen S., Granskog M. A. (2013). Warming of Atlantic Water in two west Spitsbergen fjords over the last century, (1912–2009). Polar Res. 32, 11206. doi: 10.3402/polar.v32i0.11206
Payne C. M., Roesler C. S. (2019). Characterizing the influence of Atlantic water intrusion on water mass formation and phytoplankton distribution in Kongsfjorden, Svalbard. Cont. Shelf. Res. 191, 104005. doi: 10.1016/j.csr.2019.104005
Pedersen G., Korneliussen R. J. (2009). The relative frequency response derived from individually separated targets of northeast Arctic cod (Gadus morhua), saithe (Pollachius virens), and Norway pout (Trisopterus esmarkii). ICES J. Mar. Sci. 66, 1149–1154. doi: 10.1093/icesjms/fsp070
Pettitt-Wade H., Loseto L. L., Majewski A., Hussey N. E. (2021). Cod movement ecology in a warming world: circumpolar arctic gadids. Fish Fish. 22, 562–591. doi: 10.1111/faf.12536
Promińska A., Cisek M., Walczowski W. (2017). Kongsfjorden and Hornsund hydrography – comparative study based on a multiyear survey in fjords of west Spitsbergen. Oceanologia 59, 397–412. doi: 10.1016/j.oceano.2017.07.003
Promińska A., Falck E., Walczowski W. (2018). Interannual variability in hydrography and water mass distribution in Hornsund, an Arctic fjord in Svalbard. Polar Res. 37, 1495546. doi: 10.1080/17518369.2018.1495546
Renaud P. E., Berge J., Varpe Ø., Lønne O. J., Nahrgang J., Ottesen C., et al. (2012). Is the poleward expansion by Atlantic cod and haddock threatening native polar cod, Boreogadus saida? Polar Biol. 35, 401–412. doi: 10.1007/s00300-011-1085-z
Rose G. A., Leggett W. C. (1990). The importance of scale to predator-prey spatial correlations: an example of Atlantic fishes. Ecology 71, 33–43. doi: 10.2307/1940245
Rosland R., Giske J. (1994). A dynamic optimization model of the diel vertical distribution of a pelagic planktivorous fish. Prog. Oceanogr. 34, 1–43. doi: 10.1016/0079-6611(94)90025-6
Simmonds J., MacLennan D. (2005). Fisheries acoustics: theory and practice (Oxford: Blackwell Publishing). doi: 10.1111/j.1467-2979.2006.00220.x
Snoeijs-Leijonmalm P., Flores H., Sakinan S., Hildebrandt N., Svenson A., Castellani G., et al. (2022). Unexpected fish and squid in the central Arctic deep scattering layer. Sci. Adv. 8. doi: 10.1126/sciadv.abj7536
Strand E., Huse G. (2007). Vertical migration in adult Atlantic cod (Gadus morhua). Can. J. Fish. Aquat. Sci. 64, 1747–1760. doi: 10.1139/f07-135
Svendsen H., Beszczynska-Møller A., Hagen J. O., Lefauconnier B., Tverberg V., Gerland S., et al. (2002). The physical environment of Kongsfjorden–Krossfjorden, an Arctic fjord system in Svalbard. Polar Res. 21, 133–166. doi: 10.3402/polar.v21i1.6479
Szczucka J., Hoppe Ł., Schmidt B., Fey D. P. (2017). Acoustical estimation of fish distribution and abundance in two spitsbergen fjords. Oceanologia 59, 585–591. doi: 10.1016/j.oceano.2017.04.007
Tverberg V., Skogseth R., Cottier F., Sundfjord A., Walczowski W., M. E.,, et al (2019). “The Kongsfjorden transect: seasonal and inter-annual variability in hydrography,” in Advances in Polar Biology, vol.2. Springer, Cham., 49–104. doi: 10.1007/978-3-319-46425-1_3
Keywords: climate warming, Arctic, Kongsfjorden, Atlantic cod, increase in fish size diversity
Citation: Gorska N, Schmidt B, Węsławski JM, Grabowski M, Dragan-Górska A, Szczucka J and Beszczynska-Möller A (2023) Fish in Kongsfjorden under the influence of climate warming. Front. Mar. Sci. 10:1213081. doi: 10.3389/fmars.2023.1213081
Received: 27 April 2023; Accepted: 30 June 2023;
Published: 24 July 2023.
Edited by:
Gualtiero Basilone, National Research Council (CNR), ItalyReviewed by:
Salvatore Aronica, National Research Council (CNR), ItalyGiovanni Giacalone, National Research Council (CNR), Italy
Copyright © 2023 Gorska, Schmidt, Węsławski, Grabowski, Dragan-Górska, Szczucka and Beszczynska-Möller. This is an open-access article distributed under the terms of the Creative Commons Attribution License (CC BY). The use, distribution or reproduction in other forums is permitted, provided the original author(s) and the copyright owner(s) are credited and that the original publication in this journal is cited, in accordance with accepted academic practice. No use, distribution or reproduction is permitted which does not comply with these terms.
*Correspondence: Natalia Gorska, Z29yc2thQGlvcGFuLnBs