 Aurelija Armoškaitė1,2*
 Juris Aigars1
 Ingrīda Andersone1
 Ida Maria Bonnevie2
 Henning Sten Hansen2
 Solvita Strāķe1
 Miriam von Thenen3
 Lise Schrøder2
- 1Latvian Institute of Aquatic Ecology, Riga, Latvia
- 2Institute of Planning, Aalborg University, Copenhagen, Denmark
- 3Coastal and Marine Management Group, Leibniz-Institute for Baltic Sea Research Warnemünde, Rostock, Germany
The aim of this paper is to provide the foundations for the development of a spatial decision-support toolset that combines cumulative impacts and ecosystem service supply assessments to support what-if scenario analysis in a maritime spatial planning context. Specifically, a conceptual framework for a toolset has been designed in order to introduce a new approach for place-based assessments of change in relative ecosystem service supply in multiple services at a time due to changes in cumulative impacts. Central to the toolset are two pre-existing approaches for relative ecosystem service supply and cumulative impact assessments and tools that facilitate them. The tools take advantage of available data from various sources, including geodata and expert knowledge, and have already been proven to support maritime spatial planning in a real-world context. To test the new approach and demonstrate the outputs, an ecosystem service supply assessment was done manually using the two currently separate tools. The results of the test case ecosystem service supply assessment for the Gulf of Riga in the Baltic Sea are also presented in this paper and illustrate the assessment steps and data needs. Although presently the focus of the illustrative assessment is the Gulf of Riga, the toolset will be able to accommodate analysis of cumulative impacts and service supply of any location, leaving the scope of the assessment to be determined by the objectives of the assessment as well as data availability (i.e., geospatial data availability and extent of expert knowledge).
1 Introduction
Despite benefitting from the natural environment, human activities have become one of the main sources of pressures directly and indirectly affecting it (Intergovernmental Science-Policy Platform on Biodiversity and Ecosystem Services IPBES, 2022). Anthropogenic activities are driving changes, resulting in two global crises – climate change and biodiversity loss (ibid.). Maritime spatial planning (MSP) has been introduced in many coastal countries around the world to help manage human presence at sea and address ocean sustainability issues (Ehler, 2021).
MSP has been widely defined as a public process for defining and achieving social, environmental, and economic objectives by utilizing spatial and temporal management instruments, such as zoning (Douvere and Ehler, 2011; Kid and Shaw, 2014). This definition of MSP varies slightly from place to place, but it is generally accepted that MSP follows several common key principles. These include the facilitation of ecosystem-based, participatory planning, and decision-making as well as planning that seamlessly translates from land to the coast and out into the seas and oceans, and across borders and boundaries, whilst considering all sectors, interests, and users, and leaving no one behind (UNESCO-IOC/European Commission, 2021). Many emphasize that the role of MSP in national decision-making contexts is to bridge existing policies and management measures and address the needs of society, while respecting environmental thresholds and limits (UNESCO-IOC/European Commission, 2021; Kirkfeldt and Frazão Santos, 2021). For European Union (EU) member states, this means reconciling and implementing the aims and objectives of the Marine Strategy Framework Directive (Directive 2008 /56/EC; henceforth MSFD), which defines measures for protecting and restoring marine ecosystems, and the Blue Growth agenda, concerned with sustainable economic development (European Commission, 2021; European Commission, 2022).
Planning is future-oriented, therefore as part of the MSP process, planners and decision-makers have to develop spatial zoning or management alternatives, and weigh options through scenario or trade-off analysis (Pinarbasi et al., 2017; Quinio et al., 2023). As part of this process, they must consider compatibility between users, including conflicts and synergies between uses and environment, and potentials for multi-use to utilize space and resources most effectively and reduce conflicts among stakeholders (Bonnevie et al., 2021). Relatedly, an understanding of the potential impacts of decisions and actions on ecosystems, economy, and socio-cultural conditions must be developed (Duinker and Greig, 2007; Hansen, 2019; Hammar et al., 2020; Frederiksen et al., 2021). This places social, ecological, and economic knowledge and data at the heart of MSP. Knowledge does not only need to be gathered, but also made accessible to and usable by actors with different backgrounds such as researchers or scientists from various fields, decision-makers, planners, stakeholders, and the wider public, so that it can inform the decision-making process and support different needs of MSP (Cormier et al., 2017; Quinio et al., 2023). Knowledge exchange across disciplines and institutions, and integration in decision making, remains a significant challenge, though it is not a challenge unique to the marine context nor to recent times (Bednarek et al., 2018).
Ecosystem services and the ecosystem services cascade model offers an approach to study social-ecological systems in the form of complex and continuously changing interactions between people and the natural environment and facilitate communication between science and policy (Campagne et al., 2021). Ecosystem services are “the final output from ecosystems that are directly consumed, used (actively or passively), or enjoyed by people” (Culhane et al., 2020). Marine ecosystems provide a wide range of services, all of which play an important role in supporting human well-being, but they are also under high levels of pressure generated by human activities due to demands for services such as fish for food, which is threatening the sustainability of ecosystem service supply (Campagne et al., 2021). The ecosystem services cascade connects drivers of change – human activities and the pressures they produce – to ecosystem components and the ecosystem functions they perform, as well as the services and benefits the ecosystem supplies (Potschin-Young et al., 2018). Among other things, an ecosystem services approach therefore holds the potential to facilitate analysis of MSP outcomes, say the environmental, social, and economic consequences of prioritizing certain activities over others (von Thenen et al., 2020a; Frederiksen et al., 2021).
The significance of cumulative impacts, that is, impacts generated by multiple drivers of change, are discussed widely by decision-makers and scientists alike, and considerable efforts have been made in advancing ways of understanding cumulative impacts on marine ecosystems (Menegon et al., 2018). Various spatial decision-support tools (SDSTs) – web-based applications and non-web-based computer programs – have been developed to facilitate analysis of cumulative impacts and pressures on marine ecosystems and to support MSP (Menegon et al., 2018; Hansen, 2019; Hammar et al., 2020; Depellegrin et al., 2021). Hammar et al. (2020) for instance presented a method applied in the Swedish MSP process for exploring how cumulative impacts on ecosystems may be expected to increase or reduce as a result of MSP-related changes based on a widely used geospatial cumulative impacts index approach introduced by Halpern et al. (2008). The results gave planners an overview of areas most at risk and suitability of protection measures and provided a basis for comparing the suitability of activities in specific locations.
Mapping the effects of cumulative impacts on ecosystem services could be particularly useful for planners as it could reveal a more holistic picture of ecosystems and services most under risk (Menegon et al., 2018; Singh et al., 2020). Nevertheless, only a handful of studies have explored the consequences of cumulative impacts on marine service supply and people (e.g., Singh et al., 2020) and methods and tools for assessing cumulative impacts on ecosystem service supply remain to be developed.
The main aim of this research is to provide the foundations for the development of a multi-map toolset to support spatially explicit analysis of cumulative impacts on ecosystems and service supply during the planning process. More specifically, this paper presents the conceptual framework for the toolset and an approach to estimating change in ecosystem service supply utilizing the results of cumulative impact assessments. Finally, the proposed approach is manually tested by assessing change in service supply as a result of change in cumulative impacts for an area of the Baltic Sea.
The paper is divided into five chapters. The introduction is followed by the methods and materials section, which provides an overview of the analysis design, foundational concepts, and tools central to this study. Then, the conceptual framework for the toolset is presented and tested. This is followed by a discussion of the toolset’s application possibilities, evaluation of advantages and shortcoming, and a conclusion.
2 Methods and materials
2.1 Analysis process
The first step of the analysis is to develop an understanding of the key elements and needs of an MSP process as well as social-ecological analytical frameworks, which shape impact analysis (Figure 1, step one). The second step is to analyze two existing approaches for i) quantification of ecosystem service supply following a linkage framework approach and ii) assessment of cumulative impacts based on the widely used Halpern et al. (2008) approach, as well as the tools that facilitate them (Figure 1, step two). Based on this synopsis a conceptual framework for an integrated, multi-map toolset for the analysis of relative cumulative impacts on ecosystem service supply is proposed (Figure 1, step three) and illustrated with an example (Figure 1, step four).
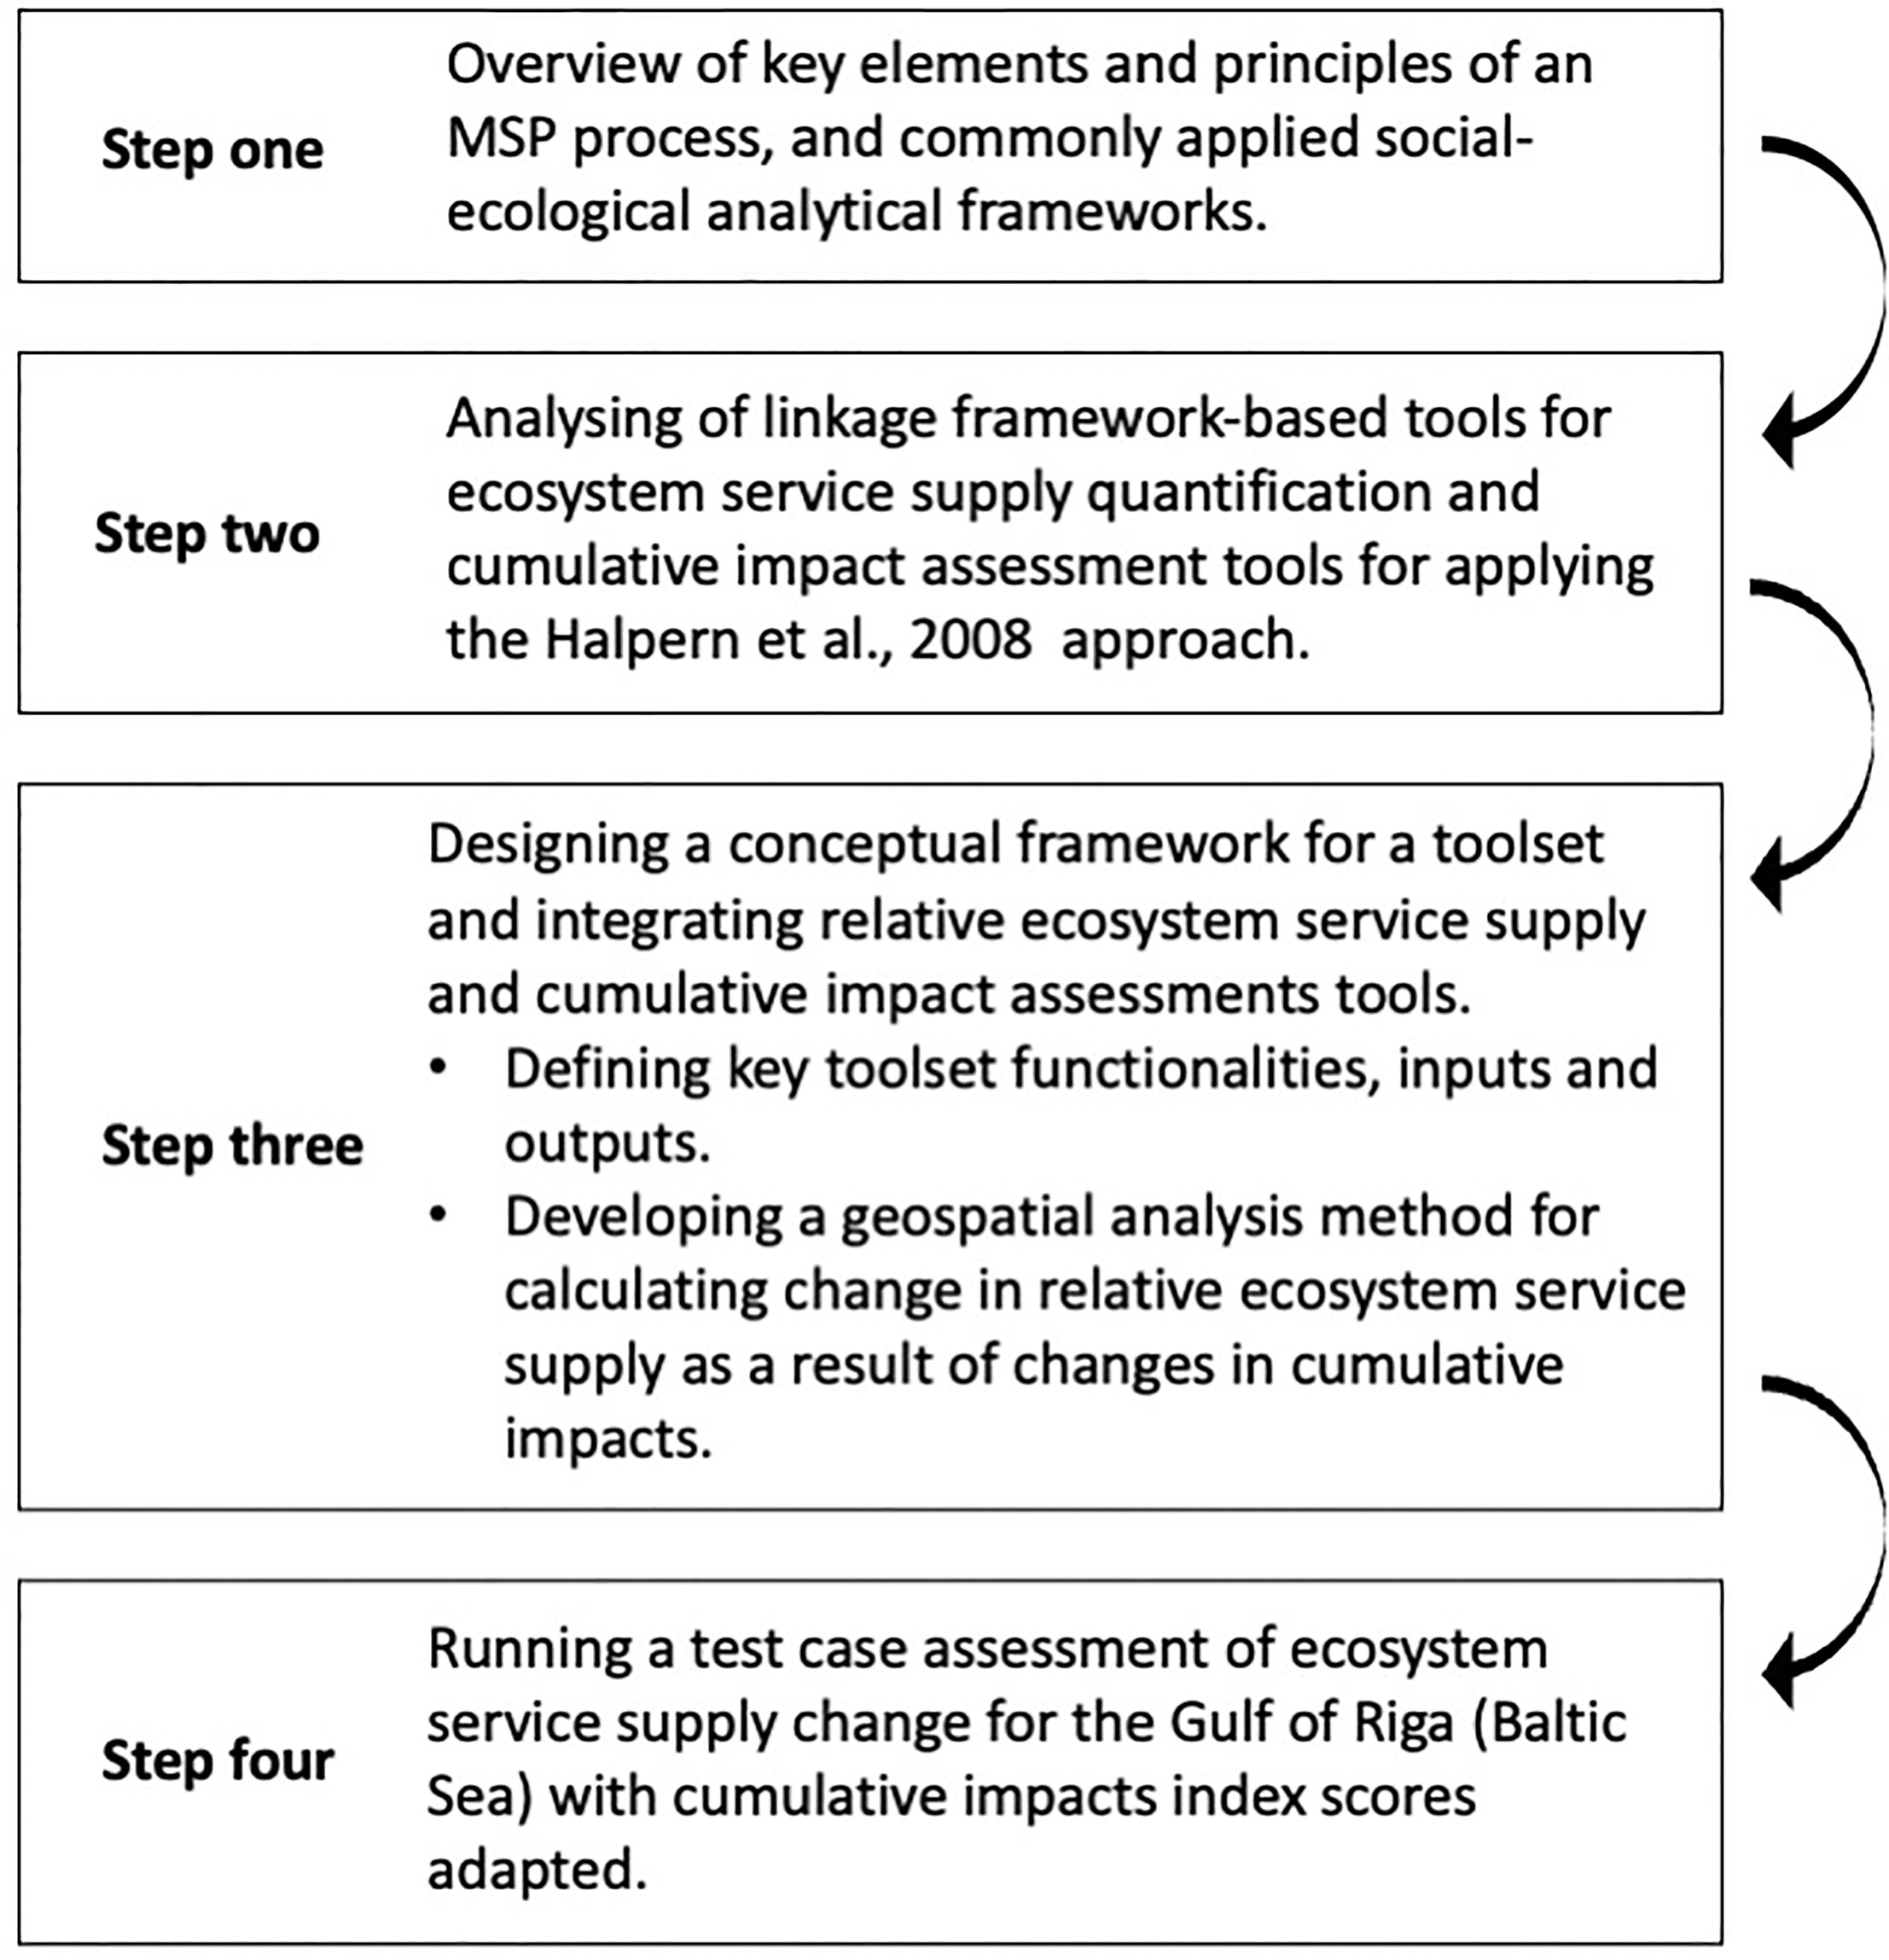
Figure 1 Steps of the analysis process.
2.2 Guiding principles and stages of maritime spatial planning
The MSP process has some defined phases or stages, some of which are focused on setting the objectives, others on analyzing the possible outcomes as well as implementing and monitoring the plans while continuously involving stakeholders and drawing on various types of knowledge, data, and information (Giacometti et al., 2020). MSP is place-based, and places serve different purposes and mean different things to different actors, thus, negotiation, discussion, and common objective setting is a key part and principle of MSP (Ehler et al., 2019). In addition to organizing the planning process and stakeholder engagement, MSP planners are also tasked with analysis of current conditions and future states of the ecosystems and society, which involves stock-taking, what-if scenarios, and trade-off analysis (Douvere and Ehler, 2011; Gissi et al., 2019; von Thenen et al., 2020a). Planners then prepare, approve, and implement the plan and monitor, evaluate, and adapt it, which then leads to the next planning cycle (Douvere and Ehler, 2011). MSP is a continuous, adaptive, and incremental process, and alternative routes to reach the objectives are explored during the plan development, the results of which inform measures and actions (Douvere and Ehler, 2011; Piet et al., 2020).
Scenario building is a way of exploring causal processes and evaluating potential outcomes against goals and objectives of the plan (McGowan et al., 2019). Scientific knowledge about the ecosystem, its dynamics, and an understanding of the functional relationship between people and the ecosystem is essential for scenario analysis and the implementation of ecosystem-based MSP (Bednarek et al., 2018; UNESCO-IOC/European Commission, 2021), that is, decision-making whereby resource demand and consumption, as well as economic development, is maintained within environmental thresholds and supports achieving good environmental status (Frazão Santos et al., 2014; HELCOM, 2020).
2.3 Social-ecological systems analytical frameworks
Understanding the complex interdependencies between ecosystems and human societies is important for many sustainability problems (De Vos et al., 2019; Schlüter et al., 2012; Schlüter et al., 2019). Such systems thinking – an issue-oriented approach to problem solving – recognizes the complexity of social, ecological, and economic phenomena (Davies and Stroink, 2015, Hopkins et al, 2011). Hereby, these phenomena, or sustainability problems, are not addressed in isolation but are viewed as part of social-ecological systems (SES), in which people and their environment are intrinsically interconnected. Various analytical frameworks have been developed to breakdown these complex systems into bitesize pieces in order to facilitate analysis, communication, and problem solving (Patrício et al., 2016; Potchin-Young et al., 2018; Delacámara et al., 2020). The Driver-Pressures-State-Impact-Response (DPSIR) was one of the first frameworks to identify the indicators for and describe pressures and impacts of human activities on the environment to inform decision-making (Binder et al., 2013; Gómez et al., 2016). DPSIR was introduced in the late nineties and since then has become one of the most widely used and adapted analytical frameworks in the context of marine environmental risk assessment and management (Patrício et al., 2016). According to the Patrício et al. (2016) study of the evolution of DPSIR-type frameworks, the most recent and elaborate adaptation of DPSIR for marine ecosystem-based management is the Drivers-Activities-Pressures-State-Impact (on human Welfare)-Response (as Measures) known as the DAPSI(W)R(M) framework. It defines drivers as the demand from society to fulfil basic human needs that result in human activities, which create pressure mechanisms through which the state of the ecosystem is changed (Patrício et al., 2016). A single activity can generate a whole range of pressures, which generate stressors resulting in cumulative impacts – impacts greater than the sum of its individual parts – affecting the ecosystems state immediately or over a longer period of time (Reckermann et al., 2022; Directive 2008 /56/EC). Changes in the state of the ecosystem include changes in species abundance or habitat composition, which in turn impact human welfare, for instance results in a decrease in food supply or natural flood defense (Patrício et al., 2016). Changes in the ecosystem state and impacts on human welfare are met with responses in the form of management measures, that is, actions targeted at controlling drivers, activities, and impacts on human welfare of the DAPSI(W)R(M) framework (Elliott and O’Higgins, 2020).
The ecosystem services (ES) approach shifts the focus from the effects of human activities on ecosystems to how we benefit from ecosystems, and aims to quantify these benefits (Sharpe et al., 2020; Elliott and O’Higgins, 2020). One of the most widely used conceptualizations of ES is the ES cascade, which represents human-environment interaction as a continuous process of ecosystem service supply and societal demand for services (Potchin-Young et al., 2018). Ecosystem services have generally been grouped into three types – provisioning, regulating and maintenance, and cultural – all of which play different yet incremental roles in maintaining our material well-being, physical and mental health, and other key factors determining our life quality and livelihoods (Alcamo et al., 2003; Potschin-Young et al., 2018). The ecosystem services element of an ecosystem services cascade has been seen as synonymous with “Impacts” in the DAPSI(W)R(M) framework, which has resulted in the substitution of the term “Impacts” to “Ecosystem Services”, and the development of ecosystem-based management-focused analytical frameworks such as the butterfly model (for more detail on the butterfly model see Atkins et al., 2011; Gómez et al., 2016, Elliott and O’Higgins, 2020).
MSP-SA introduced by Frederiksen et al. (2021) is another example of an analytical framework, which has adapted elements of DPSIR-type models and the ecosystem services cascade. It was designed to draw attention to economic, environmental, and the considerably under-considered social consequences of MSP (Frederiksen et al., 2021). In order to broaden the scope of impact analysis, MSP-SA divides “Impacts” of the DPSIR framework into three types corresponding with some of the elements of the ES cascade: ecosystem capacity; ecosystem services; and benefits, disbenefits, and the distribution of benefits and beneficiaries over time and space (ibid., Figure 2).
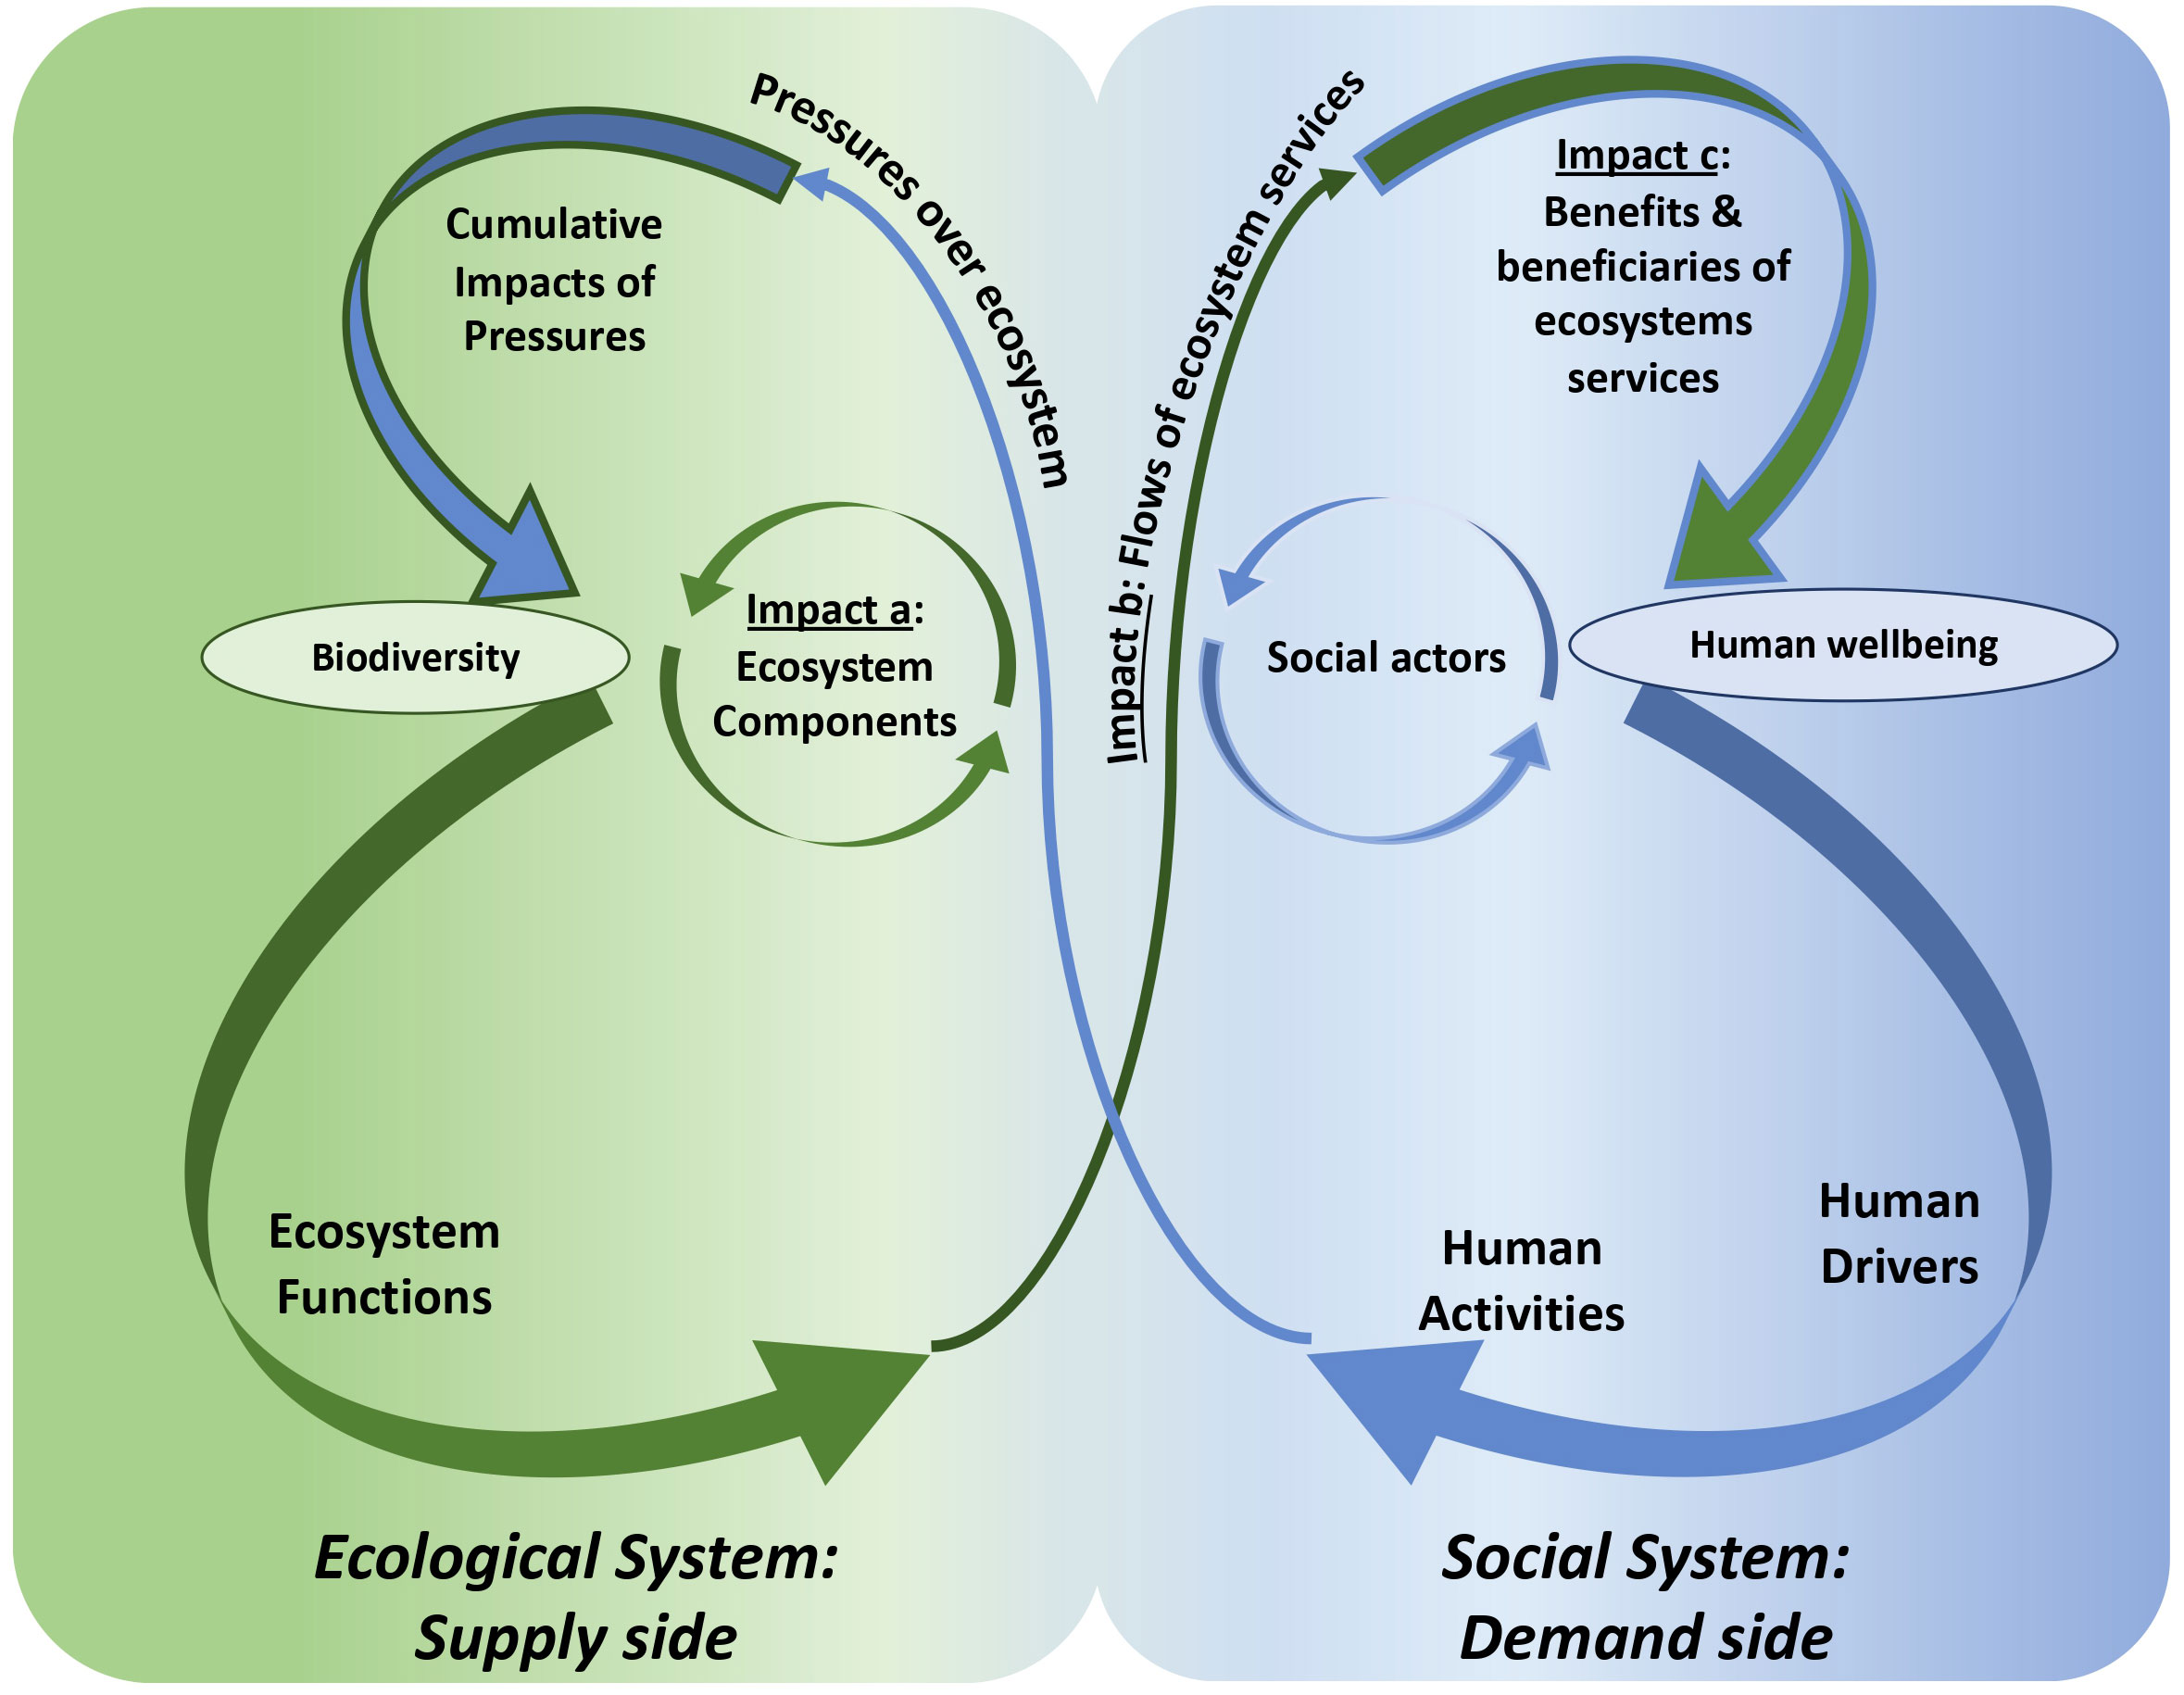
Figure 2 An adaptation of the butterfly model (Gómez et al., 2016) with the addition of “impact” elements of the MSP-SA framework (Frederiksen et al., 2021) as well as direct reference to cumulative impacts.
2.4 Existing marine cumulative impact and ecosystem service assessment approaches and tools
2.4.1 Linkage frameworks approach for assessing ecosystem services
Complex, social-ecological systems can be represented by interconnected elements in analytical, linkage frameworks that draw on various forms of knowledge (Ostrom, 2009; Gómez et al., 2016). Linkage frameworks can be built on top of existing analytical frameworks and describe the system in broad brush strokes or more nuanced numerical descriptions of interactions depending on the context and aims of the analysis (Robinson and Culhane, 2020). They are often used to explore a system and broker information to facilitate a dialogue between scientists, experts, and decision-makers (ibid.)
Linkage web diagrams can often be used to describe the SES at a level of extra detail. For instance, extensive linkage web diagrams have been used to describe the interactions between a whole range of human activities, pressures, and marine ecosystems (as in Culhane et al., 2018) and the relationships between habitats, ecosystem functioning, and service supply (see for examples Armoškaite et al., 2020; Robinson and Culhane, 2020; Culhane et al., 2018). Unlike analytical models, web diagrams attempt to consider the multiplicity of interactions between nodes or elements, which graphical representations of analytical frameworks alone, as pointed out by Potchin-Young et al., 2018, often fail to communicate.
ES analysis can be based on different types of knowledge, including expert opinion, geospatial data based on models or real-world observations provided by scientists, as well as data collected from stakeholders, which reveal their needs and values (Culhane et al., 2020). One of the key advantages of linkage diagrams is that they are not “data driven” (Robinson and Culhane, 2020). Instead, a combination of various data sources can inform the diagrams through an expert elicitations process resulting in diagrams of a more qualitative or semi-quantitative nature. This gives the user freedom to choose the level of detail of the analysis and permits assessments looking into parts of a system that may be widely studied as well as elements and dynamics about which there is little information in the same space (Robinson and Culhane, 2020). This makes the tool accessible in various contexts; what is more, it means that elements of biodiversity or benefits that people gain from ecosystems that are under-considered can be recognized and discussed in a decision-making context in addition to some more prominent topics or charismatic species (ibid.).
Purely qualitative descriptions of the links between elements may be focused more on facilitating communication, development of a common understanding, and conveying the interdependence of elements in the system (Culhane et al., 2020; Frederiksen et al., 2021). Semi-qualitative linkage diagrams numerically describe links between elements and therefore can also highlight the importance of some links over others, for instance the significance of the relative contribution of some habitats in the supply of certain services (as seen in Armoškaite et al., 2020). Numerical description can be a particularly useful instrument for calculating the effects of change in the ecosystem, on its capacity and relative service supply (Armoškaite et al., 2020; Armoškaite et al., 2021). Linkage diagrams tend to be based on matrices populated by scientists with reference typologies such as the Common International Classification of Ecosystem Services (CICES) for identifying services or a regional habitat classification system to list ecosystem components.
In Armoškaite et al. (2020), experts ascribed relative numerical values to links between ecosystem components, functions, and services. They based these values on various sources including scholarly literature, local knowledge, CICES and maps, and a regional habitat classification system for the Baltic Sea (i.e., HELCOM, 2013). The values created a foundation for calculating relative ecosystem component contribution in ecosystem functioning and service supply, as well as relative supply change analysis as a result of changes in contribution levels representing ecosystem capacity to supply services. To estimate relative change, ecosystem service supply contribution values have been adapted based on expert knowledge (Armoškaite et al., 2020) as well as geodata describing change in habitat composition based on field observations (Armoškaite et al., 2021).
Further operationalization of linkage frameworks approaches in MSP requires mapping of ecosystem service supply assessment results. Maps also allow the user to visually identify otherwise invisible spatial patterns and explore the interactions between features within the environment and drivers of change over time, thereby allowing future state analysis and highlighting areas for further study (Burgess et al., 2016). The basis of ES supply maps is most often geospatial information on habitats or species distribution (ibid.). Geodata on ecosystem component distribution could also be used to map the results of the semi-quantitative linkage framework-based assessment, that is, relative ecosystem component contribution values and ecosystem service supply change.
2.4.2 Tools for calculating cumulative impacts
The majority of manual assessments of cumulative impacts conducted for scientific research purposes are based on the Halpern et al. (2008) model, where geospatial data on pressures and ecosystem component distribution and expert-derived estimates of ecosystem component sensitivity to pressures play a central role (Hansen & Bonnevie, 2020; Bonnevie et al., 2022). The cumulative impact scores per 1 km2 cell can be calculated with the following equation:
where n is the pressure and m the ecosystem components. is the spatial distribution of pressures such as fishing efforts or shipping intensity as regular grids. Pressure data are log(x+1)- transformed and rescaled to 0…1. is the spatial distribution of ecosystem components as regular grids (e.g., seagrass Zostera marina) as presence (1) and absence (0). are sensitivity weights numerically representing the sensitivity of ecosystem component j to pressure I, typically derived by expert judgement.
A range of tools have been developed to support on-the-fly CIA analysis employing the Halpern et al., 2008 model (Depellegrin et al., 2021). MYTILUS, Symphony, Baltic Sea Impact Index Assessment Tool, and PlanWise4Blue are tools that have been applied and tested in the Baltic Sea context and employ weights describing species sensitivity to pressures obtained for the purpose of CIA analysis through expert elicitation at the international level by HELCOM (HELCOM, 2023). The sensitivity weights were derived through a combination of marine expert surveys, cross-checked with a literature analysis on physical loss and seabed disturbance, and expert confidence self-evaluation (HELCOM, 2018).
HELCOM have applied these weights following the Halpern et al., 2008 model to calculate the Baltic Sea Pressure and Impact Indices, that is, the distribution of cumulative pressures and cumulative impacts respectively. Both assessments are conducted as part of a thematic assessment of cumulative impacts on the Baltic Sea reproducible using the Baltic Sea Impact Index Assessment Tool and the wider holistic assessments of the ecosystem health (HELCOM, 2018). The difference between the two is that the cumulative pressure index reveals distribution of pressures, for instance, where pressure is at its highest, but does not consider the ecosystem components, while the impact index considers distribution of ecosystem components thereby accounting for species sensitivity to a pressure and whether or not the pressures and species spatially overlap. Maximum pressure scores, as explained by Hansen, 2019, highlight per-cell highest impacting pressures and may inform the decision-making process by indicating which pressures should be reduced.
MYTILUS is an open-source tool applied in various research settings (Bonnevie et al., 2022) and its outputs also include maps of per-cell mean additive cumulative impact index scores, as well as the option to calculate cumulative pressure index scores, including maximum pressure index scores. MYTILUS has a readymade ecological geodatabase for running CIA within the Baltic Sea region sourced from the HELCOM map and data service. HELCOM data is freely available and harmonized and comparable with data at the Baltic Sea scale, which are obtained from countries around the Baltic Sea through data calls, expert networks, and working groups, as well as European projects.
On top of facilitating CIA analysis based on the Halpern et al. (2008) approach, Symphony and MYTILUS both have scenario components, which permit adjustment of pressure levels within a specific geographical location as well as comparison between the different environmental states due to changes in pressures. The Symphony tool that has been used in the context of Swedish MSP and its scenario analysis capabilities were used to work out relative change in impact index scores for a specific location (Hammar et al., 2020).
3 A conceptual framework for mapping cumulative impacts on ecosystem service supply
The conceptual framework depicts the inputs and spatial outputs, as well as the interactions between them as part of the process of assessing ecosystem service supply and cumulative impacts (Figure 3). The different elements in the framework are numbered and referenced with respect to their reference number throughout the remainder of the text for the sake of clarity. A key and unifying input required to deliver the outputs of relative ecosystem service supply and cumulative impacts assessments is the geospatial distribution of ecosystem components, that is, input 3. An additive cumulative impacts assessment following the Halpern et al. (2008) approach also requires information on the geospatial distribution of pressures (1) and a numerical description of ecosystem component sensitivity to pressures (2). In addition to the previously mentioned ecosystem component distribution data, the other key input for running a service supply assessment following Armoškaite et al. (2020) is weights describing the importance of the same ecosystem components in ecosystem functioning, as well as the importance of ecosystem functioning in service supply (4).
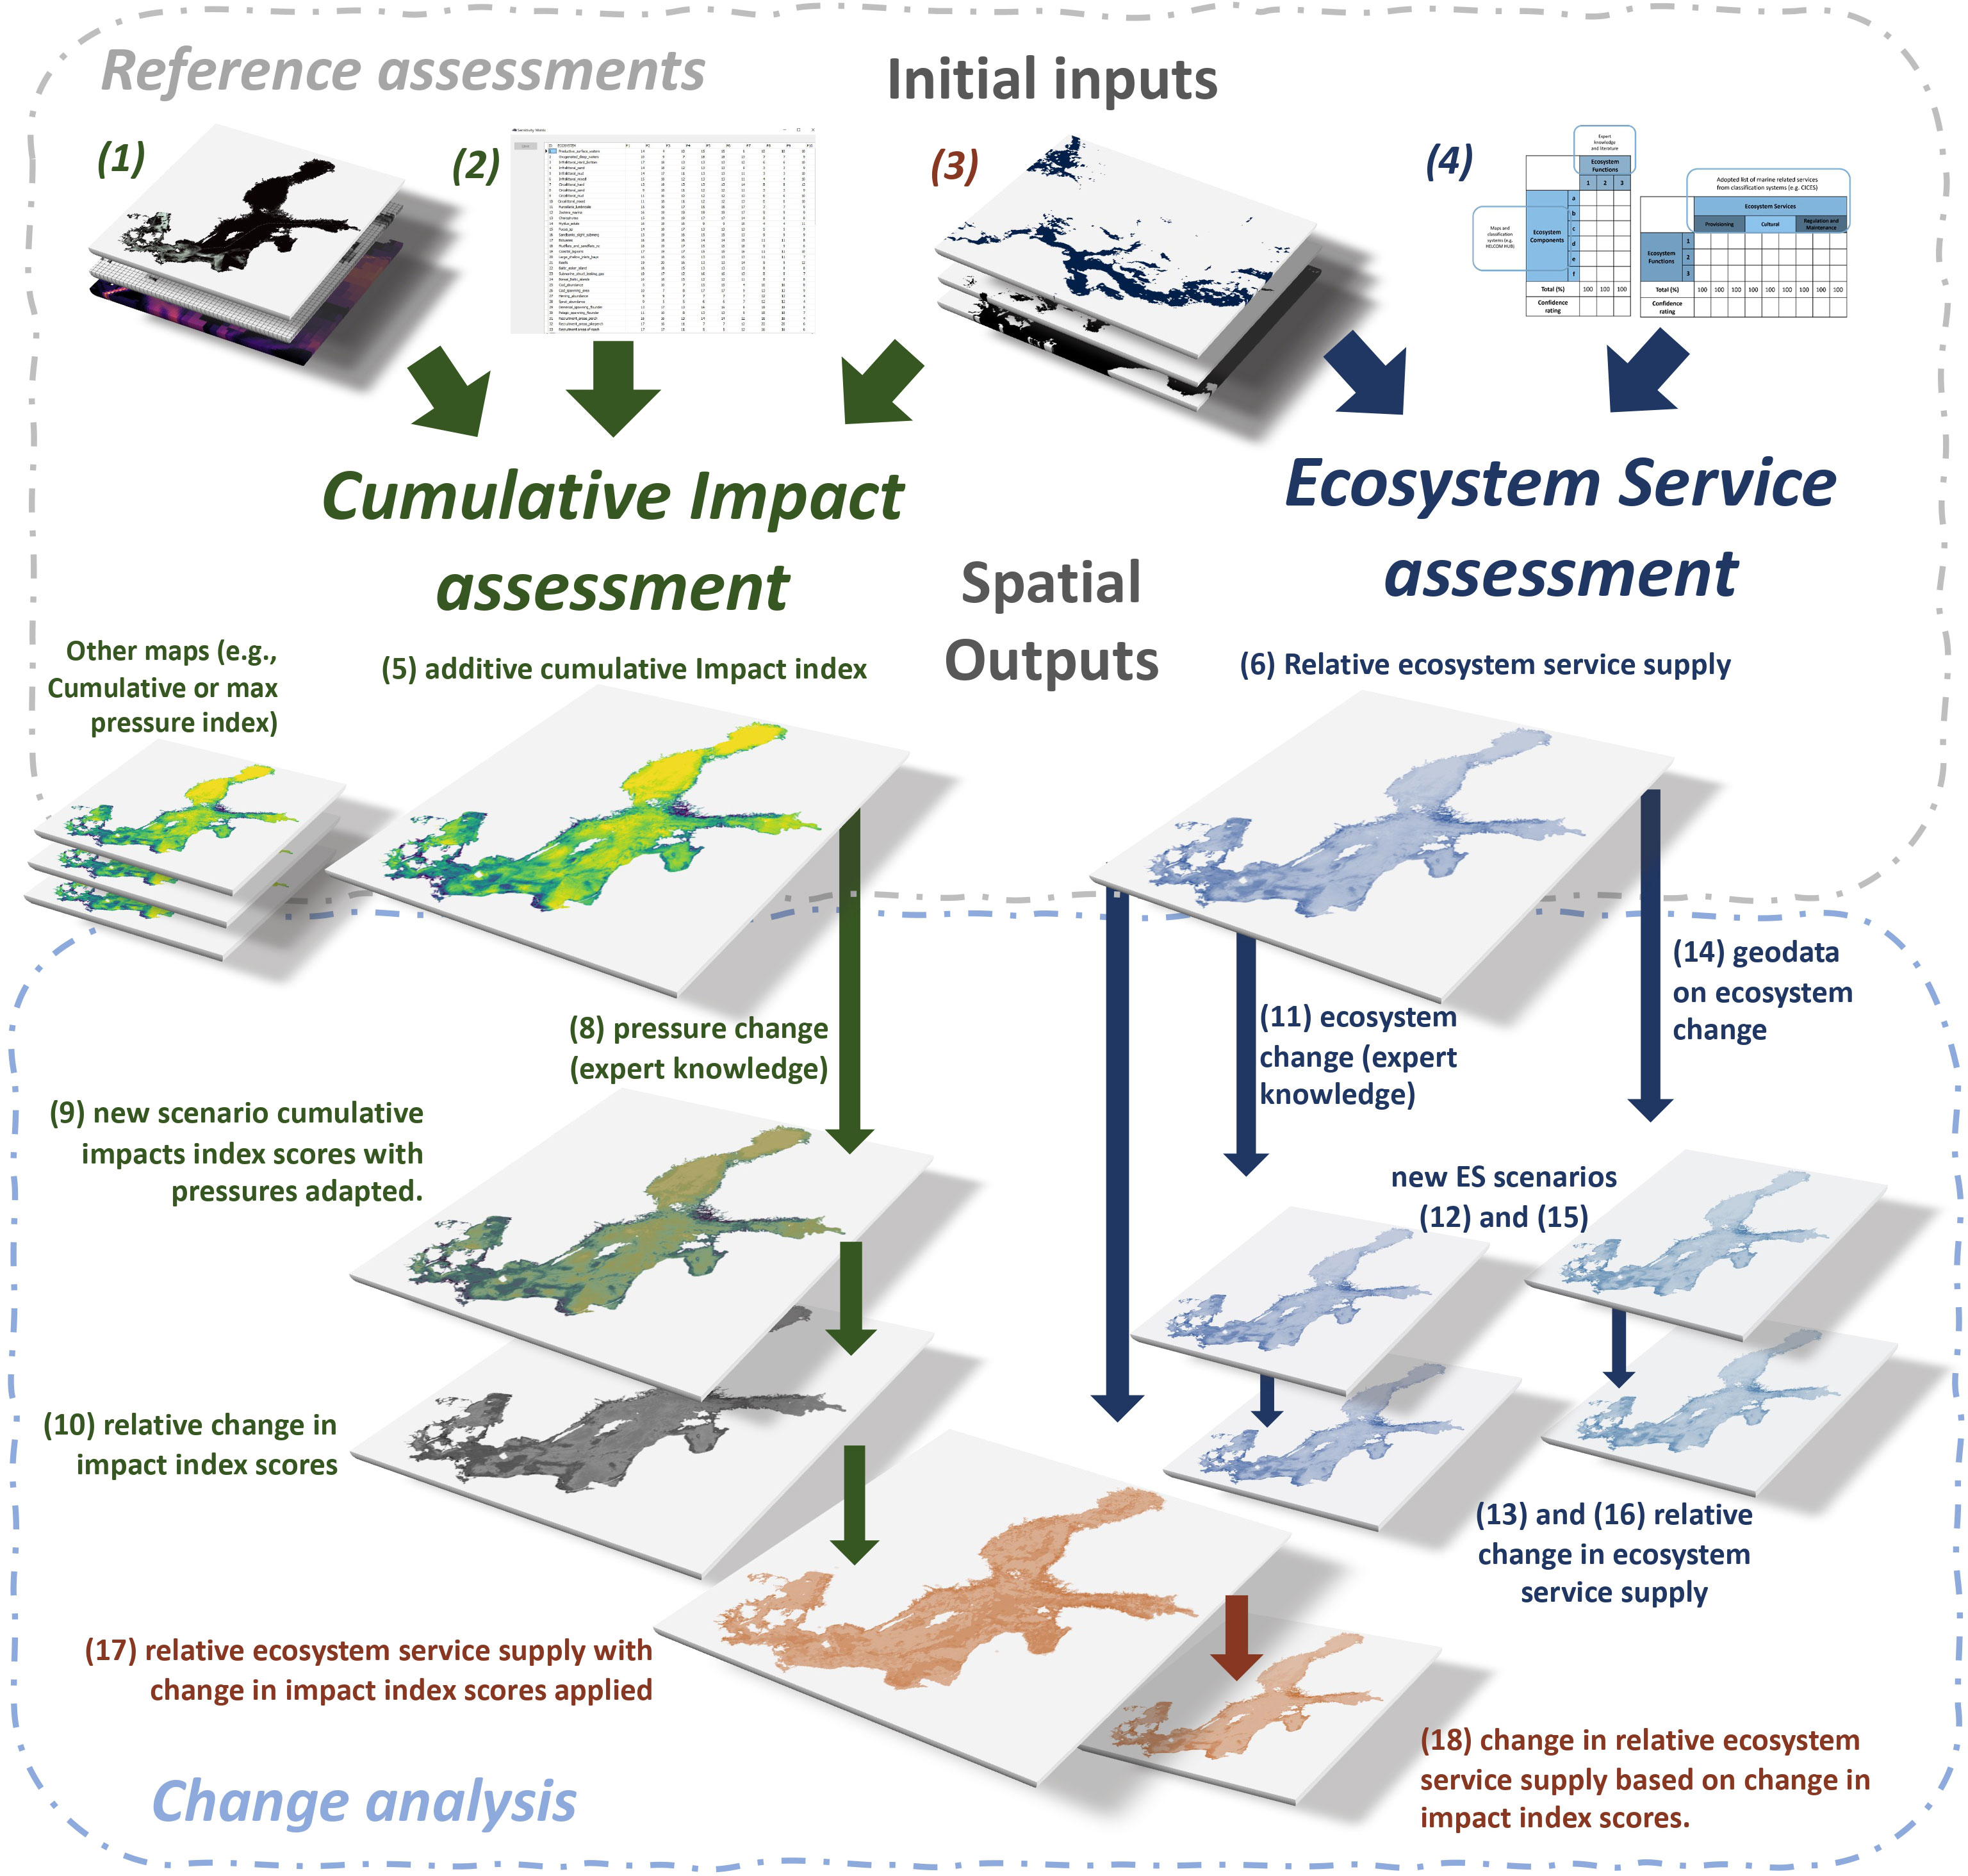
Figure 3 Conceptual framework for a multi-map ES-CIA toolset. The initials Inputs for the reference cumulative impacts and pressures (left) and service supply (right) assessments include (1) Spatial distribution of pressures, (2) Weights numerically representing the sensitivity of ecosystem component to pressures, (3) Spatial distribution of ecosystem components, and (4) Weights numerically representing the importance of ecosystem components in ecosystem functioning and functions in service supply. For change analysis additional expert knowledge (11), geodata (14) on ecosystem change for service supply analysis is needed, as well as expert knowledge on pressure change (8). Combined outputs (10) and (6) serve as inputs facilitating mapping of relative service supply under additive cumulative impacts based on index values as well as change in service supply with pressures applied.
The assessments and the functionalities in the toolset can be divided into two interrelated parts: reference assessment (Table 1) and change analysis (Table 2). Reference assessment outputs include spatial and non-spatial outputs, including a linkage diagram depicting the pathways of ecosystem service supply and relative contribution of ecosystem components (7 in Table 1).
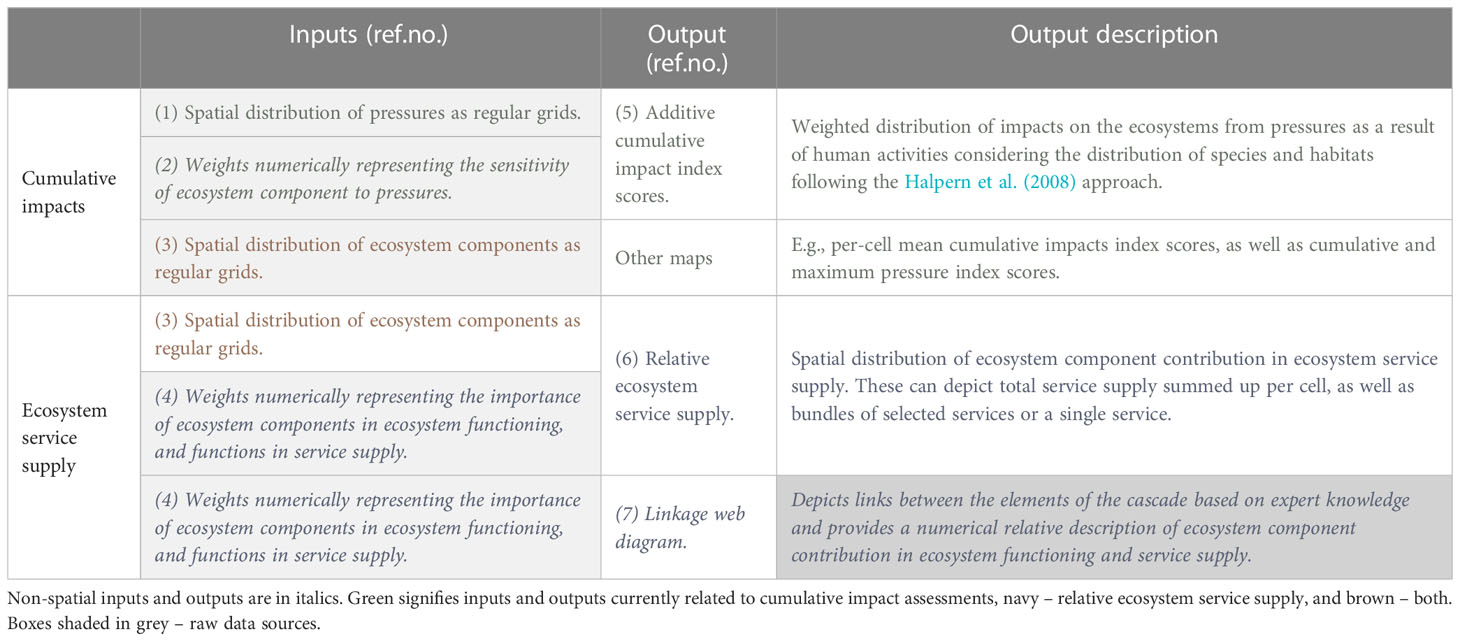
Table 1 A list and description of the reference assessment inputs and outputs.

Table 2 A list and description of change analysis inputs and outputs.
Change analysis builds on top of the results of reference assessments and some outputs become key steps or inputs for generating others (Table 2). On top of the “initial” data inputs (numbered 1,2, 3, and 4), what-if scenario or change analysis needs some further knowledge, for instance knowledge of pressure change (8). This is particularly important if any sort of connection is to be made within the scenario to “activities” or “responses” elements of the DAPSI(W)R(M) framework.
One of the key advantages of the toolset is that it gives the possibility to apply the relative change in impact index score to service supply assessments as a coefficient describing change in ecosystem component contribution, thereby connecting service supply and cumulative impact assessments.
As Tables 1 and 2 and Figure 3 show, a sequence of steps and geospatial outputs need to be worked out in order to assess relative change in service supply assessment using CIA as the evidence base. This first involves conducting an additive cumulative impact index assessment (5) as described in section 2.3, as well as an ecosystems service supply assessment (6). Secondly, a new pressure-adapted CIA scenario must be run (9) and the new cumulative impacts scenario (9) divided by the reference cumulative index scores to work out the relative change in additive cumulative impact index scores (10). Output 17 – relative service supply with pressures applied – can then be calculated. Here, the additive ecosystem component contribution values, that is, service supply (6), is divided by the relative change in additive cumulative impact index scores (10).
A map depicting relative ecosystem service supply with pressures applied (17) can be viewed in comparison to the reference supply map (6) to see changes that have occurred as a result of pressure adaptation. To see the impacts of pressures on service supply in sharper contrast, the reference scenario (6) can be subtracted from the “new scenario” (17) to show change in service supply units.
To illustrate the steps for the proposed method for investigating relative service supply change with pressures applied, an assessment was conducted manually for the Gulf of Riga area of the Baltic Sea. The assessment results and steps of the analysis are described in the next part of this section.
3.1 Change analysis in practice: the Gulf of Riga
MYTILUS tool scenario functionalities were used to assess cumulative impacts for the Gulf of Riga, a basin in the eastern Baltic Sea. This was seen as an appropriate test case site because MYTILUS has a ready-made dataset sourced from HELCOM (as described in section 2.3.2) equipped to facilitate cumulative impact assessments for the Baltic Sea region. A key advantage of using MYTILUS is that the outputs can be exported in raster format for further geospatial analysis outside the MYTILUS environment, for instance using freely available QGIS software. The Gulf of Riga was also chosen as a test case because an ecosystem service supply assessment has already been conducted for the basin and the results of the assessment – a linkage diagram and numerical relative description of ecosystem component contribution in service supply and ecosystem functioning – are readily available in Armoškaite et al. (2020).
The assessment of “reference” and “new” scenario additive cumulative impacts and mapping of relative ecosystem service supply were first done separately as explained below, and then the results were combined to reveal the relative change in ecosystem service supply as a result of change in cumulative impact index scores.
Cumulative impacts and pressures analysis of the Gulf of Riga via MYTILUS suggests that the Gulf of Riga ecosystem is under several types of pressure (Figure 4). Figure 4 suggests that the first and second largest pressures in the basin are phosphorus and nitrogen inputs, which are related to terrestrial activities. Third is hazardous substances, followed by introduction of non-indigenous species, fishing of herring, and disturbance of species. Fishing of herring was seen as a suitable variable for the test case as it is a pressure associated with a single source and therefore can be controlled through management of one activity.
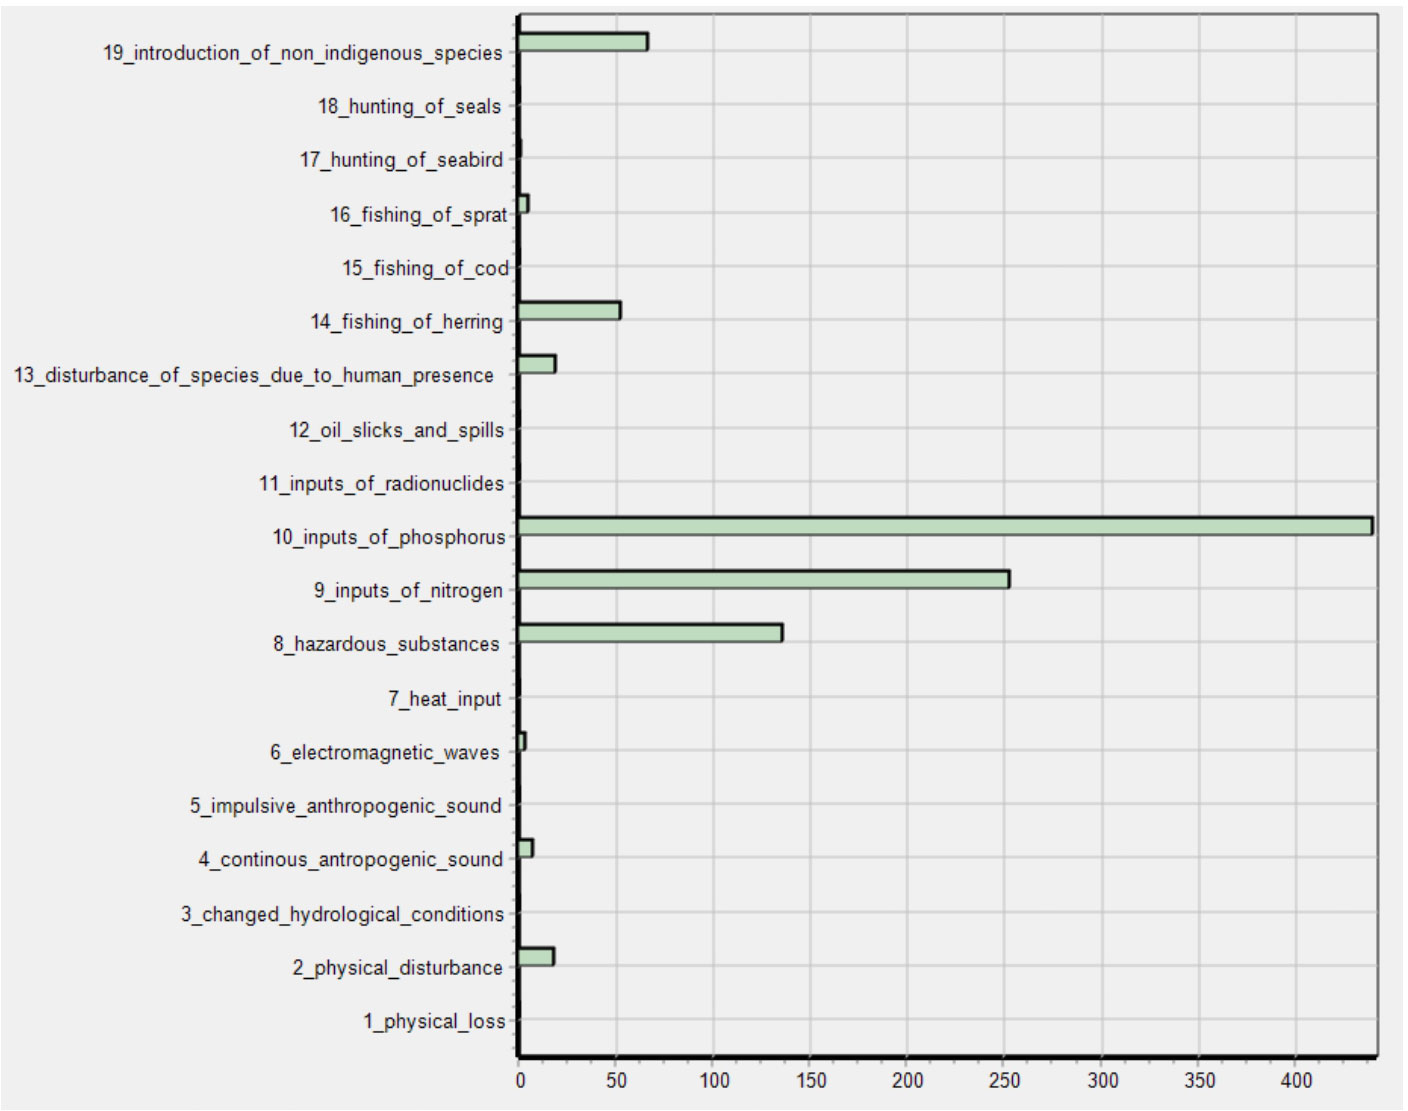
Figure 4 A bar chart describing the human-driven pressures and their pressure values at the Gulf of Riga basin level. Graph source: MYTILUS version 2.0 (Hansen, 2019).
3.1.1 Calculating change in cumulative impact index scores
To calculate relative change in relative cumulative impacts, the first step of the assessment is to conduct “reference” and “new” scenario additive cumulative impacts assessments. To illustrate this, two Baltic Sea scale cumulative impact assessments were run using MYTILUS. One was run with pressures at levels as described in Figure 4 and resulted in a map depicting the reference cumulative impact index values (5 in Table 2, Figures 3, 5). In the second assessment, the pressure levels of fishing of herring for the Gulf of Riga were reduced by 50% using the “adapt pressures” function resulting in a map depicting a new scenario cumulative impacts index values with pressures adapted (9; Figure 5).
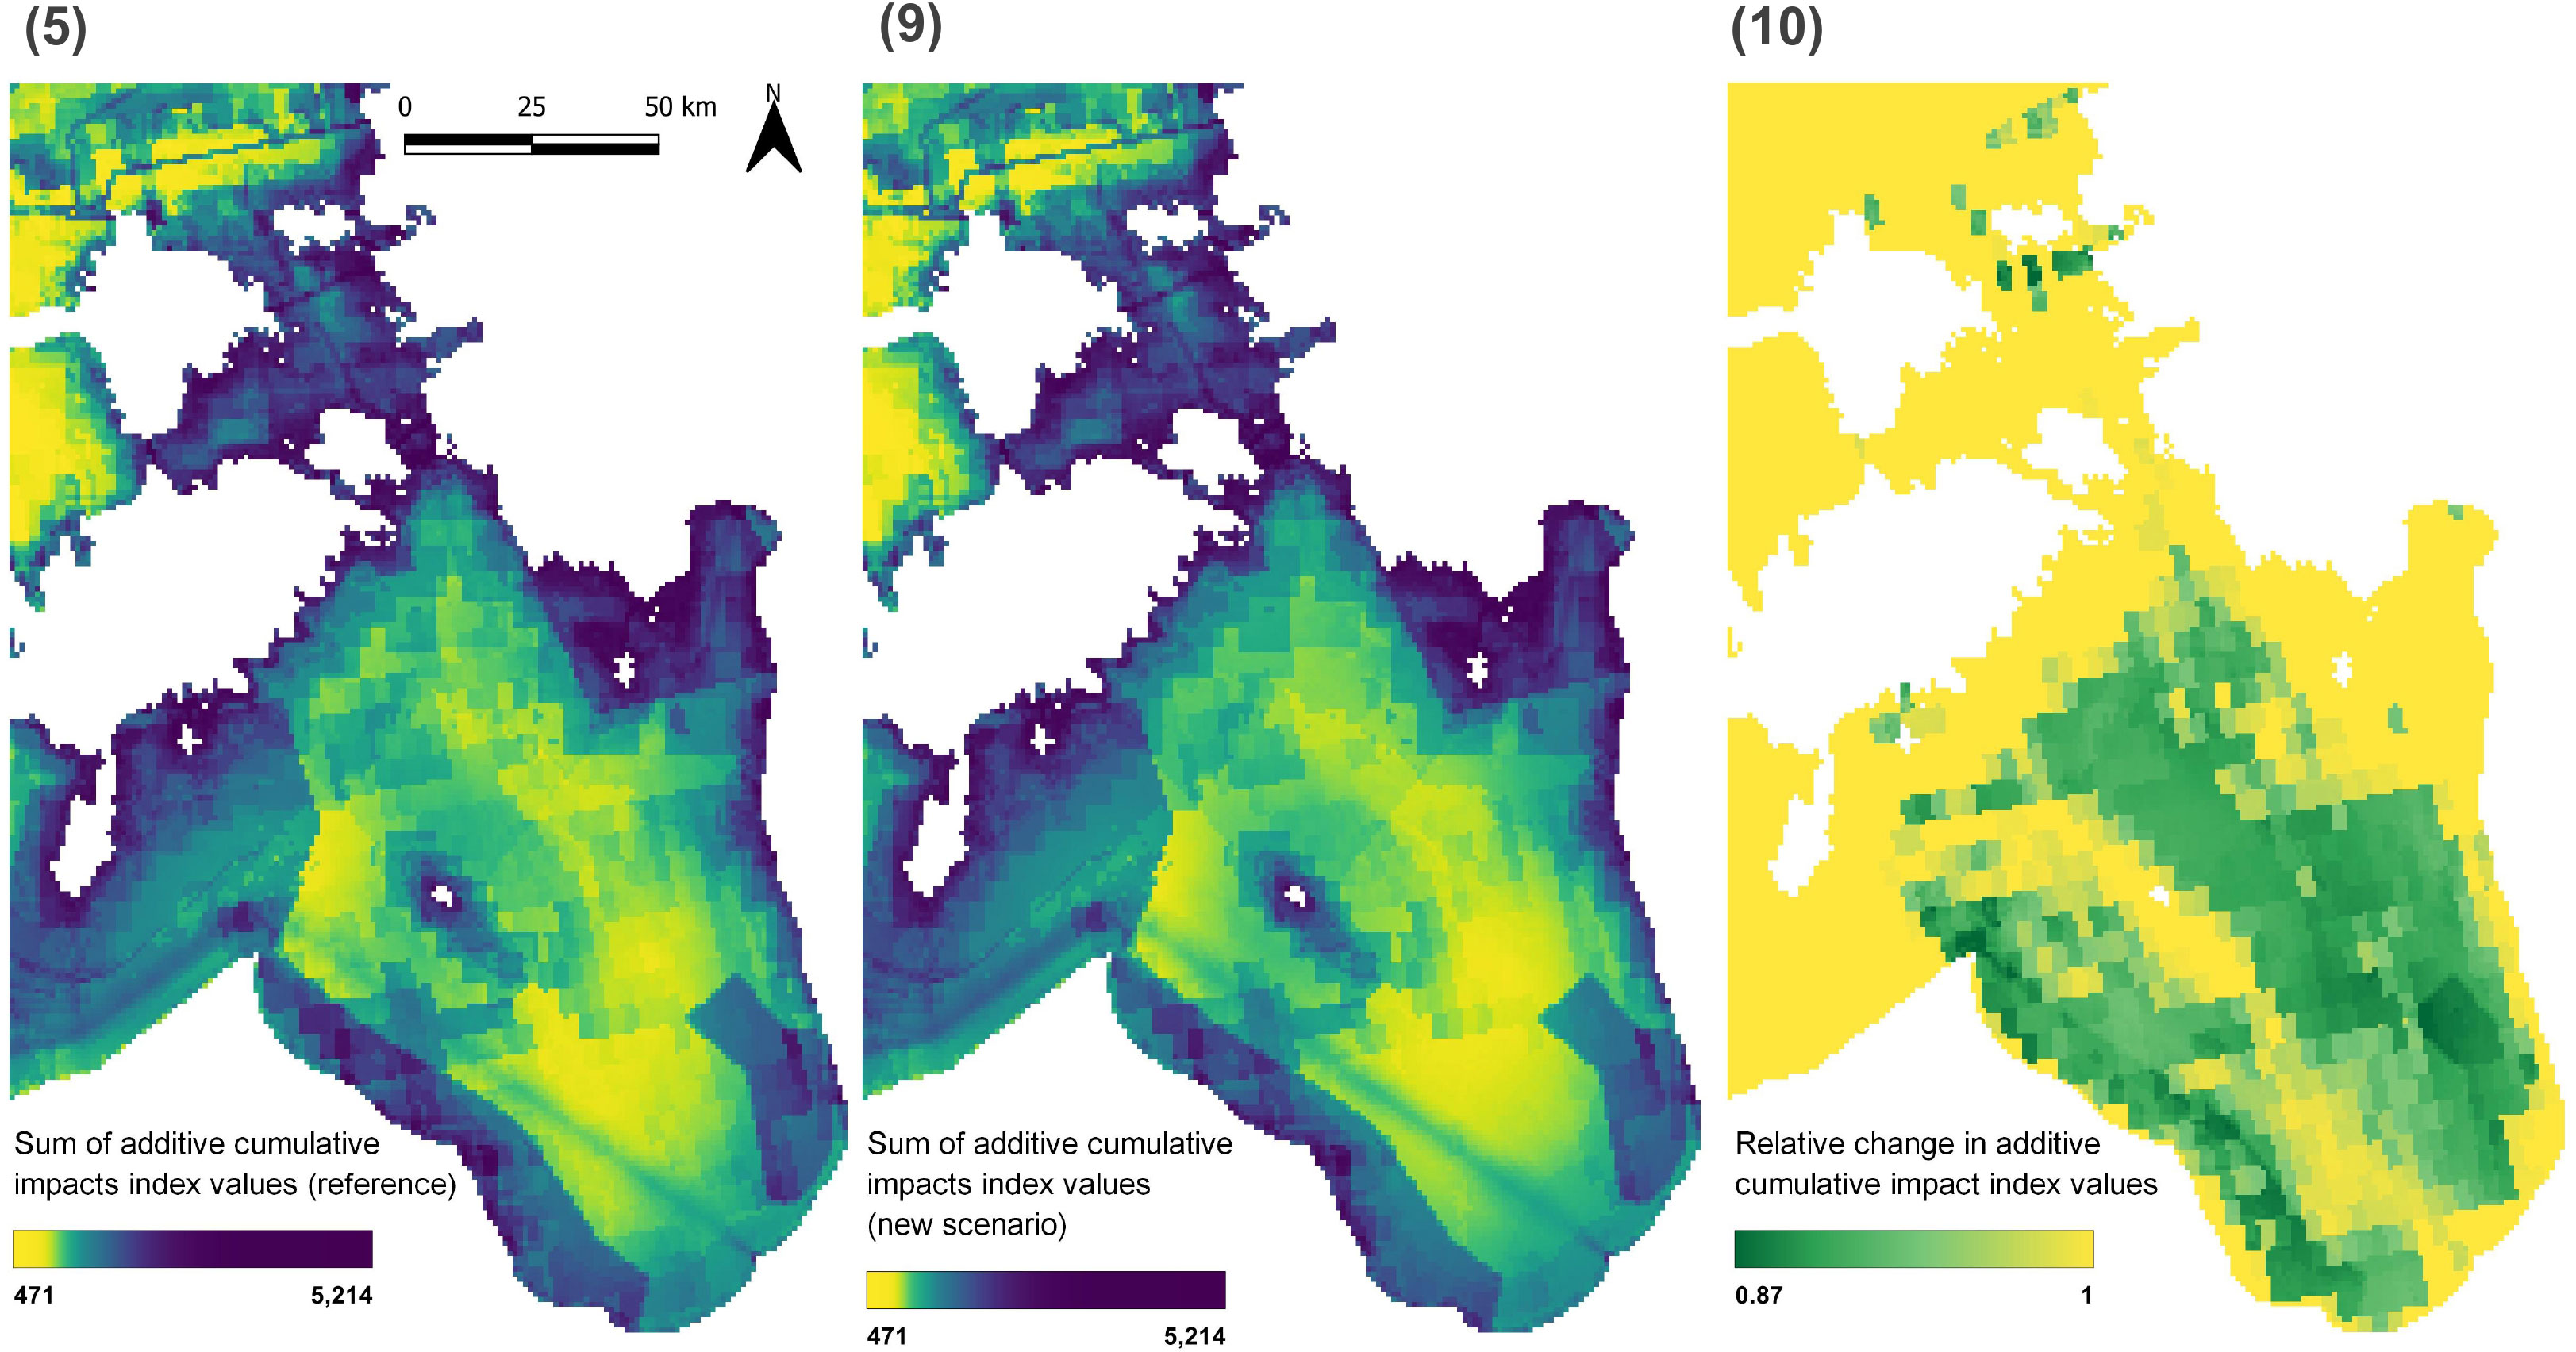
Figure 5 Gulf of Riga CIA results. Numbers next to each map are a reference to outputs in conceptual framework and Tables 1 and 2. In the relative change map, cumulative impact increased if above 1, not changed if 1, or decreased if below 1 within the cell.
The two assessments were then exported as raster files to QGIS to calculate the per-cell relative change in cumulative impacts. To calculate relative change, the new scenario raster layer was divided by the reference cumulative impact index scores using the raster calculator. The resulting raster was then clipped to only display the Gulf of Riga.
Maps of relative change in additive cumulative impact index values (10; Figure 5) reveal if cumulative impact has increased within the cell if the value is above one, not changed if equal to one, and decreased if below one. Figure 5 suggests that decreasing herring fishing in the Gulf of Riga may result in up to 13% decrease in cumulative impacts in the most affected cells.
3.1.2 Mapping reference state ecosystem service supply
At the same time, a single raster data file depicting per-cell total ecosystem service supply employing the results of the Armoškaite et al. (2020) study was prepared (for a full list of ecosystem services see Supplementary Table 1). Assessing relative service supply with pressures applied is based on a number of underlying assumptions: a) the data layers show ecosystem components in their current distribution and the reference state assessment in service supply reflects the current ecosystem state – the capacity of the ecosystem to supply services under the current level of pressure as depicted in the CIA, and b) that the two assessments are comparable as long as they are based on the exact same spatial ecosystem data, that is, data on the distribution of the ecosystem components (input 3 in Figure 3 depicting the toolset conceptual framework).This means the same geodata used in MYTILUS had to be used to plot ecosystem contribution values, which, when mapped, depict ecosystem service supply. The datasets used in the MYTILUS assessment are a collection of continuous, ordinal and binary, raster datasets freely available on the HELCOM metadata catalogue and map and data services. In the Armoškaite et al. (2020) study, 17 ecosystem components were considered and a single or a combination of geodata layers were selected from the HELCOM and MYTILUS database to represent each one for mapping the results of the Armoškaite et al. (2020) ecosystem service supply assessment (Table 3).
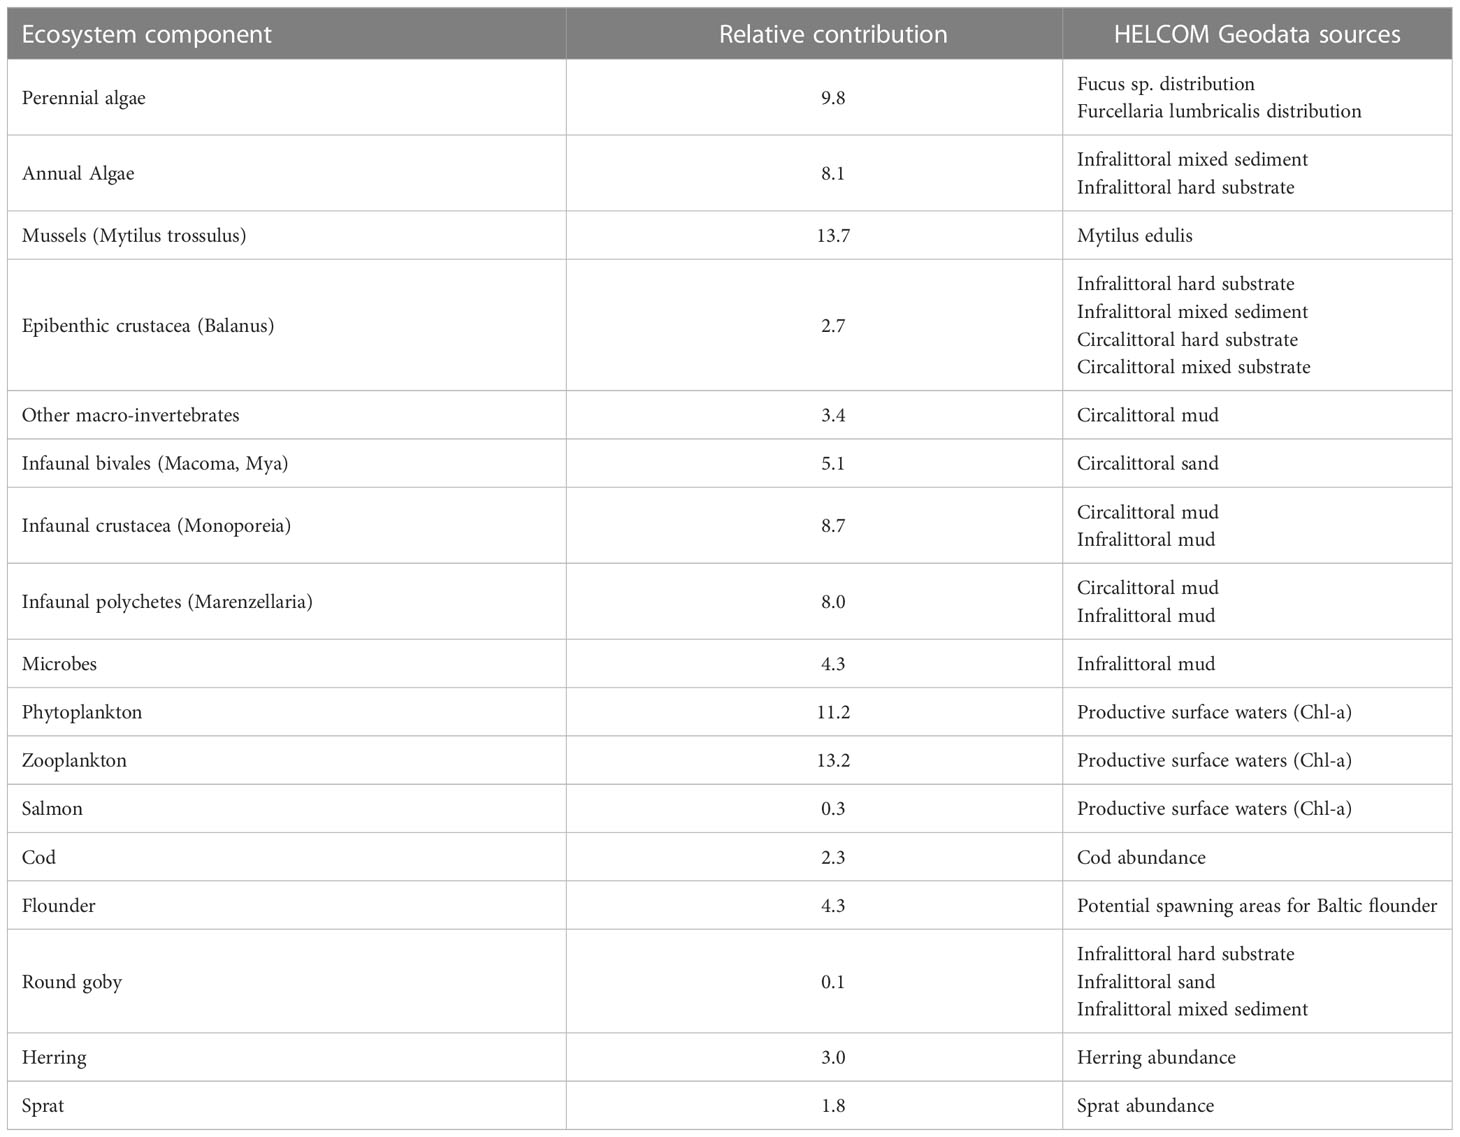
Table 3 Ecosystem components and their estimated relative contribution in total service supply [sourced from Armoškaite et al. (2020)] and their spatial proxies identified from the list of HELCOM ecosystem components (HELCOM metadata catalogue) considered in the HELCOM sensitivity matrix and thereby MYTILUS CIA based on the Halpern et al. (2008) approach.
Ecosystem data was exported from MYTLIUS to make sure the exact same raster files were used in both assessments and prepared for the ecosystem service supply assessment. This meant that in cases where a single geodata layer was sufficient to represent the distribution of that component, the (1) values in the raster grid indicating the presence of that species were replaced with the ecosystem component contribution value (Table 3). In cases where several geodata layers had to be combined to represent the distribution of an ecosystem component (see for instance the ecosystem component Epibenthic crustacea in Table 3), the raster grids were first merged and then all cells in this aggregated grid with a value above (0) were ascribed the contribution value of the respective ecosystem component. All 17 grids were then overlayed, values summed up, and the map was cropped to the area of the Gulf of Riga. The result of the analysis was a map depicting per-cell total and relative ecosystem service supply, that is, the reference scenario for assessing change in relative ecosystem service supply (see output 6 in Figure 6).
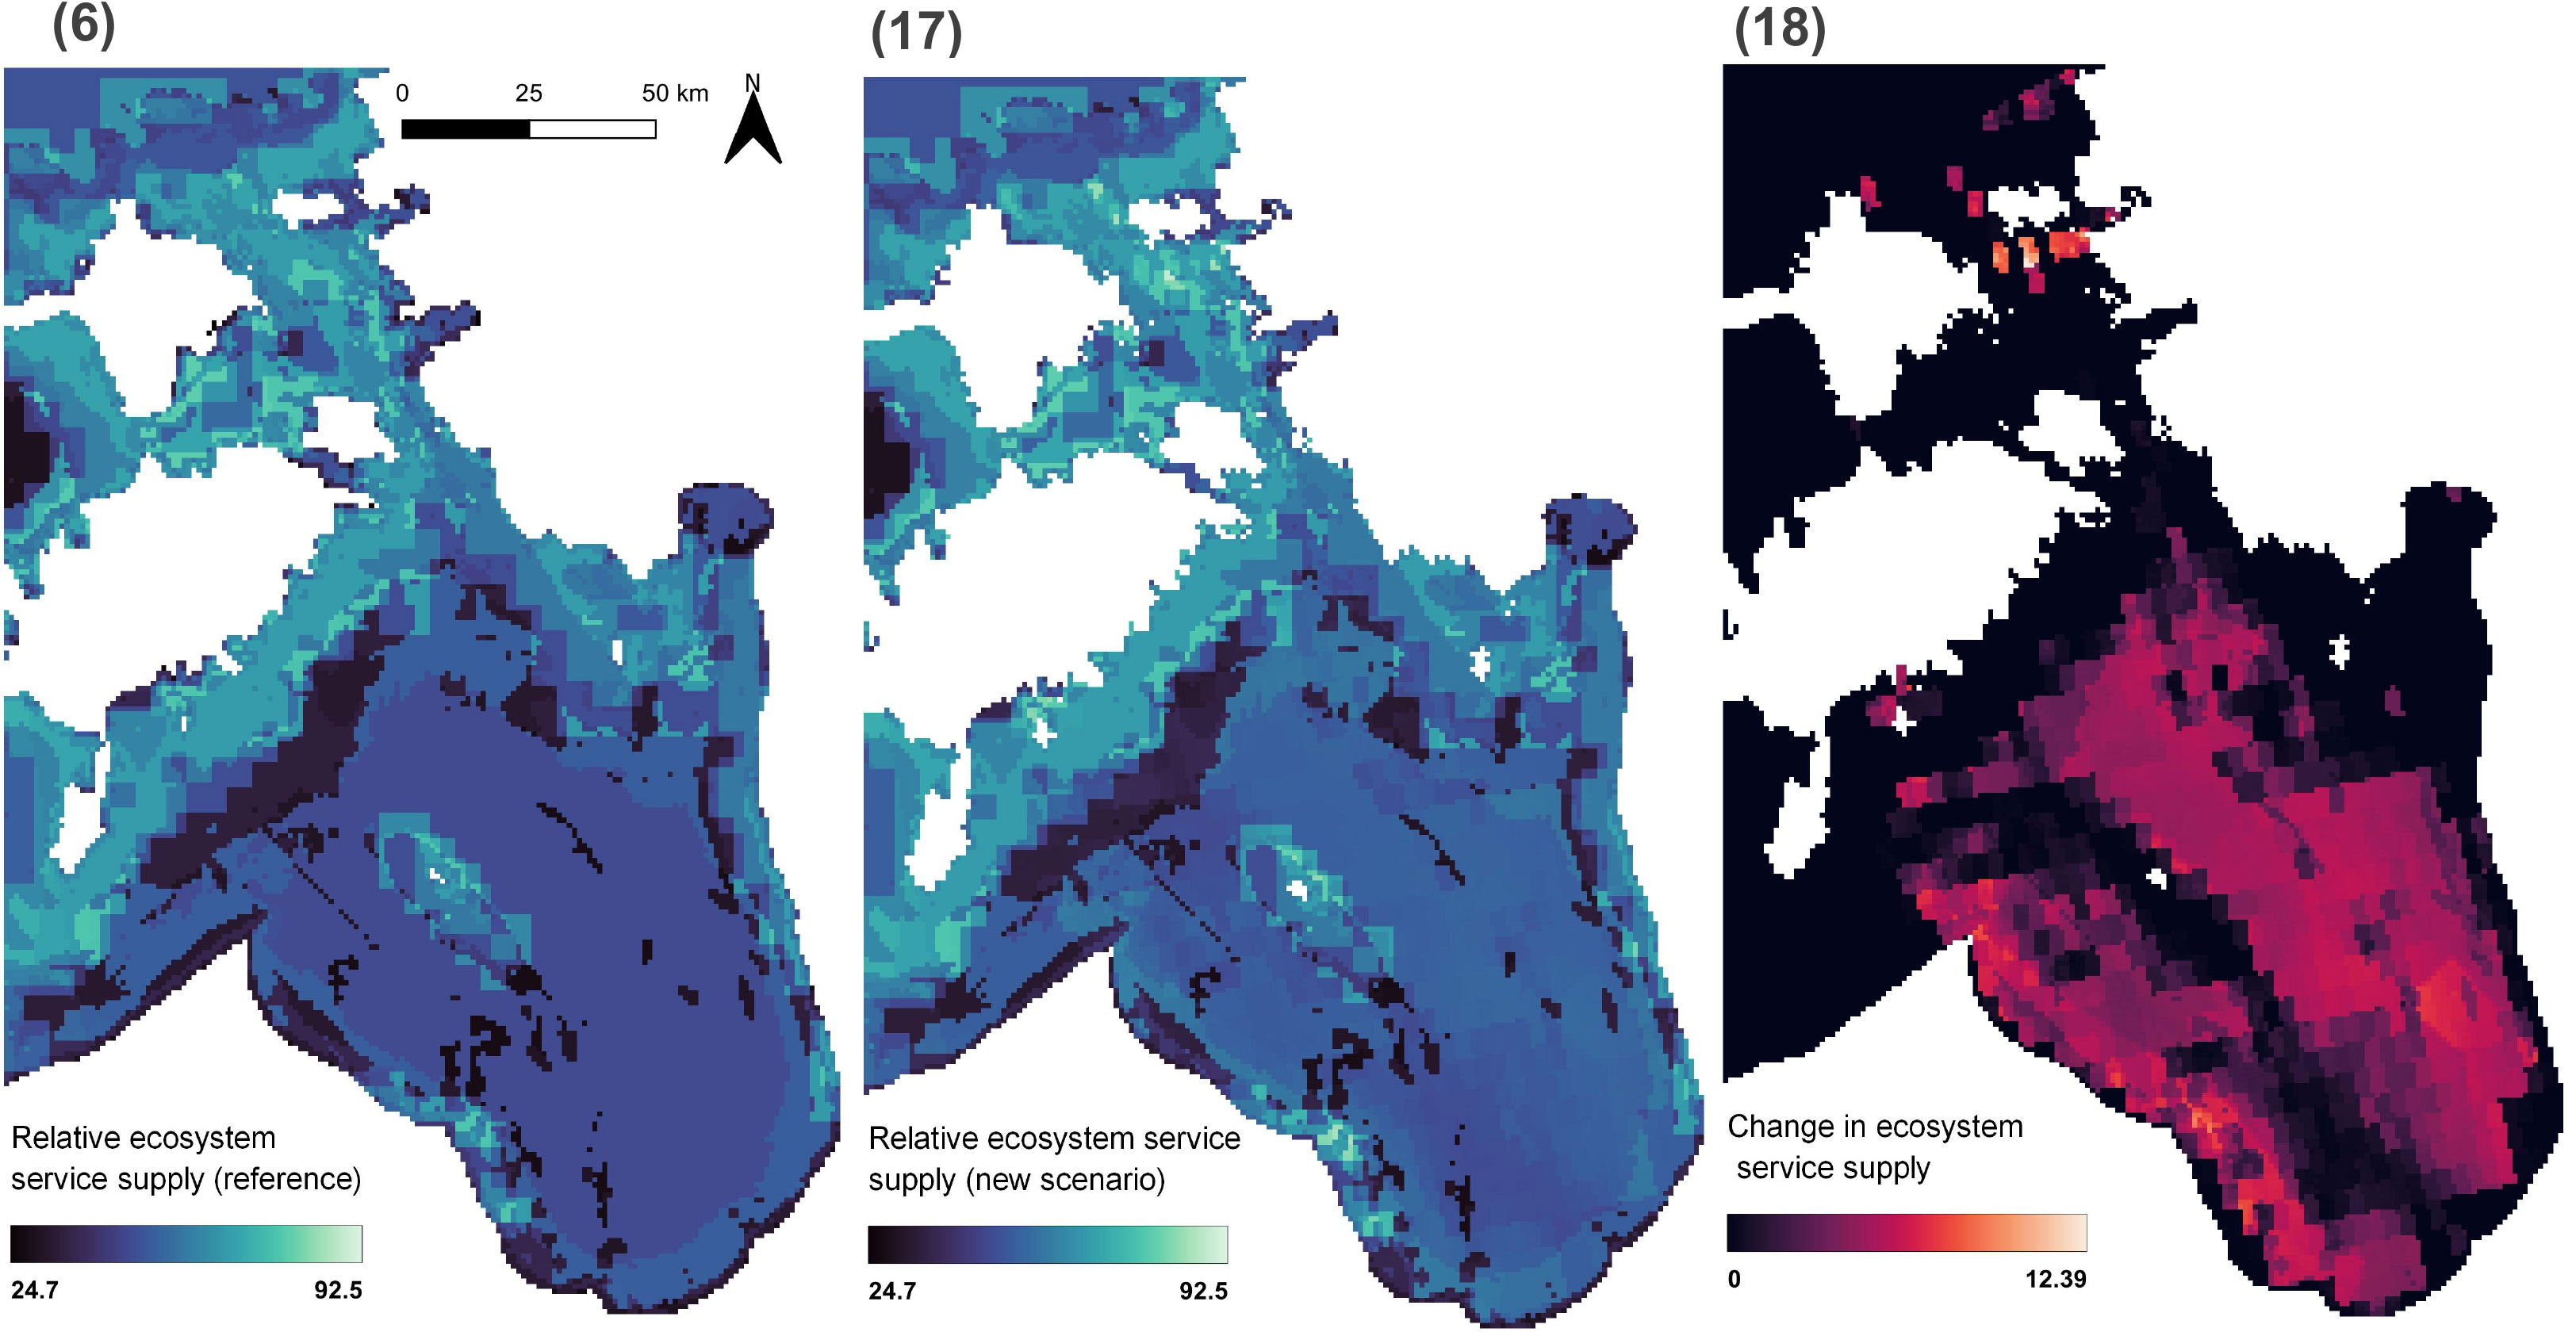
Figure 6 Maps displaying Gulf of Riga relative ecosystem service supply at reference state (6), service supply with herring fishing efforts reduced (17) worked out by applying relative change in the cumulative index scores and change in service supply (18). Numbers next to each map are a reference to outputs in Figure 2 and Tables 1 and 2.
3.1.3 Assessing change in relative ecosystem service supply
The total relative ecosystem service supply raster file (6; Figure 6) was then divided by the relative change impact index (10; Figure 5) to estimate relative ecosystem service supply with pressures applied (17; Figure 6) and the difference between reference and new scenario per-cell values expressed as change in service providing units (18). Change in ecosystem service supply suggests that reduced herring fishing in the Gulf of Riga by 50% may increase service supply in certain areas.
4 Discussion
4.1 Contributions to science and the future of maritime spatial planning
Spatial decision-support tools can provide indispensable support to planners, scientific experts, and other actors involved in the MSP process (Stelzenmüller et al., 2013; Depellegrin et al., 2021; Keenan and Jankowski, 2019). Once made operational, the multi-map toolset presented in this paper would provide the possibility to conduct geospatially explicit assessments of ecosystem service supply and cumulative impacts in a single environment. It would be a platform for visual analysis and exploration of the different outputs foreseen and presented in the conceptual framework. For instance, cumulative impact and ecosystem service supply maps for a specific area could be compared to identify locations under high/low levels of stress due to cumulative anthropogenic impacts as well as locations low/high service supply. This paper builds on the Hammar et al., 2020 approach applied to integrate cumulative impact assessments in Swedish MSP by taking the relative cumulative impact index change values and applying them in geospatial ecosystem service analysis. The toolset proposed in this paper shall enable the user to assess cumulative impacts on ecosystem service supply providing an insight into impacts on the ecosystem state (ecosystem components and functioning) as well as impacts on human wellbeing through changes in multiple service supply, thereby providing a more complete representation of the “supply” side of the social-ecological systems butterfly model.
The outputs of an ecosystem service supply assessment following Armoškaite et al. (2020), that is, quantification of service supply in relative terms, mapping and display of results in linkage web diagrams, have already informed an ecosystem services and benefit valuation study (see Pakalniete et al., 2021), evidently facilitating communication across disciplines and paving a way for a more harmonized link between service “supply” and “demand” analysis. This suggests that the outputs of the toolset will also facilitate cumulative impacts on ecosystems and change in service supply and lay the foundations for further benefits, and potentially beneficiaries and benefit distribution analysis (Frederiksen et al., 2021).
Whereas before change in relative ecosystem service supply has been assessed based on expert knowledge (Armoškaite et al., 2020) or geodata derived from field observations (Armoškaite et al., 2021), the approach for linking cumulative impact assessments results and service supply presented in this paper provides an alternative method – utilizing cumulative impact assessment results. This means that the toolset could cater for a wider range of contexts with respect to data availability as well as study objectives, including more explorative scenario analysis based on arbitrary estimates of ecosystem change and analysis rooted in evidence, and more thorough understanding of the interaction between drivers of change and ecosystems.
Studies of MSP-related decision-support tools have shown that very few tools support several functionalities and respond to the integrated, multi-objective nature of MSP tasks (Pinarbasi et al., 2017). The outcomes of the tool – the maps of relative changes in cumulative impacts and ecosystem service supply – could be used for further, MSP-related, analyses. In order to decide where to place or restrict certain human activities, the CIA-ES maps could be overlaid with other spatial or environmental requirements for the respective human activity. For the spatial and environmental requirements, tools such as SPACEA (von Thenen et al., 2020b) could be applied and the outcomes – also raster data files – combined or visually compared with the CIA-ES maps. This approach would highlight potential trade-offs between optimal locations for human activities and areas that are already highly impacted by other pressures or feature high ecosystem service supply. In the long-term, the functionalities of SPACEA could be integrated into the toolset to carry out the analyses in a one-tool environment.
4.2 Toolset application outside of maritime spatial planning
The toolset may also contribute to holistic assessments of the state of marine areas as it provides both an idea on the cumulative impacts on the ecosystem and the implications for human well-being through the linked ecosystem services. One example of a holistic assessment of a marine area is carried out by HELCOM in the Baltic Sea. These assessments already include cumulative impacts (HELCOM, 2018). The Baltic Sea Impact Index (BSII) developed by HELCOM for this purpose is based on Halpern et al. (2008), just like MYTILUS, and MYTILUS in fact uses the sensitivity matrix from HELCOM (see above). However, HELCOM’S BSII uses a sum impact approach, whereas MYTILUS and the proposed toolset additionally uses mean impact index as well as a maximum pressure index. A further development of functionalities should include synergistic as well as antagonistic impacts, something the current version of HELCOM’s BSII does not take into account (HELCOM, 2018). HELCOM is currently in the third round of the holistic assessment of the state of the Baltic Sea. For this third assessment, ecosystem services will also be assessed, including maps of ecosystem supply areas taking into account the distribution of ecosystem components and a marine ecosystem accounting approach (HELCOM, 2021). The underlying ES matrix from HELCOM, linking the ecosystem components to the specific ES, makes use of a binary scale (HELCOM, 2021). The proposed toolset here has a different approach (following Armoškaite et al., 2020) and uses expert elicitation to specify how much the ecosystem components contribute to specific ES. As the toolset additionally makes the link to the cumulative impact assessments, it is very well suited to support HELCOM’s assessments of the state of the Baltic Sea. It can also support assessments of other sea basins or areas, as the toolset’s functionalities are generic. The input data can be changed to fit other regional contexts. However, the sensitivity scores and the contribution of ecosystem components to ES would need to be adapted as they are tailored to the Baltic Sea at the moment.
In a participatory decision-making context, maps are known to increase levels of engagement among participants as well as a sense of common interests and shared spaces (Bonnevie et al., 2023; Koski et al., 2021). Therefore, on top of supporting analysis of the ways pressures and activities may be impacting ecosystems and in turn human wellbeing, the toolset also may be used to facilitate a dialogue among researchers, decision-makers, and stakeholders through multi-map comparison and scenario or trade-off analysis. A multi-map toolset may also be advantageous or of use among students and MSP researchers for capacity building in an active learning environment (Bonnevie et al., 2022).
4.3 Limitations of the proposed method for assessing cumulative impacts on service supply
One key challenge the test case highlights is that the method for assessing change in service supply proposed in this paper provides a linear, simplified representation of the interactions between the drivers of change, the ecosystem, and service supply. In the test case, the assessment results do not indicate service supply loss, which would be expected in the real world given that “fish for food – herring” is one of the services making up the total supply. On the one hand, this is a result of the simplification of causal relationships and links between elements of the system, which is a limitation that comes with linear representations and non-model-based methods of social-ecological systems analysis. On the other hand, this also highlights the significance of widespread challenges related to definitions and distinguishing the differences between “activities”, “pressures”, and “services” or “services” and “ecosystem functions”, and “services” and “benefits”, which need to be addressed among other reasons to reduce likelihood of double counting in monetary valuation of services and benefits (Hyytiäinen et al., 2014). To manage these challenges, it is important not to lose sight of initial pressure (whether anthropogenic or climate (that can be viewed as natural or anthropogenic) or natural (e.g., naturally occurring introduction of invasive species)) that has generated a cascade of events. Furthermore, it is important to approach classification of the different elements of the social-ecological system systematically, and with reference to standardized classification systems (e.g., CICES) and regulatory frameworks and strategies (e.g., the MSFD).
In the test case presented in this paper, the values describing ecosystem component contribution in service supply are aggregated to estimate change in total per-cell supply. Analysis of change in the supply of a specific service of interest is also possible but requires an additional step - identification of the ecosystem components maintaining that specific ecosystem service. This entails identification of the linkage chains connecting all ecosystem components and functions related to the services of interest, followed by mapping of the select component contribution values, and application of impact index values through geospatial analysis as described in section 3.1.3.
Social-ecological systems analysis, including ecosystem services assessments, is a selective, place-based, time-sensitive process. The focus of the test case, and the pressures and services assessed, are those that were identified through HELCOM and the expert elicitation processes of Armoškaite et al. (2020). The toolset presented in this paper will accommodate analysis of cumulative impacts and service supply of any location, leaving the scope of the assessment to be determined by the objectives of the assessment as well as data availability (i.e., geodata availability, quality, and availability and extent of expert knowledge).
It is important to emphasize that, while qualitative and semi-quantitative representations of social-ecological systems are a useful source of evidence to guide the decision-making process by highlighting problematic areas for further management (Piet et al., 2020), unknown feedback and regime shifts make scenario analysis uncertain and multiple sources of evidence should be considered (Hammar et al., 2020). Therefore, all outputs featured in the toolset and the results of the test case need to be interpreted with a level of caution and would need to be used in conjunction with other evidence-bases and should not support decision-making alone.
4.4 What does the future hold?
Once developed, the toolset functionalities will need to be tested in a real-world planning context and will require fine-tuning and further development. Studies of MSP processes and the supporting role of tools have found that “whether a tool can successfully contribute to improving the overall outcomes of the MSP process at least partially depends on how it is linked to the MSP process” (Gee et al., 2019). Therefore, when developing and testing this toolset, it is important to consider practical (i.e. application in MSP, tasks in MSP process, uncertainty and output communication, and stakeholder use), conceptual (including objectives, functionalities, developers, and users), and technical (such as the programming language, software, input data, and source code availability) aspects (Depellegrin et al., 2021) as well as co-develop the toolset with decision-makers, planners, experts, and scientists from social and natural sciences as well as stakeholders from various maritime sectors.
5 Conclusion
Adaptive and ecosystem-based management of human activities is needed to prevent further deterioration of ecosystems and the cascading effects on human-wellbeing. Maritime spatial planning is often seen as a promising instrument for managing human needs for space and resources as well as the need to protect and restore ecosystems. In this study, we explored how cumulative impacts assessment tools based on the Halpern et al. (2008) approach could be integrated with a relative ecosystem service supply assessment tool, forming a multi-map toolset to support impact analysis and an ecosystem-based MSP process. More specifically, we presented how relative change in cumulative impact index values could inform relative ecosystem service supply assessments thereby linking pressures to service supply and facilitating impact analysis. One of the key advantages of the toolset discussed and tested is that it supports visual, geospatial outputs, and service supply assessments in various data availability contexts. Cumulative impacts assessments may provide an overview of change in the ecosystem state, while relative change in ecosystem service supply may serve as an indication of potential impacts of human wellbeing. At the same time, the results of these assessments should not be the sole source of evidence informing decision-making due to uncertainties and complex, non-linear relationships between elements as well as feedback that are not considered in the assessments.
Data availability statement
The original contributions presented in the study are included in the article/Supplementary Materials. Further inquiries can be directed to the corresponding author. HSH plans to soon create a webpage to make the MYTILUS software available for download. Meanwhile, a copy of the MYTILUS software can be acquired by contacting Professor Henning Sten Hansen at Aalborg University Copenhagen: aHNoQHBsYW4uYWF1LmRr.
Author contributions
Conceptualization - AA, JA, IA, IB, HH, SS, MvT, and LS. Writing original draft – AA, JA, and MvT. Writing reviewing and editing - AA, JA, IA, IB, HH, SS, MvT, and LS. All authors contributed to the article and approved the submitted version.
Funding
The study has been supported and open access funding provided by the “Research of marine protected habitats in EEZ and determination of the necessary conservation status in Latvia” project (project number LIFE19 NAT/LV/000973 REEF), the “AquaINFRA” project funded by the European Commission’s Horizon Europe Research and Innovation program (grant agreement No 101094434), and the German Federal Ministry of Education and Research project” Coastal Futures” (grant No 03F0911B).
Conflict of interest
The authors declare that the research was conducted in the absence of any commercial or financial relationships that could be construed as a potential conflict of interest.
Publisher’s note
All claims expressed in this article are solely those of the authors and do not necessarily represent those of their affiliated organizations, or those of the publisher, the editors and the reviewers. Any product that may be evaluated in this article, or claim that may be made by its manufacturer, is not guaranteed or endorsed by the publisher.
Supplementary material
The Supplementary Material for this article can be found online at: https://www.frontiersin.org/articles/10.3389/fmars.2023.1213119/full#supplementary-material
References
Alcamo J., Ash N. J., Butler C. D., Callicott J. B., Capistrano D., Carpenter S. R., et al. (2003). Millennium Ecosystem Assessment. Ecosystems and Human Well-being: A Framework for Assessment. Available online: http://pdf.wri.org/ecosystems_human_wellbeing.pdf.
Armoškaite A., Aigars J., Hansen H. S., Andersone I., Schrøder L., Strāķe S. (2021). Assessing change in habitat composition, ecosystem functioning and service supply in Latvian protected stony reefs. J. Environ. Management. 298, 113537. doi: 10.1016/j.jenvman.2021.113537
Armoškaite A., Puriņa I., Aigars J., Strāķe S., Pakalniete K., Frederiksen P., et al. (2020). Establishing the links between marine ecosystem components, functions, and services: an ecosystem service assessment tool. Ocean Coast. Manage. 193, 105229. doi: 10.1016/j.ocecoaman.2020.105229
Atkins J. P., Burdon D., Elliot M., Gregory A. J. (2011). Management of the marine environment: integrating ecosystem services and societal benefits with the DPSIR framework in a systems approach. Mar. pollut. Bulletin. 62, 2015–2226. doi: 10.1016/j.marpolbul.2010.12.012
Baltic Sea Impact index assessment tool. Available at: https://maps.helcom.fi/website/bsii/.
Bednarek A. T., Wyborn C., Cvitanovic C., Meyer R., Colvin R. M., Addison P. F. E., et al. (2018). Boundary spanning at the science–policy interface: the practitioners’ perspectives. Sustainability Science. 13, 1175–1183. doi: 10.1007/s11625-018-0550-9
Binder C. R., Hinkel J., Bots P. W. G., Pahl-Wostl C. (2013). Comparison of frameworks for analyzing social-ecological systems. Ecol. Soc. 18, 4, 26. doi: 10.5751/ES-05551-180426
Bonnevie I., Hansen H. S., Schrøder L. (2021). Supporting integrative maritime spatial planning by operationalising SEANERGY – a tool to study cross-sectoral synergies and conflicts. Int. J. Digital Earth. 14, 678–695. doi: 10.1080/17538947.2020.1865467
Bonnevie I. M., Hansen H. S., Schrøder L., Armoškaitė A. (2022). Utilising MYTILUS for active learning to compare cumulative impacts on the marine environment in different planning scenarios. Sustainability. 14, 12606. doi: 10.3390/su141912606
Bonnevie I. M., Hansen H. S., Schrøder L., Rönneberg M., Kettunen P., Koski C., et al. (2023). Engaging stakeholders in marine spatial planning for collaborative scoring of conflicts and synergies within a spatial tool environment. Ocean Coast. Management. 233, 106449. doi: 10.1016/j.ocecoaman.2022.106449
Burgess N. D., Darrah S., Knight S., Danks F. S. (2016). Approaches to mapping ecosystem services. technical report (UNEP World Conservation Monitoring Centre (UNEP-WCMC). Available at: https://resources.unep-wcmc.org/products/WCMC_RT244
Campagne C. S., Langridge J., Claudet J., Mongruel R., Thiébaut E. (2021). What evidence exists on how changes in marine ecosystem structure and functioning affect ecosystem services delivery? A systematic map protocol. Environ. Evidence. 10, 36. doi: 10.1186/s13750-021-00251-x
Cormier R., Kelble C. R., Anderson M. R., J. Allen I., Grehan A., Gregersen O. (2017). Moving from ecosystem-based policy objectives to operational implementation of ecosystem-based management measures. ICES J. Mar. Sci. 74, 406–413. doi: 10.1093/icesjms/fsw181
Culhane F. E., Frid C. L.J., Gelabert E. R., White L., Robinson L. A. (2018). Linking marine ecosystems with the services they supply: What are the relevant service providing units? Ecological Applications. 28, 1740–1751. doi: 10.1002/eap.1779
Culhane F. E., Robinson L. A., Lillebø A. I. (2020). “Approaches for estimating the supply of ecosystem services: concepts for ecosystem-based management in coastal and marine environments,” in Ecosystem-based management, ecosystem services and aquatic biodiversity. Eds. O’Higgins T., Lago M., DeWitt T. (Cham: Springer), pp.105–pp.126. doi: 10.1007/978-3-030-45843-0_6
Davies A. C., Stroink M. L. (2015). The relationship between systems thinking and the new ecological paradigm. Systems Research and Behavioral Science 33, 575–586. doi: 10.1002/sres.2371
Delacámara G., O’Higgins T., Lago M., Langhans S. (2020). “Ecosystem-based management: moving from concept to practice,” in Ecosystem-based management, ecosystem services and aquatic biodiversity. Eds. O’Higgins T., Lago M., DeWitt T. (Cham: Springer), pp.39–pp.60. doi: 10.1007/978-3-030-45843-0_3
Depellegrin D., Hansen H. S., Schrøder L., Bergström L., Romagnoni G., Steenbeek J., et al. (2021). Current status, advancements and development needs of geospatial decision support tools for marine spatial planning in European seas. Ocean Coast. Management. 209, 105644. doi: 10.1016/j.ocecoaman.2021.105644
De Vos A., Biggs R., Preiser. R. (2019). Methods for understanding social-ecological systems: a review of place-based studies. Ecol. Soc. 24, 16. doi: 10.5751/ES-11236-240416
Directive 2008 /56/EC of the European parliament and of the council of 17 June 2008 establishing a framework for community action in the field of marine environmental policy (Marine strategy framework directive). Available at: http://data.europa.eu/eli/dir/2008/56/oj.
Douvere F., Ehler C. N. (2011). The importance of monitoring and evaluation in adaptive maritime spatial planning. J. Coast. Conserv. 15, 305–311. doi: 10.1007/s11852-010-0100-9
Duinker P. N., Greig L. A. (2007). Scenario analysis in environmental impact assessment: improving explorations of the future. Environ. Impact Assess. Rev. 27, 206–219. doi: 10.1016/j.eiar.2006.11.001
Ehler C. N. (2021). Two decades of progress in marine spatial planning. Mar. Policy. 132, 104134. doi: 10.1016/j.marpol.2020.104134
Ehler C., Zaucha J., Gee K. (2019). “Maritime/Marine spatial planning at the interface of research and practice,” in Maritime spatial planning past, present, future. Eds. Zaucha J., Gee K., pp.1–pp21. doi: 10.1007/978-3-319-98696-8_1
Elliott M., O’Higgins T. G. (2020). “From DPSIR the DAPSI(W)R(M) emerges… a butterfly – ‘protecting the natural stuff and delivering the human stuff,” in Ecosystem-based management, ecosystem services and aquatic biodiversity. Eds. O’Higgins T., Lago M., DeWitt T. (Cham: Springer), 61–86. doi: 10.1007/978-3-030-45843-0_4
European Commission (2021) A new approach for a sustainable blue economy in the EU transforming the EU's blue economy for a sustainable future. Available at: https://eur-lex.europa.eu/legal-content/EN/TXT/?uri=COM:2021:240:FIN.
European Commission (2022). Directorate-general for maritime affairs and fisheries, joint research centre. Eds. Addamo A., Calvo Santos A., Guillén J., Neehus S., Peralta Baptista. A., Quatrini S., et al (The EU blue economy report 2022, Publications Office of the European Union). Available at: https://data.europa.eu/doi/10.2771/793264.
Frazão Santos C., Domingos T., Ferreira M. A., Orbach M., Andrade F. (2014). How sustainable is sustainable marine spatial planning? part I–linking the concepts. Mar. Policy 49, 59–65. doi: 10.1016/j.marpol.2014.04.004
Frederiksen P., Morf P., von Thenen M., Armoškaite A., Luhtala H., Schiele K. S., et al. (2021). Proposing an ecosystem services-based framework to assess sustainability impacts of maritime spatial plans (MSP-SA). Ocean Coast. Manage. 208, 105577. doi: 10.1016/j.ocecoaman.2021.105577
Gee K., Blazauskas N., Dahl K., Göke C., Hassler B., Kannen A., et al. (2019). Can tools contribute to integration in MSP? a comparative review of selected tools and approaches. Ocean Coast. Manage. 179, 104834. doi: 10.1016/j.ocecoaman.2019.104834
Giacometti A., Morf A., Gee K., Kull M., Luhtala H., Eliasen S. Q., et al. (2020). “Handbook: process, methods and tools for stakeholder involvement in maritime spatial planning,” in BONUS BASMATI deliverable 2.3. Available at: https://nordregio.org/wp-content/uploads/2020/09/BONUS-BASMATI-handbook-digital.pdf.
Gissi E., Fraschetti S., Micheli F. (2019). Incorporating change in marine spatial planning: a review. Environ. Sci. Policy 92, 191–200. doi: 10.1016/j.envsci.2018.12.002
Gómez C. M., Delacámara G., Arévalo-Torres J., Barbière J., Barbosa A. L., Boteler B., et al. (2016). The AQUACROSS innovative concept. deliverable 3.1 (European Union’s Horizon 2020 Framework Programme for Research and Innovation grant agreement No. 642317). Available at: https://aquacross.eu/sites/default/files/D3.1%20Innovative%20Concept.pdf.
Halpern B. S., Walbridge S., Selkoe K. A., Kappel C. V., Micheli F., D'Agrosa C., et al. (2008). A global map of human impact on marine ecosystems. Science 319, 5865, 948–952. doi: 10.1126/science.1149345
Hammar L., Molander S., Pålsson J., Schmidtbauer Crona J., Carneiro G., Johansson T., et al. (2020). Cumulative impact assessment for ecosystem-based marine spatial planning. Sci. Total Environ. 734, 139024. doi: 10.1016/j.scitotenv.2020.139024
Hansen H. S. (2019). “Cumulative impact of societal activities on marine ecosystems and their services,” in Computational science and its applications – ICCSA 2019. ICCSA 2019. lecture notes in computer science (Cham: Springer) 11621, 521–534, . doi: 10.1007/978-3-030-24302-9_41
Hansen H. S., Bonnevie I. M. (2020). “A toolset to estimate the effects of human activities in maritime spatial planning,” in Computational science and its applications – ICCSA 2020. ICCSA 2020. lecture notes in computer science (Cham: Springer), 12252. doi: 10.1007/978-3-030-58811-3_38
HELCOM Metadata catalogue. Available at: https://metadata.helcom.fi/geonetwork/srv/eng/catalog.search#/home.
HELCOM (2013). HELCOM HUB – technical report on the HELCOM underwater biotope and habitat classification. Balt. Sea Environ. Proc. 139, 16–33. Available at: https://helcom.fi/wp-content/uploads/2019/08/BSEP139.pdf
HELCOM (2018) Thematic assessment of cumulative impacts on the Baltic Sea 2011-2016. Available at: http://www.helcom.fi/baltic-sea-trends/holistic-assessments/state-of-the-baltic-sea-2018/reports-and-materials/.
HELCOM (2020). Indicator manual. version 1. Baltic Sea environment proceedings n°175 (HELCOM). Available at: https://helcom.fi/wp-content/uploads/2021/01/BSEP175.pdf.
HELCOM (2021). Assessment for ecosystem service approach in HOLAS III Vol. 15-2021 (STATE & CONSERVATION), 3J–77. Available at: https://portal.helcom.fi/meetings/STATE%20-%20CONSERVATION%2015-2021-843/MeetingDocuments/3J-77%20Assessment%20for%20Ecosystem%20Service%20Approach%20in%20HOLAS%20III.pdf.
HELCOM (2023) Cumulative impacts on the marine environment. Available at: http://stateofthebalticsea.helcom.fi/cumulative-impacts/.
Hopkins T. S., Bailly D., Støttrup. J. G. (2011). A systems approach framework for coastal zones. Ecol. Soc. 16, 25. doi: 10.5751/ES-04553-160425
Hyytiäinen K., Blyh K., Hasler B., Ahlvik L., Ahtiainen H., Artell J., et al. (2014). Environmental economic research as a tool in the protection of the Baltic Sea – costs and benefits of reducing eutrophication (Nordic Council of Ministers). Available at: http://norden.diva-portal.org/smash/get/diva2:707748/FULLTEXT01.pdf.
Intergovernmental Science-Policy Platform on Biodiversity and Ecosystem Services (IPBES) (2022). Methodological assessment report on the diverse values and valuation of nature of the intergovernmental science-policy platform on biodiversity and ecosystem services. Eds. Balvanera P., Pascual U., Christie M., Baptiste B., González-Jiménez D. (Bonn, Germany: IPBES secretariat). 10.5281/zenodo.6522522.
Keenan P. B., Jankowski P. (2019). Spatial decision support systems: three decades on. Decision Support Syst. 116, 64–76. doi: 10.1016/j.dss.2018.10.010
Kid S., Shaw D. (2014). The social and political realities of marine spatial planning: some land-based reflections. ICES J. Mar. Sci. 71, 1535–1541. doi: 10.1093/icesjms/fsu006
Kirkfeldt T. S., Frazão Santos C. (2021). A review of sustainability concepts in marine spatial planning and the potential to supporting the UN sustainable development goal 14. Front. Mar. Sci. 8. doi: 10.3389/fmars.2021.713980
Koski C., Rönneberg M., Kettunen P., Armoškaitė A., Strake S., Oksanen J. (2021). User experiences of using a spatial analysis tool in collaborative GIS for maritime spatial planning. Trans. GIS. 24, 1809–1824. doi: 10.1111/tgis.12827
McGowan L., Jay S., Kidd S. (2019). “Scenario-building for marine spatial planning,” in Maritime spatial planning. Eds. Zaucha J., Gee K. (Cham: Palgrave Macmillan), 327–351. doi: 10.1007/978-3-319-98696-8_14
Menegon S., Depellegrin D., Farella G., Sarretta A., Venier C., Barbanti A. (2018). Addressing cumulative effects, maritime conflicts and ecosystem services threats through MSP-oriented geospatial webtools. Ocean Coast. Manage. 163, 417–436. doi: 10.1016/j.ocecoaman.2018.07.009
Ostrom E. (2009). A general framework for analyzing sustainability of social-ecological systems. Science 325, 419–422. doi: 10.1126/science.1172133
Pakalniete K., Ahtiainen H., Aigars J., Andersone I., Armoškaite A., Hansen H. S., et al. (2021). Economic valuation of ecosystem service benefits and welfare impacts of offshore marine protected areas: a study from the Baltic Sea. Sustainability 13, 10121. doi: 10.3390/su131810121
Patrício J., Elliott M., Mazik K., Papadopoulou K. N., Smith C. J. (2016). DPSIR–two decades of trying to develop a unifying framework for marine environmental management? Front. Mar. Sci. 3. doi: 10.3389/fmars.2016.00177
Piet G., Delacámara G., Kraan M., Röckmann C., Lago M. (2020). “Advancing aquatic ecosystem-based management with full consideration of the social-ecological system,” in Ecosystem-based management, ecosystem services and aquatic biodiversity. theory, tools, and applications. Eds. O’Higgins T., Lago M., DeWitt T. (Springer), pp.18–pp.38. doi: 10.1007/978-3-030-45843-0_2.
Pinarbasi K., Galparsoro I., Borja A., Stelzenmüller V., Ehler C. H., Gimpel A. (2017). Decision support tools in marine spatial planning: present applications, gaps and future perspectives. Mar. Policy 83, 83–91. doi: 10.1016/j.marpol.2017.05.031
Potchin-Young M., Haines-Young R., Görg C., Heink U., Jax K., Schleyer C. (2018). Understanding the role of conceptual frameworks: reading the ecosystem service cascade. Ecosystem Serv. 29, 428–440. doi: 10.1016/j.ecoser.2017.05.015
Quinio L., Ripken, Klenke T., Trouillet B., Hansen H. S., Schrøder L. (2023). Exploring ecosystem-based approaches in MSP through actor-driven perceptual mapping. Mar. Policy 152, 105604. doi: 10.1016/j.marpol.2023.105604
Reckermann M., Omstedt A., Soomere T., Aigars J., Akhtar N., Bełdowska M., et al. (2022). Human impacts and their interactions in the Baltic Sea region, earth syst. Dynam 13, 1–80. doi: 10.5194/esd-13-1-2022
Robinson L. A., Culhane F. E. (2020). “Linkage frameworks: an exploration tool for complex systems in ecosystem-based management,” in Ecosystem-based management, ecosystem services and aquatic biodiversity. theory, tools, and applications. Eds. O’Higgins T., Lago M., DeWitt T. (Springer), 213–233. doi: 10.1007/978-3-030-45843-0_11
Schlüter M., McAllister R. R. J., Arlinghaus R., Bunnefeld N., Eisenack K., Hoülker F., et al. (2012). New horizons for managing the environment: a review of coupled social-ecological systems modeling. Natural Resource Modeling 25, 219–272. doi: 10.1111/j.1939-7445.2011.00108.x
Schlüter M., Müller B., Frank. K. (2019). The potential of models and modeling for social-ecological systems research: the reference frame ModSES. Ecol. Soc. 24, 1, 31. doi: 10.5751/ES-10716-240131
Sharpe L. M., Hernandez C. L., Jackson C. A. (2020). “Prioritizing stakeholders, beneficiaries, and environmental attributes: a tool for ecosystem-based management,” in Ecosystem-based management, ecosystem services and aquatic biodiversity. theory, tools, and applications. Eds. O’Higgins T., Lago M., DeWitt T. (Springer), 189–211. Available at: https://link.springer.com/chapter/10.1007/978-3-030-45843-0_10.
Singh G. G., Eddy I. M. S., Halpern B. S., Neslo R., Satterfield T., Chan K. M. A. (2020). Mapping cumulative impacts to coastal ecosystem services in British Columbia. PloS One 15, e0220092. doi: 10.1371/journal.pone.0220092
Stelzenmüller V., Lee J., South A., Foden J., Rogers S. I. (2013). Practical tools to support marine spatial planning: a review and some prototype tools. Mar. Policy. 38, 214–227. doi: 10.1016/j.marpol.2012.05.038
UNESCO-IOC/European Commission (2021). MSPglobal international guide on Marine/Maritime spatial planning (Paris: UNESCO). Available at: https://unesdoc.unesco.org/ark:/48223/pf0000379196.
von Thenen M., Frederiksen P., Hansen H. S., Schiele K. S. (2020a). A structured indicator pool to operationalize expert-based ecosystem service assessments for marine spatial planning. Mar. Policy. 187, 105071. doi: 10.1016/j.ocecoaman.2019.105071
von Thenen M., Hansen H. S., Schiele K. S. (2020b). “SPACEA: a custom-made GIS toolbox for basic marine spatial planning analyses,” in Computational science and its applications – ICCSA 2020. ICCSA 2020. lecture notes in computer science, vol. 12252. (Cham: Springer), 394–404. doi: 10.1007/978-3-030-58811-3_28
Keywords: integrated marine ecosystem service assessments, cumulative impact assessments, maritime spatial planning, marine ecosystem service supply, spatial decision-support tools
Citation: Armoškaitė A, Aigars J, Andersone I, Bonnevie IM, Hansen HS, Strāķe S, Thenen M and Schrøder L (2023) Setting the scene for a multi-map toolset supporting maritime spatial planning by mapping relative cumulative impacts on ecosystem service supply. Front. Mar. Sci. 10:1213119. doi: 10.3389/fmars.2023.1213119
Received: 27 April 2023; Accepted: 06 June 2023;
Published: 27 June 2023.
Edited by:
Elena Gissi, National Research Council (CNR), ItalyReviewed by:
Roland Cormier, Fisheries and Oceans Canada (DFO), CanadaEduardo Gomes, Universidade de Lisboa, Portugal
Copyright © 2023 Armoškaitė, Aigars, Andersone, Bonnevie, Hansen, Strāķe, Thenen and Schrøder. This is an open-access article distributed under the terms of the Creative Commons Attribution License (CC BY). The use, distribution or reproduction in other forums is permitted, provided the original author(s) and the copyright owner(s) are credited and that the original publication in this journal is cited, in accordance with accepted academic practice. No use, distribution or reproduction is permitted which does not comply with these terms.
*Correspondence: Aurelija Armoškaitė, YXVyZWxpamEuQXJtb3NrYWl0ZUBsaGVpLmx2