Abstract
The management and conservation of biodiversity relies on information on both the abundance of species and the potential impact of threats. Globally, one of the largest threats towards marine biodiversity is bycatch in fisheries. Under the Marine Strategy Framework Directive (MSFD), EU Member States are required to assess the status of species, such as the harbour porpoise (Phocoena phocoena), in relation to their abundance and mortality due to bycatch every six years. The Vulnerable (HELCOM) Belt Sea population of harbour porpoise has been surveyed to determine its abundance six times using dedicated aerial or ship-based line-transect distance sampling surveys. Here, we estimated the first trend in population abundance over an 18 year period (2005-2022). Using the most recent abundance estimate, we computed a mortality limit applying the modified Potential Biological Removal (mPBR) method based on the regionally agreed conservation objective to restore or maintain 80% of carrying capacity over 100 years with an 80% probability. Over the past 18 years there has been a strong negative trend (-2.7% p.a.; 95% CI: -4.1%; + 1.3%) in abundance, with a 90.5% probability. The mortality limit was estimated to be 24 animals, which the current bycatch estimates (~900 porpoises/year from the commercial Danish and Swedish set net fishery fleets, with no data from Germany and other fishery types) exceed by far. The frequency and quality of data available on abundance for this population are higher than those available for the majority of marine species. Given the observed population decline and likely unsustainable levels of bycatch, the results presented here provide a strong basis to make informed, evidence-based management decisions for action for this population. Such action is needed urgently, before the dire situation of other porpoise species and populations around the globe is repeated.
1 Introduction
Successful management relies heavily on unbiased data on population dynamics and on the potential impact of threats to the population (Nelms et al., 2021). The ability of a population to sustain itself in the long-term is highly dependent on the rate at which the population grows through reproduction and immigration in relation to the rate at which individuals are lost from the population (Conde et al., 2019). This loss can derive from either natural or anthropogenic factors, with bycatch in fisheries being one of the main threats for many species and populations of small cetaceans (Brownell et al., 2019). This threat is often the main factor limiting the recovery of depleted species and populations of marine mammals (Gales et al., 2003; Kovacs et al., 2012; Reeves et al., 2013; Brownell et al., 2019).
The harbour porpoise (Phocoena phocoena) is a small cetacean species impacted by set net fisheries, as it is regularly bycaught (Vinther and Larsen, 2004; Read et al., 2006; Siebert et al., 2020). There are three populations of harbour porpoises in the Baltic/North Sea region; 1) the North Sea population, distributed from the northern Kattegat, through Skagerrak to the entire North Sea; 2) the Belt Sea population in the western Baltic Sea, the Belt seas, the Sound and the southern Kattegat; and 3) the Baltic Proper population in the inner Baltic Sea (see Carlén et al. (2021) for a distribution map of all three populations). The three populations are not only morphologically and genetically distinct (Wiemann et al., 2010; Galatius et al., 2012; Lah et al., 2016; Celemín et al., 2023), but also have limited overlap in distribution during the summer breeding season (Sveegaard et al., 2011, 2015; Carlén et al., 2018). As a species, the IUCN has classified the harbour porpoise as Least Concern both in the European region (Sharpe and Berggren, 2023) and globally (Braulik et al., 2023). The harbour porpoise is listed on OSPAR’s “List of Threatened and/or Declining Species and Habitats” (OSPAR, 2008, OSPAR Agreement 2008-06) including within the distributional range of the North Sea population. However, the Belt Sea population is listed as Vulnerable (HELCOM, 2013) and the Baltic Proper population as Critically Endangered (HELCOM, 2013; Carlström et al., 2023).
With respect to marine conservation, all Member States of the European Union (EU) are required to monitor harbour porpoises as well as the level of bycatch under the EU Habitats Directive (HD) (92/43/EEC, Habitats Directive, 1992) and EU regulation 1241/2019, and report on whether populations are in good environmental status under the Marine Strategy Framework Directive (MSFD) (2008/56/EC, Marine Strategy Framework Directive, 2008). Additionally, an estimate of absolute abundance, trends in abundance, and a threshold for sustainable additional mortality are needed as indicators for the population to contribute to the Holistic Assessment of the Baltic Sea (HOLAS) completed by the Helsinki Commission (HELCOM) at regular intervals. Therefore, it is essential to have up-to-date information and data collected to the highest standards for successful conservation and management.
The abundance of cetaceans, including harbour porpoises, is typically estimated from line-transect distance sampling surveys conducted from ships or aircraft (Hammond et al., 2021a). The first dedicated survey covering most of the currently defined management area of the Belt Sea population, but also covering a larger area, was the 1994 SCANS (Small Cetacean Abundance in European Atlantic waters and the North Sea) survey (Hammond et al., 2002; Hammond et al., 2021b). The whole management area of the Belt Sea population was covered in subsequent surveys, including SCANS-II in 2005 (Hammond et al., 2013), MiniSCANS in 2012 (Viquerat et al., 2014), SCANS-III in 2016 (Hammond et al., 2021b) and MiniSCANS-II in 2020 (Unger et al., 2021). Additionally, the SCANS-IV survey was recently conducted in 2022 (Gilles et al., 2023). However, it is currently unknown whether the population is stable, growing or declining over time, as these surveys covered slightly different areas making a simple comparison and trend analysis of the abundance estimates difficult. Furthermore, a trend analysis should not only consider the point estimates but also the associated uncertainty, which provides valuable information on the precision of each estimate (Taylor et al., 2007; Authier et al., 2020).
The Potential Biological Removal (PBR) control rule was developed within a management strategy framework: the amended Marine Mammal Protection Act (MMPA) in the USA. A set of legally-binding guidelines were made to compute a limit reference point for anthropogenic removals from marine mammal stocks (or management units). PBR does not require information on bycatch level or other human-caused mortality, instead it relies on an absolute abundance estimate (and precision) to determine a removal threshold (aka reference point) above which removals would prevent a population/management unit from reaching a defined conservation objective (Wade, 1998; Wade et al., 2021). In the case of the MMPA, meeting the conservation objective is defined on two criteria; 1) that a population at the maximum net productivity level [MNPL, greater than or equal to 50% of carrying capacity (K)] is able to remain there for 20 years (short-term goal), and 2) that a population that is depleted at 30% of K is able, despite non-nil removals, to reach and remain above MNPL within 100 years with a probability of 0.95 (long-term goal; see ‘conservation goals’ in Wade, 1998, page 8). The PBR control is enshrined in the U.S. MMPA but has been applied to a range of cetacean species around the world (Slooten et al., 2006; Stenson et al., 2012; Parra et al., 2021) thereby accepting, either implicitly or explicitly, the U.S. MMPA conservation objective.
In the Baltic Region, ASCOBANS (Agreement on the Conservation of Small Cetaceans of the Baltic, North East Atlantic, Irish and North Seas) has set a conservation objective, adopted by all Parties (including Denmark, Germany and Sweden where the Belt Sea population is distributed), that ‘‘populations should be kept at or restored to 80% of their carrying capacity’’ (ASCOBANS, 1997); although a time frame and level of certainty have yet to be specified by ASCOBANS. Estimates of mortality limits have previously been calculated for harbour porpoises in the Baltic region based on this conservation objective (Berggren et al., 2002). However, these calculations were based on previously understood population structures in the region that do not match the currently defined population management areas. Until now, an interim limit on bycatch has previously been set as 1% of population size for the Belt Sea within HELCOM and OSPAR (Oslo-Paris Commission), which does not take population dynamics or demographic differences between species and populations into account (Hammond et al., 2019). Additionally, when assessing mortality limits to determine the best management strategy it is essential to factor in potential sources of bias (Wade, 1998; Punt and Donovan, 2007; Moore et al., 2021). Recent work from OSPAR Marine Mammal Expert Group (OMMEG) tuned the PBR method to a fully quantitative interpretation of the ASCOBANS conservation objective (Genu et al., 2021), defining a time frame of 100 years and a probability of 80%. These values were then adopted for use within OSPAR and HELCOM as a part of their recent assessment processes (QSR 2023 and HOLAS 3), and are also within the range of values of probability and timeframes recommended to be used in initial work completed by ASCOBANS as a part of the process of updating their conservation objective (ASCOBANS, 2023). This quantification of the conservation objective also allowed this modified PBR (mPBR) to then be applied to the Belt Sea population of harbour porpoises.
The aims of this study were to assess the trend in abundance over time for the Belt Sea population of harbour porpoises from a series of dedicated line-transect distance sampling surveys over 18 years. We also calculated an mPBR threshold for the population and compared it to published data on bycatch rates for the same area.
2 Materials and methods
2.1 Survey design, data collection and analysis
The SCANS and MiniSCANS surveys have generated a time series of data to investigate changes in harbour porpoise abundance in European Atlantic shelf waters at spatial and temporal scales that are ecologically appropriate for a highly mobile species. Novel high standards for data collection and analysis were developed (Hammond et al., 2021a). These abundance estimates are unbiased and allow for the assessment of bycatch (and other anthropogenic pressures) in a population context.
All surveys were designed to meet the assumptions described in Buckland et al. (2001) for line-transect distance sampling. The survey design engine in software DISTANCE (Thomas et al., 2010) and, for the most recent surveys, the R package ‘dssd’ (Marshall, 2020) were used to design transects that provide equal coverage probability, therefore allowing for unbiased abundance estimation by extrapolating estimated sample density to the entire stratum (Hammond et al., 2021a). Table 1 compares the metadata of the surveys that covered the management area of the Belt Sea population.
Table 1
| Year | 1994 | 2005 | 2012 | 2016 | 2020 | 2022 |
|---|---|---|---|---|---|---|
| Survey dates | 27 June - 09 July 1994 | 27 June - 16 July 2005 | 2 - 21 July 2012 | 5 - 24 July 2016 | 24 June - 10 July 2020 | 28 June - 31 July 2022 |
| Survey | SCANS | SCANS-II | MiniSCANS | SCANS-III | MiniSCANS-II | SCANS-IV |
| Block (labels) | I + X | S | 2 | MS A-I | BS A-F | |
| Area | SK/BS | SK/BS | BS | BS | BS | BS |
| Area (km2) | 55,295 | 68,372 | 51,511 | 40,707 | 42,244 | 42,264 |
| Platform | ship + aerial | ship | ship | ship | aerial | aerial |
| Effort (km)* | 2,292 | 1,279 | 826 | 1,028 | 4,533 | 4,279 |
| Abundance | 51,660 | 27,901 | 40,475 | 42,324 | 17,301 | 14,403 |
| CV | 0.30 | 0.39 | 0.24 | 0.30 | 0.20 | 0.21 |
| CI low (abundance) | 29,058 | 13,387 | 25,614 | 23,368 | 11,695 | 9,555 |
| CI high (abundance) | 91,841 | 58,149 | 65,041 | 76,658 | 25,688 | 21,769 |
| Density | 0.93 | 0.41 | 0.79 | 1.04 | 0.41 | 0.34 |
| CI low (density) | 0.53 | 0.20 | 0.50 | 0.57 | 0.28 | 0.23 |
| CI high (density) | 1.66 | 0.85 | 1.24 | 1.88 | 0.61 | 0.52 |
| Reference | Hammond et al. (2021b), revised from Hammond et al. (2002) | Hammond et al. (2021b), revised from Hammond et al. (2013) | Viquerat et al. (2014) | Hammond et al. (2021b) | Unger et al. (2021) | Gilles et al. (2023) |
Metadata of all SCANS and MiniSCANS surveys in the Belt Sea population region.
Summary of harbour porpoise abundance and density (ind./km2) estimates from SCANS and MiniSCANS surveys. Surveys were either conducted solely on the distribution range of the population (i.e., western Baltic Sea, Belt Sea, The Sound and Kattegat) (BS) or covered a larger area, including the Skagerrak, to different extents (SK). *For ship surveys, effort refers to km in sea conditions Beaufort ≤2, and for aerial surveys, under good or moderate conditions.
Detectability differences between survey platforms, teams and environmental conditions were taken into account, and all data were corrected for perception and availability biases, by considering platform differences between surveys and diving behaviour of the species.
In the ship-based surveys, a double-platform line-transect survey technique, involving two separate observer teams on each ship, was applied (Hammond et al., 2002, 2013; Viquerat et al., 2014; Hammond et al., 2021b). This method aimed to collect data enabling the adjustment of abundance estimates for animals not initially detected on the transect line. Additionally, it sought to account for potential effects resulting from the animals’ movement in response to the ship (Laake and Borchers, 2004).
In the aerial surveys, the racetrack or circle-back method, first implemented in SCANS-II (Hammond et al., 2013), corrects for both availability and perception bias and therefore estimates the fraction missed on the transect line (Hiby and Lovell, 1998; Hiby, 1999). In this approach, initiated by the sighting of an individual animal or a group, the aircraft circles back to re-survey the same segment of the transect line, thereby yielding data equivalent to that obtained by a double observer team (Scheidat et al., 2008; Hammond et al., 2021b; Gilles et al., 2023).
The MiniSCANS-II survey in 2020 (Unger et al., 2021) was the first survey designed to fully cover the agreed management area of the Belt Sea population (i.e. the waters between an east-west line between Denmark and Sweden at 56.95°N in the Kattegat Sea, and a north-south line between Sweden and Germany at 13.5°E in the southern Baltic Sea, Sveegaard et al., 2015) (Figure 1; Supplementary Table 1 and Supplementary Figure 1). MiniSCANS-II also yielded the highest effort to date, and since the precision of abundance estimates depends to a certain extent on the realized effort, the abundance estimates were associated with a low CV (Table 1; Supplementary Table 2). We provide details on the design and results of this aerial survey in the Supplementary Material. For more details on survey method and abundance estimation we refer to Scheidat et al. (2008); Gilles et al. (2009); Hammond et al. (2013) and Hammond et al. (2021b).
Figure 1
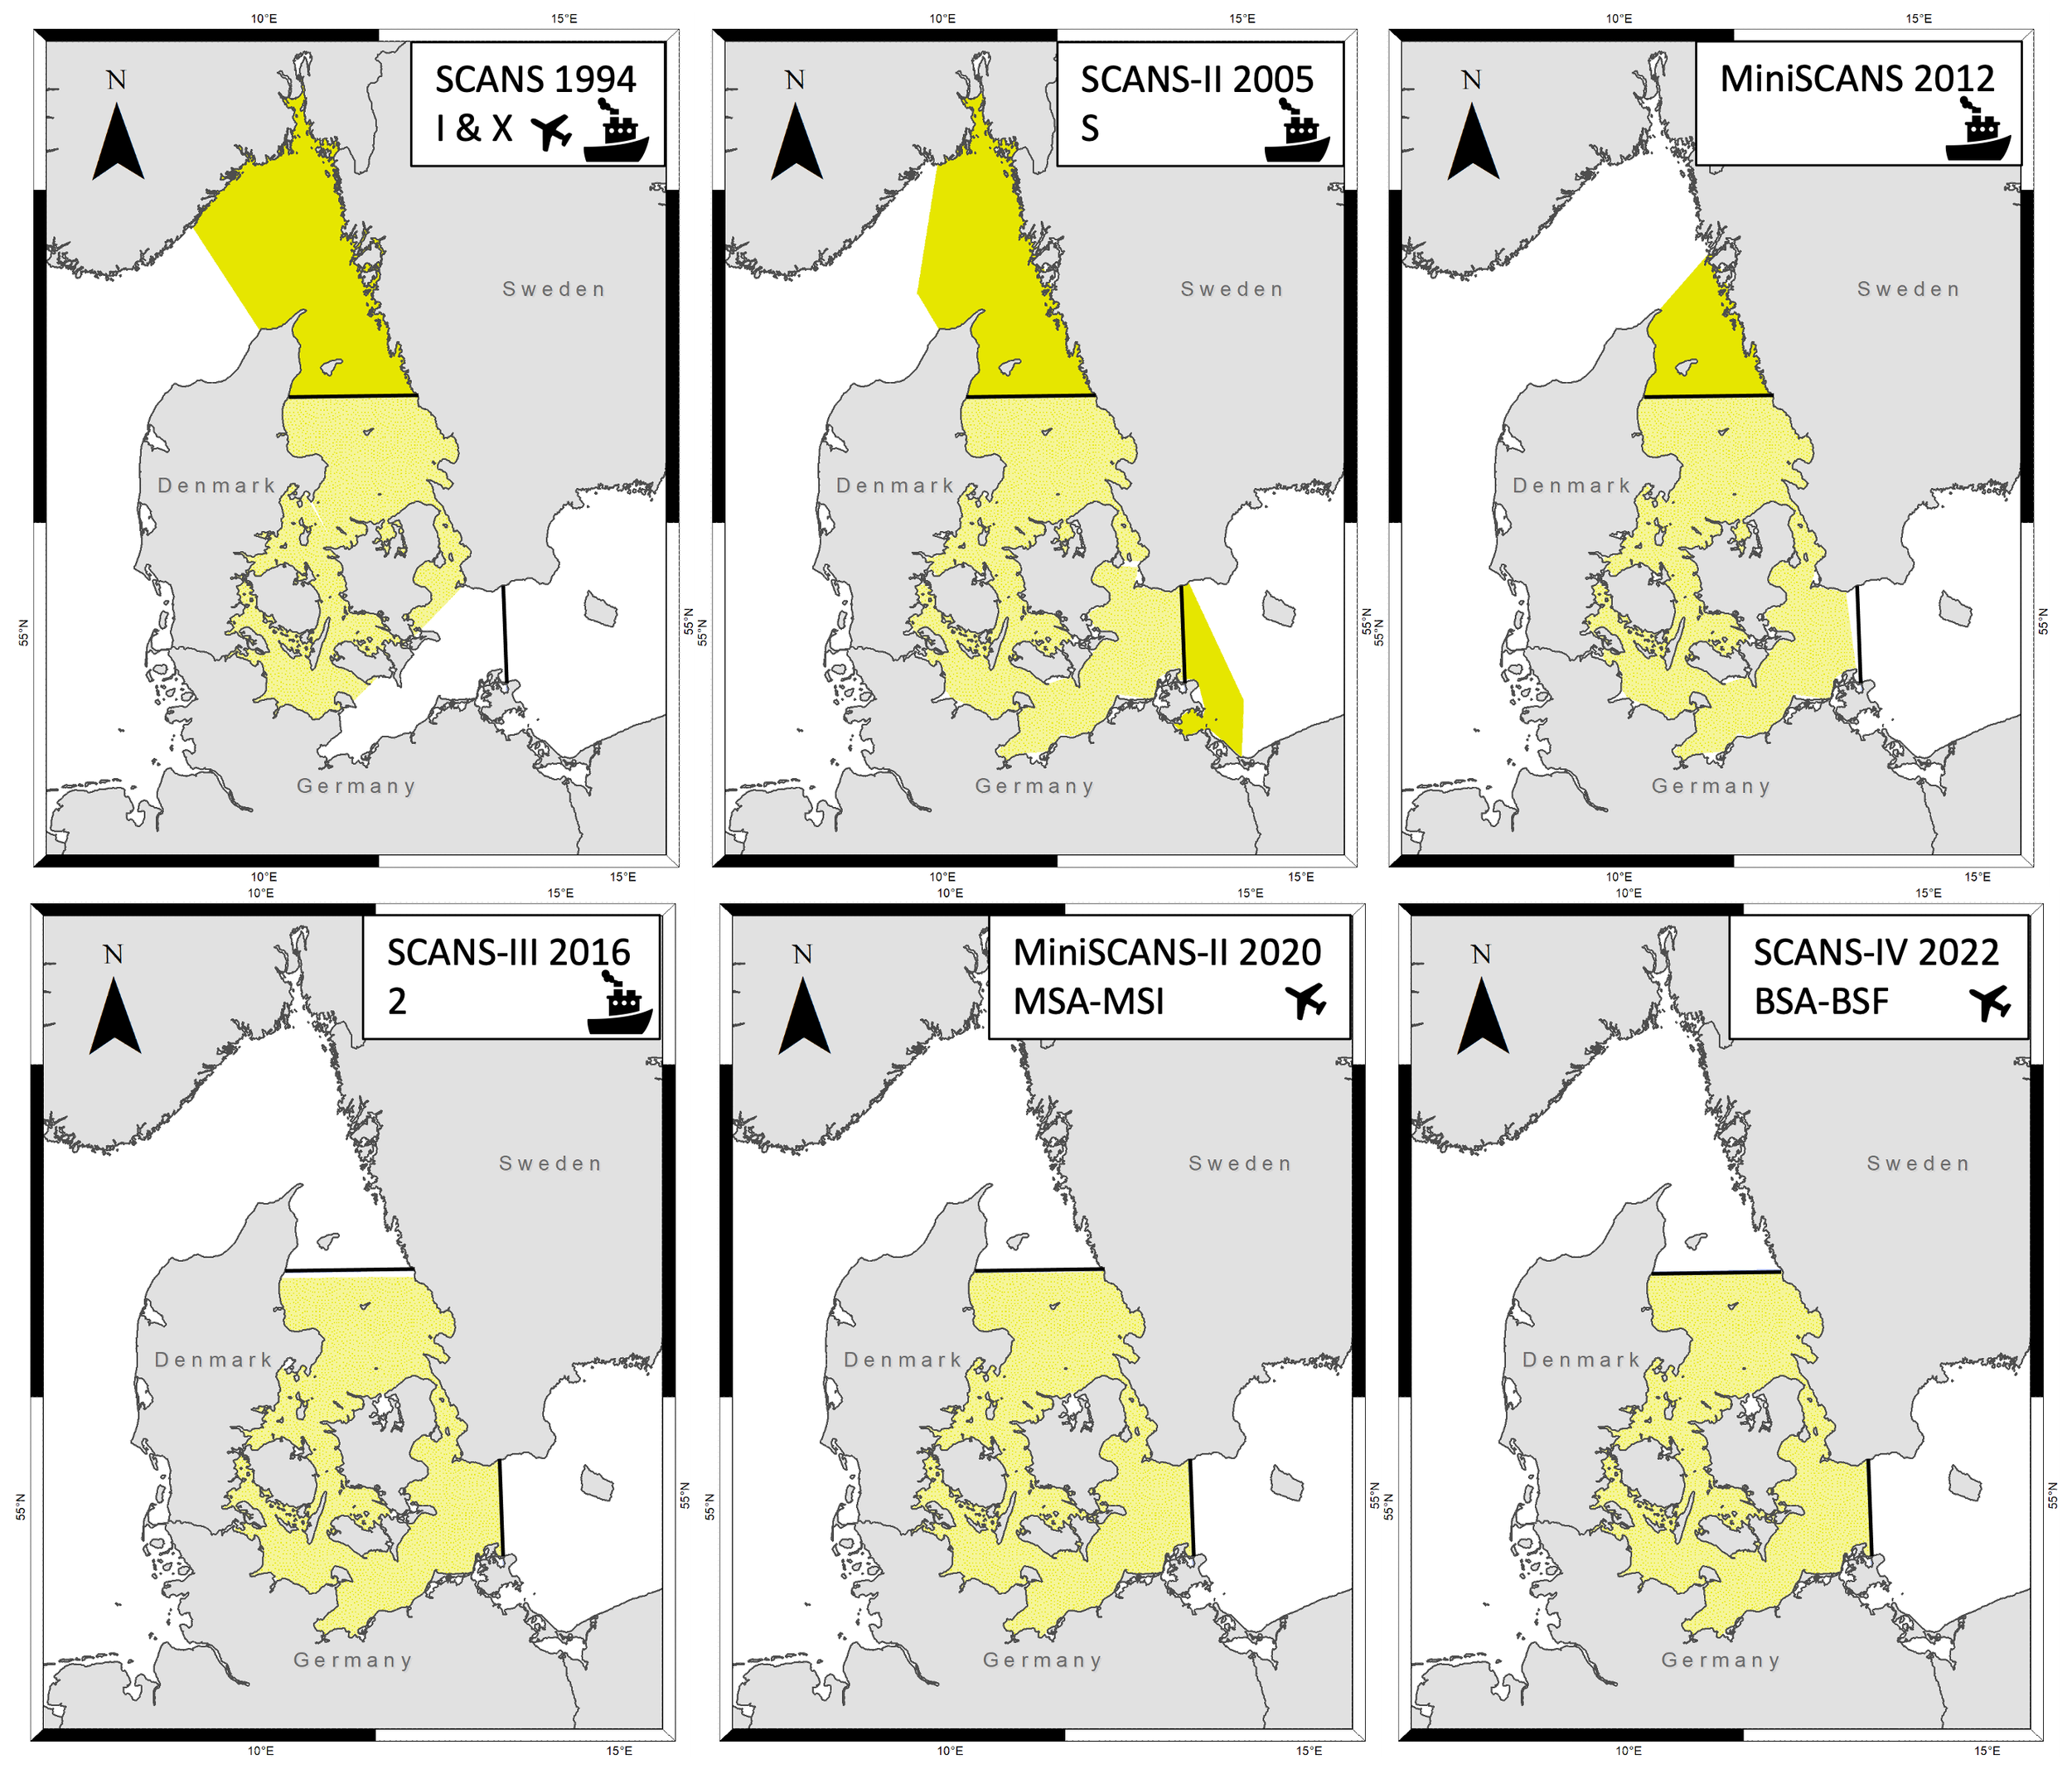
Survey area coverage of the individual SCANS (1994, 2005, 2016, 2022) and MiniSCANS surveys (2012, 2020) surveys is shown in yellow, and the defined management area of the Belt Sea population of harbour porpoises (Phocoena phocoena) in solid black lines (with the limits defined in Sveegaard et al., 2015). Shading is light yellow when survey area is inside the management area, and dark yellow when outside. The 1994 survey was excluded from the trend analysis due to the lack of coverage in the south-eastern part of the management area. Labels in top left indicate survey name, survey year and which blocks were designed (note that in 2012 a single survey area without any stratification in blocks was planned); the icon represents the survey platform. Figure modified from Gilles et al., 2023.
2.2 Trend analysis
The first survey in the Belt Sea region (SCANS) in 1994 only covered 70% of the currently recognised management area of the Belt Sea population, excluding the south-eastern part, which could have influenced the abundance estimate for the population at that time. Therefore, only the abundance estimates from surveys completed between 2005 and 2022 were used for the trend analysis, as these surveys covered the majority of the management area. However, even these remaining surveys covered the management area of the Belt Sea population to varying extents (Figure 1), and only the three most recent surveys in 2016 (SCANS-III), 2020 (MiniSCANS-II) and 2022 (SCANS-IV) more precisely matched the Belt Sea management area. Therefore, for surveys prior to 2016, the conventional distance sampling (CDS) estimates (and associated 95% confidence intervals) were post-stratified to the size of the management area, assuming that the average density in the sampled area could be extrapolated to the whole management area. This allowed for a comparison of the abundance estimates over time.
A Bayesian trend analysis was performed following the approach by Nachtsheim et al. (2021), allowing for the incorporation of all sources of uncertainty. By taking the variability of the individual estimates and the associated errors into account, a closer representation of the trend was achieved by estimating its whole distribution instead of simply a point estimate (as per in more conventional trend estimation methods; Authier et al., 2020; Nachtsheim et al., 2021).
A detailed description of the Bayesian trend analysis approach is provided in Nachtsheim et al. (2021). Briefly, the point abundance estimates from 2005 to 2022, and the associated estimate of uncertainty (expressed as the standard error based on the 95% confidence intervals), were used as priors for the Bayesian model. The posterior distribution of the ‘true’ abundances was obtained with Markov Chain Monte Carlo (MCMC) sampling (10,000 iterations) with the package ‘agTrend’ (Johnson and Fritz, 2014) in R 3.4.4 (R Core Team, 2018). For any given year, the median and 95% credibility interval of the posterior distribution was determined to represent the most probable abundance estimate and the range of posterior estimates for that time, respectively. Linear models linking the posterior distribution values from 2005 to 2022 were run, and the slope coefficient for each model was extracted. This provided a distribution of coefficients which represent an estimate of the relative change, or trend, in abundance over time. An empirical cumulative distribution function was applied on the distribution of relative trend estimates to derive the probability that a trend was negative (p less than 0) or positive (p greater than 0).
2.3 Mortality limit calculation
To calculate a mPBR mortality threshold, a population dynamics model (the so-called operational model) is first needed. A generalized logistic (Pella-Tomlinson), density-dependent, and age-disaggregated model was calibrated with life-history information on the Belt Sea population using the function “pellatomlinson_dis” within the RLA package v.0.2.0 (Genu et al., 2021) (R v. 4.1.0; R Core Team, 2021). This allowed for the simulation of population growth towards carrying capacity (K) using population-specific demographic parameters including, 1) a female:male sex bias in relative vulnerabilities to bycatch of 1.0:1.2 (Lockyer and Kinze, 2003), 2) a female:male sex ratio at birth of 1.0:1.1 (Lockyer and Kinze, 2003) and 3) the proportion of females that are sexually mature for each age defined based on Kesselring et al. (2017). Some of the population-specific demographic parameters [e.g. maximum longevity (22 years) and age-specific risk of bycatch (higher for the first two years)] required by the model were determined to be consistent with the values used for the North Sea population (see Hammond et al., 2019). For one parameter (age-specific survival) there was a lack of data available for this population, so the values used for the North Sea population were determined to be the most suitable (see Hammond et al., 2019). A rough estimate of carrying capacity is needed as a starting point for calculating population trajectories. The value of 50,000 was chosen based on the first abundance estimate available (SCANS 1994: 51,660 animals (CV=0.30); Hammond et al., 2021b revised from Hammond et al., 2002; note that the area surveyed in 1994 was slightly different from later surveys). The order of magnitude of the carrying capacity is important because it drives the importance of demographic stochasticity in extinction risk. Demographic stochasticity is taken into account in the simulations with the age-disaggregated model (see algorithm 2 in Genu et al., 2021).
The impact of randomised removals from the population as a result of unmanaged bycatch was then simulated using the “pellatomlison_dis” function in order to deplete the population to likely current day levels. Simulated bycatch (assumed to be between 0.1% and 5% of K), was allowed to occur over a 60 year period as this reflects the duration from when fishing effort largely increased in the Belt Sea region due to modernisation of fishing methods around 1960 (Nielsen and Richardson, 1996), to the most recent abundance estimate (SCANS-IV, Gilles et al., 2023). A total of 100,000 simulations were completed, and scenarios with depletion levels (after 60 years of unmanaged bycatch) of between 30% and 70% of K were selected for use in calibrating a PBR formula to the conservation objective.
The Potential Biological Removal (PBR) is a control rule for estimating the maximum number of animals, excluding natural mortalities, that can be removed and still allow a population to reach a particular conservation objective (Wade, 1998). PBR is typically calculated as:
where Rmax is the highest possible population growth rate of the population in the available environment (assumed to be 4% by default for cetaceans), and Nmin is the 20th percentile of the most recent abundance estimate, calculated as the lower percentile of a log-normal distribution:
where is the most recent abundance estimate for the population and associated precision (CV), and Z is the standard normal deviate for the 20th percentile (0.842) (Wade, 1998). The most recent unbiased abundance estimate for the Belt Sea population originates from SCANS-IV (Gilles et al., 2023).
Fr is a recovery factor between 0.1 and 1.0, with the value used influencing the rate at which a population can recover towards a conservation objective. In this study, a modified PBR (mPBR) method (Genu et al., 2021) was used to tune the results of the PBR model to the ASCOBANS conservation objective [“populations should be kept at or restored to 80% of their carrying capacity (K)” (Resolution 3.3)], assuming that the objective needed to be achieved within 100 years, with an 80% probability. The R function “pbr_nouveau” (Genu et al., 2021) was used to complete robustness trials under different scenarios of biases in data inputs (Table 2) to determine the value of Fr that would allow the population to reach the conservation objective. The scenarios tested matched previous studies (Wade, 1998; Genu et al., 2021), and were completed for two different CV values (0.2 and 0.4), reflecting the observed range in the precision of abundance estimates for this population (Table 1; Hammond et al., 2002, 2013; Viquerat et al., 2014; Unger et al., 2021; Hammond et al., 2021b; Gilles et al., 2023).
Table 2
| Robustness trial | Scenario | n | q | MNPL | Ktrend | Frequency | Rmax | CV | b.byc | b.abund | b.Rmax | byc.CV | cata. | Fr |
|---|---|---|---|---|---|---|---|---|---|---|---|---|---|---|
| Base case scenario | 0A | 302 | 0.2 | 0.5 | 1 | 6 | 0.04 | 0.2 | 1 | 1 | 1 | 0.3 | 0 | 0.2 |
| 0B | 298 | 0.2 | 0.5 | 1 | 6 | 0.04 | 0.4 | 1 | 1 | 1 | 0.3 | 0 | 0.3 | |
| Bycatch underestimation | 1A | 302 | 0.2 | 0.5 | 1 | 6 | 0.04 | 0.2 | 2 | 1 | 1 | 0.3 | 0 | 0.1 |
| 1B | 298 | 0.2 | 0.5 | 1 | 6 | 0.04 | 0.4 | 2 | 1 | 1 | 0.3 | 0 | 0.1 | |
| Abundance overestimation | 2A | 302 | 0.2 | 0.5 | 1 | 6 | 0.04 | 0.2 | 1 | 2 | 1 | 0.3 | 0 | 0.1 |
| 2B | 298 | 0.2 | 0.5 | 1 | 6 | 0.04 | 0.4 | 1 | 2 | 1 | 0.3 | 0 | 0.1 | |
| Maximum Productivity rate underestimation | 3A | 302 | 0.2 | 0.5 | 1 | 6 | 0.04 | 0.2 | 1 | 1 | 0.5 | 0.3 | 0 | 0.4 |
| 3B | 298 | 0.2 | 0.5 | 1 | 6 | 0.04 | 0.4 | 1 | 1 | 0.5 | 0.3 | 0 | 0.6 | |
| Higher bycatch coefficient of variation | 5A | 302 | 0.2 | 0.5 | 1 | 6 | 0.04 | 0.2 | 1 | 1 | 1 | 1.2 | 0 | 0.2 |
| 5B | 298 | 0.2 | 0.5 | 1 | 6 | 0.04 | 0.4 | 1 | 1 | 1 | 1.2 | 0 | 0.2 | |
| Lower survey frequency | 6A | 302 | 0.2 | 0.5 | 1 | 10 | 0.04 | 0.2 | 1 | 1 | 1 | 0.3 | 0 | 0.2 |
| 6B | 298 | 0.2 | 0.5 | 1 | 10 | 0.04 | 0.4 | 1 | 1 | 1 | 0.3 | 0 | 0.2 | |
| Lower MNPL | 7A | 289 | 0.2 | 0.45 | 1 | 6 | 0.04 | 0.2 | 1 | 1 | 1 | 0.3 | 0 | NA |
| 7B | 311 | 0.2 | 0.45 | 1 | 6 | 0.04 | 0.4 | 1 | 1 | 1 | 0.3 | 0 | 0.1 | |
| Higher MNPL + bycatch underestimation | 8A | 298 | 0.2 | 0.7 | 1 | 6 | 0.04 | 0.2 | 2 | 1 | 1 | 0.3 | 0 | 0.4 |
| 8B | 302 | 0.2 | 0.7 | 1 | 6 | 0.04 | 0.4 | 2 | 1 | 1 | 0.3 | 0 | 0.4 | |
| Catastrophic events happening | 9A | 302 | 0.2 | 0.5 | 1 | 6 | 0.04 | 0.2 | 1 | 1 | 1 | 0.3 | 0.1 | 0.2 |
| 9B | 298 | 0.2 | 0.5 | 1 | 6 | 0.04 | 0.4 | 1 | 1 | 1 | 0.3 | 0.1 | 0.2 | |
| Carrying capacity degradation | 10A | 302 | 0.2 | 0.5 | 0.5 | 6 | 0.04 | 0.2 | 1 | 1 | 1 | 0.3 | 0 | 0.4 |
| 10B | 298 | 0.2 | 0.5 | 0.5 | 6 | 0.04 | 0.4 | 1 | 1 | 1 | 0.3 | 0 | 0.5 |
Robustness trials to determine under which scenarios and recovery factor (Fr) value the Belt Sea population of harbour porpoise (Phocoena phocoena) is able to reach the conservation objective of ASCOBANS, that the population reaches 80% of carrying capacity (here assumed to be 50,000 animals), within 100 years with 80% certainty.
The scenarios tested (and numbers given for the scenario) reflect that of Genu et al., 2021, except that scenario 4A and 4B (higher CV of the abundance estimate) were excluded in this study and instead the likely range of CVs obtained for abundance estimates in this population (0.2-0.4) were tested for every scenario.
n = number of simulations used to test the scenario; q = the quantile used to estimate Nmin, where Nmin is the 20th percentile of the most recent abundance estimate, calculated as the lower percentile of a log-normal; MNPL = maximum net productivity level of the population. Ktrend = the trend in carrying capacity over the course of the simulation as a fraction of K at the beginning. Frequency = how often abundance surveys are completed; Rmax = maximum theoretical or estimated productivity rate of the population; CV = coefficient of variation of the abundance estimate; b.byc = bias in the bycatch estimate as a factor of the true value (i.e. 1 = no bias, 2 = bycatch has been underestimated by a factor of 2); b.abund = bias in abundance estimate as a factor of the true value; b.Rmax = bias in Rmax as a factor of the true value; byc.CV = coefficient of variation of the bycatch estimate; cata. = strength of a catastrophic event happening (0 = no catastrophic event, 0.1 = 10% of the population are lost at a random stage of the simulation).
3 Results
3.1 Abundance estimates
The metadata and abundance estimates for the SCANS and MiniSCANS surveys are summarised in Table 1. The surveys conducted in 2020 and 2022 achieved the highest survey effort in the management area of the Belt Sea population. The survey in 1994 was excluded from the trend analysis because SCANS covered a larger area, including the Skagerrak to the north, but it did not encompass the southeastern part of the management area, resulting in a 30% coverage gap (Figure 1). Comparing the five remaining surveys, the highest abundance was estimated for 2012 and 2016, while the lowest was estimated for 2020 and 2022.
3.2 Trend in abundance
The results of the Bayesian trend analysis are shown in Figure 2. The abundance estimate from 2016 (SCANS-III) had less influence on the estimated trend since it is also the abundance estimate with the lowest precision. In this sense, the model took the estimate into account but down-weighted its influence on the trend because of its low precision. The Bayesian trend analysis revealed a decreasing trend of 2.68% per year (95% credibility interval, -4.13% to +1.26%), with a 90.5% probability that the trend was in fact negative (Figure 2).
Figure 2
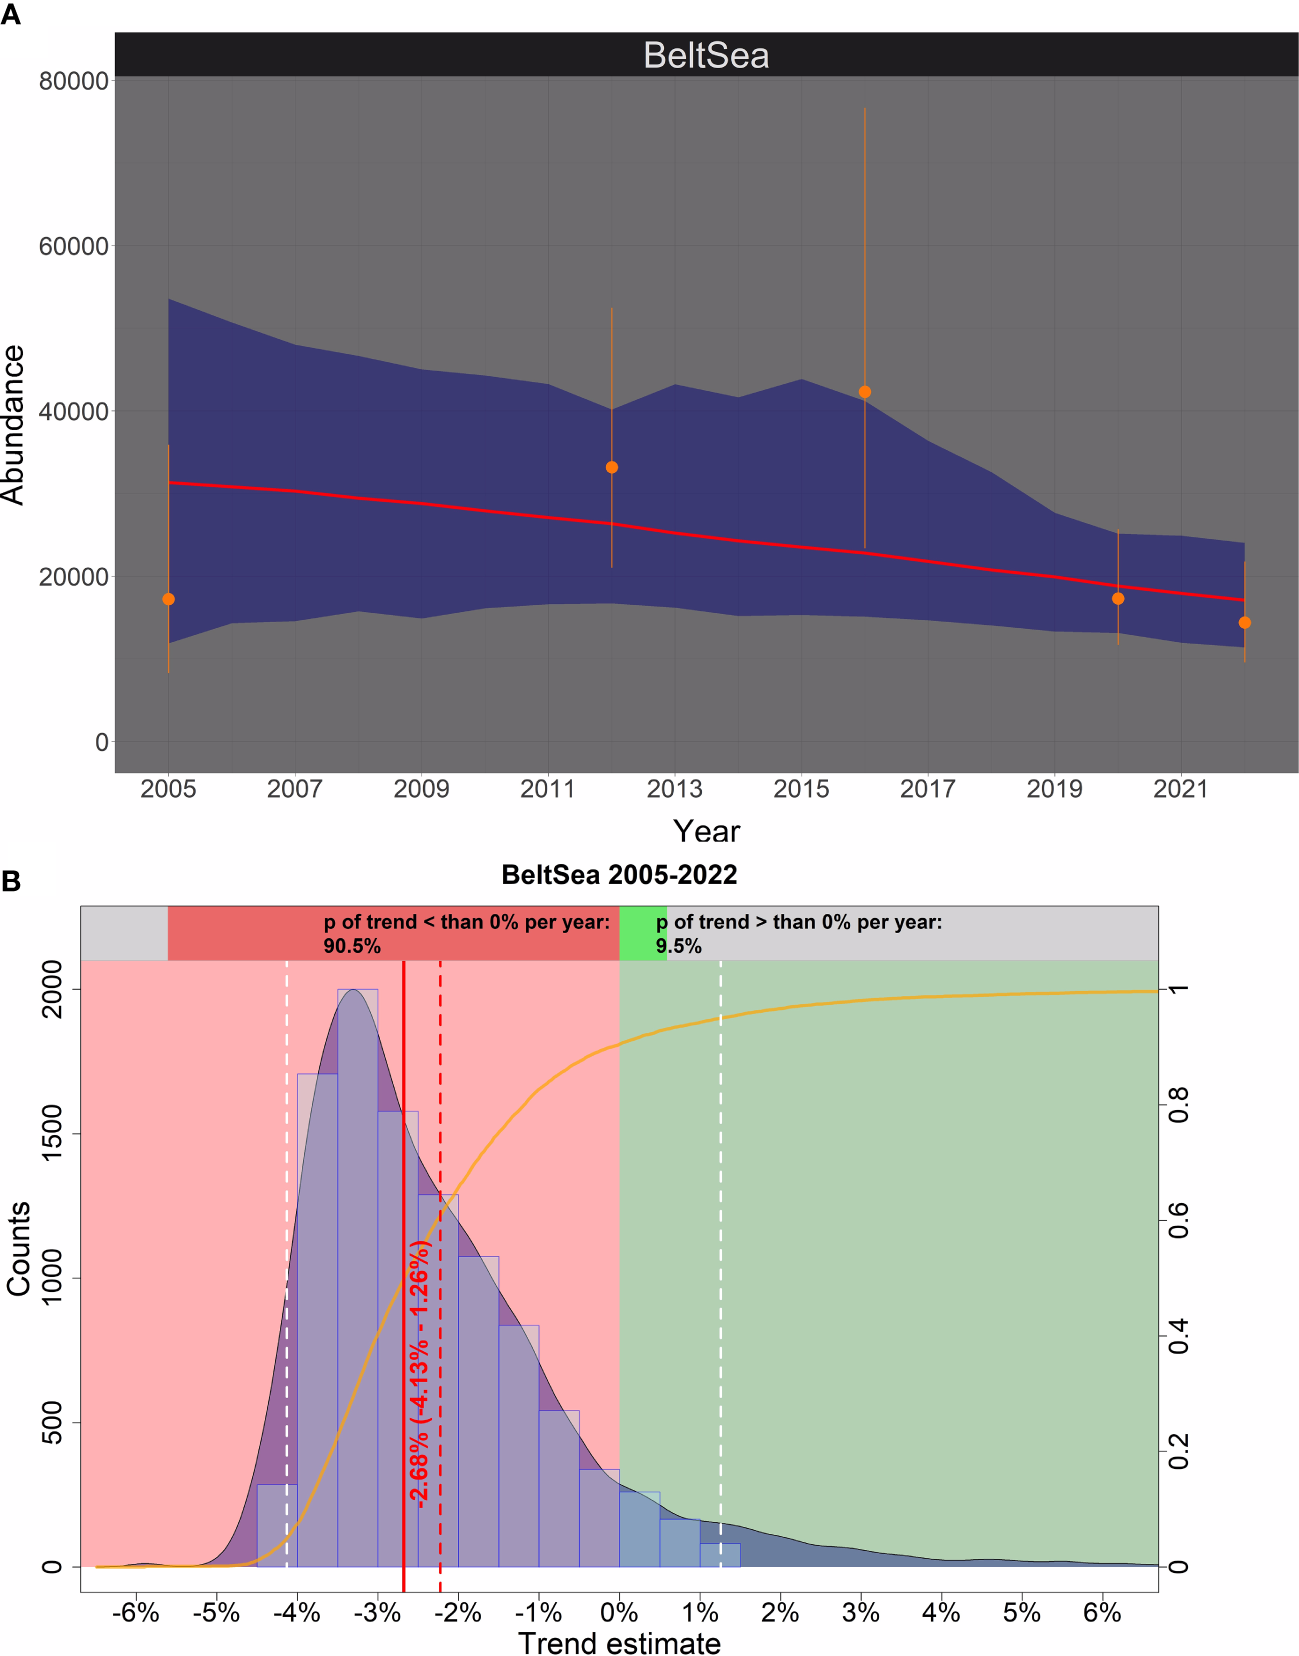
The Bayesian trend in abundance of harbour porpoises (Phocoena phocoena) in the Belt Sea management area between 2005 and 2022. (A) Stratum-based visual survey abundance estimates and the associated 95% confidence intervals are shown in orange. The median of the posteriori distribution of the calculated ‘true’ abundance estimates from a Bayesian model is show by the red line, and the corresponding 95% credibility intervals are shown in blue. (B) The distribution of the trend estimates (relative change in abundance) between 2005 and 2022 is shown by the light blue histogram and the blue shaded density curve (x-axis); the solid red vertical line is the median, the vertical red dashed line is the mean, and the white dashed lines represent the upper and lower 95% credibility intervals of the trend estimate. The red coloured area corresponds to an area with a negative trend, while the green coloured area represents a positive trend. The orange solid line illustrates the empirical cumulative distribution function of the trend estimates, giving the probability of a trend estimate at a specified value (e.g. 0%). Hence, the upper bar chart shows how likely it is that the trend is either negative (i.e., p< 0%; red) or positive (i.e., p > 0%; green).
3.3 Mortality limit
Based on the results of the most recent abundance survey (SCANS-IV) from 2022 (14,403 animals (95% CI = 9,555-21,769); CV = 0.21; Gilles et al., 2023), Nmin was estimated at 12,091 animals. The highest Fr that allowed the population to reach the conservation objective with a CV of 0.2 was Fr = 0.4 in scenario 3A (Rmax underestimation), scenario 8A (higher MNPL, and bycatch underestimation), and scenario 10A (carrying capacity degradation). All seven other scenarios (with a CV of 0.2) required an Fr of 0.2 or 0.1 to achieve the conservation objective (Table 2). For the Belt Sea population of harbour porpoises to meet the conservation objective under all scenarios tested (with a CV of 0.2), including an underestimation of bycatch (scenario 1A), an Fr value set to the minimum 0.1 is required (Table 2). Simulated trajectories of the base case scenario (0A, n = 302, assuming no biases) with an Fr value of 0.1 are shown in Figure 3, and mean trajectories for all Fr values in the base case scenario are shown in Figure 4. PBR was calculated for each possible Fr value based on the most recent abundance estimate and associated CV (Table 3). The calculated mPBR mortality limit, with an Fr of 0.1, was 24 animals (Table 3).
Figure 3
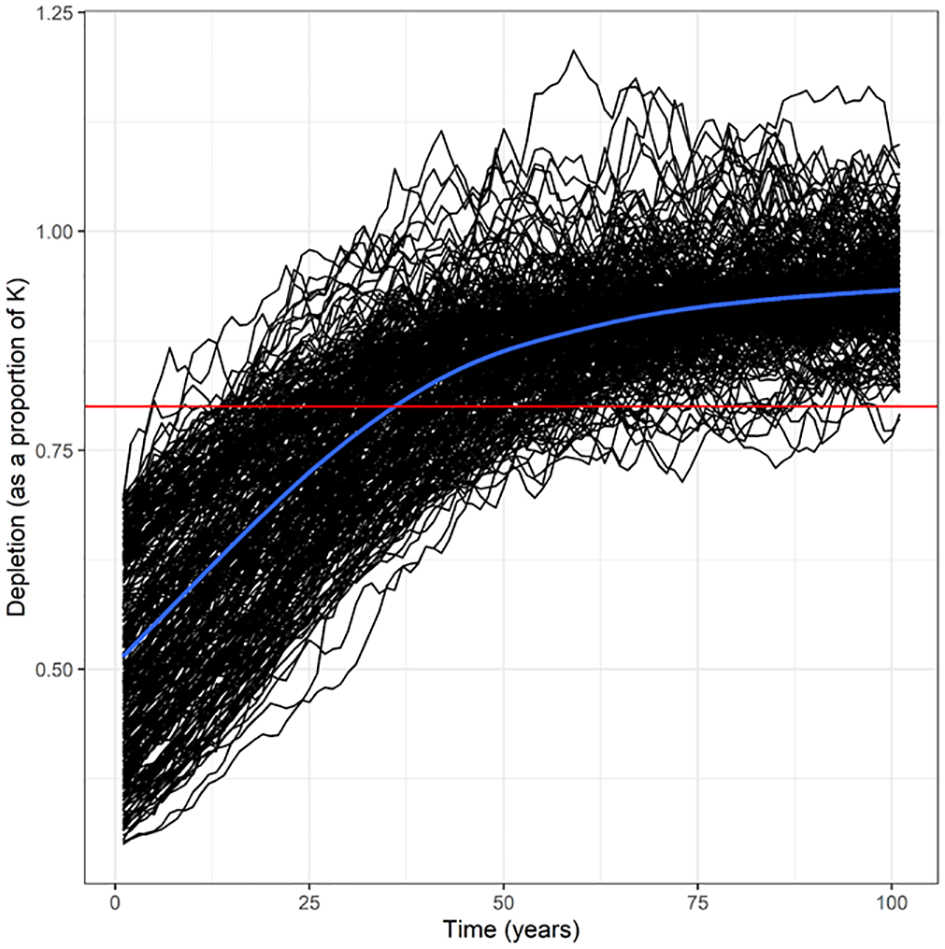
Populations dynamics of the Belt Sea population of harbour porpoise (Phocoena phocoena) under the base case scenario (0A-assuming a Maximum Net Productivity Level (MNPL) of 0.5, population growth rate (Rmax) of 4%, coefficient of variation of the abundance estimate of 0.2, and no bias in other factors) (n = 302 simulations) with a recovery factor of 0.1. The mean of the trajectories is shown by the blue line. The 80% of carrying capacity (K) depletion level is shown by the red line, which is consistent with the conservation objective of ASCOBANS.
Figure 4
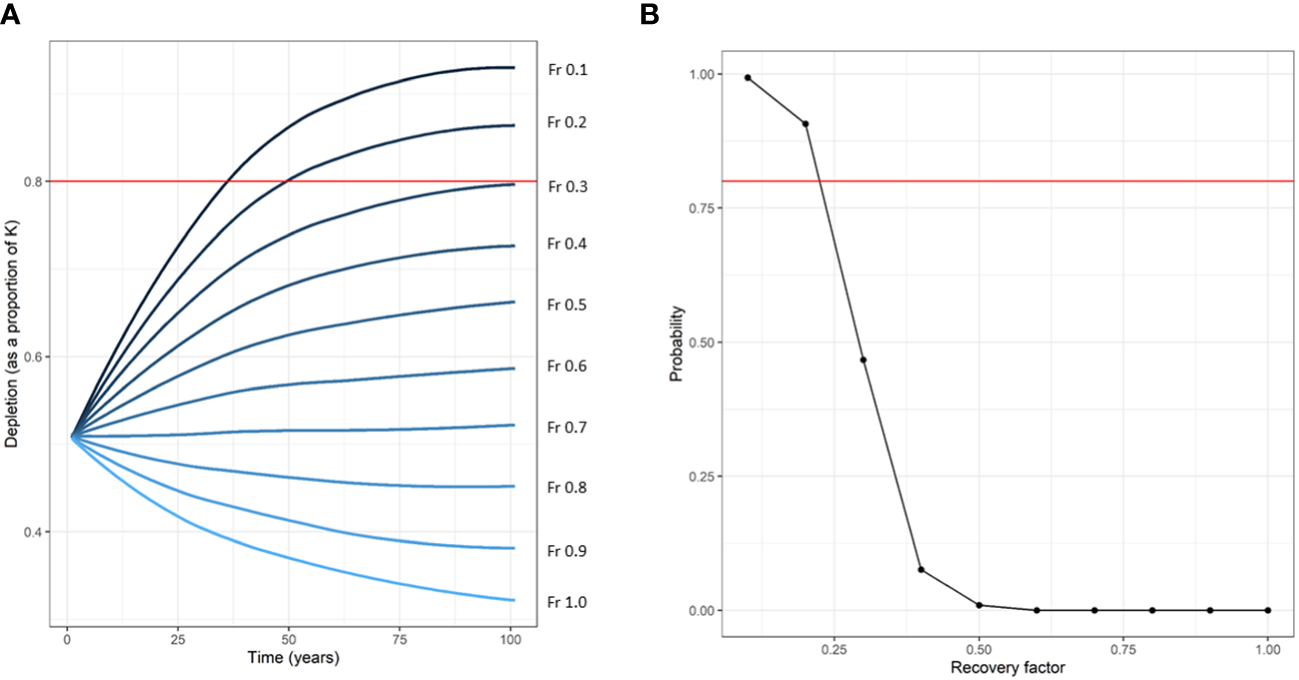
Mean trajectories of the Belt Sea population of harbour porpoises (Phocoena phocoena) with various levels of recovery factors (Fr) over 100 years of management (A). The probability that the population will achieve the conservation objective of reaching 80% of carrying capacity (red line panel A) within 100 years is shown (B). Values are shown for the base case scenario (0A) (assuming a Maximum Net Productivity Level (MNPL) of 0.5, a population growth rate (Rmax) of 4%, coefficient of variation of the abundance estimate of 0.2, and no bias in any other factors). Only Fr values of 0.1 and 0.2 allow the population to have an >80% probability [red line panel (B)] of reaching the conservation objective (80% of K within 100 years).
Table 3
| Fr | Mortality limit |
|---|---|
| 0.1 | 24 |
| 0.2 | 48 |
| 0.3 | 72 |
| 0.4 | 96 |
| 0.5 | 120 |
| 0.6 | 144 |
| 0.7 | 168 |
| 0.8 | 192 |
| 0.9 | 216 |
| 1 | 240 |
Potential biological removal (PBR) mortality limit values for the Belt Sea population of harbour porpoise (Phocoena phocoena) based on the most recent abundance estimate and associated CV [from 2022: 14,403 (95% CI = 9,555-21,769; CV = 0.21; taken from Gilles et al., 2023)].
A recovery factor (Fr) of 0.1 and mortality limit of 24 animals (shaded row) is required in order to meet the conservation objective of ASCOBANS under potential scenarios of bias in the available data.
4 Discussion
Using a Bayesian trend analysis, this study revealed that there has been a negative trend in the abundance of the Belt Sea population of harbour porpoises over the last 18 years (average rate of -2.7% per year). Completion of a range of robustness trials taking into account possible biases in the data available, revealed that for the population to reach the conservation objective in a scenario where bycatch is underestimated, an Fr value of 0.1 is needed. This resulted in a calculated mortality limit of 24 individuals per year, which is far exceeded by current published estimates of the rate of bycatch within the range of this population of ~900 animals (Kindt-Larsen et al., 2023). The bycatch underestimation scenario selected appears likely, given that no data are available or included from the German commercial fleet, or from part-time and recreational fishermen using set nets in any country (Kindt-Larsen et al., 2023).
There are multiple methods that can be used to estimate mortality limits, and many different assumptions that need to be made when completing the required simulations and calculations. A recent study (Kindt-Larsen et al., 2023), reported an mPBR threshold of 99 animals based on the results of MiniSCANS-II 2020 (Unger et al., 2021), assuming accurate and precise information on both abundance and bycatch estimates; this is an unlikely scenario given the large confidence intervals, many assumptions, and lack of precise information for both methods. They also present a PBR threshold using an Fr value of 1, concluding that this is the preferred threshold for this population as it falls within the confidence intervals of the estimated yearly total bycatch for the population. The use of an Fr value of 1 is not a standard use of the PBR method, and in the USA where the PBR method was developed under the MMPA, such a high Fr value (above 0.5) is almost never implemented. As Wade et al. (2021) point out, the U.S. MMPA Guidelines states that “Recovery factors of 1.0 for stocks of unknown status should be reserved for cases where there is assurance that Nmin, Rmax, and the estimates of mortality and serious injury are unbiased and where the stock structure is unequivocal”. These conditions are not met in the case of the Belt Sea population of harbour porpoise since, among others, total bycatch is underestimated (Kindt-Larsen et al., 2023). Additionally, the use of such a threshold ignores the conservation goals (that populations should be able to be restored, not just maintained) strived for by the European Commission (DG MARE, 2023).
In 2023, based on the abundance estimate from 2020 (MiniSCANS-II; Unger et al., 2021), a bycatch threshold for the Belt Sea population of 73 animals per year was agreed by all Contracting Parties of HELCOM. This threshold was used as a part of the “Number of drowned mammals and waterbirds in fishing gear” (D1C1)” indicator on mortality for the Belt Sea population in HOLAS 3 (HELCOM, 2023) and the indicator was determined to be greatly exceeded by the estimates of bycatch levels available at that time (NAMMCO and IMR, 2019). As a result, the Belt Sea population was assessed as not in good status in terms of bycatch level in HOLAS 3 (HELCOM, 2023). When including the recent results from SCANS-IV in our study, the mortality limit required for this population to be able to reach the defined conservation objective has lowered to 24 animals. Meanwhile, the estimated mortality of this population due to bycatch has now increased to an even larger number of animals (which is still likely underestimated) (Kindt-Larsen et al., 2023). The high bycatch level, combined with the negative trend in abundance shown in this study, raises serious concern about the future prospects of the Belt Sea population.
For highly mobile species distributed over large areas, a common challenge is too few abundance estimates, often with large uncertainties that reduce the power to assess trends (Authier et al., 2020). Over the study period of 18 years, a negative trend was observed, despite the large confidence intervals of the earlier surveys and the small number of surveys (n = 5). The Bayesian method used allowed the influence of imprecise estimates to be down weighted (in proportion of their imprecision) when estimating a trend, which is more efficient as it uses all of the available information from the limited number of surveys completed to date (Nachtsheim et al., 2021). The trend analysis supports a decline with a very high probability of 90%. When assessing species in risk of declines for the IUCN Red List, a timeframe of 10 years or three generations, whichever is the longer, is regularly applied (IUCN Standards and Petitions Committee, 2022). The 18-years trend analysed in this study does not yet cover three generations of the species (assuming 7.5 years per generation for a non-disturbed generation length; based on ICES (2014) (page 113) and Santos and Pierce, 2015) but does not prevent an assessment based on the best available evidence. In populations with low reproduction rates where individuals are long-lived, short-term fluctuations in species abundance can obscure long-term trends (Hovestadt and Nowicki, 2008). In order to ensure that there is sufficient power to detect long-term trends, abundance surveys should continue to be completed regularly in the future, at least once every HOLAS assessment cycle (6 years) which is aimed at supporting EU Member States with their reporting for Article 8 and 9 under the MSFD.
There is a lack of historical quantitative data for many cetacean populations, which is also not conducive to a clear picture of population development. The first SCANS survey in 1994 likely took place after the population had already been exposed to substantial bycatch from fisheries, environmental pollution, and underwater noise. It is therefore difficult to determine the actual carrying capacity of the population prior to human impacts, and the value of 50,000 used in this study may be an underestimate of true carrying capacity. In contrast, the SCANS 1994 extended further north than the current management area of the Belt Sea population, and did not include a part of the currently accepted management area to the southeast with lower densities, which could indicate an overestimated carrying capacity. However, the fact that we used an over- or underestimated estimate of carrying capacity is unlikely to change the results on the mortality limit as long as the order of magnitude of the estimated carrying capacity remains roughly correct. In any case, restoration to a pristine state is unlikely and the first available estimate (1994) corresponds roughly to an operative baseline situation as required under the Habitat Directives. Future work should include a gap analysis and density surface modelling to predict density in the region missed during the first SCANS survey in 1994. This would allow the first survey to be included in future trend analyses, along with more recent surveys that are completed, and expand the time-frame over which the trend is analysed.
More generally, line-transect distance sampling surveys using different platforms (either ship or aircraft) are a reliable and well established method for assessing the abundance and density of cetaceans. The methods implemented on both platforms have been developed to account for, or at least to minimise to the greatest extent possible, violation of the assumptions that can generate bias in abundance estimates if they are violated. If those assumptions are met, both aerial and ship-based estimates are unbiased. All SCANS and MiniSCANS surveys met the assumptions of line-transect distance sampling and applied state-of-the-art double-platform methods to collect data that were used to correct for animals missed on the transect line. Therefore, accounting for detectability differences between survey platforms, teams and environmental conditions were taken into account, individually for all surveys, and all data were corrected for perception and availability bias, by considering platform differences and diving behaviour of the animals. As a result, absolute abundance could be estimated and should be comparable between surveys irrespective of the chosen platform. In other words, absolute abundance estimation was carried out independently for each survey year and data were not pooled across survey year and all correction factors to account for imperfect detection were year- and survey-specific. The likelihood of the change in platform driving the change in abundance is low.
The difference between the calculated mortality limit and the estimated bycatch in the region (Kindt-Larsen et al., 2023) is of major concern. The conclusion that an Fr of 0.1 is required to meet the ASCOBANS conservation objective is in line with what was determined for other populations (Taylor et al., 2022), despite being tuned for the Belt Sea population in this study. This is not surprising given that the Belt Sea population is a small population that is listed as Vulnerable which should, if anything, have even more cautious management than populations that are listed as Least Concern. It is possible to see that with bycatch at the current rate the population will decline over time based on projections of the population demographics models (see Figure 4). Kindt-Larsen et al. (2023) suggest that a lack of decline in the population over time is a sign that either the calculated mortality limits are over precautious, or that the management unit definition is incorrect. They suggest that the population may be stable, possibly due to a large influx of animals from the North Sea population keeping density high in the region. However, this conclusion ignores much previous work based on genetics, morphology and telemetry data showing that such movement does not often occur (Sveegaard et al., 2015). Additionally, the results of this study demonstrate that despite the short 18-year period, there is strong evidence of a decline in this population and that the currently high bycatch levels (Kindt-Larsen et al., 2023) are likely the cause. Therefore, there is a need to greatly reduce the level of bycatch in this region, not only to allow the population to reach the ASCOBANS conservation goal in the long-term, but also to prevent a further decline in the short-term.
In addition to bycatch, there are several other factors (and their cumulative effects) that could also contribute to a potential decline in this population. For instance, in 2019 explosions from military activities to clear mines contributed to the death of 10 out of the 24 animals examined (Siebert et al., 2022). Additionally, a mass mortality of harbour porpoises (85 individuals) was likely related to a military exercise in Denmark in 2005 (Wright et al., 2013). Underwater noise from anthropogenic sources, such as shipping and construction of offshore installations, is increasing and may lead to exclusion of animals from important habitats, masking of communication, disruption of foraging activities, and hearing impairments (Lucke et al., 2009; Dähne et al., 2013; Hermannsen et al., 2014; Erbe et al., 2016; Wisniewska et al., 2018a). Indeed, during the MiniSCANS-II survey, despite high effort, no harbour porpoises were observed within stratum MSI (Supplementary Figure 2) where pile-driving for an offshore wind farm was occurring during the survey (Unger et al., 2021). Also, food depletion may be an issue as porpoises have been shown to eat more and smaller prey in the Belt Sea population range than what was previously found (Sveegaard et al., 2012; Wisniewska et al., 2016; Andreasen et al., 2017; Wisniewska et al., 2018b) and several fish stocks, e.g. cod and herring within the management unit of the Belt Sea population, are severely depleted (ICES, 2022, 2023) likely due to overfishing, eutrophication and increasing water temperatures. It is unknown how these additional risk factors influence harbour porpoises at the population level. The cumulative impact of these factors could also influence the risk of bycatch for some individuals, for example, if their hearing is impaired by noise impacts (Lucke et al., 2009; Hermannsen et al., 2014; Siebert et al., 2022). While pollutant loads are thought to be decreasing in the Baltic region (Jörundsdóttir et al., 2006; Miller et al., 2014), many legacy pollutants are still at high levels, and there is increasing knowledge on the possible impacts of new emerging pollutants in the marine environment (de Wit et al., 2020; Dietz et al., 2021a, Dietz et al., 2021b; Gkotsis et al., 2022). Overall, the population remains vulnerable to the negative impacts of anthropogenic activities. However, given that on average 900 animals (but possibly as high as 3,000 taking uncertainty into account) have been bycaught annually in set nets from Denmark and Sweden alone (Kindt-Larsen et al., 2023), it is likely that this remains by far the largest threat to the Belt Sea population of harbour porpoises.
Despite the fact that we demonstrate that bycatch levels are extremely high relative to the sustainable level, there is a need for data from Germany, as well as more accurate data from Sweden and Denmark, on both fisheries bycatch rates and fishing effort, so that the total amount of bycatch in the management area can be determined more accurately. These data will not only allow for a valid assessment of the impact of bycatch on the population, they will also allow for the future use of other methods which need more input data for estimating mortality limits, such as the Removals Limit Algorithm (RLA; Hammond et al., 2019) or the Anthropogenic Removals Threshold (ART; Ouzoulias et al., 2024). Both methods require a time series of bycatch estimates to compute a mortality limit, and have been applied to other harbour porpoise populations (Genu et al., 2021; Ouzoulias et al., 2024). Regardless of the method used to calculate the mortality limit, current conservation ambitions in the Northeast Atlantic (OSPAR North-East Atlantic Environment Strategy, 2030) and in the European Union (Biodiversity Strategy 2030) are to reduce bycatch to a minimum, and where possible, to eliminate it. The EU Biodiversity Strategy 2030 calls for EU Member States to put in place effective restoration measures to restore degraded ecosystems and to address the current biodiversity crisis (IBPES, 2019). Given the current dire situation of other porpoise populations like the Baltic Proper harbour porpoise (Amundin et al., 2022, Carlström et al., 2023), the Black Sea harbour porpoise (Popov et al., 2023), the Yangtze finless porpoise (Neophocaena asiaeorientalis) (Mogensen et al., 2022), the Iberian harbour porpoise (Pierce et al., 2022) and the vaquita (Phocoena sinus) (Rojas-Bracho et al., 2022; IWC, 2023), informed decisions on management actions to reduce the level of bycatch in this population should not be delayed. While more data are always welcome, the results of this study demonstrate that we know enough to take action now.
Statements
Data availability statement
The raw data supporting the conclusions of this article will be made available by the authors, without undue reservation. The datasets for this study can be found in the gitlab depository “Owen2023” (https://gitlab.univ-lr.fr/mauthier/owen2023).
Ethics statement
Ethical approval was not required for the study involving animals in accordance with the local legislation and institutional requirements because the study only involved aerial surveys and statistical analyses.
Author contributions
KO: Conceptualization, Formal Analysis, Funding acquisition, Investigation, Methodology, Project administration, Validation, Visualization, Writing – original draft. AG: Conceptualization, Data curation, Formal Analysis, Funding acquisition, Investigation, Methodology, Project administration, Software, Supervision, Validation, Visualization, Writing – original draft. MA: Data curation, Formal Analysis, Investigation, Methodology, Software, Validation, Writing – review & editing. JC: Conceptualization, Formal Analysis, Funding acquisition, Methodology, Project administration, Validation, Writing – review & editing. MG: Data curation, Formal Analysis, Investigation, Methodology, Software, Validation, Writing – review & editing. LK: Investigation, Writing – review & editing. DN: Data curation, Formal Analysis, Investigation, Methodology, Software, Validation, Visualization, Writing – review & editing. NR-M: Data curation, Formal Analysis, Investigation, Software, Validation, Visualization, Writing – review & editing. US: Funding acquisition, Investigation, Project administration, Supervision, Writing – review & editing. MS: Data curation, Formal Analysis, Investigation, Methodology, Software, Validation, Writing – review & editing. JT: Funding acquisition, Investigation, Methodology, Project administration, Supervision, Writing – original draft. BU: Data curation, Investigation, Project administration, Visualization, Writing – original draft. SS: Data curation, Funding acquisition, Investigation, Project administration, Supervision, Writing – original draft.
Funding
The author(s) declare that financial support was received for the research, authorship, and/or publication of this article. The trend analysis was funded by the European Union as part of the HELCOM BLUES project (No. 110661/2020/839624/SUB/ENV.C.2), and the Swedish Agency for Marine and Water Management (SwAM) provided funding for the mortality limit calculation. Funding for MiniSCANS-II was provided jointly by the Danish Environmental Protection Agency, the German Federal Agency for Nature Conservation (BfN; TopMarine FKZ 3518532213) and SwAM (Swedish National Monitoring Programme).
Acknowledgments
We would like to express our gratitude to all survey teams, data recorders, observers, and ground crew for their flexibility and availability in conducting surveys, even during challenging pandemic times. We are particularly grateful to all aircraft companies for safe flights, flexibility in implementing survey plans on short notice as well as for sharing their experience in the interpretation of weather forecasts. Furthermore, we thank Philip Hammond and Claire Lacey to provide estimates, figures and tables from the SCANS surveys. We thank the HELCOM secretariat for coordinating the BLUES project and the three reviewers for their helpful comments on an earlier draft of the manuscript.
Conflict of interest
The authors declare that the research was conducted in the absence of any commercial or financial relationships that could be construed as a potential conflict of interest.
Publisher’s note
All claims expressed in this article are solely those of the authors and do not necessarily represent those of their affiliated organizations, or those of the publisher, the editors and the reviewers. Any product that may be evaluated in this article, or claim that may be made by its manufacturer, is not guaranteed or endorsed by the publisher.
Supplementary material
The Supplementary Material for this article can be found online at: https://www.frontiersin.org/articles/10.3389/fmars.2024.1289808/full#supplementary-material
References
1
Amundin M. Carlström J. Carlen I. Thomas L. Koblitz J. Tielmann J. et al . (2022). Estimating the abundance of the critically endangered Baltic Proper harbour porpoise (Phocoena phocoena) population using passive acoustic monitoring. Ecol. Evol.12, e8554. doi: 10.1002/ece3.8554
2
Andreasen H. Ross S. D. Siebert U. Andersen N. G. Ronnenberg K. Gilles A. (2017). Diet composition and food consumption rate of harbor porpoises (Phocoena phocoena) in the western Baltic Sea. Mar. Mam Sci.33, 1053–1079. doi: 10.1111/mms.12421
3
ASCOBANS (1997). Report of the Second meeting of Parties to ASCOBANS (Bonn, Germany). Available online at: https://www.ascobans.org/en/document/report-second-meeting-parties-ascobans (Accessed 18 July, 2023).
4
ASCOBANS . (2023). ASCOBANS Conservation Objectives. Document ASCOBANS/AC28/Doc.8.2 submitted to the Advisory Committee meeting. Available online at: https://www.ascobans.org/sites/default/files/document/ascobans_ac28_doc8.2_conservation-objectives.pdf (Accessed 19 Jan 2024).
5
Authier M. Galatius A. Gilles A. Spitz J. (2020). Of power and despair in cetacean conservation: estimation and detection of trend in abundance with noisy and short time-series. PeerJ8, e9436. doi: 10.7717/peerj.9436
6
Berggren P. Wade P. R. Carlström J. Read A. J. (2002). Potential limits to anthropogenic mortality for harbour porpoises in the Baltic region. Biol. Conserv.103, 313–322. doi: 10.1016/S0006-3207(01)00142-2
7
Braulik G. T. Minton G. Amano M. Bjørge A. (2023). Phocoena phocoena (amended version of 2020 assessment) (Accessed 23 February 2024).
8
Brownell R. L. Jr. Reeves R. R. Read A. J. Smith B. D. Thomas P. Ralls K. et al . (2019). Bycatch in gillnet fisheries threatens Critically Endangered small cetaceans and other aquatic megafauna. Endang. Species Res.40, 285–296. doi: 10.3354/esr00994
9
Buckland S. T. Anderson D. R. Burnham K. P. Laake J. L. Borchers D. L. Thomas L. (2001). Introduction to distance sampling estimating abundance of biological populations (Oxford, UK: Oxford University Press). doi: 10.1093/oso/9780198506492.001.0001
10
Carlén I. Thomas L. Carlström J. Amundin M. Teilmann J. Tregenza N. et al . (2018). Basin-scale distribution of harbour porpoises in the Baltic Sea provides basis for effective conservation actions. Biol. Conserv.226, 42–53. doi: 10.1016/j.biocon.2018.06.031
11
Carlén I. Nunny L. Simmonds M. P. (2021). Out of Sight, Out of Mind: How Conservation Is Failing European Porpoises. Front. Mar. Sci.8. doi: 10.3389/fmars.2021.617478
12
Carlström J. Carlén I. Dähne M. Hammond P. S. Koschinski S. Owen K. et al . (2023). Phocoena phocoena (Baltic Sea subpopulation). IUCN Red List Threatened Species2023, e.T17031A5037077323 February 2024. doi: 10.2305/IUCN.UK.2023-1.RLTS.T17031A50370773.en
13
Celemín E. Autenrieth M. Roos A. Pawliczka I. Quintela M. Lindstrøm U. et al . (2023). Evolutionary history and seascape genomics of Harbour porpoises (Phocoena phocoena) across environmental gradients in the North Atlantic and adjacent waters. Mol. Ecol. Resour.00, 1–18. doi: 10.1111/1755-0998.13860
14
Conde D. A. Staerk J. Colchero F. da Silva R. Schöley J. Baden H. M. et al . (2019). Data gaps and opportunities for comparative and conservation biology. PNAS.116, 9658–9664. doi: 10.1073/pnas.1816367116
15
Dähne M. Gilles A. Lucke K. Peschko V. Adler S. Krügel K. et al . (2013). Effects of pile-driving on harbour porpoises (Phocoena phocoena) at the first offshore wind farm in Germany. Environ. Res. Lett.8, 25002. doi: 10.1088/1748-9326/8/2/025002
16
de Wit C. A. Bossi R. Dietz R. R. Dreyer A. Faxneld S. Garbus S. E. et al . (2020). Organohalogen compounds of emerging concern in Baltic Sea biota: Levels, biomagnification potential and comparisons with legacy contaminants. Environ. Int.144, 106037. doi: 10.1016/j.envint.2020.106037
17
Dietz R. Fort J. Sonne C. Albert C. Bustnes J. O. Christensen T. K. et al . (2021a). A risk assessment of the effects of mercury on Baltic Sea, Greater North Sea and North Atlantic wildlife, fish and bivalves. Environ. Int.146, 106178. doi: 10.1016/j.envint.2020.106178
18
Dietz R. Sonne C. Jenssen B. M. Das K. De Wit C. A. Harding K. C. et al . (2021b). The Baltic Sea: An ecosystem with multiple stressors. Environ. Internat.147, 106324. doi: 10.1016/j.envint.2020.106324
19
Erbe C. Reichmuth C. Cunningham K. Lucke K. Dooling R. (2016). Communication masking in marine mammals: A review and research strategy. Mar. pollut. Bull.103, 15–38. doi: 10.1016/j.marpolbul.2015.12.007
20
European Commission, DG MARE (2023). EU Action Plan: Protecting and restoring marine ecosystems for sustainable and resilient fisheries (Belgium: European Commission, 1049 Bruxelles/Brussel).
21
Galatius A. Kinze C. C. Teilmann J. (2012). Population structure of harbour porpoises in the Baltic region: evidence of separation based on geometric morphometric comparisons. J. Mar. Biol. Assoc. U. K.92, 1669–1676. doi: 10.1017/S0025315412000513
22
Gales N. Hindell M. Kirkwood R. (2003). Marine mammals: Fisheries, tourism and management issues (Locked Bag 10 Clayton South VIC 3169 Australia: CSIRO Publishing). doi: 10.1071/9780643090712
23
Genu M. Gilles A. Hammond P. S. Macleod K. Paillé J. Paradinas I. et al . (2021). Evaluating strategies for managing anthropogenic mortality on marine mammals: an R implementation with the package RLA. Front. Mar. Sci.8. doi: 10.3389/fmars.2021.795953
24
Gilles A. Authier M. Ramirez-Martinez N. C. Araújo H. Blanchard A. Carlström J. et al . (2023). Estimates of cetacean abundance in European Atlantic waters in summer 2022 from the SCANS-IV aerial and shipboard surveys. Available online at: https://www.tiho-hannover.de/itaw/scans-iv-survey.
25
Gilles A. Scheidat M. Siebert U. (2009). Seasonal distribution of harbour porpoises and possible interference of offshore wind farms in the German North Sea. Mar. Ecol. Prog. Ser.383, 295–307. doi: 10.3354/meps08020
26
Gkotsis G. Nika M. Nikolopoulou V. Alygizakis N. Bizani E. Aalizadeh R. et al . (2022). Assessment of contaminants of emerging concern in European apex predators and their prey by LC-QToF MS wide-scope target analysis. Environ. Internat.170, 107623. doi: 10.1016/j.envint.2022.107623
27
Habitats Directive (1992). Council Directive 92/43/EEC of 21 May 1992 on the conservation of natural habitats and of wild fauna and flora. Off. J. Eur. Union206, 7–50.
28
Hammond P. Berggren P. Benke H. Borchers D. Collet A. Heide-Jørgensen M. et al . (2002). Abundance of harbour porpoise and other cetaceans in the North Sea and adjacent waters. J. App. Ecol.39, 361–376. doi: 10.1046/j.1365-2664.2002.00713.x
29
Hammond P. S. Francis T. B. Heinemann D. Long K. J. Moore J. E. Punt A. E. et al . (2021a). Estimating the abundance of marine mammal populations. Front. Mar. Sci.8. doi: 10.3389/fmars.2021.735770
30
Hammond P. Lacey C. Gilles A. Viquerat S. Börjesson P. Herr H. et al . (2021b). Estimates of cetacean abundance in European Atlantic waters in summer 2016 from the SCANS-III aerial and shipboard surveys - Revised version. Available online at: https://scans3.wp.st-andrews.ac.uk/files/2021/06/SCANS-III_design-based_estimates_final_report_revised_June_2021.pdf (Accessed 18 July, 2023).
31
Hammond P. S. Macleod K. Berggren P. Borchers D. L. Burt L. Cañadas A. et al . (2013). Cetacean abundance and distribution in European Atlantic shelf waters to inform conservation and management. Biol. Conserv.164, 107–122. doi: 10.1016/j.biocon.2013.04.010
32
Hammond P. S. Paradinas I. Smout S. C. (2019). Development of a Removals Limit Algorithm (RLA) to set limits to anthropogenic mortality of small cetaceans to meet specified conservation objectives, with an example implementation for bycatch of harbour porpoise in the North Sea. JNCC Report No. 628, JNCC, Peterborough, ISSN 0963-8091. Available online at: https://data.jncc.gov.uk/data/8ac9a424-eda5-4062-957e-63d82d3e39cc/JNCC-Report-628-FINAL-WEB.pdf.
33
HELCOM . (2013). HELCOM Red List of Baltic Sea species in danger of becoming extinct. Balt. Sea Environ. Proc. No. 140 (Accessed 18 July, 2023).
34
HELCOM . (2023). Number of drowned mammals and waterbirds in fishing gear. HELCOM core indicator report. Available online at: https://indicators.helcom.fi/filtering/?topic=bycatch4247 (Accessed 18 July, 2023).
35
Hermannsen L. Beedholm K. Tougaard J. Madsen P. T. (2014). High frequency components of ship noise in shallow water with a discussion of implications for harbor porpoises (Phocoena phocoena). J. Acoust. Soc Am.136, 1640–1653. doi: 10.1121/1.4893908
36
Hiby L. (1999). “The objective identification of duplicate sightings in aerial survey for porpoise,” in Marine mammal survey and assessment methods (Balkema, Rotterdam), 179–189.
37
Hiby L. Lovell P. (1998). Using aircraft in tandem formation to estimate abundance of harbour porpoise. Biometrics54, 1280–1289. doi: 10.2307/2533658
38
Hovestadt T. Nowicki P. (2008). Process and measurement errors in population size: their mutual effects on precision and bias of estimates for demographic parameters. Biodiv Conserv.17, 3417–3429. doi: 10.1007/s10531-008-9426-0
39
IBPES . (2014). Summary for policymakers of the global assessment report on biodiversity and ecosystem services of the Intergovernmental Science-Policy Platform on Biodiversity and Ecosystem Services. DíazS.SetteleJ.BrondízioE. S.NgoH. T.GuèzeM.AgardJ.et al. (eds.) IPBES secretariat, (Bonn, Germany), doi: 10.5281/zenodo.3553579
40
ICES . (2014). Report of the working group on marine mammal ecology (WGMME) (Woods Hole, Massachusetts, USA: ICES CM), 232.
41
ICES . (2022). Herring (Clupea harengus) in subdivisions 20-24, spring spawners (Skagerrak, Kattegat, and western Baltic). In: Report of the ICES advisory committee 2022. ICES advice 2022, her.27.20-24 (Accessed 18 July, 2023).
42
ICES . (2023). Cod (Gadus morhua) in Subdivision 21 (Kattegat). In: Report of the ICES advisory committee 2023. ICES Advice 2023, cod.27.21. Available online at: doi: 10.17895/ices.advice.21820488 (Accessed 18 July, 2023).
43
IUCN Standards and Petitions Committee . (2022). Guidelines for Using the IUCN Red List Categories and Criteria. Version 15.1. Standards Petitions Committee. Downloadable. https://www.iucnredlist.org/documents/RedListGuidelines.pdf.
44
IWC . (2023). Grave concern for the survival of the vaquita porpoise. A statement from the Scientific Committee of the IWC. Available online at: https://iwc.int/resources/media-resources/news/first-ever-extinction-alert-from-the-iwc (Accessed 24 August, 2023).
45
Johnson D. S. Fritz L. (2014). agTrend: A Bayesian approach for estimating trends of aggregated abundance. Methods Ecol. Evol.5, 1110–1115. doi: 10.1111/2041-210X.12231
46
Jörundsdóttir H. Norström K. Olsson M. Pham-Tuan H. Hühnerfuss H. Bignert A. et al . (2006). Temporal trend of bis(4-chlorophenyl) sulfone, methylsulfonyl-DDE and -PCBs in Baltic guillemot (Uria aalge) egg 1971–2001 – A comparison to 4,4′-DDE and PCB trends. Environ. pollut.141, 226–237. doi: 10.1016/j.envpol.2005.08.054
47
Kesselring T. Viquerat S. Brehm R. Siebert U. (2017). Coming of age: - Do female harbour porpoises (Phocoena phocoena) from the North Sea and Baltic Sea have sufficient time to reproduce in a human influenced environment? PloS One12 (10), e0186951. doi: 10.1371/journal.pone.0186951
48
Kindt-Larsen L. Glemarec G. Berg C. W. Königson S. Kroner A.-M. Søgaard M. et al . (2023). Knowing the fishery to know the bycatch: bias-corrected estimates of harbour porpoise bycatch in gillnet fisheries. Proc. R. Soc B290, 20222570. doi: 10.1098/rspb.2022.2570
49
Kovacs K. M. Aguilar A. Aurioles D. Burkanov V. Campagna C. Gales N. et al . (2012). Global threats to pinnipeds. Mar. Mam. Sci.28, 414–426. doi: 10.1111/j.1748-7692.2011.00479.x
50
Lah L. Trense D. Benke H. Berggren P. Gunnlaugsson Þ. Lockyer C. et al . (2016). Spatially explicit analysis of genome-wide SNPs detects subtle population structure in a mobile marine mammal, the harbor porpoise. PloS One11, e0162792. doi: 10.1371/journal.pone.0162792
51
Laake J. L. Borchers D. L. (2004). Methods for incomplete detection at distance zero. Advanced Distance Sampling (Oxford), 108–189.
52
Lockyer C. Kinze C. C. (2003). Status, ecology and life history of harbour porpoises (Phocoena phocoena), in Danish waters. NAMMCO Sci. Publications5, 143–176. doi: 10.7557/3.2745c
53
Lucke K. Siebert U. Lepper P. A. Blanchet M. A. (2009). Temporary shift in masked hearing thresholds in a harbor porpoise (Phocoena phocoena) after exposure to seismic airgun stimuli. J. Acoust. Soc Am.125, 4060–4070. doi: 10.1121/1.3117443
54
Marine Strategy Framework Directive (2008). Directive 2008/56/EC of the european parliament and of the council. J. Council Decision 2008.
55
Marshall L. (2020). dssd: Distance Sampling Survey Design. R package version 0.2.0. R.
56
Miller A. Nyberg E. Danielsson S. Faxneld S. Haglund P. Bignert A. (2014). Comparing temporal trends of organochlorines in guillemot eggs and Baltic herring: Advantages and disadvantage for selecting sentinel species for environmental monitoring. Mar. Environ. Res.100, 38–47. doi: 10.1016/j.marenvres.2014.02.007
57
Mogensen L. M. W. Mei Z. Hao Y. Harrison X. A. Wang D. Turvey S. T. (2022). Precautionary principle or evidence-based conservation? Assessing the information content of threat data for the yangtze finless porpoise. Front. Mar. Sci.8. doi: 10.3389/fmars.2021.791484
58
Moore J. E. Heinemann D. Francis T. B. Hammond P. S. Long K. J. Punt A. E. et al . (2021). Estimating bycatch mortality for marine mammals: concepts and best practices. Front. Mar. Sci.8. doi: 10.3389/fmars.2021.752356
59
Nachtsheim D. A. Viquerat S. Ramírez-Martínez N. C. Unger B. Siebert U. Gilles A. (2021). Small cetacean in a human high-use area: Trends in harbour porpoise abundance in the North Sea over two decades. Front. Mar. Sci.7. doi: 10.3389/fmars.2020.606609
60
NAMMCO IMR (2019). Report of joint IMR/NAMMCO international workshop on the status of harbour porpoises in the north atlantic. Tromsø Norway.pp, 236.
61
Nelms S. E. Alfaro-Shigueto J. Arnould J. P. Y. Avila I. C. (2021). Marine mammal conservation: over the horizon. Endang Species Res.44, 291–325. doi: 10.3354/esr01115
62
Nielsen E. Richardson K. (1996). Can changes in the fisheries yield in the Kattegat, (1950–1992) be linked to changes in primary production? ICES J. Mar. Sci.53, 988–994. doi: 10.1006/jmsc.1996.0123
63
OSPAR . (2008). OSPAR List of Threatened and/or Declining Species and Habitats. Available at: http://www.ospar.org/eng/html/strategies/strategy-01.htm.WorldCat.
64
OSPAR North-East Atlantic Environment Strategy . (2030). OSPAR Secretariat (United Kingdom: The Aspect 12 Finsbury Square, London, EC2A 1AS). Available at: https://www.ospar.org/site/assets/files/1200/north-east_atlantic_environement_strategy_compiled.pdf.
65
Ouzoulias F. Bousquet N. Genu M. Gilles A. Spitz S. Authier M. (2024). Development of a new control rule for managing anthropogenic removals of protected, endangered or threatened species in marine ecosystems. PeerJ.12, e16688. doi: 10.7717/peerj.16688
66
Parra G. J. Bilgmann K. Peters K. J. Möller L. M. (2021). Abundance and potential biological removal of common dolphins subject to fishery impacts in south Australian waters. Front. Mar. Sci.8. doi: 10.3389/fmars.2021.617075
67
Pierce G. J. Petitguyot M. A. C. Gutiérrez-Muñoz P. Fernández-Fernández D. Fariñas-Bermejo A. Read F. L. et al . (2022). Iberian harbour porpoise - an update on fishery bycatch mortality. Paper SC/68D/HIM/10. Report of the International Whaling Commission 67 (INTERNATIONAL WHALING COMMISSION THE RED HOUSE, 135 STATION ROAD, IMPINGTON, CAMBRIDGESHIRE, CB24 9NP).
68
Popov D. Meshkova G. Vishnyakova K. Ivanchikova J. Paiu M. Timofte C. et al . (2023). Assessment of the bycatch level for the Black Sea harbour porpoise in the light of new data on population abundance. Front. Mar. Sci.10. doi: 10.3389/fmars.2023.1119983
69
Punt A. E. Donovan G. P. (2007). Developing management procedures that are robust to uncertainty: lessons from the international whaling commission. ICES J. Mar. Sci.64, 603–612. doi: 10.1093/icesjms/fsm035
70
R Core Team . (2021). R: A language and environment for statistical computing (Vienna, Austria: R Foundation for Statistical Computing). Available at: https://www.R-project.org/.
71
R Core Team . (2018). R: A language and environment for statistical computing (Vienna, Austria: R Foundation for Statistical Computing). Available at: https://www.R-project.org/.
72
Read A. J. Drinker P. Northridge S. (2006). Bycatch of marine mammals in U.S. and Global Fisheries. Conserv. Biol.20, 163–169. doi: 10.1111/j.1523-1739.2006.00338.x
73
Reeves R. R. McClellan K. Werner T. B. (2013). Marine mammal bycatch in gillnet and other entangling net fisheries 1990 to 2011. Endanger. Species Res.20, 71–97. doi: 10.3354/esr00481
74
Rojas-Bracho L. Taylor B. Booth C. Thomas L. Jaramillo-Legorreta A. Nieto-García E. et al . (2022). More vaquita porpoises survive than expected. Endanger. Species Res.48, 225–234. doi: 10.3354/esr01197
75
Santos M. B. Pierce G. J. (2015). Marine mammals and good environmental status: science, policy and society; challenges and opportunities. Hydrobiologia750, 13–41. doi: 10.1007/s10750-014-2164-2
76
Scheidat M. Gilles A. Kock K. H. Siebert U. (2008). Harbour porpoise Phocoena phocoena abundance in the southwestern Baltic Sea. Endanger. Species Res.5, 215–223. doi: 10.3354/esr00161
77
Sharpe M. Berggren P. (2023) Phocoena phocoena (Europe assessment). The IUCN Red List of Threatened Species 2023 (Accessed 14 February 2024).
78
Siebert U. Pawliczka I. Benke H. von Vietinghoff V. Wolf P. Pilāts. V. et al . (2020). Health assessment of harbour porpoises (Phocoena Phocoena) from Baltic area of Denmark, Germany, Poland and Latvia. Environ. Internat.143, 105904. doi: 10.1016/j.envint.2020.105904
79
Siebert U. Stürznickel J. Schaffeld T. Oheim R. Rolvien T. Prenger-Berninghoff E. et al . (2022). Blast injury on harbour porpoises (Phocoena phocoena) from the Baltic Sea after explosions of deposits of World War II ammunition. Environ. Int.159, 107014. doi: 10.1016/j.envint.2021.107014
80
Slooten E. Dawson S. Rayment W. Childerhouse S. (2006). A new abundance estimate for Maui’s dolphin: What does it mean for managing this critically endangered species? Biol. Conserv.128, 576–581. doi: 10.1016/j.biocon.2005.10.013
81
Stenson G. B. Hammill M. Ferguson S. Stewart R. Doniol-Valcroze T. (2012). Applying the precautionary approach to marine mammal harvests in Canada DFO. Can. Sci. Advisory Secretariat Res. Document2012/107, ii + 15.
82
Sveegaard S. Andreasen H. Mouritsen K. N. Jeppesen J. P. Teilmann J. (2012). Correlation between the seasonal distribution of harbour porpoises and their prey in the Sound, Baltic Sea. Mar. Biol.159, 1029–1037. doi: 10.1007/s00227-012-1883-z
83
Sveegaard S. Galatius A. Dietz R. Kyhn L. Koblitz J. C. Amundin M. et al . (2015). Defining management units for cetaceans by combining genetics, morphology, acoustics and satellite tracking. Glob. Ecol. Conserv.3, 839–850. doi: 10.1016/j.gecco.2015.04.002
84
Sveegaard S. Teilmann J. Tougaard J. Dietz R. Mouritsen K. N. Desportes G. et al . (2011). High-density areas for harbor porpoises (Phocoena phocoena) identified by satellite tracking. Mar. Mam. Sci.27, 230–246. doi: 10.1111/j.1748-7692.2010.00379.x
85
Taylor N. Authier M. Banga R. Genu M. Macleod K. Gilles A. (2022). Marine mammal by-catch. OSPAR 2023: the 2023 quality status report for the northeast atlantic (London: OSPAR Commission). Available at: https://oap.ospar.org/en/ospar-assessments/quality-status-reports/qsr-2023/indicator-assessments/marine-mammal-bycatch.
86
Taylor B. L. Martinez M. Gerrodette T. Barlow J. Hrovat Y. N. (2007). Lessons from monitoring trends in abundance of marine mammals. Mar. Mammal Sci.23, 157–175. doi: 10.1111/j.1748-7692.2006.00092.x
87
Thomas L. Buckland S. T. Rexstad E. A. Laake J. L. Strindberg S. Hedley S. L. et al . (2010). Distance software: design and analysis of distance sampling surveys for estimating population size. J. Appl. Ecol.47 (1), 5–14. doi: 10.1111/j.1365-2664.2009.01737.x
88
Unger B. Nachtsheim D. Ramirez-Martinez N. C. Siebert U. Sveegard S. Kyhn L. A. et al . (2021). MiniSCANS II: Aerial survey for harbour porpoises in the western Baltic Sea, Belt Sea, the Sound and Kattegat in 2020 (Germany, Denmark, Sweden). Available online at: https://www.tiho-hannover.de/en/clinics-institutes/institutes/institute-of-terrestrial-and-aquatic-wildlife-research-itaw/research/projects-aquatic/completed-projects-aquatic/projects-aquatic-completed-between-2015-and-2020/miniscans-ii-aerial-survey-for-harbour-porpoises-in-the-western-baltic-sea-belt-sea-the-sound-and-kattegat-in-2020 (Accessed 05 February 2024).
89
Vinther M. Larsen F. (2004). Updated estimates of harbour porpoise (Phocoena phocoena) bycatch in the Danish North Sea bottom-set gillnet fishery. J. Cetacean Res. Manage.6, 19–24. doi: 10.47536/jcrm.v6i1.785
90
Viquerat S. Herr H. Gilles A. Peschko V. Siebert U. Sveegaard S. et al . (2014). Abundance of harbour porpoises (Phocoena phocoena) in the western Baltic, Belt Seas and Kattegat. Mar. Biol.161, 745–754. doi: 10.1007/s00227-013-2374-6
91
Wade P. R. (1998). Calculating limits to the allowable human-caused mortality of cetaceans and pinnipeds. Mar. Mam. Sci.14, 1–37. doi: 10.1111/j.1748-7692.1998.tb00688.x
92
Wade P. R. Long K. J. Francis T. B. Punt A. E. Hammond P. S. Heinemann D. et al . (2021). Best practices for assessing and managing bycatch of marine mammals. Front. Mar. Sci.8. doi: 10.3389/fmars.2021.757330
93
Wiemann A. Andersen L. W. Berggren P. Siebert U. Benke H. Teilmann J. et al . (2010). Mitochondrial Control Region and microsatellite analyses on harbour porpoise (Phocoena phocoena) unravel population differentiation in the Baltic Sea and adjacent waters. Conserv. Genet.11, 195–211. doi: 10.1007/s10592-009-0023-x
94
Wisniewska D. M. Johnson M. Teilman J. Rojano-Donate L. Shearer J. Sveegaard S. et al . (2016). Ultra-high foraging rates of harbor porpoises make them vulnerable to anthropogenic disturbance. Curr. Biol.26, 1441–1446. doi: 10.1016/j.cub.2016.03.069
95
Wisniewska D. M. Johnson M. Teilmann J. Rojano-Donãate L. Shearer J. Sveegaard S. et al . (2018b). Response to “Resilience of harbor porpoises to anthropogenic disturbance: must they really feed continuously? Mar. Mammal Sci.34, 265–270. doi: 10.1111/mms.12463
96
Wisniewska D. M. Johnson M. Teilmann J. Siebert U. Galatius A. Dietz R. et al . (2018a). High rates of vessel noise disrupt foraging in wild harbour porpoises (Phocoena phocoena). Proc. R. Soc B285, 20172314. doi: 10.1098/rspb.2017.2314
97
Wright A. J. Maar M. Mohn C. Nabe-Nielsen J. Siebert U. Jensen J. F. et al . (2013). Possible causes of a harbour porpoise mass stranding in danish waters in 2005. PloS One8, e55553. doi: 10.1371/journal.pone.0055553
Summary
Keywords
Baltic Sea, bycatch, cetacean, distance sampling, monitoring, Phocoena phocoena , SCANS, conservation
Citation
Owen K, Gilles A, Authier M, Carlström J, Genu M, Kyhn LA, Nachtsheim DA, Ramírez-Martínez NC, Siebert U, Sköld M, Teilmann J, Unger B and Sveegaard S (2024) A negative trend in abundance and an exceeded mortality limit call for conservation action for the Vulnerable Belt Sea harbour porpoise population. Front. Mar. Sci. 11:1289808. doi: 10.3389/fmars.2024.1289808
Received
06 September 2023
Accepted
16 February 2024
Published
07 March 2024
Volume
11 - 2024
Edited by
Porter Hoagland, Woods Hole Oceanographic Institution, United States
Reviewed by
Sacha Viquerat, Alfred Wegener Institute Helmholtz Centre for Polar and Marine Research (AWI), Germany
Di Jin, Woods Hole Oceanographic Institution, United States
Updates
Copyright
© 2024 Owen, Gilles, Authier, Carlström, Genu, Kyhn, Nachtsheim, Ramírez-Martínez, Siebert, Sköld, Teilmann, Unger and Sveegaard.
This is an open-access article distributed under the terms of the Creative Commons Attribution License (CC BY). The use, distribution or reproduction in other forums is permitted, provided the original author(s) and the copyright owner(s) are credited and that the original publication in this journal is cited, in accordance with accepted academic practice. No use, distribution or reproduction is permitted which does not comply with these terms.
*Correspondence: Kylie Owen, kylie.owen@nrm.se
†These authors share first authorship
Disclaimer
All claims expressed in this article are solely those of the authors and do not necessarily represent those of their affiliated organizations, or those of the publisher, the editors and the reviewers. Any product that may be evaluated in this article or claim that may be made by its manufacturer is not guaranteed or endorsed by the publisher.