 Andrew R. Thompson1*
 Rasmus Swalethorp2
 Michaela Alksne3
 Jarrod A. Santora4
 Elliott L. Hazen5
 Andrew Leising5
 Erin Satterthwaite2,6
 William J. Sydeman7
 Clarissa R. Anderson8
 Toby D. Auth9
 Simone Baumann-Pickering3
 Timothy Baumgardner10
 Eric P. Bjorkstedt11,12
 Steven J. Bograd5
 Noelle M. Bowlin1
 Brian J. Burke13
 Elizabeth A. Daly14
 Heidi Dewar1
 John C. Field4Jennifer L. Fisher17Newell Garfield5
 Ashlyn Gidding15Ralf Goericke2Richard Golightly16
 Eliana Gómez-Ocampo10
 Jose Gomez-Valdes10John A. Hildebrand15
 Kym C. Jacobson17
 Michael G. Jacox5,18
 Jaime Jahncke19
 Michael Johns19Joshua M. Jones15
 Bertha Lavaniegos10
 Nate Mantua4
 Gerard J. McChesney20Megan E. Medina8
 Sharon R. Melin21Luis Erasmo Miranda10
 Cheryl A. Morgan14
 Catherine F. Nickels1,22
 Rachael A. Orben23
 Jessica M. Porquez24Antonella Preti1,22
 Roxanne R. Robertson24
 Daniel L. Rudnick25
 Keith M. Sakuma4
 Carley R. Schacter16
 Isaac D. Schroeder4Lauren Scopel16
 Owyn E. Snodgrass1
 Sarah Ann Thompson7
 Pete Warzybok19Katherine Whitaker2
 William Watson1
 Edward D. Weber1
 Brian Wells4,17
- 1Fisheries Resources Division, National Marine Fisheries Service, Southwest Fisheries Science Center, La Jolla, CA, United States
- 2Scripps Institution of Oceanography, University of California, San Diego, La Jolla, CA, United States
- 3Scripps Acoustic Ecology Lab, Scripps Institution of Oceanography, University of California, San Diego, La Jolla, CA, United States
- 4Fisheries Ecology Division, National Marine Fisheries Service, Southwest Fisheries Science Center, Santa Cruz, CA, United States
- 5Environmental Research Division, National Marine Fisheries Service, Southwest Fisheries Science Center, Monterey, CA, United States
- 6California Sea Grant, Scripps Institution of Oceanography, University of California, San Diego, La Jolla, CA, United States
- 7Farallon Institute, Petaluma, CA, United States
- 8Southern California Coastal Ocean Observing System, Scripps Institution of Oceanography, University of California, San Diego, La Jolla, CA, United States
- 9Pacific States Marine Fisheries Commission, Hatfield Marine Science Center, Newport, OR, United States
- 10Facultad de Ciencias Marinas, Universidad Autonoma de Baja California, Ensenada, Mexico
- 11Fisheries Ecology Division, National Marine Fisheries Service, Southwest Fisheries Science Center, Arcata, CA, United States
- 12Department of Fisheries Biology, Cal Poly Humboldt, Arcata, CA, United States
- 13Fish Ecology Division, National Marine Fisheries Service, Northwest Fisheries Science Center, Seattle, WA, United States
- 14Fish Ecology Division, National Marine Fisheries Service, Northwest Fisheries Science Center, Hatfield Marine Science Center, Newport, OR, United States
- 15Cooperative Institute for Marine Ecosystem Resources Studies, Oregon State University Hatfield Marine Science Center, Newport, OR, United States
- 16Department of Wildlife, Cal Poly Humboldt, Arcata, CA, United States
- 17Department of Wildlife, Humboldt State University, Arcata, CA, United States
- 18Physical Sciences Laboratory, National Oceanic and Atmospheric Administration, Boulder, CO, United States
- 19Point Blue Conservation Science, Petaluma, CA, United States
- 20U.S. Fish and Wildlife Service, San Francisco Bay National Wildlife Refuge Complex, Fremont, CA, United States
- 21Marine Mammal Laboratory, National Marine Fisheries Service, Alaska Fisheries Science Center, Seattle, WA, United States
- 22Institute of Marine Studies, University of California, Santa Cruz, Santa Cruz, CA, United States
- 23Department of Fisheries, Wildlife, and Conservation Sciences, Oregon State University, Hatfield Marine Science Center, Newport, OR, United States
- 24Cooperative Institute for Marine, Earth, and Atmospheric Systems, Cal Poly Humboldt, Arcata, CA, United States
- 25Climate, Atmospheric Science & Physical Oceanography Division, Scripps Institution of Oceanography, University of California, San Diego, La Jolla, CA, United States
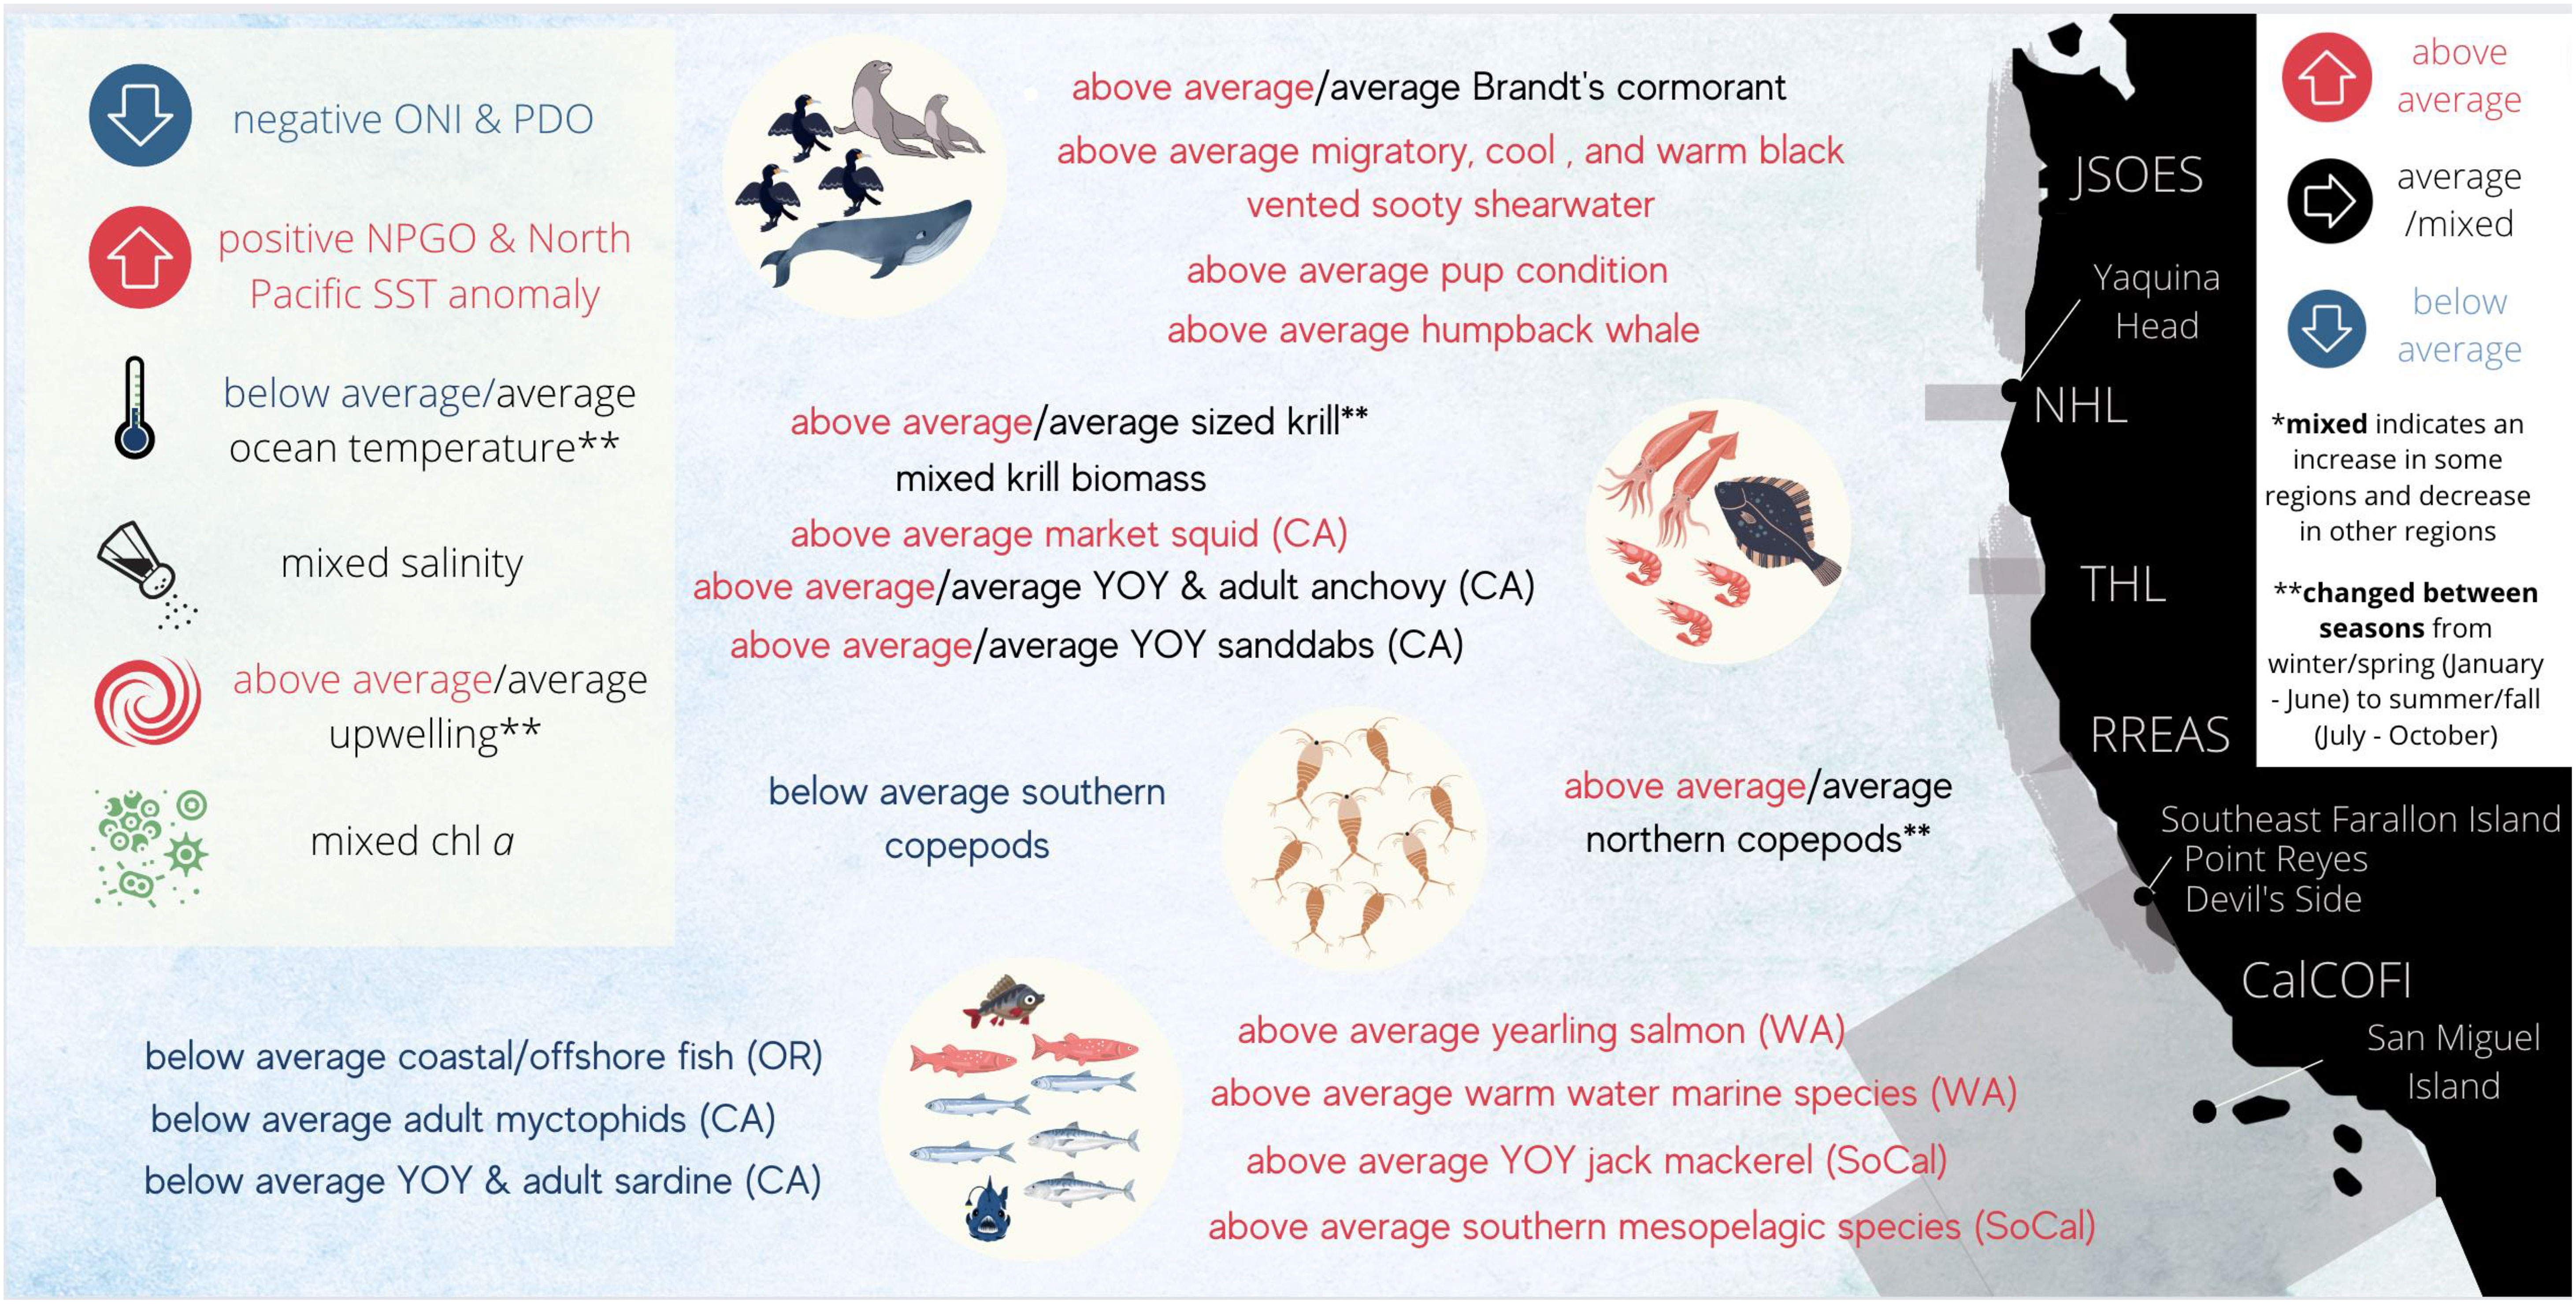
2022 marked the third consecutive La Niña and extended the longest consecutive stretch of negative Oceanic Niño Index since 1998-2001. While physical and biological conditions in winter and spring largely adhered to prior La Niña conditions, summer and fall were very different. Similar to past La Niña events, in winter and spring coastal upwelling was either average or above average, temperature average or below average, salinity generally above average. In summer and fall, however, upwelling and temperature were generally average or slightly below average, salinity was close to average and chlorophyll a was close to average. Again, as during prior La Niña events, biomass of northern/southern copepods was above/below average off Oregon in winter, and body size of North Pacific krill in northern California was above average in winter. By contrast, later in the year the abundance of northern krill dropped off Oregon while southern copepods increased and body sizes of North Pacific krill fell in northern California. Off Oregon and Washington abundances of market squid and Pacific pompano (indicators of warm, non-typical La Niña conditions) were high. In the 20th century, Northern anchovy recruitment tended to be high during cold conditions, but despite mostly warm conditions from 2015-2021 anchovy populations boomed and remained high in 2022. Resident seabird reproductive success, which tended in the past to increase during productive La Niña conditions was highly variable throughout the system as common murre and pelagic cormorant, experienced complete reproductive failure at Yaquina Head, Oregon while Brandt’s cormorant reproduction was average. At three sampling locations off central California, however, common murre reproduction was close to or above average while both pelagic and Brandt’s cormorant were above average. California sealion reproduction has been above average each year since 2016, and pup weight was also above average in 2022, likely in response not to La Niña or El Niño but continuous high abundance of anchovy. The highly variable and often unpredictable physical and biological conditions in 2022 highlight a growing recognition of disconnects between basin-scale indices and local conditions in the CCE. “July-December 2022 is the biggest outlier from individual “strong” La Niña (events) ever going back to the 50s.” – Nate Mantua
Graphical Abstract
Introduction
Basin scale indices of ocean condition have the potential to inform biological dynamics at regional scales (Hallett et al., 2004). Since the early 1980s expectations have formed regarding the biological implications of El Niño and La Niña conditions throughout the world (Cobb et al., 2013; Timmermann et al., 2018; Broughton et al., 2022). NOAA’s National Weather Service declares that the ocean is in an El Niño/La Niña state when the 3-month average sea surface temperature anomaly exceeds/falls below 0.5°C of average (between 1971 and 2000) in the east-central equatorial Pacific (5°N to 5°S and 170°W to 120°W) for five consecutive months. In El Niño years the northern and southern (poleward of 20°) Pacific Ocean tends to be relatively warm off the western coasts of North and South America but cool in the western Pacific and vice versa in La Niña years. In the California Current Ecosystem (CCE), which covers the coast of North America between Vancouver Island, Canada and southern Baja California Sur, Mexico (Figure 1), the flow of the eastern boundary California Current, and upwelling tend to be high during La Niña events (Bond et al., 2008). This results in high nutrient input and generates cool, productive conditions that, for example, facilitate the increased spawning output, growth and survival of many zooplankton species such as North Pacific krill Euphasia pacifica and Thysanoessa spinifera that are important prey for juvenile salmon leaving their natal rivers and entering the ocean for the first time (Peterson et al., 2014). 2022 represented the third consecutive La Niña year, and our goal here is to evaluate oceanographic and biological conditions in the CCE to determine if the system was similar to prior La Niña events (Bond et al., 2008).
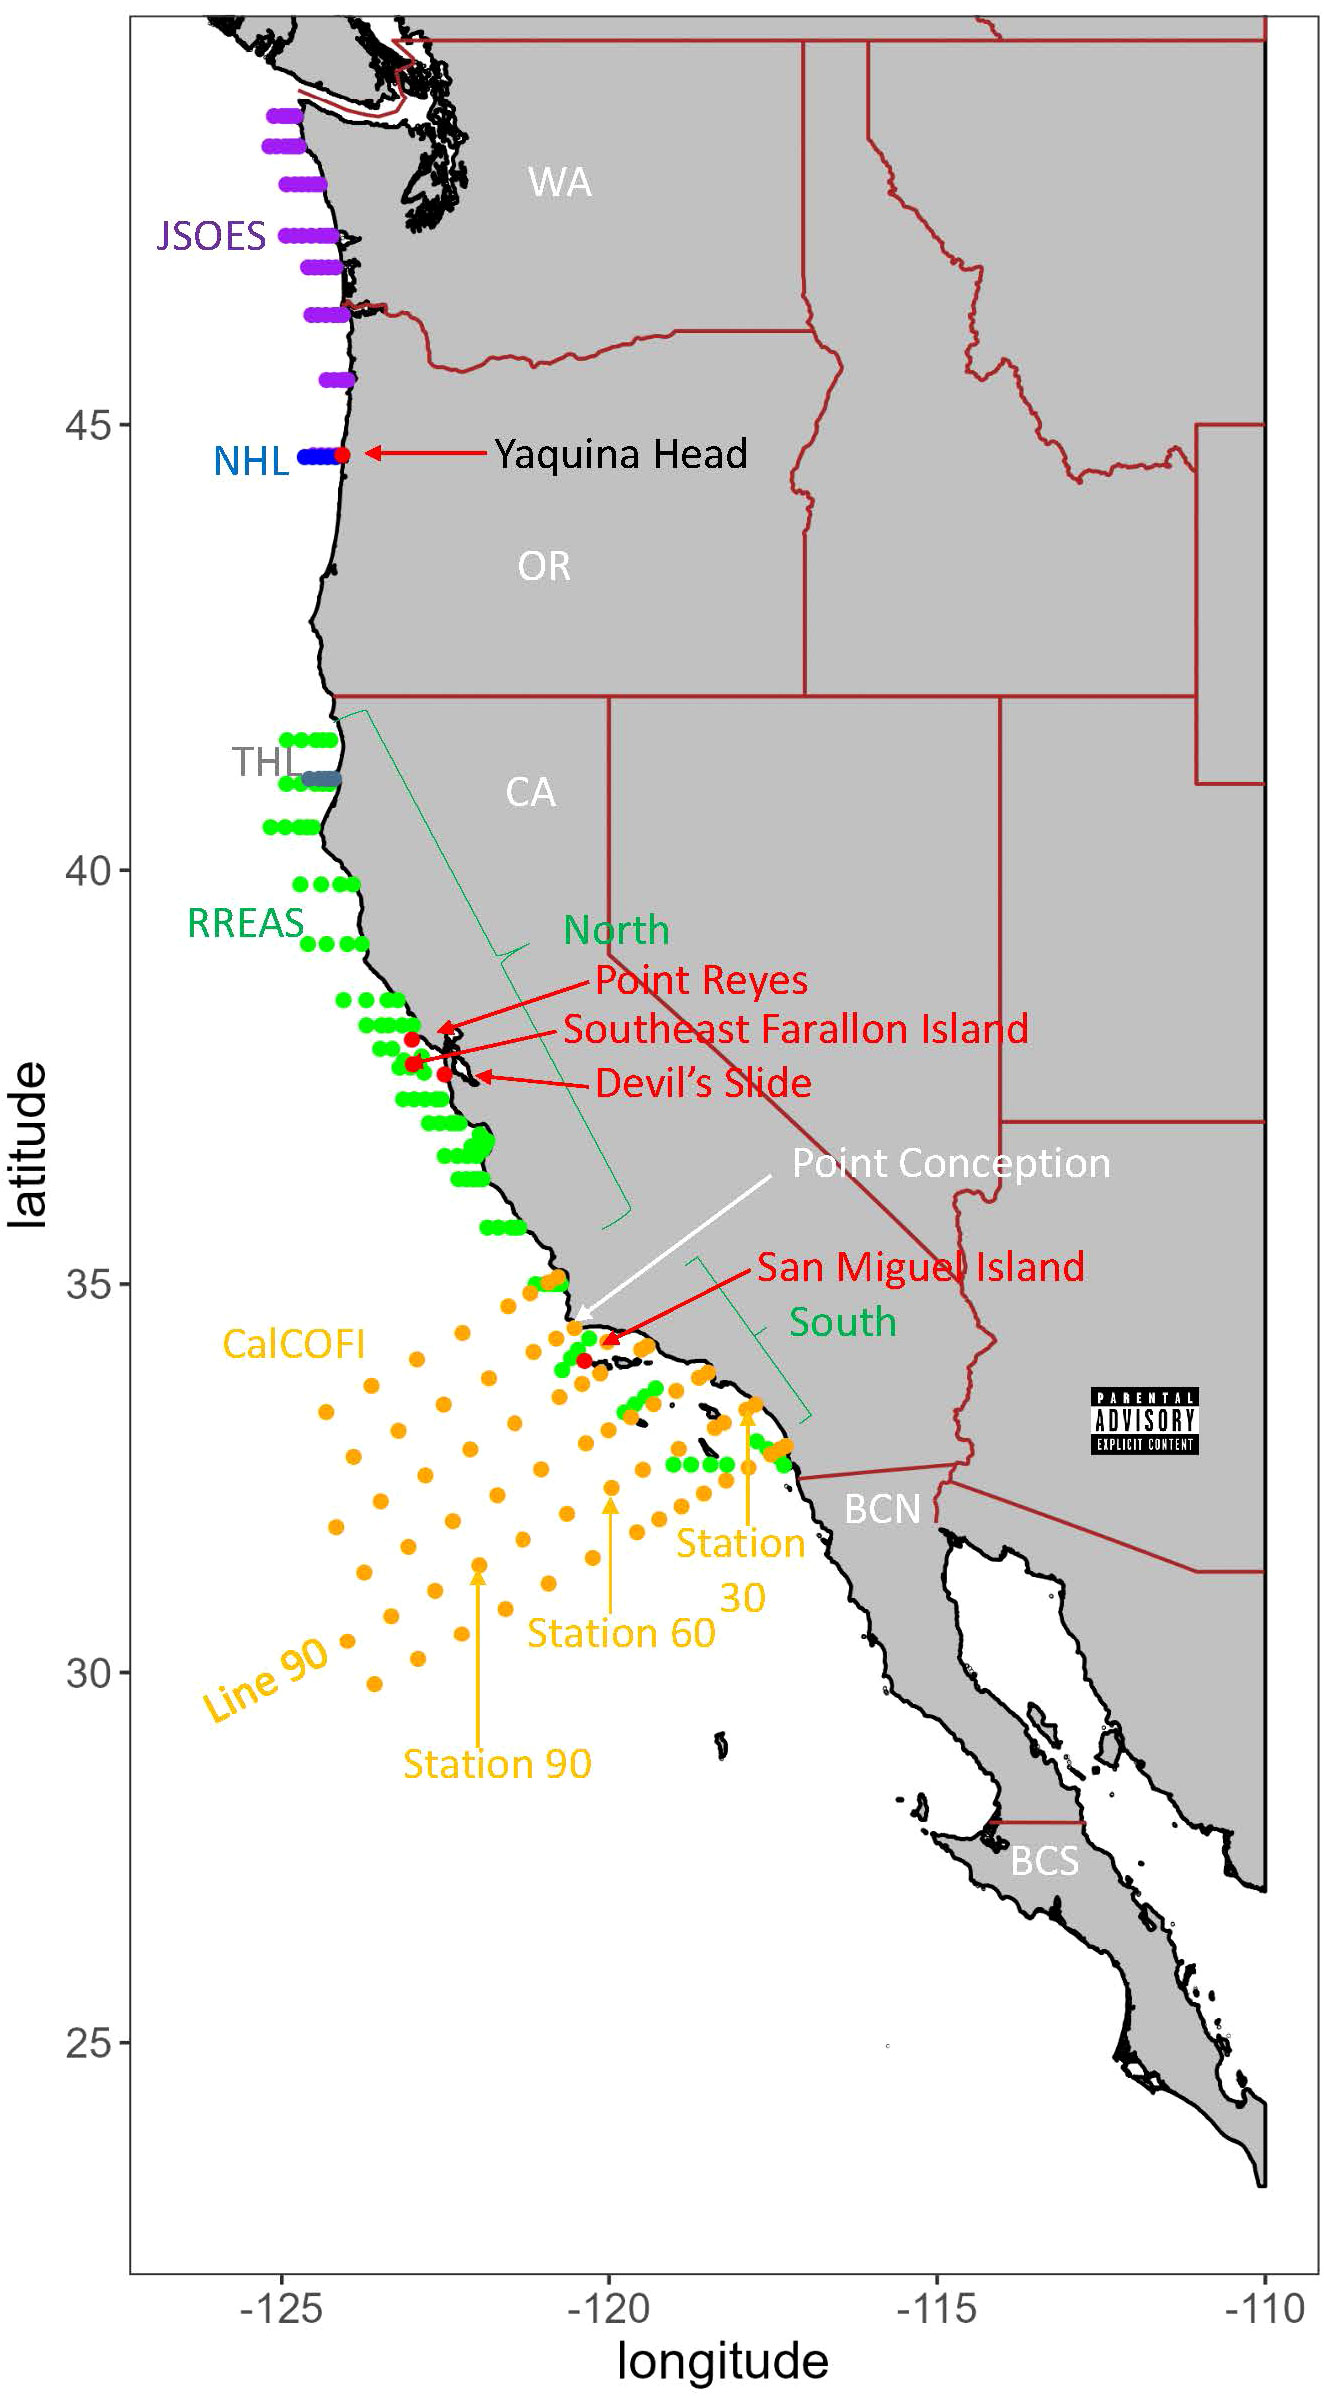
Figure 1 Map of sampling locations. The following are sea-going surveys: Purple is the Juvenile Salmon Ocean Ecosystem Survey (JSOES), blue is the Newport Hydrographic Line (NHL), green is the Rockfish Recruitment and Ecosystem Assessment Survey (RREAS), grey is the Trinidad Head Line (THL), and orange is the California Cooperative Oceanic Fisheries Investigation (CalCOFI) survey. Red dots are land-based surveys for birds (Yaquina Head, Point Reyes and Devil’s Slide) and sea lions (San Miguel Island). States and landmarks are in white font: WA is Washington, OR is Oregon, CA is California, BCN is Baja California Norte, and BCS is Baja California Sur.
In the past, there was general consensus of the expected physical and biological conditions in the CCE during La Niña events (Bond et al., 2008). For example, northerly winds that induce upwelling were typically high and the onset of these winds (i.e., spring transition) was early in the year. This upwelling brings cold, saline and nutrient rich water to the surface. The nutrients fuel primary production and thus chlorophyll was high. At the secondary trophic level, large, northern, lipid-rich zooplankton abundance tended to be more abundant than smaller, southern zooplankton. Fish species that feed on the larger zooplankton (e.g.), tended to experience high survival during La Niña. In addition, recruitment of anchovy seemed to increase during the cold La Niña events while sardine recruitment may have been lower (Chavez et al., 2003). Many apex predators such as sea birds and marine mammals tended to have high reproductive success during the productive La Niña conditions (Jones et al., 2018; Laake et al., 2018; Pistorius et al., 2023).
Despite the common use of El Niño/La Niña to predict biological dynamics, it has become increasingly clear that the way El Niño and La Niña manifest locally can change through time (Park et al., 2012; Yeo et al., 2012; Yu et al., 2012; Jo et al., 2015; Ohlberger et al., 2022; Hong and Hsu, 2023). For example, Yu et al. (2012) found that Eastern Pacific types of El Niños were more common prior to 1990 but Central Pacific El Niño events were predominant from 1990-2009. Both Eastern Pacific and Central Pacific El Niño events begin with warming at the equator, but the Eastern versions form closer to South America and tend to propagate warm water to higher latitudes than the central counterparts (Capotondi et al., 2015; Lilly and Ohman, 2021). Within the CCE, El Niño type can greatly affect local biological conditions, and different zooplankton communities emerge under Eastern Pacific versus Central Pacific El Niño events (Chavez et al., 2002; Lilly and Ohman, 2018; Lilly and Ohman, 2021). Furthermore, marine heatwaves (MHW), which are becoming more frequent worldwide (Jacox et al., 2020; Jacox et al., 2022), can dampen teleconnection between tropical and higher-latitude conditions. Indeed, despite Niño-neutral conditions in 2017 summer surface water temperature was 3-4° C above average off Peru and Ecuador, and this event was called a “coastal” El Niño (Echevin et al., 2018).
Local conditions occurring under another popular basin-scale indicator, the Pacific Decadal Oscillation (PDO) are also proving to be highly dynamic (Litzow et al., 2020a). The PDO is a multivariate index characterizing variability in sea surface temperature anomaly in the north Pacific (Mantua et al., 1997). It is high when water is relatively warmer in the eastern than the western Pacific and vice versa. At decadal time scales, high and low PDO periods tend to cluster resulting in conditions termed warm and cold regimes, respectively. These warm and cold PDO regimes have been tied to biological events such as periods with low and high anchovy or sardine abundances (Chavez et al., 2003). However, Litzow et al. (2020a) found that beginning in 1989 there has been increasing disconnect between the value and even the magnitude of the PDO and SST anomalies in both the Bering Sea and the CCE. The persistent north Pacific MHWs changed the meaning of the PDO in southern California so fundamentally that Werb and Rudnick (2023) questioned its utility as an index that can be used to predict biological dynamics.
The potential for nonstationary local relationships under El Niño/La Niña or warm/cold PDO regimes necessitates continuous monitoring of both physical and biological conditions in marine ecosystems to understand ecosystem status and make sensible ecosystem-based management decisions. The State of the California Current Ecosystem Report has been documenting ecosystem conditions in the CCE every year since 1993. Here, we again report on trends in physical oceanography, phytoplankton, pelagic invertebrate zooplankton, fish, birds, and marine mammals. Our goal is to explicitly compare physical and biological features of the CCE to determine how the system in 2022 compared to past strong La Niña events occurring over the past half century.
Methods
The State of the California Current Ecosystem Report synthesizes data from a myriad of satellite observations and land or ship-based surveys that have proven over the years to be insightful indicators of the physical or biological status of the CCE (McClatchie et al., 2016b; Thompson et al., 2019b; Weber et al., 2021). The methodology of each survey (Figure 1) has been well described elsewhere, and here we provide a brief summary of each data source as well as a reference for each that provides details on data collection. We present time series of anomalies for most of the analyzed variables. For each variable we first calculated the long term mean across all sample points and then subtracted the given value from the mean. We then qualitatively described whether the value in 2022 was average (at or very close to the mean), below or above average.
Pacific climate indices
We obtained time series of the Oceanic Niño Index (ONI) and the Pacific Decadal Oscillation (PDO) and North Pacific Gyre Oscillation (NPGO) indices from the California Current Integrated Ecosystem website (https://oceanview.pfeg.noaa.gov/dashboard/). The ONI is a three-month running mean of SST anomalies averaged within and around the equator at 5°S-5°N and 120°W-170°W. The PDO is the first eigenvector of a Principal Components Analysis of sea surface temperature in 5° x 5° grids throughout the North Pacific (Mantua et al., 1997). The NPGO is the second eigenvector of sea surface height (SSH) throughout this same region (Di Lorenzo et al., 2008).
Next, we examined broad trends in SST in the North Pacific. First, we plotted a time series of Hadley SST (https://www.metoffice.gov.uk/hadobs/hadisst/) with a five-month running mean of SST anomalies averaged over 30°N-60°N and 120°E-110°W to describe dynamics of SST throughout the North Pacific. Next, we focused on the California Current Ecosystem by plotting five-month running means of area average SST anomalies over 30-48°N along the coast out to 150 km.
To visualize spatial distribution of SST in the Pacific, we created figures of seasonal averages of SST and wind anomalies from winter, spring, summer and fall 2022 using data from NCAR/NCEP Reanalysis (downloads.psl.noaa.gov/Datasets/ncep.reanalysis/Monthlies/surface/).
To contextualize the strength of the 2022 La Niña relative to past La Niñas, we created a figure showing the average SST anomaly during the ten strongest La Niñas from 1991-2020 versus the SST anomalies in 2022 in the first and second halves of the year. We noted that conditions seemed to vary greatly in the first and second halves of 2022 and thus created separate plots for January to June and July to December.
Marine heatwave update
Since the onset of the 2013 North Pacific Marine Heatwave (MHW), these events, as defined by Hobday et al. (2016), have been present near constantly in the North Pacific (Weber et al., 2021), and 2022 was no exception. We compared the duration and intensity of the 2022 MHW at two spatial scales. First, we evaluated the size and duration of the 2022 MHW relative to the 235 MHWs recorded since 1982 at the scale of the North Pacific. Next, we examined the amount of area in the North Pacific that contained a MHW through time in 2022. To evaluate the presence of MHW’s in the CCE, we demarcated the proportion of the ocean from the shore to the seaward edge of the Economic Exclusive Zone (EEZ; 370 km) that included a MHW. We further discerned the evolution of MHWs in the CCE by plotting against day of the year the proportion of the EEZ with a MHW in 2022, and in recent years with MHWs (2021, 2020, 2019 and 2014). Finally, we plotted the total area of MHWs in 2022 per day along with the same four years as the previous graph.
Upwelling and primary production
We evaluated upwelling strength by plotting SST anomalies from the coast out to 75 km from shore from 47°N to 31°N between January 2017 and December 2022. We coupled this panel with anomalies of the Biologically Effective Upwelling Transport Index (BEUTI), which estimates vertical flux of nitrate to the mixed layer, over the same temporal and spatial extent (Jacox et al., 2018). Next, we examined how cumulative upwelling progressed on a daily basis in 2022 versus the long-term average and the most recent three years. Here, we examined the Coastal Upwelling Transport Index at 47°N, 45°N, 42°N, 39°N, 36°N, and 33°N. In addition, we plotted images onto a 0.1° ×0.1° grid of spring (March–May) chlorophyll a anomalies from 2020–2022 relative to 2003–2022. We obtained satellite-derived (Aqua MODIS) chlorophyll a data off the west coast of the United States from https://coastwatch.pfeg.noaa.gov/erddap/griddap/erdMH1chlamday.
Regional temperature, salinity and chlorophyll a
We compared anomalies of temperature, salinity and chlorophyll from various locations within the CCE. Anomalies were calculated from in-situ measurements along the Newport Hydrographic Line (NHL; Figure 1) at stations 5 and 50 (Auth et al., 2018), Trinidad Head Line (THL; Figure 1) at station 2 (Robertson and Bjorkstedt, 2020), and CalCOFI (Figure 1) Line 90 at stations 30, 60 and 90 (Robidas, 2023). For CalCOFI, we analyzed CTD data that has been sampled at 1-m depth intervals since 2003. In each location, we evaluated conditions relatively shallow (NHL: 50 m, THL: 15 m, and CalCOFI: mean 0-50 m) and deep (NHL: 150 m, THL: 65 m and CalCOFI: mean 151-200 m) in the water column. There was no winter CalCOFI cruise in 2022 due to issues with covid and staffing.
Regional zooplankton
Three indices of zooplankton were collected throughout the CCE. At the NHL, we evaluated biomass anomalies of northern and southern copepods collected with bongo nets deployed to 100 m (Peterson et al., 2014). We also analyzed anomalies of adult body size and total biomass of North Pacific krill collected along the THL with Bongo nets deployed to 100 m (Robertson and Bjorkstedt, 2020). Finally, total krill biomass anomalies were measured north and south of Point Conception using data from midwater trawls (30 m, 15 min) collected by the Rockfish Recruitment and Ecosystem Assessment Survey (RREAS; Figure 1) (Sakuma et al., 2016).
Regional fish and market squid
Various life stages of fish were sampled throughout the CCE (Gallo et al., 2022). Here, we focus, from north to south, on the Juvenile Salmon and Ocean Ecosystem Survey (JSOES; Figure 1), the NHL, the RREAS and CalCOFI. In each survey we delineated fishes from particular habitat types (e.g., coastal, northern versus southern offshore from NHL) that in the past were observed to respond in at least somewhat of a predictable fashion to basin-scale dynamics (Thompson et al., 2022b). Furthest north, JSOES conducted horizontal net tows in the upper 20 m of the water column during the day. Although many fishes were caught through JSOES spring sampling (Barcelo et al., 2018), we examined abundance anomalies from just those that reside near the surface during the day and do not undergo diel vertical migration. We also distinguished fishes with marine versus anadromous life histories from JSOES. Off the NHL, ichthyoplankton were collected every two weeks with bongo nets from January to March (Daly et al., 2013). The RREAS (Figure 1) conducted 15 minute tows at 30 m depth in early summer (Schroeder et al., 2019) off California since 2004. We categorized RREAS fishes into adult or young of the year (YOY) life phases and plotted standardized abundance time series north and south of Point Conception (Santora et al., 2021; Schroeder et al., 2022). The CalCOFI survey has been sampling quarterly off central and southern California consistently since 1951 using a ring net from 1951-1976 and then a bongo net from 1977-present (Thompson et al., 2017). Spring samples tend to contain the most species and are the most consistently sampled (Thompson et al., 2022a), so we focused on this season. From CalCOFI, we distinguished taxa with adult benthic, mesopelagic and pelagic habitats and plot abundance anomalies.
Given the importance of northern anchovy Engraulis mordax (henceforth anchovy) to ecosystem dynamics in the CCE (Fennie et al., 2023), and initial observations showing that larval abundance seaward of the shelf break were very high, we also included a plot of the spatial distribution of anomalies of larval abundance of this species in spring 2022. For each CalCOFI station we calculated the mean number of larvae in spring from 1951-2021. We then generated station specific anomalies by subtracting the number of larvae caught in 2022 from the long-term average.
Regional seabird and sea lion reproduction
Seabird monitoring, where measures of reproductive success (number of fledged chicks) from individual nests are recorded using standardized methodology, are conducted worldwide and from several locations in the CCE (Pistorius et al., 2023). We examined time series of reproductive success of three surface nesting species, the common murre Uria aalge, Brandt’s cormorant Phalacrocorax penicillatus, and pelagic cormorant Phalacrocorax pelagicus. Furthest north, these species were monitored at Yaquina Head, Oregon (Porquez et al., 2021). In California, we examined reproduction dynamics from Point Reyes, Southeast Farallon Island, and Devil’s Slide (Santora et al., 2014). California sea lions Zalophus californianus have been monitored at San Miguel Island for decades. We reported mean pup weight anomalies from 1997-2022. We focused on pup weight anomaly as it has been shown to be a robust index of pup conditions (McClatchie et al., 2016a).
Regional at-sea mammals and birds
CalCOFI marine mammal visual surveys were carried out during daylight hours while the ship was in transit between CalCOFI sampling stations on each quarterly cruise (Campbell et al., 2015). Observations of seabirds were made off the RREAS in late spring and CalCOFI in summer (Sydeman et al., 2021a; Sydeman et al., 2021b). For marine mammals we analyzed two indicator species, humpback whales Megaptera novaeangliae and blue whales Balaenoptera musculus. For seabirds, we tracked dynamics of resident common murre and migrant sooty shearwater off central California in late spring and cool water-associated sooty shearwater and warm water-associated black-vented shearwater Puffinus opisthomelas.
Results
Pacific climate indices
The three major basin-scale indices were all negative in 2022. The ONI was negative all year indicating that the Pacific Ocean was experiencing the third consecutive La Niña in as many years. The PDO has been continuously negative since 2020. The NPGO has been negative since mid-2017 (Figure 2A).
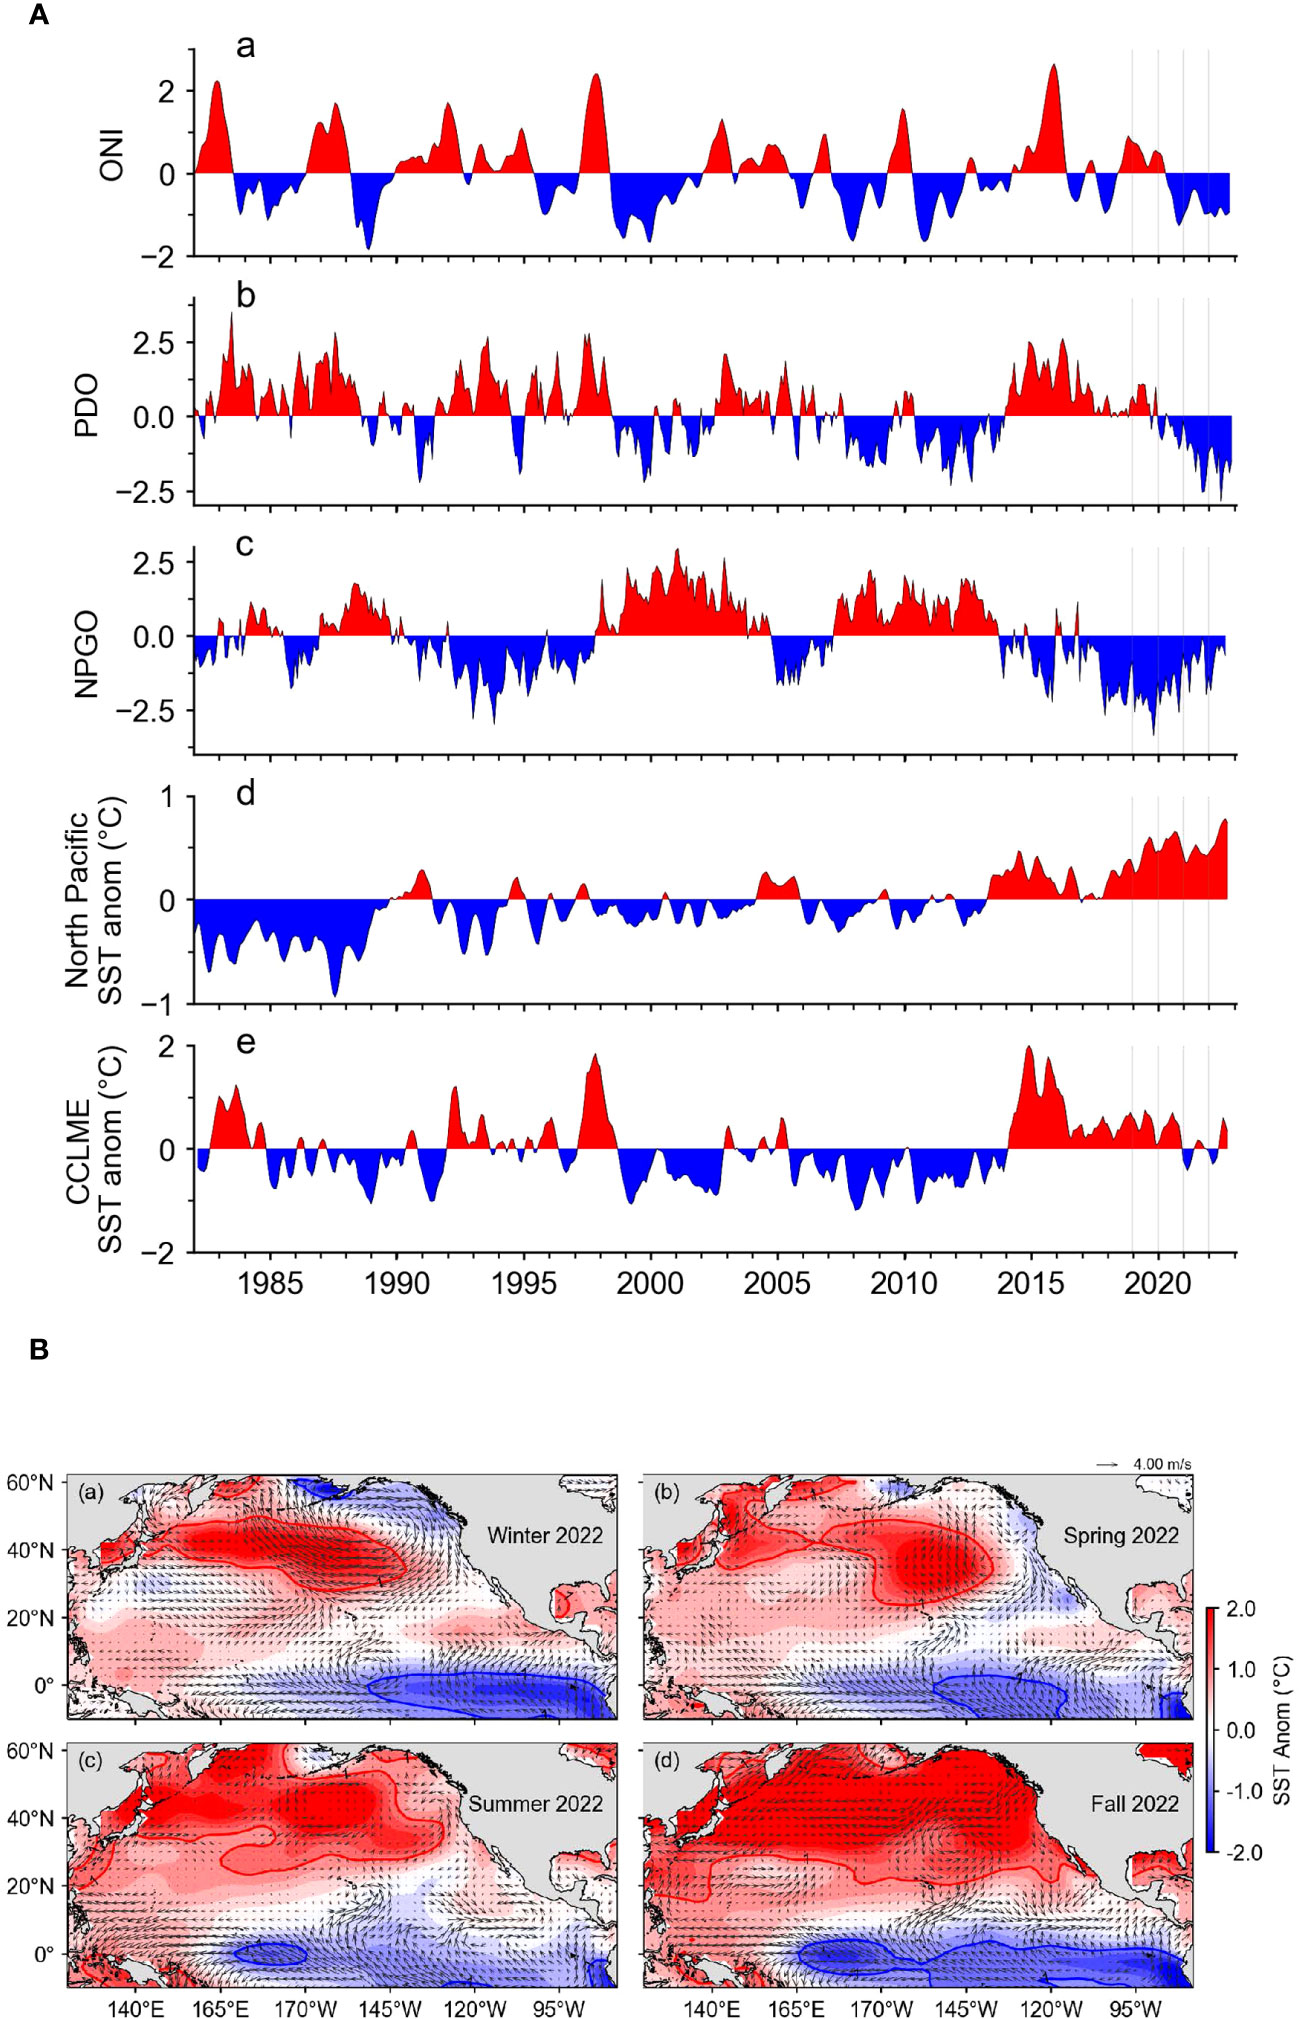
Figure 2 (A) Basin-scale indices: Oceanic Niño Index (ONI), Pacific Decadal Oscillation (PDO), North Pacific Gyre Oscillation (NPGO), North Pacific Sea Surface Temperature (SST) anomaly, and California Current Large Marine Ecosystem SST anomaly. (B) SST anomalies in winter, spring, summer and fall 2022 across the Pacific and geostrophic current flow.
The mean SST anomaly across the North Pacific Ocean, however, has been positive nearly 100% of the time since 2013 and has steadily increased since 2018. In 2022 the SST anomaly in the North Pacific reached a record high towards the end of the year. Similarly, the SST anomaly in the CCE region has been almost exclusively positive since 2014. Both in 2021 and 2022, SST was slightly below average in the first half of the year but above average in the second half (Figure 2A).
Visualization of SST anomalies throughout the North Pacific contextualize the average trends. In winter, SST was close to average near the coast of North America but well above average in the central Pacific (Figure 2B). In spring, conditions resembled a typical La Niña as SST was below average in the eastern Pacific but above average in the western Pacific. In summer and fall, the SST anomaly was also higher in the east than the west, but the SST anomaly was higher than average in the entire region (Figure 2B).
The contrast between the first half of 2022 and the second half was evident by comparison of average SST anomalies in the strongest La Niña during the past 30 years versus that of 2022 (Figure 3). The first part of 2022 resembled a mild La Niña as SST was below normal along the coast of North America and above average in the central Pacific (Figures 3A, B). In summer and fall, however, the SST anomaly was well above average (Figures 3C, D) in the eastern North Pacific and well above average in the western Pacific.
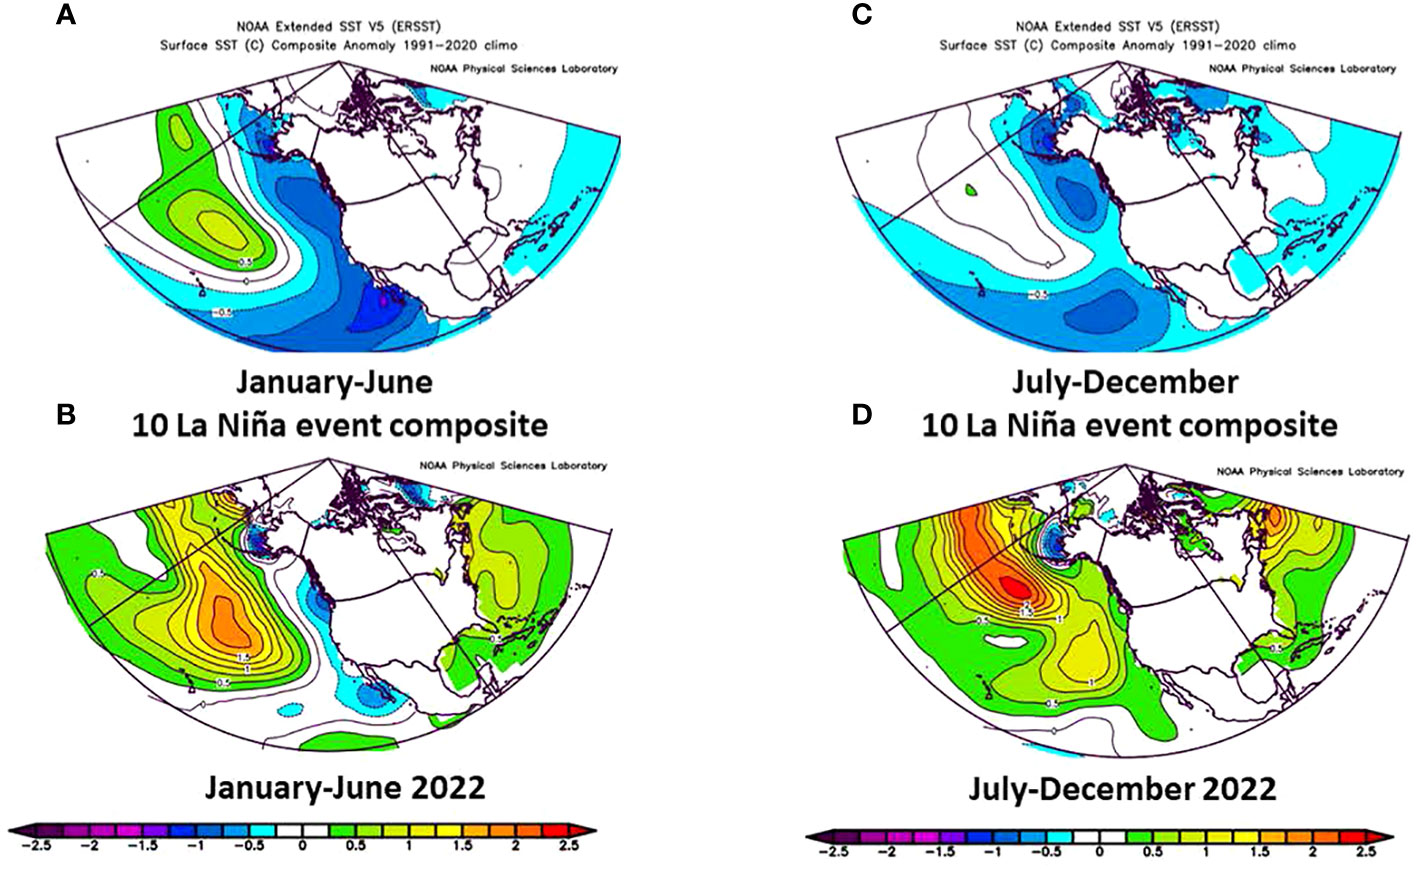
Figure 3 (A) Average SST anomaly during strong La Niña years in January-June from 1991-2020, (B) Average SST anomaly in January-June in 2022, (C) Average SST anomaly during strong La Niña years in July-December from 1991-2020, (D) SST anomaly in July-December in 2022.
Marine heatwave update
From the perspective of the North Pacific Ocean, the third largest MHW occurred in 2022, following only the 2018 and 2020 events (Figure 4A). In January 2022, MHWs covered approximately half a million km2 (Figure 4B). Marine heatwave coverage increased abruptly in the North Pacific in March to about 4 million km2; however, until August the MHW was mostly seaward of the EEZ. From August to November the MHW footprint increased to approximately 7 million km2, and it encroached into the CCE. By the June 9, 2022 the MHW was present in ~20% of the CCE (Figure 4C). The amount of the CCE experiencing a MHW jumped to ~50% by the middle of the year and in August approximately 70% of the EEZ was in an MHW (Figure 4C). The MHW occupied most of the EEZ through October but rapidly departed in late October, and was almost absent within the EEZ by late November (Figure 4C). The pattern of MHWs entering the EEZ in late spring or early summer and then withdrawing in fall was evident in each year from 2019-2021. By contrast, in 2014 the MHW remained in the EEZ through the end of the year. At the scale of the Eastern Pacific Ocean, the size of the MHW in 2022 increased through the year and peaked in September (Figure 4D). Although it decreased in size in fall, it still occupied approximately 4 x 10⁶ km2 mostly offshore from the EEZ by the end of the year. Similar dynamics, where the size of the MHW increased early in the year, peaked in summer and decreased but did not dissipate in fall also occurred in 2014, 2019 and 2020. In 2021, however, the MHW almost totally went away in fall.
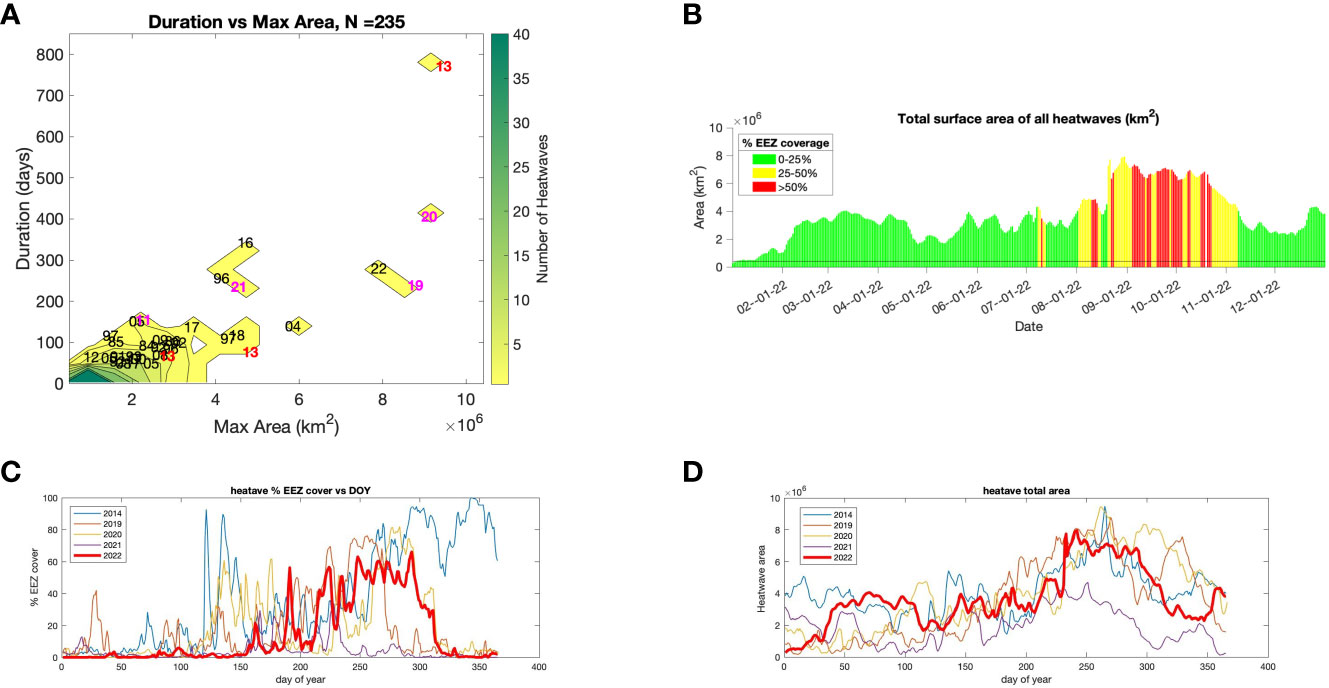
Figure 4 (A) Duration and size of 235 north east Pacific marine heatwaves (MHW) since 1982, (B) Total area and proportion of the U.S. Economic Exclusive Zone (EEZ) encompassed by a MHW in each day of 2022, (C) Percent of the EEZ that was in a MHW and (D) Total heatwave area in each day in 2022 and in recent years with pronounced MHW.
Upwelling and primary production
Upwelling also reflected a contrast between the two halves of 2022. In winter, upwelling was above average (and SST below average) in northern California and southern Oregon while conditions were close to average in the rest of the CCE off the United States (Figures 5A, B). In spring, upwelling was well above and SST well below average between Point Conception (34°N) and Cape Mendocino (40.4°N). South of Point Conception, however, upwelling was about average in spring and north of Cape Mendocino it was below average. In summer, conditions changed abruptly throughout the CCE. Sea surface temperature was above average in most of the U.S. portion of the CCE from June to late October and upwelling was either average or below average. In approximately the last month of 2022, upwelling increased and temperature decreased north of Point Conception.
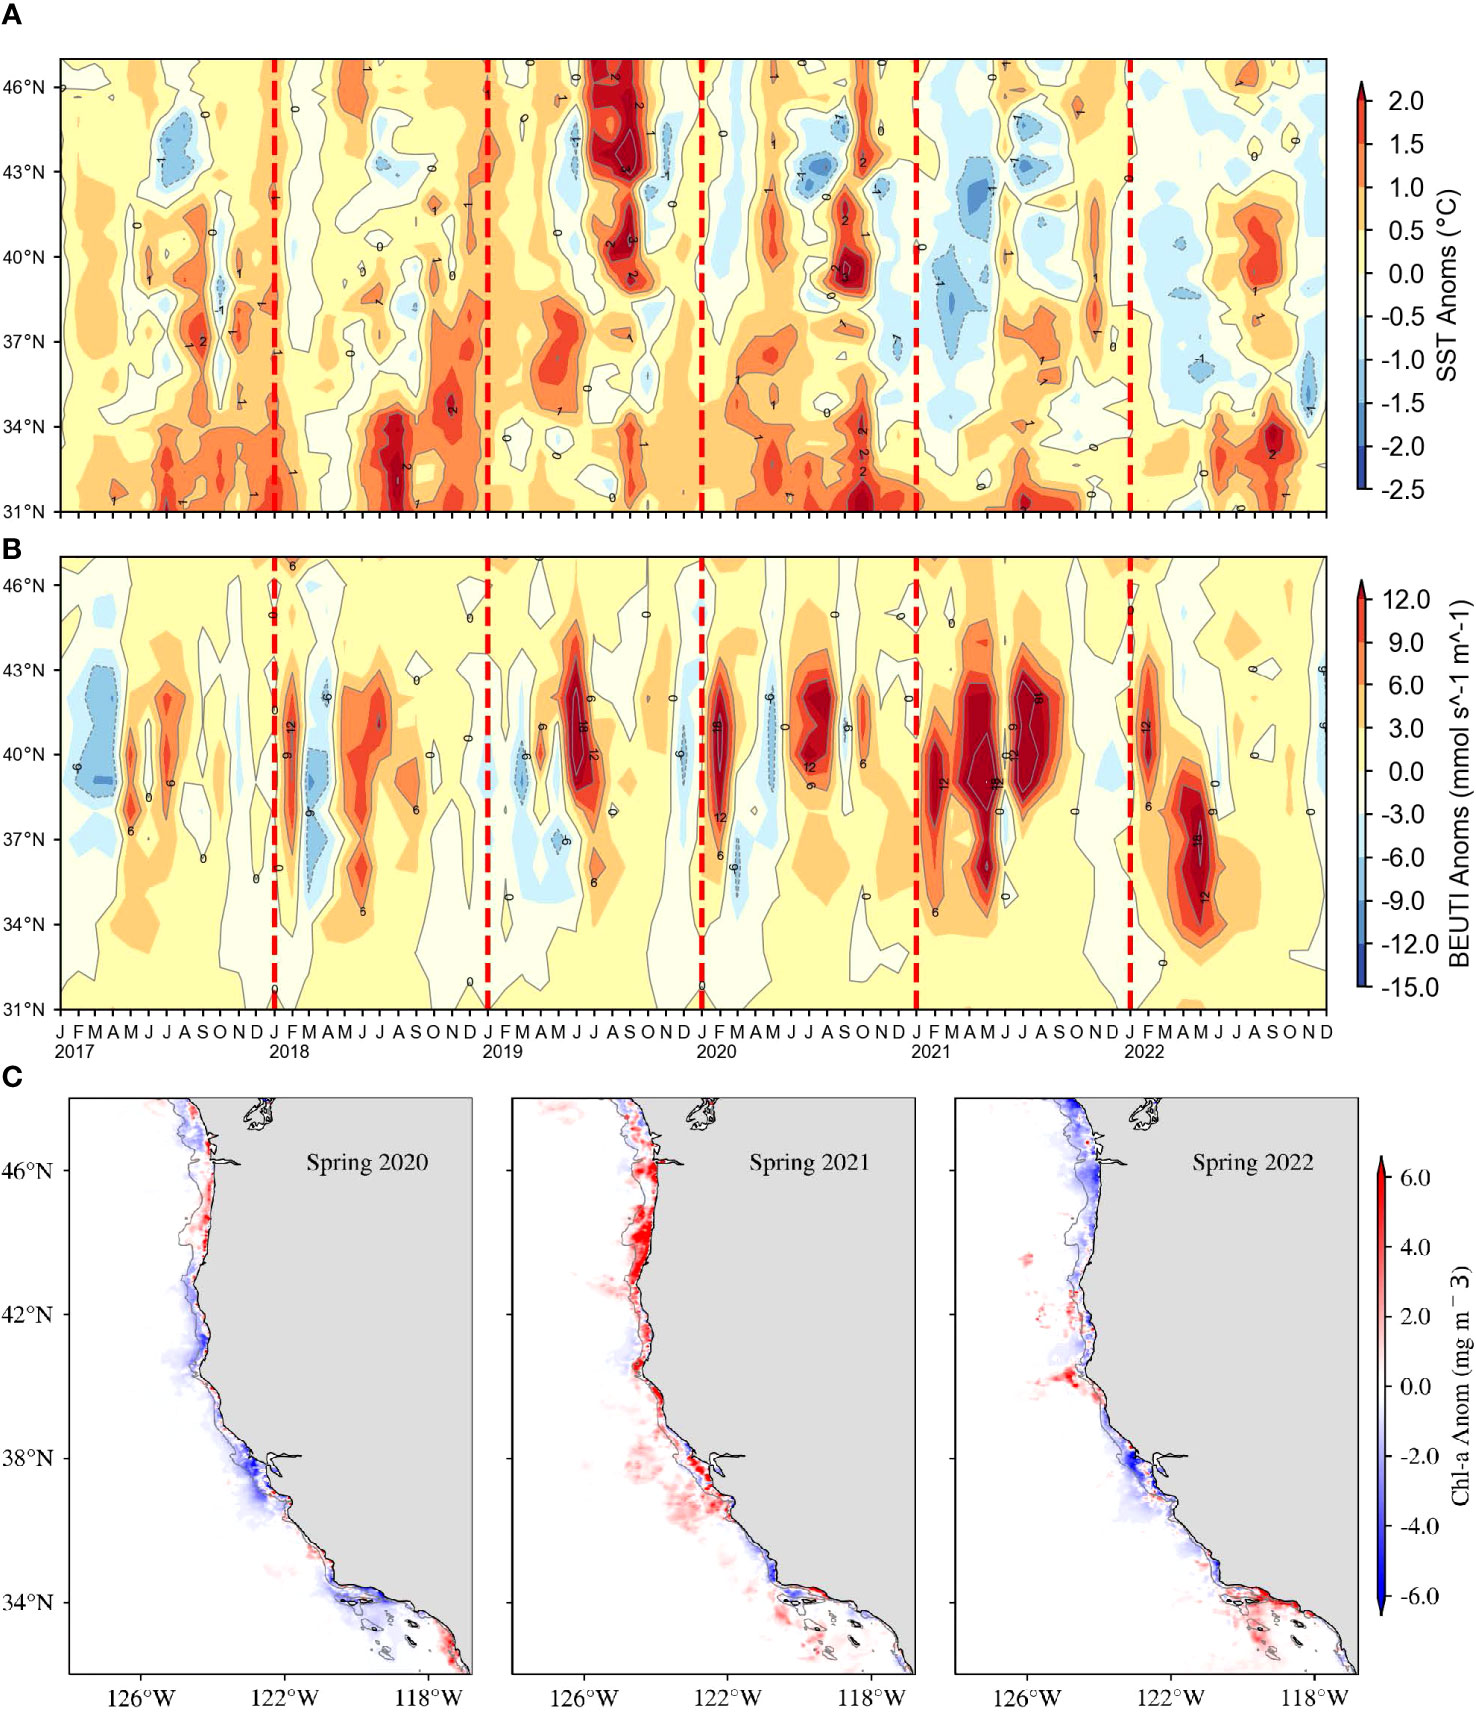
Figure 5 (A) Average SST anomaly within 75 km of the coast and (B) Biologically Effective Upwelling Transport Index (BEUTI) from 2017-2022 by latitude (y-axis) and time (x-axis). (C) satellite-derived chlorophyll a anomaly during spring 2020-2022.
Surface chlorophyll a in spring was mostly anomalously low off the west coast of the United States in 2022 (Figure 5C). The few locations where chlorophyll a was high near the continental shelf break at and north of Cape Mendocino (40.4°N) into southern Oregon (42.9°N) and in northern part of the Southern California Bight (34°N). The distribution of chlorophyll a in spring 2022 was markedly different than 2021 when chlorophyll a was elevated throughout most of the central and northern CCE.
Regional temperature, salinity and chlorophyll a
Off Newport, Oregon, temperatures were low and salinity high at both 50 and 150 m in winter of 2022. Subsequently, conditions reversed as temperature and salinity were close to average (Figure 6A). Similarly, chlorophyll a fell to below average when temperature increased and salinity decreased (Figure 6A). We observed similar patterns in northern California. On the THL, temperature was generally low and salinity high early in the year. Later in the year, temperature was above or close to average and salinity below or close to average (Figure 6B). Fluorescence on THL also decreased from beginning to mid-2022 although there was a brief spike in September.
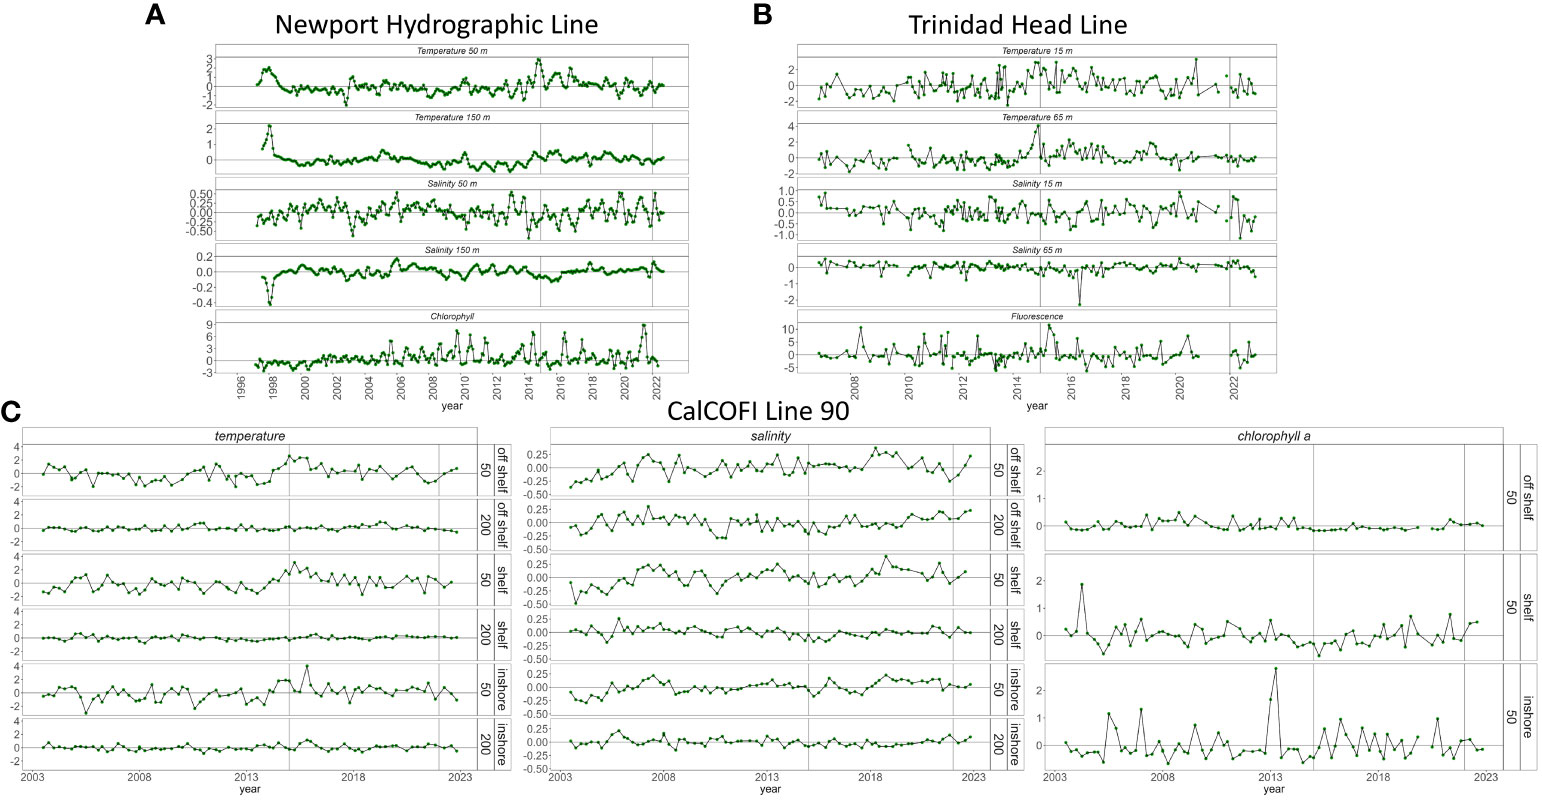
Figure 6 Temperature, salinity, and chlorophyll a (or fluorescence) at multiple depths from (A) Newport Hydrographic Line, (B) Trinidad Head Line and (C) CalCOFI Line 90. Note the differences in depths among geographic locations.
In southern California on CalCOFI line 90 conditions differed depending on depth and distance from shore (Figure 6C). At the offshore station (station 90), temperature was average near the surface (0-50 m) in spring but above average in summer and fall (Figure 6C). At depth (151-200m), temperature was below average in 2022. At the shelf break, temperature was slightly below average in spring and then average in summer. Closer to shore, shallow temperature was slightly above average in spring, average in summer and slightly below average in fall while deeper temperature was average in spring, above average in summer and below average in fall.
Salinity in southern California was mostly average or above average on line 90 in 2022 with below average salinity only occurring in spring off the shelf in the upper 50 m (Figure 6C). Chlorophyll a was close to average in the offshore region throughout 2022. Near the shelf break, chlorophyll a was above average in spring and summer. Chlorophyll a was above average near shore in spring and below average in summer and fall (Figure 6C).
Regional zooplankton
On the NHL, northern copepod biomass was high in the beginning of the year but became slightly negative towards the middle of the and then slightly positive in the second half of the year (Figure 7A). North Pacific krill body size was slightly above-average at the beginning of the year, dropped to below-average in late spring, and returned to near-average for the remainder of the year (Figure 7B). North of Point Conception, the RREAS (early summer) documented slightly above average total krill while in the south total krill was slightly below average (Figure 7C).
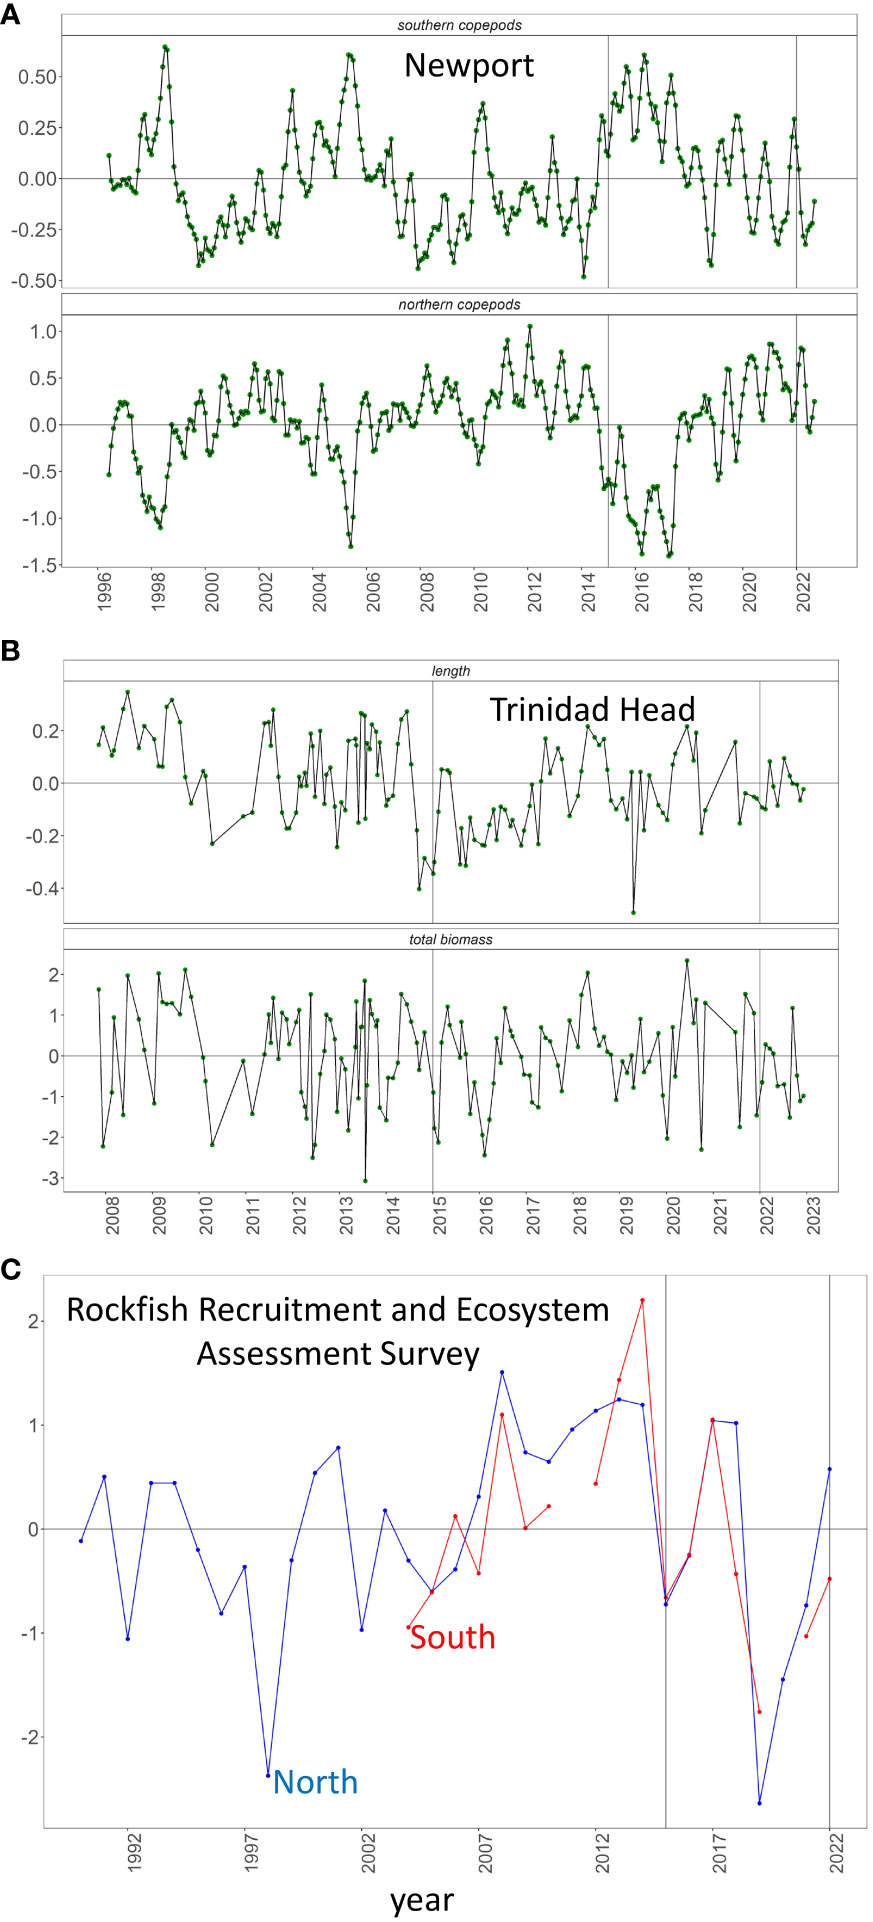
Figure 7 (A) Anomaly of log biomass of southern and northern copepods at the NHL. (B) Anomaly of North Pacific krill body length (mm) and biomass (mg C m-2) at the THL. (C) Anomaly of log biomass of krill in California north (blue) and south (red) of Point Sal from the RREAS.
Regional fish and market squid
Off Washington and Oregon, daytime surface trawls found that abundances of yearling anadromous Coho salmon Oncorhynchus kisutch were above average while chinook salmon O. tshawytscha were average in 2022 (Figure 8A). Abundances of both monitored marine species, market squid Doryteuthis opalescens and Pacific pompano P. simillimus were above average. Off Newport, Oregon, larval abundances of five of six coastal species were below average with only Pacific sandlance Ammodytes hexapterus coming in above average (Figure 8B). Abundances of all offshore/southern species were below average in 2022 off Newport. In California, adult dynamics from the RREAS were similar north and south of Point Conception (Figure 8C). Specifically, market squid abundance was above average while Myctophidae and Pacific sardine Sardinops sagax (henceforth sardine) were below average. Adult anchovy abundance was above average in the north but fell to average for the first time since 2016 in the south. Young of the year trends were more disjointed than adults in the northern versus southern parts of California. Abundance of YOY rockfishes Sebastes spp. decreased to below average in the south but rose from 2021 to remain above average in the north. By contrast, abundance of YOY anchovy were well above average in southern California but below average in northern/central California. Young of the year sardine and sanddab Citharichthys spp. abundances were both below average throughout California while Pacific hake Merluccius productus (henceforth hake) decreased in 2022 relative to 2021 throughout California although this species remained above average in both regions. In southern California, CalCOFI larval data displayed varied trends for the two main benthic species as the abundance of sanddabs increased to the highest level since 2014 while rockfishes remained below average (Figure 8D). For the mesopelagics, abundances of both northern and southern taxa increased in 2022 and southern taxa were at close to record high abundances. Among pelagics, the larval anchovy abundance reached the highest level on record, and jack mackerel Trachurus symmetricus was in the top 10 highest in 2022. Market squid was also well above average in 2022. Hake and Pacific mackerel Scomber japonicus were below average, but sardine larval abundance increased to the highest level since 2014, although this was still orders of magnitude lower than peak abundances from the late 1990s to approximately 2009.
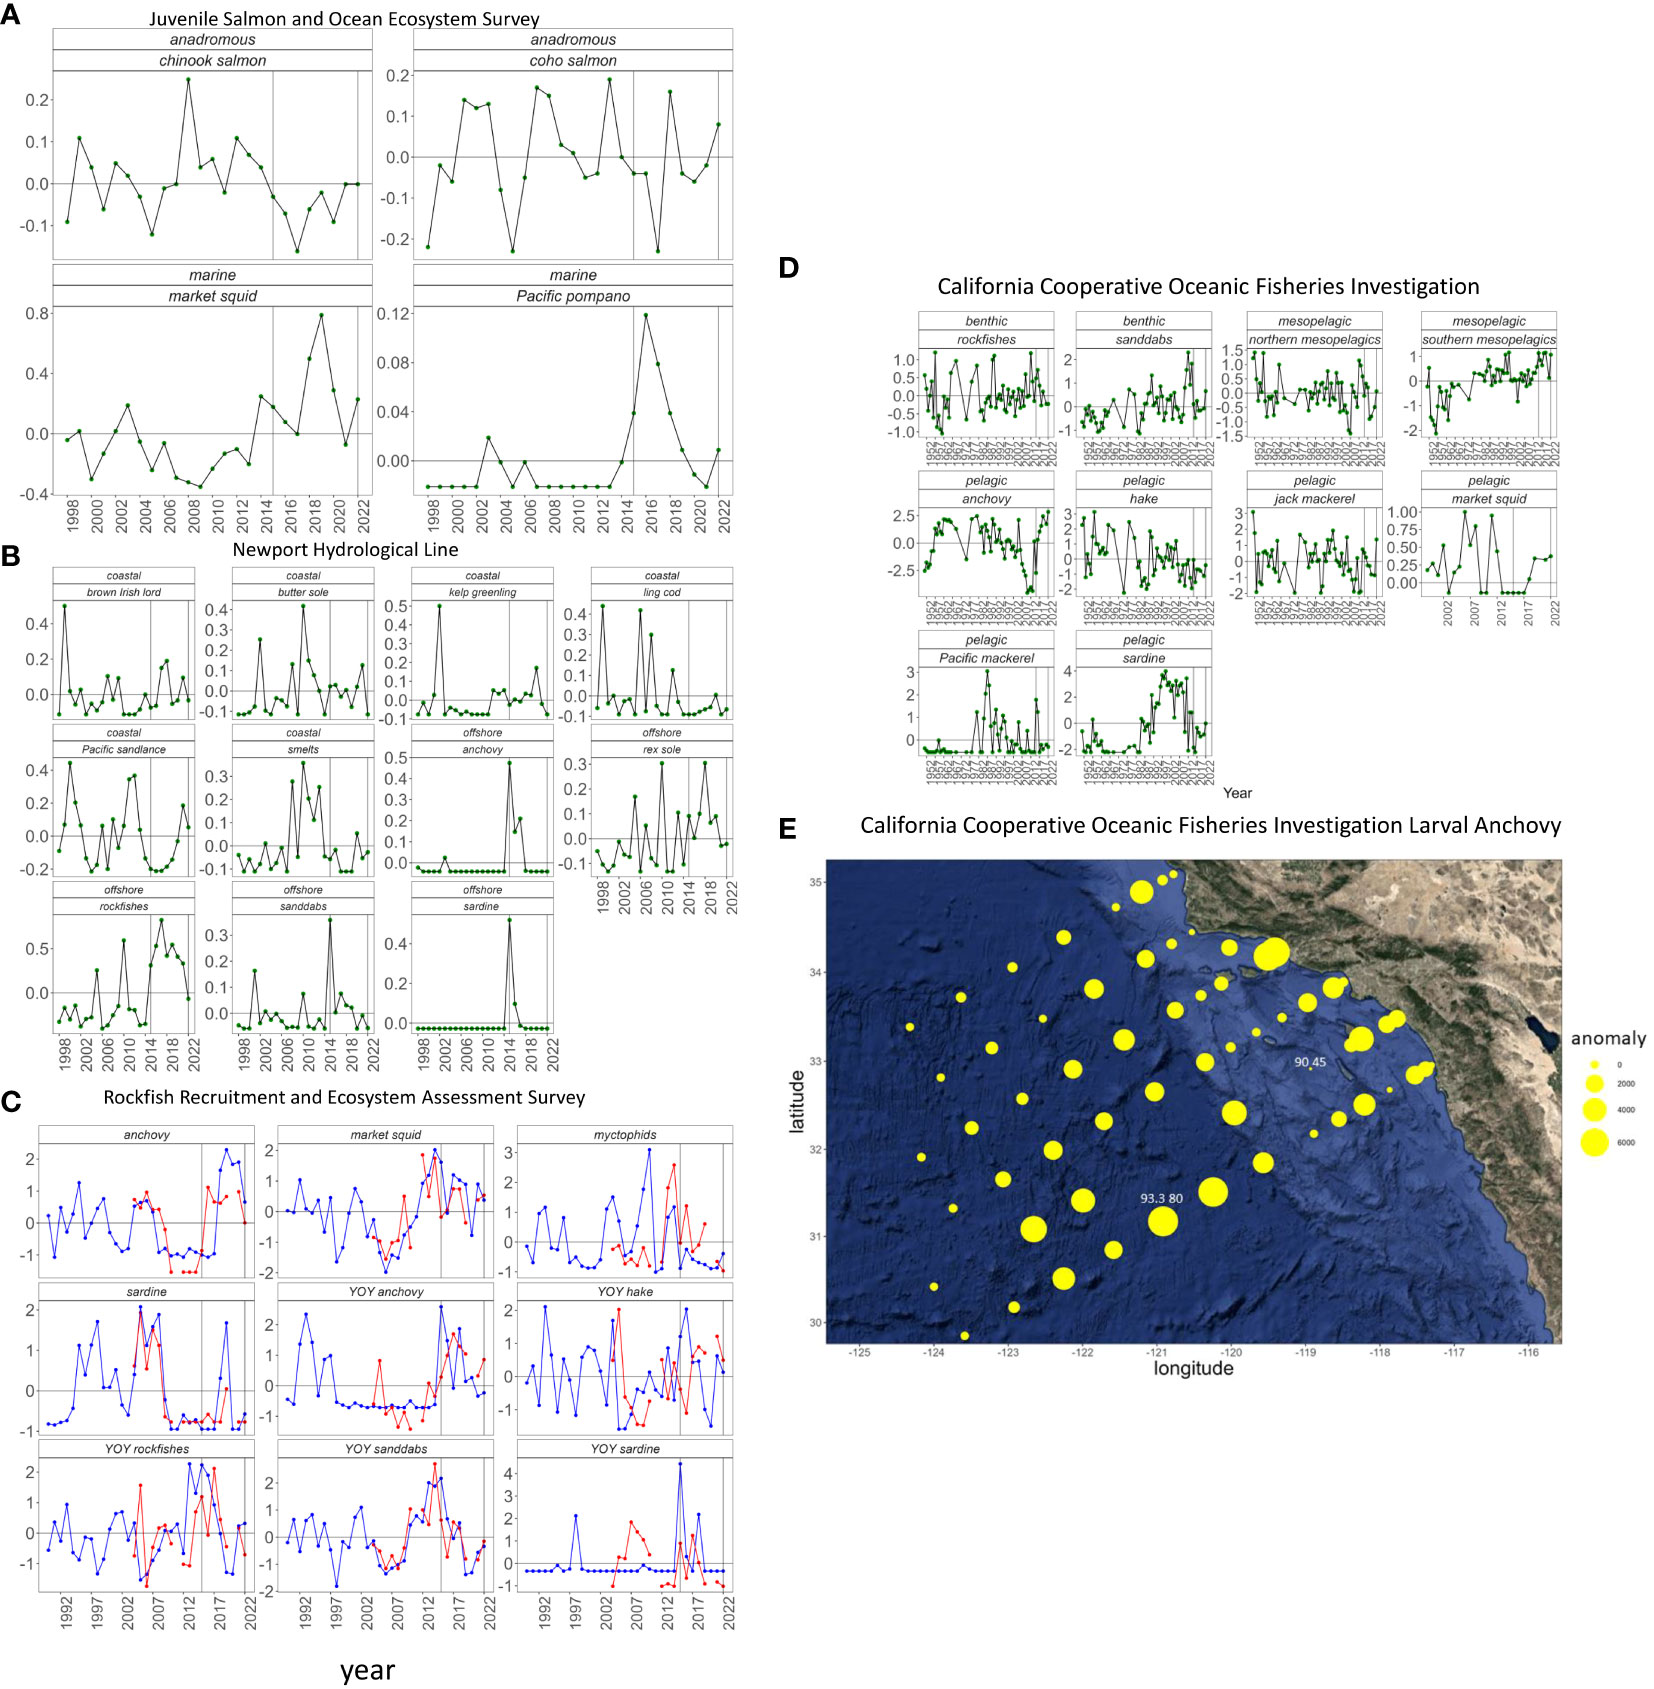
Figure 8 Log anomaly (A) abundance of yearly salmon, market squid and Pacific pompano off Washington and Oregon from the JSOES, (B) abundance of ichthyoplankton off the NHL, (C) abundance of adult and young of the year market squid and fishes from the RREAS, (D) abundance of ichthyoplankton from spring CalCOFI cruises, (E) non-transformed anomaly of larval anchovy abundance (no under 10m2) per station in spring 2022 relative to spring 1951-2021.
The spatial distribution of anchovy larvae was highly unusual in 2022 when very high abundances were found seaward of the continental shelf (Figure 8E). The most extreme example of high offshore abundance was station 93.3 80 where 7000 more larvae were found in 2022 (7056) than on average (56). In addition to this station several nearby offshore stations had upwards of 5000 more larvae than average. By contrast, most of the outer shelf stations had average anchovy abundances and a handful of stations had below average abundances. For example, 265 fewer larvae were found in 2022 (110) than average (375) at station 90 45, just west of San Clemente Island (Figure 8E). Closer to shore larval anchovy abundance was generally higher than normal but not to the same extent as the off-shelf stations.
Regional seabird and sea lion reproduction
Seabird reproductive success was variable by species and location in 2022 (Figure 9A). At Yaquina Head, common murre experienced total reproductive failure for the fourth season since records began in 2007. Common murre reproduction was above average at Point Reyes, slightly below average at Southeast Farallon Island and almost exactly average at Devil’s Slide. Brandt’s cormorant experienced average reproduction at Yaquina Head and above average at the other three localities. Pelagic cormorants also had complete reproductive failure at Yaquina Head but were above average in Southeast Farallon Island and Devil’s Slide. This species was not monitored at Pt. Reyes Headlands. In 2015, sea lion pup weight was the lowest on record. Pup weight rebounded to above average in 2016 and has remained above average through 2022 (Figure 9B).
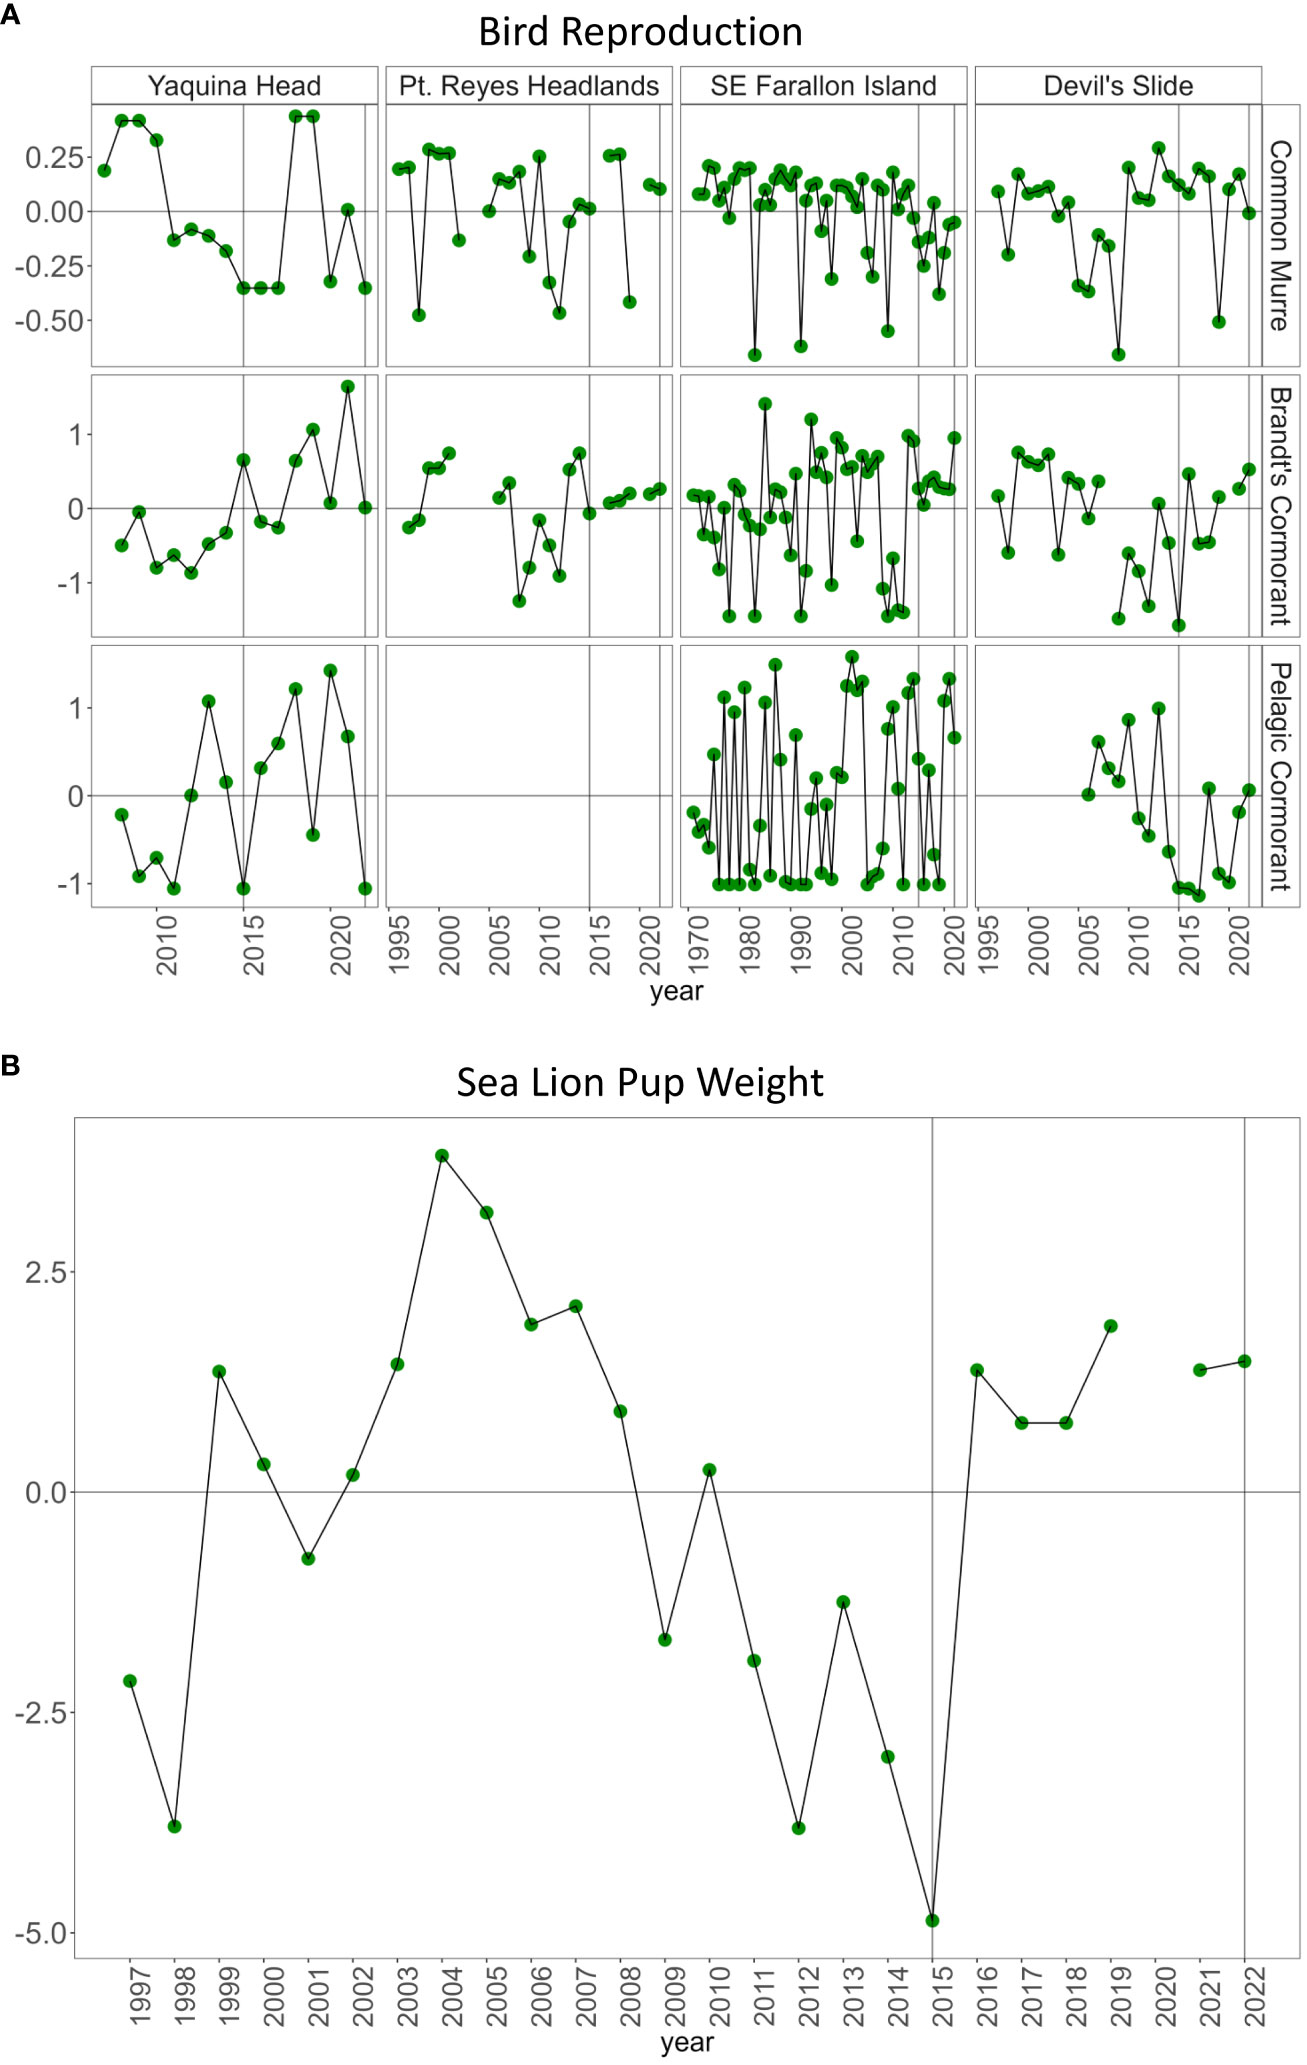
Figure 9 (A) Reproduction anomaly (number of fledglings) of three birds in Yaquina Head, Oregon, Pt. Reyes, SE Farallon Island and Devil’s Slide near San Francisco, California. (B) Sea lion pup weight anomaly (kg) on San Miguel Island, California.
Regional at-sea birds and mammals
All four indicator bird species were sighted at above average rates in 2022. In central California in late spring, both the migratory sooty shearwater and resident common murre were at record highs dating back to 1995 (Figure 10A). In southern California in summer, cold-water sooty shearwater had the sixth highest sightings and warm water black vented shearwater the second highest sightings since 1995 (Figure 10B).
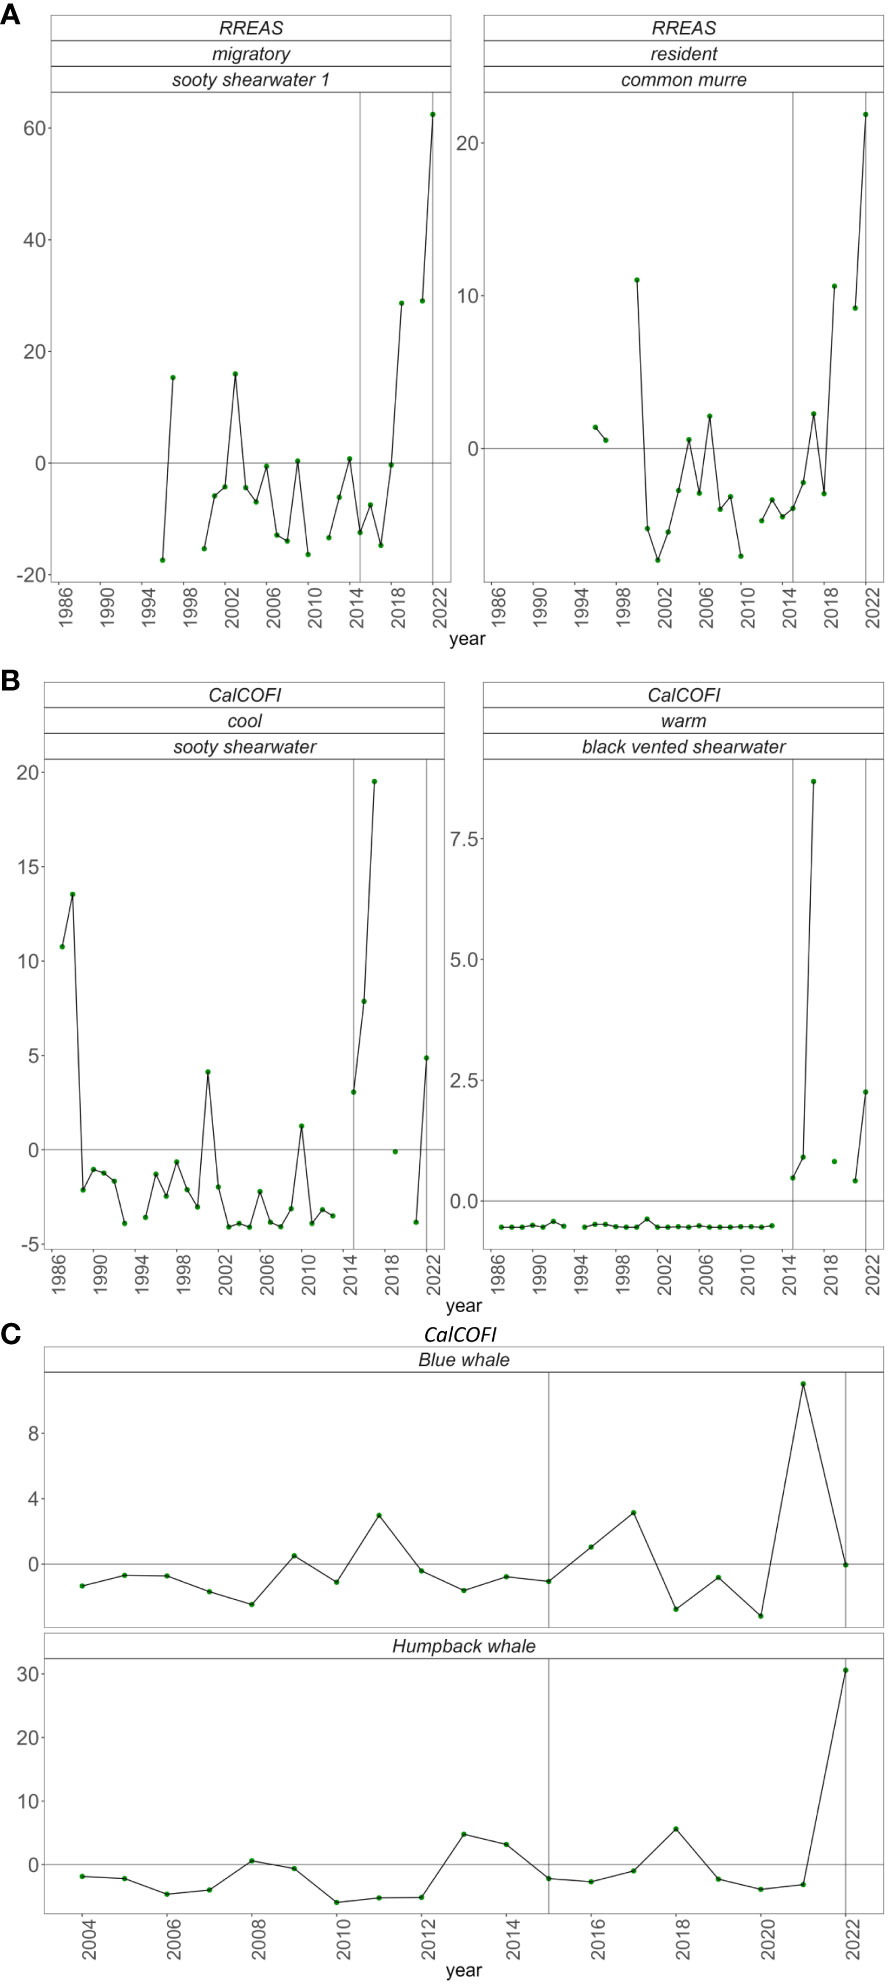
Figure 10 At sea sighting anomaly of (A) sooty shearwater and common murre in central California from the RREAS, (B) sooty shearwater and black vented shearwater from summer CalCOFI in southern California, (C) Blue whales and Humpback whales averaged across the four seasonal CalCOFI cruises.
Annual humpback whale encounter rates were considerably higher in 2022 than any previous year (Figure 10C). Most of the 2022 sightings occurred during the fall survey, and fall 2022 encounter rates were higher than any previous survey dating back to 2004 (Supplementary Figure). Encounter rates of blue whales have fluctuated above and below average in recent years and were average in 2022 (Figure 10C).
Discussion
Pacific climate indices
Environmental conditions differed markedly in the first and second halves of 2022 in the CCE relative to basin-scale indices. The determination of El Niño/La Niña state is based upon SST at the equator, and during La Niña events, the CCE is generally cool with high upwelling and coastal productivity (Bond et al., 2008). In winter the CCE seemingly reflected a weak La Niña as SST was largely close to average and northerly winds fueled moderately high upwelling in the northern CCE. Spring more resembled a typical La Niña with cool temperatures throughout most of the CCE, northerly winds and high upwelling. In summer, however, conditions in the CCE abruptly ceased being similar to an average La Niña. In summer, SST in the CCE was approximately 1°C above normal and by fall the CCE-wide SST anomaly rose to about plus 2°C. Concomitantly, upwelling fell to average or below average in summer and fall. In all, summer and fall 2022 depicted likely the most anomalous La Niña conditions in the CCE on record.
Historically, the PDO correlated positively with SST in the CCE (Litzow et al., 2020a). When the PDO was in a negative or “cold” phase the CCE tended to be cold and productive due to high upwelling, and the PDO negatively correlated with salmon production (Mantua et al., 1997). Meanwhile, a positive NPGO was associated with high nutrients, salinity and chlorophyll in the CCE (Di Lorenzo et al., 2008). Our finding that it was anomalously warm in the CCE over the past three years and in the second half of 2022 in particular, highlight that the relationship with the PDO/NPGO and local conditions off the west coast of the U.S. and Baja California are rapidly changing. Litzow et al. (2020a) found that the relationship between the NPGO/PDO local climate began to become nonstationary starting in about 1989/1990 when there was an abrupt climate shift characterized by abrupt lowering variability in the Aleutian Low and northeast Pacific warming (Hare and Mantua, 2000; Yeh et al., 2011). They showed that relationships with these indices have been weakening from the Bering Sea to the southern California Current. In addition, while the PDO correlated strongly and positively with salmon production in the Gulf of Alaska from 1950-1988, there was no relationship from 1989-2012 (Litzow et al., 2018) and that the relationship even became significantly negative from 2014-2019 (Litzow et al., 2020b).
While the relationships between the PDO and local conditions has been changing since the late 1980’s (Litzow et al., 2020a), nonstationarity was punctuated with the onset of the 2013 North Pacific Marine Heatwave (Werb and Rudnick, 2023). In Werb and Rudnick (2023), unlike Mantua et al. (1997), the PDO was calculated without removing long-term trends in SST, resulting in exclusively positive PDO values from 2014-2021. This revised version of the PDO lines up better with our observations of ocean conditions as record high temperatures were recorded at the scale of the North Pacific and the CCE was almost exclusively anomalously warm since 2014. Together, these results emphasize that naively using the PDO as an explanatory variable for biological dynamics in the CCE is now problematic (Litzow et al., 2018; Litzow et al., 2020a; Litzow et al., 2020b; Ohlberger et al., 2022; Werb and Rudnick, 2023).
Marine heatwave update
It has been predicted that the frequency, intensity and duration of MHW will increase under a warming globe (Frölicher et al., 2018; Oliver et al., 2018). In the North Pacific, MHWs have essentially become the new normal resulting in unprecedented temperature highs in the North Pacific and the CCE. Marine heatwaves have been tracked in this region since 1982, and nine of the largest twelve occurred from 2013-2022. Given the propensity of MHWs, the new question is not whether or not there is a MHW but how close to shore does the MHW move? In 2021, the MHW mostly stayed offshore (Thompson et al., 2022b). The 2022 MHW was similar in size and duration to the 2019 MHW, although that year there were fewer intrusions closer to shore as upwelling winds were more constant relative to 2022. In addition, the 2019 MHW also began to dissipate and retreat much further offshore during the late summer/fall, whereas this year, the intrusion into coastal waters continued through the entire fall. Given the unprecedented nature of the physical conditions in the CCE since 2013 it is particularly important to continue closely monitoring the system as biological responses are often unpredictable based on past warming events (Schroeder et al., 2019; Schroeder et al., 2022; Thompson et al., 2022a).
Regional physical oceanography and chlorophyll a
During La Niña events upwelling tends to be prevalent coastwide, and coastal waters are cold and saline (Bond et al., 2008). In the first part of 2022, this expectation was largely met in the northern CCE as water was slightly abnormally cold and saline and chlorophyll a was close to average in NHL and THL. By summer, however, despite the PDO and ONI being strongly negative, temperature, salinity and chlorophyll a mostly reverted to average. Moderate environmental conditions seem to be pervasive in the northern CCE during negative PDO years in recent years. The PDO has been predominantly negative since 2019, but environmental conditions have mostly hovered around the long-term means with the exception of early 2021 when it was relatively cool and saline (Thompson et al., 2019b; Weber et al., 2021; Thompson et al., 2022b).
CalCOFI samples far off the continental shelf and thus can discern the presence of multiple water masses. There are multiple bodies of water in this region and their boundaries are highly variable through both time and space (Bograd et al., 2019). Central Pacific water is the furthest from shore off southern California and is relatively warm, saline with low chlorophyll a, Pacific Subarctic or California Current water is cool, low salinity and high chlorophyll a and tends to be centered on the shelf break. Upwelled water is cool, saline and high in chlorophyll a, close to shore and shallow, while California Undercurrent water is warm, saline and low chlorophyll a and is also close to shore but deeper (100-300 m) than upwelled water. In the offshore region off southern California, temperature and salinity were above average most of the year indicating the presence of Central Pacific water. This saline water mass has been ubiquitous in the CCE since 2015 when water from the North Pacific Subtropical Gyre was advected eastward into the CCE (Ren and Rudnick, 2021). However, chlorophyll a was also high in spring and summer on the shelf which may indicate that there was a mixture of Central Pacific and Pacific Subarctic waters in this region. Pacific Subarctic water has also been common in the CCE during the 2014-2016 MHW and has apparently fueled high rockfish recruitment before and during the MHW (Schroeder et al., 2019). Closer to shore, temperature and salinity were close to average, but chlorophyll a was elevated in spring before dropping to slightly below average in summer and fall. The enhanced chlorophyll a was likely a remnant of upwelling prior to spring sampling before physical conditions returned to average.
Regional zooplankton
Zooplankton are critical food for a myriad of marine species including fish, birds, and marine mammals. During past La Niña events in the CCE, high nutrient input from upwelling often resulted in higher abundances of lipid-rich northern zooplankton. This suite of zooplankton are important prey for species such as yearling salmon and increases the odds of adult salmon returning to spawn in their natal rivers one to three years in the future (Friedman et al., 2018). Yearling salmon tend to enter the ocean in late spring/early summer (Thompson et al., 2019a), so zooplankton community composition is particularly important during this time of year. In 2022, biomass of northern copepods was high when yearling salmon were entering the ocean which may have enhanced salmon survival (Daly et al., 2013). By midyear, however, northern copepod biomass dropped dramatically. Similarly, North Pacific krill body size and total krill biomass, which were both typically high in La Niña years, dropped precipitously in northern California from the beginning of the year to mid-2022. Zooplankton dynamics in the CCE are influenced by primary production and hydrographic conditions (Peterson et al., 2017). The decrease in northern copepod biomass and krill body size and biomass was likely driven by reduced upwelling, near- to below-average chlorophyll a concentration, and warmer water in summer (Peterson et al., 2014; Peterson et al., 2017; Robertson and Bjorkstedt, 2020).
Fish and market squid
During warm, non-La Niña periods, southern fishes tend to move north and offshore species tend to move inshore throughout the CCE. In the Pacific northwest Pacific pompano and market squid are bellwether indicators of warm water. Pacific pompano were absent from surface trawl surveys off Oregon and Washington in 12 out of 16 years prior to the onset of the 2014-2016 Pacific MHW (Thompson et al., 2018). Subsequent to 2013 this species has been present in each year although abundances were low in 2021. In 2022, however, abundance was above average for the sixth time since 2015. Similarly, market squid were above average off Oregon and Washington in 2022 for the sixth year since 2015. Market squid distribution shifted far north during and after the 2014-2016 marine heatwave (Burford et al., 2022; Chasco et al., 2022; Suca et al., 2022) which significantly reduced commercial fishing revenue in California (Suca et al., 2022; Free et al., 2023). Market squid distributions differed in 2022 from recent years, however, as abundances were above average in Oregon/Washington as well as in northern and southern California. It is thus possible that market squid distributions expanded or began shifting south in 2022 as this species was found throughout of the west coast of the United States.
Off Oregon, fishes are categorized as coastal resident versus southern offshore, and coastal residents tend to be elevated during La Niña events (Daly et al., 2013). Larvae and juveniles of the coastal residents are important forage for both salmon and birds and tend to increase during cool conditions (Daly et al., 2013; Daly et al., 2021) while abundances of the southern offshore species rises when it is warm (Auth et al., 2018; Nielsen et al., 2021). The larval fish assemblage from the NHL in 2022 was unusual as abundances of both the coastal resident and southern offshore species were either average or low. Discerning the mechanisms underpinning low fish production off Oregon in 2022 could be an important topic for future research.
It was previously thought that anchovy population size increased during cool periods when La Niña events were frequent (Chavez et al., 2003), but in recent years anchovy increased greatly in warm years (e.g., 2004-2005, 2014-2016; (Thompson et al., 2019b)). The expectations for anchovy during La Niña events is thus currently unclear, and our understanding of drivers of the populations size of this important forage species (McClatchie et al., 2016a) is evolving (Swalethorp et al., 2023). Anchovy have been in a boom state in the CCE since 2015 (Thompson et al., 2019b), and in 2022 adult anchovy abundance remained high in central California but fell to average levels in southern California. However, patterns of young of the year anchovy were opposite as values were well above average in southern California but slightly below average in central California. The spatial discrepancy between young of the year and adult abundance may indicate that many adults are spawning in locations that are possibly suboptimal for larval survival. A similar dynamic seemed to take place in the Humboldt Current where Peruvian anchoveta eggs were found in locations where adult food was high but the water was also acidic while larvae were in nearby, less corrosive water (Shen et al., 2017). Record high densities of spawning anchovy, as those experienced since 2015, could be displacing spawners into lower quality nursery habitat. Alternatively, it is possible that adult populations in southern California were higher in southern California than detected by the RREAS which mainly samples stations along the shelf break. CalCOFI found that anchovy egg and larvae counts were orders of magnitude higher than average in locations near and seaward of the continental shelf break. Regardless of the precise adult abundance in southern California, it is clear that the anchovy regime that began in 2016 (Thompson et al., 2018) continued into 2022, and the high young of the year anchovy abundance in 2022 suggests that it will persist at least into 2023.
Southern mesopelagic species typically receded from southern California during La Niña events (Thompson et al., 2012), but abundances were close to a record high there in 2022. This suite of species resides primarily in the warm and saline Central Pacific and California Undercurrent, that flows from south to north, and very predictably are abundant when the system is warm (Moser et al., 1987; Hsieh et al., 2009; Thompson et al., 2022a). Although mesopelagics are in deep water during the day, they vertically migrate towards the surface at night and are thus important components of the pelagic food chain. Indeed, a recent analysis of predator diets in the CCE revealed that of 143 predator taxa 25% consumed mesopelagic fishes (Iglesias et al., 2023). This suite of predators included economically valuable bluefin tuna (16% of all non-empty diet samples), albacore (19%), swordfish (50%), and Humboldt squid (52%). Between the high abundance of mesopelagic fishes and anchovy, at least the southern portion of the CCE was highly productive from the perspective of a piscivore in 2022.
Bird and sea lion reproduction
The capacity of seabirds to fledge their young is affected greatly by prey available to the parents, and productive La Niña conditions tended to be conducive for successful reproduction (Sydeman et al., 2001). Seabird reproduction in 2022, however, was very different between Oregon and central California as two species (common murre and pelagic cormorant) experienced total reproductive failure at Yaquina Head, Oregon. In addition to prey availability, eagle depredation of common murre is a potential top-down forcer of common murre reproductive failure at Yaquina Head (Thompson et al., 2022b) and around the world (Hentati-Sundberg et al., 2021). However, eagle interactions with common murre were unexceptional in 2022 (Supplementary Appendix), and eagles typically do not affect pelagic cormorants. It is thus likely that seabird productivity at Yaquina Head was derailed by a lack of suitable food. Murre chick diets at Yaquina Head have high intraannual variability and are generally dominated by smelt (Osmeridae spp.), herring or sardines (Clupeidae spp.), or Pacific sand lance (Thompson et al., 2022b). Diet composition of common murre is typically collected, but because of the reproductive failure of common murres in 2022 there was no associated dietary information from Yaquina Head. Indeed, ichthyoplankton surveys from the NHL, which is 5 km south of Yaquina Head, suggested that fish production was low in 2022. For example, abundances of smelt were below average, Clupeids were absent, and Pacific sand lance were approximately average. This differed from 2021 when both smelt and Pacific sand lance were well above average, and reproduction was much higher for all three species (Thompson et al., 2022b).
In central California, Brandt’s cormorant and pelagic cormorant reproduction were above average in all three sampling locations. Cormorants can feed their chicks regurgitated prey so there is not a maximal anchovy body size that is inaccessible to the chicks and thus both young of the year or adult anchovy can be valuable prey (Thompson et al., 2018). Common murre reproductive success was close to or slightly above average in central California. Unlike cormorants, they feed their chicks whole animals and thus adult anchovy are not suitable for nourishing chicks. However, common murre reproductive success has been found to be positively correlated with krill and young of the year sanddab (Santora et al., 2014), and in 2022 krill biomass was above average and young of the year sanddab average in central California. Common murre therefore likely also had a fairly robust prey field in 2022.
In the 2021 State of the California Current Ecosystem Report (Thompson et al., 2022b), we predicted that sea lion pup condition would be above average in 2022 because anchovy recruitment was high in southern California in 2021 and thus adult anchovy prey would likely be available to sea lions in 2022. This prediction turned out to be correct as sea lion pup weight was above average once again in 2022. Indeed, sea lion pup weight was above average in each year from 2016-2022, tying the previous streak of above average weights from 2002-2008. Sea lion pup condition is proving to be one of the most predictable indicators of ecosystem condition in the CCE. McClatchie et al. (2016a) found that the combined abundance of anchovy and sardine, as well as pup sex, explained 81% of the variability in pup weight between 2004 and 2014. In 2014 abundances of both anchovy and sardine were extremely low and sea lion pups were starving because their mothers likely were malnourished and unable to properly lactate (Laake et al., 2018). Pup condition improved dramatically in 2016 coincident with the anchovy boom and has remained above average as the high anchovy abundance continued through 2022. Updating the analyses in McClatchie et al. (2016a) to the present would provide deeper understanding of drivers of sea lion condition in the CCE.
At sea birds and mammals
During previous cool-water La Niña events, at sea residents such as common murre tended to be high while warm-water migrants such as sooty shearwater were low (Thompson et al., 2019b). At sea observations of migratory sooty shearwater and common murre were at an all-time highs in 2022 in central California in spring. Sooty shearwater observations in this area are thought to be driven by prey (Santora et al., 2011; Santora et al., 2017), and several potential prey species such as market squid, adult anchovy, young of the year hake and young of the year rockfishes were above average in 2022. Common murre are resident breeders that can travel up to approximately 30 km to search for food (Ainley and Boekelheide, 1990), but non-breeding birds are capable of traveling much greater distances (Loredo et al., 2019). The coupled high at-sea observations and average to above average reproductive success suggests that common murre were forced to forage far from the colony (Harding et al., 2007) but that they generally found enough food to nourish their chicks. Alternatively, non-breeding or pre-breeding birds could have moved into the sampling area from elsewhere. In summer in southern California, warm-water associated black-vented shearwater, which historically were low during La Niña events, were above average for the eight consecutive year since the 2014 MHW, suggesting that the system has been in a sustained warm state for almost a decade. However, cool water sooty shearwater were also above average perhaps as a result of the relatively cool and productive spring conditions.
Annual humpback whale encounter rates were higher in 2022 than any previous year. Humpback whales are opportunistic foragers (Baker et al., 1985). Stocks wintering in Central America and Mexico migrate seasonally to southern California, where their diets may reflect local oceanographic and climate conditions (Calambokidis et al., 2000; Fleming et al., 2016). For instance, during cool, productive, strong upwelling periods that are characteristic of La Niña events in southern California, we would expect to see humpback whale diets dominated by krill, whereas, during warm, oligotrophic periods, humpback whale diets may be dominated by pelagic schooling fish (Fleming et al., 2016). Record high abundances of anchovy larvae were measured offshore of the continental shelf in 2022, adjacent to offshore spring humpback whale sightings (Supplementary Appendix). Additionally, an anomalously high number of anchovy larvae were measured in the Santa Barbara Channel, in close proximity to the record high number of humpback whale sightings during the fall CalCOFI survey (Supplementary Appendix). The high number of humpback whale sightings this year indicates that they may be aggregating in the region to exploit high density anchovy schools during this period of warmer, oligotrophic conditions in the CalCOFI region.
Encounter rates of blue whales have fluctuated above and below average in recent years. Blue whales are seasonal migrants to southern California during summer months (Irvine et al., 2014). While inhabiting the CalCOFI region they forage exclusively on krill, preferring Thysanoessa spinifera to North Pacific krill (Nickels et al., 2019). Due to their specialized foraging preferences, blue whale encounter rates may be an indicator of local productivity (Wachtendonk et al., 2022). In the summer of 2021, encounter rates of blue whales were the highest throughout the timeseries (Supplementary Appendix). Encounter rates of blue whales were lower in summer 2022 than they were in summer 2021. Conditions in 2021 were dominated by a strong La Niña, driving increased productivity in the California Current Ecosystem and favorable conditions for blue whales (Thompson et al., 2022b). Whereas, conditions in summer 2022 were less productive from the perspective of a blue whale, potentially driving the lower encounter rates of blue whales throughout the CalCOFI region.
Conclusion
The relationship between basin scale indices such as ONI, PDO and NPGO and local physical conditions has become nonstationary in the CCE (Litzow et al., 2020a). Fiedler and Mantua (2017) showed that local conditions were variable during El Niño events between 1950 and 2016 but were more consistent during La Niña events. However, 2022 marked the third consecutive La Niña and during much of this stretch physical and biological conditions in the CCE were unlike past La Niña years (Weber et al., 2021; Thompson et al., 2022b), and many of the physical and biological responses based on observations from past La Niña events were not met in 2022. For example, northern copepods biomass was average off Oregon as was krill body size off northern California in summer. Off Oregon and Washington, warm-water associated species were above average, off Oregon cool-water coastal species were low, and off southern California southern mesopelagic fishes were high. While many reproductive success of many birds was above average in central California common murre experienced total reproductive failure off Oregon. Our accounting of the state of the California Current Ecosystem in 2022 agree with Werb and Rudnick (2023) who state that “the PDO and other EOF based metrics may not be as useful in the future as climate continues to change” (Table 1).
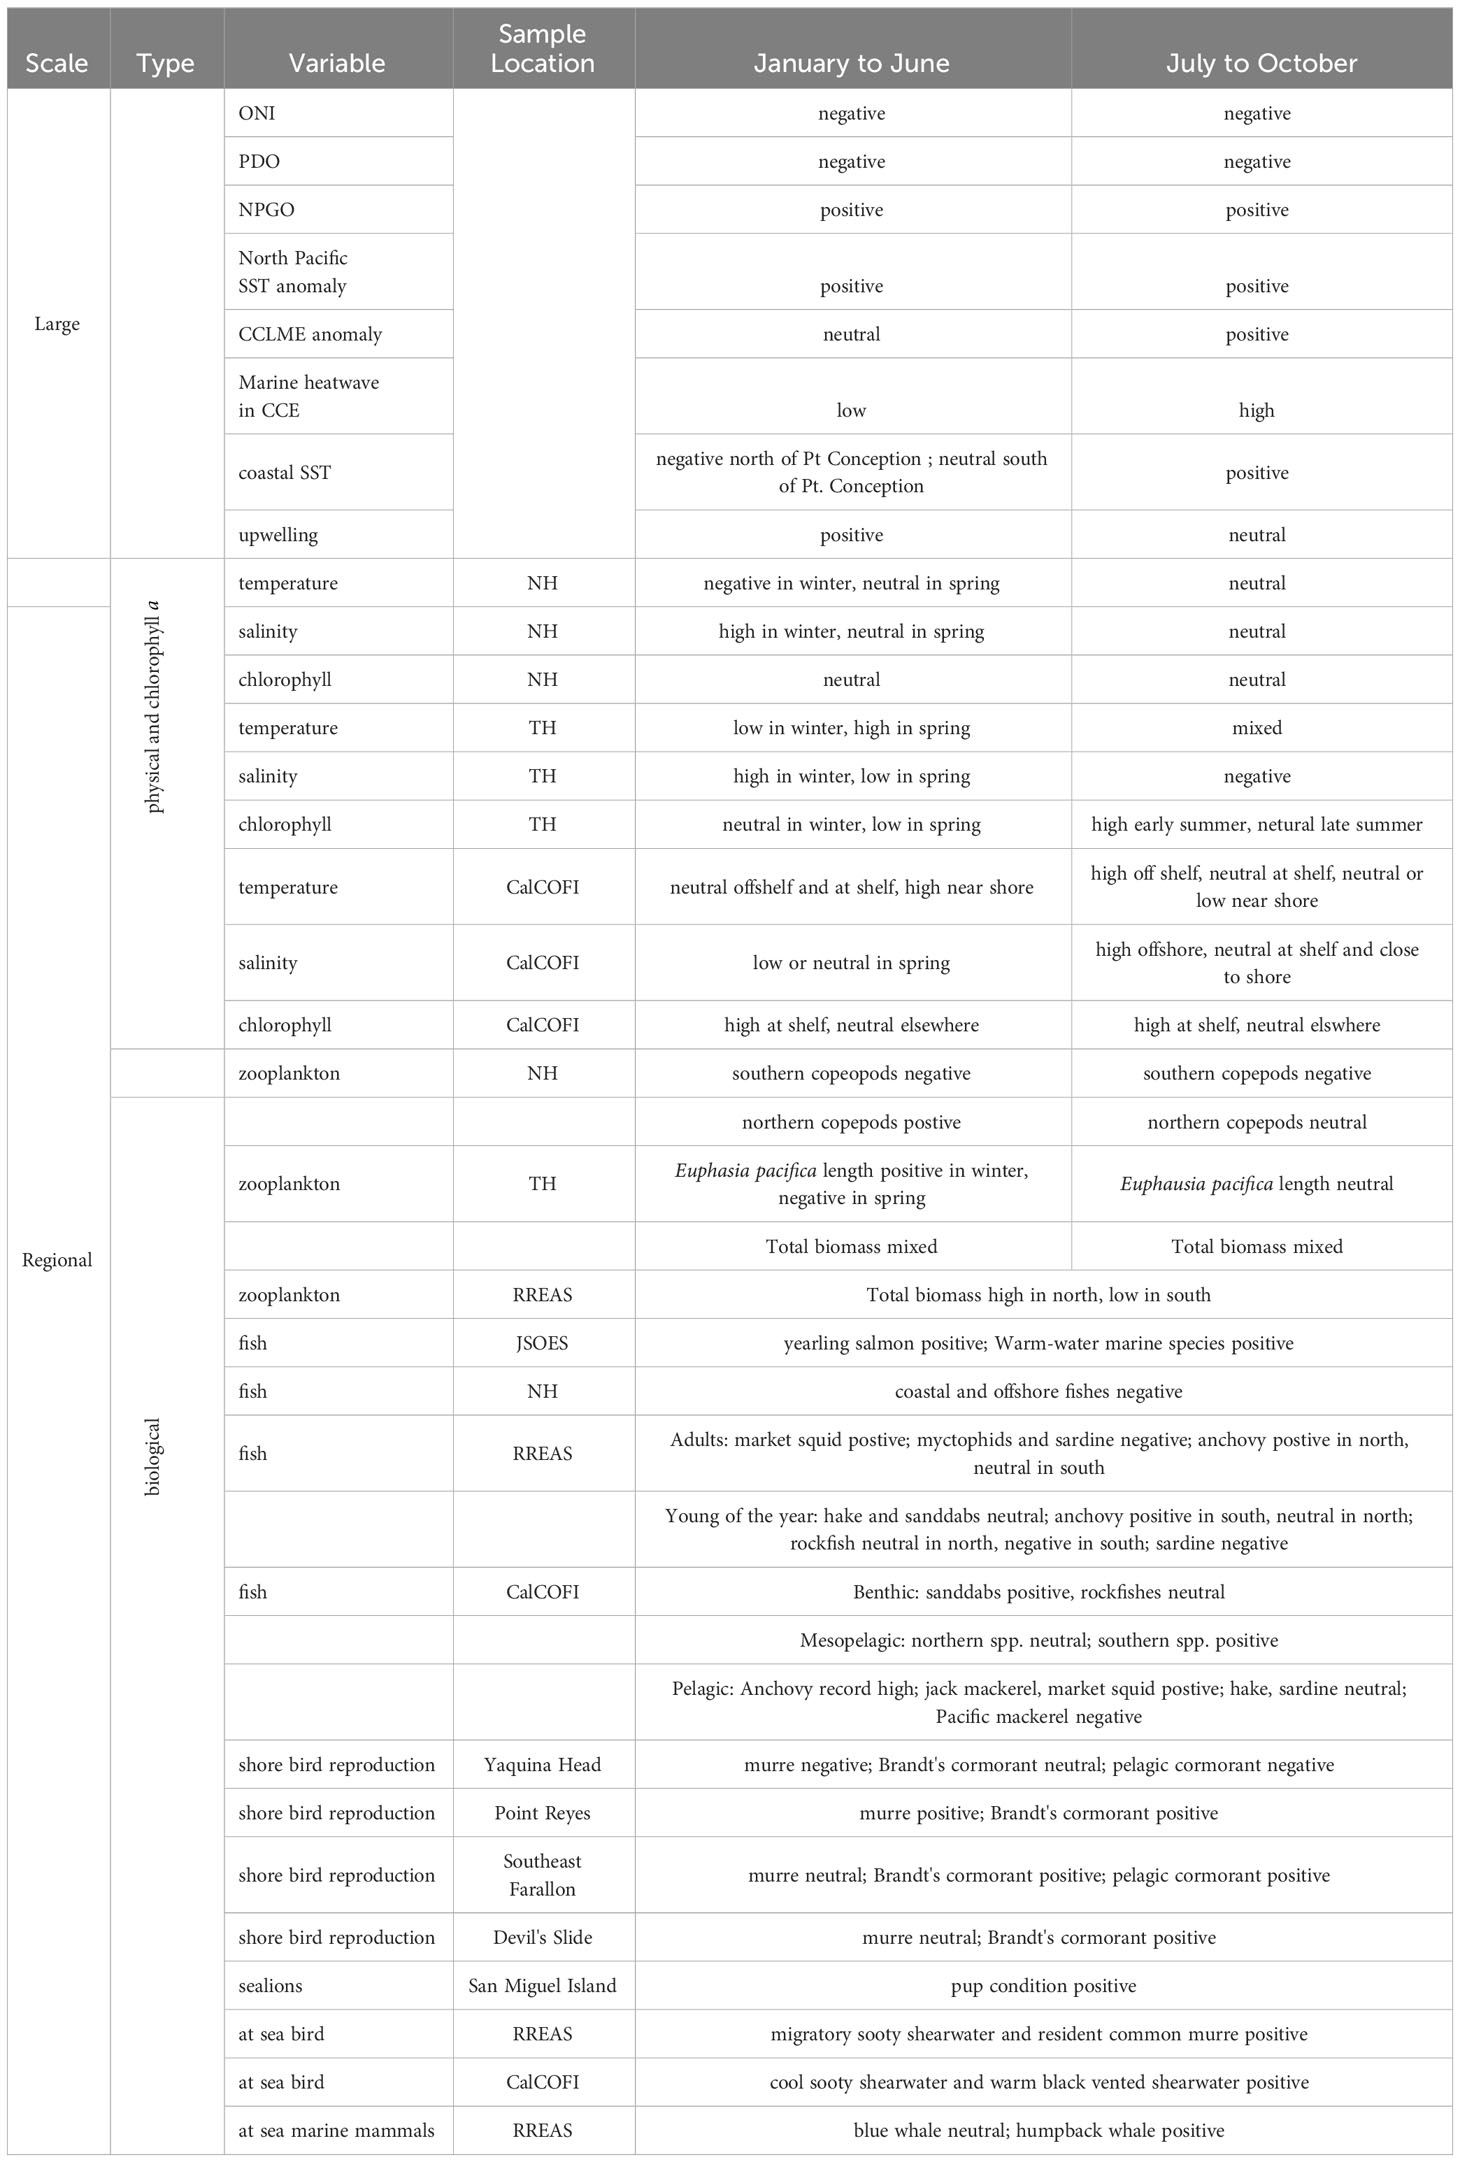
Table 1 Summary of physical and biological indicators of the status of the California Current Ecosystem in the first and second halves of 2022.
Data availability statement
The datasets presented in this study can be found in online repositories. The names of the repository/repositories and accession number(s) can be found in the article/Supplementary Material.
Ethics statement
The animal study was approved by Scripps Institution of Oceanography board of ethics. The study was conducted in accordance with the local legislation and institutional requirements.
Author contributions
AT: Conceptualization, Formal analysis, Investigation, Software, Writing – original draft, Writing – review & editing. RS: Conceptualization, Data curation, Investigation, Writing – original draft, Writing – review & editing. MA: Conceptualization, Formal analysis, Investigation, Methodology, Writing – original draft, Writing – review & editing. JS: Conceptualization, Data curation, Formal analysis, Investigation, Writing – original draft, Writing – review & editing. EH: Conceptualization, Data curation, Formal analysis, Investigation, Methodology, Writing – original draft, Writing – review & editing. AL: Data curation, Formal analysis, Writing – original draft. ES: Conceptualization, Formal analysis, Writing – original draft. WS: Conceptualization, Data curation, Formal analysis, Investigation, Methodology, Writing – original draft, Writing – review & editing. CA: Conceptualization, Data curation, Formal analysis, Investigation, Writing – original draft, Writing – review & editing. TA: Conceptualization, Data curation, Formal analysis, Investigation, Methodology, Writing – original draft, Writing – review & editing. SB-P: Conceptualization, Data curation, Methodology, Writing – original draft, Writing – review & editing. TB: Formal analysis, Writing – original draft. EB: Conceptualization, Data curation, Formal analysis, Investigation, Methodology, Writing – original draft, Writing – review & editing. SB: Conceptualization, Data curation, Formal analysis, Investigation, Writing – original draft, Writing – review & editing. NB: Formal analysis, Resources, Writing – original draft. BB: Formal analysis, Writing – original draft. ED: Conceptualization, Data curation, Formal analysis, Methodology, Writing – original draft, Writing – review & editing. HD: Conceptualization, Data curation, Formal analysis, Investigation, Writing – original draft, Writing – review & editing. JCF: Conceptualization, Data curation, Formal analysis, Funding acquisition, Investigation, Methodology, Project administration, Resources, Software, Supervision, Validation, Visualization, Writing – original draft, Writing – review & editing. JLF: Conceptualization, Data curation, Formal analysis, Investigation, Methodology, Writing – original draft, Writing – review & editing. NG: Conceptualization, Data curation, Formal analysis, Methodology, Writing – original draft, Writing – review & editing. AG: Formal analysis, Writing – original draft. RaG: Conceptualization, Data curation, Formal analysis, Investigation, Methodology, Writing – original draft, Writing – review & editing. RiG: Conceptualization, Data curation, Formal analysis, Methodology, Writing – original draft, Writing – review & editing. EG-O: Conceptualization, Data curation, Formal analysis, Investigation, Writing – original draft, Writing – review & editing. JG-V: Conceptualization, Data curation, Formal analysis, Investigation, Methodology, Writing – original draft, Writing – review & editing. JH: Formal analysis, Validation, Writing – original draft. KJ: Conceptualization, Data curation, Formal analysis, Investigation, Methodology, Writing – original draft, Writing – review & editing. MGJ: Conceptualization, Data curation, Investigation, Writing – original draft, Writing – review & editing. JJa: Conceptualization, Data curation, Formal analysis, Investigation, Writing – original draft, Writing – review & editing. MJ: Conceptualization, Data curation, Formal analysis, Investigation, Writing – original draft, Writing – review & editing. JJo: Formal analysis, Writing – original draft. BL: Formal analysis, Writing – original draft, Writing – review & editing. NM: Conceptualization, Data curation, Formal analysis, Investigation, Methodology, Writing – original draft, Writing – review & editing. GM: Formal analysis, Writing – original draft, Writing – review & editing. MM: Formal analysis, Writing – original draft. SM: Formal analysis, Writing – original draft. LM: Formal analysis, Writing – original draft. CM: Data curation, Formal analysis, Writing – original draft. CN: Data curation, Formal analysis, Investigation, Writing – original draft. RO: Formal analysis, Writing – original draft. JP: Formal analysis, Writing – original draft. AP: Data curation, Formal analysis, Investigation, Writing – original draft. RR: Conceptualization, Data curation, Formal analysis, Funding acquisition, Investigation, Methodology, Project administration, Resources, Software, Supervision, Validation, Visualization, Writing – original draft, Writing – review & editing. DR: Formal analysis, Writing – original draft, Writing – review & editing. KS: Formal analysis, Writing – original draft. CS: Formal analysis, Writing – original draft. IS: Formal analysis, Writing – original draft. LS: Conceptualization, Data curation, Formal analysis, Methodology, Writing – original draft, Writing – review & editing. OS: Data curation, Formal analysis, Methodology, Writing – original draft, Writing – review & editing. ST: Data curation, Formal analysis, Writing – original draft. PW: Formal analysis, Writing – original draft. KW: Data curation, Formal analysis, Writing – original draft. WW: Formal analysis, Writing – original draft. EW: Conceptualization, Formal Analysis, Writing – original draft. BW: Conceptualization, Formal analysis, Writing – original draft.
Funding
The author(s) declare that no financial support was received for the research, authorship, and/or publication of this article.
Acknowledgments
We would like to primarily thank the sea going folks that make collection of much of the data here possible. We also thank the CCE LTER (NSF OCE-2224726). Discussions with David Demer helped us better understand the nature of the PDO, NPGO and ONI. We would like to extend our gratitude to Greg Williams for his excellent comments on a sloppy draft of this paper. The scientific results and conclusions, as well as any views or opinions expressed herein, are those of the author(s) and do not necessarily reflect the views of NOAA or the Department of Commerce.
Conflict of interest
The authors declare that the research was conducted in the absence of any commercial or financial relationships that could be construed as a potential conflict of interest.
Publisher’s note
All claims expressed in this article are solely those of the authors and do not necessarily represent those of their affiliated organizations, or those of the publisher, the editors and the reviewers. Any product that may be evaluated in this article, or claim that may be made by its manufacturer, is not guaranteed or endorsed by the publisher.
Supplementary material
The Supplementary Material for this article can be found online at: https://www.frontiersin.org/articles/10.3389/fmars.2024.1294011/full#supplementary-material
References
Ainley D. G., Boekelheide R. J. (1990). Seabirds of the Farallon Islands: structure and dynamics of an upwelling system community (Stanford, California, USA: Stanford University Press).
Auth T. D., Daly E. A., Brodeur R. D., Fisher J. L. (2018). Phenological and distributional shifts in ichthyoplankton associated with recent warming in the northeast Pacific Ocean. Global Change Biol. 24, 259–272. doi: 10.1111/gcb.13872
Baker C. S., Herman L. M., Perry A., Lawton W. S., Straley J. M., Straley J. H. (1985). Population characteristics and migration of summer and late-season humpback whales (Megaptera novaeangliae) in southeastern Alaska. Mar. Mammal Sci. 1, 304–323. doi: 10.1111/j.1748-7692.1985.tb00018.x
Barcelo C., Ciannelli L., Brodeur R. D. (2018). Pelagic marine refugia and climatically sensitive areas in an eastern boundary current upwelling system. Global Change Biol. 24, 668–680. doi: 10.1111/gcb.13857
Bograd S. J., Schroeder I. D., Jacox M. G. (2019). A water mass history of the Southern California current system. Geophys. Res. Lett. 46, 6690–6698. doi: 10.1029/2019GL082685
Bond N. A., Batchelder H. P., Bograd S. J. (2008). Forecasting northeastern Pacific ecosystem responses to La Niña. Eos Trans. Am. Geophys. Union 89, 321–322. doi: 10.1029/2008EO350002
Broughton J. M., Codding B. F., Faith J. T., Mohlenhoff K. A., Gruhn R., Brenner-Coltrain J., et al. (2022). El Niño frequency threshold controls coastal biotic communities. Science 377, 1202–1205. doi: 10.1126/science.abm1033
Burford B. P., Wild L. A., Schwarz R., Chenoweth E. M., Sreenivasan A., Elahi R., et al. (2022). Rapid range expansion of a marine ectotherm reveals the demographic and ecological consequences of short-term variability in seawater temperature and dissolved oxygen. Am. Nat. 199, 523–550. doi: 10.1086/718575
Calambokidis J., Steiger G. H., Rasmussen K., Urbán J. R., Balcomb K. C., Ladrón de Guevara P., et al. (2000). Migratory destinations of humpback whales that feed off California, Oregon and Washington. Mar. Ecol. Prog. Ser. 192, 295–304. doi: 10.3354/meps192295
Campbell G. S., Thomas L., Whitaker K., Douglas A. B., Calambokidis J., Hildebrand J. A. (2015). Inter-annual and seasonal trends in cetacean distribution, density and abundance off southern California. Deep Sea Res. Part II: Topical Stud. Oceanogr. 112, 143–157. doi: 10.1016/j.dsr2.2014.10.008
Capotondi A., Wittenberg A. T., Newman M., Di Lorenzo E., Yu J.-Y., Braconnot P., et al. (2015). Understanding ENSO diversity. Bull. Am. Meteorol. Soc. 96, 921–938. doi: 10.1175/BAMS-D-13-00117.1
Chasco B. E., Hunsicker M. E., Jacobson K. C., Welch O. T., Morgan C. A., Muhling B. A., et al. (2022). Evidence of temperature-driven shifts in market squid doryteuthis opalescens densities and distribution in the California current ecosystem. Mar. Coast. Fish. 14, e10190. doi: 10.1002/mcf2.10190
Chavez F. P., Pennington J. T., Castro C. G., Ryan J. P., Michisaki R. P., Schlining B., et al. (2002). Biological and chemical consequences of the 1997-1998 El Nino in central California waters. Prog. Oceanogr. 54, 205–232. doi: 10.1016/S0079-6611(02)00050-2
Chavez F. P., Ryan J., Lluch-Cota S. E., Niquen M. (2003). From anchovies to sardines and back: Multidecadal change in the Pacific Ocean. Science 299, 217–221. doi: 10.1126/science.1075880
Cobb K. M., Westphal N., Sayani H. R., Watson J. T., Di Lorenzo E., Cheng H., et al. (2013). Highly variable El Niño–Southern oscillation throughout the holocene. Science 339, 67–70. doi: 10.1126/science.1228246
Daly E. A., Auth T. D., Brodeur R. D., Peterson W. T. (2013). Winter ichthyoplankton biomass as a predictor of early summer prey fields and survival of juvenile salmon in the northern California Current. Mar. Ecol. Prog. Ser. 484, 203–217. doi: 10.3354/meps10320
Daly E. A., Brodeur R. D., Morgan C. A., Burke B. J., Huff D. H. (2021). Prey selectivity and diet partitioning of juvenile salmon in coastal waters in relation to prey biomass and implications for salmon early marine survival. North Pacific Anadromous Fish Commission Tech. Rep. 17, 53–56.
Di Lorenzo E., Schneider N., Cobb K. M., Franks P. J. S., Chhak K., Miller A. J., et al. (2008). North Pacific Gyre Oscillation links ocean climate and ecosystem change. Geophys. Res. Lett. 35, L08607. doi: 10.1029/2007GL032838
Echevin V., Colas F., Espinoza-Morriberon D., Vasquez L., Anculle T., Gutierrez D. (2018). Forcings and evolution of the 2017 coastal El Niño off northern Peru and Ecuador. Front. Mar. Sci. 5. doi: 10.3389/fmars.2018.00367
Fennie H. W., Seary R., Muhling B. A., Bograd S. J., Brodie S., Cimino M. A., et al. (2023). An anchovy ecosystem indicator of marine predator foraging and reproduction. Proc. R. Soc. B: Biol. Sci. 290, 2022–2326. doi: 10.1098/rspb.2022.2326
Fiedler P. C., Mantua N. J. (2017). How are warm and cool years in the California Current related to ENSO? J. Geophys. Res.: Oceans 122, 5936–5951. doi: 10.1002/2017JC013094
Fleming A. H., Clark C. T., Calambokidis J., Barlow J. (2016). Humpback whale diets respond to variance in ocean climate and ecosystem conditions in the California Current. Global Change Biol. 22, 1214–1224. doi: 10.1111/gcb.13171
Free C. M., Anderson S. C., Hellmers E. A., Muhling B. A., Navarro M. O., Richerson K., et al. (2023). Impact of the 2014–2016 marine heatwave on US and Canada West Coast fisheries: Surprises and lessons from key case studies. Fish Fish. 24, 652–674. doi: 10.1111/faf.12753
Friedman W. R., Santora J. A., Schroeder I. D., Huff D. D., Brodeur R. D., Field J. C., et al. (2018). Environmental and geographic relationships among salmon forage assemblages along the continental shelf of the California Current. Mar. Ecol. Prog. Ser. 596, 181–198. doi: 10.3354/meps12598
Frölicher T. L., Fischer E. M., Gruber N. (2018). Marine heatwaves under global warming. Nature 560, 360–364. doi: 10.1038/s41586-018-0383-9
Gallo N. D., Bowlin N. M., Thompson A. R., Satterthwaite E. V., Brady B., Semmens B. X. (2022). Fisheries surveys are essential ocean observing programs in a time of global change: A synthesis of oceanographic and ecological data from U.S. West coast fisheries surveys. Front. Mar. Sci. 9, 757124. doi: 10.3389/fmars.2022.757124
Hallett T. B., Coulson T., Pilkington J. G., Clutton-Brock T. H., Pemberton J. M., Grenfell B. T. (2004). Why large-scale climate indices seem to predict ecological processes better than local weather. Nature 430, 71–75. doi: 10.1038/nature02708
Harding A. M. A., Piatt J. F., Schmutz J. A., Shultz M. T., van Pelt T. I., Kettle A. B., et al. (2007). Prey density and the behavioral flexibility of a marine predator: The common murre (Uria aalge). Ecology 88, 2024–2033. doi: 10.1890/06-1695.1
Hare S. R., Mantua N. J. (2000). Empirical evidence for North Pacific regime shifts in 1977 and 1989. Prog. Oceanogr. 47, 103–145. doi: 10.1016/S0079-6611(00)00033-1
Hentati-Sundberg J., Berglund P.-A., Hejdström A., Olsson O. (2021). COVID-19 lockdown reveals tourists as seabird guardians. Biol. Conserv. 254, 108950. doi: 10.1016/j.biocon.2021.108950
Hobday A. J., Alexander L. V., Perkins S. E., Smale D. A., Straub S. C., Oliver E. C. J., et al. (2016). A hierarchical approach to defining marine heatwaves. Prog. Oceanogr. 141, 227–238. doi: 10.1016/j.pocean.2015.12.014
Hong H.-J., Hsu H.-H. (2023). Remote tropical central Pacific influence on driving sea surface temperature variability in the Northeast Pacific. Environ. Res. Lett. 18, 044005. doi: 10.1088/1748-9326/acc087
Hsieh C., Kim H. J., Watson W., Di Lorenzo E., Sugihara G. (2009). Climate-driven changes in abundance and distribution of larvae of oceanic fishes in the southern California region. Global Change Biol. 15, 2137–2152. doi: 10.1111/j.1365-2486.2009.01875.x
Iglesias I., Santora J., Field J. (2023). Mesopelagic fishes are important prey for a diversity of predators. Front. Mar. Sci 10. doi: 10.3389/fmars.2023.1220088
Irvine L. M., Mate B. R., Winsor M. H., Palacios D. M., Bograd S. J., Costa D. P., et al. (2014). Spatial and temporal occurrence of blue whales off the U.S. West Coast, with implications for management. PLoS One 9 (7), e102959. doi: 10.1371/journal.pone.0102959
Jacox M. G., Alexander M. A., Amaya D., Becker E., Bograd S. J., Brodie S., et al. (2022). Global seasonal forecasts of marine heatwaves. Nature 604, 486–490. doi: 10.1038/s41586-022-04573-9
Jacox M. G., Alexander M. A., Bograd S. J., Scott J. D. (2020). Thermal displacement by marine heatwaves. Nature 584, 82–86. doi: 10.1038/s41586-020-2534-z
Jacox M. G., Edwards C. A., Hazen E. L., Bograd S. J. (2018). Coastal upwelling revisited: ekman, bakun, and improved upwelling indices for the U.S. West Coast. J. Geophys. Res.: Oceans 123, 7332–7350. doi: 10.1175/bams-d-17-0119.1
Jo H.-S., Yeh S.-W., Lee S.-K. (2015). Changes in the relationship in the SST variability between the tropical Pacific and the North Pacific across the 1998/1999 regime shift. Geophys. Res. Lett. 42, 7171–7178. doi: 10.1002/2015GL065049
Jones T., Parrish J. K., Peterson W. T., Bjorkstedt E. P., Bond N. A., Ballance L. T., et al. (2018). Massive mortality of a planktivorous seabird in response to a marine heatwave. Geophys. Res. Lett. 45, 3193–3202. doi: 10.1002/2017GL076164
Laake J. L., Lowry M. S., DeLong R. L., Melin S. R., Carretta J. V. (2018). Population growth and status of california sea lions. J. Wildl. Manage. 82, 583–595. doi: 10.1002/jwmg.21405
Lilly L. E., Ohman M. D. (2018). CCE IV: El Niño-related zooplankton variability in the southern California Current System. Deep Sea Res. Part I: Oceanogr. Res. Papers 140, 36–51. doi: 10.1016/j.dsr.2018.07.015
Lilly L. E., Ohman M. D. (2021). Euphausiid spatial displacements and habitat shifts in the southern California Current System in response to El Nino variability. Prog. Oceanogr. 193, 26. doi: 10.1016/j.pocean.2021.102544
Litzow M. A., Ciannelli L., Puerta P., Wettstein J. J., Rykaczewski R. R., Opiekun M. (2018). Non-stationary climate–salmon relationships in the Gulf of Alaska. Proc. R. Soc. B: Biol. Sci. 285, 20181855. doi: 10.1098/rspb.2018.1855
Litzow M. A., Hunsicker M. E., Bond N. A., Burke B. J., Cunningham C. J., Gosselin J. L., et al. (2020a). The changing physical and ecological meanings of North Pacific Ocean climate indices. Proc. Natl. Acad. Sci. 117, 7665–7671. doi: 10.1073/pnas.1921266117
Litzow M. A., Malick M. J., Bond N. A., Cunningham C. J., Gosselin J. L., Ward E. J. (2020b). Quantifying a novel climate through changes in PDO-climate and PDO-salmon relationships. Geophys. Res. Lett. 47, e2020GL087972. doi: 10.1029/2020GL087972
Loredo S. A., Orben R. A., Suryan R. M., Lyons D. E., Adams J., Stephensen S. W. (2019). Spatial and temporal diving behavior of non-breeding common murres during two summers of contrasting ocean conditions. J. Exp. Mar. Biol. Ecol. 517, 13–24. doi: 10.1016/j.jembe.2019.05.009
Mantua N. J., Hare S. R., Zhang Y., Wallace J. M., Francis R. (1997). A pacific interdecadal climate oscillation with impacts on salmon production. Bull. Am. Meteorol. Soc. 78, 1069–1079. doi: 10.1175/1520-0477(1997)078<1069:APICOW>2.0.CO;2
McClatchie S., Field J. C., Thompson A. R., Gerrodette T., Lowry M., Fiedler P. C., et al. (2016a). Food limitation of sea lion pups and the decline of forage off central and southern California. R. Soc. Open Sci. 3, 150628. doi: 10.1098/rsos.150628
McClatchie S., Goericke R., Leising A. L., Auth T. D., Bjorkstedt E., Robertson R. R., et al. (2016b). State of the California current 2015–16: comparisons with the 1997–98 El Niño. CalCOFI Rep. 57, 1–57. doi: 10.1098/rsos.150628
Moser H. G., Smith P. E., Eber L. E. (1987). Larval fish assemblages in the California Current region 1954-1960, a period of dynamic environmental change. California Coop. Ocean Fish. Invest. Rep. 28, 97–127.
Nickels C. F., Sala L. M., Ohman M. D. (2019). The euphausiid prey field for blue whales around a steep bathymetric feature in the southern California current system. Limnol. Oceanogr. 64, 390–405. doi: 10.1002/lno.11047
Nielsen J. M., Rogers L. A., Brodeur R. D., Thompson A. R., Auth T. D., Deary A., et al. (2021). Responses of ichthyoplankton assemblages to the recent marine heatwave and previous climate fluctuations in several Northeast Pacific marine ecosystems. Global Change Biol. 27, 506–520. doi: 10.1111/gcb.15415
Ohlberger J., Ward E. J., Brenner R. E., Hunsicker M. E., Haught S. B., Finnoff D., et al. (2022). Non-stationary and interactive effects of climate and competition on pink salmon productivity. Global Change Biol. 28, 2026–2040. doi: 10.1111/gcb.16049
Oliver E. C. J., Donat M. G., Burrows M. T., Moore P. J., Smale D. A., Alexander L. V., et al. (2018). Longer and more frequent marine heatwaves over the past century. Nat. Commun. 9, 1324. doi: 10.1038/s41467-018-03732-9
Park J.-Y., Yeh S.-W., Kug J.-S. (2012). Revisited relationship between tropical and North Pacific sea surface temperature variations. Geophys. Res. Lett. 39, L02703. doi: 10.1029/2011GL050005
Peterson W. T., Fisher J. L., Peterson J. O., Morgan C. A., Burke B. J., Fresh K. L. (2014). Applied fisheries oceanography: ecosystem indicators of ocean conditions inform fisheries management in the California current. Oceanography 27, 80–89. doi: 10.5670/oceanog.2014.88
Peterson W. T., Fisher J. L., Strub P. T., Du X., Risien C., Peterson J., et al. (2017). The pelagic ecosystem in the Northern California Current off Oregon during the 2014–2016 warm anomalies within the context of the past 20 years. J. Geophys. Res.: Oceans 122, 7267–7290. doi: 10.1002/2017JC012952
Pistorius P. A., Sydeman W. J., Watanuki Y., Thompson S. A., Orgeret F. (2023). “Chapter 8 - Climate change: The ecological backdrop of seabird conservation,” in Conservation of Marine Birds. Eds. Young L., VanderWerf E. (Academic Press), 245–276.
Porquez J. M., Klunis L., Kim E., Cox A., Dlinajec N., Orben R. A. (2021). Yaquina Head Seabird Colony: 2021 Season Summary (Corvallis, OR, USA: Department of Fisheries, Wildlife, and Conservation Sciences, Oregon State University). Available at: https://hmsc.oregonstate.edu/sites/hmsc.oregonstate.edu/files/yhona_finalreport2021.pdf.
Ren A. S., Rudnick D. L. (2021). Temperature and salinity extremes from 2014-2019 in the California Current System and its source waters. Commun. Earth Environ. 2, 62. doi: 10.1038/s43247-021-00131-9
Robertson R. R., Bjorkstedt E. P. (2020). Climate-driven variability in Euphausia pacifica size distributions off northern California. Prog. Oceanogr. 188, 102412. doi: 10.1016/j.pocean.2020.102412
Robidas M. L. (2023). What drives larval condition for Northern Anchovy (Engraulis mordax)? Implications for coastal pelagic species recruitment fluctuations and fishery management practices. Masters Thesis (San Diego, CA, USA:: University of San Diego).
Sakuma K. M., Field J. C., Mantua N. J., Ralston S., Marinovich B. B., Carrion C. N. (2016). Anomalous epipelagic micronekton assemblage patterns in the neritic waters of the california current in spring 2015 during a period of extreme ocean conditions. CalCOFI Rep. 57, 163–183.
Santora J. A., Hazen E. L., Schroeder I. D., Bograd S. J., Sakuma K. M., Field J. C. (2017). Impacts of ocean climate variability on biodiversity of pelagic forage species in an upwelling ecosystem. Mar. Ecol. Prog. Ser. 580, 205–220. doi: 10.3354/meps12278
Santora J. A., Rogers T. L., Cimino M. A., Sakuma K. M., Hanson K. D., Dick E. J., et al. (2021). Diverse integrated ecosystem approach overcomes pandemic-related fisheries monitoring challenges. Nat. Commun. 12, 6492. doi: 10.1038/s41467-021-26484-5
Santora J. A., Schroeder I. D., Field J. C., Wells B. K., Sydeman W. J. (2014). Spatio-temporal dynamics of ocean conditions and forage taxa reveal regional structuring of seabird–prey relationships. Ecol. Appl. 24, 1730–1747. doi: 10.1890/13-1605.1
Santora J. A., Sydeman W. J., Schroeder I. D., Wells B. K., Field J. C. (2011). Mesoscale structure and oceanographic determinants of krill hotspots in the California Current: Implications for trophic transfer and conservation. Prog. Oceanogr. 91, 397–409. doi: 10.1016/j.pocean.2011.04.002
Schroeder I. D., Santora J. A., Bograd S. J., Hazen E. L., Sakuma K. M., Moore A. M., et al. (2019). Source water variability as a driver of rockfish recruitment in the California Current Ecosystem: implications for climate change and fisheries management. Can. J. Fish. Aquat. Sci. 76, 950–960. doi: 10.1139/cjfas-2017-0480
Schroeder I. D., Santora J. A., Mantua N., Field J. C., Wells B. K., Hazen E. L., et al. (2022). Habitat compression indices for monitoring ocean conditions and ecosystem impacts within coastal upwelling systems. Ecol. Indic. 144, 109520. doi: 10.1016/j.ecolind.2022.109520
Shen S. G., Thompson A. R., Correa J., Fietzek P., Ayón P., Checkley D. M. (2017). Spatial patterns of Anchoveta (Engraulis ringens) eggs and larvae in relation to pCO2 in the Peruvian upwelling system. Proc. R. Soc. B: Biol. Sci. 284, 20170509. doi: 10.1098/rspb.2017.0509
Suca J. J., Santora J. A., Field J. C., Curtis K. A., Muhling B. A., Cimino M. A., et al. (2022). Temperature and upwelling dynamics drive market squid (Doryteuthis opalescens) distribution and abundance in the California Current. ICES J. Mar. Sci. 79, 2489–2509. doi: 10.1093/icesjms/fsac186
Swalethorp R., Landry M. R., Semmens B. X., Ohman M. D., Aluwihare L., Chargualaf D., et al. (2023). Anchovy boom and bust linked to trophic shifts in larval diet. Nat. Commun. 14, 7412. doi: 10.1038/s41467-023-42966-0
Sydeman W. J., Force M., Santora J., Thompson S. A. (2021a). Seabirds and Marine Mammals on the NMFS Rockfish Recruitment and Ecosystem Assessment Survey: 2021 Data Report (Petaluma, CA, USA: Farralon Institute).
Sydeman W. J., Hester M. M., Thayer J. A., Gress F., Martin P., Buffa J. (2001). Climate change, reproductive performance and diet composition of marine birds in the southern California Current system 1969–1997. Prog. Oceanogr. 49, 309–329. doi: 10.1016/S0079-6611(01)00028-3
Sydeman W. J., Wright C., Thompson S. A. (2021b). Seabirds on the CalCOFI/CCE-LTER Survey, Summer 2021 Data Report (Petaluma, CA, USA: Farralon Institute).
Thompson A. R., Watson W., McClatchie S., Weber E. D. (2012). Multi-scale sampling to evaluate assemblage dynamics in an oceanic marine reserve. PloS One 7, e33131. doi: 10.1371/journal.pone.0033131
Thompson A. R., McClatchie S., Weber E. D., Watson W., Lennert-Cody C. E. (2017). Correcting for bias in ichthyoplankton abundance estimates associated with the 1977 transition form ring to bongo net sampling. CalCOFI Rep. 58, 113–123.
Thompson A. R., Schroeder I. D., Bograd S. J., Hazen E. L., Jacox M. G., Leising A. L., et al. (2018). State of the California Current 2017-18: Still not quite normal in the north and getting interesting in the south. CalCOFI Rep. 59, 1–66.
Thompson A. R., Harvey C. J., Sydeman W. J., Barceló C., Bograd S. J., Brodeur R. D., et al. (2019a). Indicators of pelagic forage community shifts in the California Current Large Marine Ecosystem 1998–2016. Ecol. Indic. 105, 215–228. doi: 10.1016/j.ecolind.2019.05.057
Thompson A. R., Schroeder I. D., Bograd S. J., Hazen E. L., Jacox M. G., Leising A. L., et al. (2019b). State of the California Current 2018-19: a novel anchovy regime and a new marine heatwave? CalCOFI Rep. 60, 1–65. doi: 10.3389/fmars.2022.958727
Thompson A. R., Ben-Aderet N. J., Bowlin N. M., Kacev D., Swalethorp R., Watson W. (2022a). Putting the Pacific marine heatwave into perspective: The response of larval fish off southern California to unprecedented warming in 2014–2016 relative to the previous 65 years. Global Change Biol. 28, 1766–1785. doi: 10.1111/gcb.16010
Thompson A. R., Bjorkstedt E. P., Steven J. Bograd J. L., Hazen E. L., Leising A., Santora J. A., et al. (2022b). State of the California current ecosystem in 2021: winter is coming? Front. Mar. Sci. 9, 958727. doi: 10.3389/fmars.2022.958727
Timmermann A., An S.-I., Kug J.-S., Jin F.-F., Cai W., Capotondi A., et al. (2018). El Niño–Southern oscillation complexity. Nature 559, 535–545. doi: 10.1038/s41586-018-0252-6
Wachtendonk R., Calambokidis J., Flynn K. (2022). Blue whale body condition assessed over a 14-year period in the NE Pacific: annual variation and connection to measures of ocean productivity. Front. Mar. Sci. 9. doi: 10.3389/fmars.2022.847032
Weber E. D., Auth T. D., Baumann-Pickering S., Baumgartner T. R., Bjorkstedt E. P., Bograd S. J., et al. (2021). State of the California current 2019–2020: back to the future with marine heatwaves? Front. Mar. Sci. 8, 709454. doi: 10.3389/fmars.2021.709454
Werb B. E., Rudnick D. L. (2023). Remarkable changes in the dominant modes of North Pacific sea surface temperature. Geophys. Res. Lett. 50, e2022GL101078. doi: 10.1029/2022GL101078
Yeh S.-W., Kang Y.-J., Noh Y., Miller A. J. (2011). The North Pacific climate transitions of the winters of 1976/77 and 1988/89. J. Climate 24, 1170–1183. doi: 10.1175/2010JCLI3325.1
Yeo S.-R., Kim K.-Y., Yeh S.-W., Kim W. (2012). Decadal changes in the relationship between the tropical Pacific and the North Pacific. J. Geophys. Res.: Atmos., 117, D15102. doi: 10.1029/2012JD017775
Keywords: California Current, marine heatwave, La Niña/El Niño, California Cooperative Oceanic Fisheries Investigation, global warming
Citation: Thompson AR, Swalethorp R, Alksne M, Santora JA, Hazen EL, Leising A, Satterthwaite E, Sydeman WJ, Anderson CR, Auth TD, Baumann-Pickering S, Baumgardner T, Bjorkstedt EP, Bograd SJ, Bowlin NM, Burke BJ, Daly EA, Dewar H, Field JC, Fisher JL, Garfield N, Gidding A, Goericke R, Golightly R, Gómez-Ocampo E, Gomez-Valdes J, Hildebrand JA, Jacobson KC, Jacox MG, Jahncke J, Johns M, Jones JM, Lavaniegos B, Mantua N, McChesney GJ, Medina ME, Melin SR, Miranda LE, Morgan CA, Nickels CF, Orben RA, Porquez JM, Preti A, Robertson RR, Rudnick DL, Sakuma KM, Schacter CR, Schroeder ID, Scopel L, Snodgrass OE, Thompson SA, Warzybok P, Whitaker K, Watson W, Weber ED and Wells B (2024) State of the California Current Ecosystem report in 2022: a tale of two La Niñas. Front. Mar. Sci. 11:1294011. doi: 10.3389/fmars.2024.1294011
Received: 14 September 2023; Accepted: 22 January 2024;
Published: 09 February 2024.
Edited by:
Ibon Galparsoro, Technological Center Expert in Marine and Food Innovation (AZTI), SpainReviewed by:
Daniele Bianchi, University of California, Los Angeles, United StatesKelly A. Kearney, University of Washington, United States
Copyright © 2024 Thompson, Swalethorp, Alksne, Santora, Hazen, Leising, Satterthwaite, Sydeman, Anderson, Auth, Baumann-Pickering, Baumgardner, Bjorkstedt, Bograd, Bowlin, Burke, Daly, Dewar, Field, Fisher, Garfield, Gidding, Goericke, Golightly, Gómez-Ocampo, Gomez-Valdes, Hildebrand, Jacobson, Jacox, Jahncke, Johns, Jones, Lavaniegos, Mantua, McChesney, Medina, Melin, Miranda, Morgan, Nickels, Orben, Porquez, Preti, Robertson, Rudnick, Sakuma, Schacter, Schroeder, Scopel, Snodgrass, Thompson, Warzybok, Whitaker, Watson, Weber and Wells. This is an open-access article distributed under the terms of the Creative Commons Attribution License (CC BY). The use, distribution or reproduction in other forums is permitted, provided the original author(s) and the copyright owner(s) are credited and that the original publication in this journal is cited, in accordance with accepted academic practice. No use, distribution or reproduction is permitted which does not comply with these terms.
*Correspondence: Andrew R. Thompson, YW5kcmV3LnRob21wc29uQG5vYWEuZ292