 Robert A. Literman
 Mayara P. V. Matos
 Sara M. Handy
 Jonathan R. Deeds3
- 1Office of Analytics and Outreach, Center for Food Safety and Applied Nutrition, U.S. Food and Drug Administration, College Park, MD, United States
- 2Office of Food Safety, Center for Food Safety and Applied Nutrition, U.S. Food and Drug Administration, College Park, MD, United States
- 3Office of Regulatory Science, Center for Food Safety and Applied Nutrition, U.S. Food and Drug Administration, College Park, MD, United States
The commercially important species Lutjanus campechanus (Northern/Gulf red snapper) and Lutjanus purpureus (Southern/Caribbean red snapper) are the protagonists of a decade’s long taxonomic debate over their species delimitation, due in part to partial habitat overlap, extensive morphological similarity, and the lack of resolution when applying canonically reliable DNA barcoding approaches. In this study, we leveraged publicly available RAD-Seq data for L. campechanus and L. purpureus to identify species-informative single‐nucleotide polymorphisms (SNPs) at the genome scale that were successful in distinguishing the Northern and Southern red snappers, while also detecting individuals exhibiting introgression. This 4-step empirical approach demonstrates the value of applying novel bioinformatics pipelines to existing genome-scale data to maximize the distillation of informative subsets. Our results facilitate economically relevant species identification in addition to confirming or challenging species identifications for specimens with data in public databases. These findings and their applications will benefit future sustainability strategies and broader research questions surrounding these overfished and evolutionarily entangled snapper species.
1 Introduction
Global fish production is estimated at $401 billion USD and fish consistently holds its place as one of the major food commodities across the globe (FAO, 2020). Routine assessment of fish population structure remains an important factor towards minimizing over-exploitation and improving fisheries’ stock, but understanding abundances and geographic distribution relies critically on accurate species identification (Ying et al., 2011). Morphological species identification in fishes can be challenging in earlier life stages (Yancy et al., 2008), and the lack of diagnostic morphologic traits persists through adulthood for some cryptic species (Griffiths et al., 2010; Lara et al., 2010; Melo et al., 2016). In these cases, molecular approaches ranging from analyses of single loci to large swaths of the genome have directly contributed to the advancement of conservation efforts by facilitating the development of more informed fishery management strategies (Gomes et al., 2012; Ovenden et al., 2015).
Snappers (Lutjanidae) are commercially important reef-associated fishes normally found around natural and artificial reefs and occasionally in open waters (Gallaway et al., 2009; Dance et al., 2011). According to traditional morphology-based assessments, Lutjanus campechanus Poey, 1860 (Northern/Gulf red snapper) is distributed mainly off the South Atlantic coast of the United States, the Gulf of Mexico, and down through the eastern coastal waters of Central America, with sporadic reports of expanded southern ranges reaching the coastal and offshore waters around northern South America (Rivas, 1966; NOAA, 2022). The sister species L. purpureus Poey, 1866 (Southern/Caribbean red snapper) is found in seas off the coast of southeastern Brazil, northwards through to the Caribbean Sea, but reports have been observed further north in the Yucatan Peninsula (Mexico) and even in the United States off the coasts of the Carolinas, Georgia, and Northeast Florida (Rivas, 1966; Moura and Lindeman, 2007). Both species provide major economic resources for local fisheries (Charuau et al., 2001; Marko et al., 2004; Begossi et al., 2011; NOAA, 2022), with commercial landings of L. campechanus in the United States totaling around 7.7 million pounds ($33 million USD) in 2021 (NOAA, 2022). However, due in part to remarkable morphological resemblance across life stages and their partially overlapping distribution, specimens of L. campechanus and L. purpureus are frequently misidentified, exacerbating a century-long taxonomic debate (Rivas, 1966).
In practice, DNA barcoding using cytochrome c oxidase subunit 1 (COI) can accurately identify many commercial species of fish (Handy et al., 2011) which assists in answering questions about species distribution, evolutionary history, and for assessing the authenticity and accurate labeling of fish and seafood products (Staffen et al., 2017; Willette et al., 2017; Christiansen et al., 2018; Chen et al., 2019; Nehal et al., 2021). Despite its successful applicability for most fish species, small-scale barcoding strategies fail to discriminate closely related species with low genetic divergence such as L. campechanus and L. purpureus (Cawthorn et al., 2018; Silva et al., 2018). Early research classified Northern and Southern red snappers as two separate species (Rivas, 1966), but follow-up studies argued that they are essentially conspecific populations with widespread distribution across the western Atlantic region (Cervigón, 1993; Gomes et al., 2008, 2012). Multi-gene mitochondrial DNA (mtDNA) data along with reports of interspecific hybridization in northern South America (Pedraza-Marron et al., 2019) suggest regular gene flow between the species (Gomes et al., 2008, 2012; Silva et al., 2018). Supplementing mitochondrial data with nuclear gene data and otolith morphometrics also failed to reveal a robust species-informative signal (Marval-Rodríguez et al., 2022), but recent studies based on genome-wide restriction-site associated DNA sequencing (RAD-seq) found sufficient genetic evidence to support the hypothesis that L. campechanus and L. purpureus should be considered two unique species, albeit with significant admixture at intermediate latitudes (Pedraza-Marron et al., 2019; Silva et al., 2020).
Here, we leverage a recently published genome assembly for L. campechanus (Norrell et al., 2020) along with previously published RAD-Seq data (Pedraza-Marron et al., 2019) to identify a genome-wide panel of over 10,000 single-nucleotide polymorphisms (SNPs) capable of in silico delineation of L. campechanus and L. purpureus. Fish from the more extreme ends of their respective ranges displayed significant differentiation, but we also observed more of an allelic patchwork in samples from more intermediate latitudes. We rolled all analytical steps for SNP-based species identification into the open-source, user-friendly tool “Snapper Sniffer” (https://github.com/BobLiterman/Snapper_Sniffer), and applied this tool to assess species assignments for all red snapper individuals with genome-scale data hosted at the National Center for Biotechnology Information (NCBI). The basic steps of this pipeline are readily adaptable for many biological systems, providing a rapid option for the development of DNA-based species identification assays for species with limited genomic resources, or whenever low sequence diversity restricts the utility of canonical PCR primers and DNA barcoding assays.
2 Materials and methods
A detailed stepwise description of the procedures can be found on the following GitHub repository: https://github.com/BobLiterman/Snapper_RADSeq
2.1 Pre-processing of sequencing data
All RAD-Seq data for this study were downloaded from the NCBI Short Read Archive (Supplementary Table S1) and were published along with the following studies: PRJNA243918 (Puritz et al., 2014), PRJNA325063 (Norrell et al., 2020), PRJNA329407 (Puritz et al., 2016), PRJNA524905 (Pedraza-Marron et al., 2019), PRJNA783042 (Portnoy et al., 2022). We trimmed and quality-filtered all reads with bbduk from the BBMap suite v. 38.86 (B. Bushnell - sourceforge.net/projects/bbmap/) using a sliding window with a Q10-cutoff and removing reads with a post-trimming minimum average quality below Q15 and/or a length less than 50bp.
2.2 Identification of species-informative single-nucleotide polymorphisms
Designing effective species-informative SNPs relies on selecting appropriate reference samples. To that end, we generated our final diagnostic SNP dataset after four iterative rounds of comparisons and filtering (Figure 1), selecting reference individuals in each round that displayed maximal species separation. SNPs were designed based on RAD-seq data from Pedraza-Marron et al. (2019), and we mapped all RAD-Seq datasets against the draft L. campechanus genome from Norrell et al. (2020) using bbmap as implemented in the SISRS bioinformatics package (Schwartz et al., 2015).
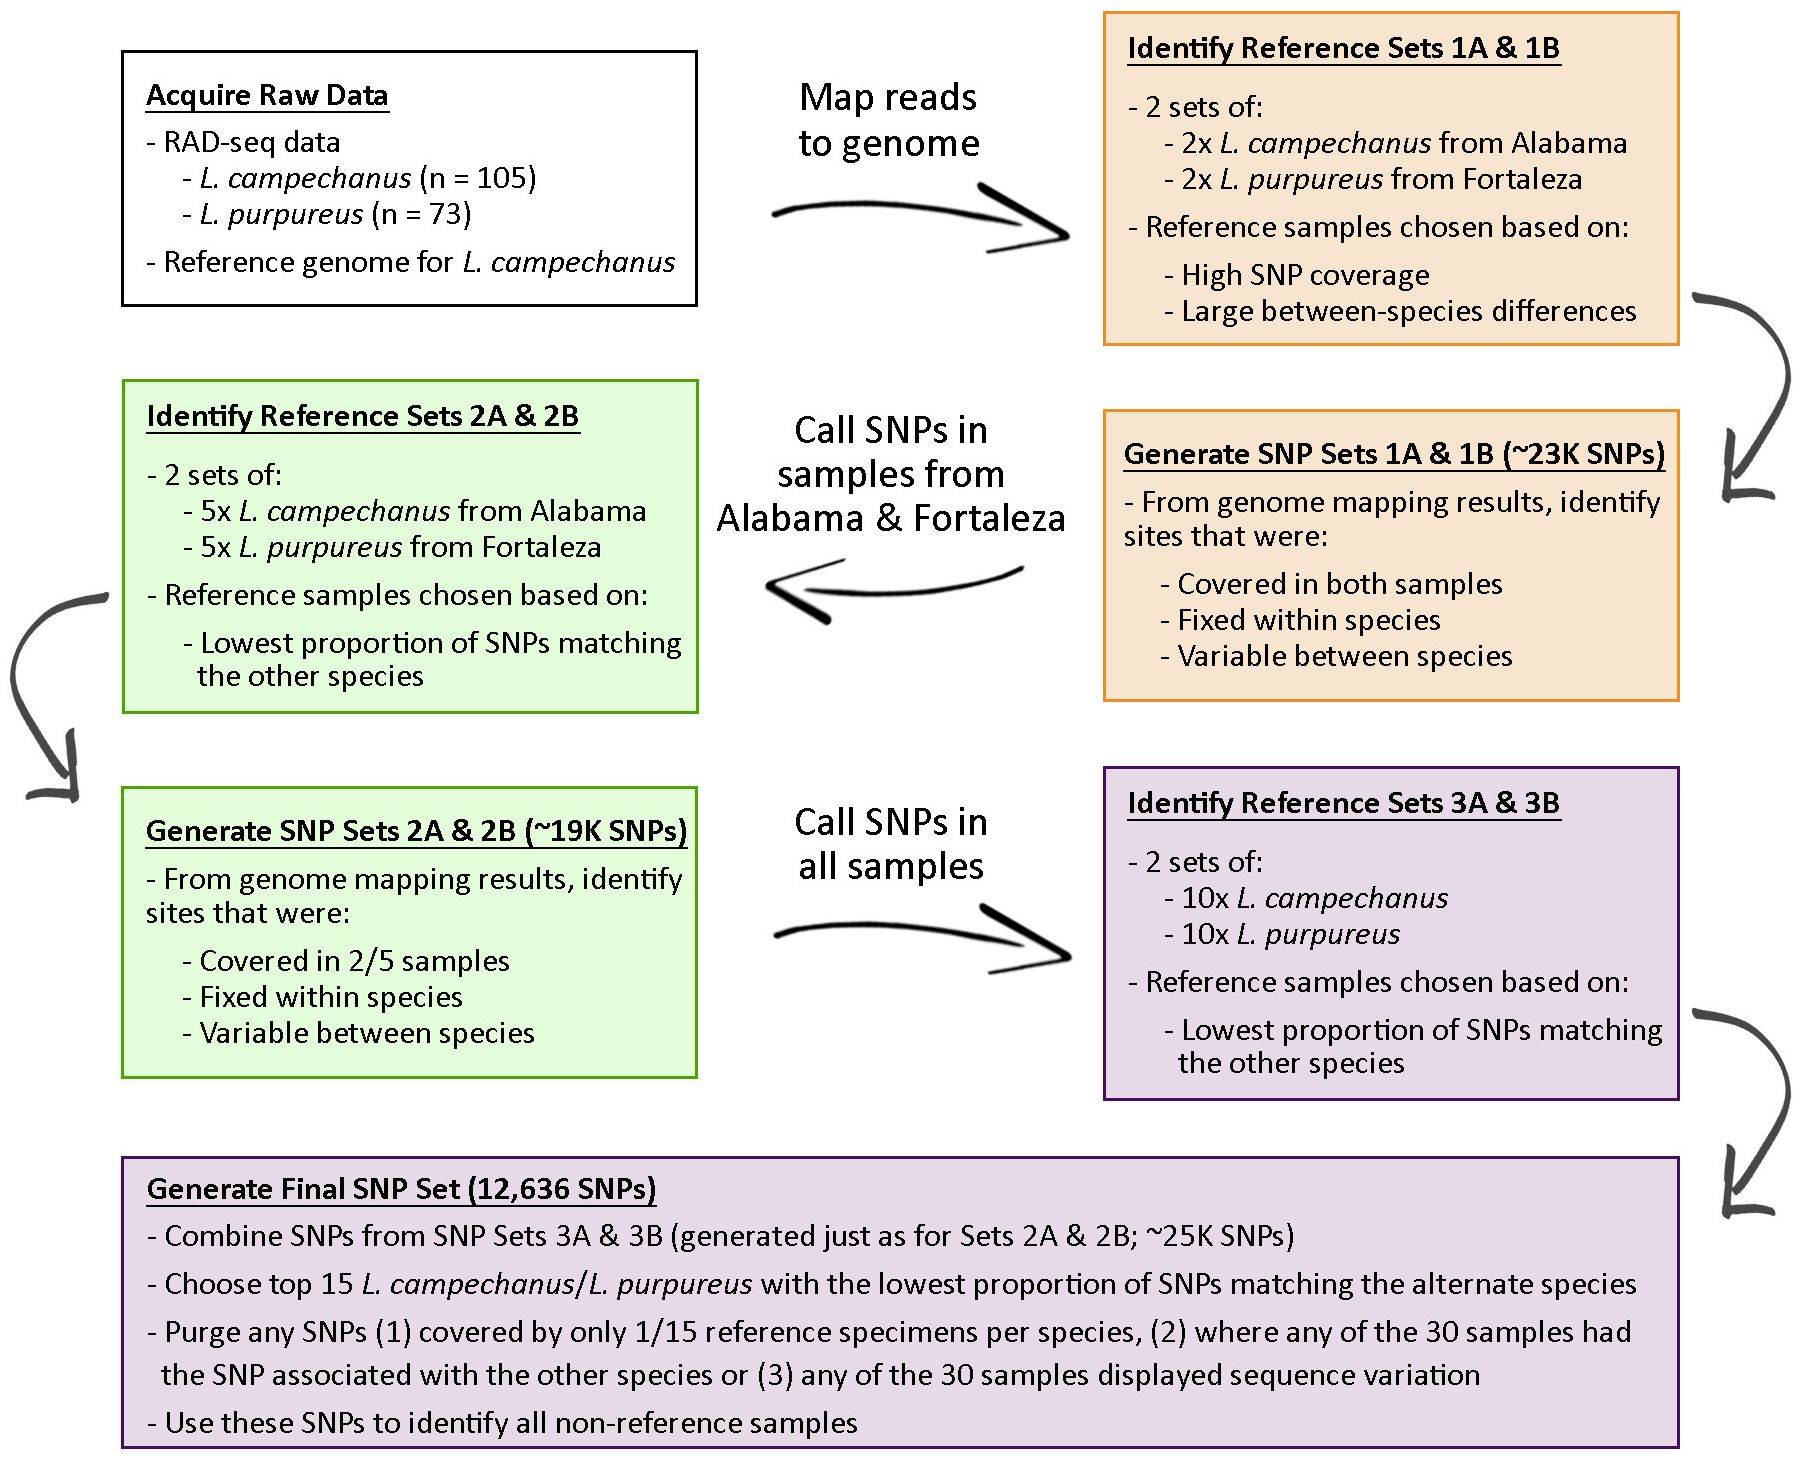
Figure 1 Iterative approach to design species-informative SNPs for the identification of non-reference L. campechanus vs. L. purpureus samples.
We began our search for SNPs using data from the four populations exhibiting minimal introgression in Pedraza-Marron et al. (2019) (L. campechanus: Alabama, Florida; L. purpureus: Fortaleza, São Luís). We calculated the pairwise sequence similarities between (1) L. campechanus from Alabama (USA) versus L. purpureus from Fortaleza (Ceará, Brazil) and (2) Florida (USA) L. campechanus versus São Luís (Maranhão, Brazil) L. purpureus (Supplementary Figure S1). The genetic differentiation between Alabama L. campechanus and Fortaleza L. purpureus was more pronounced when compared to the Florida/São Luís samples, so the first set of proto-diagnostic SNPs were designed based off the Alabama/Fortaleza individuals. For each species we chose two replicate sets of four individuals, selecting individuals based on 1) having relatively high numbers of alleles with read coverage, 2) a high degree of sequence similarity with individuals from their reported species, and 3) a low degree of sequence similarity with individuals from the alternate species. For each replicate reference set, we identified putative species-informative SNPs at positions where 1) alleles were fixed/homozygous in all four individuals, 2) the alleles were fixed within species, and 3) the alleles varied between species. We queried the bases at these SNP positions for all L. campechanus and L. purpureus samples from Florida, Alabama, Fortaleza, and São Luís, and we identified all positions that had (1) the L. campechanus reference allele, (2) the L. purpureus reference allele, (3) both reference alleles, or (4) neither (Supplementary Figure S2).
Based on the first round of allele characterization, new reference samples were selected from Florida, Alabama, Fortaleza, and São Luís individuals with the lowest proportions of SNPs that matched either the alternate species or had reference alleles for both species. From each species, we selected two sets of five individuals, and species-informative SNPs were identified at genomic sites where 1) variation was fixed within-species and variable between species and 2) where at least two out of the five individuals had read coverage. Any genomic positions that had conflicting allelic signal between the two reference sets were excluded, and resulting SNPs were used to characterize all samples from Pedraza-Marron et al. (2019) (Supplementary Figure S3). A third set of reference samples including 20 individuals per species were selected as above, but with no restriction on population of origin. These samples were separated into two sets of ten, and SNPs were identified as before. We queried these new SNP positions in all samples from Pedraza-Marron et al. (2019) (Supplementary Figure S4).
To generate the final SNP dataset, we identified the 15 individuals per species with the lowest proportion of SNPs matching the alternate species or both species. We pooled all SNPs from the third iteration (Reference SNPs 3A + 3B), removed any SNPs where any reference sample displayed heterozygosity or conflicting signal, and filtered these SNPs based on whether there was allelic data for 2, 3, 4, or 5 individuals per species. We used SNPs with coverage from at least 2 individuals per species to classify all samples from Pedraza-Marron et al. (2019) along with samples from other Lutjanus studies (Puritz et al., 2016; Norrell et al., 2020; Portnoy et al., 2022).
3 Results
3.1 Reference genome mapping of RAD-seq data
Post-trimming base counts for the 178 RAD-seq datasets from Pedraza-Marron et al. (2019) ranged from 4.2 Mb – 3.1 Gb (L. campechanus: n = 105; L. purpureus: n = 73; Supplementary Table S1). RAD-seq data from other studies ranged between 29 Kb – 1.5 Gb (Supplementary Table S1). Based on read mapping against the L. campechanus draft genome of (Norrell et al., 2020), samples had a single allele (i.e., fixed/homozygous sites) at 1.97M – 279M genomic sites (Average: 67M sites; Supplementary Table S2), with more than one allele present at between 663 – 1.48M sites (Average: 256K sites; Supplementary Table S2).
3.2 Generating species-informative SNPs for the delineation of L. campechanus and L. purpureus
We used a four-round iterative approach to design and refine a genome-scale species-informative SNP dataset, with increasing numbers of high-confidence samples added to subsequent reference pools (Figure 1). The first set of reference samples came from Alabama (L. campechanus) and Fortaleza (L. purpureus). Two replicate reference sets each containing 2 individuals per species resulted in 24,179 SNPs (Reference Set 1A; Supplementary Table S4) and 22,121 SNPs (Reference Set 1B; Supplementary Table S4).
To create the second round of reference SNPs we used the species-informative SNPs identified in the first round to score all samples from Florida, Alabama, Fortaleza, and São Luís. Of all species-informative SNP positions analyzed, individual samples had coverage of between 664 – 22,560 positions (Supplementary Table S5). For each species, samples always had the highest allele matching rate with their species of record (Supplementary Table S5). L. campechanus samples had L. campechanus alleles at 70.7% - 84.0% of covered sites (Mean: 76.9%; Supplementary Table S5), and L. purpureus alleles were found at 63.3% - 82.8% of sites among L. purpureus samples (Mean: 75.1%; Supplementary Table S5). Among L. campechanus, the L. purpureus allele was detected at between 6.1% - 28.6% of sites (Mean: 12.0%; Supplementary Table S5), and among L. purpureus the L. campechanus allele was observed at between 8.2% - 25.3% (Mean: 12.9%; Supplementary Table S5). We selected two replicate sets of 5 samples per species, and analyses of these reference sets resulted in 19,252 SNPs (Reference Set 2A; Supplementary Table S4) and 19,720 SNPs (Reference Set 2B; Supplementary Table S4).
Using the SNPs identified from the second round we performed the same SNP characterization on all samples from Pedraza-Marron et al. (2019). SNP coverage ranged from 540 – 19,054 positions per individual (Supplementary Table S6). Notably, two populations of L. purpureus from Nueva Esparta (Venezuela) and La Guajira (Colombia) showed patterns consistent with increased introgression with L. campechanus (Figure 2, Supplementary Table S6). In these two populations, individuals had the L. purpureus allele at around 46% of SNP positions (35.6% - 63.7%; Figure 2; Supplementary Table S6) compared to other L. purpureus populations where the allele was observed at more than 72% of sites on average (59.8% - 83.4%; Figure 2; Supplementary Table S6). Samples from Nueva Esparta and La Guajira also had L. campechanus alleles at higher rates, with 17.2% - 45.8% of positions carrying that allele (Mean: 28.9%; Figure 2; Supplementary Table S6) compared to an average of around 14% in the other populations (9.0% - 31.1%; Figure 2; Supplementary Table S6). We separated the top twenty individuals into two sets of ten, resulting in 26,738 SNPs and 24,213 SNPs for reference sets 3A and 3B, respectively (Supplementary Table S4).
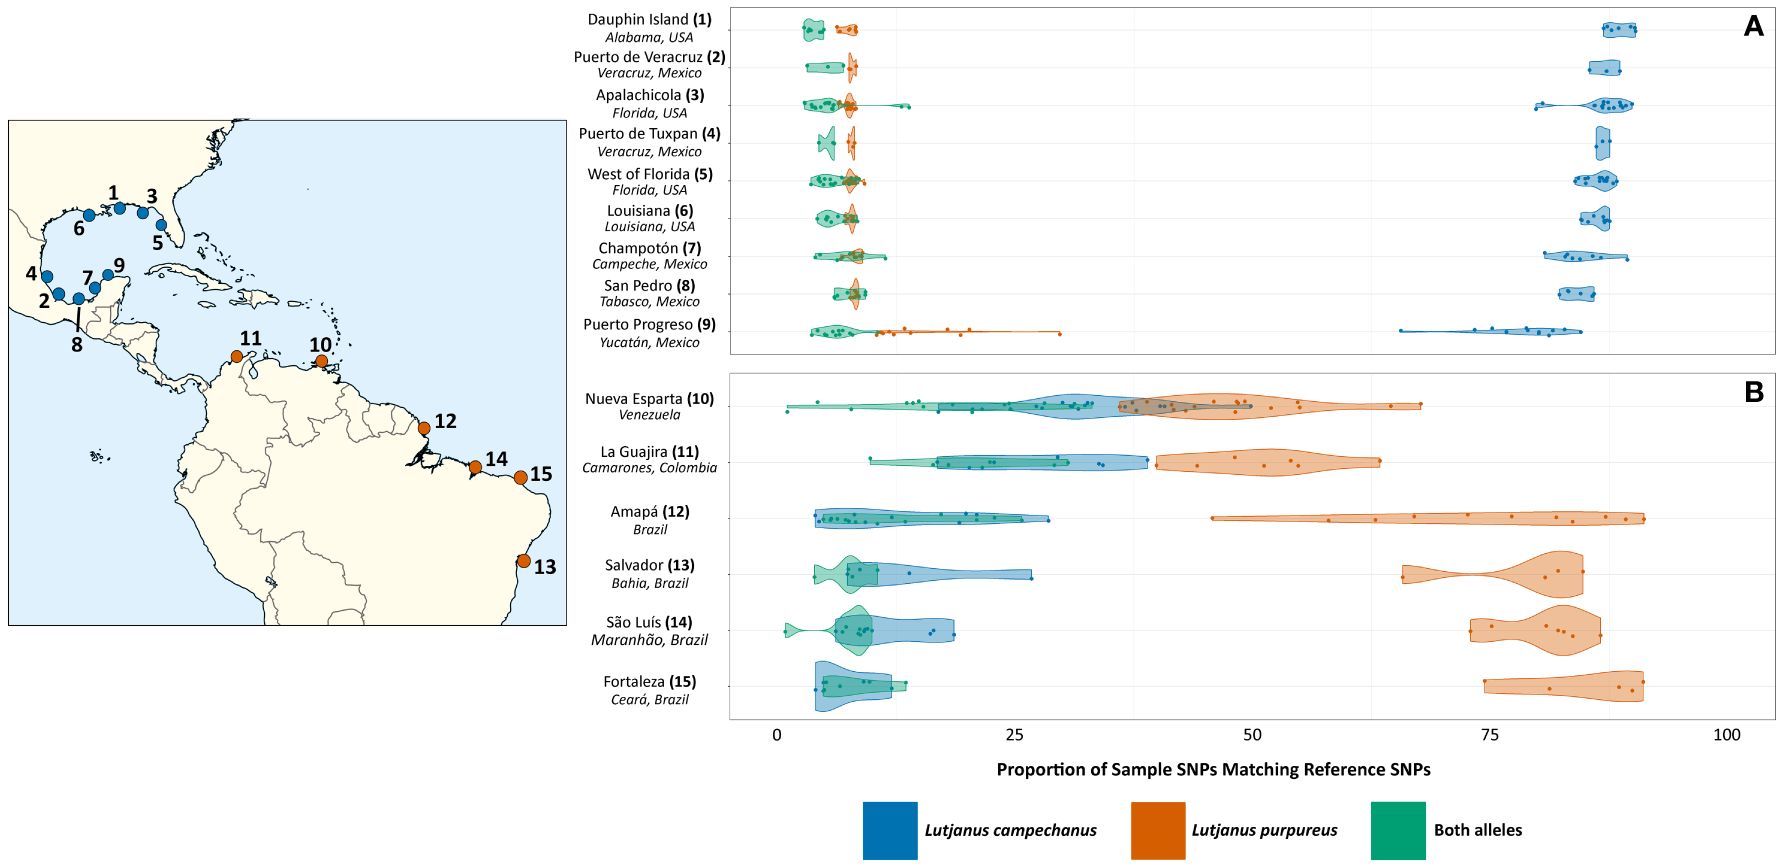
Figure 2 SNP-based identification of Lutjanus samples from Pedraza-Marron et al. (2019). (A) L. campechanus samples (locations 1-9) and (B) L. purpureus samples (locations 10-15) were collected from different locations in North and South America, as shown in the map.
The final set of reference SNPs for the delineation of L. campechanus and L. purpureus was generated following the third round of SNP-based identification. Individuals had coverage for 429 – 24,633 SNPs (Mean: 14,246; Supplementary Table S7) and for each species we selected the 15 samples with the lowest proportion of alleles matching the opposite species or both species. We then filtered the final SNP set down to sites that had mapping coverage data for between 2 - 5 of the 15 total individuals. Final reference samples for L. campechanus came from three locations in the USA: Alabama (n = 7), Florida (n=2), and Louisiana (n=6) and L. purpureus samples came from four locations in Brazil: Amapá (n=1), Fortaleza (n=6), Salvador (n=3) and São Luís (n=5) (Supplementary Table S8). With 2 - 5 individuals per species required to have coverage, final SNP counts were 12,636 (minimum 2), 8,546 (minimum 3), 5,799 (minimum 4), and 4,111 (minimum 5) (Supplementary Table S4).
3.3 RAD-seq derived SNPs are sufficient for the identification of L. campechanus and L. purpureus individuals
We used the final set of SNPs to re-identify all samples from Pedraza-Marron et al. (2019). Results were qualitatively consistent when requiring 2 – 5 reference samples per species to have SNP coverage (Supplementary Table S8), and here we discuss results from the SNPs covered by 2 individuals per species, as this dataset provided the highest SNP counts (Supplementary Figure 2, Table S4). Across all L. campechanus samples, 65.6% – 90.2% of covered SNPs had the L. campechanus allele (Mean: 85.0%; Figure 2; Supplementary Table S8), 6.2% - 29.7% of sites had the L. purpureus allele (Mean: 9.0%; Figure 2; Supplementary Table S8), and 1.5% - 13.8% of SNPs had both alleles (Mean: 5.9%; Figure 2; Supplementary Table S8). Only eight L. campechanus individuals had less than 80% of SNPs carrying the L. campechanus allele, with six from the Yucatan region and two from the Gulf coast off northern Florida (Apalachicola).
Results were more variable among L. purpureus populations. The southern-most populations from Brazil (Fortaleza, São Luís, Salvador, and Amapá) had the L. purpureus allele at 75.9% - 86.5% of sites on average (Figure 2; Supplementary Table S8), but this average was only 50.8% and 48.7% in the northern populations of La Guajira and Nueva Esparta respectively (Figure 2; Supplementary Table S8). Similarly, while the L. campechanus allele was observed on average at 6.4% - 11.9% of sites among the southern populations (Figure 2; Supplementary Table S8), the L. campechanus allele was detected on average at 28.0% and 32.7% of sites in individuals from La Guajira (Colombia) and Nueva Esparta (Venezuela) respectively (Figure 2; Supplementary Table S8). The northern populations also had a higher proportion of sites containing both alleles, with 19.3% of sites having both in the north compared to an average of 8.0% of sites in the south (Figure 2; Supplementary Table S8). For individuals from Amapá (Brazil), a population with an intermediate latitude relative to the most northern and southern populations, 12.1% of sites had both alleles on average (Supplementary Table S8).
At the time of this study, the RAD-Seq data from Pedraza-Marron et al. (2019) represented the only publicly available genome-scale sequence data for L. purpureus, but several studies had generated comparable data for L. campechanus (Puritz et al., 2014, 2016; Norrell et al., 2020; Portnoy et al., 2022). We combined all analytical steps from read trimming through SNP calling into a fully automated pipeline (https://github.com/BobLiterman/Snapper_Sniffer) and reanalyzed the L. campechanus samples from Pedraza-Marron et al. (2019) along with samples from each of these independent studies. Mean SNP coverages varied significantly between study datasets, with data from Pedraza-Marron et al. (2019) having the highest mean coverage (7,862 SNPs) and data from Puritz et al. (2014) having the lowest mean coverage (86 SNPs; Supplementary Table S9). In 1,241 out of the total 1,247 L. campechanus samples, the L. campechanus allele was detected at 64.1% - 92.8% of queried sites (Mean: 78.1%; Figure 3; Supplementary Table S9) while the proportion of sites with the L. purpureus allele was lower and non-overlapping (5.4% - 30.8% of sites; Mean: 16.2%; Figure 3; Supplementary Table S9).
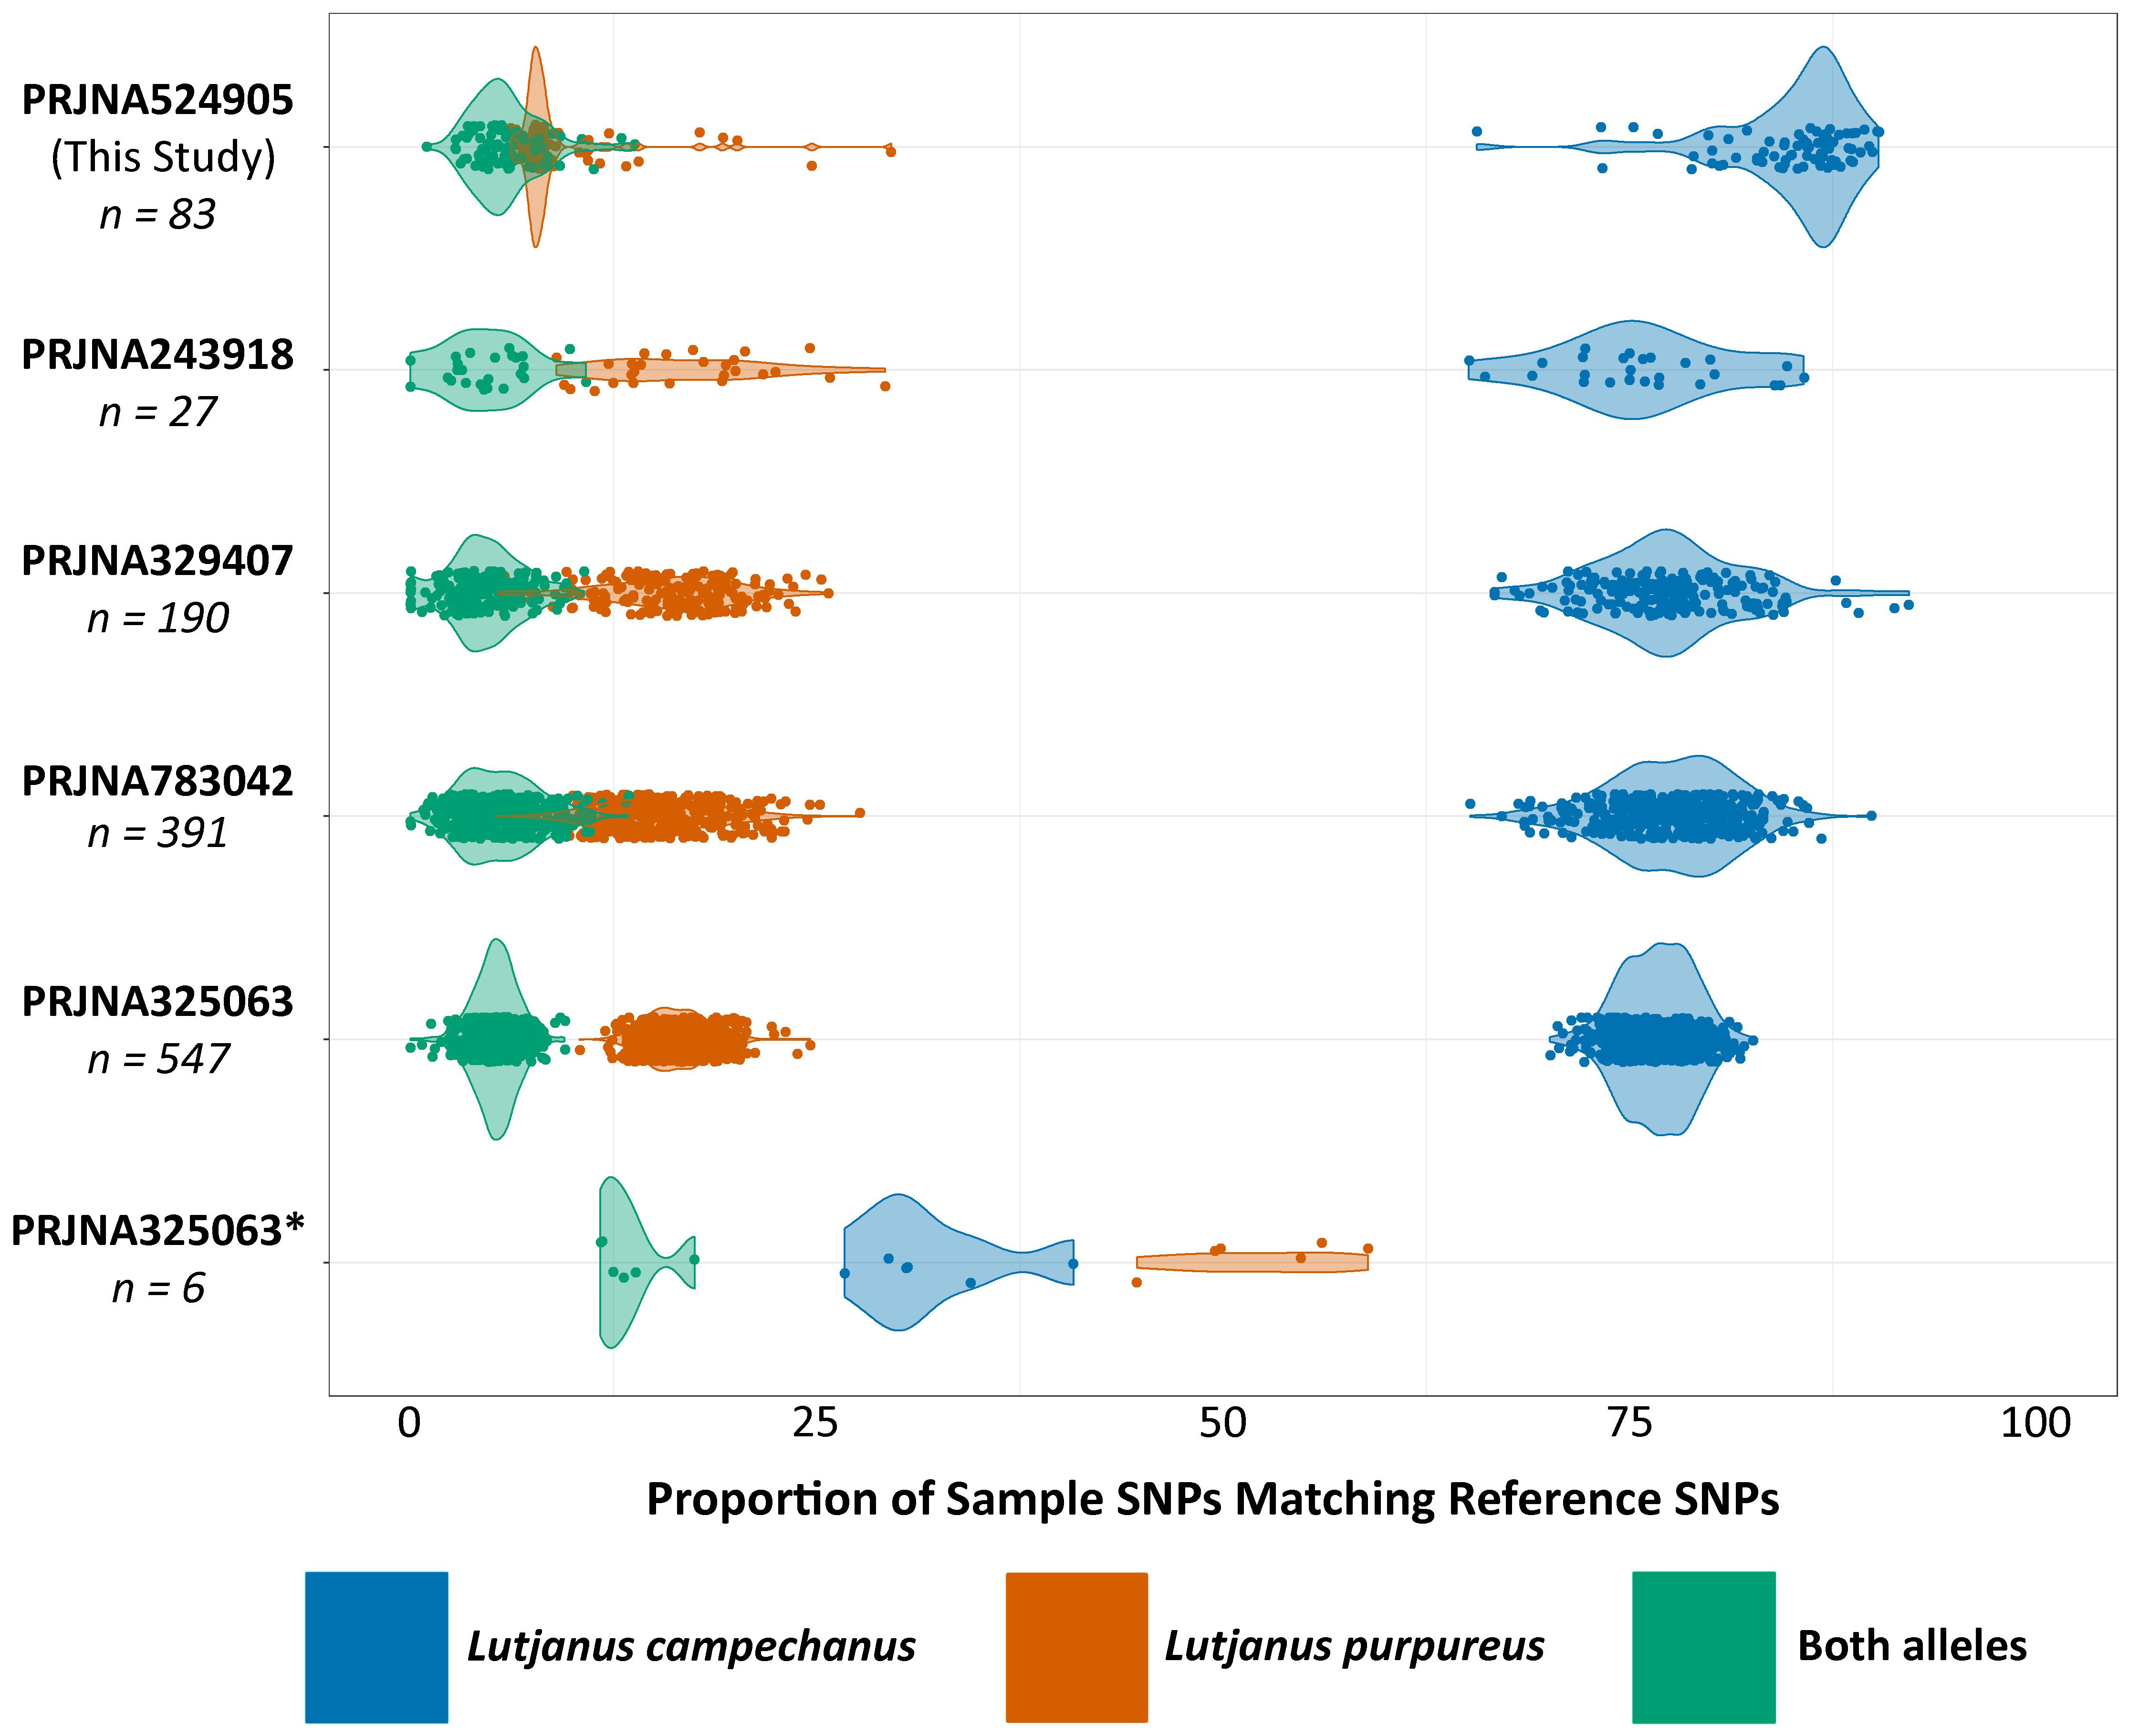
Figure 3 In silico identification of L. campechanus individuals from this and other studies using SNPs designed in this study. From top to bottom: PRJNA524905 (Pedraza-Marron et al., 2019), PRJNA243918 (Puritz et al., 2014), PRJNA329407 (Puritz et al., 2016), PRJNA783042 (Portnoy et al., 2022), typical specimens from PRJNA325063 (Norrell et al., 2020), apparent hybrids from PRJNA325063 (Norrell et al., 2020).
Six samples from Norrell et al. (2020) caught off the coast of the Carolinas (n = 2), the Florida Gulf coast (n = 2), and the Alabama Gulf coast (n = 2) had proportionally fewer L. campechanus alleles (27.8% - 41.4% of sites; Mean: 32.8%; Figure 3; Supplementary Table S9), and between 45.3% - 59.5% of sites in those samples had the L. purpureus allele (Mean: 53.2%; Figure 3; Supplementary Table S9). For those six samples, 9.9% - 15.9% of sites had alleles associated with both species (Mean: 12.1%; Figure 3; Supplementary Table S9), compared to 0% - 12.8% of sites (Mean: 4.6%; Figure 3; Supplementary Table S9) in the remaining 1,241 samples. These six samples had SNP coverage for 268 – 564 sites (Supplementary Table S9), which was above the median value for all samples (242 SNPs; Supplementary Table S9). For all L. campechanus datasets excluding these six samples, the ratio of the number of contigs containing L. purpureus alleles versus those containing L. campechanus alleles was between 25% - 27% (Supplementary Table S10). The L. purpureus samples from Pedraza-Marron et al. (2019) had L. purpureus alleles on around 3 times the number of contigs that harbored L. campechanus alleles (L. purpureus contigs: 3,233; L. campechanus contigs: 1,904; Ratio: 2.96; Supplementary Table S10), while the six samples from Norrell et al. (2020) had an intermediate value with an average of 209 contigs containing L. purpureus alleles versus 138 contigs containing L. campechanus alleles (Ratio: 1.51; Table S10).
4 Discussion
In this study, the Lutjanus campechanus genome assembly of Norrell et al. (2020) enabled a genome-guided reanalysis of snapper RAD-Seq data from Pedraza-Marron et al. (2019), and in concordance with that study we too find support for allelic variation capable of distinguishing Northern and Southern red snappers. We identified over 12,000 genome-anchored SNPs that demonstrated utility in assessing the species of Lutjanus samples collected in different studies, and compiled all the analytical steps for our empirical method to identify diagnostic SNPs for species identification into the Nextflow bioinformatics pipeline “Snapper Sniffer” (https://github.com/BobLiterman/Snapper_Sniffer). This pipeline allows users to query their own raw sequencing data in a single command. Genome-anchored SNP datasets such as this provide valuable insights towards the development of rapid species diagnostic tools (e.g., designing PCR markers or qPCR assays in informative regions), which are often critical infrastructure in the fight against seafood misidentification. Furthermore, this method can be easily extended to vary the criteria used to select reference individuals used to select SNPs, and their numbers at each step during analysis of other datasets with different characteristics.
Lending support to the robustness of our diagnostic SNPs when applied to external datasets, a vast majority of the allelic SNP profiles from NCBI L. campechanus were qualitatively equivalent to L. campechanus individuals from Pedraza-Marron et al. (2019). Six individuals, all labeled as L. campechanus at NCBI and caught or procured from either the American Gulf coast or off the coast of the Carolinas, displayed an allelic profile that was more similar to L. purpureus from northern South America, supporting intermittent reports of L. purpureus or potential hybrids in more northerly waters (Rivas, 1966; Moura and Lindeman, 2007). Understanding whether these samples represent more recent hybrids or ‘northern’ L. purpureus, along with other deeper dives into the complex evolutionary trajectories of these lineages, would greatly benefit from incorporating more data both in terms of depth and breadth. Aside from the samples from Pedraza-Marron et al. (2019), out of over 12,000 SNPs that were identified as putatively informative the median coverage for individual samples was fewer than 300 sites. This scant data distribution precludes meaningful analysis of many data subdivisions, and the application of optimal marker filtering strategies (O'Leary et al., 2018) are also limited when many sites are covered by only a few reads. The method designed in this work is promising for recovering diagnostic SNPs despite large variations in coverage among samples. Varying some parameters of the search, such as sample size at each step, would be worth exploring. Although linkage map data from the L. campechanus genome was not considered as a factor in SNP identification here, one option to combat limited sequencing depth in derived assays would be to identify a limited yet highly discriminatory subset of SNPs that were (1) evenly distributed across linkage groups and (2) recoverable from the vast majority of samples even when sequencing at low depth. Using chromosomal linkage data would also permit more precise dissection of the historical allelic signal and would help disentangle complex signal from hybridization or gene flow events.
The robustness of SNP datasets designed using reference individuals will scale with the logic underling reference selection and how the resulting SNPs are filtered. In this study, we used an iterative approach to reference selection, starting from populations with a priori expectations of strong allelic distinction and broadening out to allow references from any population so long as they provided maximal separation between species, but whole genome clustering pipelines such as STRUCTURE (Pritchard et al., 2000) or Mash (Ondov et al., 2016) would provide alternative methods to selecting the genetically distinct references. Considering the low sequencing depths for the query samples, we chose to filter our reference SNPs loosely so that individual queries had a chance to cover a reasonable number of SNPs. However, recent advances in machine learning algorithms have been applied to diagnostic SNP development in plants (Korani et al., 2019) and animals (Momeni et al., 2021) and these methods may provide a route to maximize discrimination-per-SNP basis even when dealing with limited datasets.
While the current incarnation of ‘Snapper Sniffer’ is applied to the delineation of L. campechanus and L. purpureus, the underlying computational steps would apply to most any biological system, with similarly successful applications in other fish species (Literman et al., 2023) along with diploid and polyploid plant species (Hunter et al., 2021; Literman et al., 2022). We note that the parameters presented herein might need some adjustment for the analysis of other datasets. Accurate species identification is a critical factor for abundance assessment and informed conservation efforts (Rodrigues et al., 2006; Beerkircher et al., 2009; Kürzel et al., 2022), suggesting that the generalization of scripts associated with this pipeline along with de novo pangenome options for clades lacking a reference genome (Schwartz et al., 2015) would enable broad deployment across understudied clades lacking robust DNA-based markers.
Data availability statement
The original contributions presented in the study are included in the article/Supplementary Material. Further inquiries can be directed to the corresponding author.
Author contributions
RL: Conceptualization, Data curation, Formal analysis, Investigation, Methodology, Project administration, Visualization, Writing – original draft, Writing – review & editing. MM: Conceptualization, Formal analysis, Investigation, Methodology, Project administration, Visualization, Writing – original draft, Writing – review & editing. SH: Conceptualization, Project administration, Writing – review & editing, Methodology. JD: Conceptualization, Project administration, Writing – review & editing, Methodology.
Funding
The author(s) declare financial support was received for the research, authorship, and/or publication of this article. This publication was supported by the Food and Drug Administration (FDA) of the U.S. Department of Health and Human Services (HHS) as part of a financial assistance award U01FD001418 totaling $5,266,416 with 100 percent funded by FDA/HHS.
Acknowledgments
At the time of data analysis, RL was supported, in part, by an appointment to the Research Participation Program, administered by the Oak Ridge Institute for Science and Education (ORISE) through an interagency agreement between the U.S. Department of Energy and the U.S. FDA. MM performed this work during an appointment with the Joint Institute for Food Safety and Applied Nutrition (JIFSAN) through the cooperative agreement with the FDA listed in the funding section.
Conflict of interest
The authors declare that the research was conducted in the absence of any commercial or financial relationships that could be construed as a potential conflict of interest.
Publisher’s note
All claims expressed in this article are solely those of the authors and do not necessarily represent those of their affiliated organizations, or those of the publisher, the editors and the reviewers. Any product that may be evaluated in this article, or claim that may be made by its manufacturer, is not guaranteed or endorsed by the publisher.
Author disclaimer
The contents are those of the author(s) and do not necessarily represent the official views of, nor an endorsement, by FDA/HHS, or the U.S. Government.
Supplementary material
The Supplementary Material for this article can be found online at: https://www.frontiersin.org/articles/10.3389/fmars.2024.1342509/full#supplementary-material
References
Beerkircher L., Arocha F., Barse A., Prince E., Restrepo V., Serafy J., et al. (2009). Effects of species misidentification on population assessment of overfished white marlin Tetrapturus albidus and roundscale spearfish T. georgii. Endanger. Species Res. 9, 81–90. doi: 10.3354/esr00234
Begossi A., Salivonchyk S. V., Araujo L. G., Andreoli T. B., Clauzet M., Martinelli C. M., et al. (2011). Ethnobiology of snappers (Lutjanidae): target species and suggestions for management. J. Ethnobiol. Ethnomedicine 7, 11. doi: 10.1186/1746-4269-7-11
Cawthorn D.-M., Baillie C., Mariani S. (2018). Generic names and mislabeling conceal high species diversity in global fisheries market. Conserv. Lett. 11, e12573. doi: 10.1111/conl.12573
Cervigón F. (1993). Los peces marinos de Venezuela (Caracas, Venezuela: Fundación Científica Los Roques).
Charuau A., Cochraine K., Die D., Lárez A., Marcano L. A., Phillips T., et al. (2001). “"Regional assessment of red snapper, lutjanus purpureus",” in Regional reviews and national management reports / Fourth Workshop on the Assessment and Management of Shrimp and Groundfish Fisheries on the Brazil-Guianas Shelf (Food and Agriculture Organization of the United Nations, Rome). FAO fisheries reports No. 651.
Chen K. C., Zakaria D., Altarawneh H., Andrews G. N., Ganesan G. S., John K. M., et al. (2019). DNA barcoding of fish species reveals low rate of package mislabeling in Qatar. Genome 62, 69–76. doi: 10.1139/gen-2018-0101
Christiansen H., Fournier N., Hellemans B., Volckaert F. A. M. (2018). Seafood substitution and mislabeling in Brussels' restaurants and canteens. Food Control 85, 66–75. doi: 10.1016/j.foodcont.2017.09.005
Dance M. A., Patterson I., William F., Addis D. T. (2011). Fish community and trophic structure at artificial reef sites in the northeastern Gulf of Mexico. Bull. Mar. Sci. 87, 301–324. doi: 10.5343/bms.2010.1040
FAO (2020). The state of world fisheries and aquaculture - sustainability in action. (Rome: Food and Agriculture Organization of the United Nations).
Gallaway B. J., Szedlmayer S. T., Gazey W. J. (2009). A life history review for red snapper in the gulf of Mexico with an evaluation of the importance of offshore petroleum platforms and other artificial reefs. Rev. Fish. Sci. 17, 48–67. doi: 10.1080/10641260802160717
Gomes G., Sampaio I., Schneider H. (2012). Population Structure of Lutjanus purpureus (Lutjanidae - Perciformes) on the Brazilian coast: further existence evidence of a single species of red snapper in the western Atlantic. An. Acad. Bras. Cienc. 84, 979–999. doi: 10.1590/S0001-37652012000400013
Gomes G., Schneider H., Vallinoto M., Santos S., Orti G., Sampaio I. (2008). Can Lutjanus purpureus (South red snapper) be “legally” considered a red snapper (Lutjanus campechanus)? Genet. Mol. Biol. 31, 372–376. doi: 10.1590/S1415-47572008000200035
Griffiths A. M., Sims D. W., Cotterell S. P., El Nagar A., Ellis J. R., Lynghammar A., et al. (2010). Molecular markers reveal spatially segregated cryptic species in a critically endangered fish, the common skate (Dipturus batis). Proc. R. Soc. B: Biol. Sci. 277, 1497–1503. doi: 10.1098/rspb.2009.2111
Handy S. M., Deeds J. R., Ivanova N. V., Hebert P. D., Hanner R. H., Ormos A., et al. (2011). A single-laboratory validated method for the generation of DNA barcodes for the identification of fish for regulatory compliance. J. AOAC Int. 94 (1), 201–10. doi: 10.1093/jaoac/94.1.201
Hunter E. S., Literman R., Handy S. M. (2021). Utilizing big data to identify tiny toxic components: Digitalis. Foods 10, 1794. doi: 10.3390/foods10081794
Korani W., Clevenger J. P., Chu Y., Ozias-Akins P. (2019). Machine learning as an effective method for identifying true single nucleotide polymorphisms in polyploid plants. Plant Genome 12, 180023. doi: 10.3835/plantgenome2018.05.0023
Kürzel K., Kaiser S., Lörz A.-N., Rossel S., Paulus E., Peters J., et al. (2022). Correct species identification and its implications for conservation using haploniscidae (Crustacea, isopoda) in Icelandic waters as a proxy. Front. Mar. Sci. 8. doi: 10.3389/fmars.2021.795196
Lara A., Ponce De León J. L., Rodriguez R., Casane D., Cote G., Bernatchez L., et al. (2010). DNA barcoding of Cuban freshwater fishes: evidence for cryptic species and taxonomic conflicts. Mol. Ecol. Resour. 10, 421–430. doi: 10.1111/j.1755-0998.2009.02785.x
Literman R. A., Ott B. M., Wen J., Grauke L. J., Schwartz R. S., Handy S. M. (2022). Reference-free discovery of nuclear SNPs permits accurate, sensitive identification of Carya (hickory) species and hybrids. Appl. Plant Sci. 10 (1), e11455. doi: 10.1002/aps3.11455
Literman R., Windsor A. M., Bart H. L. Jr., Hunter E. S., Deeds J. R., Handy S. M. (2023). Using low-coverage whole genome sequencing (genome skimming) to delineate three introgressed species of buffalofish (Ictiobus). Mol. Phylogenet. Evol. 182, 107715. doi: 10.1016/j.ympev.2023.107715
Marko P. B., Lee S. C., Rice A. M., Gramling J. M., Fitzhenry T. M., Mcalister J. S., et al. (2004). Fisheries: mislabelling of a depleted reef fish. Nature 430, 309–310. doi: 10.1038/430309b
Marval-Rodríguez A., Renán X., Galindo-Cortes G., Acuña-Ramírez S., Jiménez-Badillo M. D. L., Rodulfo H., et al. (2022). Assessing the Speciation of Lutjanus campechanus and Lutjanus purpureus through Otolith Shape and Genetic Analyses. Fishes 7, 85. doi: 10.3390/fishes7020085
Melo B. F., Ochoa L. E., Vari R. P., Oliveira C. (2016). Cryptic species in the Neotropical fish genus Curimatopsis (Teleostei, Characiformes). Zoologica Scripta 45, 650–658. doi: 10.1111/zsc.12178
Momeni J., Parejo M., Nielsen R. O., Langa J., Montes I., Papoutsis L., et al. (2021). Authoritative subspecies diagnosis tool for European honey bees based on ancestry informative SNPs. BMC Genomics 22, 101. doi: 10.1186/s12864-021-07379-7
Moura R. L., Lindeman K. C. (2007). A new species of snapper (Perciformes: Lutjanidae) from Brazil, with comments on the distribution of Lutjanus griseus and L. apodus. Zootaxa 1422, 31–43. doi: 10.11646/zootaxa.1422.1
Nehal N., Choudhary B., Nagpure A., Gupta R. K. (2021). DNA barcoding: a modern age tool for detection of adulteration in food. Crit. Rev. Biotechnol. 41, 767–791. doi: 10.1080/07388551.2021.1874279
NOAA (2022) FishWatch: Red snapper. Available online at: https://www.fishwatch.gov/profiles/red-snapper (Accessed January 24, 2022).
Norrell A. E., Jones K. L., Saillant E. A. (2020). Development and characterization of genomic resources for a non-model marine teleost, the red snapper (Lutjanus campechanus, Lutjanidae): Construction of a high-density linkage map, anchoring of genome contigs and comparative genomic analysis. PloS One 15, e0232402. doi: 10.1371/journal.pone.0232402
O'Leary S. J., Puritz J. B., Willis S. C., Hollenbeck C. M., Portnoy D. S. (2018). These aren’t the loci you’e looking for: Principles of effective SNP filtering for molecular ecologists. Mol. Ecol. 27, 3193–3206. doi: 10.1111/mec.14792
Ondov B. D., Treangen T. J., Melsted P., Mallonee A. B., Bergman N. H., Koren S., et al. (2016). Mash: fast genome and metagenome distance estimation using MinHash. Genome Biol. 17, 132. doi: 10.1186/s13059-016-0997-x
Ovenden J. R., Berry O., Welch D. J., Buckworth R. C., Dichmont C. M. (2015). Ocean's eleven: a critical evaluation of the role of population, evolutionary and molecular genetics in the management of wild fisheries. Fish Fish. 16, 125–159. doi: 10.1111/faf.12052
Pedraza-Marron C. D. R., Silva R., Deeds J., Van Belleghem S. M., Mastretta-Yanes A., Dominguez-Dominguez O., et al. (2019). Genomics overrules mitochondrial DNA, siding with morphology on a controversial case of species delimitation. Proc. R. Soc. B. 286, 20182924. doi: 10.1098/rspb.2018.2924
Portnoy D. S., Fields A. T., Puritz J. B., Hollenbeck C. M., Patterson W. F. III. (2022). Genomic analysis of red snapper, Lutjanus campechanus, population structure in the U.S. Atlantic and Gulf of Mexico. ICES J. Mar. Sci. 79, 12–21. doi: 10.1093/icesjms/fsab239
Pritchard J. K., Stephens M., Donnelly P. (2000). Inference of population structure using multilocus genotype data. Genetics 155, 945–959. doi: 10.1093/genetics/155.2.945
Puritz J. B., Gold J. R., Portnoy D. S. (2016). Fine-scale partitioning of genomic variation among recruits in an exploited fishery: causes and consequences. Sci. Rep. 6, 36095. doi: 10.1038/srep36095
Puritz J. B., Hollenbeck C. M., Gold J. R. (2014). dDocent: a RADseq, variant-calling pipeline designed for population genomics of non-model organisms. PeerJ 2, e431. doi: 10.7717/peerj.431
Rivas L. R. (1966). Review of the lutjanus campechanus complex of red snappers. Q. J. Fla. Acad. Sci. 29, 117–136. Available at: http://www.jstor.org/stable/24315047.
Rodrigues A. S., Pilgrim J. D., Lamoreux J. F., Hoffmann M., Brooks T. M. (2006). The value of the IUCN Red List for conservation. Trends Ecol. Evol. 21, 71–76. doi: 10.1016/j.tree.2005.10.010
Schwartz R. S., Harkins K. M., Stone A. C., Cartwright R. A. (2015). A composite genome approach to identify phylogenetically informative data from next-generation sequencing. BMC Bioinform. 16, 193. doi: 10.1186/s12859-015-0632-y
Silva R., Pedraza-Marrón C. D. R., Sampaio I., Betancur-R R., Gomes G., Schneider H. (2020). New insights about species delimitation in red snappers (Lutjanus purpureus and L. campechanus) using multilocus data. Mol. Phylogenet. Evol. 147, 106780. doi: 10.1016/j.ympev.2020.106780
Silva R., Peloso P. L. V., Sturaro M. J., Veneza I., Sampaio I., Schneider H., et al. (2018). Comparative analyses of species delimitation methods with molecular data in snappers (Perciformes: Lutjaninae). Mitochondrial DNA A DNA Mapp. Seq. Anal. 29, 1108–1114. doi: 10.1080/24701394.2017.1413364
Staffen C. F., Staffen M. D., Becker M. L., Lofgren S. E., Muniz Y. C. N., De Freitas R. H. A., et al. (2017). DNA barcoding reveals the mislabeling of fish in a popular tourist destination in Brazil. PeerJ 5, e4006. doi: 10.7717/peerj.4006
Willette D. A., Simmonds S. E., Cheng S. H., Esteves S., Kane T. L., Nuetzel H., et al. (2017). Using DNA barcoding to track seafood mislabeling in Los Angeles restaurants. Conserv. Biol. 31, 1076–1085. doi: 10.1111/cobi.12888
Yancy H. F., Zemlak T. S., Mason J. A., Washington J. D., Tenge B. J., Nguyen N.-L. T., et al. (2008). Potential use of DNA barcodes in regulatory science: applications of the Regulatory Fish Encyclopedia. J. Food Prot. 71, 210–217. doi: 10.4315/0362-028X-71.1.210
Keywords: red snapper, Lutjanus campechanus, Lutjanus purpureus, species identification, single nucleotide polymorphisms (SNPs)
Citation: Literman RA, Matos MPV, Handy SM and Deeds JR (2024) An empirical DNA-based identification of morphologically similar snappers (Lutjanus campechanus, Lutjanus purpureus) using a versatile bioinformatics workflow for the discovery and analysis of informative single-nucleotide polymorphisms. Front. Mar. Sci. 11:1342509. doi: 10.3389/fmars.2024.1342509
Received: 23 November 2023; Accepted: 10 April 2024;
Published: 23 April 2024.
Edited by:
David Seth Portnoy, Texas A&M University Corpus Christi, United StatesReviewed by:
Eric Saillant, University of Southern Mississippi, United StatesRaimundo Da Silva, Chico Mendes Institute for Biodiversity Conservation (ICMBio), Brazil
Copyright © 2024 Literman, Matos, Handy and Deeds. This is an open-access article distributed under the terms of the Creative Commons Attribution License (CC BY). The use, distribution or reproduction in other forums is permitted, provided the original author(s) and the copyright owner(s) are credited and that the original publication in this journal is cited, in accordance with accepted academic practice. No use, distribution or reproduction is permitted which does not comply with these terms.
*Correspondence: Mayara P. V. Matos, bWF5YXJhLm1hdG9zQGZkYS5oaHMuZ292