 Dezhi Bu
 Qingmei Zhu
 Jialin Li1
 Yanpei Zhuang
 Wei Yang
 Di Qi
Di Qi- 1Polar and Marine Research Institute, College of Harbour and Coastal Engineering, Jimei University, Xiamen, China
- 2College of Ocean and Meteorology, Guangdong Ocean University, Zhanjiang, China
- 3Southern Marine Science and Engineering Guangdong Laboratory (Zhuhai), Zhuhai, China
The mariculture industry has grown rapidly worldwide over the past few decades. The industry helps meet growing food demands and may provide an effective means of carbon sequestration; however, it may harm the marine ecological environment, and the extent of its impact depends on the type of mariculture. Here we focus on the impact of mariculture on the nutrient status and eutrophication in Sansha Bay, which is a typical aquaculture harbor in southeastern China that employs a combination of shellfish and seaweed farming. Nutrient concentrations and dual nitrate isotopes were measured in Sansha Bay during the winter of 2021. The average concentrations of nitrate and phosphate were 31.3 ± 10.5 and 2.26 ± 0.84 µM, respectively, indicating that the water was in a eutrophic state. However, the N/P ratios were relatively low (14.3 ± 2.2). Nitrate isotope measurements were 8.8‰–11.9‰ for δ15N-NO3− and 2.2‰–6.0‰ for δ18O-NO3−. Source analysis based on the nitrate isotope measurements indicates that nitrate in Sansha Bay is derived mainly from the excretion of organisms and sewage discharge from mariculture. The isotopic fractionation model of nitrate assimilation by organisms indicates that surface waters in Sansha Bay experience strong biological uptake of nitrate, which is likely related to seaweed farming in winter. The low N/P ratios may be attributed to excessive nitrogen uptake (relative to phosphorus) during shellfish and seaweed farming, as well as nitrogen removal through sediment denitrification, which is fueled by the sinking of particulate organic matter from mariculture. Overall, our study shows that mariculture activities dominated by shellfish and seaweed cultivation in Sansha Bay may exacerbate eutrophication but reduce N/P ratios in the water column in aquaculture areas.
1 Introduction
Under the combined influence of global warming and human activities, the open ocean regions of the world’s oceans have become more nutrient-poor, whereas coastal areas have become more nutrient-rich (Cloern, 2001; Boyd et al., 2015; Zhuang et al., 2021a). Coastal eutrophication is primarily caused by excessive loading of nitrogen (N) and phosphorus (P). Over the past few decades, the influx of N and P into coastal waters has increased dramatically (Beusen et al., 2022), leading to dramatic ecological and environmental consequences such as the expansion of harmful algal blooms (Glibert et al., 2018) and hypoxia (Wang et al., 2017). In general, nutrients in coastal waters are derived mainly from river input, organic matter regeneration, atmospheric deposition, submarine groundwater discharge, and seasonal transport of water masses (Liu et al., 2012; Lao et al., 2022). Mariculture activities, dominated by the extractive culture of aquatic plants, filter-feeding bivalves, and fed-culture marine finfish and crustaceans, may also contribute to eutrophication in coastal zones (Gao et al., 2021; Beusen et al., 2022).
Owing to the growing global demand for seafood, the scale of mariculture has expanded rapidly in recent decades, and the Food and Agriculture Organization (FAO) predicts that this growth will continue (FAO, 2020). Studies have shown that mariculture may have significant environmental impacts that are closely related to the type of mariculture employed (Zhang et al., 2022; Xiong et al., 2023). Two generally accepted views are that fed culture (i.e., cages and ponds) releases N and P (Wang et al., 2012; Bannister et al., 2016; Carballeira et al., 2018), and photosynthetic seaweed may act as a nutrient sink (Xiao et al., 2017). The nitrogen discharged into the water as mariculture feed each year may reach levels as high as 2.1 × 10⁶ tons, but most of the feed is not utilized by cultured organisms (Williams and Crutzen, 2010), thus promoting eutrophication in coastal waters. In contrast, mariculture systems involving seaweed cultivation can absorb nutrients through photosynthesis, converting nutrient-rich waters into beneficial resources and somewhat offsetting the environmental impact of heterotrophic fish and shrimp farming (Jiang et al., 2020). Furthermore, seaweed cultivation is widely recognized, not only for providing food and biofuels, but also for removing CO2 from seawater, thus increasing the ocean’s carbon absorption capacity and providing new potential means for carbon neutrality (Zhang et al., 2017; Gao et al., 2021). These studies emphasize the need to better understand the impact of mariculture systems involving seaweed cultivation on the nutrient dynamics of coastal waters in our quest to adopt sustainable and environmentally friendly mariculture models.
Sansha Bay is a semi-enclosed bay located in the coastal area of the East China Sea. It is known for its seaweed-based mariculture systems and is referred to as the “hometown of Chinese nori” and the “hometown of Chinese kelp” (Chen et al., 2013). The bay experiences minimal winter runoff, and its hydrography is primarily influenced by the China Coastal Current (CCC) in winter. The nutrient concentrations of the bay waters are more heavily affected by mariculture activities than other factors such as ocean currents owing to the narrow outlet connecting the bay to the open ocean (Han et al., 2021). Larimichthys crocea is the main species of fish cultured in the bay, and millions of tons of feed are required annually to maintain the fish culture (Xie et al., 2020). However, approximately 5%–10% of the feed decomposes in the water (Duan et al., 2001). Han et al. (2021) observed that the Sansha Bay water mass had relatively low salinity compared with the East China Sea Shelf Water and the CCC but much higher nutrient concentrations than other water masses in this coastal area, and they suggested this disparity may be due to the influence of intensive mariculture activities. These factors make Sansha Bay an ideal location for studying the environmental impact of mixed mariculture systems involving seaweed cultivation. The biogeochemical processes of nutrients in Sansha Bay are complicated; however, systematic biogeochemical studies are lacking.
The abundance of 15N and 18O in nitrates (δ15N-NO3− and δ18O-NO3−) is useful for identifying the sources and biological transformations of N in coastal ecosystems (Wankel et al., 2009; Chen et al., 2022a; Tian et al., 2022). In this study, nutrients and dual nitrate isotopes (δ15N-NO3−, δ18O-NO3−) were measured in the waters of Sansha Bay during the winter of 2021. In addition, a Bayesian stable isotope mixing model was used to calculate the relative contributions from several nitrate sources. Our overall aims were to (1) determine the eutrophication status of the bay’s winter seawater; (2) identify the ranges of dual nitrate isotope values and assess the main sources of nitrate in Sansha Bay; and (3) evaluate the impact of seaweed-based aquaculture on the nutrient dynamics of the bay waters.
2 Materials and methods
2.1 Study area
Sansha Bay (26°30′–26°58′E, 119°26′–120°10′N) is located on the northeast coast of Fujian Province, China (Figure 1). The surface current outside Sansha Bay is influenced by the CCC in winter and the South China Sea Warm Current (SCSWC) in summer. In late autumn and winter, seawater from the East China Sea or from farther north of China is transported along the coast under the influence of winter winds. In addition, observations based on radium isotopes (226Ra and 228Ra) have shown that groundwater input in Sansha Bay also affects the nutrient flux (Wang et al., 2018). Seasonal activities such as seeding, growing, and harvesting on the densely clustered floating mariculture mats in the bay also have a substantial effect on the spatial–temporal distribution of its hydrochemical parameters (Wang et al., 2018). In addition, driven by the Asian monsoon, the hydrographic characteristics of Sansha Bay were significantly influenced by the plume water of the Jiao River, which showed the highest freshwater discharge rate in warm months (from April to September) and the lowest in cold months (from October to April the following year). Han et al. (2021) observed a water mass with relatively lower salinity than CCC meandering in Sansha Bay and influenced by intensive mariculture activities, nutrient concentrations in this Bay were much higher than other water masses in this coastal area.
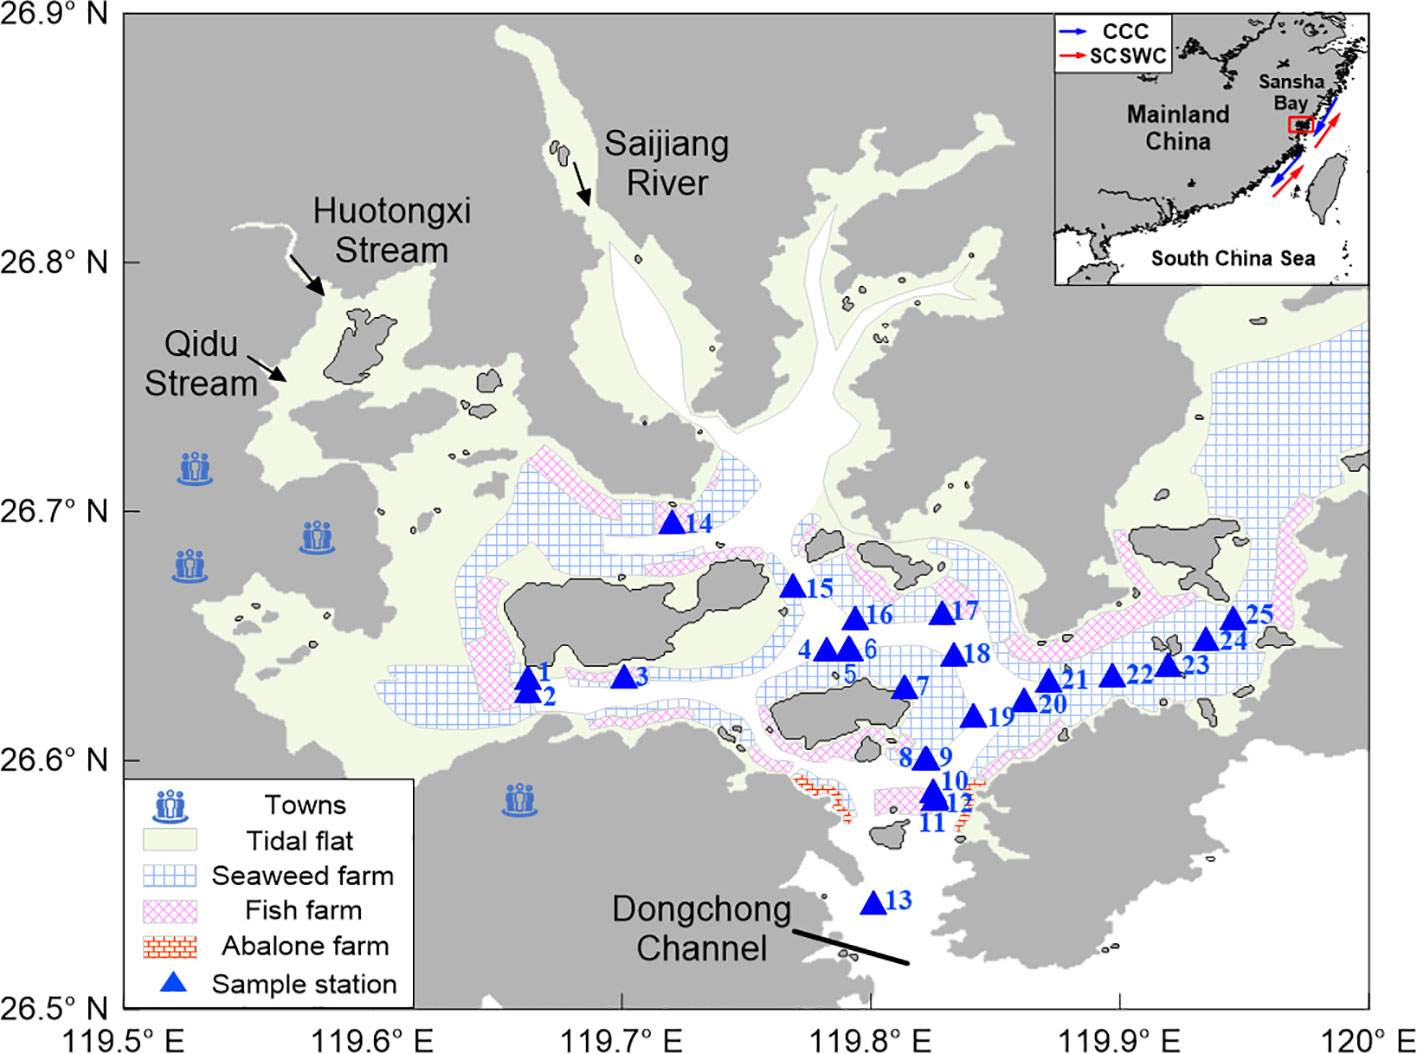
Figure 1 Location maps and sampling sites in Sansha Bay in December 2021. The top right inset shows a schematic trajectory of the surface current outside Sansha Bay, with the China Coastal Current (CCC, blue arrows) in winter and the South China Sea Warm Current (SCSWC, red arrows) in summer (Han et al., 2021). Sample stations are indicated by blue solid triangles. Light green areas represent tidal flats, and the various grids represent different types of mariculture.
2.2 Sampling strategy
A research cruise was carried out in Sansha Bay on 11–12 December, 2021 (Figure 1). Water samples were collected at 25 stations using a 5L Niskin bottle guided by a Conductivity–Temperature–Depth (CTD; Seabird® WQM 2019) recorder, which simultaneously measured sea surface temperature (SST) and salinity (SSS). Salinity in the water column samples was determined using a portable salinometer (Portasal 8410A, Guildline Co., Canada) and used to calibrate data from the CTD recorder. Water samples were obtained from two or three depth layers at each sampling site, depending on the overall water depth. “Surface waters” refer to waters 1 m below the surface, and “bottom waters” denote waters 1 m above the sediment bed.
2.3 Nutrient analysis
Nutrient samples were filtered using cellulose acetate membranes with a pore size of 0.45 μm that had been acid-cleaned. Two hundred and fifty mL of filtered seawater was frozen and stored at −20°C and used for routine spectrophotometric analysis of NO3−, NO2−, PO43−, and Si(OH)4 concentrations using the Technicon AA3 automatic analyzer (Bran-Lube, GmbH; Han et al., 2021). Concentrations of NO3− + NO2− were determined using a Cu–Cd column reduction method, and NO2− contents were determined using spectrophotometry with standard pink azo dye (Dai et al., 2008). Concentrations of PO43− and Si(OH)4 were measured using standard spectrophotometric methods (Knap et al., 1996). The detection limits for NO3− + NO2−, PO43−, and Si(OH)4 were 0.1, 0.08, and 0.08 µM, respectively. The relative standard deviations (RSD) of repeat measurements of selected samples were<5%.
2.4 Analysis of nitrate isotopes
Isotope analyses of NO3− were carried out according to the method of Sigman et al. (2001) and Casciotti et al. (2002) (Equations 1 and 2) using an isotope-ratio mass spectrometer (IRMS). The international nitrate reference materials NITS USGS34 (δ15N = −1.8‰; δ18O = −27.9‰) and NITS USGS35 (δ15N = 2.7‰; δ18O = 57.5‰) were used to correct for drift, oxygen isotopic exchange, and blanks. The average standard deviation was typically 0.2‰ for δ15N and 0.5‰ for δ18O, which is applicable to samples with NO3− concentrations ≥ 1 μM. Isotope ratios are reported in delta (δ) notation in units of per mil (‰):
where denotes N2 in air and denotes Vienna Standard Mean Ocean Water (VSMOW).
2.5 Potential eutrophication
Phytoplankton absorbs nutrients from seawater according to the Redfield ratio (Redfield, 1963), leaving relative excess of nitrogen or phosphorus. Excess nitrogen or phosphorus do not have direct contribution to eutrophication but could be considered as a potential factor, known as potential eutrophication (Sun et al., 2006). In order to highlight the limiting characteristics of nutrient salts, dissolved inorganic nitrogen (DIN, including NO3-, NO2- and NH4+) and active phosphate (PO43-), which play a bottleneck role in phytoplankton growth (Zhuang et al., 2021b), were selected as evaluation parameters. The potential eutrophication evaluation model (Table 1, Guo et al., 1998; Sun et al., 2016; Yang et al., 2020) was adopted for the evaluation of the nutrient condition in the study area.
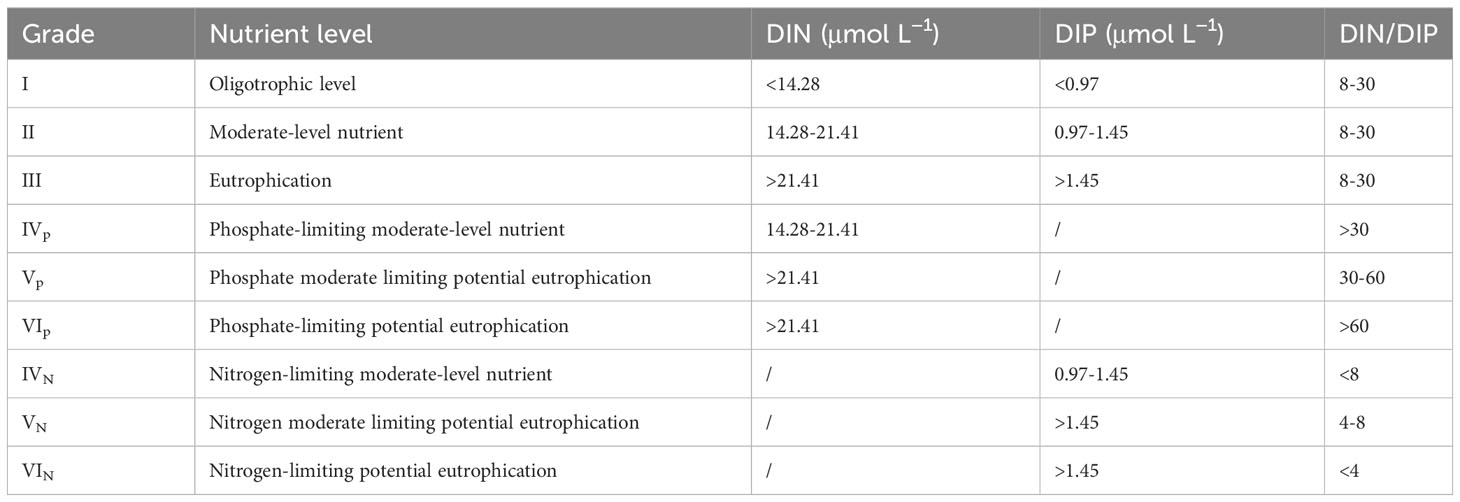
Table 1 The evaluation standards for potential eutrophication.
2.6 Calculation of N*
To evaluate the nitrate deficit, we used the parameter N* proposed by Gruber and Sarmiento (1997), where N* = ([NO3−] − 16*[PO43−] + 2.9) × 0.87. In the equation, 16 is the Redfield ratio of 16:1, and 0.87 is a calculated factor based on the specific stoichiometric ratios in denitrification and remineralization processes. The constant (2.9) was introduced to set the mean N* to zero and is based on global measurements (Gruber and Sarmiento, 1997). The N* index reflects the net effect of N2 fixation and denitrification, and negative N* values imply a nitrate deficit in the ocean (Deutsch and Weber, 2012).
2.7 Stable isotope analysis in R mixing model
SIAR (stable isotope analysis in R) is a software package that uses a Bayesian stable isotope mixing model, which is used to calculate the relative proportion of various nitrate sources. In the mixing model, the Bayesian framework is utilized to calculate the probability distribution amongst the different nitrate sources. The model framework is as follows:
where denotes the isotope values (j = 2, δ15N-NO3−, and δ18O-NO3−) of the sample i (i = 1, 2, 3, … N); is the isotope value j of the source k (k = 1, 2, 3, … K) and is normally distributed with an average and standard deviation ; Pk is the proportion of source k, as calculated using the SIAR model; is the fractionation factor for j on source k and is normally distributed with an average and standard deviation ; ϵjk is the residual error of the additional unquantified variations between individual samples and is normally distributed with an average 0 and standard deviation σj. The model uses CSV Microsoft Excel of δ15N-NO3− and δ18O-NO3−, , and as inputs. It then outputs numerical and graphical depictions of the relative contributions of the potential sources (Zhang et al., 2018) (Equation 3). More detailed information of the Bayesian stable isotope mixing model has been provided by Moore and Semmens (2008); Xue et al. (2009), and Zhang et al. (2018).
3 Results
The water depth in Sansha Bay ranges from 8 to 50 meters (Figure 2A). During winter, water temperatures at the survey stations in Sansha Bay range from 17.8 to 18.6°C, with an average of 18.4 ± 0.1°C, and salinity ranges from 20.25 to 21.99, with an average of 21.45 ± 0.45 (Figures 2B, C; Supplementary Figure 1). There were only very small horizontal and vertical variations in temperature and salinity within the bay (Supplementary Figure 2), indicating a relatively homogeneous hydrographical property. The small amount of winter runoff from rivers into Sansha Bay (Supplementary Figure 3), the influence of riverine inputs on the physicochemical properties of the water is minimal, as reflected by the distribution patterns of temperature and salinity.
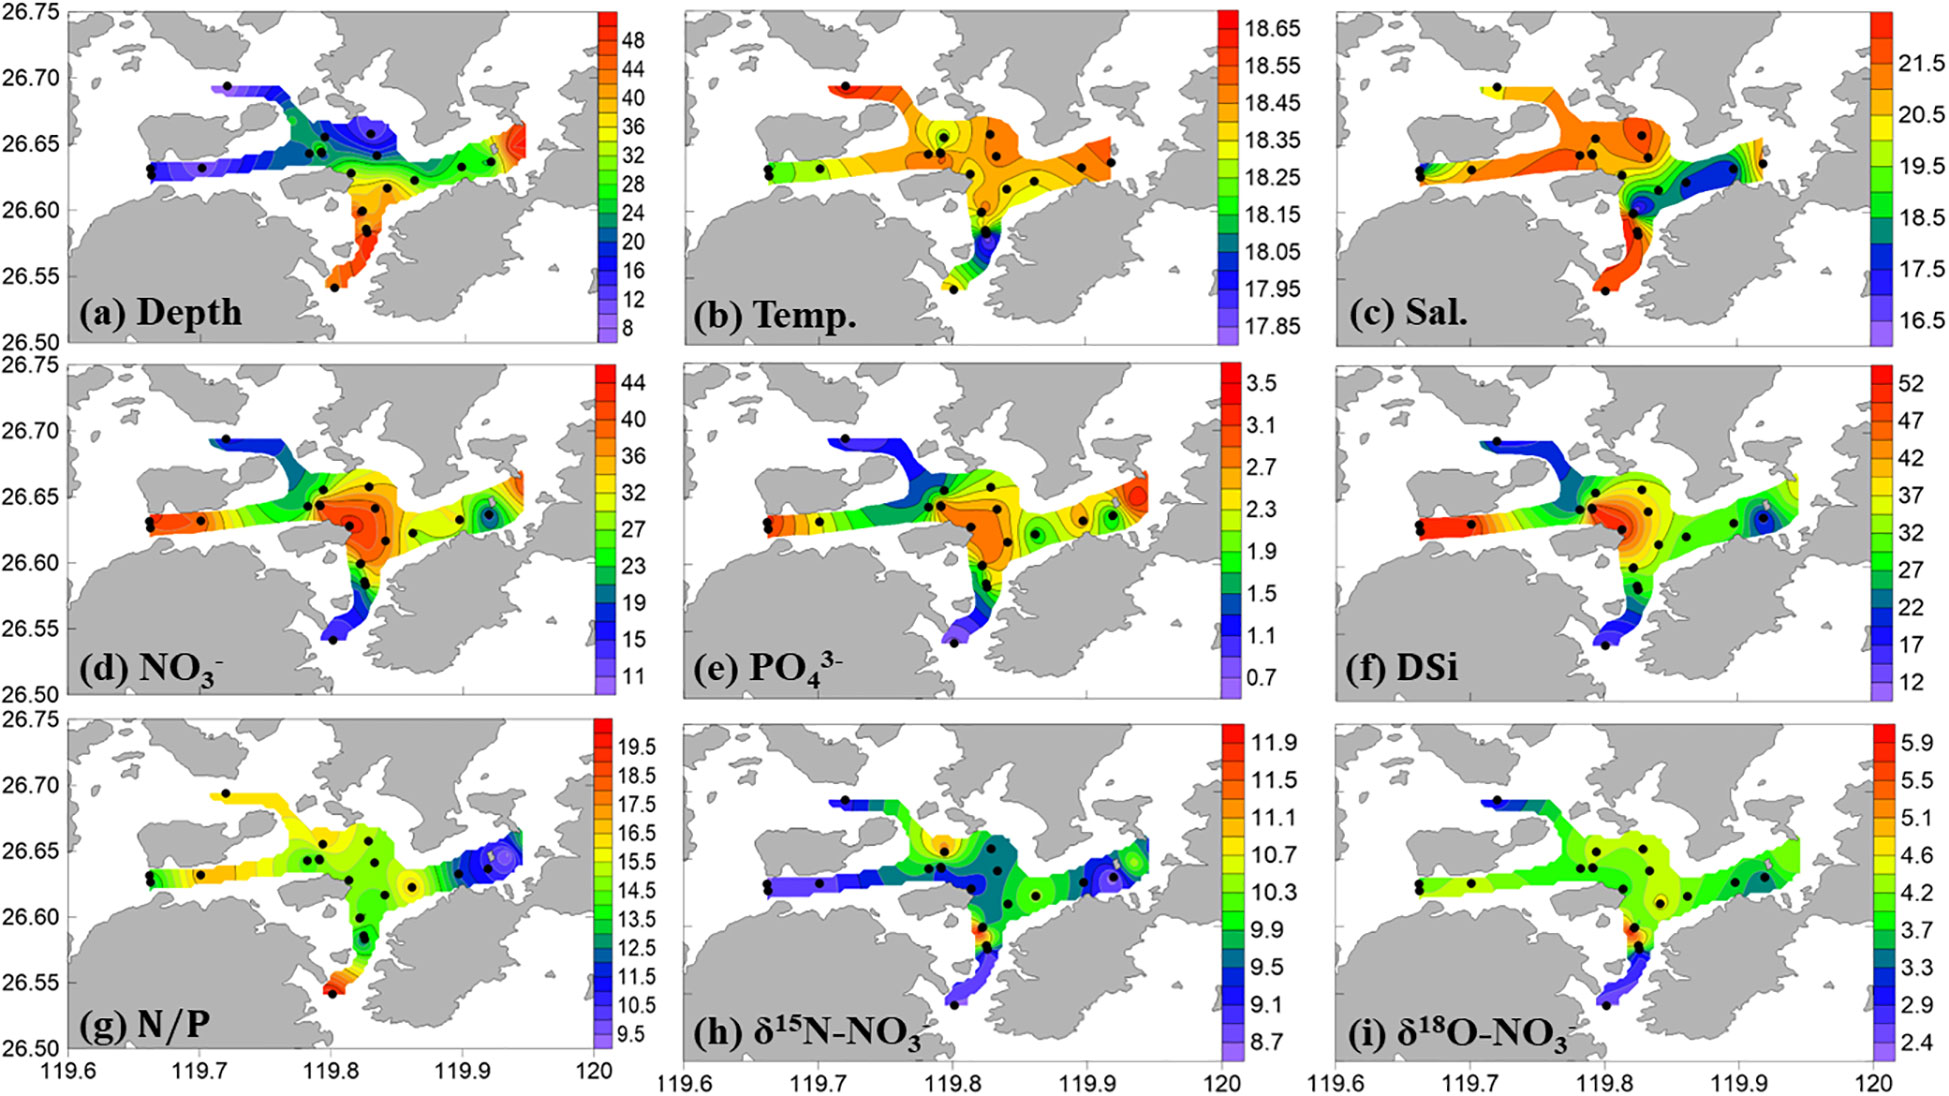
Figure 2 Surface distributions of (A) station depth (m), (B) temperature (°C), (C) salinity, (D) NO3− (µM), (E) PO43− (µM), (F) Dsi (µM), (G) NO3−/PO43−, (H) δ15N-NO3−, and (I) δ18O-NO3− in Sansha Bay in winter 2021.
During the investigation, nitrate concentrations at the Sansha Bay survey stations ranged from 8.4 to 44.9 µM, with an average concentration of 31.3 ± 10.5 µM, phosphate concentrations ranged from 0.46 to 3.61 µM, with an average concentration of 2.26 ± 0.84 µM, and silicate concentrations ranged from 9.8 to 52.9 µM, with an average concentration of 32.8 ± 11.3 µM (Figures 2D–F; Supplementary Figure 1). The lowest nutrient concentrations in the surface and bottom waters were recorded at the mouth of Sansha Bay.
The NO3−/PO43− ratios in the water at the survey stations ranged from 9.3 to 20.0, with an average value of 14.3 ± 2.2, which is lower than the Redfield ratio (16:1). The highest NO3−/PO43− ratios in surface and bottom layers were observed at the mouth of Sansha Bay, corresponding to the lowest nutrient concentrations (Figure 2G; Supplementary Figure 1). The NO3−/PO43− ratios in the bay were lower than those at the bay mouth, suggesting that biogeochemical processes modify the nutrient structure in the bay. During the investigation, the NO3−/DSi ratios in the water ranged from 0.6 to 1.1, with an average value of 0.96 ± 0.11, which is close to the Redfield ratio (1:1).
In winter, the δ15N-NO3− values in Sansha Bay were 8.8‰–11.9‰, with an average value of 9.8‰ ± 0.6‰. δ18O-NO3− values were 2.2‰–6.0‰, with an average value of 4.0‰ ± 0.8‰ (Figures 2H–I). There is a positive correlation between δ15N-NO3− and δ18O-NO3− in surface waters (using the equation δ18O-NO3− = 0.70 × δ15N-NO3− − 2.9), indicating either a relatively uniform source of surface nitrate or that similar biogeochemical processes were active (Figure 3A). However, there is no significant correlation between δ15N-NO3− and δ18O-NO3− values in bottom waters (Figure 3B). As observed in the nutrient distribution pattern, δ15N-NO3− and δ18O-NO3− values were higher in the mariculture area within the bay and lower at the bay mouth.
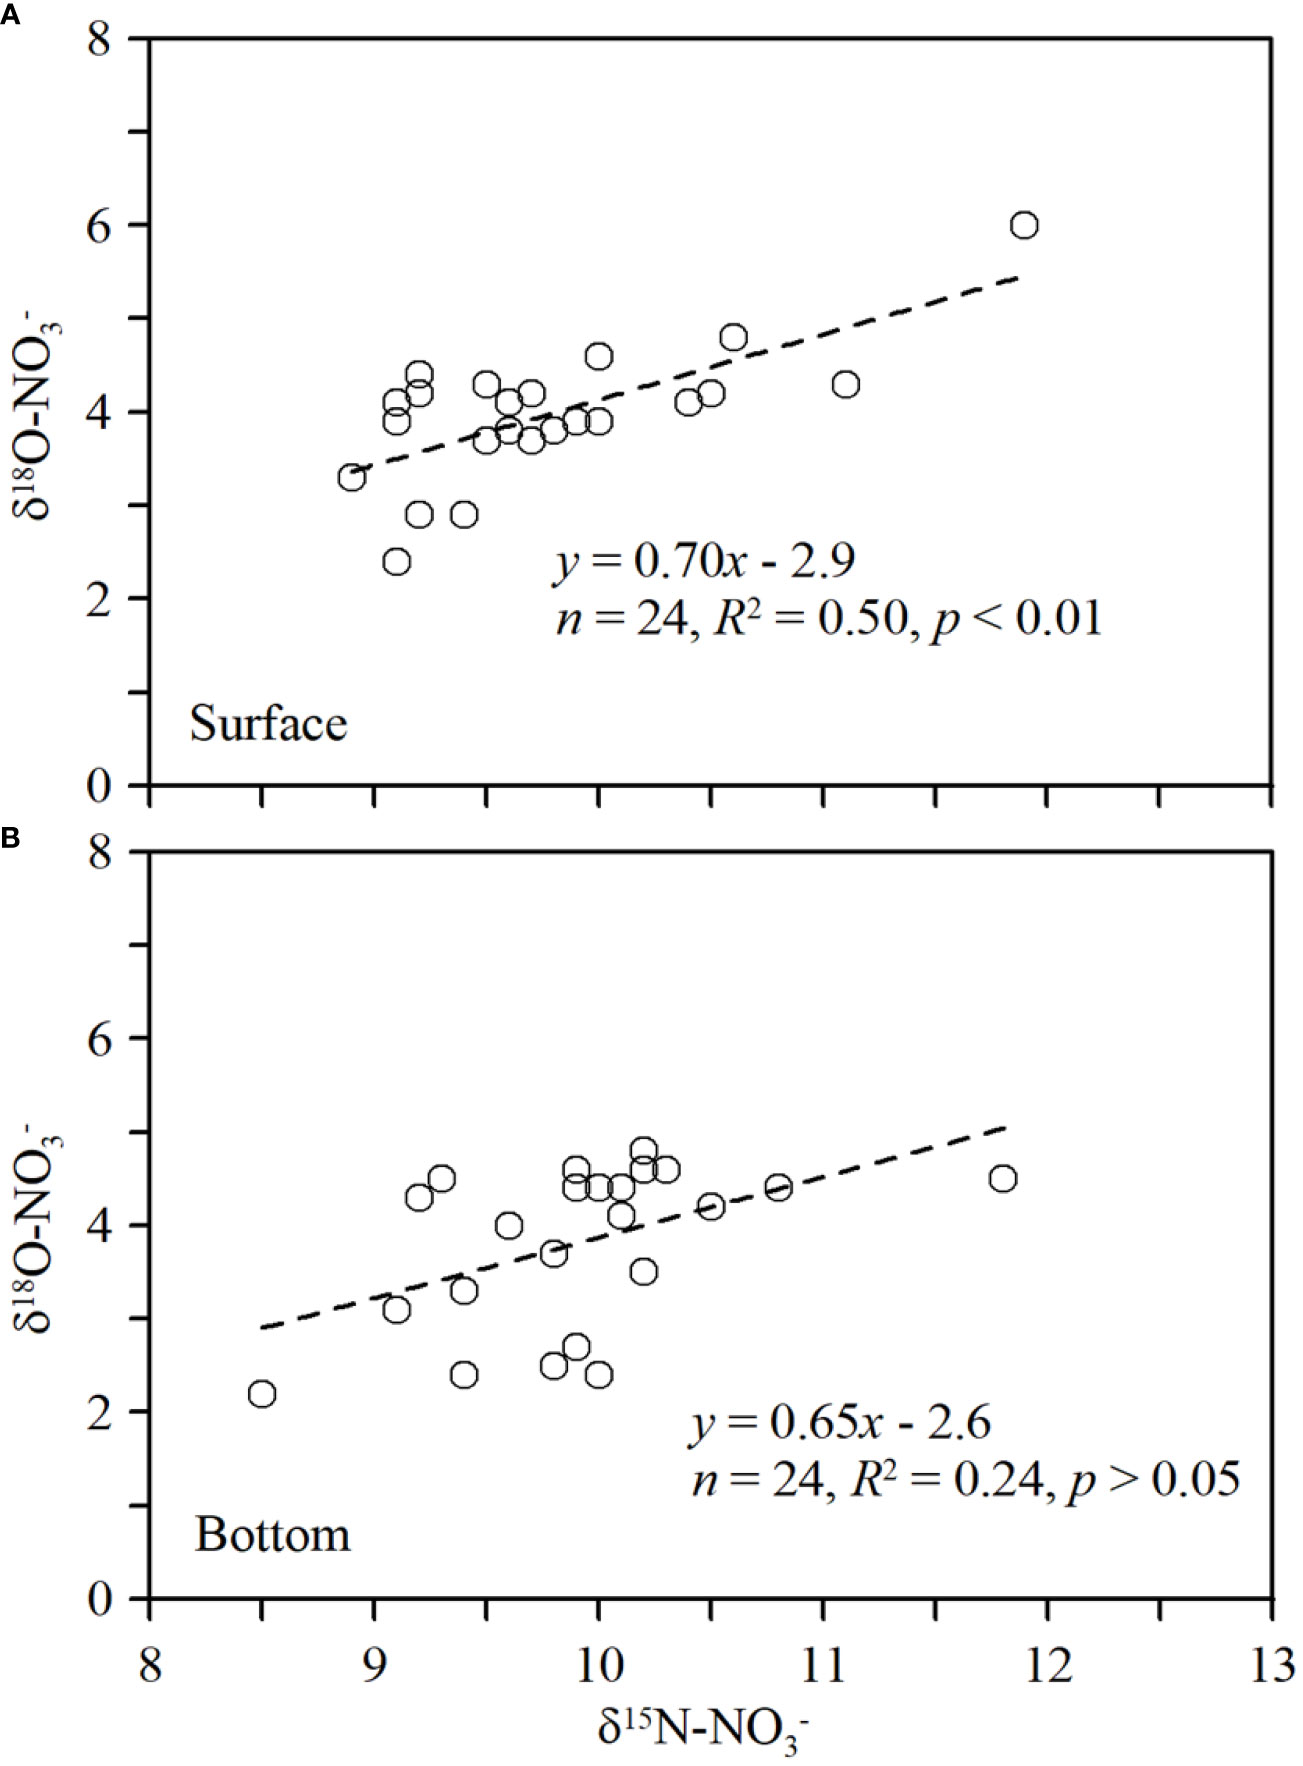
Figure 3 Relationship between δ15N-NO3− and δ18O-NO3− in surface (A) and bottom (B) waters in Sansha Bay in winter.
4 Discussion
4.1 Nutrient status of Sansha Bay in winter
The winter waters in Sansha Bay, like most coastal harbors affected by the CCC in southeastern China, appear to be characterized by eutrophication (e.g., Cai et al., 2013; Yang et al., 2018). Approximately 81% of the data points (50/62) in this study exceeded the thresholds for eutrophication in harbor waters proposed by Guo et al. (Guo et al., 1998; NO3− >21.4 µM, PO43−>1.45 µM), indicating that most of the winter water in Sansha Bay was eutrophic (Figure 4). The small amount of winter run off from rivers into Sansha Bay and another area of low surface nutrient concentrations was found at the mouth of the Sai River, suggesting that winter river input does not greatly influence nutrient levels in the bay. The lowest nutrient concentrations in the surface and bottom waters were recorded at the mouth of Sansha Bay., indicating that offshore water input may not be the main source of nutrients into the bay. Areas of high nutrient concentrations were observed mainly in mariculture areas, indicating that mariculture activities contribute to nutrient levels in the bay. The influence of the winter CCC extends from 26°N to 35°N along the southeastern coast (Wang et al., 2003). As shown in Figure 5, the NO3−/PO43− ratios in CCC-influenced harbors along the southeastern coast of China generally decrease from north to south. Owing to the input of nutrients from the Yangtze River, NO3−/PO43− ratios can exceed 80 in the winter waters of the Yangtze River estuary (Liu et al., 2009). The CCC carries signals from the land sources of the Yangtze River and a large volume of nutrients to the southeastern coastal harbors during winter, which is one of the main reasons for the high N/P ratios in these harbors (Yang et al., 2018). The NO3−/PO43− ratios in Hangzhou Bay, Xiangshan Bay, and Sanmen Bay are relatively similar (Cai et al., 2013; Wu et al., 2020) and lower than those of the Yangtze River estuary, but they further decrease to 14.3 ± 2.2 in Sansha Bay (Figure 5; Supplementary Table 1).
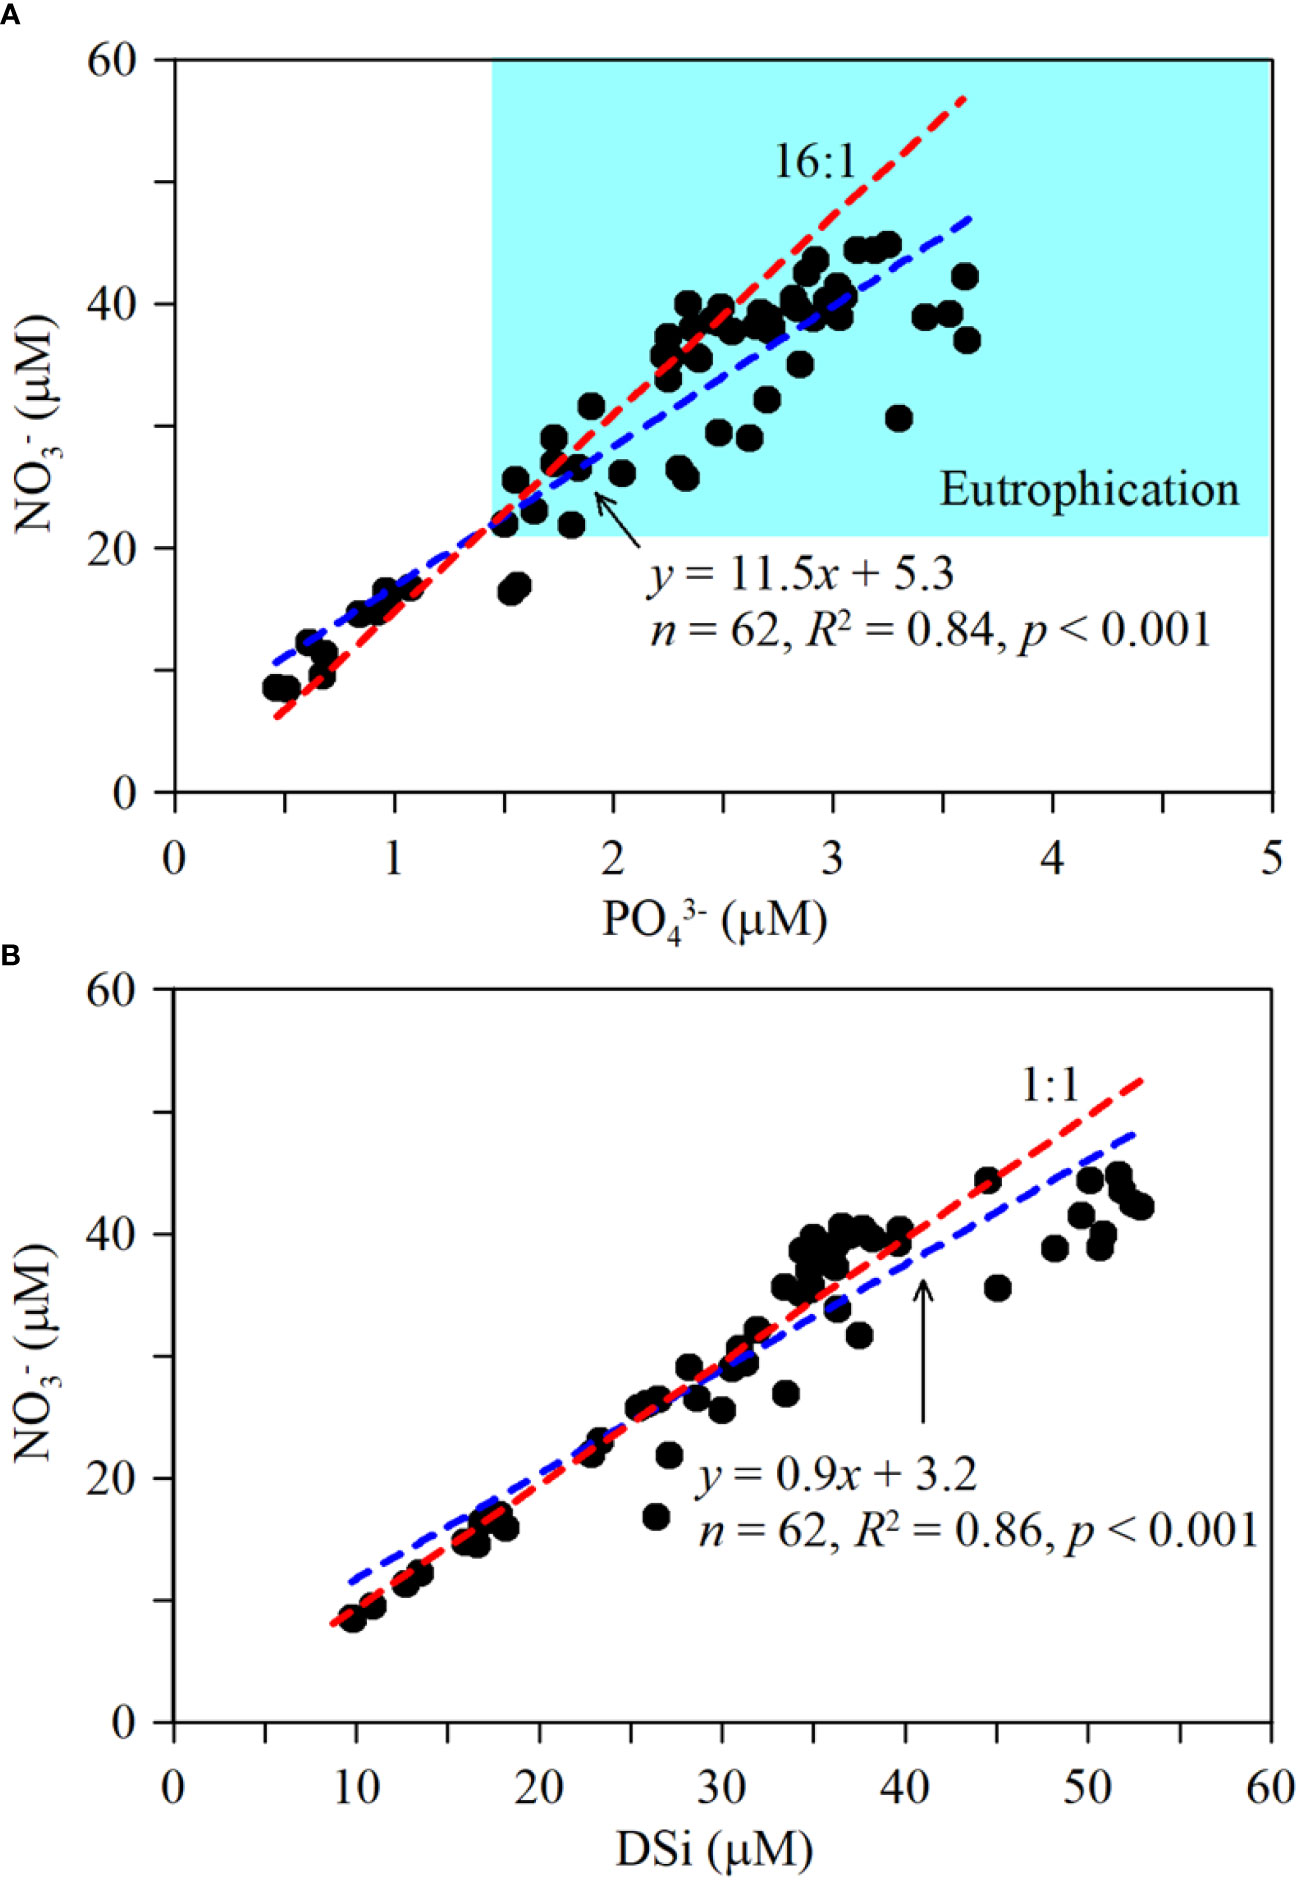
Figure 4 Relationship between (A) NO3− (µM) and PO43− (µM), (B) NO3− and DSi (µM). Dashed red lines represent the Redfield ratios of NO3−/PO43- = 16:1 and NO3−/DSi = 1:1. Dashed blue lines represent linear regression lines.
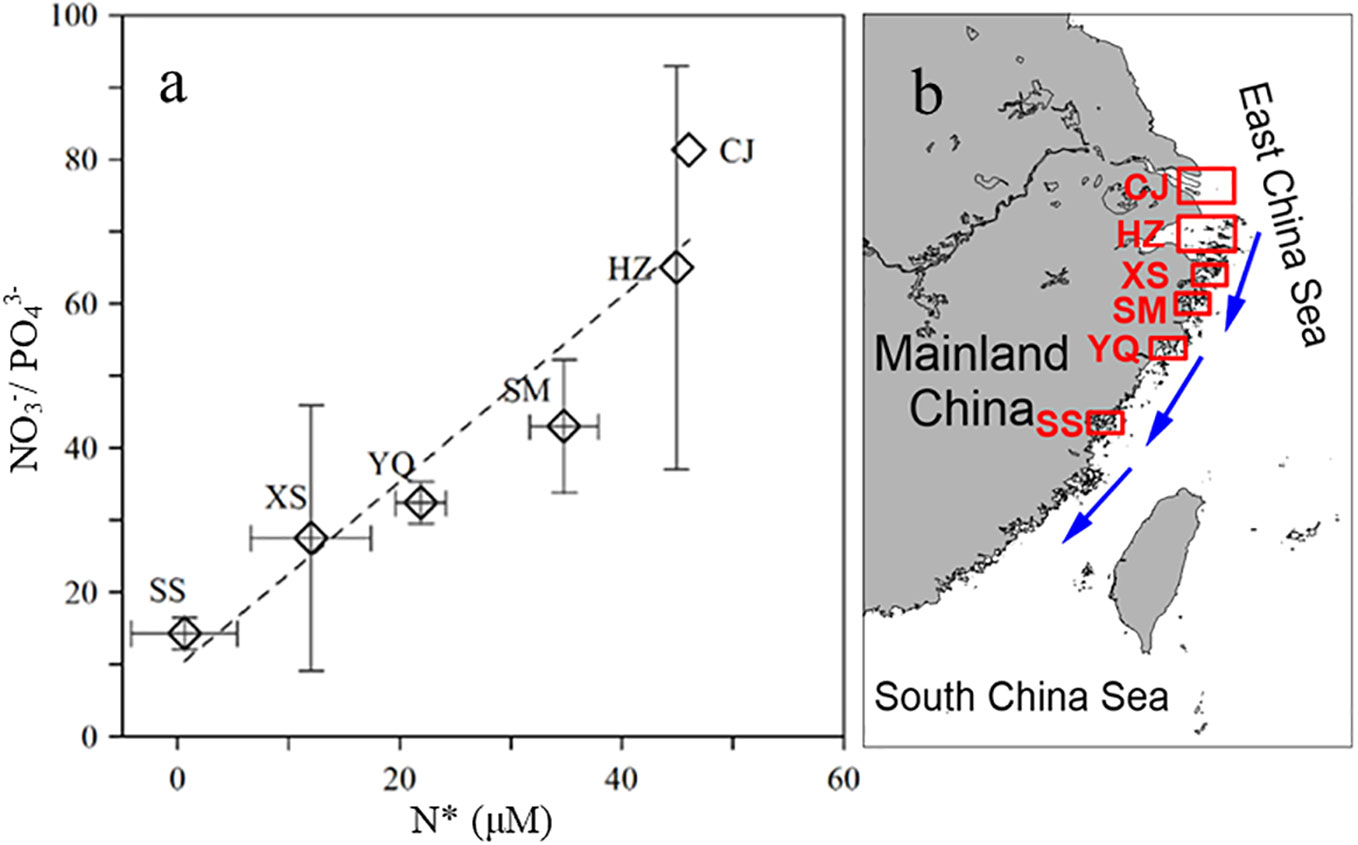
Figure 5 (A) North–south variations in NO3−/PO43− and N* (μM), as measured in the coastal ports of Southeast China, which are under the influence of the CCC. (B) Geographical locations of the coastal harbors of Southeast China. Dashed lines represent linear regression lines. CJ: Changjiang estuary, HZ: Hangzhou Bay, XS: Xiangshan Bay, SM: Sanmen Bay; YQ: Yueqing Bay, SS: Sansha Bay.
The winter waters of Sansha Bay have lower NO3−/PO43− and NO3−/DSi ratios than many other nearshore harbors influenced by the CCC (Supplementary Table 1). Correlation analysis showed significant positive relationships between concentrations of NO3− and both PO43− and DSi (Figure 4). The relationship between NO3− and PO43− concentrations was examined by linear regression and indicates that NO3− concentrations increased with increasing PO43−; however, the slope was only 11.5, lower than the Redfield ratio (Figure 4A). Similarly, NO3− concentrations increased with increasing DSi, with a slope of 0.9 (Figure 4A). These results indicate that the winter waters of Sansha Bay are eutrophic but have relatively low N/P ratios.
The distribution of the N* index reflects the excess (positive values) or deficiency (negative values) of nitrate relative to phosphate (Deutsch and Weber, 2012). The N* values decrease gradually along the southeastern coast, with values approaching 0 in Sansha Bay, indicating that strong denitrification processes occur as the excess nitrate flows southward and enters coastal harbors. This may be related to intense nitrogen removal via sedimentary denitrification (Li et al., 2021). Indeed, observations show that denitrification at the mouth of the Yangtze River is the main pathway for the removal of excess nitrogen, with nitrogen removal rates reaching up to 28.49 ng N g−1·h−1 (Li et al., 2021).
4.2 Sources and biochemical transformation of nitrate in Sansha Bay waters
Based on the dual isotope method for nitrate source identification (Kendall et al., 2007; Xue et al., 2009), the δ15N-NO3− (8.8‰–11.9‰) and δ18O-NO3− (2.2‰–6.0‰) values in Sansha Bay waters (Figure 6) suggest that the main sources of nitrate are manure and sewage, as evidenced by the more positive δ15N-NO3− values. The δ15N-NO3− values are lower at the mouths of the main rivers entering the bay (Figure 2) when the river input is low (Supplementary Figure 3), suggesting that the more positive anthropogenic signal may be introduced by mariculture activities within the bay. Previous studies have suggested that the main sources of nutrients in Sansha Bay during winter are the eutrophic coastal currents and mariculture inputs (Han et al., 2021); however, the extent of the latter depends heavily on the type of mariculture. Jiang et al. (2020) found that seaweed aquaculture in Xiangshan Bay absorbed nutrients and alleviated eutrophication. The type of mariculture may also affect the distribution of dual nitrate isotopes. In Xiangshan Bay, where seaweed aquaculture is dominant, δ15N-NO3− and δ18O-NO3− values range from 5.7‰ to 8.8‰ and from 1.8‰ to 6.8‰, respectively (Yang et al., 2018). In Laizhou Bay, where sea cucumber aquaculture is dominant, δ15N-NO3− and δ18O-NO3− values range from 2.0‰ to 11.8‰ and from −7.8‰ to 12.6‰, respectively (Kang and Xu, 2016).
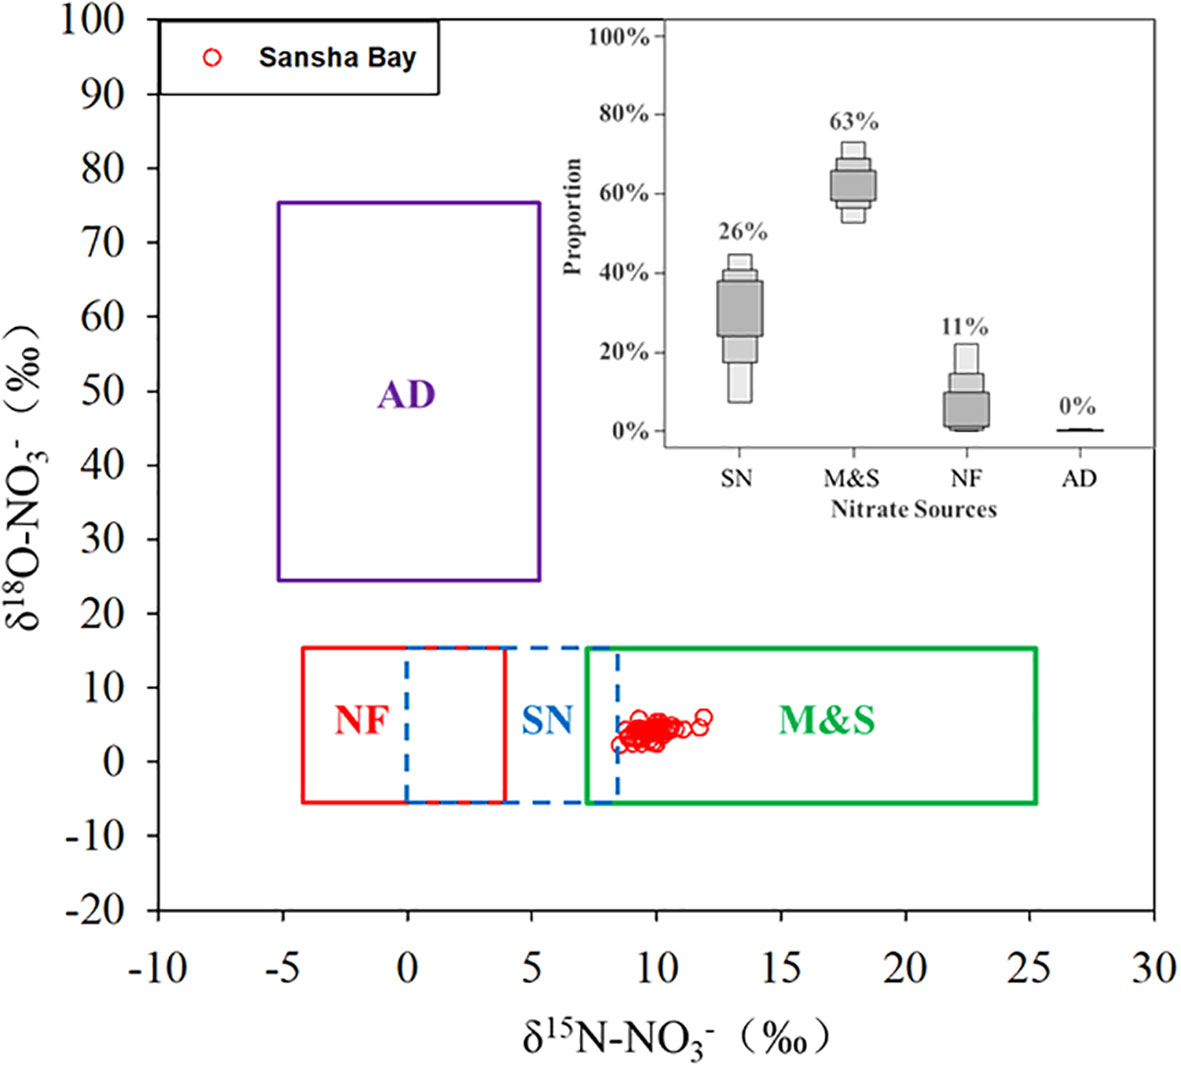
Figure 6 Cross plot of δ15N-NO3− and δ18O-NO3− values in the surface water samples of Sansha Bay (red dots) and the relative proportions of potential nitrate sources (atmospheric deposition, AD; manure and sewage, M&S; soil organic nitrogen, SN; and N fertilizer, NF), as calculated using the Bayesian isotopic mixing model. The isotopic compositions of the various sources are based on Kendall (1998) and Zhang et al. (2018).
The application of Bayesian mixing models reveals that the surface water in Sansha Bay has a mixture of sources (Supplementary Figure 4), which poses a challenge for nitrate source analysis. According to previous studies, the main nitrate sources in water are likely manure and sewage, reduced nitrogen fertilizer, nitrate derived from soil nitrogen, and atmospheric deposition (Dai et al., 2008; Ye et al., 2016). The relative contributions of these four potential nitrate sources have been calculated in many studies across a broad range of study areas (e.g., Moore and Semmens, 2008; Xue et al., 2012; Zhang et al., 2018; Lao et al., 2019). Therefore, we calculated the potential sources of nitrate using δ15N-NO3− and δ18O-NO3− values in a Bayesian isotope mixing model (Chen et al., 2022b). The uncertainty associated with these calculations is difficult to constrain with the present data because (a) the range of isotopic values from potential nitrate sources is relatively large (Supplementary Table 2), and (b) the end-members of the potential nitrate sources originate from the reference literature and not from the measurement of samples in Sansha Bay. Nevertheless, such an estimate can provide an insight into nitrate sources in Sansha Bay. The end-member values for the potential nitrate sources are presented in Supplementary Table 2, and the results are shown in Figure 6. The results suggest that manure and sewage were the predominant sources of nitrate in the surface waters of Sansha Bay (51%–75%, average 63%), followed by soil organic nitrogen (3%–45%, average 26%) and reduced nitrogen fertilizer (0%–24%, average 11%).
4.3 Impact of mariculture on nutrient loading and N/P ratios
Mariculture activities are commonplace in the harbors along the southeastern coast of China and include kelp farming in Xiangshan Bay (Yang et al., 2018), mixed crab and seaweed farming in Sanmen Bay (Cai et al., 2013), and mixed shellfish and seaweed farming in Sansha Bay (Han et al., 2021). Most mariculture activities increase nutrient loading in water owing to the excretion of farmed organisms and the addition of feed (Bouwman et al., 2013). In this study, the higher nutrient concentrations in Sansha Bay compared with the bay mouth suggest nutrient loading from mariculture. However, the low NO3−/PO43− ratios in Sansha Bay compared with the bay mouth indicate the possibility of denitrification in the bay, which may be caused by the structural modification of nutrients, potentially owing to seaweed farming. Zhang et al. (2022) suggested that seaweed farming may increase N/P ratios, whereas bivalve farming may decrease N/P ratios. Overall, the N/P ratio of nutrients removed by mariculture is close to 18. In Sansha Bay, where mixed shellfish and seaweed farming occurs, excess nitrate (relative to phosphate) may be absorbed during mariculture activities under conditions of sufficient nitrogen, and excess nitrogen may be removed from the water during the harvest season (Han et al., 2021).
Previous studies have shown that when algae have high rates of nitrate assimilation, the δ15N of the remaining nitrate will increase significantly owing to the preferential utilization of 14N by the organism (Ahad et al., 2006; Chen et al., 2013). Average δ15N-NO3− values in Sansha Bay during winter were as high as 9.8‰ ± 0.6‰, higher than the spring ratios measured in the Yangtze River Estuary (6.9‰, Chen et al., 2013) and the Pearl River Estuary (2.2‰–4.4‰, Chen et al., 2022b). These values are also higher than those measured in the upper bay area of Xiangshan Bay, where kelp farming is predominant (8.1‰ ± 0.5‰), and the lower bay area, which is significantly influenced by dilution via input from the Yangtze River (6.2‰ ± 0.3‰) (Yang et al., 2018). These results indicate that Sansha Bay experiences strong biological absorption and transformation of nitrate.
The intense biological production and deposition of organic debris in the surface layer during seaweed cultivation provides abundant organic matter to the sediment (Zhuang et al., 2022). The re-mineralization of this organic matter may enhance sedimentary denitrification (Wu et al., 2021), thus removing more nitrogen (while phosphates remain unaffected) and reducing N/P ratios. Denitrification enriches the residual nitrate, with δ15N and δ18O having a ratio close to 2:1 (Kendall, 1998; Mengis et al., 1999). The higher δ15N-NO3− and δ18O-NO3− values in the bottom waters of the mariculture area in Sansha Bay compared with the surface waters support the idea that denitrification processes are occurring in the sediment (Figure 3). These findings suggest that in areas where shellfish and seaweed are cultivated, the strong absorption of nitrate by organisms and enhanced sedimentary denitrification stimulated by the downward settling of organic matter result in the reduction of N/P ratios in the water.
5 Conclusion
The average concentrations of nitrate and phosphate in Sansha Bay during winter 2021 were 31.3 ± 10.5 and 2.26 ± 0.84 µM, respectively, indicating eutrophic conditions. However, N/P ratios were relatively low, with an average of only 14.3 ± 2.2. Nitrate isotope ratios in Sansha Bay were 8.8‰–11.9‰ for δ15N-NO3− and 2.2‰–6.0‰ for δ18O-NO3−. Based on the nitrate isotopes, it is suggested that the main sources of nitrate in Sansha Bay are likely sewage discharge and biological excretion associated with mariculture activities. Therefore, mariculture has contributed to the eutrophication of the water. However, the isotopic fractionation model of nitrate assimilation by organisms indicates that strong biological uptake of nitrate is occurring in the surface waters of Sansha Bay, possibly owing to extensive algal cultivation during winter. The low N/P ratios of Sansha Bay may be attributed to excessive nitrogen uptake by shellfish and algae cultivation, as well as the introduction of organic matter from algal cultivation, which enhances denitrification and nitrogen removal in sediments. Therefore, aquaculture activities in Sansha Bay may exacerbate eutrophication while also altering nutrient compositions and reducing N/P ratios.
Data availability statement
The raw data supporting the conclusions of this article will be made available by the authors, without undue reservation.
Author contributions
DB: Writing – original draft. QZ: Writing – review & editing, Data curation, Methodology. JL: Writing – review & editing, Methodology. JH: Writing – review & editing, Data curation, Methodology. YZ: Writing – review & editing. WY: Writing – review & editing, Investigation. DQ: Writing – review & editing.
Funding
This study was funded by National Key Research and Development Program of China (2023YFC3108102), Fujian Provincial Science and Technology Plan & Natural Science Foundation of Fujian Province (2023J06036), and the Fujian Provincial Department of Education - Sea Economy government, industry, University and research alliance (FOCAL2023-0101) the Ocean Negative Carbon Emissions (ONCE) Program.
Conflict of interest
The authors declare that the research was conducted in the absence of any commercial or financial relationships that could be construed as a potential conflict of interest.
Publisher’s note
All claims expressed in this article are solely those of the authors and do not necessarily represent those of their affiliated organizations, or those of the publisher, the editors and the reviewers. Any product that may be evaluated in this article, or claim that may be made by its manufacturer, is not guaranteed or endorsed by the publisher.
Supplementary material
The Supplementary Material for this article can be found online at: https://www.frontiersin.org/articles/10.3389/fmars.2024.1351657/full#supplementary-material
References
Ahad J. M. E., Ganeshram R. S., Spencer R. G. M., Uher G., Upstill-Goddard R. C., Cowie G. L. (2006). Evaluating the sources and fate of anthropogenic dissolved inorganic nitrogen (DIN) in two contrasting North Sea estuaries. Sci. Total Environ. 372, 317–333. doi: 10.1016/j.scitotenv.2006.09.018
Bannister R. J., Johnsen I. A., Hansen P. K., Kutti T., Asplin L. (2016). Near-and far-field dispersal modelling of organic waste from Atlantic salmon aquaculture in fjord systems. ICES J. Mar. Sci. 73, 2408–2419. doi: 10.1093/icesjms/fsw027
Beusen A., Doelman J., Van Beek L., Van Puijenbroek P., Mogollón J., Van Grinsven H., et al. (2022). Exploring river nitrogen and phosphorus loading and export to global coastal waters in the Shared Socio-economic pathways. Global Environ. Change 72, 102426. doi: 10.1016/j.gloenvcha.2021.102426
Bouwman L., Beusen A., Glibert P. M., Overbeek C., Pawlowski M., Herrera J., et al. (2013). Mariculture: significant and expanding cause of coastal nutrient enrichment. Environ. Res. Lett. 8, 044026. doi: 10.1088/1748-9326/8/4/044026
Boyd P. W., Lennartz S. T., Glover D. M., Doney S. C. (2015). Biological ramifications of climate-change-mediated oceanic multi-stressors. Nat. Climate Change 5, 71–79. doi: 10.1038/nclimate2441
Cai X., Pan J., Yu P., Liu X., Sun W. (2013). The behavior of nutrients in different harbors in coastal waters of Zhejiang province. Mar. Sci. Bull. 32 (5), 488–493. doi: 10.11840/j.issn.1001-6392.2003.05.002
Carballeira C., Cebro A., Villares R., Carballeira A. (2018). Assessing changes in the toxicity of effluents from intensive marine fish farms over time by using a battery of bioassays. Environ. Sci. Pollut. Res. 25, 12739–12748. doi: 10.1007/s11356-018-1403-x
Casciotti K. L., Sigman D. M., Hastings M. G., Böhlke J., Hilkert A. (2002). Measurement of the oxygen isotopic composition of nitrate in seawater and freshwater using the denitrifier method. Anal. Chem. 74, 4905–4912. doi: 10.1021/ac020113w
Chen C., Lao Q., Shen Y., Jin G., Chen F., Su Q., et al. (2022a). Comparative study of nitrogen cycling between a bay with riverine input and a bay without riverine input, inferred from stable isotopes. Front. Mar. Sci. 9, 885037. doi: 10.3389/fmars.2022.885037
Chen F., Chen J., Jia G., Jin H., Xu J., Yang Z., et al. (2013). Nitrate δ 15 N and δ 18 O evidence for active biological transformation in the Changjiang Estuary and the adjacent East China Sea. Acta Oceanol. Sin. 32, 11–17. doi: 10.1007/s13131-013-0294-4
Chen F., Deng Z., Lao Q., Bian P., Jin G., Zhu Q., et al. (2022b). Nitrogen cycling across a salinity gradient from the pearl river estuary to offshore: Insight from nitrate dual isotopes. J. Geophys. Res.: Biogeosci. 127, e2022JG006862. doi: 10.1029/2022JG006862
Cloern J. E. (2001). Our evolving conceptual model of the coastal eutrophication problem. Mar. Ecol. Prog. Ser. 210, 223–253. doi: 10.3354/meps210223
Dai M., Wang L., Guo X., Zhai W., Li Q., He B., et al. (2008). Nitrification and inorganic nitrogen distribution in a large perturbed river/estuarine system: the Pearl River Estuary, China. Biogeosciences 5, 1227–1244. doi: 10.5194/bg-5-1227-2008
Deutsch C., Weber T. (2012). Nutrient ratios as a tracer and driver of ocean biogeochemistry. Annu. Rev. Mar. Sci. 4, 113–141. doi: 10.1146/annurev-marine-120709-142821
Duan Q., Mai K., Zhong H., Si L., Wang X. (2001). Studies on the nutrition of the large yellow croaker, Pseudosciaena crocea R. I: growth response to graded levels of dietary protein and lipid. Aquacult. Res. 32, 46–52. doi: 10.1046/j.1355-557x.2001.00048.x
FAO. (2020). The State of World Fisheries and Aquaculture 2020. Sustainability in action (Rome: Agriculture Organization of the United Nations. Fisheries Department). doi: 10.4060/ca9229en
Gao G., Gao L., Jiang M., Jian A., He L. (2021). The potential of seaweed cultivation to achieve carbon neutrality and mitigate deoxygenation and eutrophication. Environ. Res. Lett. 17, 014018. doi: 10.1088/1748-9326/ac3fd9
Glibert P. M., Al-Azri A., Icarus Allen J., Bouwman A. F., Beusen A. H., Burford M. A., et al. (2018). Key questions and recent research advances on harmful algal blooms in relation to nutrients and eutrophication. Global Ecology and Oceanography of Harmful Algal Blooms, Ecological Studies 232, 229–259. doi: 10.1007/978-3-319-70069-4_12
Gruber N., Sarmiento J. L. (1997). Global patterns of marine nitrogen fixation and denitrification. Global Biogeochem. cycles 11, 235–266. doi: 10.1029/97GB00077
Guo W., Zhang X., Yang Y., Hu M. (1998). Potential eutrophication assessment for Chinese coastal waters. J. Oceanogr. Taiwan Strait/Taiwan Haixia 17, 64–70.
Han A., Kao S. J., Lin W., Lin Q., Han L., Zou W., et al. (2021). Nutrient budget and biogeochemical dynamics in Sansha Bay, China: A coastal bay affected by intensive mariculture. J. Geophys. Res.: Biogeosci. 126, e2020JG006220. doi: 10.1029/2020JG006220
Jiang Z., Liu J., Li S., Chen Y., Du P., Zhu Y., et al. (2020). Kelp cultivation effectively improves water quality and regulates phytoplankton community in a turbid, highly eutrophic bay. Sci. Total Environ. 707, 135561. doi: 10.1016/j.scitotenv.2019.135561
Kang P., Xu S. (2016). The impact of mariculture on nutrient dynamics and identification of the nitrate sources in coastal waters. Environ. Sci. Pollut. Res. 23, 1300–1311. doi: 10.1007/s11356-015-5363-0
Kendall C. (1998). Tracing sources and cycling of nitrate in catchments. Isotope Tracers Catchment Hydrol. 839, 519–576. doi: 10.1016/B978-0-444-81546-0.50023-9
Kendall C., Elliott E. M., Wankel S. D. (2007). “Tracing anthropogenic inputs of nitrogen to ecosystems,” in Stable Isotopes in Ecology and Environmental Science, Second Edition. (Wiley-Blackwell), 375–449. doi: 10.1002/9780470691854.ch12
Knap A., Michaels A., Close A., Ducklow H., Dickson A. (1996). Protocols for the joint global ocean flux study (JGOFS) core measurements. JGOFS Reprint IOC Manuals Guides No. 29 UNESCO 1994 19, 177.
Lao Q., Chen F., Liu G., Chen C., Jin G., Zhu Q., et al. (2019). Isotopic evidence for the shift of nitrate sources and active biological transformation on the western coast of Guangdong Province, South China. Mar. Pollut. Bull. 142, 603–612. doi: 10.1016/j.marpolbul.2019.04.026
Lao Q., Zhang S., Li Z., Chen F., Zhou X., Jin G., et al. (2022). Quantification of the seasonal intrusion of water masses and their impact on nutrients in the Beibu Gulf using dual water isotopes. J. Geophys. Res.: Oceans 127, e2021JC018065. doi: 10.1029/2021JC018065
Li Y., Jin H., Chen J., Wang D., Yang Z., Wang B., et al. (2021). Nitrogen removal through sediment denitrification in the Yangtze Estuary and its adjacent East China Sea: A nitrate limited process during summertime. Sci. Total Environ. 795, 148616. doi: 10.1016/j.scitotenv.2021.148616
Liu S. M., Hong G. H., Zhang J., Ye X. W., Jiang X. L. (2009). Nutrient budgets for large Chinese estuaries. Biogeosciences 6 (10), 2245–2263. doi: 10.5194/bg-6-2245-2009
Liu S. M., Li L. W., Zhang G. L., Liu Z., Yu Z., Ren J. L. (2012). Impacts of human activities on nutrient transports in the Huanghe (Yellow River) estuary. J. Hydrol. 430, 103–110. doi: 10.1016/j.jhydrol.2012.02.005
Mengis M., Schif S., Harris M., English M., Aravena R., Elgood R., et al. (1999). Multiple geochemical and isotopic approaches for assessing ground water NO3– elimination in a riparian zone. Groundwater 37, 448–457. doi: 10.1111/j.1745-6584.1999.tb01124.x
Moore J. W., Semmens B. X. (2008). Incorporating uncertainty and prior information into stable isotope mixing models. Ecol. Lett. 11, 470–480. doi: 10.1111/j.1461-0248.2008.01163.x
Redfield A. C. (1963). “The Influence of Organisms on the Composition of Seawater,” in The Sea (New York: Wiley Interscience), 26–77.
Sigman D. M., Casciotti K. L., Andreani M., Barford C., Galanter M., Böhlke J. (2001). A bacterial method for the nitrogen isotopic analysis of nitrate in seawater and freshwater. Anal. Chem. 73, 4145–4153. doi: 10.1021/ac010088e
Sun W., Tang X. C., Xu Y. D., Zhang H. J., Wei X., Liu Y. J. (2016). Characteristics of nutrients, restrictive analysis and eutrophication assessment in the Shuangdao Bay, Weihai. Sci. Technol. Eng. 16 (25), 168–172. doi: 10.3969/j.issn.1671-1815.2016.25.028
Sun P. X., Wang B., Zhang Z. H., Wang Z. L., Xia B. (2006). Relationship between nutrient distributions and eutrophication in seawater of the Laizhou Bay. Adv. Mar. Sci. 24 (3), 329–335. doi: 10.3969/j.issn.1671-6647.2006.03.009
Tian S., Gaye B., Tang J., Luo Y., Lahajnar N., Daehnke K., et al. (2022). Nitrate regeneration and loss in the Central Yellow Sea bottom water revealed by nitrogen isotopes. Front. Mar. Sci. 9, 834953. doi: 10.3389/fmars.2022.834953
Wang B., Chen J., Jin H., Li H., Huang D., Cai W. J. (2017). Diatom bloom-derived bottom water hypoxia off the Changjiang estuary, with and without typhoon influence. Limnol. Oceanogr. 62, 1552–1569. doi: 10.1002/lno.10517
Wang G., Han A., Chen L., Tan E., Lin H. (2018). Fluxes of dissolved organic carbon and nutrients via submarine groundwater discharge into subtropical Sansha Bay, China. Estuarine Coast. Shelf Sci. 207, 269–282. doi: 10.1016/j.ecss.2018.04.018
Wang X., Olsen L. M., Reitan K. I., Olsen Y. (2012). Discharge of nutrient wastes from salmon farms: environmental effects, and potential for integrated multi-trophic aquaculture. Aquacult. Environ. Interact. 2, 267–283. doi: 10.3354/aei00044
Wang B., Wang X., Zhan R. (2003). Nutrient conditions in the yellow sea and the east China sea. Estuarine Coast. Shelf Sci. 58, 127–136. doi: 10.1016/S0272-7714(03)00067-2
Wankel S. D., Kendall C., Paytan A. (2009). Using nitrate dual isotopic composition (δ15N and δ18O) as a tool for exploring sources and cycling of nitrate in an estuarine system: Elkhorn Slough, California. J. Geophys. Res.: Biogeosci. 114, G01011. doi: 10.1029/2008J
Williams J., Crutzen P. (2010). Nitrous oxide from aquaculture. Nat. Geosci. 3, 143–143. doi: 10.1038/ngeo804
Wu J., Hong Y., Liu X., Hu Y. (2021). Variations in nitrogen removal rates and microbial communities over sediment depth in Daya Bay, China. Environ. Pollut. 286, 117267. doi: 10.1016/j.envpol.2021.117267
Wu B., Jin H., Gao S., Xu J., Chen J. (2020). Nutrient budgets and recent decadal variations in a highly eutrophic estuary: Hangzhou Bay, China. J. Coast. Res. 36, 63–71. doi: 10.2112/JCOASTRES-D-18-00071.1
Xiao X., Agusti S., Lin F., Li K., Pan Y., Yu Y., et al. (2017). Nutrient removal from Chinese coastal waters by large-scale seaweed aquaculture. Sci. Rep. 7, 46613. doi: 10.1038/srep46613
Xie B., Huang J., Huang C., Wang Y., Shi S., Huang L. (2020). Stable isotopic signatures (δ13C and δ15N) of suspended particulate organic matter as indicators for fish cage culture pollution in Sansha Bay, China. Aquaculture 522, 735081. doi: 10.1016/j.aquaculture.2020.735081
Xiong Y., Gao L., Qu L., Xu J., Ma Z., Gao G. (2023). The contribution of fish and seaweed mariculture to the coastal fluxes of biogenic elements in two important aquaculture areas, China. Sci. Total Environ. 856, 159056. doi: 10.1016/j.scitotenv.2022.159056
Xue D., Botte J., De Baets B., Accoe F., Nestler A., Taylor P., et al. (2009). Present limitations and future prospects of stable isotope methods for nitrate source identification in surface-and groundwater. Water Res. 43, 1159–1170. doi: 10.1016/j.watres.2008.12.048
Xue D., De Baets B., Van Cleemput O., Hennessy C., Berglund M., Boeckx P. (2012). Use of a Bayesian isotope mixing model to estimate proportional contributions of multiple nitrate sources in surface water. Environ. Pollut. 161, 43–49. doi: 10.1016/j.envpol.2011.09.033
Yang Z., Chen J., Li H., Jin H., Gao S., Ji Z., et al. (2018). Sources of nitrate in Xiangshan Bay (China), as identified using nitrogen and oxygen isotopes. Estuarine Coast. Shelf Sci. 207, 109–118. doi: 10.1016/j.ecss.2018.02.019
Yang B., Gao X., Zhao J., Lu Y., Gao T. (2020). Biogeochemistry of dissolved inorganic nutrients in an oligotrophic coastal mariculture region of the northern Shandong Peninsula, north Yellow Sea. Mar. Pollut. Bull. 150, 110693. doi: 10.1016/j.marpolbul.2019.110693
Ye F., Jia G., Xie L., Wei G., Xu J. (2016). Isotope constraints on seasonal dynamics of dissolved and particulate N in the P earl R iver E stuary, south C hina. J. Geophys. Res.: Oceans 121, 8689–8705. doi: 10.1002/2016JC012066
Zhang J., Wu W., Li Y., Liu Y., Wang X. (2022). Environmental effects of mariculture in China: An overall study of nitrogen and phosphorus loads. Acta Oceanol. Sin. 41, 4–11. doi: 10.1007/s13131-021-1909-9
Zhang Y., Zhang J., Liang Y., Li H., Li G., Chen X., et al. (2017). Carbon sequestration processes and mechanisms in coastal mariculture environments in China. Sci. China Earth Sci. 60, 2097–2107. doi: 10.1007/s11430-017-9148-7
Zhang M., Zhi Y., Shi J., Wu L. (2018). Apportionment and uncertainty analysis of nitrate sources based on the dual isotope approach and a Bayesian isotope mixing model at the watershed scale. Sci. Total Environ. 639, 1175–1187. doi: 10.1016/j.scitotenv.2018.05.239
Zhuang Y., Jin H., Cai W.-J., Li H., Jin M., Qi D., et al. (2021a). Freshening leads to a three-decade trend of declining nutrients in the western Arctic Ocean. Environ. Res. Lett. 16, 054047. doi: 10.1088/1748-9326/abf58b
Zhuang Y., Jin H., Cai W. J., Li H., Qi D., Chen J. (2022). Extreme nitrate deficits in the western Arctic ocean: Origin, decadal changes, and implications for denitrification on a polar marginal shelf. Global Biogeochem. Cycles 36, e2022GB007304. doi: 10.1029/2022GB007304
Keywords: marine aquaculture, nutrients, N/P ratio, nitrate isotopes, denitrification
Citation: Bu D, Zhu Q, Li J, Huang J, Zhuang Y, Yang W and Qi D (2024) Mariculture may intensify eutrophication but lower N/P ratios: a case study based on nutrients and dual nitrate isotope measurements in Sansha Bay, southeastern China. Front. Mar. Sci. 11:1351657. doi: 10.3389/fmars.2024.1351657
Received: 12 December 2023; Accepted: 08 January 2024;
Published: 25 January 2024.
Edited by:
Ruijie Zhang, Guangxi University, ChinaReviewed by:
Guo Wei, East China University of Technology, ChinaJiapeng Wu, Guangzhou University, China
Copyright © 2024 Bu, Zhu, Li, Huang, Zhuang, Yang and Qi. This is an open-access article distributed under the terms of the Creative Commons Attribution License (CC BY). The use, distribution or reproduction in other forums is permitted, provided the original author(s) and the copyright owner(s) are credited and that the original publication in this journal is cited, in accordance with accepted academic practice. No use, distribution or reproduction is permitted which does not comply with these terms.
*Correspondence: Yanpei Zhuang, emh1YW5neXBAam11LmVkdS5jbg==; Di Qi, cWlkaUBqbXUuZWR1LmNu