 Jie Zhu1,2
 Hanhan Yao
 Zhihua Lin
 Yinghui Dong
- 1National Demonstration Center for Experimental Fisheries Science Education, Shanghai Ocean University, Shanghai, China
- 2Key Laboratory of Aquatic Germplasm Resources of Zhejiang, Zhejiang Wanli University, Ningbo, China
- 3Ninghai Institue of Mariculture Breeding and Seed Industry, Zhejiang Wanli University, Ningbo, China
Introduction: The razor clam, Sinonvacula constricta, one of the important mariculture bivalves in China, has unique flavor and wide salinity adaptability. The unique flavor mainly depends on the content of free amino acids and other umami substances in vivo. However, the flavor divergence of razor clam caused by the variable salinity breeding environment, while the mechanisms remain unclear.
Methods: Here, the razor clams were cultured in high salinity (30 ppt) and normal salinity (20 ppt) for eight weeks, and the effects of salinity on free amino acids and related genes expression in S. constricta were investigated by transcriptomics and metabolomics method.
Results: The results showed the free amino acid content under high salinity environment was significantly higher than normal salinity environment through the duration of the experiment (P < 0.05). The combination of transcriptomic and metabolomic data also indicated that high salinity environment resulted in enhanced metabolism of free amino acids. Furthermore, eight genes such as RALDH2, ACOX1, ALDH-E2 were potentially important for enhancing free amino acids metabolism under high salinity environment.
Discussion: This study preliminarily explained the regulation processes of high salinity environment on the metabolism of free amino acids in razor clams, providing a reference for the flavor regulation mechanism.
1 Introduction
Salinity is an important environmental factor that influences the biochemical and physiological status of aquatic animals (Chen et al., 2014; Pourmozaffar et al., 2019). Affected by the tide, ocean currents, and seawater evaporation, salinity has a drastic fluctuation in the near-shore, especially in the intertidal zone (Huong et al., 2010; Johnson et al., 2011). During long-term evolution, aquatic animals have developed appropriate self-defense mechanisms to maintain an optimal metabolic state in response to salinity fluctuations (Zhang et al., 2020). Previous investigations have reported that alanine (Ala), glutamic acid (Glu), proline (Pro), and several other free amino acids serve as the primary osmolytes for isosmotic regulation in aquatic animals (Abe et al., 2005)—for example, taurine (Tau) is the main cellular osmo-effector in teleosts, accounting for 40%–50% of the osmolality change (Vislie, 1983). Ala and Glu play important roles in the process of long-term osmotic stress tolerance in the white shrimp Litopenaeus vannamei (Hurtado et al., 2007). Moreover, bivalves exhibit different osmoregulatory mechanisms in response to varying salinity environments (Deaton, 2009; Larsen et al., 2014). Ala, Pro, arginine (Arg) and Tau were found to play an important role in the osmotic adaptation of the Eastern oyster Crassostrea virginica, and their contents increase significantly in the process of high osmotic acclimation, while these decrease in the process of low osmotic condition (Hosoi et al., 2003). It is widely accepted that free amino acids also contribute to the taste and flavor of bivalves (Shahidi and Cadwallader, 1997; Ran et al., 2017). This suggests that salinity can affect the flavor of bivalves by altering the content of free amino acids. Indeed in Pacific oyster Crassostrea gigas, the content of free amino acids significantly increased with increasing salinity (Chen et al., 2022a; Chen et al., 2022b).
The razor clam, Sinonovacula constricta, is a typically intertidal and estuarine species that periodically experiences extreme salinity stress due to intense tidal fluctuation. It can tolerate a broad range of salinities ranging from 5 to 30 ppt (Ran et al., 2017). Razor clams are widely distributed along the coastlines of China, Japan, and South Korea (Jiang et al., 2010). In recent years, the breeding scale of razor clams in the high-salinity sea area of northern China has been expanding (FAO, 2022). S. constricta exhibited enhanced umami and flavor in these areas, which was attributed to changes in umami substances such as amino acids and lipids caused by increased salinity (Ran et al., 2017; Li et al., 2021). However, the specific regulatory mechanisms and the effects of medium- and long-term high-salinity environments on free amino acid content remain unclear.
RNA-seq data contain detailed information on the noncoding RNA portion of the total RNA, making it a useful tool for examining complex biological regulatory mechanisms (Vailati-Riboni et al., 2017). Currently, the transcriptome of various marine bivalves has been sequenced, providing a foundation for comprehending the adaptive mechanism of marine invertebrates under environmental stress (Lockwood and Somero, 2011; Xiao et al., 2018; Liu et al., 2019; Kong et al., 2022; Lv et al., 2022). However, the transcriptome sequence cannot provide information on metabolite levels (Li et al., 2021). Metabolomics is the science that studies all chemical processes involving metabolites. It can quantify metabolites in organisms and reveal their responses to external environmental factors (Vailati-Riboni et al., 2017). Through the integrative analysis of both types of data, a more comprehensive understanding can be gained regarding the key regulatory genes involved in environmental stress. In the present study, we employed transcriptomic analysis in conjunction with ultrahigh performance liquid chromatography-mass spectrometry (UHPLC-MS)-based metabolomics to investigate the mechanisms of free amino acid metabolism in razor clams under elevated salinity conditions and identify the key metabolic regulatory genes.
2 Materials and methods
2.1 Salinity challenge and sample collection
The healthy razor clams (wet weight 4.53 ± 0.34 g; shell length 38.15 ± 0.99 mm) were collected from an aquafarm in Ninghai (Ningbo, China). The clams were acclimated in a holding tank for 7 days before being exposed to salinity. The salinity was increased from 20 to 30 ppt at a rate of 2 ppt/day.
A total of 720 razor clams were divided into two groups, with a salinity value of 20 ppt (S20, control group) and 30 ppt (S30, high-salinity group) in the experimental exposure, and each group underwent three separate tests. Each separate test was performed in a 500-L tank. The desired seawater salinity was obtained by mixing seawater with sea salt or freshwater. The water was changed once a day, and the mixed living microalgae of Chaetoceros calcitrans and Chlorella vulgaris were fed twice a day. The foot muscles of six individuals were randomly sampled in the second and eighth weeks for each group, frozen immediately in liquid nitrogen, and then stored at -80°C.
2.2 Determination of free amino acid content
The free amino acid content was determined by a Hitachi L-8800 automatic amino acid analyzer (Hitachi, Tokyo, Japan). Briefly, the lyophilized powder samples (0.1 g) were hydrolyzed with 5 mL of HCl (0.01 mol/L) for 30 min, centrifuged, mixed with 8% sulfosalicylic acid for 12 h, and diluted with 0.02 mol/L HCl. Then, the hydrolysates were filtered through a membrane filter (0.22 μm) and the filtered hydrolysates were applied to the amino acid analyzer to determine the amino acid contents, which were expressed as dry weight (mg/g).
2.3 RNA extraction, library construction, sequencing and data analysis
The total RNA of the foot muscle tissue was extracted by using Trizol reagent (TaKaRa, Japan), and the integrity was assessed using the RNA Nano 6000 Assay kit of the Bioanalyzer 2100 system (Agilent Technologies, CA, USA). A total of 24 libraries (six individuals were taken from each sampling point in the control and treatment groups) were generated by using NEBNext® Ultra™ RNA Library Prep kit for Illumina® (NEB, USA). Then, the library fragments were purified and PCR was performed. Lastly, the PCR products were purified and library quality was assessed on the Agilent Bioanalyzer 2100 system.
The reads with low quality were removed to obtain clean data, and their Q20, Q30, and GC contents were calculated, and analysis was performed based on these data. After that, the index of the reference genome was constructed for comparison using HISAT2 v2.0.5. The mapped reads of each sample were assembled by using StringTie (v1.3.3b) in a reference-based approach (Pertea et al., 2015). Feature Counts v1.5.0-p3 was used to count the reads numbers mapped to each gene, and then the expected number of fragments per kilobase of transcript per million fragments mapped (FPKM) base pairs sequenced of each gene was calculated based on the length of the gene and reads count mapped to this gene. DESeq2 software was used to analyze the differential expression between the two comparison combinations. The resulting P-values were adjusted using Benjamini and Hochberg’s approach for controlling the false discovery rate. Genes with an adjusted P-value ≤0.05 as found by DESeq2 were assigned as differentially expressed. The Gene Ontology (GO) and Kyoto Encyclopedia of Genes and Genomes (KEGG) enrichment analysis of differentially expressed genes (DEGs) was performed using cluster Profiler software.
2.4 Validation of DEGs by qRT-PCR
To verify the accuracy of the RNA-seq results, we selected eight DEGs under the highly affected pathways at high salinity conditions for qRT-PCR. The primers were designed with Primer3 software (Table 1), and 18S rRNA was used as the reference gene for validating the relative expression profiling of the selected DEGs (Kong et al., 2022). The synthesis of cDNA was performed using a PrimeScript® RT reagent kit with gDNA Eraser (TaKaRa, Japan).
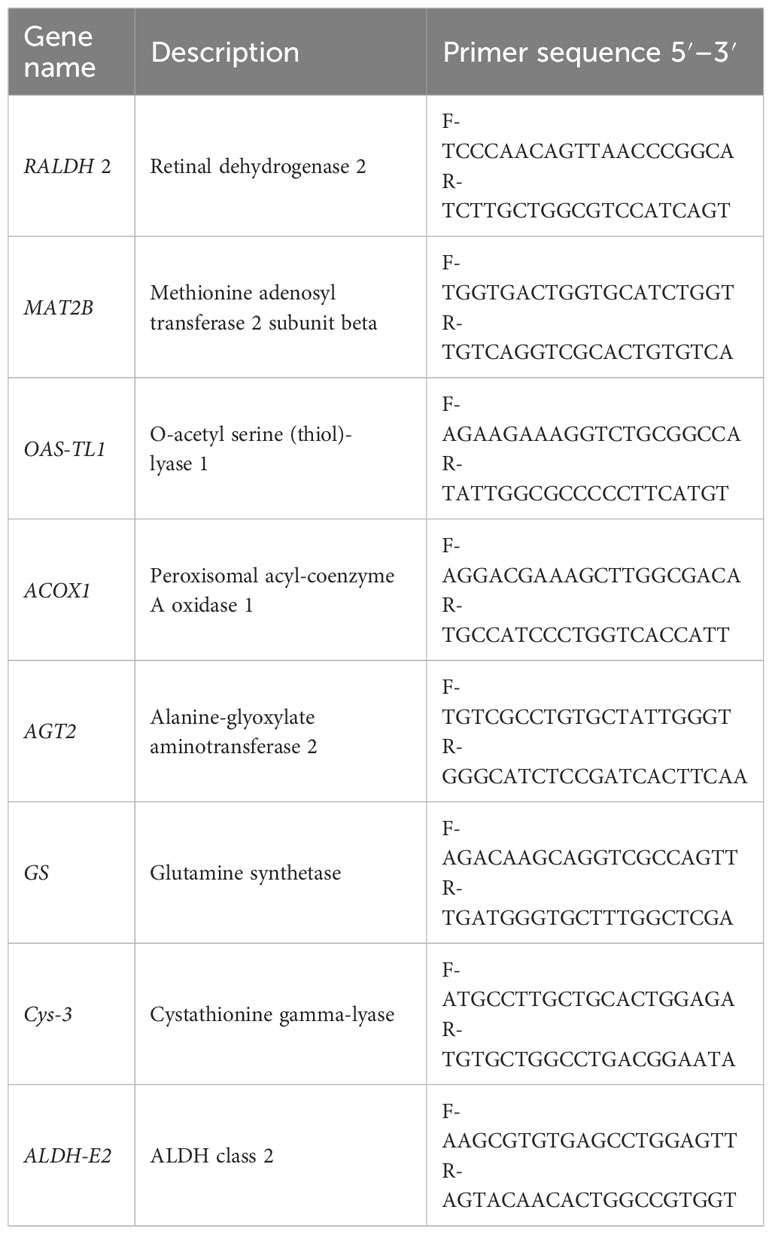
Table 1 Primer sequences for the genes used in the qRT-PCR.
The total qRT-PCR reaction contained 500 ng of cDNA, 6.8 μL of RNase-free water, 10 μL of 2 × TB Green® Premix Ex Taq™ II (TaKaRa, Japan), and 0.8 μL of each forward and reverse gene-specific primer (10 mM). The cycling parameters included an initial denaturation step at 95°C for 30 s, followed by 35 cycles at 95°C for 5 s and 55°C for 30 s. The relative expression levels of the genes were calculated by using 2-ΔΔCT (Livak and Schmittgen, 2001).
2.5 LC-MS metabolomic data analysis
The foot muscle tissues (100 mg) were individually ground with liquid nitrogen, and the homogenate was resuspended with prechilled 80% methanol by well vortex. The samples were incubated on ice for 5 min and then were centrifuged at 15,000 g (4°C for 20 min). A portion of the supernatant was diluted to a final concentration containing 53% methanol by using LC-MS-grade water. The samples were subsequently transferred to a fresh Eppendorf tube and then were centrifuged at 15,000 g (4°C for 20 min). Finally, the supernatant was injected into the LC-MS/MS system analysis.
The metabolites obtained from the LC-MS analysis were identified by mapping against the KEGG database, the HMDB database, and the LIPID Maps database for annotation. The transformation of the metabolomics data, principal component analysis (PCA), and partial least squares discriminant analysis (PLS-DA) were conducted by using the software metaX to obtain the VIP values for each metabolite (Wen et al., 2017). The P-value and FC-value were calculated for each metabolite between the two groups based on a t-test. The default criteria for differentially accumulated metabolite (DAM) screening were VIP >1, P-value <0.05, and FC ≥2 or FC ≤0.5. Correlation plots were prepared by using the Corr plot package in R language.
2.6 Integrated analysis of transcriptome and metabolome
Pearson product–moment correlation coefficient tests were used to calculate the correlation coefficient between DEGs and DAMs associated with free amino acid metabolism pathways in a high-salinity environment. The transcriptomic and metabolomic datasets were integrated based on the metabolic pathway information obtained from the KEGG pathway mapping. The combined analysis of the S20 and S30 groups was performed using DEGs (FDR < 0.05 and |log2FC| > 1) and SDMs (VIP > 1 and P < 0.05). Furthermore, the DEGs and DAMs in the high salinity and control groups were mapped to the KEGG database to obtain a common pathway to propose the regulatory network of free amino acid metabolism pathways for S. constricta based on the upregulation and downregulation of genes and metabolites.
3 Results
3.1 Effect of salinity on the free amino acid content of S. constricta
The 17 free amino acid contents in the foot muscle of the razor clam were determined under medium- and long-term high-salinity environments using the hydrochloric acid hydrolysis method (Table 2). In the S20 group, the total free amino acids (TOFAA) contents in razor clams ranged from 57.87 to 64.25 mg/g (Table 2). Aspartic acid (Asp), serine (Ser), Glu, glycine (Gly), Ala, and Pro were the flavor amino acids (FAA), accounting for 51.74%–60.39% of the full content (Table 2). The exposure to high salinity increased the concentration of TOFAA and FAA (Figures 1A, B). As shown in Table 2, the TOFAA content in the muscle exposed to a high-salinity environment showed an increase of approximately 40.70% and 43.04% in the second and eighth weeks compared with the control group, while the FAA content showed an increase of approximately 100.74% and 76.77%. The contents of Glu (P < 0.05), Ala (P < 0.001), threonine (Thr) (P < 0.001), and Ser (P < 0.01) in the S30 group were significantly increased compared to the S20 group throughout the entire trial, while the contents of Ile and Tyr showed a significant increase in the second week but not in the eighth week (Figures 1C, D). Ala was the dominant free amino acid, accounting for 37.67%–38.62% (S20) and 51.96%–61.74% (S30) of the total content, respectively (Table 2). Its content in the high-salinity group increased most significantly compared to the control group (Figure 1), implying its important role in the osmotic adjustment of the razor clam.

Table 2 Content of free amino acids of S. constricta at different salinities and time.
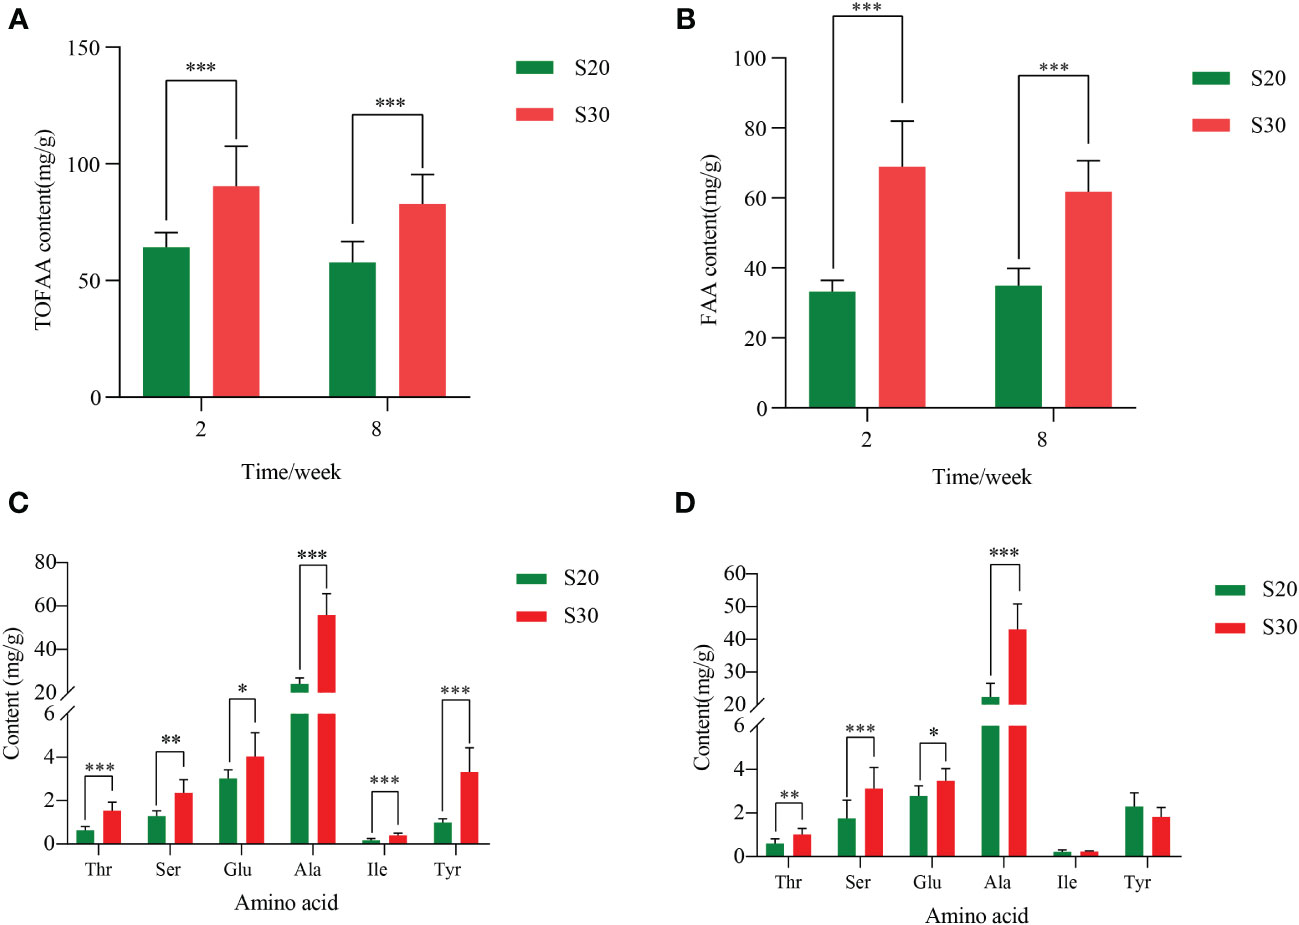
Figure 1 Comparison of the (A) TOFAA content and (B) FAA content of S. constricta at different salinities and time, and the content of six amino acids increased significantly in 2 weeks (C) and 8 weeks (D) in a high-salinity environment. TOFAA, total free amino acid; FAA, flavor amino acid; Thr, threonine; Ser, serine; Glu, glutamic acid; Ala, alanine; Ile, isoleucine; Tyr, tyrosine. The asterisk represents significant differences between the high-salinity group and the control group (*P < 0.05, **P < 0.01, and ***P < 0.001). The vertical bars represent the mean ± SE (n = 6).
3.2 Transcriptome-based identification of DEGs in S. constricta after salinity treatment
A total of 165.14 Gb clean bases were obtained by RNA-seq. In the second week, 2,014 genes were found to have differential expression, with 706 genes upregulated and 1,308 genes downregulated. In the eighth week, the total number of DEGs increased to 2,371, with 1,405 upregulated and 966 downregulated. To validate the precision levels of DEGs obtained from transcriptome data, the expression levels of eight DEGs in the amino acid metabolism pathway were measured by the qRT-PCR method. The expression pattern of these DEGs detected by using qRT-PCR was highly similar to that identified by RNA-seq (Figures 2A, B).
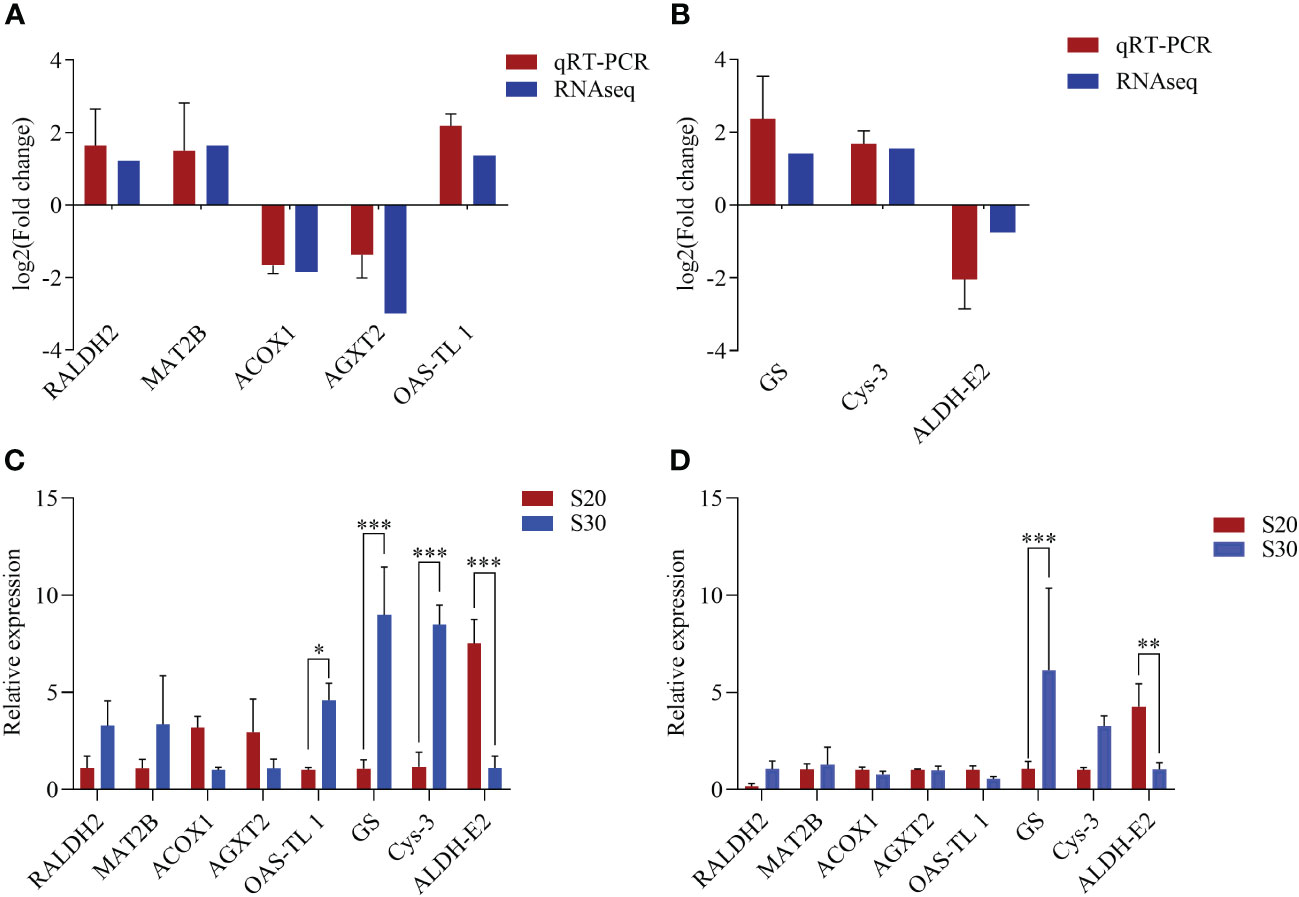
Figure 2 Comparisons of the expression profiles of eight differentially expressed genes obtained using RNA-seq (i.e., transcriptome data) and qRT-PCR analysis (A, B) as well as their expression levels (C, D). (A, C) From the second week and (B, D) from the eighth week. The asterisk represents significant differences between the high-salinity group and the control group (*P < 0.05, **P < 0.01, and ***P < 0.001). The vertical bars represent the mean ± SE (n = 4).
To evaluate the significance of the DEGs, all DEGs identified in muscle tissues in the second and eighth weeks were assigned GO terms. In the GO analysis of DEGs, there were significant enrichment items under the P-value <0.05 in the second and eighth weeks, which were classified into biological process (BP), cellular component (CC), or molecular function (MF) groups (Supplementary Figure S1). The MF category had the largest number of DEGs in the second week, while the CC category had the largest number of DEGs in the eighth week. To further evaluate the effect of salinity on biochemical pathways, DEGs were mapped using the KEGG database (Supplementary Figure S2). In the second week, some DEGs were involved in base excision repair, biosynthesis of amino acids, and glycolysis/gluconeogenesis. In the eighth week, DEGs were involved in the ribosome, phagosome, fructose, and mannose metabolism. The activation of the amino acid synthesis pathway indicated that de novo synthesis was the main source of the increased amino acid content in S. constricta under a high-salinity environment.
According to NR annotation, many DEGs were found to be associated with amino acid metabolic pathways, including RALDH2, GS, OAS-TL1, ACOX1, etc. In the second week, OAS-TL1 (P < 0.05), GS (P < 0.001), and Cys-3 (P < 0.001) were significantly upregulated, while ALDH-E2 was significantly downregulated (P < 0.001). Additionally, in the eighth week, GS was significantly upregulated (P < 0.001), and ALDH-E2 was significantly downregulated (P < 0.01) (Figures 2C, D). In the biosynthesis of amino acid pathways, MAT2B, OAS-TL1, Cys-3, and other genes were significantly upregulated, indicating that the whole pathway was activated in a high-salinity environment. These results suggest that these genes may facilitate the acclimation of razor clams to high salinity conditions.
3.3 Salinity-induced metabolomics profile
A total of 865 positive and 384 negative ion mode metabolites were identified by using the LC-MS technique in the experimental razor clam. The PCA and PLS-DA analyses revealed significant differences in the metabolite profiles of the clams between the two salinity groups, and the negative and positive electrospray ionization (ESI) (ESI+ and ESI−) modes are shown in Figures 3A, B, respectively.
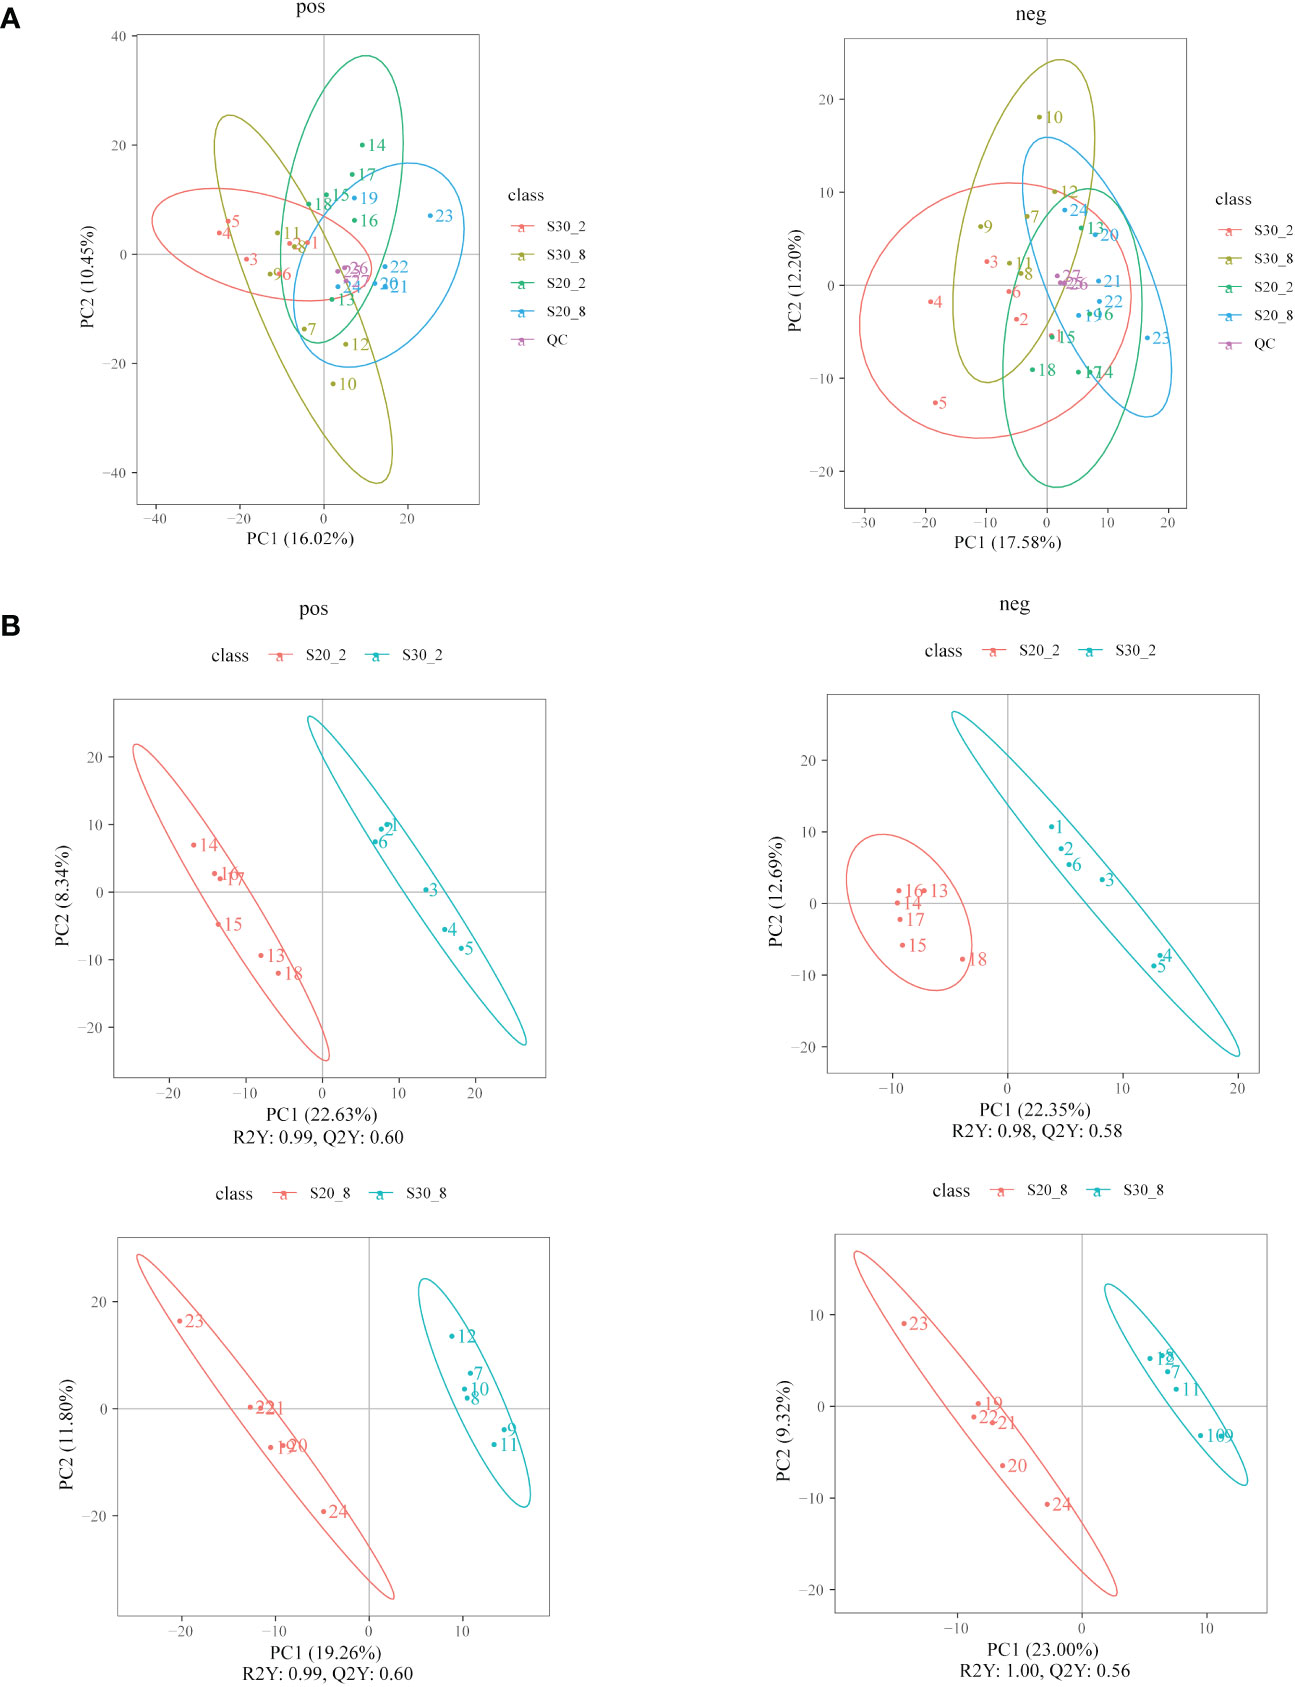
Figure 3 Principal component analysis (A) and partial least squares discriminant analysis (B) score plots of metabolites in razor clams from the S20 and S30 groups. pos, ESI+ mode; neg, ESI− mode.
The result was visualized using a clustered heat map, which exhibits differences in metabolite concentrations between the S20 and S30 groups at two different time points (Figure 4). A total of 223 metabolites were found to be differentially accumulated (P < 0.05 and VIP > 1) in the S30 group compared with the S20 group in the second week, while 203 metabolites were found in the eighth week. Among these metabolites, most of them were classified as amino acids and carbohydrates, such as phenylalanine, alanine, and α-D-glucose-1, 6-bisphosphate. The KEGG analysis identified 20 pathways based on both the -ln (P-value) and pathway impact scores for significantly different metabolites. In the second week, the most relevant metabolic pathways were tryptophan metabolism and mannose metabolism pathways, while fatty acid biosynthesis, oxidative phosphorylation, and arachidonic acid metabolism were the most relevant pathways in the eighth week.
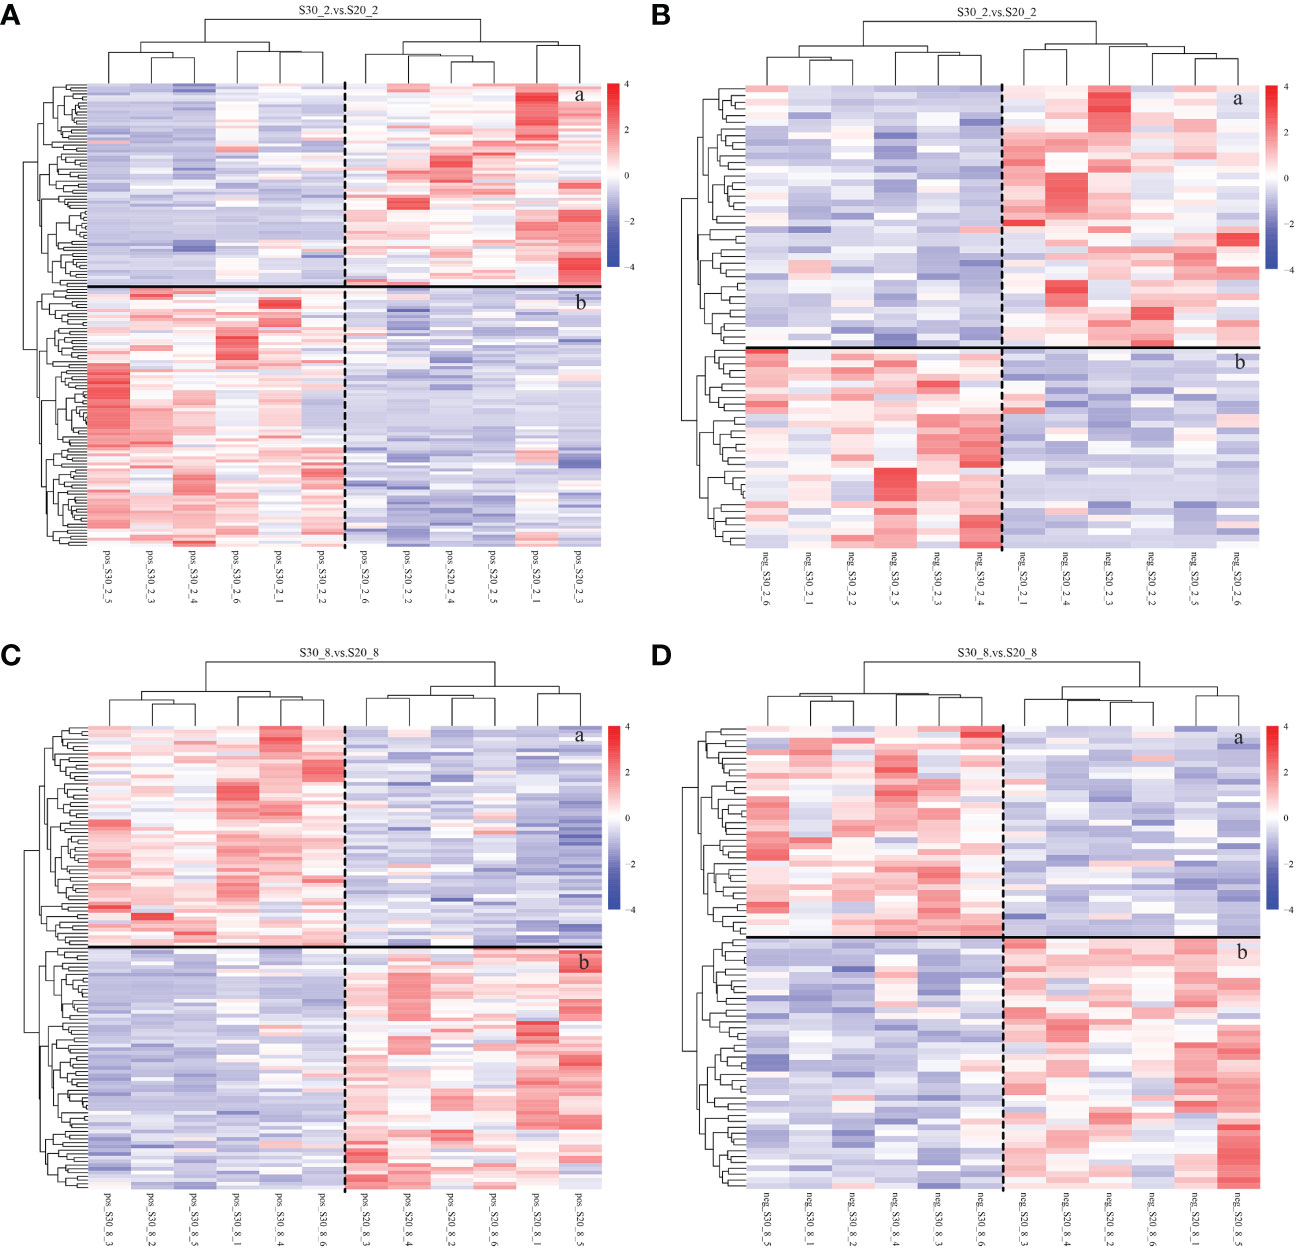
Figure 4 Heat map analysis of the metabolites with concentrations that differed between the S20 and S30 groups. pos, ESI+ mode; neg, ESI− mode. (A, B) From the second week and (C, D) from the eighth week. (a) Metabolites with elevated concentrations, (b) metabolites with decreased concentrations. The color denotes the relative abundance of each metabolite, going from less (blue) to more (red).
3.4 Integrated analysis of metabolomics and transcriptomics
The KEGG analysis of the aggregated genes and metabolites data identified 25 pathways in the second week, including 23 metabolites and 56 genes. Among these pathways, eight were found to be involved in amino acid metabolism, such as Ile, Arg, and Ala metabolism (Table 3). Notably, Ala was significantly accumulated as an intermediate metabolite of the biosynthesis of amino acid pathways. In the eighth week, a total of 27 pathways were identified, including 21 metabolites and 74 genes, and seven pathways were involved in amino acid metabolism, such as the metabolism of Tyr, Ala, and Asp (Table 3). Therefore, exposure to a high-salinity environment may significantly affect amino acid metabolism in razor clams.

Table 3 Aggregated metabolites and genes in the KEGG pathway in the second and eighth weeks.
4 Discussion
Intracellular free amino acids have been shown to play a dominant role in regulating osmolality and cell volume in marine animals (McNamara et al., 2004; Rivera-Ingraham and Lignot, 2017; Pourmozaffar et al., 2019). Studies have shown that free amino acids contribute 10%–20% to intracellular osmolarities in some crustaceans, with Gly, Pro, Tau, and Ala being the most common osmolytes (Lynch and Wood, 1966; McNamara et al., 2004; Rivera-Ingraham and Lignot, 2017; Koyama et al., 2018). The osmotic effect of free amino acids is more important in bivalves as it contributes 20%–30% to intracellular osmolarities, and differences in osmoregulatory free amino acids are observed among species (Huo et al., 2014; Pourmozaffar et al., 2019). For example, one of the most essential osmoregulatory substances in the mussel Mya arenaria was Gly, while the main osmoregulatory amino acid in Baltic clam Macoma balthica was Ala (Song et al., 2023). In the present research, the free amino acid content in S. constricta was significantly increased under a high-salinity environment (P < 0.05), especially Ala, implying that Ala may be the most important amino acid osmolyte in the osmoregulation of S. constricta. In addition, Ala is an important flavoring substance (Abe et al., 2005; Fürst, 2009), and the increased levels of Ala resulting from high salinity are mainly responsible for the greater popularity among consumers of shellfish cultured in high-salinity environments (Ran et al., 2017). All these results showed that not only is Ala an important osmotic regulator but it also plays a vital role in contributing to the better flavor of S. constricta.
There are two basic mechanisms by which the quantities of free amino acids in the tissues are varied for purposes of intracellular isosmotic regulation (Shinji et al., 2012). The first mechanism suggests that the biosynthesis of free amino acids plays a leading role in providing the necessary amino acids for osmotic regulation as there is a significant increase in demand for amino acids during this process (Hosoi et al., 2003; Song et al., 2023). An alternative mechanism suggests that de novo synthesis plays only a limited role in supplying the free amino acids involved in osmotic regulation, while protein decomposition in tissues remains the main source of increased free amino acid content (Shinji et al., 2012). The transcriptomics data showed that the synthesis pathway of free amino acids was significantly affected in the high-salinity environment, while the protein decomposition pathway was not significantly enriched. Similar findings were observed for the S. constricta and oysters Crassostrea brasiliana (Zacchi et al., 2017; Li et al., 2021), which support the first mechanism by showing that salinity stress accelerated the biosynthesis of amino acids. These results indicate that the primary mechanism of osmotic stress leading to an increase in free amino acid content in bivalves is the accelerated synthesis of free amino acids.
The combined analysis of omics data revealed that many DEGs were significantly enriched in the amino acid metabolism pathway under high salinity, such as ACOX1, RALDH2, and ALDH-E2 in the β-alanine metabolism pathway. Previous studies have reported that salinity stress activated the expression of genes related to amino acid metabolic pathways, such as ATPGD, CSAD, and P5CS, in response to changes in osmotic status and adaption to osmotic stress conditions in the Manila clam Ruditapes philippinarum (Nie et al., 2017). Similarly, in S. constricta, the changes in the expression of these genes at high salinity occur because free amino acids play important roles in regulating osmotic pressure in razor clams (Cao et al., 2023). ACOX1 is an important gene in the development and nutritional regulation of aquatic animals (Morais et al., 2007), which regulates the conversion process between propionyl-COA and acrylyl-COA, thereby affecting the synthesis of Ala (Oaxaca-Castillo et al., 2007). While RALDH2 and ALDH-E2 have an Aldedh domain and belong to the aldehyde dehydrogenase (ALDH) family, this family of dehydrogenases acts on aldehyde substrates (Fleischman, 2012). ALDH is an enzyme that participates in important cellular mechanisms such as aldehyde detoxification and retinoic acid synthesis (Toledo-Guzmán et al., 2019). It can accelerate the synthesis of β-alanine from β-amino propionaldehyde (Jakoby, 1963). We observed an increase in the expression of RALDH2, while the expression of ACOX1 and ALDH-E2 decreased in the S30 group. Additionally, there was a significant change in Ala content. These results suggest that this regulation has a significant importance for Ala synthesis. Therefore, we believe that the razor clam can enhance the metabolism of free amino acids by altering the expression of genes involved in free amino acid biosynthesis to maintain osmotic pressure balance.
5 Conclusion
In conclusion, this study aimed to investigate the internal regulatory mechanism of free amino acids under a high-salinity environment in S. constricta through transcriptomic and metabolomic analyses. The results showed that free amino acids (particularly, alanine) have a significant effect on acclimation to a high-salinity environment. Exposing the farmed S. constricta to a high-salinity environment for a medium length of time would be an effective strategy to achieve its unique flavor and delightful taste. The integrated transcriptomic and metabolomic analyses revealed that hyperosmolality disturbed the metabolic processes in razor clams, affecting the levels of amino acids and some intermediate metabolites. We identified RALDH2, ACOX1, and ALDH-E2 involved in beta-alanine metabolism, and MAT2B, OAS-TL1, Cys-3, and AGXT2 involved in the biosynthesis of amino acids, and GS to be involved in alanine, aspartate, and glutamate metabolism. These genes potentially play a significant role in regulating the flavor of S. constricta.
Data availability statement
The datasets presented in this study can be found in online repositories. The names of the repository and accession number can be found below: NCBI; PRJNA1064175.
Ethics statement
The animal study was approved by Zhejiang Wanli University animal ethics committee. The study was conducted in accordance with the local legislation and institutional requirements.
Author contributions
JZ: Validation, Writing – original draft. HX: Formal Analysis, Writing – review & editing. ZZ: Writing – review & editing, Data curation. HY: Writing – review & editing, Visualization. ZL: Writing – review & editing, Conceptualization, Project administration. YD: Writing – review & editing, Methodology.
Funding
The author(s) declare that financial support was received for the research, authorship, and/or publication of this article. This work was supported by Ningbo Major Project of Science and Technology (2021Z114 and 2019B10005), Zhejiang Major Program of Science and Technology (2021C02069-7), and National Marine Genetic Resource Center Program.
Conflict of interest
The authors declare that the research was conducted in the absence of any commercial or financial relationships that could be construed as a potential conflict of interest.
Publisher’s note
All claims expressed in this article are solely those of the authors and do not necessarily represent those of their affiliated organizations, or those of the publisher, the editors and the reviewers. Any product that may be evaluated in this article, or claim that may be made by its manufacturer, is not guaranteed or endorsed by the publisher.
Supplementary material
The Supplementary Material for this article can be found online at: https://www.frontiersin.org/articles/10.3389/fmars.2024.1368952/full#supplementary-material
Supplementary Figure 1 | Gene Ontology analysis of differentially expressed genes (DEGs). The numbers represent the count of DEGs that have been enriched. (A) From the second week and (B) from the eighth week.
Supplementary Figure 2 | Kyoto Encyclopedia of Genes and Genomes analysis of differentially expressed genes (DEGs). The numbers represent the count of DEGs that have been enriched. (A) From the second week and (B) from the eighth week.
References
Abe H., Yoshikawa N., Sarower M. G., Okada S. (2005). Physiological function and metabolism of free D-alanine in aquatic animals. J. Biol. Pharm. Bull. 28, 1571–1577. doi: 10.1248/bpb.28.1571
Cao W., Dong Y., Geng Y., Bi S., Liu Z., Zhou L., et al. (2023). Comprehensive analysis of whole-transcriptome profiles in response to acute hypersaline challenge in Chinese razor clam Sinonovacula constricta. J. Biol. (Basel) 12, 106. doi: 10.3390/biology12010106
Chen K., Li E., Gan L., Wang X., Chen L. (2014). Growth and lipid metabolism of the Pacific white shrimp Litopenaeus vannamei at different salinities. J. J. Shellfish Res. 33, 825–832. doi: 10.2983/035.033.0317
Chen L., Yu F., Shi H., Wang Q., Xue Y., Xue C., et al. (2022a). Effect of salinity stress on respiratory metabolism, glycolysis, lipolysis, and apoptosis in Pacific oyster (Crassostrea gigas) during depuration stage. J. J. Sci. Food Agric. 102, 2003–2011. doi: 10.1002/jsfa.11539
Chen L., Zhang H., Shi H., Xue C., Wang Q., Yu F., et al. (2022b). The flavor profile changes of Pacific oysters (Crassostrea gigas) in response to salinity during depuration. J. Food Chemistry: X 16, 100485. doi: 10.1016/j.fochx.2022.100485
FAO (2022). Fisheries and aquaculture software. In: FishStatJ - Software for Fishery Statistical Time Series (Rome: FAO Fisheries and Aquaculture Department Rome). Available at: http://www.fao.org/fishery/statistics/software/fishstatj/en.
Fleischman A. G. (2012). ALDH marks leukemia stem cell. J. Blood 119, 3376–3377. doi: 10.1182/blood-2012-02-406751
Fürst P. (2009). Basics in clinical nutrition: Proteins and amino acids. J. e-SPEN Eur. e-Journal Clin. Nutr. Metab. 4, 62–65. doi: 10.1016/j.eclnm.2008.07.010
Hochachka P. W., Somero G. N. (1984). Biochemistry adaptation (New Jersey: Princeton University Press). doi: 10.1515/9781400855414
Hosoi M., Kubota S., Toyohara M., Toyohara H., Hayashi I. (2003). Effect of salinity change on free amino acid content in Pacific oyster. J. Fisheries Sci. 69, 395–400. doi: 10.1046/j.1444-2906.2003.00634.x
Huo Z., Wang Z., Liang J., Zhang Y., Shen J., Yao T., et al. (2014). Effects of salinity on embryonic development, survival, and growth of Crassostrea hongkongensis. J. Ocean Univ. China 13, 666–670. doi: 10.1007/s11802-014-2206-4
Huong D. T. T., Jasmani S., Jayasankar V., Wilder M. (2010). Na/K-ATPase activity and osmo-ionic regulation in adult whiteleg shrimp Litopenaeus vannamei exposed to low salinities. J. Aquaculture 304, 88–94. doi: 10.1016/j.aquaculture.2010.03.025
Hurtado M. A., Racotta I. S., Civera R., Ibarra L., Hernández-Rodríguez M., Palacios E. (2007). Effect of hypo- and hypersaline conditions on osmolality and Na+/K+ -ATPase activity in juvenile shrimp (Litopenaeus vannamei) fed low- and high-HUFA diets. J. Comp. Biochem. Physiol. Part A: Mol. Integr. Physiol. 147, 703–710. doi: 10.1016/j.cbpa.2006.07.002
Jiang Q., Li Q., Yuan Y., Kong L. (2010). Development and characterization of 14 polymorphic microsatellite loci in the razor clam (Sinonovacula constricta). Conserv. Genet. Resour. 2, 81–83. doi: 10.1007/s12686-010-9185-6
Johnson C. R., Banks S. C., Barrett N. S., Cazassus F., Dunstan P. K., Edgar G. J., et al. (2011). Climate change cascades: Shifts in oceanography, species’ ranges and subtidal marine community dynamics in eastern Tasmania. J. J. Exp. Mar. Biol. Ecol. 400, 17–32. doi: 10.1016/j.jembe.2011.02.032
Kong X., Lv L., Ren J., Liu Y., Lin Z., Dong Y. (2022). Comparative transcriptome analyses unravel the response to acute thermal stress in the razor clam, Sinonovacula constricta. J. Aquaculture Rep. 23, 101079. doi: 10.1016/j.aqrep.2022.101079
Koyama H., Mizusawa N., Hoashi M., Tan E., Yasumoto K., Jimbo M., et al. (2018). Changes in free amino acid concentrations and associated gene expression profiles in the abdominal muscle of kuruma shrimp (Marsupenaeus japonicus) acclimated at different salinities. J. Exp. Biol. 221, 168997. doi: 10.1242/jeb.168997
Larsen E. H., Deaton L. E., Onken H., O’Donnell M., Grosell M., Dantzler W. H., et al. (2014). Osmoregulation and excretion. Compr. Physiol. 4, 405–573. doi: 10.1002/cphy.c130004
Li Y., Niu D., Wu Y., Dong Z., Li J. (2021). Integrated analysis of transcriptomic and metabolomic data to evaluate responses to hypersalinity stress in the gill of the razor clam (Sinonovacula constricta). J. Comparative Biochemistry and Physiology Part D Genomics Proteomics 38, 100793. doi: 10.1016/j.cbd.2021.100793
Liu X., Li L., Li A., Li Y., Wang W., Zhang G. (2019). Transcriptome and gene coexpression network analyses of two wild populations provides insight into the high-salinity adaptation mechanisms of Crassostrea ariakensis. J. Mar. Biotechnol. 21, 596–612. doi: 10.1007/s10126-019-09896-9
Livak K. J., Schmittgen T. D. (2001). Analysis of relative gene expression data using real-time quantitative PCR and the 2 (-Delta Delta C(T)) method. J. Methods 25, 402–408. doi: 10.1006/meth.2001.1262
Lockwood B. L., Somero G. N. (2011). Transcriptomic responses to salinity stress in invasive and native blue mussels (genus Mytilus). J. Mol. Ecol. 20, 517–529. doi: 10.1111/mec.2011.20.issue-3
Lv L., Ren J., Zhang H., Sun C., Dong Y., Lin Z. (2022). Transcriptomic analysis of gill and hepatopancreas in razor clam (Sinonovacula constricta) exposed to acute ammonia. J. Front. Mar. Sci. 9. doi: 10.3389/fmars.2022.832494
Lynch M. P., Wood L. (1966). Effect of environmental salinity on free amino acids of Crassostrea virginica (Gmelin). J. Comp. Biochem. Physiol. 19, 783–790. doi: 10.1016/0010-406X(66)90434-8
McNamara J. C., Rosa J. C., Greene L. J., Augusto A. (2004). Free amino acid pools as effectors of osmostic adjustment in different tissues of the freshwater shrimp Macrobrachium olfersii (Crustacea, Decapoda) during long-term salinity acclimation. Mar. Freshw. Behav. Physiol. 37, 193–208. doi: 10.1080/10236240400006208
Morais S., Knoll-Gellida A., André M., Barthe C., Babin P. J. (2007). Conserved expression of alternative splicing variants of peroxisomal acyl-CoA oxidase 1 in vertebrates and developmental and nutritional regulation in fish. J. Physiol. Genomics 28, 239–252. doi: 10.1152/physiolgenomics.00136.2006
Nie H., Jiang L., Chen P., Huo Z., Yang F., Yan X. (2017). High throughput sequencing of RNA transcriptomes in Ruditapes philippinarum identifies genes involved in osmotic stress response. J. Sci. Rep. 7, 4953. doi: 10.1038/s41598-017-05397-8
Oaxaca-Castillo D., Andreoletti P., Vluggens A., Yu S. T., Veldhoven P. P., Reddy J. K., et al. (2007). Biochemical characterization of two functional human liver acyl-coa oxidase isoforms 1a and 1b encoded by a single gene - sciencedirect. J. Biochem. Biophys. Res. Commun. 360, 314–319. doi: 10.1016/j.bbrc.2007.06.059
Pertea M., Pertea G. M., Antonescu C. M., Chang T. C., Mendell J. T., Salzberg S. L. (2015). StringTie enables improved reconstruction of a transcriptome from RNA-seq reads. J. Nat. Biotechnol. 33, 290–295. doi: 10.1038/nbt.3122
Pourmozaffar S., Jahromi S. T., Rameshi H., Sadeghi A., Bagheri T., Behzadi S., et al. (2019). The role of salinity in physiological responses of bivalves. J. Rev. Aquaculture 11, 1–19. doi: 10.1111/raq.12397
Ran Z., Li S., Zhang R., Xu J., Liao K., Yu X., et al. (2017). Proximate, amino acid and lipid compositions in Sinonovacula constricta (Lamarck) reared at different salinities. J. J. Sci. Food Agric. 97, 4476–4483. doi: 10.1002/jsfa.8311
Rivera-Ingraham G. A., Lignot J. H. (2017). Osmoregulation, bioenergetics and oxidative stress in coastal marine invertebrates: raising the questions for future research. J. Exp. Biol. 220, 1749–1760. doi: 10.1242/jeb.135624
Shahidi F., Cadwallader K. R. (1997). Flavor and lipid chemistry of seafoods. J. ACS Symposium 674, 1–8. doi: 10.1021/symposium
Shinji J., Okutsu T., Jayasankar V., Jasmani S., Wilder M. N. (2012). Metabolism of amino acids during hyposmotic adaptation in the whiteleg shrimp, Litopenaeus vannamei. J. Amino Acids 43, 1945–1954. doi: 10.1007/s00726-012-1266-2
Song X., Lü W., Ibrahim S., Deng Y., Li Q., Yue C. (2023). Identification of free amino acids (FAA) that are important as major intracellular osmolytes in the estuarine Hong Kong oyster, Crassostrea hongkongensis. J. Aquaculture Rep. 28, 101164. doi: 10.1016/j.aqrep.2023.101464
Toledo-Guzmán M. E., Hernández M. I., Gómez-Gallegos Á.A., Ortiz-Sánchez E. (2019). ALDH as a stem cell marker in solid tumors. J. Curr. Stem Cell Res. Ther. 14, 375–388. doi: 10.2174/1574888X13666180810120012
Vailati-Riboni M., Palombo V., Loor J. J. (2017). “What are omics sciences?,” in Periparturient Diseases of Dairy Cows, (Switzerland: Springer Cham). 1–7.
Vislie T. (1983). Cell volume regulation in fish heart ventricles with special reference to taurine. J. Comp. Biochem. Physiol. Part A: Physiol. 76, 507–514. doi: 10.1016/0300-9629(83)90453-X
Wen B., Mei Z., Zeng C., Liu S. (2017). metaX: A flexible and comprehensive software for processing metabolomics data. J. BMC Bioinf. 18, 183. doi: 10.1186/s12859-017-1579-y
Xiao S., Wong N.-K., Li J., Zhang Y., Ma H., Mo R., et al. (2018). Analysis of in situ transcriptomes reveals divergent adaptive response to hyper- and hypo-salinity in the Hongkong oyster, Crassostrea hongkongensis. J. Front. Physiol. 9. doi: 10.3389/fphys.2018.01491
Zacchi F. L., Limaa D., Flores-Nunes F., Mattos J. J., Lüchmannc K. H., Bícegoe M. C., et al. (2017). Transcriptional changes in oysters Crassostrea brasiliana exposed to phenanthrene at different salinities. J. Aquat. Toxicol. 183, 94–103. doi: 10.1016/j.aquatox.2016.12.016
Keywords: Sinonovacula constricta, salinity, free amino acids, transcriptome, metabolome
Citation: Zhu J, Xu H, Zou Z, Yao H, Lin Z and Dong Y (2024) Effects of medium- and long-term high-salinity environments on free amino acid content and related genes of Sinonovacula constricta. Front. Mar. Sci. 11:1368952. doi: 10.3389/fmars.2024.1368952
Received: 11 January 2024; Accepted: 19 February 2024;
Published: 12 March 2024.
Edited by:
Jinghui Fang, Chinese Academy of Fishery Sciences (CAFS), ChinaReviewed by:
Meijie Yang, Chinese Academy of Sciences (CAS), ChinaGuohua Sun, Ludong University, China
Copyright © 2024 Zhu, Xu, Zou, Yao, Lin and Dong. This is an open-access article distributed under the terms of the Creative Commons Attribution License (CC BY). The use, distribution or reproduction in other forums is permitted, provided the original author(s) and the copyright owner(s) are credited and that the original publication in this journal is cited, in accordance with accepted academic practice. No use, distribution or reproduction is permitted which does not comply with these terms.
*Correspondence: Hongqiang Xu, eGhxMTkzN0AxNjMuY29t; Yinghui Dong, ZG9uZ3lpbmdodWkxMThAMTI2LmNvbQ==