 Lei Zhang1,2
 Peng Tan
 Dongdong Xu
 Ligai Wang
 Zhili Ding
- 1Key Laboratory of Mariculture and Enhancement, Zhejiang Marine Fishery Research Institute, Zhoushan, China
- 2Marine and Fisheries Research Institute, Zhejiang Ocean University, Zhoushan, China
- 3Zhejiang Provincial Key Laboratory of Aquatic Resources Conservation and Development, College of Life Science, Huzhou University, Huzhou, China
- 4Ocean Academy, Zhejiang University, Zhoushan, China
Exploring alternatives to fishmeal (FM) in aquaculture nutrition remains a hot topic in this area. Yarrowia lipolytica (YL), a promising single-cell protein source, has yet to be evaluated for its use on the Pacific white shrimp (Litopenaeus vannamei) diet. This investigation assessed the effects of YL on growth performance, metabolism, antioxidant capacity, and nutrient digestibility in shrimp. Seven diets with equal protein and lipid contents were prepared, incorporating gradient YL (dry matter basis): 0% (control), 1.50%, 3.00%, 4.50%, 6.00%, 9.00%, and 12.00%. During a 56-day feeding trial involving shrimp, with an initial average weight of 0.32 ± 0.02 g, each kind of diet was randomly assigned to six tanks. It was observed that the growth performance improved initially but then exhibited a declining trend as the dietary inclusion of YL increased. Regression analysis indicated 2.68% as the optimal YL percentage for a specific growth rate (SGR), accounting for 10.54% of the dietary FM content. A higher YL (over 6.00%), which is equivalent to replacing over 23.6% of the FM, led to increased feed intake and conversion ratios, possibly correlating with decreased YL digestibility. However, YL inclusion across the studied range had no detrimental impact on intestinal or hepatopancreatic morphology. Notably, higher YL levels significantly enhanced hepatopancreatic trypsin activity and reduced serum triglyceride and cholesterol levels. The inclusion of YL notably augmented antioxidant defense mechanisms in shrimp, as evidenced by increased total antioxidant capacity and catalase activities, as well as reduced malondialdehyde levels in the hepatopancreas, possibly due to the presence of β-glucan and mannan oligosaccharides in YL. These findings support YL being viable as a protein source in shrimp feeds.
1 Introduction
Fishmeal (FM) has been the primary protein source in the diet of marine carnivorous species because of its high protein quality, well-balanced amino acid profile, palatability, and absence of anti-nutritional factors (NRC, 2011; Oliva-Teles et al., 2015; Tacon and Metian, 2015). Despite this, the burgeoning demand of the expanding aquaculture industry has challenged the static supply of approximately 5 million tons of FM (Easton et al., 2002; Hua et al., 2019; FAO, 2022). Thus, the exploration of sustainable FM alternatives is imperative for ensuring the industry’s long-term ecological viability (Naylor et al., 2021).
Numerous researches have been conducted to evaluate alternative protein sources, including plant-derived proteins, processed animal byproducts, and single-cell proteins (SCPs) (Gupta et al., 2020; Mohan et al., 2022; Carvalho et al., 2023). While plant-based proteins may offer a sustainable option, they often lead to imbalances in amino acid profiles, reduced nutrient utilization, and decreased palatability (Gatlin et al., 2007; Glencross, 2020; Sánchez-Muros et al., 2020). Animal byproducts are lipid-rich but they are prone to oxidative rancidity (Luthada-Raswiswi et al., 2021). SCPs derived from microorganisms, including bacteria, fungi, algae, and yeast, have emerged as promising alternatives, offering high protein content, essential micronutrients, and bioactive compounds such as β-glucan and mannan oligosaccharides (Meena et al., 2013; Torrecillas et al., 2014; Douxfils et al., 2017; Glencross et al., 2020; Agboola et al., 2021; Sharif et al., 2021). The dietary inclusion of yeast, for instance, has demonstrated positive effects on the growth and health of various aquatic species without adverse impacts (Oliva-Teles et al., 2006; Øverland et al., 2013; Bob-Manuel, 2014; Huyben et al., 2017) and has been shown to enhance growth and immune responses in shrimp (Jin et al., 2018). However, the economic feasibility of yeast production is constrained by the high cost of raw materials, particularly carbon sources (Sharif et al., 2021).
One-carbon gas proteins (C1GPs) are significant focus among single-cell proteins (SCPs) in recent years. These proteins, produced by fermenting microorganisms using C1-related industrial waste gases, such as CH4, CO, and CO2 (Wang et al., 2023). This method notably reduces greenhouse gas emissions and the dependency on agricultural resources (Sharif et al., 2021). Produced via industrial waste gas fermentation technology, Yarrowia lipolytica (YL) stands out for its environmental resilience and efficient substrate utilization and biosynthesis (Hu et al., 2016), making it an eco-friendly alternative to FM (Turck et al., 2019; Mamaev and Zvyagilskaya, 2021). Dietary supplementation with YL has shown beneficial effects on growth, the immune response, the gut microbiota, and disease resistance in various fish species (Hatlen et al., 2012; Berge et al., 2013; Alamillo et al., 2017; Shurson, 2018; Neuls et al., 2021). However, research on YL as an FM substitute in crustaceans is limited.
This study focused on Pacific white shrimp, a predominant species in global aquaculture that accounts for a significant portion of the industry’s output (FAO, 2022). We aimed to evaluate the potential of incorporating YL into shrimp diets by assessing growth performance, feed utilization, digestive enzyme activities, and histological and biochemical parameters in both the intestine and hepatopancreas. This investigation is expected to provide valuable insights into the feasibility of using YL as a sustainable dietary component in the cultivation of Pacific white shrimp.
2 Materials and methods
The study received approval from the Zhejiang Ocean University Committee on Ethics of Animal Experiments and adhered to the ethical norms and guidelines for Frontiers in Marine Science.
2.1 Chemical analysis
The proximate compositions of the feed ingredients, experimental feeds, and shrimp samples were analyzed following the methodology outlined by the Association of Official Analytical Chemists (AOAC, 2005). The values are the means of two replicates. The specific methods employed in this study were based on our previous publication (Zhang et al., 2023). Moisture content was determined by drying minced samples in a 105°C oven until a consistent weight was achieved. After acid digestion with an Auto-Digester (KjelFlex K-360, BUCHI, Switzerland), crude protein content was calculated using the Kjeldahl technique and calculated by multiplying nitrogen by 6.25. Crude lipids were extracted using a Soxtec System HT (Soxtec 2055, FOSS Tecator) through ether extraction. The samples were burned in a muffle furnace at 550°C for 8 h to assess the amount of ash content. The analysis of amino acid content in the samples was conducted according to our previous publication (Zhang et al., 2023). The determination of phosphorus content in the samples was carried out using the molybdenum blue colorimetric method (Tan et al., 2022a).
2.2 Yarrowia lipolytica production and experimental diet formulation
Yarrowia lipolytica GTLB P42 was obtained and cultured with Jitilabo (Beijing) Biotechnology Development Co., Ltd., Beijing, China. Yarrowia lipolytica was produced using the method described by Hu et al. (2016), and the general process is presented in Figure 1. In the first stage, Moorella thermoacetica produced acetic acid by anaerobic fermentation using syngas (a mixture of CO, H2, and CO2) as the sole carbon source, after which the fermentation broth was purified and filtered. In the second stage, Yarrowia lipolytica uses the above acetic acid product as a substrate to produce yeast proteins by aerobic fermentation. The Yarrowia lipolytica strains used in the trial were analyzed by the methods described below and contained (dry matter) 57.66% crude protein, 0.22% crude lipid, 7.49% ash, and 1.56% phosphorus. The amino acid compositions of Yarrowia lipolytica are shown in Supplementary Table S1.
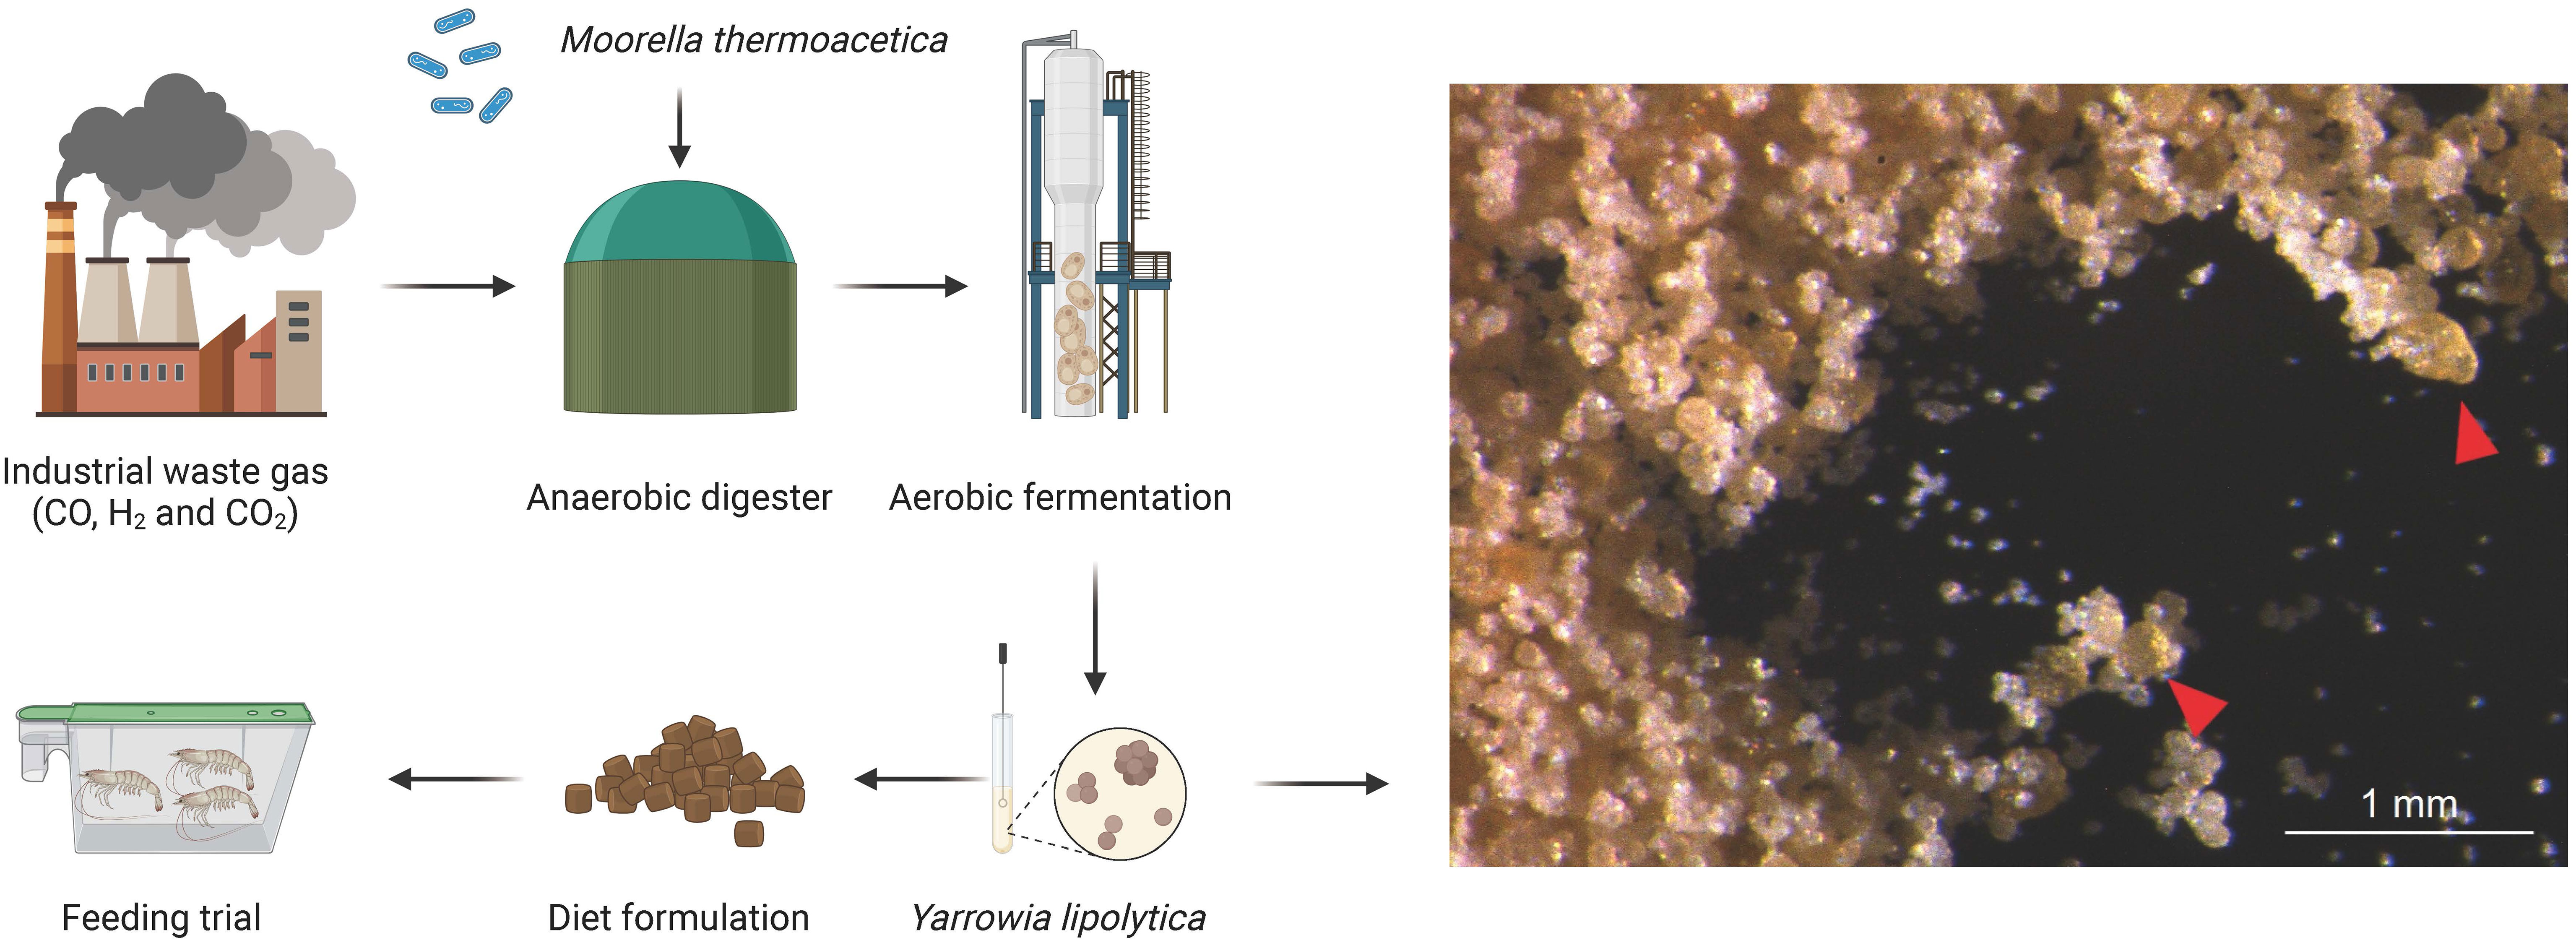
Figure 1 Yarrowia lipolytica production and schematic of the present study. In the first stage, Moorella thermoacetica in an anaerobic bioreactor converted CO, H2, and CO2 to acetic acid. In the second stage, Yarrowia lipolytica converts acetic acid to yeast protein. Finally, graded concentrations of Yarrowia lipolytica were added to the diet. Feeding trials were also conducted to evaluate the potential use of Yarrowia lipolytica in shrimp diets. Right panel: arrows indicate the morphology of YL under light microscopy.
Seven equal protein content (40.00% crude protein), equal lipid content (8.00% crude lipid), and equal energetic (16.33 MJ/kg) diets were formulated by supplementing YL at levels of 0%, 1.50%, 3.00%, 4.50%, 6.00%, 9.00%, and 12.00% to a basal diet. According to previous studies, DL-methionine, L-lysine, and L-arginine were added to maintain amino acids balance to support animal growth and health (Cheng et al., 2021; Ji et al., 2021). To determine the apparent digestibility, yttrium oxide (Y2O3) was supplemented at a concentration of 0.1%. The formulation and approximate compositions of the experimental diets are shown in Table 1. Feed pellets with a diameter of 1.20 mm were prepared and steam-sterilized according to the specific production process described in previous study (Xu et al., 2021).
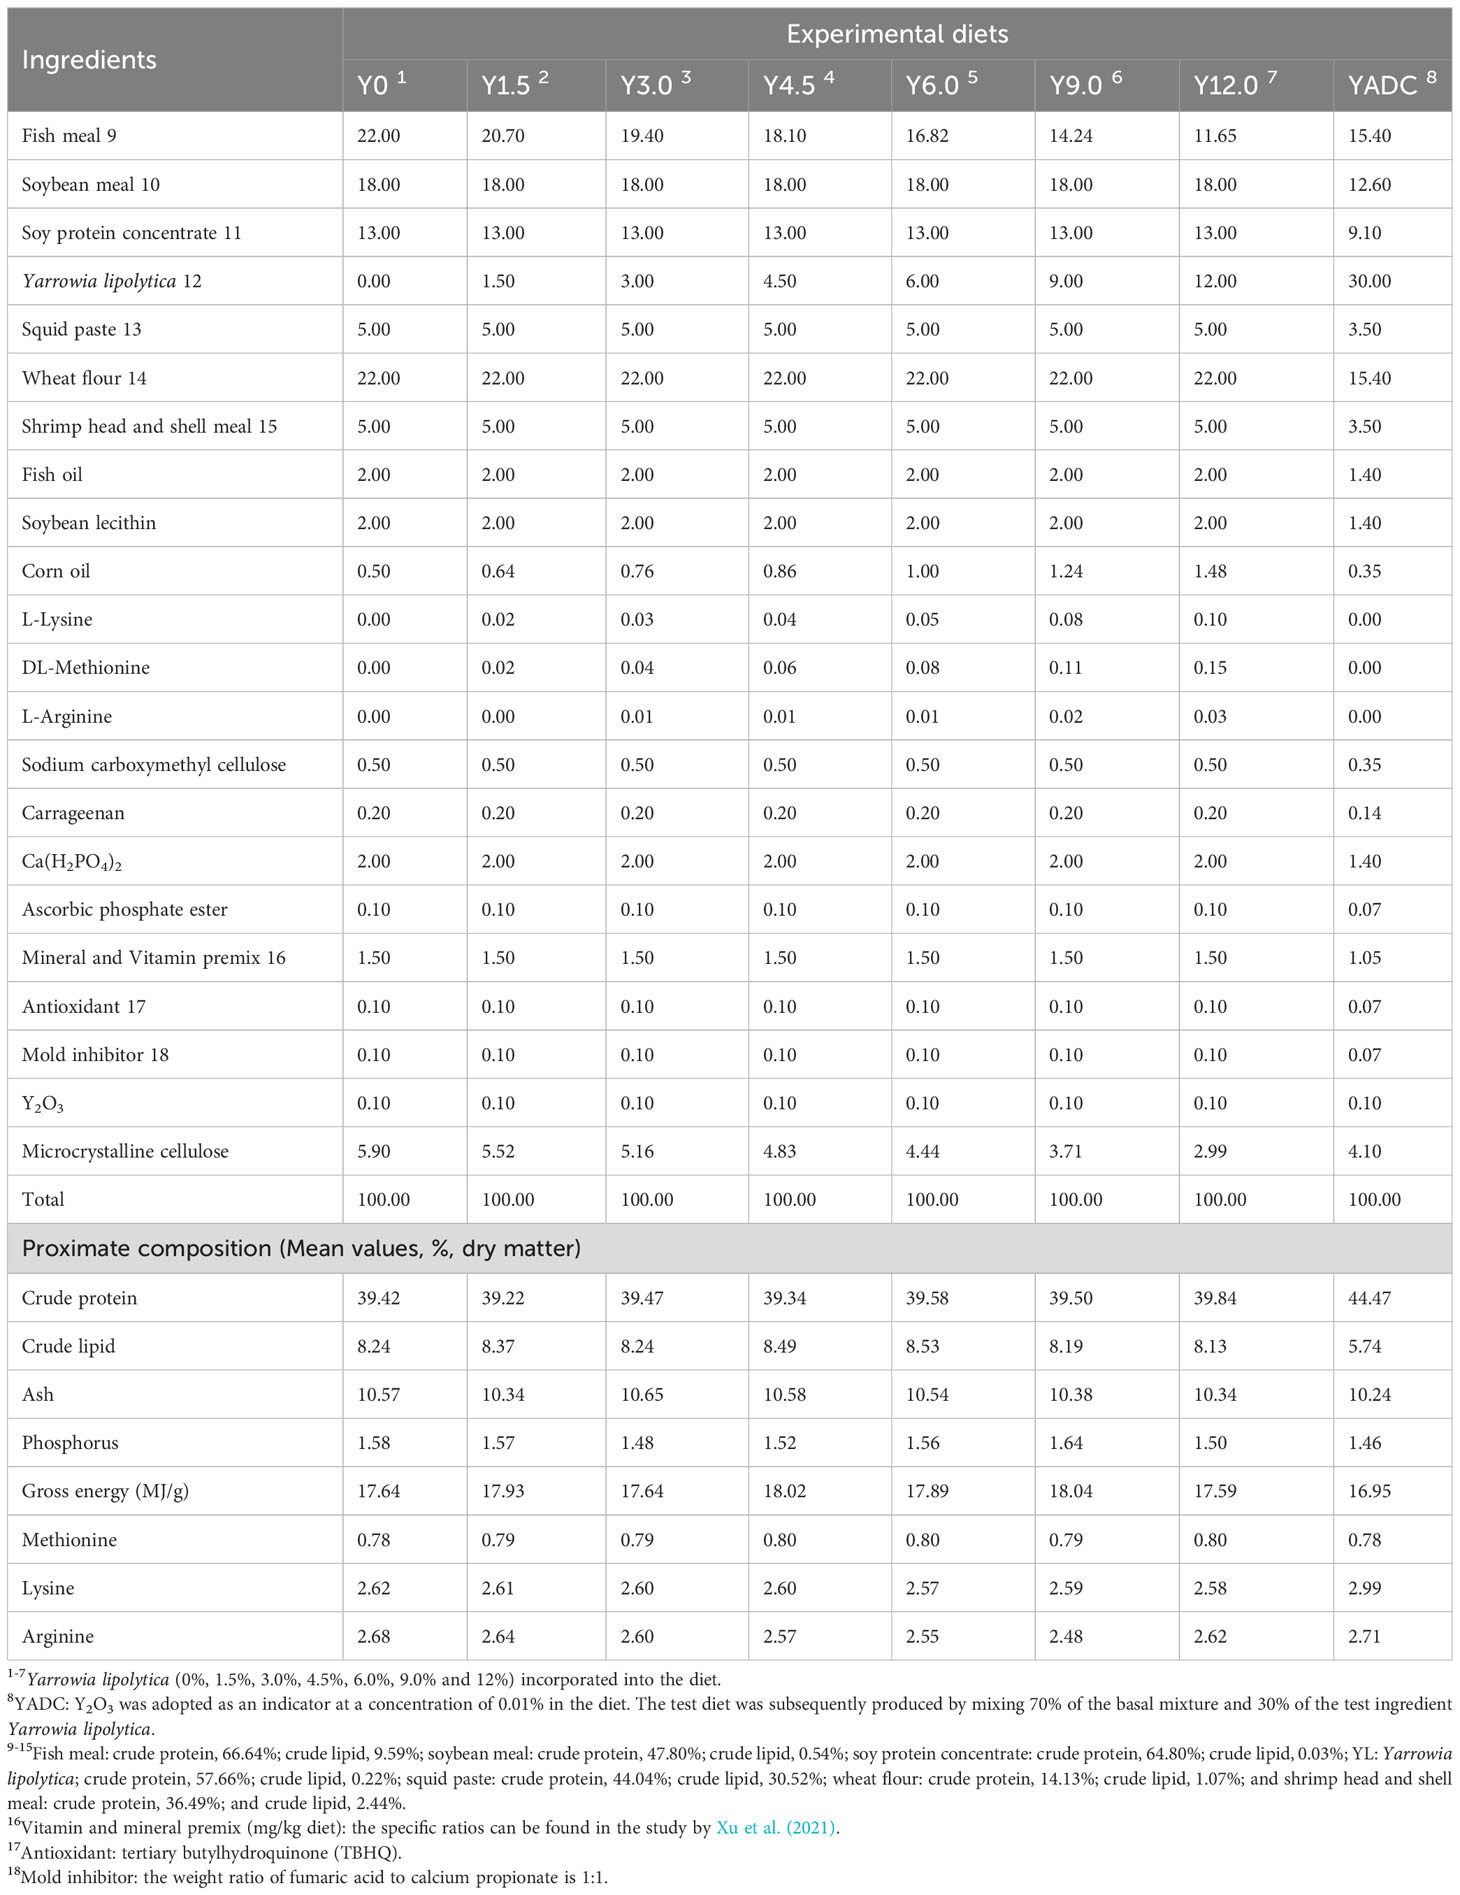
Table 1 Experimental diet formula and its basic nutrient composition (%, dry weight).
2.3 Experimental animals and feeding trial
Litopenaeus vannamei used in the experiment were obtained from the Xixuan Fishery Science and Technology Island Farm in Zhoushan City, Zhejiang Province, China. Commercial diets were fed to the shrimp for 2 weeks for acclimation. After domestication for 2 weeks, 2,100 shrimp (initial body weight of 0.32 ± 0.02 g) were transferred to a flowing water system and randomly divided into 42 tanks (six replicates for each treatment) with 50 individuals per tank. During the feeding period, the water was subjected to daily exchanges, and continuous aeration was ensured through the use of air stones. The water temperature was carefully regulated within the range of 25.0 ± 3.0°C while maintaining a salinity level of 28.0 ± 1.0 g/L. Additionally, the dissolved oxygen content was maintained above 6.0 mg/L, the ununionized ammonia nitrogen concentration was kept below 0.05 mg/L, the nitrite concentration was kept below 0.1 mg/L, and the pH was monitored within the range of 7.7 ± 0.1. Shrimp were fed the respective experimental diets to apparent satiation three times daily at 07:00, 12:00, and 18:00 for 56 days. After 3 h of feeding, the remaining pellets were collected using a siphon, dried, and weighed. Additionally, feces were thoroughly removed.
2.4 Digestibility experiment
Starting from the 7th week of the formal trial, the feces were drained every night after feeding for 3 h. The feces were collected and dried by siphoning at 6:00 am on the following day. The yttrium content was determined by inductively coupled plasma atomic emission spectrometry (Thermo Electron, U.S.A.) after digestion.
2.5 Sample collection
Before the start of the experiment, 30 initial shrimp were randomly selected and stored in a −20°C freezer for whole-body proximate composition analysis. At the end of the 8-week feeding trial, a fasting period of 12 h was imposed on the shrimp. Subsequently, the shrimp were sedated using a concentration of 60 mg/L tricaine methanesulfonate (MS-222, Sigma−Aldrich, USA) to minimize any potential problems. The shrimp were then carefully captured using a net and promptly transferred to an ice plate, where they were weighed tail by tail after they had remained stationary. Ten shrimp were selected from each tank for whole shrimp analysis, while the remaining shrimp were subjected to heart blood sampling. After a 2 h standing period, the samples were centrifuged at 8,000 ×g for 15 min. The serum samples were carefully collected and stored at −80 °C until analysis. The shrimp visceral mass was carefully extracted and dissected on ice to sequentially isolate the hepatopancreas, stomach, and intestines. The hepatopancreas was weighed and collected to measure digestive, antioxidant, and immune parameters. Muscle samples were analyzed for muscle composition. All the samples were stored at −80 °C until analysis. The hepatopancreas and midgut of six shrimp were randomly taken from each tank and divided into two small portions, which were stored in 4% paraformaldehyde (PFA) solution and 2.5% glutaraldehyde solution (4 °C). These samples were subjected to histological staining with hematoxylin and eosin (H & E) and electron microscopy.
2.6 Biochemical assays
The stomach, hepatopancreas, and midgut tissues were accurately weighed, and 9 volumes of homogenization medium (cold PBS, 0.1 M, pH 7.0, 4°C) were added at a weight (g): volume (mL) ratio = 1:9. The tissues were mechanically homogenized in an ice-water bath. The homogenate was centrifuged at 2,500 ×g for 10 min at 4°C. The supernatant was carefully collected and stored at −80 °C, after which the digestive enzyme (trypsin, lipase, and amylase) activity was determined. The serum samples were used to analyze the total protein (TP), albumin (ALB), glucose (GLU), blood urea nitrogen (BUN), triglyceride (TG), total cholesterol (TC), total bilirubin (TBIL), and creatinine (Cr) contents as well as alanine transaminase (ALT), aspartate aminotransferase (AST), and polyphenol oxidase (PPO) activities. Furthermore, the serum and hepatopancreatic malondialdehyde (MDA), catalase (CAT), total superoxide dismutase (T-SOD), total antioxidant capacity (T-AOC), lysozyme (LZM), glutathione peroxidase (GSH-Px), alkaline phosphatase (AKP), and acid phosphatase (ACP) activities were also determined. The biochemical parameters of the serum and tissues were determined using assay kits provided by Nanjing Jiancheng Bioengineering Institute (China), and the measurements were conducted according to the manufacturer’s instructions.
2.7 Hepatopancreas and midgut structure and ultrastructure analysis
In accordance with the methods of Xu et al. (2021), tissue samples were subjected to H & E staining and analyzed via histological sectioning. Transmission electron microscopy (TEM) and scanning electron microscopy (SEM) analyses of tissue samples were performed as described previously by Tan et al. (2022b). Eighteen images were selected for each group, and Imagine-Pro Plus 6.0 (Media Cybernetics, USA) software was used for further analysis of the microvillus height in the transmission electron microscopy sections (Penn et al., 2011).
2.8 Calculations and statistical analysis
The following variables were calculated:
Survival rate (SR, %) = Nt × 100/N0;
Weight gain rate (WGR, %) = 100 × (Wt − W0)/W0;
Specific growth rate (SGR, %/day) = 100 × (Ln Wt – Ln W0)/t;
Hepatosomatic index (HSI, %) = 100 × (liver weight/Wt);
Feed intake (FI, %/day) = 100 × dry feed intake/[(initial body weight + final body weight)/2]/t;
Feed conversion ratio (FCR) = dry feed fed/wet weight gained;
Protein efficiency ratio (PER) = 100 × (Wt − W0)/(feed intake × feed protein content);
Protein productive value (PPV, %) = 100 × protein gain/total protein intake;
Apparent digestibility coefficient (ADC, %) of dry matter = (1 − dietary Y2O3/fecal Y2O3) × 100;
Apparent digestibility coefficients of a certain nutrient in feed (%) = [1 − (dietary Y2O3/fecal Y2O3) × (certain nutrient content in feces/certain nutrient content in feed)] × 100;
Apparent digestibility coefficients of a certain nutrient in the test ingredient (%) = [(ADC test diet × nutrient test diet) – (0.7 × ADC REF diet × nutrient REF diet)]/(0.3 × nutrient ingredient).
where Wt and W0 represent the final and initial shrimp weights, respectively; Nt and N0 are the final and initial shrimp quantities, respectively, in each tank; t is the trial period in days; and REF diet is the reference diet.
All the data were analyzed using IBM SPSS Statistics 26.0 (SPSS, Inc., USA) and are presented as the mean ± standard error of the mean (S. E. M.). Levene’s test was used to confirm the normality and homogeneity of the variance. The Kruskal-Wallis test was performed when the data were not homogeneous. Otherwise, one-way ANOVA with Duncan’s multiple range test for multiple data groups was used to assess significant differences among groups. Differences were considered significant at P < 0.05. If statistical significance was detected, the data were further subjected to orthogonal polynomial comparisons, which were used to assess the significance of linear, quadratic, and cubic regression models to fit the best model. If the cubic regression was found to be significant, the quadratic and linear regressions were disregarded; otherwise, the significance of the quadratic regression was examined; if the quadratic regression was significant, the linear regression was not considered; otherwise, the significance of the linear regression was tested (Yossa and Verdegem, 2015). Origin 2021 (OriginLab, Inc., USA) was used to fit the regression model; correlation analyses were performed using the R package (4.1.2) ggplot2, linkET, dplyr, and FactoMineR. BioRender.com was used to create YL production workflows.
3 Results
3.1 Growth performance and feed utilization
Table 2 shows that the relationships between dietary YL levels and shrimp growth performance (SR, WGR, and SGR), as well as feed utilization (FR, FCR, PER, and PPV), were best explained using a cubic model. Compared to that in the control group (Y0), the SR of the shrimp in the Y1.5, Y4.5, Y6.0, and Y12.0 groups significantly increased (P < 0.05). As the YL level in the feed increased, the WGR and SGR initially increased and then decreased. A cubic regression model based on the SGR indicated that the optimal YL level in shrimp diets was 2.68% (R2 = 0.90658, Figure 2A), which accounted for 10.54% of the dietary FM content. When the FCR increased, the PER and PPV decreased when dietary YL inclusion exceeded 3.0% (P < 0.05). Moreover, increases in dietary YL inclusion resulted in increased FI and FCR (P < 0.05, Figures 2B, C), while PER showed a decreasing trend (Figure 2D). The responses of all three variables to the increase in dietary YL inclusion followed a cubic model (R2 = 0.95365, 0.95067, and 0.94102, respectively). A growth-promoting effect of YL inclusion in the range of 0-3.0% was observed. Furthermore, growth performance did not significantly decrease when YL inclusion exceeded 6.0%, which is equivalent to replacing over 23.6% of the FM, but increases in FI and FCR were noted.
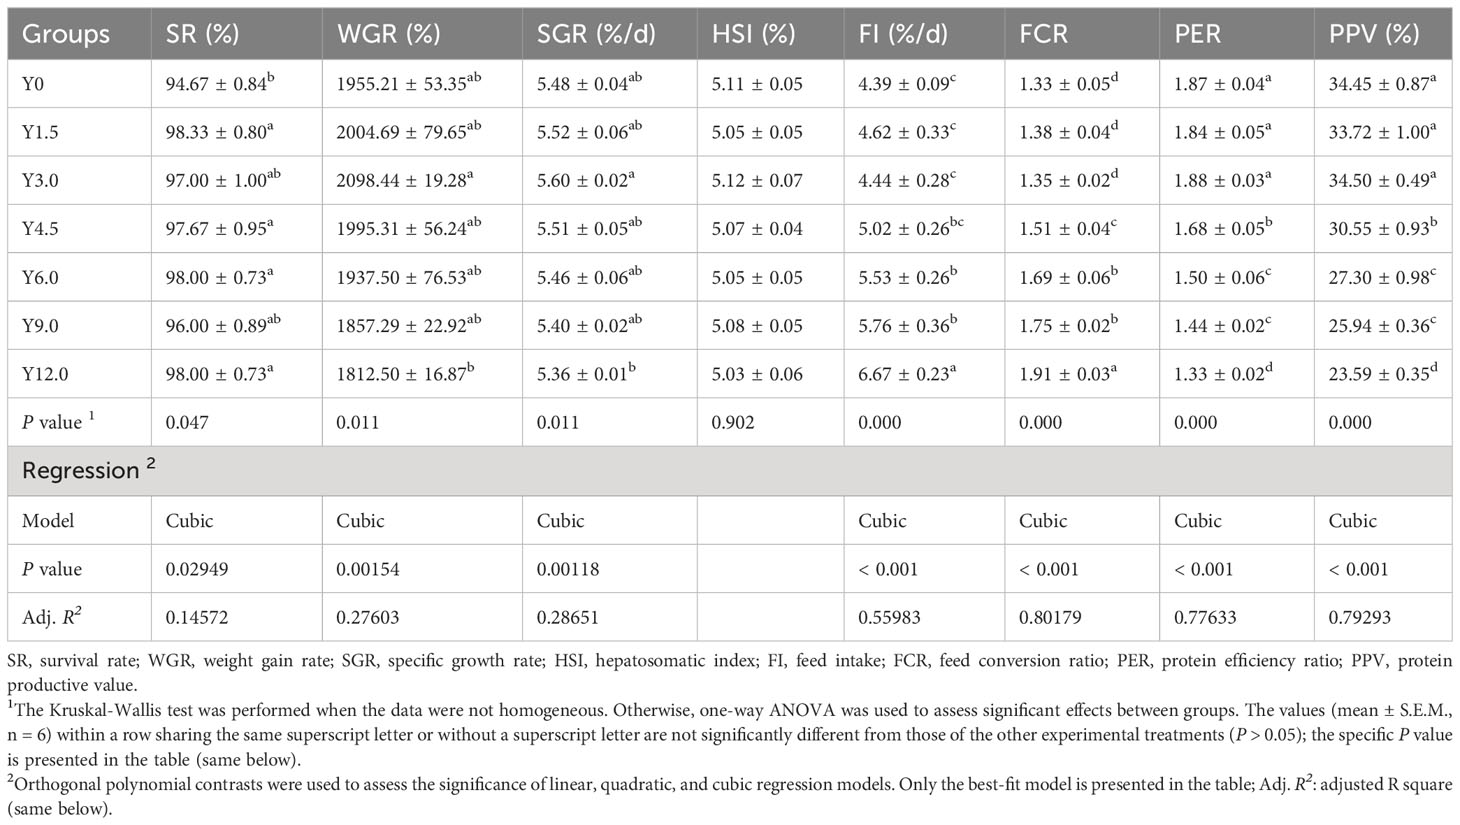
Table 2 Effect of dietary Yarrowia lipolytica on growth performance and feed utilization.
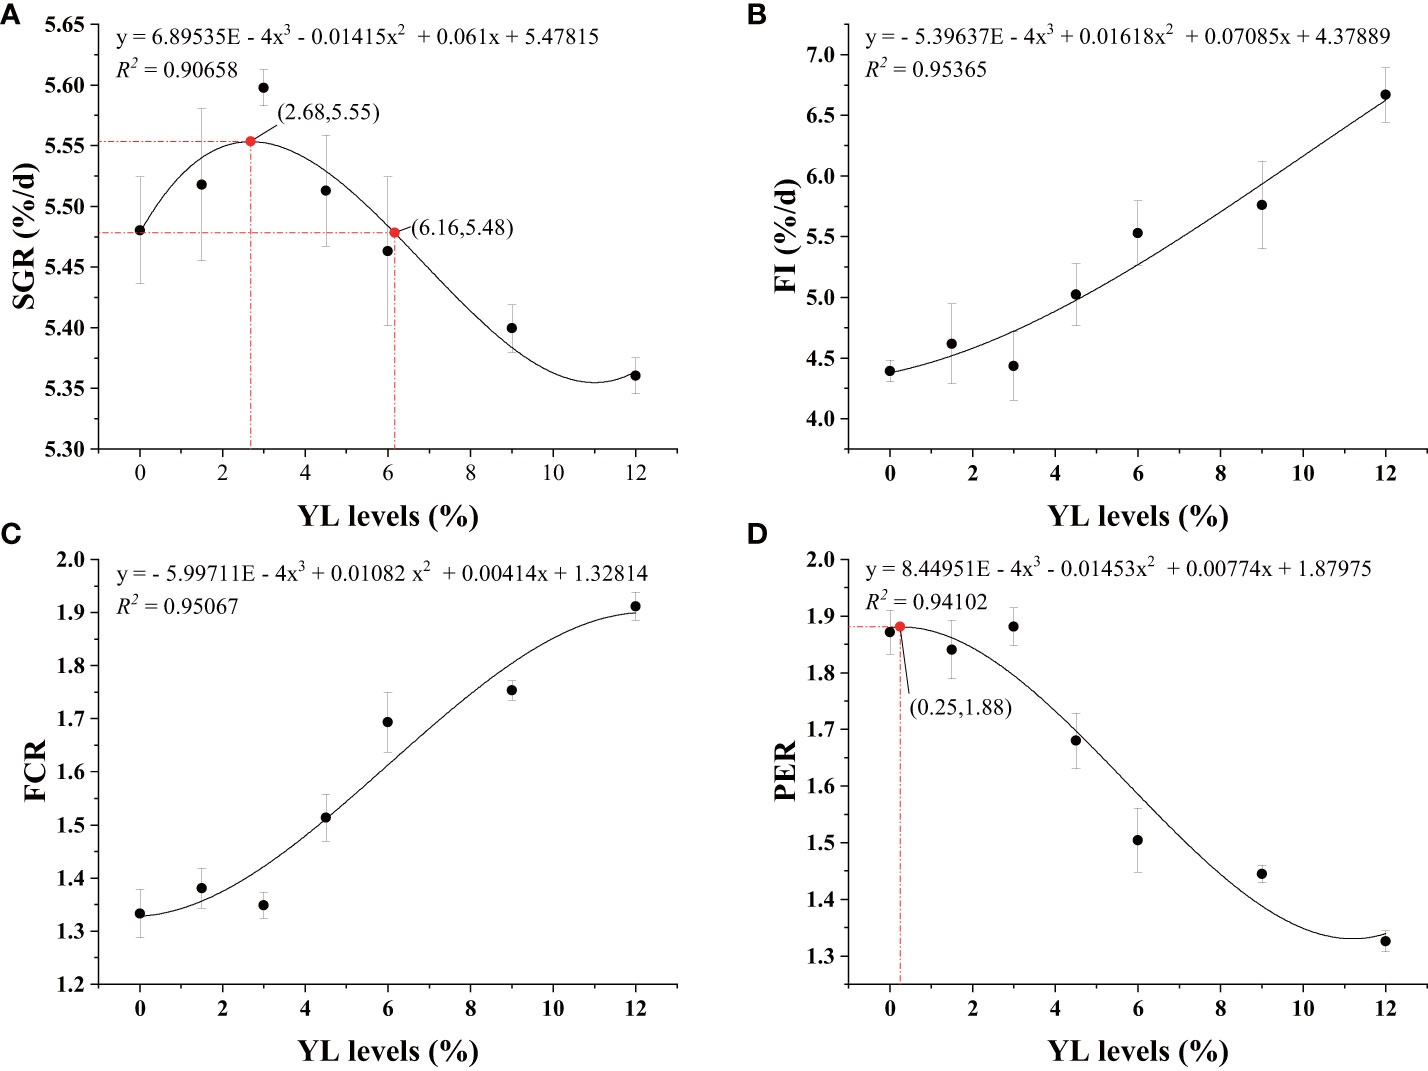
Figure 2 Regression analysis of SGR (A), FI (B), FCR (C), and PER (D) of shrimp-fed gradient levels of Yarrowia lipolytica for 56 days. SGR, specific growth rate; FI, feed intake; FCR, feed conversion ratio; PER, protein efficiency ratio; YL, Yarrowia lipolytica.
3.2 Whole-body and muscle proximate composition analysis
Tables 3, 4 present the whole-body and muscle proximate compositions at different YL levels. Cubic responses of whole-body moisture, crude protein, and crude lipid, as well as muscle moisture and phosphorus contents, were observed. Dietary YL inclusion at 6.0%, 9.0%, and 12.0% significantly increased whole-body moisture content (P < 0.05), while no significant differences in whole-body ash and phosphorus content were found among the groups (P > 0.05). The Y12.0 group had significantly lower crude protein and crude lipid contents in the whole body and greater muscle moisture content compared to the Y0 group (P < 0.05). The shrimp muscle crude protein content was significantly lower in the Y9.0 and Y12.0 groups than in the Y0 and Y3.0 groups (P < 0.05). Muscle phosphorus content was significantly lower in the Y3.0, Y6.0, and Y9.0 groups compared to the Y0 and Y1.5 groups (P < 0.05). The inclusion of 0-12.0% YL had no significant effect on the muscle crude lipid and ash contents (P > 0.05).
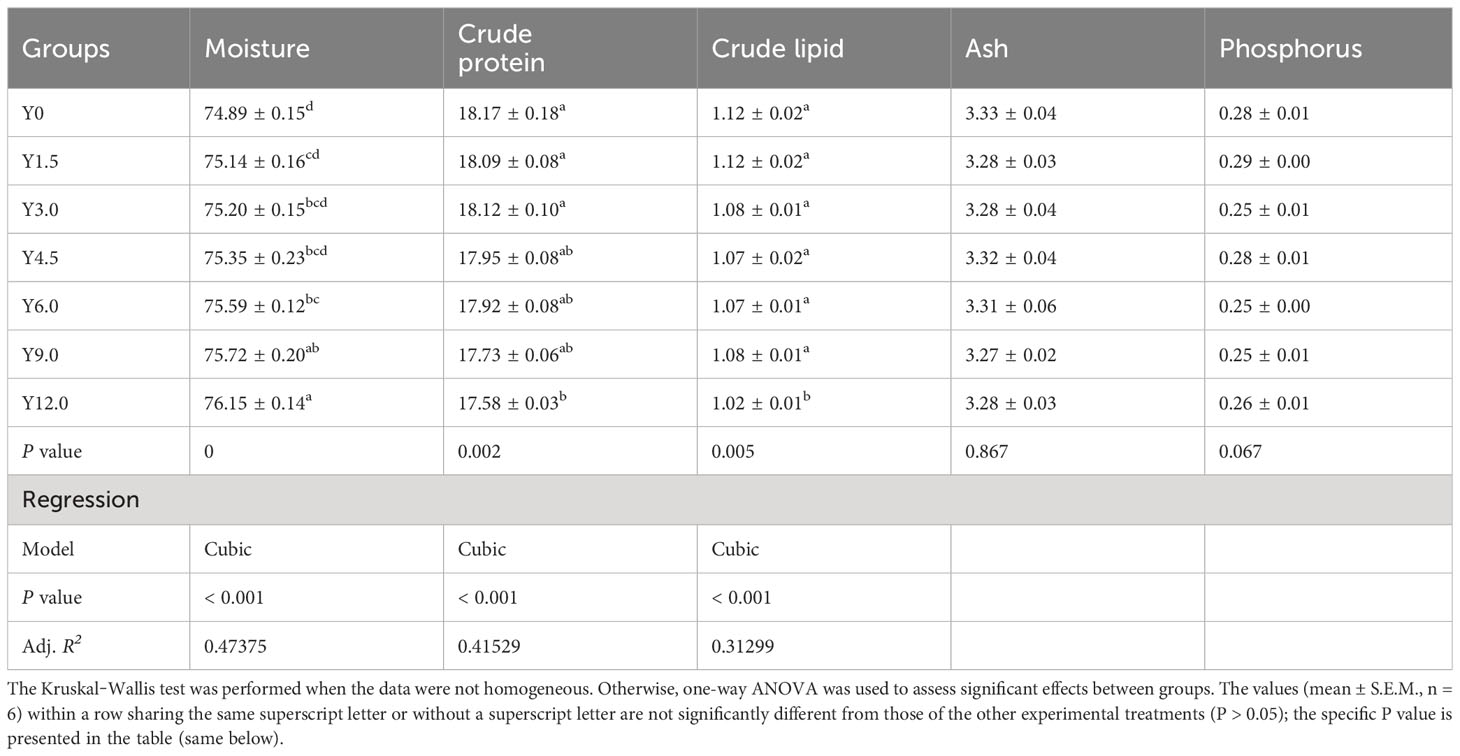
Table 3 Effect of dietary Yarrowia lipolytica on whole-body proximate composition (%).
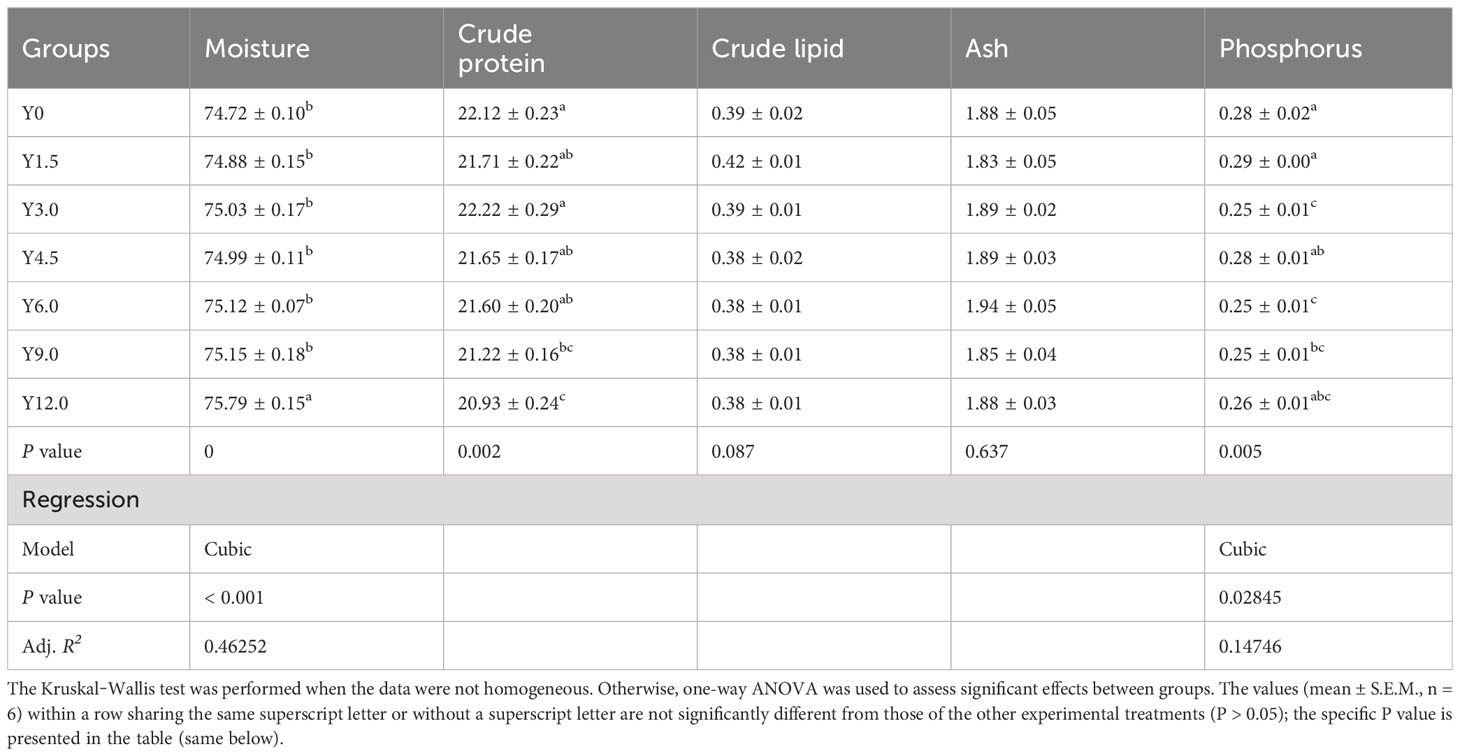
Table 4 Effect of dietary Yarrowia lipolytica on muscle proximate composition (%).
3.3 Muscle amino acid composition analysis
Table 5 shows the muscle amino acid composition at different dietary YL levels. Glycine and proline contents were cubically affected by the YL levels. Compared to the Y3.0 group, the muscle glycine content significantly reduced in the Y9.0 group, while the proline content significantly increased in the Y6.0, Y9.0, and Y12.0 groups (P < 0.05). The glycine content in the Y12.0 group was significantly higher than in the Y1.5, Y4.5, and Y9.0 groups, and the proline content in the Y9.0 group was significantly higher than in the Y0, Y1.5, Y3.0, and Y4.5 groups (P < 0.05). Dietary inclusion of 0-12.0% YL had no significant effect on the other 14 amino acids (P > 0.05).
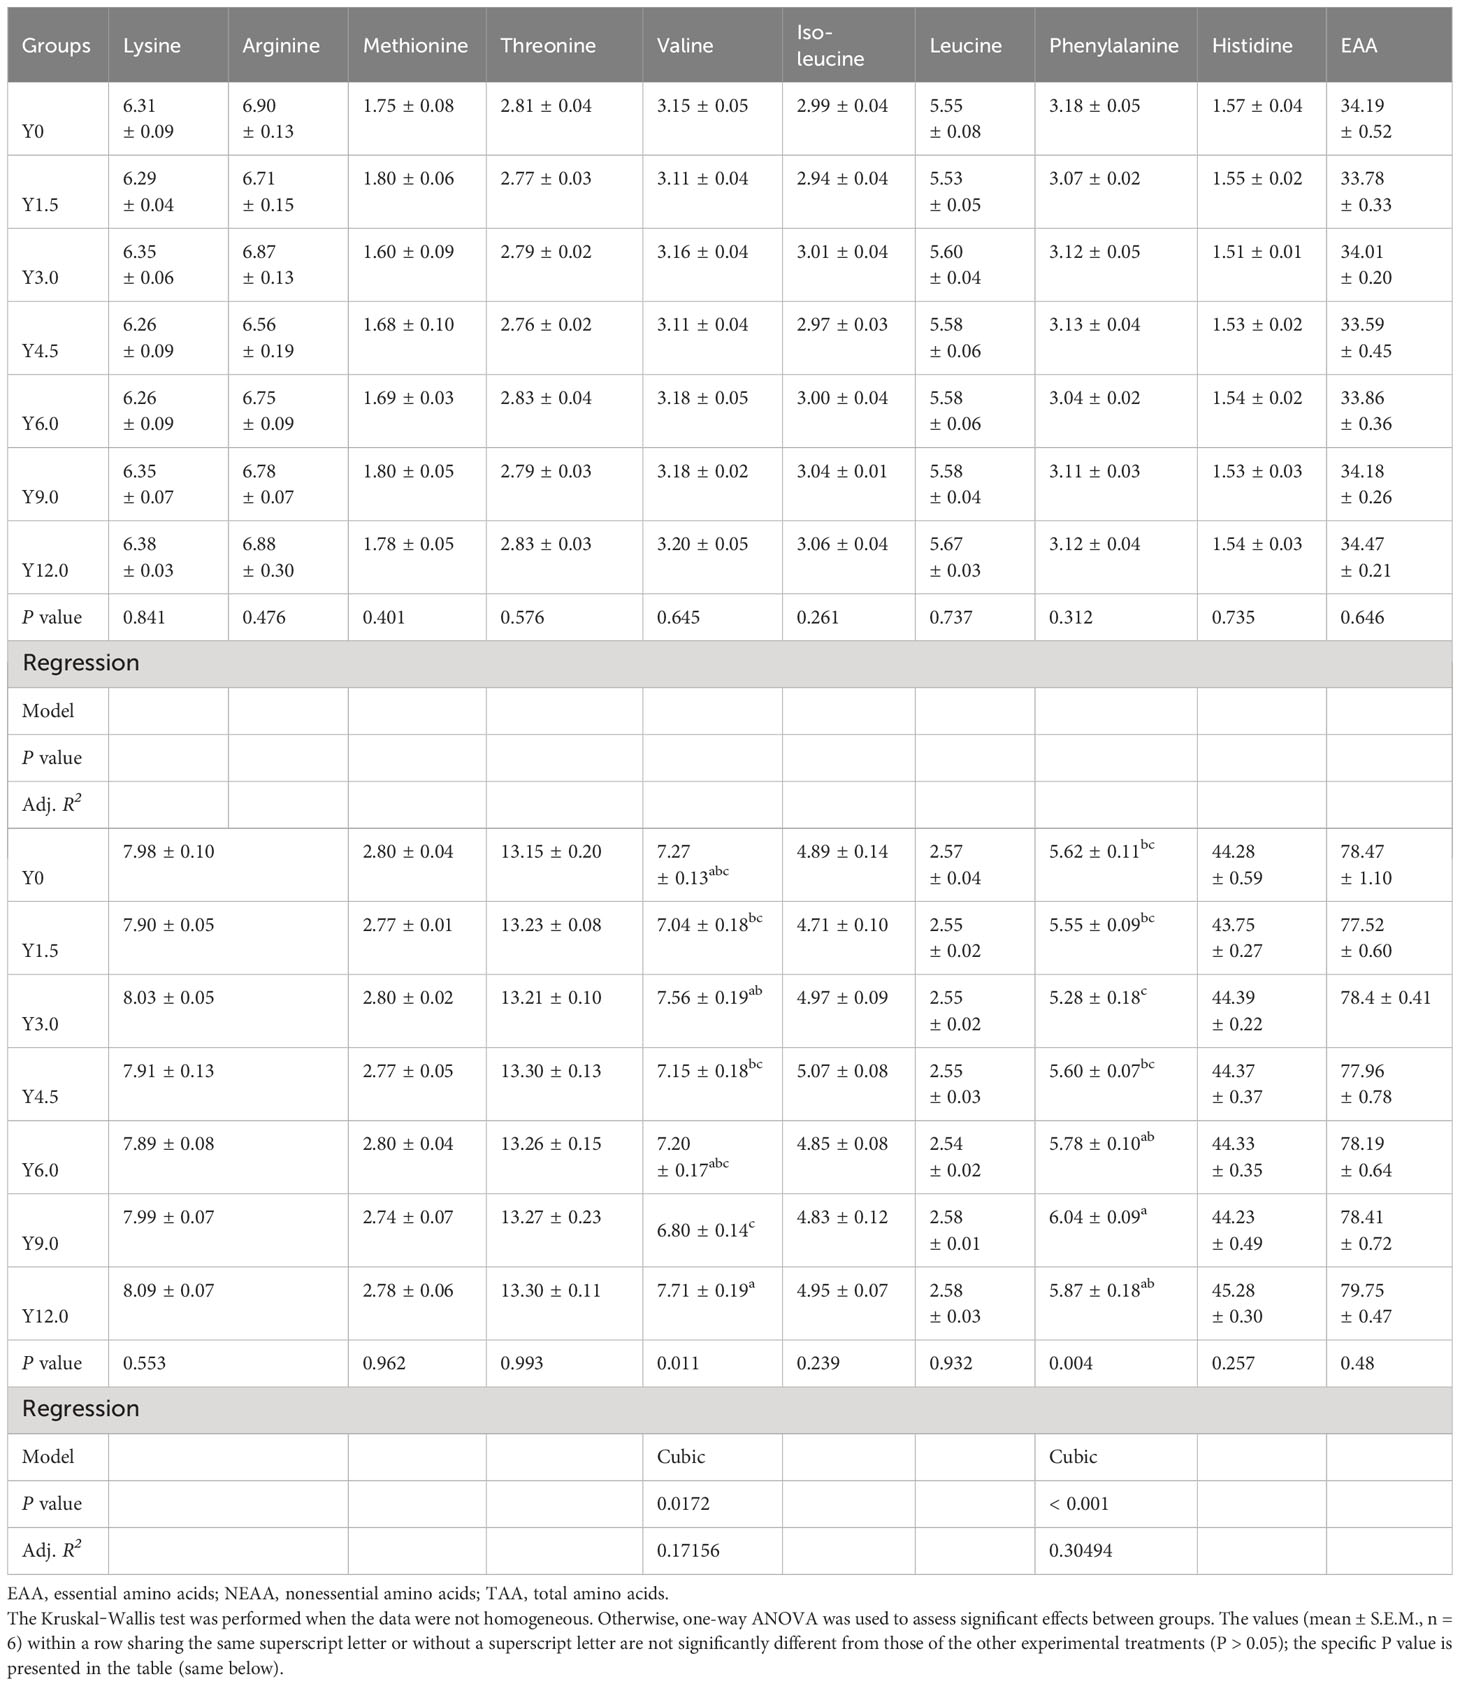
Table 5 Effect of dietary Yarrowia lipolytica on muscle amino acid content (g/100 g).
3.4 Serum biochemical, immune, and antioxidant parameter analysis
As depicted in Table 6, the serum TG and TC contents showed a decreasing trend and were cubically affected by dietary YL levels. The serum TG content was significantly lower in the Y4.5, Y9.0, and Y12.0 groups compared to the Y0, Y1.5, and Y3.0 groups (P < 0.05). There was a significant decrease in the serum TC content when dietary YL level exceeded 3.0% compared to the Y0 group (P < 0.05). However, no significant differences were noted among the treatments for serum TP, ALB, GLU, BUN, TBIL, Cr contents, or ALT and AST activities (P > 0.05).
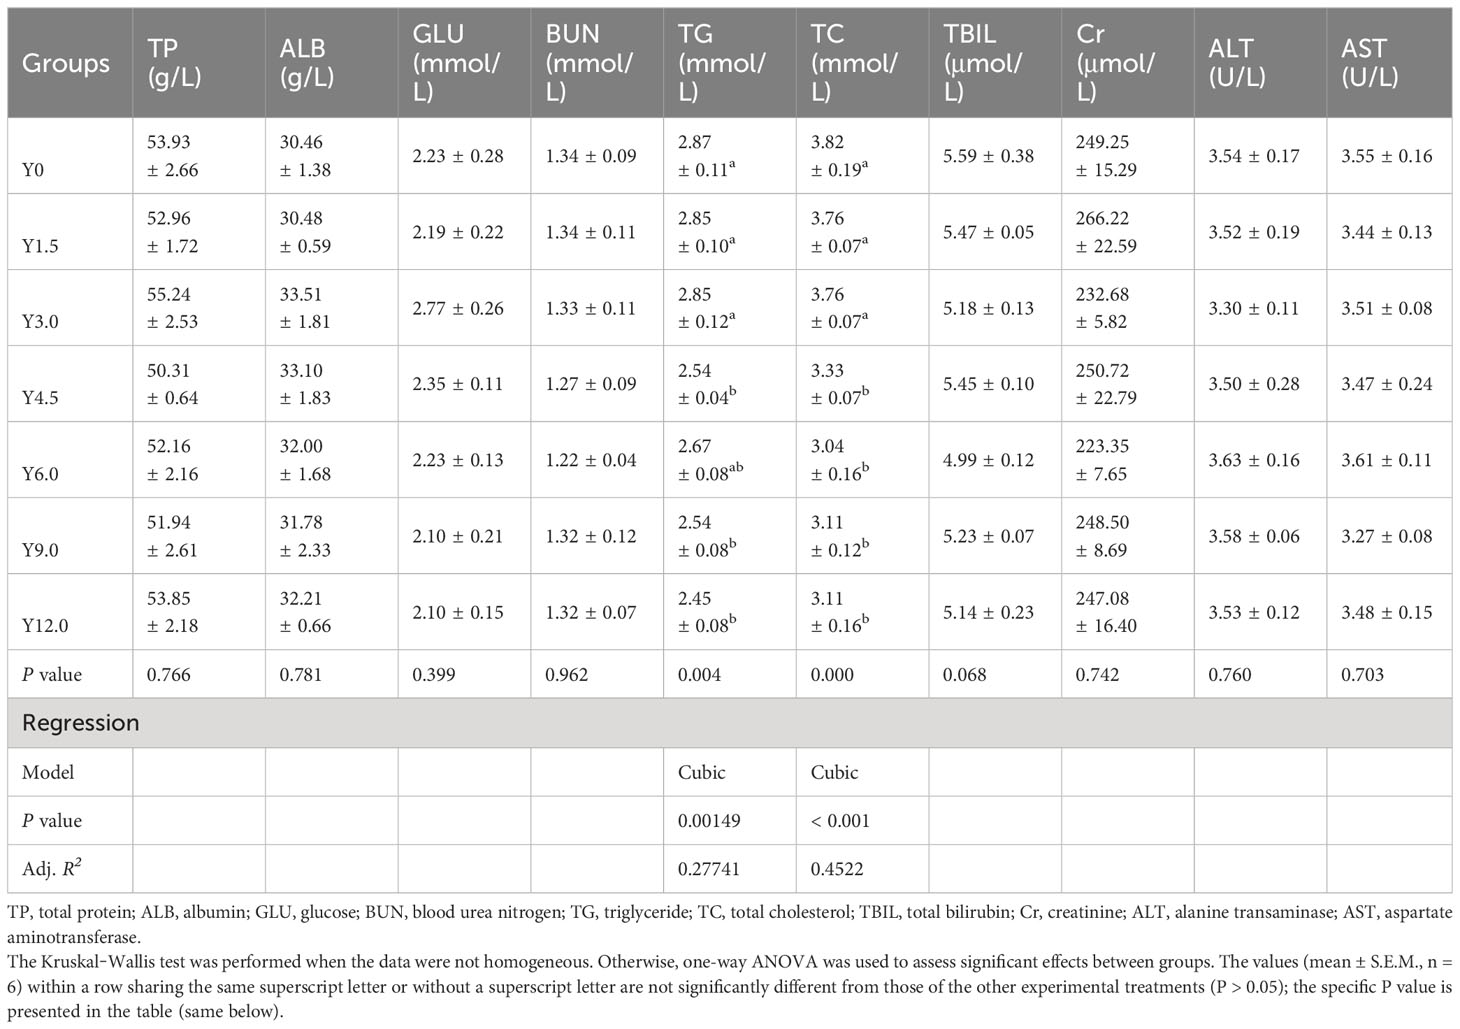
Table 6 Effects of dietary Yarrowia lipolytica on serum biochemical parameters.
Table 7 reveals that the serum T-AOC content exhibited a cubic increasing trend with increasing levels of YL replacement. The serum T-AOC content was significantly higher in the Y6.0, Y9.0, and Y12.0 groups than in the Y0 group (P < 0.05). However, no significant differences were observed among the groups for other serum antioxidant and immune parameters, including the MDA content and CAT, T-SOD, LZM, GSH-Px, AKP, ACP, and PPO activities (P > 0.05).
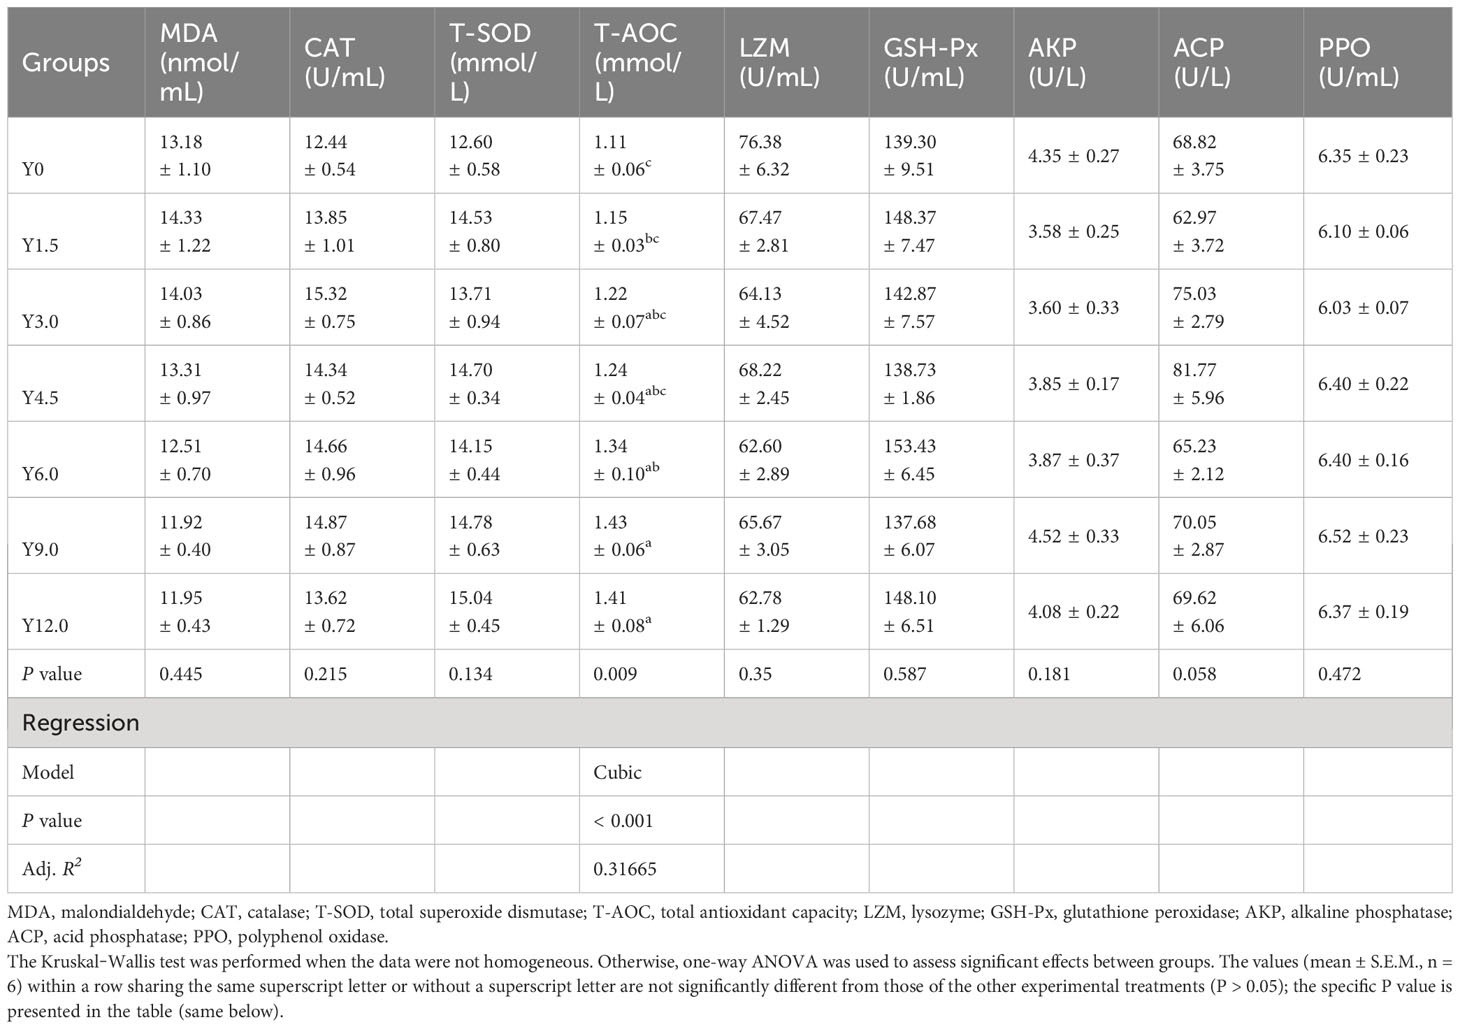
Table 7 Effects of dietary Yarrowia lipolytica on serum antioxidant and immune parameters.
3.5 Hepatopancreatic antioxidant and immune parameter analysis
Orthogonal polynomial contrast analysis, as presented in Table 8, indicated that the hepatopancreatic MDA content decreased, while the CAT and T-AOC activities increased, all of which responded cubically to dietary YL levels. The MDA content was significantly lower in the Y3.0, Y6.0, Y9.0, and Y12.0 groups, while the T-AOC activity was significantly higher in the Y4.5, Y9.0, and Y12.0 groups than in the Y0 group (P < 0.05). CAT activity was significantly elevated in the Y12.0 group relative to the Y0, Y3.0, Y4.5, and Y6.0 groups (P < 0.05). However, including dietary YL at levels ranging from 0% to 12.0% showed no significant effect on hepatopancreatic T-SOD, LZM, GSH-Px, AKP, and ACP activities (P > 0.05).
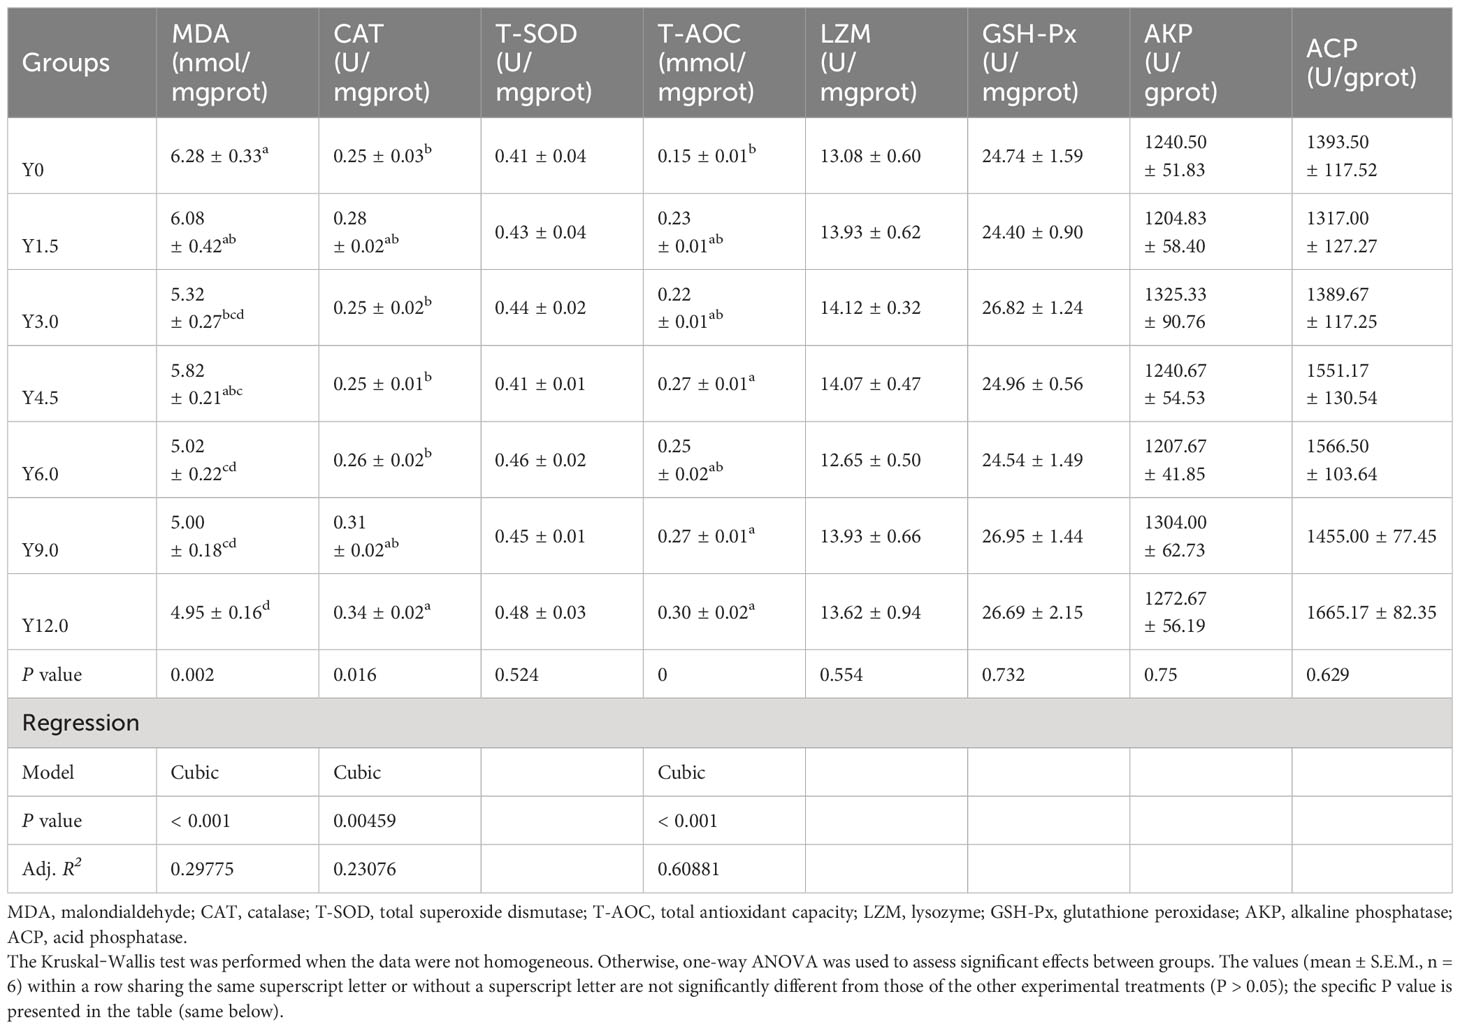
Table 8 Effects of dietary Yarrowia lipolytica on hepatopancreatic antioxidant and immune parameters.
3.6 Digestive enzyme activity analysis
Digestive enzyme activities in the stomach, hepatopancreas, and midgut, detailed in Table 9, showed that hepatopancreatic trypsin activity exhibited a cubic increase with increasing dietary YL inclusion. Specifically, trypsin activity was significantly higher in the Y3.0, Y9.0, and Y12.0 groups than in the Y0 group (P < 0.05). However, no significant differences were observed in stomach and midgut trypsin, lipase, and amylase activities or hepatopancreatic lipase and amylase activities among the different groups (P > 0.05).
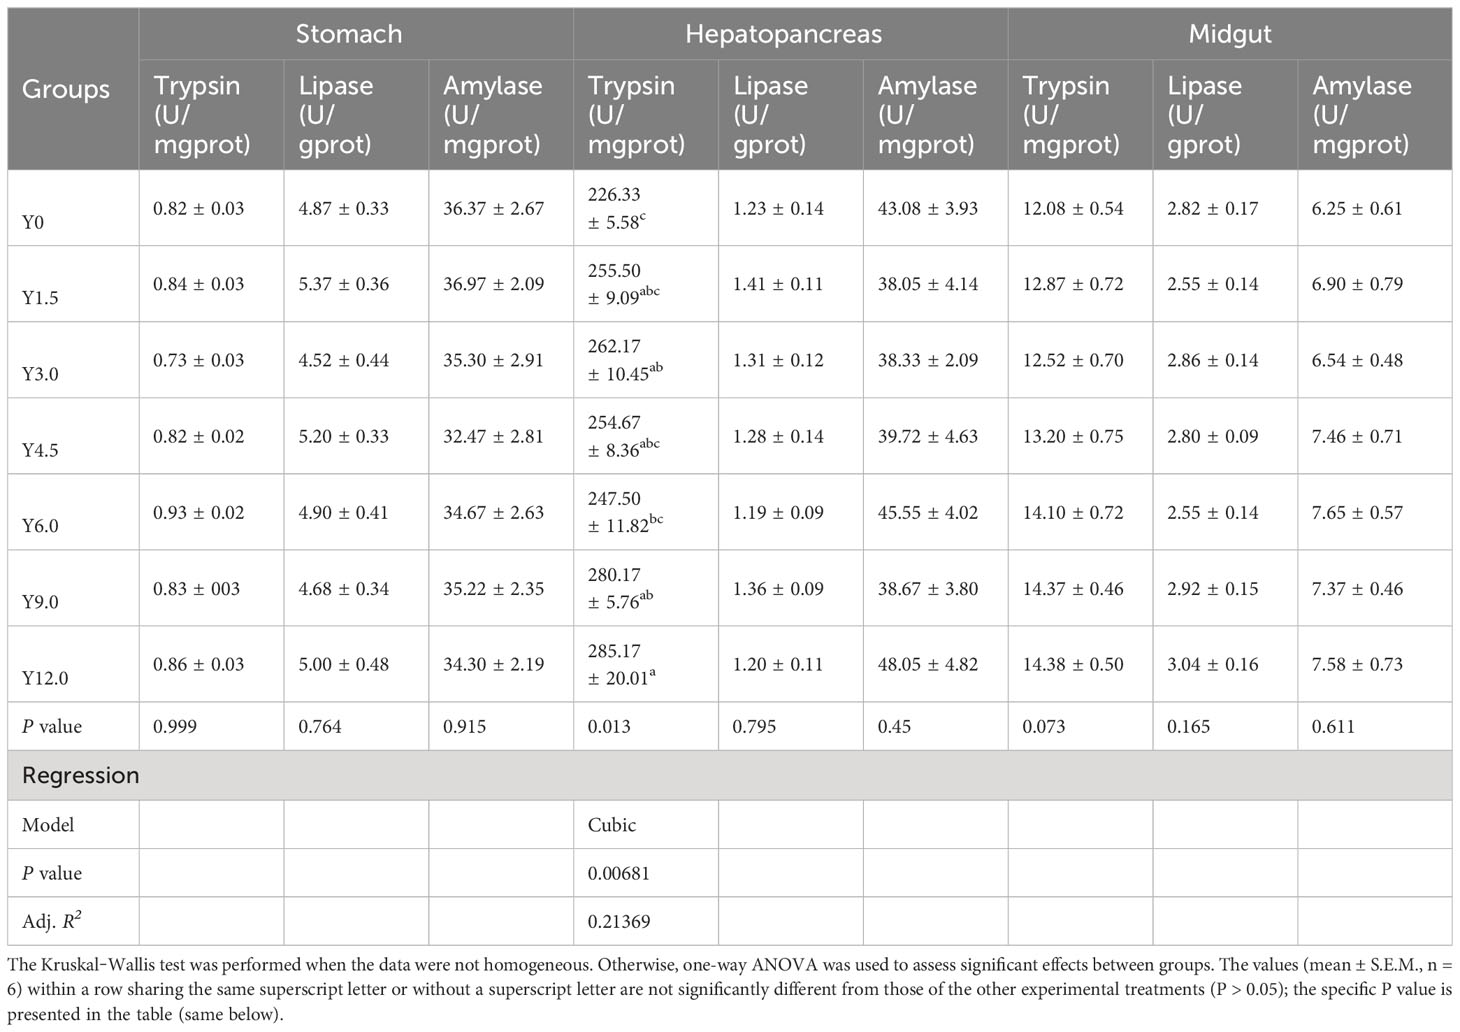
Table 9 Effects of dietary Yarrowia lipolytica on digestive enzyme activities in the stomach, hepatopancreas, and midgut.
3.7 Intestine and hepatopancreas histological analysis
The histological structures of midgut tissue from the Y0, Y3.0, and Y12.0 groups, displayed in Figure 3, showed no significant differences or damage to the intestinal mucosa. SEM and TEM revealed no significant differences or damage in the surface morphology of intestinal microvilli among the groups, with the intestinal microvilli neatly arranged and closely packed. A statistical analysis of intestinal TEM microvillus height revealed no significant difference between the Y0 (46.38 ± 2.55 μm), Y3.0 (45.66 ± 3.37 μm), and Y12.0 (42.61 ± 2.69 μm) groups, demonstrating that dietary YL inclusion at levels of 0-12.0% did not significantly affect shrimp intestinal microvillus height (P > 0.05).
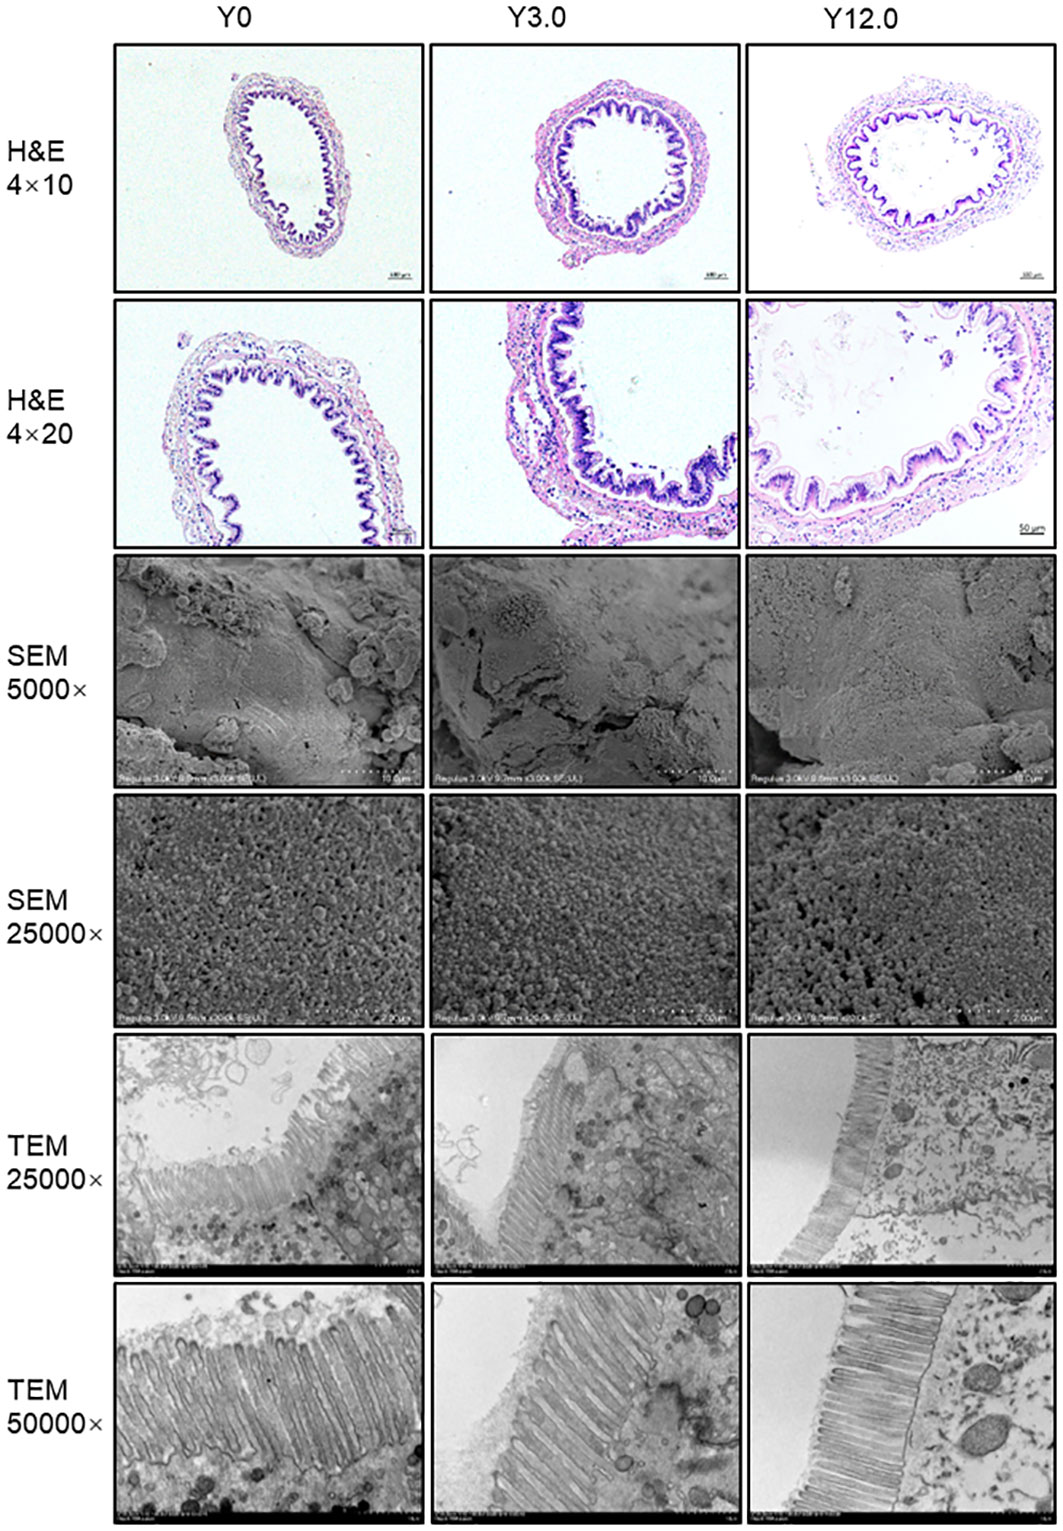
Figure 3 Intestinal histomorphology of shrimp fed Y0, Y3.0, and Y12.0 diets for 56 days. Upper panel: representative histomorphology of transverse sections of the midgut stained with hematoxylin and eosin (H & E). Middle panel: representative midgut ultrastructure determined using a scanning electron microscope (SEM). Lower panel: representative midgut ultrastructure determined using a transmission electron microscope (TEM).
The histological structure of the shrimp hepatopancreas, shown in Figure 4, indicated that all groups had visible and neatly organized structures, suggesting that dietary YL inclusion at levels of 0-12.0% did not led to significant damage to the histological structure of the shrimp hepatopancreas.
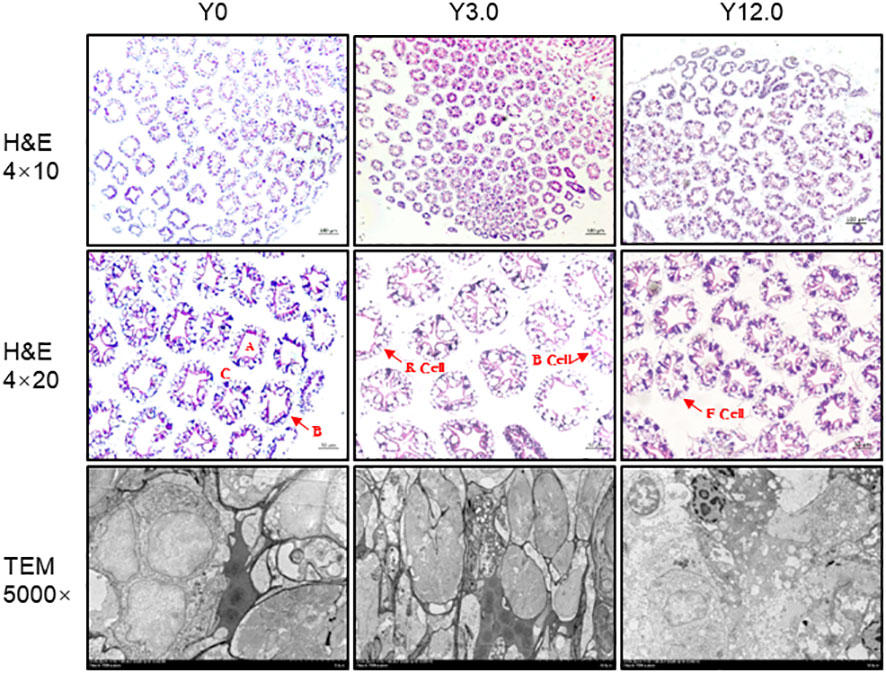
Figure 4 Hepatopancreas histomorphology of shrimp fed the Y0, Y3.0, and Y12.0 diets. Upper and middle panels: representative histomorphology of transverse sections of the hepatopancreas stained with hematoxylin and eosin (H & E). A: stellate lumen; B: basement membrane; C: hepatic microsomes; B cells: secretory cells; R cells: resorptive cells; F cells: fibroblasts. Lower panel: representative hepatopancreas ultrastructure determined using a transmission electron microscope (TEM).
3.8 Apparent digestibility coefficient analysis
The ADC for the test ingredient Yarrowia lipolytica, as displayed in Supplementary Tables S2–S4, showed that, compared to those in the Y0 group, there were no significant differences in the ADC of dry matter, crude protein, crude lipid, phosphorus, and amino acids in the YADC group (P > 0.05), although a decreasing trend was observed.
3.9 Principal component analysis and multidimensional correlation analysis
The PCA biplot (Figure 5) clearly differentiated the Y12.0 group from the Y0, Y1.5, Y3.0, and Y4.5 groups. The first principal component (PCA1) accounted for 39.67% of the dataset’s variance and was influenced predominantly by FCR, FI, PER, and PPV. The second principal component (PCA2), which explained 11.02% of the variance, primarily reflected variations in the whole-body ash content of the shrimp. The PCA results revealed a positive correlation between FI and FCR, and between PER and PPV, with these two sets of variables showing negative correlations with each other. This pattern aligned with the findings from the multidimensional correlation analysis.
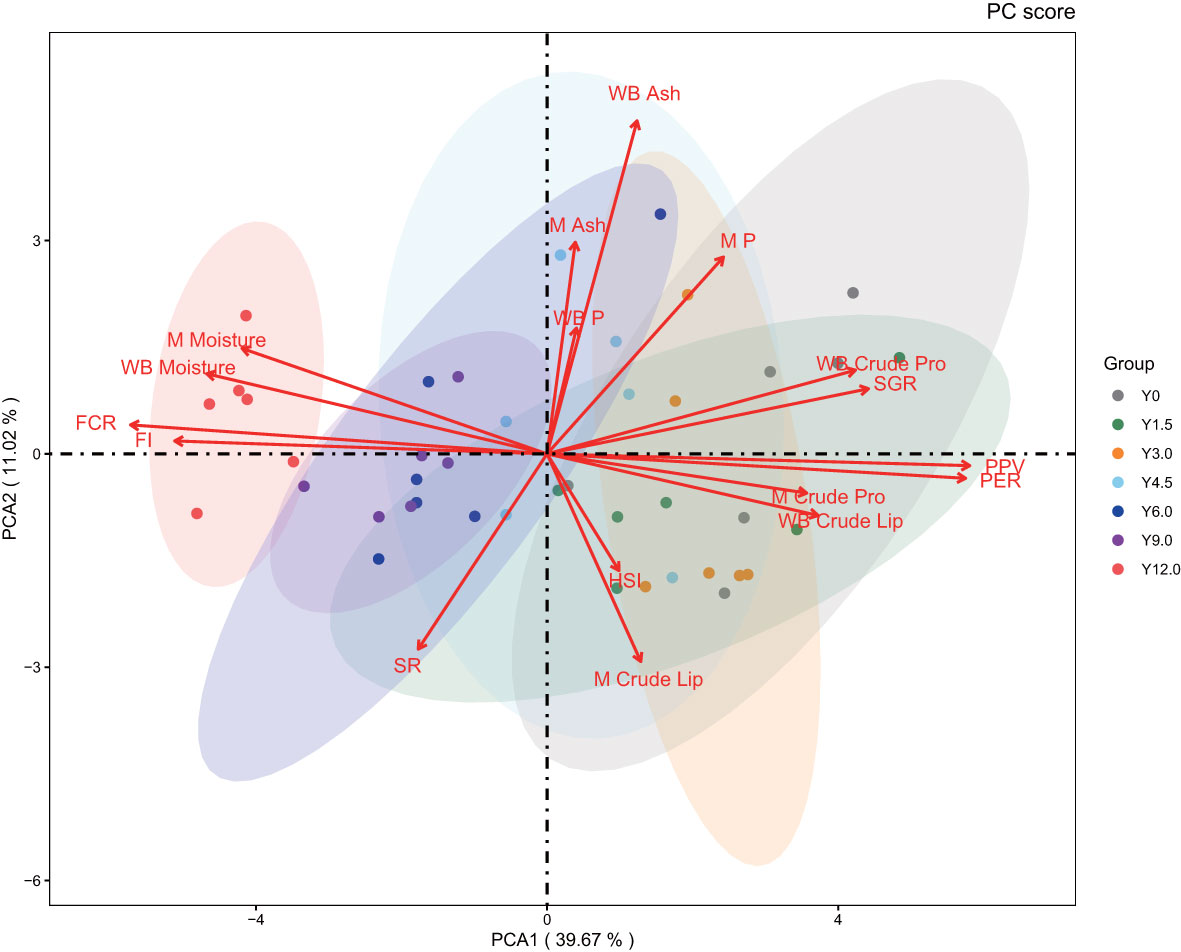
Figure 5 Principal component analysis. The 95% confidence intervals are marked by oval circles. The arrow denotes the original variable. The projection of the arrows on the coordinate axes shows the contribution of the original data to the principal component. The direction represents the correlation between the original variable and the principal component.
As illustrated in Figure 6, the multidimensional correlation analysis revealed that the SGR was significantly negatively correlated with FI, FCR, whole-body moisture, and muscle moisture content (P < 0.05). Conversely, the SGR was significantly positively correlated with the PER, PPV, whole-body crude lipid, and both whole-body and muscle crude protein contents (P < 0.05). Additionally, the FI and FCR were negatively correlated with whole-body crude protein, crude lipid, and muscle crude protein contents, while the PER and PPV exhibited significant positive correlations with these parameters (P < 0.05). FI and FCR were also positively correlated with whole-body and muscle moisture contents, whereas PER and PPV were negatively correlated with these moisture contents (P < 0.05). Significant negative correlations were observed between whole-body and muscle moisture contents, whole-body crude protein and crude lipid contents, while muscle phosphorus content was positively correlated with whole-body ash and phosphorus contents (P < 0.05). Moreover, physiological and biochemical parameters were significantly correlated with whole-body crude lipid content (Mantel’s r ≥ 0.2, P < 0.01), and digestive enzyme activities were significantly related to FCR, PER, and PPV (Mantel’s r < 0.2, P < 0.01), as well as with whole-body moisture and crude protein contents (Mantel’s r < 0.2, P < 0.05).
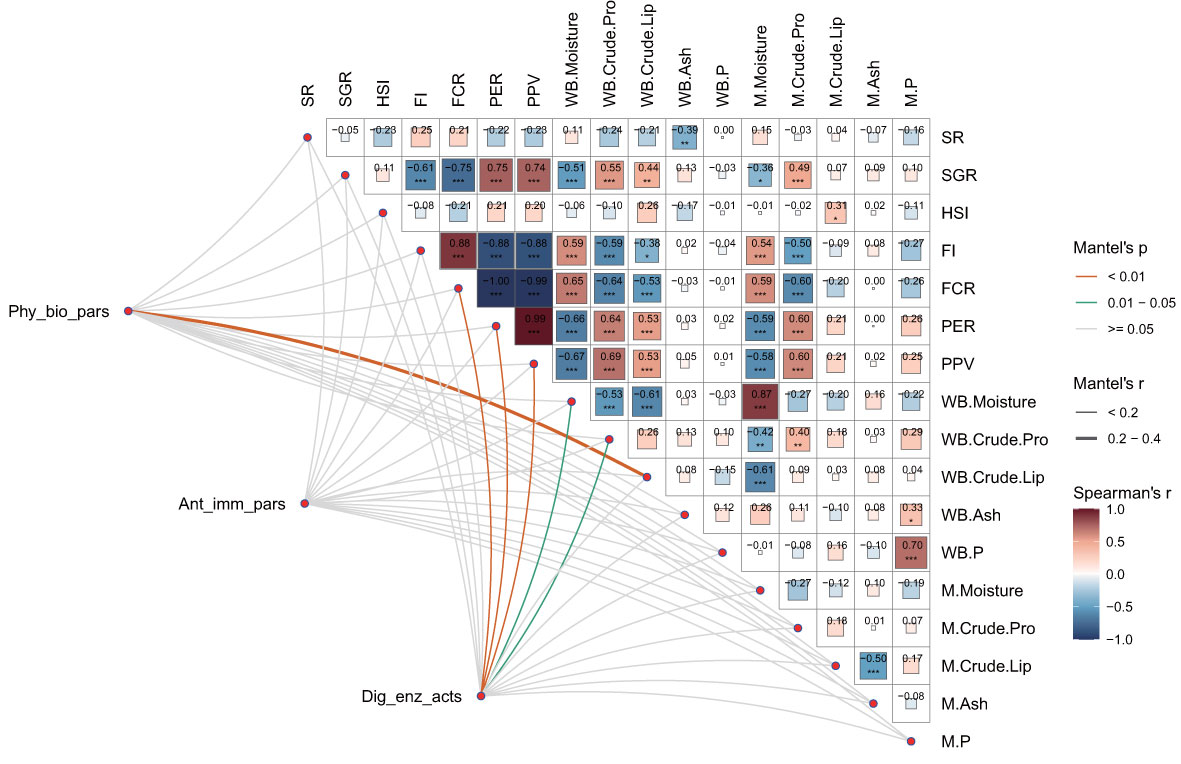
Figure 6 Multidimensional correlation analysis of physiological and biochemical parameters, antioxidant and immune parameters, and digestive enzyme activities with growth performance and nutritional parameters. Physiological and biochemical parameters (Phy_bio_pars), antioxidant and immune parameters (Ant_imm_pars), and digestive enzyme activities (Dig_enz_acts) were also evaluated. The growth performance parameters included the survival rate (SR), specific growth rate (SGR), hepatosomatic index (HSI), feed intake (FI), feed conversion ratio (FCR), protein efficiency ratio (PER), and protein productive value (PPV). The nutritional parameters included whole-body moisture, crude protein, crude lipids, ash, phosphorus (WB. Moisture, WB. Crude. Pro, WB. Crude. Lip, WB. Ash, WB. P); muscle moisture, crude protein, crude lipids, ash, and phosphorus (M. Moisture, M. Crude. Pro, M. Crude. Lip, M. Ash, M. P). This study conducted a pairwise comparison of growth performance and nutritional parameters. Pearson’s correlation coefficients are assigned a gradient color and the size of the corresponding color block. Additionally, Mantel’s tests were applied to assess the relationships between physiological and biochemical parameters, antioxidant and immune parameters, digestive enzyme activities, and specified parameters. For the relevant distance correlations, the edge width and color correspond to Mantel’s r statistic and the p statistic, respectively.
4 Discussion
To evaluate the potential of Yarrowia lipolytica (YL) as a protein source in shrimp diets, this study tested various YL levels (0-12.0%) as alternatives to fishmeal (FM) protein. The results indicated that optimal YL inclusion improved shrimp growth performance, lipid metabolism, and antioxidant capacity. This section discusses the effects of dietary YL on growth, metabolism, and immune function.
4.1 Effect of dietary YL on growth performance, feed efficiency, and the ADC
Optimal YL levels promoted growth performance, echoing findings in turkeys (Meleagris gallopavo) (Czech et al., 2020), piglets (Sus scrofa) (Czech et al., 2016, 2018), Atlantic salmon (Berge et al., 2013), Nile tilapia (Neuls et al., 2021), and Largemouth Bass (Micropterus salmoides) (Fei et al., 2022). The nutrient-rich composition of yeast, which contains β-glucan, mannan oligosaccharides (MOS), amino acids, and nucleotides, likely contributed to this enhancement in growth (Gamboa-Delgado and Márquez-Reyes, 2018; Jin et al., 2018; Patsios et al., 2020). However, higher YL inclusions above 6.0% resulted in decreased feed utilization due to the indigestible nature of some yeast nutrients, leading to a decrease in the protein efficiency ratio (PER) (Patsios et al., 2020). A cubic regression model pinpointed 2.68% as the optimal YL substitution level, which is equivalent to replacing 10.54% of the FM, aligning with Hertrampf and Piedad-Pascual’s (Hertrampf and Piedad-Pascual, 2003) suggested range for yeast inclusion in shrimp diets.
In addition, bacterial proteins produced using C1 gases (e.g. FeedKind® and RichMore) have been evaluated in aquatic animals. These studies illustrate their potential in replacing certain levels of FM in various species’ diets without negatively impacting growth performance (Biswas et al., 2020; Xu et al., 2021; Zhang et al., 2022). It is worth noting that dietary high RichMore levels can have adverse effects on their growth and immune function in Pacific white shrimp (Yao et al., 2022). This may be attributed to the insufficient supply of essential amino acids, fatty acids, and other functional substances, as well as the negative impact of elevated RichMore levels on protein synthesis and nutrient utilization (Jiang et al., 2021). Similar results were found in this study, elevated YL levels were found to reduce protein and lipid deposition in shrimp, especially at a 12.0% substitution level. Principal component analysis (PCA) revealed that the Y12.0 group was distinct from the other groups in terms of growth performance, feed utilization, and nutritional composition.
Moreover, YL did not adversely impact the activity of digestive enzymes or digestive tissue morphology. Increased hepatopancreatic trypsin activity was noted, potentially leading to enhanced intestinal trypsin activity, possibly due to yeast organic acids reducing digestive tract pH and thus boosting proteolytic enzyme activity (Lückstädt, 2008; Zhao et al., 2017). Additionally, YL maintains the integrity of the intestinal mucosa and hepatic structure, likely attributable to nucleotides and oligosaccharides in yeast facilitating the growth of intestinal cells and the synthesis of cell membranes (Uauy, 1994; Torrecillas et al., 2011a; Torrecillas et al., 2011b, 2013, 2014; Hossain et al., 2020). However, the limited digestibility of YL poses a challenge. The yeast cell wall restricts enzyme access to cellular contents, thereby limiting nutrient utilization (Yamada and Sgarbieri, 2005; Overland and Skrede, 2017). Disrupting the yeast cell wall, as shown to increase protein digestibility in rainbow trout (Rumsey et al., 1991), improving the ADC in shrimp diets (Zhao et al., 2017), and other processing methods (Hansen et al., 2021), are essential for enhancing the bioavailability of YL.
4.2 Effect of dietary YL on metabolism-related parameters
The inclusion of high dietary levels of YL improved lipid metabolism in shrimp, as evidenced by the significant reductions in serum triglyceride (TG) and total cholesterol (TC) contents. The serum biochemical parameters, known indicators of nutritional status and physiological conditions (Parrino et al., 2018; Burgos-Aceves et al., 2019), markedly decreased with increasing YL. Comparable effects on lipid profiles in turkeys and piglets were observed with 3.0% to 6.0% YL inclusion, decreasing TG, TC, and LDL-C levels. The production of bile salt hydrolase (BSH), which catalyzes bile salt hydrolysis, increases the excretion of endogenous cholesterol, thus regulating serum and hepatic cholesterol levels (Reis et al., 2017). Multivariate correlation analysis revealed a significant association between serum physiological and biochemical indices and whole-body crude lipid content, indicating enhanced blood lipid metabolism due to dietary YL.
4.3 Effect of dietary YL on nonspecific immunity
Dietary YL inclusion positively impacted nonspecific immunity by enhancing antioxidant capacity. Antioxidant enzymes such as catalase (CAT) and superoxide dismutase (SOD) play crucial roles in balancing oxidative and antioxidant status by eliminating excess reactive oxygen species (ROS) (Gao et al., 2014; Xu et al., 2018). Malondialdehyde (MDA), an indicator of lipid peroxidation, was used to assess oxidative damage (Del Rio et al., 2005). Dietary YL inclusion increased the total antioxidant capacity (T-AOC) in the serum, liver, and pancreas while reducing the MDA content. Dietary YL inclusion has been shown to promote antioxidant capacity and increase immune-related gene expression in Largemouth bass (Fei et al., 2022), Pacific red snapper (Lutjanus peru) (Alamillo et al., 2017; Reyes-Becerril et al., 2021), and shrimp (Licona-Jain et al., 2020; Liu et al., 2022). β-glucan in YL enhances the organism’s antioxidant capacity by scavenging free radicals (Kofuji et al., 2012; Nakashima et al., 2018), and MOS in YL binds pathogens in the gastrointestinal tract, restricting colonization, enhancing intestinal mucosa integrity, stimulating the body’s immune response, and contributing to the antioxidant process (Torrecillas et al., 2014; Spring et al., 2015). In addition, yeast is rich in components such as peptides, organic acids, and vitamins, all of which have been shown to enhance the antioxidative capacity (Suchner et al., 2000; Ringø et al., 2012). Therefore, dietary YL inclusion effectively improves antioxidant performance in shrimp by increasing their antioxidant capacity.
5 Conclusions
This study focused on assessing the efficacy of Yarrowia lipolytica (YL) as a protein source in shrimp feed through feeding trials and biochemical analyses. The following conclusions were drawn:
1. In this experiment, 22% FM content was incorporated in the control diet. The optimal inclusion level of YL for Pacific white shrimp was determined to be 2.68% based on growth performance, which accounted for 10.54% of the dietary FM content. A high YL content resulted in reduced feed utilization, as indicated by the increased feed conversion ratio and feed intake with a YL level above 6.0%, accounting for 23.6% of the dietary FM content.
2. This study highlighted the beneficial role of dietary YL in lipid metabolism. Specifically, the inclusion of YL in shrimp diets led to a significant reduction in serum triglyceride and total cholesterol levels.
3. The inclusion of YL in shrimp diets was associated with improved antioxidant capacity. This was evidenced by the increased total antioxidant capacity and reduced malondialdehyde content.
In conclusion, Yarrowia lipolytica has emerged as a promising alternative protein source for shrimp feed, offering benefits in terms of growth performance, digestive health, lipid metabolism, and antioxidant capacity.
Data availability statement
The original contributions presented in the study are included in the article/Supplementary Material. Further inquiries can be directed to the corresponding authors.
Ethics statement
The animal study was approved by Zhejiang Ocean University Committee on Ethics of Animal Experiments. The study was conducted in accordance with the local legislation and institutional requirements.
Author contributions
LZ: Writing – review & editing, Data curation, Formal analysis, Investigation, Writing – original draft. PZ: Data curation, Writing – review & editing. PT: Funding acquisition, Writing – review & editing. DX: Data curation, Writing – review & editing. LW: Data curation, Writing – review & editing. ZD: Data curation, Writing – review & editing. QS: Conceptualization, Funding acquisition, Supervision, Writing – review & editing.
Funding
The author(s) declare that financial support was received for the research, authorship, and/or publication of this article. This study was financial supported by “Pioneer” and “Leading Goose” R&D Program of Zhejiang (No: 2024C02012).
Acknowledgments
We thank Huanhuan Sang and Shipeng Ma from Zhejiang Ocean University for providing support with the feeding trials and sampling.
Conflict of interest
The authors declare that the research was conducted in the absence of any commercial or financial relationships that could be construed as a potential conflict of interest.
Publisher’s note
All claims expressed in this article are solely those of the authors and do not necessarily represent those of their affiliated organizations, or those of the publisher, the editors and the reviewers. Any product that may be evaluated in this article, or claim that may be made by its manufacturer, is not guaranteed or endorsed by the publisher.
Supplementary material
The Supplementary Material for this article can be found online at: https://www.frontiersin.org/articles/10.3389/fmars.2024.1370371/full#supplementary-material
References
Agboola J. O., Overland M., Skrede A., Hansen J. O. (2021). Yeast as major protein-rich ingredient in aquafeeds: a review of the implications for aquaculture production. Rev. Aquac. 13, 949–970. doi: 10.1111/raq.12507
Alamillo E., Reyes-Becerril M., Cuesta A., Angulo C. (2017). Marine yeast Yarrowia lipolytica improves the immune responses in Pacific red snapper (Lutjanus Peru) leukocytes. Fish Shellfish Immunol. 70, 48–56. doi: 10.1016/j.fsi.2017.08.036
AOAC (2005). Official methods of analysis of AOAC international. 18th ed (Arlington, VA, USA: Association of the Official Analytical Chemists).
Berge G. M., Hatlen B., Odom J. M., Ruyter B. (2013). Physical treatment of high EPA Yarrowia lipolytica biomass increases the availability of n-3 highly unsaturated fatty acids when fed to Atlantic salmon. Aquac. Nutr. 19, 110–121. doi: 10.1111/anu.2013.19.issue-s1
Biswas A., Takakuwa F., Yamada S., Matsuda A., Saville R. M., LeBlanc A., et al. (2020). Methanotroph (Methylococcus capsulatus, Bath) bacteria meal as an alternative protein source for Japanese yellowtail, Seriola quinqueradiata. Aquaculture 529, 735700. doi: 10.1016/j.aquaculture.2020.735700
Bob-Manuel F. G. (2014). A comparative study of the effect of yeast single cell protein on growth, feed utilization and condition factor of the African catfish Clarias gariepinus (Burchell) and tilapia, Oreochromis niloticus (Linnaeus) fingerlings. Afr. J. Agric. Res. 9, 2005–2011. doi: 10.5897/AJAR10.856
Burgos-Aceves M. A., Lionetti L., Faggio C. (2019). Multidisciplinary haematology as prognostic device in environmental and xenobiotic stress-induced response in fish. Sci. Total Environ. 670, 1170–1183. doi: 10.1016/j.scitotenv.2019.03.275
Carvalho M., Torrecillas S., Montero D., Sanmartin A., Fontanillas R., Farias A., et al. (2023). Insect and single-cell protein meals as replacers of fish meal in low fish meal and fish oil diets for gilthead sea bream (Sparus aurata) juveniles. Aquaculture 566, 739215. doi: 10.1016/j.aquaculture.2022.739215
Cheng Y., Li X., Wang L., Lu K., Song K., Ai Q., et al. (2021). Effects of dietary arginine levels on growth, immune function of physical barriers and serum parameters of spotted seabass (Lateolabrax maculatus) reared at different water temperatures. Aquaculture 541, 736812. doi: 10.1016/j.aquaculture.2021.736812
Czech A., Merska-Kazanowska M., Ognik K., Zieba G. (2020). Effect of the use of Yarrowia lipolytica or Saccharomyces cerevisiae yeast with a probiotic in the diet of Turkey hens on growth performance and gut histology. Ann. Anim. Sci. 20, 1047–1063. doi: 10.2478/aoas-2020-0017
Czech A., Smolczyk A., Grela E. R., Kiesz M. (2018). Effect of dietary supplementation with Yarrowia lipolytica or Saccharomyces cerevisiae yeast and probiotic additives on growth performance, basic nutrients digestibility and biochemical blood profile in piglets. J. Anim. Physiol. Anim. Nutr. 102, 1720–1730. doi: 10.1111/jpn.12987
Czech A., Smolczyk A., Ognik K., Kiesz M. (2016). Nutritional value of Yarrowia lipolytica yeast and its effect on growth performance indicators in piglets. Ann. Anim. Sci. 16, 1091–1100. doi: 10.1515/aoas-2016-0034
Del Rio D., Stewart A. J., Pellegrini N. (2005). A review of recent studies on malondialdehyde as toxic molecule and biological marker of oxidative stress. Nutr. Metab. Cardiovasc. Dis. 15, 316–328. doi: 10.1016/j.numecd.2005.05.003
Douxfils J., Fierro-Castro C., Mandiki S. N. M., Emile W., Tort L., Kestemont P. (2017). Dietary β-glucans differentially modulate immune and stress-related gene expression in lymphoid organs from healthy and Aeromonas hydrophila-infected rainbow trout (Oncorhynchus mykiss). Fish Shellfish Immunol. 63, 285–296. doi: 10.1016/j.fsi.2017.02.027
Easton M. D., Luszniak D., Von der G. E. (2002). Preliminary examination of contaminant loadings in farmed salmon, wild salmon and commercial salmon feed. Chemosphere 46, 1053–1074. doi: 10.1016/S0045-6535(01)00136-9
FAO (2022). The state of world fisheries and aquaculture 2022. Towards blue transformation. (Rome, Italy: Food and Agriculture Organization of the United Nations).
Fei H., Cheng Y., Zhang H. M., Yu X., Yi S. F., Huang M. M., et al. (2022). Effect of autolyzed Yarrowia lipolytica on the growth performance, antioxidant capacity, intestinal histology, microbiota, and transcriptome profile of juvenile Largemouth Bass (Micropterus salmoides). Int. J. Mol. Sci. 23, 10780. doi: 10.3390/ijms231810780
Gamboa-Delgado J., Márquez-Reyes J. M. (2018). Potential of microbial-derived nutrients for aquaculture development. Rev. Aquac. 10, 224–246. doi: 10.1111/raq.12157
Gao J., Koshio S., Wang W., Li Y., Huang S., Cao X. (2014). Effects of dietary phospholipid levels on growth performance, fatty acid composition and antioxidant responses of Dojo loach Misgurnus anguillicaudatus larvae. Aquaculture 426, 304–309. doi: 10.1016/j.aquaculture.2014.02.022
Gatlin D. M., Barrows F. T., Brown P., Dabrowski K., Gaylord T. G., Hardy R. W., et al. (2007). Expanding the utilization of sustainable plant products in aquafeeds: a review. Aquac. Res. 38, 551–579. doi: 10.1111/j.1365-2109.2007.01704.x
Glencross B. D. (2020). A feed is still only as good as its ingredients: an update on the nutritional research strategies for the optimal evaluation of ingredients for aquaculture feeds. Aquac. Nutr. 26, 1871–1883. doi: 10.1111/anu.13138
Glencross B. D., Huyben D., Schrama J. W. (2020). The application of single-cell ingredients in aquaculture feeds - a review. Fishes 5, 22. doi: 10.3390/fishes5030022
Gupta S. K., Fotedar R., Foysal M. J., Priyam M., Siddik M. A. B., Chaklader M. R., et al. (2020). Impact of varied combinatorial mixture of non-fishmeal ingredients on growth, metabolism, immunity and gut microbiota of Lates calcarifer (Bloch 1790) fry. Sci. Rep. 10, 17091. doi: 10.1038/s41598-020-72726-9
Hansen J.Ø., Lagos L., Lei P., Reveco-Urzua F. E., Morales-Lange B., Hansen L. D., et al. (2021). Down-stream processing of baker's yeast (Saccharomyces cerevisiae) – effect on nutrient digestibility and immune response in Atlantic salmon (Salmo salar). Aquaculture 530, 735707. doi: 10.1016/j.aquaculture.2020.735707
Hatlen B., Berge G. M., Odom J. M., Mundheim H., Ruyter B. (2012). Growth performance, feed utilisation and fatty acid deposition in Atlantic salmon, Salmo salar L., fed graded levels of high-lipid/high-EPA Yarrowia lipolytica biomass. Aquaculture 364, 39–47. doi: 10.1016/j.aquaculture.2012.07.005
Hertrampf J. W., Piedad-Pascual F. (2003). Handbook on ingredients for aquaculture feeds. (Dordrecht, the Netherlands: Kluwer Academic Publishers).
Hossain M. S., Koshio S., Kestemont P. (2020). Recent advances of nucleotide nutrition research in aquaculture: a review. Rev. Aquac. 12, 1028–1053. doi: 10.1111/raq.12370
Hu P., Chakraborty S., Kumar A., Woolston B., Liu H., Emerson D., et al. (2016). Integrated bioprocess for conversion of gaseous substrates to liquids. Proc. Natl. Acad. Sci. U.S.A. 113, 3773–3778. doi: 10.1073/pnas.1516867113
Hua K., Cobcroft J. M., Cole A., Condon K., Jerry D. R., Mangott A., et al. (2019). The future of aquatic protein: implications for protein sources in aquaculture diets. One Earth 1, 316–329. doi: 10.1016/j.oneear.2019.10.018
Huyben D., Nyman A., Vidakovic A., Passoth V., Moccia R., Kiessling A., et al. (2017). Effects of dietary inclusion of the yeasts Saccharomyces cerevisiae and Wickerhamomyces anomalus on gut microbiota of rainbow trout. Aquaculture 473, 528–537. doi: 10.1016/j.aquaculture.2017.03.024
Ji R., Wang Z., He J., Masagounder K., Xu W., Mai K., et al. (2021). Effects of DL-methionyl-DL-methionine supplementation on growth performance, immune and antioxidative responses of white leg shrimp (Litopenaeus vannamei) fed low fishmeal diet. Aquac. Rep. 21, 100785. doi: 10.1016/j.aqrep.2021.100785
Jiang X., Yao W., Yang H., Tan S., Leng X., Li X. (2021). Dietary effects of Clostridium autoethanogenum protein substituting fish meal on growth, intestinal histology and immunity of Pacific white shrimp (Litopenaeus vannamei) based on transcriptome analysis. Fish Shellfish Immunol. 119, 635–644. doi: 10.1016/j.fsi.2021.10.005
Jin M., Xiong J., Zhou Q.-C., Yuan Y., Wang X.-X., Sun P. (2018). Dietary yeast hydrolysate and brewer's yeast supplementation could enhance growth performance, innate immunity capacity and ammonia nitrogen stress resistance ability of Pacific white shrimp (Litopenaeus vannamei). Fish Shellfish Immunol. 82, 121–129. doi: 10.1016/j.fsi.2018.08.020
Kofuji K., Aoki A., Tsubaki K., Konishi M., Isobe T., Murata Y. (2012). Antioxidant activity of β-glucan. ISRN Pharm. 2012, 5. doi: 10.5402/2012/125864
Licona-Jain A., Campa-Cordova A., Luna-Gonzalez A., Racotta I. S., Tello M., Angulo C. (2020). Dietary supplementation of marine yeast Yarrowia lipolytica modulates immune response in Litopenaeus vannamei. Fish Shellfish Immunol. 105, 469–476. doi: 10.1016/j.fsi.2020.07.043
Liu Y. C., Zheng L., Xu B. Y., Sagada G., Zhang J. Z., Shao Q. J. (2022). Effects of diets with varying astaxanthin from Yarrowia lipolytica levels on the growth, feed utilization, metabolic enzymes activities, antioxidative status and serum biochemical parameters of Litopenaeus vannamei. Fishes 7, 352. doi: 10.3390/fishes7060352
Lückstädt C. (2008). The use of acidifiers in fish nutrition. CAB Rev. Perspect. Agric. Vet. 3, 1–9. doi: 10.1079/PAVSNNR20083044
Luthada-Raswiswi R., Mukaratirwa S., O'Brien G. (2021). Animal protein sources as a substitute for fishmeal in aquaculture diets: a systematic review and meta-analysis. Appl. Sci. 11, 3854. doi: 10.3390/app11093854
Mamaev D., Zvyagilskaya R. (2021). Yarrowia lipolytica: a multitalented yeast species of ecological significance. FEMS Yeast Res. 21, foab008. doi: 10.1093/femsyr/foab008
Meena D., Das P., Kumar S., Mandal S., Prusty A., Singh S., et al. (2013). Beta-glucan: an ideal immunostimulant in aquaculture (a review). Fish Physiol. Biochem. 39, 431–457. doi: 10.1007/s10695-012-9710-5
Mohan K., Rajan D. K., Muralisankar T., Ganesan A. R., Sathishkumar P., Revathi N. (2022). Use of black soldier fly (Hermetia illucens L.) larvae meal in aquafeeds for a sustainable aquaculture industry: a review of past and future needs. Aquaculture 553, 738095. doi: 10.1016/j.aquaculture.2022.738095
Nakashima A., Yamada K., Iwata O., Sugimoto R., Atsuji K., Ogawa T., et al. (2018). β-Glucan in foods and its physiological functions. J. Nutr. Sci. Vitaminol. 64, 8–17. doi: 10.3177/jnsv.64.8
Naylor R. L., Hardy R. W., Buschmann A. H., Bush S. R., Cao L., Klinger D. H., et al. (2021). A 20-year retrospective review of global aquaculture. Nature 591, 551–55+. doi: 10.1038/s41586-021-03308-6
Neuls L., de Souza V. J., Romao S., Bitencourt T. B., Raupp Ramos C. J., Garcia Parra J. E., et al. (2021). Immunomodulatory effects of Yarrowia lipolytica as food additive in the diet of Nile tilapia. Fish Shellfish Immunol. 119, 272–279. doi: 10.1016/j.fsi.2021.10.011
NRC (2011). Nutrient requirements of fish and shrimp (Washington DC. USA: The National Academies Press), 376.
Oliva-Teles A., Enes P., Peres H. (2015). “Replacing fishmeal and fish oil in industrial aquafeeds for carnivorous fish,” in Feed and feeding practices in aquaculture (Woodhead Publishing Limited, Waltham, USA), 203–233. doi: 10.1016/B978-0-08-100506-4.00008-8
Oliva-Teles A., Guedes M. J., Vachot C., Kaushik S. J. (2006). The effect of nucleic acids on growth, ureagenesis and nitrogen excretion of gilthead sea bream Sparus aurata juveniles. Aquaculture 253, 608–617. doi: 10.1016/j.aquaculture.2005.09.010
Øverland M., Karlsson A., Mydland L. T., Romarheim O. H., Skrede A. (2013). Evaluation of Candida utilis, Kluyveromyces marxianus and Saccharomyces cerevisiae yeasts as protein sources in diets for Atlantic salmon (Salmo salar). Aquaculture 402, 1–7. doi: 10.1016/j.aquaculture.2013.03.016
Overland M., Skrede A. (2017). Yeast derived from lignocellulosic biomass as a sustainable feed resource for use in aquaculture. J. Sci. Food Agr. 97, 733–742. doi: 10.1002/jsfa.8007
Parrino V., Cappello T., Costa G., Cannava C., Sanfilippo M., Fazio F., et al. (2018). Comparative study of haematology of two teleost fish (Mugil cephalus and Carassius auratus) from different environments and feeding habits. Eur. Zool. J. 85, 194–200. doi: 10.1080/24750263.2018.1460694
Patsios S. I., Dedousi A., Sossidou E. N., Zdragas A. (2020). Sustainable animal feed protein through the cultivation of Yarrowia Lipolytica on agro-industrial wastes and by-products. Sustainability 12, 1398. doi: 10.3390/su12041398
Penn M. H., Bendiksen E.Å., Campbell P., Krogdahl Å. (2011). High level of dietary pea protein concentrate induces enteropathy in Atlantic salmon (Salmo salar L.). Aquaculture 310, 267–273. doi: 10.1016/j.aquaculture.2010.10.040
Reis S. A., Conceicao L. L., Rosa D. D., Siqueira N. P., Peluzio M. C. G. (2017). Mechanisms responsible for the hypocholesterolaemic effect of regular consumption of probiotics. Nutr. Res. Rev. 30, 36–49. doi: 10.1017/S0954422416000226
Reyes-Becerril M., Alamillo E., Angulo C. (2021). Probiotic and immunomodulatory activity of marine yeast Yarrowia lipolytica strains and response against Vibrio parahaemolyticus in fish. Probiotics Antimicrob. Proteins 13, 1292–1305. doi: 10.1007/s12602-021-09769-5
Ringø E., Olsen R. E., Vecino J. G., Wadsworth S., Song S. (2012). Use of immunostimulants and nucleotides in aquaculture: a review. J. Mar. Sci. Res. Dev. 2, 104. doi: 10.4172/2155-9910.1000104
Rumsey G. L., Hughes S. G., Smith R. R., Kinsella J. E., Shetty K. J. (1991). Digestibility and energy values of intact, disrupted and extracts from brewer's dried yeast fed to rainbow trout (Oncorhynchus mykiss). Anim. Feed Sci. Tech. 33, 185–193. doi: 10.1016/0377-8401(91)90059-2
Sánchez-Muros M. J., Renteria P., Vizcaino A., Barroso F. G. (2020). Innovative protein sources in shrimp (Litopenaeus vannamei)feeding. Rev. Aquac. 12, 186–203. doi: 10.1111/raq.12312
Sharif M., Zafar M. H., Aqib A. I., Saeed M., Farag M. R., Alagawany M. (2021). Single cell protein: sources, mechanism of production, nutritional value and its uses in aquaculture nutrition. Aquaculture 531, 30. doi: 10.1016/j.aquaculture.2020.735885
Shurson G. C. (2018). Yeast and yeast derivatives in feed additives and ingredients: sources, characteristics, animal responses, and quantification methods. Anim. Feed Sci. Tech. 235, 60–76. doi: 10.1016/j.anifeedsci.2017.11.010
Spring P., Wenk C., Connolly A., Kiers A. (2015). A review of 733 published trials on Bio-Mos®, a mannan oligosaccharide, and Actigen®, a second generation mannose rich fraction, on farm and companion animals. J. Appl. Anim. Nutr. 3, e8. doi: 10.1017/jan.2015.6
Suchner U., Kuhn K., Fürst P. (2000). The scientific basis of immunonutrition. Proc. Nutr. Soc 59, 553–563. doi: 10.1017/S0029665100000793
Tacon A. G. J., Metian M. (2015). Feed matters: satisfying the feed demand of aquaculture. Rev. Fish. Sci. Aquac. 23, 1–10. doi: 10.1080/23308249.2014.987209
Tan P., Zhang P., Zhang L., Zhu W., Wang L., Chen R., et al. (2022a). Effects of soybean lecithin on growth performance, intestine morphology, and liver tissue metabolism in Rock Bream (Oplegnathus fasciatus) larvae. Front. Mar. Sci. 9. doi: 10.3389/fmars.2022.942259
Tan P., Zhu W., Zhang P., Wang L., Chen R., Xu D. (2022b). Dietary soybean lecithin inclusion promotes growth, development, and intestinal morphology of yellow drum (Nibea albiflora) larvae. Aquaculture 559, 15. doi: 10.1016/j.aquaculture.2022.738446
Torrecillas S., Makol A., Benítez-Santana T., Caballero M. J., Montero D., Sweetman J., et al. (2011a). Reduced gut bacterial translocation in European sea bass (Dicentrarchus labrax) fed mannan oligosaccharides (MOS). Fish Shellfish Immunol. 30, 674–681. doi: 10.1016/j.fsi.2010.12.020
Torrecillas S., Makol A., Betancor M. B., Montero D., Caballero M. J., Sweetman J., et al. (2013). Enhanced intestinal epithelial barrier health status on European sea bass (Dicentrarchus labrax) fed mannan oligosaccharides. Fish Shellfish Immunol. 34, 1485–1495. doi: 10.1016/j.fsi.2013.03.351
Torrecillas S., Makol A., Caballero M. J., Montero D., Ginés R., Sweetman J., et al. (2011b). Improved feed utilization, intestinal mucus production and immune parameters in sea bass (Dicentrarchus labrax) fed mannan oligosaccharides (MOS). Aquac. Nutr. 17, 223–233. doi: 10.1111/anu.2011.17.issue-2
Torrecillas S., Montero D., Izquierdo M. (2014). Improved health and growth of fish fed mannan oligosaccharides: potential mode of action. Fish Shellfish Immunol. 36, 525–544. doi: 10.1016/j.fsi.2013.12.029
Turck D., Castenmiller J., de Henauw S., Hirsch-Ernst K. I., Kearney J., Maciuk A., et al. (2019). Safety of Yarrowia lipolytica yeast biomass as a novel food pursuant to regulation (EU) 2015/2283. EFSA J. 17, e05594. doi: 10.2903/j.efsa.2022.7450
Uauy R. (1994). Nonimmune system responses to dietary nucleotides. J. Nutr. 124, S157–S159. doi: 10.1093/jn/124.suppl_1.157S
Wang J., Chen L., Xu J., Ma S., Liang X., Wei Z., et al. (2023). C1 gas protein: a potential protein substitute for advancing aquaculture sustainability. Rev. Aquac. 15, 1179–1197. doi: 10.1111/raq.12707
Xu B., Liu Y., Chen K., Wang L., Sagada G., Tegomo A. F., et al. (2021). Evaluation of methanotroph (Methylococcus capsulatus, Bath) bacteria meal (FeedKind®) as an alternative protein source for juvenile black sea bream, Acanthopagrus schlegelii. Front. Mar. Sci. 8. doi: 10.3389/fmars.2021.778301
Xu Z., Regenstein J. M., Xie D., Lu W., Ren X., Yuan J., et al. (2018). The oxidative stress and antioxidant responses of Litopenaeus vannamei to low temperature and air exposure. Fish Shellfish Immunol. 72, 564–571. doi: 10.1016/j.fsi.2017.11.016
Yamada E. A., Sgarbieri V. C. (2005). Yeast (Saccharomyces cerevisiae) protein concentrate: preparation, chemical composition, and nutritional and functional properties. J. Agr. Food Chem. 53, 3931–3936. doi: 10.1021/jf0400821
Yao W., Yang P., Zhang X., Xu X., Zhang C., Li X., et al. (2022). Effects of replacing dietary fish meal with Clostridium autoethanogenum protein on growth and flesh quality of Pacific white shrimp (Litopenaeus vannamei). Aquaculture 549, 737770. doi: 10.1016/j.aquaculture.2021.737770
Yossa R., Verdegem M. (2015). Misuse of multiple comparison tests and underuse of contrast procedures in aquaculture publications. Aquaculture 437, 344–350. doi: 10.1016/j.aquaculture.2014.12.023
Zhang Q., Liang H., Longshaw M., Wang J., Ge X., Zhu J., et al. (2022). Effects of replacing fishmeal with methanotroph (Methylococcus capsulatus, Bath) bacteria meal (FeedKind®) on growth and intestinal health status of juvenile largemouth bass (Micropterus salmoides). Fish Shellfish Immunol. 122, 298–305. doi: 10.1016/j.fsi.2022.02.008
Zhang L., Tan P., Zhang P., Chen R., Wang L., Xu D. (2023). A comparative study of dietary lipid sources on growth performance, body composition, fillet quality, and nutrient retention in juvenile yellow drum (Nibea albiflora). Aquaculture 574, 739630. doi: 10.1016/j.aquaculture.2023.739630
Keywords: Yarrowia lipolytica, Litopenaeus vannamei, growth performance, metabolism, antioxidant capacity
Citation: Zhang L, Zhang P, Tan P, Xu D, Wang L, Ding Z and Shao Q (2024) Yarrowia lipolytica as a promising protein source for Pacific white shrimp (Litopenaeus vannamei) diet: impact on growth performance, metabolism, antioxidant capacity, and apparent digestibility. Front. Mar. Sci. 11:1370371. doi: 10.3389/fmars.2024.1370371
Received: 14 January 2024; Accepted: 19 February 2024;
Published: 12 March 2024.
Edited by:
Lei Wang, Anhui Normal University, ChinaCopyright © 2024 Zhang, Zhang, Tan, Xu, Wang, Ding and Shao. This is an open-access article distributed under the terms of the Creative Commons Attribution License (CC BY). The use, distribution or reproduction in other forums is permitted, provided the original author(s) and the copyright owner(s) are credited and that the original publication in this journal is cited, in accordance with accepted academic practice. No use, distribution or reproduction is permitted which does not comply with these terms.
*Correspondence: Peng Tan, dGFucGVuZ0B6am91LmVkdS5jbg==; Qingjun Shao, cWpzaGFvQHpqdS5lZHUuY24=