 Qi Liu
 Xiang Zhao
 Yinquan Qu
 Yiting Wang
 Xingle Guo3
 Wenyu Li
 Tianxiang Gao
 Ying Qiao
- 1Wuhan Onemore-tech Co., Ltd, Wuhan, China
- 2The Key Laboratory of Mariculture, Ocean University of China, Ministry of Education, Qingdao, China
- 3Fisheries College, Zhejiang Ocean University, Zhoushan, China
- 4Key Laboratory of Tropical Marine Ecosystem and Bioresource, Fourth Institute of Oceanography, Ministry of Natural Resources, Beihai, China
The construction of high-quality genomes is fundamental for molecular studies of species. Currently, there are no published genome sequences within the Uranoscopidae family, and research on the genomic characteristics of this family is lacking. In this study, genomic analyses of seven species from the Uranoscopidae family which captured from the southeastern coast of China were conducted using next-generation sequencing technology. The results revealed that the genomic characteristics of the seven species are relatively similar. The genome sizes of the seven Uranoscopidae species ranged from 536.00 Mb to 652.49 Mb, with repeat sequence proportions between 20.09% and 36.64%, and heterozygosity levels ranging from 0.41% to 0.88%. The assembled draft genomes exhibited GC contents of these species ranging from approximately 42.14% to 43.53%. Furthermore, the mitochondrial sequences for the seven species were assembled, with sizes ranging from 14,966 to 18,446 bp. The evolutionary relationships between different species were depicted through the mapping of conserved genes, whole-genome variances and mitochondrial genome sequences. Besides, the historical effective population sizes of all species experienced rapid expansion after the Last Interglacial Period, with three species undergoing bottleneck effects. In conclusion, this study provides a reference for the subsequent construction of high-quality genomes for species within the Uranoscopidae family and offers a rich data resource for further evolutionary research.
Introduction
The Uranoscopidae family, comprising about 59 species across 7 genera, belongs to Perciformes, Trachinoidei (Vilasri, 2013; Froese and Pauly, 2023). Uranoscopidae inhabits areas ranging from coastal regions to the deep sea, widely distributed in tropical and temperate coastal waters globally (Gomon et al., 2008). Seven Uranoscopidae species have been reported in China, namely Uranoscopus chinensis, U. tosae, U. oligolepis, U. japonicus, U. bicinctus, Xenocephalus elongatus, and Ichthyscopus lebeck (Chen and Zhang, 2016; Liu et al., 2016a). However, recent studies have raised controversies regarding the classification and identification of Uranoscopidae species (Vilasri et al., 2019; Prokofiev, 2021). Notably, there is a lack of specialized scholars conducting comprehensive studies on Uranoscopidae, particularly in the realm of molecular phylogeny.
Furthermore, certain groups, such as Champsodontidae in the suborder Trachinoidei, exhibit conflicting outcomes in molecular phylogenetic analyses across different studies. In different molecular phylogenetic studies, it has been considered to be related to Ophidiidae (Smith and Wheeler, 2004), Ambassidae (Smith and Craig, 2007), Dicentrarchus labrax + Siganus vulpinus and Priacanthus hamrur (Lautredou et al., 2013), Labriformes (Thacker et al., 2015; Mirande, 2017) and the family Creediidae + Percophidae (Betancur et al., 2017). Additionally, phylogenetic trees based on single or minority gene sequences often yield inconclusive results or fail to provide strong support for certain branches (Delsuc et al., 2005).
Since the advent of molecular sequencing technology, molecular sequences have become instrumental in phylogenetic analysis. Over the past few decades, scholars specializing in classification and evolution have conducted numerous molecular phylogenetic studies, primarily relying on single or a few gene sequences (Springer et al., 1997; Purkhold et al., 2000; Klicka et al., 2005; Thacker et al., 2015). However, the presence of horizontal gene transfer, parallel homologous genes, and variations in gene evolution rates between groups raises concerns that phylogenetic trees reconstructed from single or limited gene sequences may not accurately depict the true evolutionary relationships among species (Doolittle and Logsdon, 1998; Degnan and Rosenberg, 2006; Nakhleh, 2013).
With the advancement of sequencing technology and the continual reduction in costs, whole-genome sequencing has become a standard approach in biological research. The presence of repeat sequences and genome heterozygosity significantly influences genome assembly, with variations observed across different species. In cases where reference genomes are absent, a preliminary examination of genome characteristics, known as genome survey analysis, is often essential before embarking on whole-genome sequencing (Xiong et al., 2021). This analysis enables the prediction of genome size, repeat ratio, heterozygous ratio, and GC content, guiding the formulation of the sequencing and assembly strategy. Additionally, genome survey analysis aids in the identification of genome-wide short sequence repeat sequences (SSR), with wide applications in population genetic studies (Xiong et al., 2021). In recent years, a substantial number of fish genome sequencing projects have been undertaken. International scientists have conducted genome sequencing analyses of various fish species, including zebrafish Danio rerio (Howe et al., 2013), Nile tilapia (Brawand et al., 2014), rainbow trout Oncorhynchus mykiss (Berthelot et al., 2014) and channel catfish Ictalurus punctatus (Liu et al., 2016b). These efforts have yielded abundant information, laying the foundation for further genetic studies.
The phylogeny of Uranoscopidae fish presents a complex and uncertain scenario. Phylogenetic results based on morphological characters diverge significantly from those derived from molecular data. Morphological phylogenetic analysis strongly supports the notion that Uranoscopidae shares the closest relationship with the Trachinidae family (Pietsch, 1989; Imamura and Yabe, 2002; Schwarzhans, 2019), followed by the Ammodytidae family. Conversely, molecular phylogeny analysis reveals Uranoscopidae and Trachinidae as distantly related, forming multi-source groups. Uranoscopidae, alongside Ammodytidae, Cheimarrichthyidae, Pinguipedidae, and Leptoscopidae, is considered a monophyletic group with close phylogenetic ties. However, the interfamily relationships vary across different molecular phylogenetic analyses (Chen et al., 2003; Dettai and Lecointre, 2004; Smith and Wheeler, 2004; Dettai and Lecointre, 2005; Smith and Wheeler, 2006; Smith and Craig, 2007; Dettaï and Lecointre, 2008; Li et al., 2009; Lautredou et al., 2013; Near et al., 2015; Thacker et al., 2015; Betancur et al., 2017). To address this complexity, our study conducted a genome survey analysis of seven Uranoscopidae species in China, identifying microsatellite motifs. Mitochondrial genome data was then employed for phylogenetic analysis to determine their relative positions. The primary objective of this study is to elucidate the genomic characteristics of the Uranoscopidae family. This marks the inaugural phase of our investigation into the genetic composition and evolutionary dynamics within this fish lineage. Moving forward, we intend to integrate of third-generation sequencing techniques and Hi-C technology to construct golden reference genomes for this family.
Materials and methods
Sample collection, DNA extraction and genome sequencing
Seven Uranoscopidae species along the coast of China were collected (Table 1, Figure 1). All samples were cryopreserved and transported to the Marine Fishery Resource and Biodiversity Laboratory of Zhejiang Ocean University. Preliminary morphological identification was conducted following the methods outlined by Chen et al (Kawai et al., 2003; Chen and Zhang, 2016; Wu and Zhong, 2021). Approximately 1 g of muscle tissue was extracted from each sample for DNA extraction. All animal specimens were collected in compliance with legal regulations and adhered to the Animal Care and Use Ethics policies of Zhejiang Ocean University. Every effort was made to minimize invasiveness during the collection process.
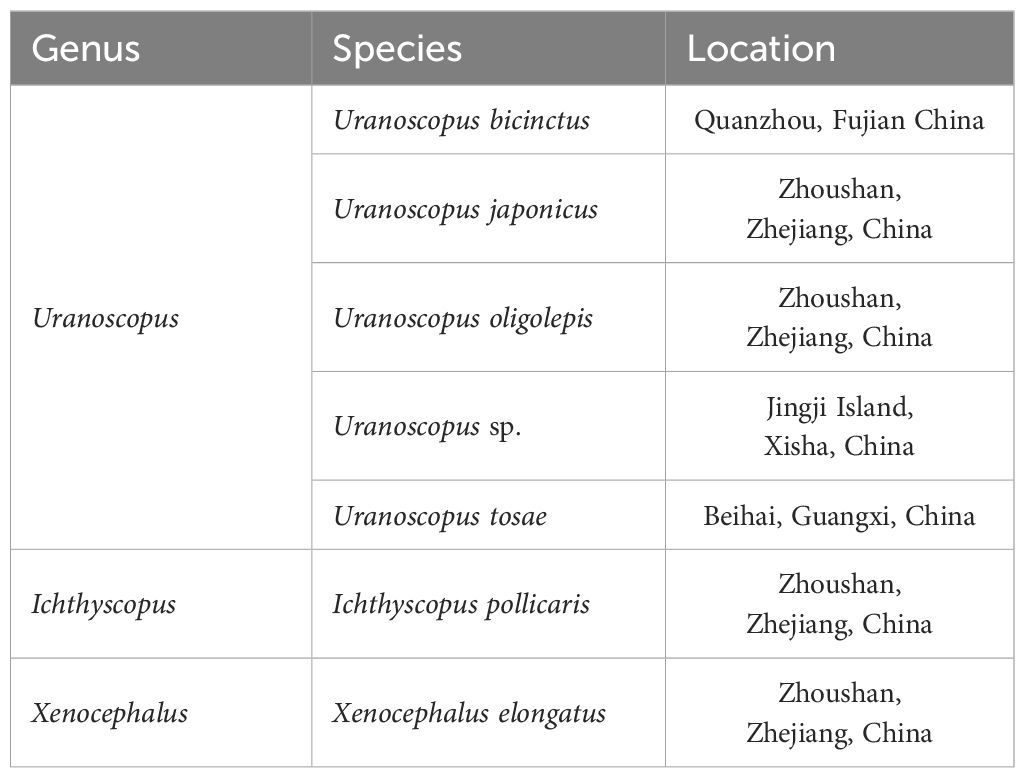
Table 1 Material information of seven fishes in this study.
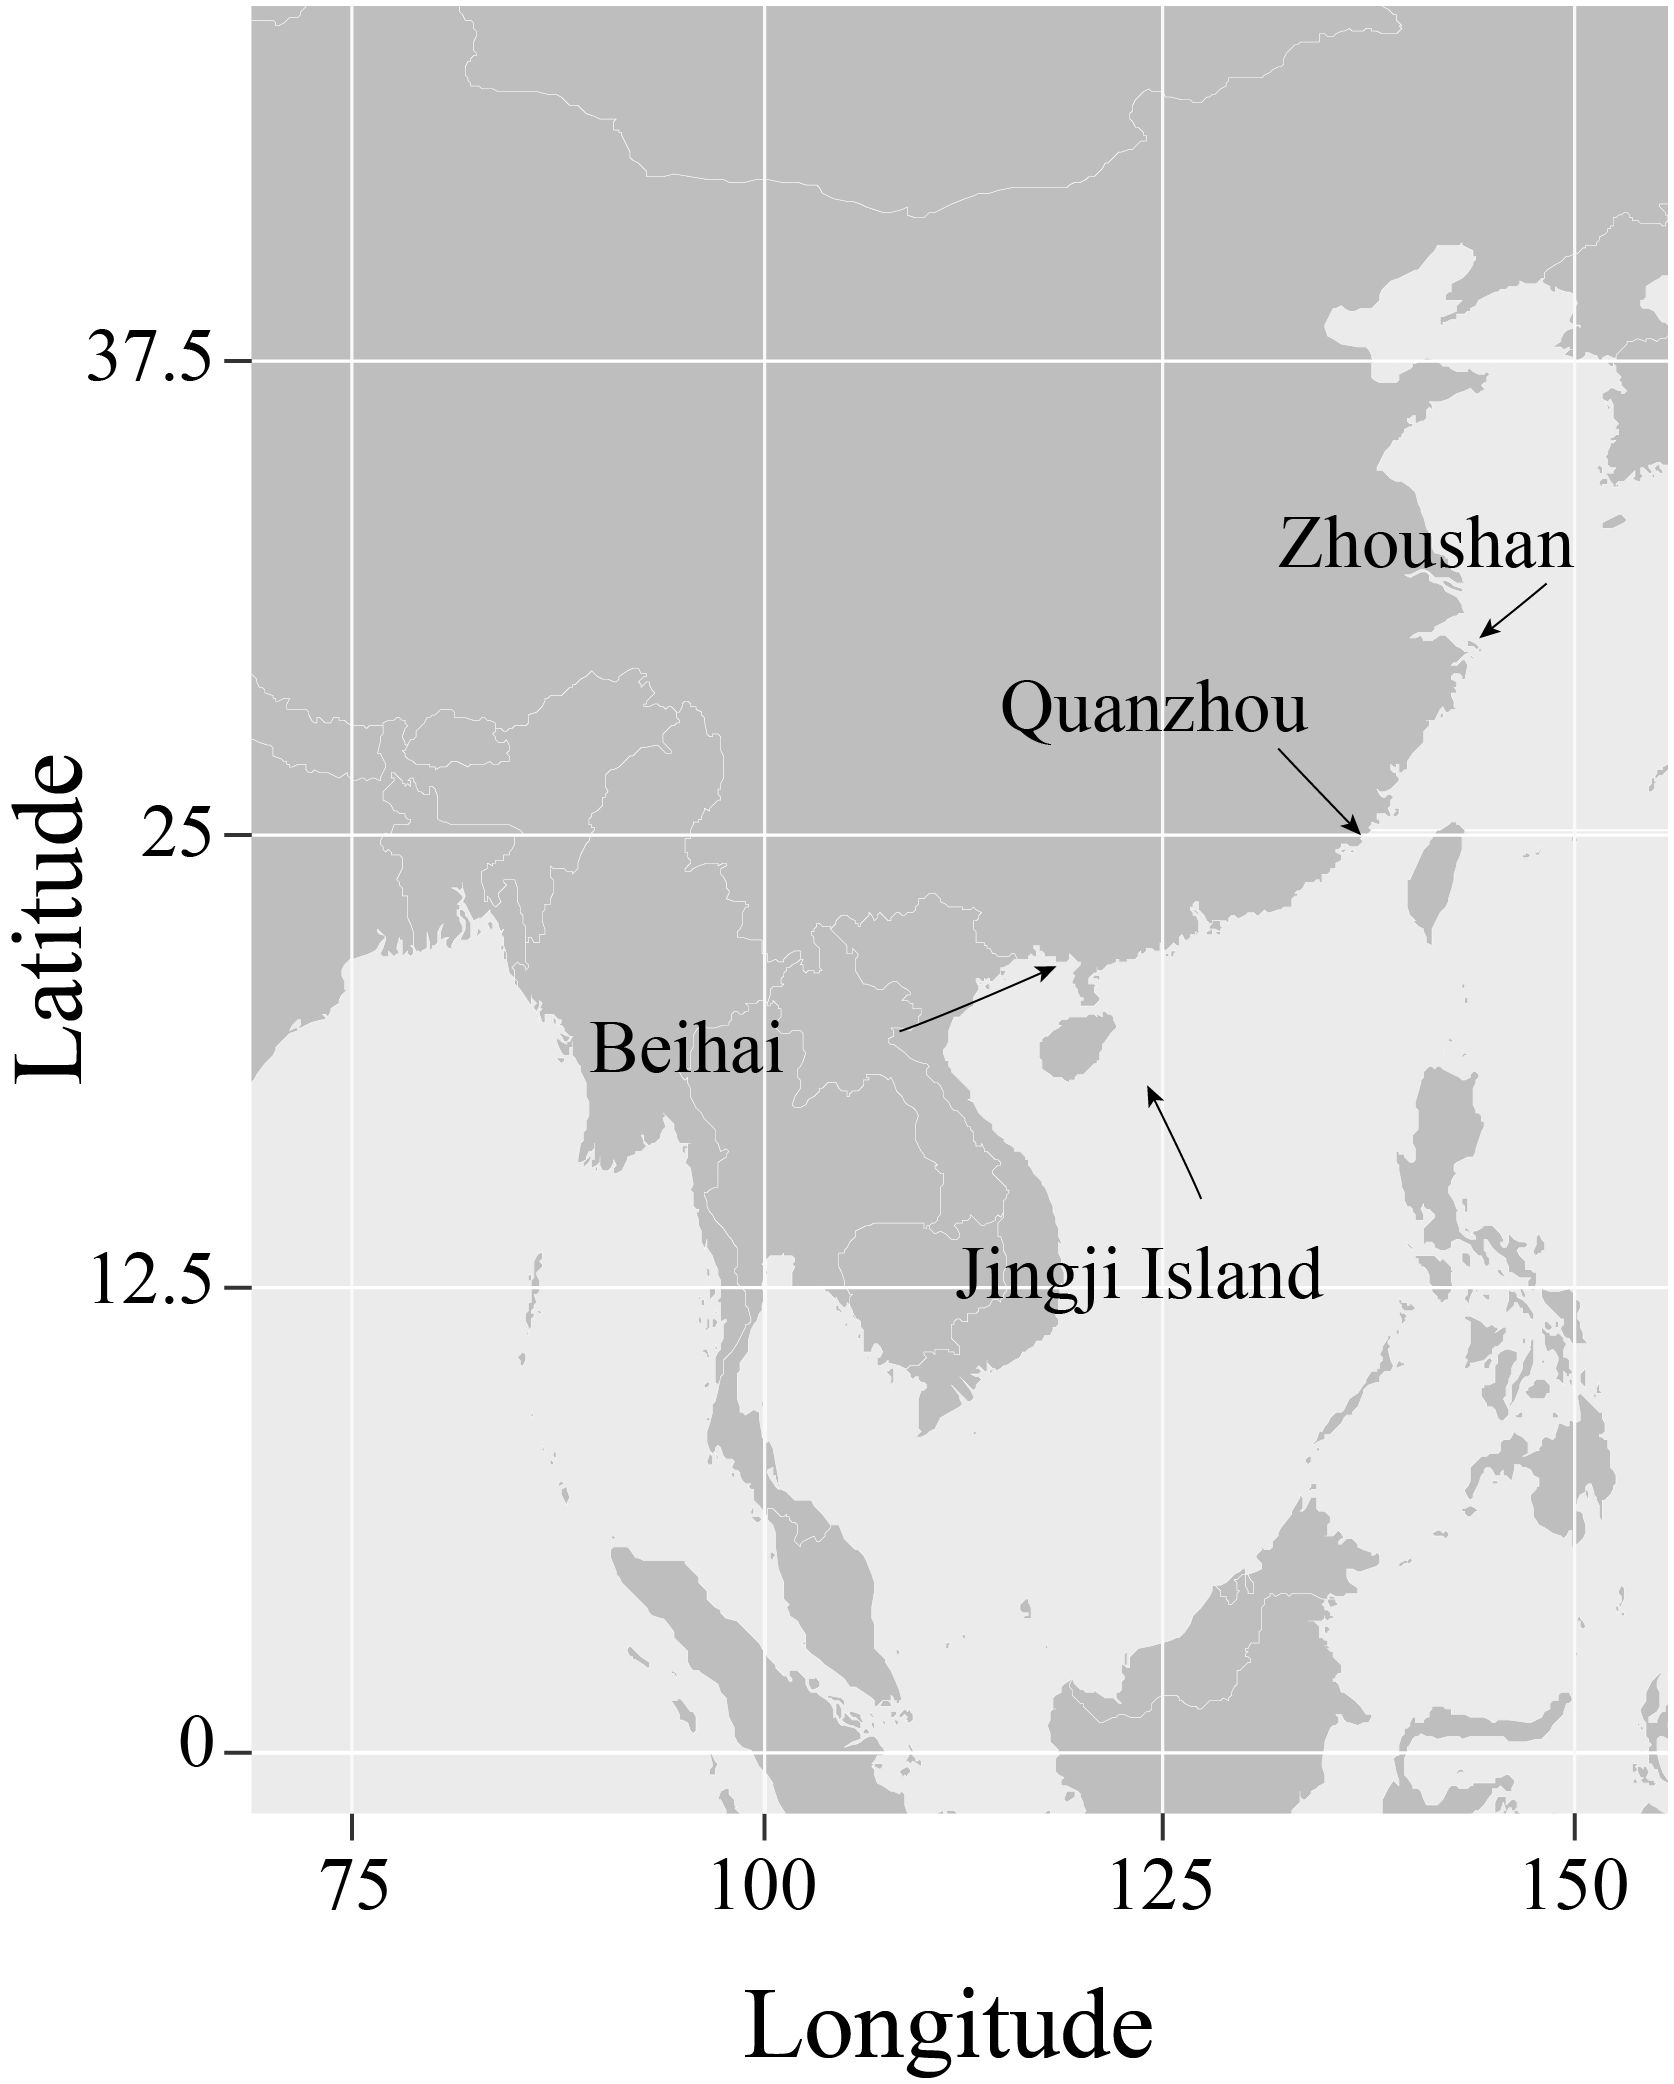
Figure 1 The geographical distribution of sample collection sources.
Phenol/Chloroform extraction method was used to extract the DNA from muscle tissue. The extracted DNA concentration was assessed using NanoDrop 2000 (Thermo Fisher Scientific Inc, USA) and verified through 1% agarose gel electrophoresis. After ultrasonic fragmentation, libraries were constructed with insert fragment sizes of approximately 350 bp for sequencing. All libraries were sequenced on the Illumina NovaSeq 6000 platform according to the manufacturer′s protocol.
Data quality control and genome survey analysis
FASTP (Chen et al., 2018) with default parameters was utilized for raw data filtering and quality control, resulting in the acquisition of clean data. Following the step, a total of 396.89 Gb (averaging 100× coverage of the genome) of high-quality data were retained for further analysis. To assess sequencing quality, metrics such as quality values Q20 and Q30, along with GC content, were calculated. GCE v1.0.0 (Liu et al., 2013) was used to estimate the genome characteristics of each sample, with K-mer size of 17. The outcomes of the K-mer analysis were leveraged to estimate genome size, heterozygosity, and repeat ratio. The algorithm used for determining genome size is as follows: genome size = K-mer_num/peak_depth, where K-mer_num represents the total number of K-mers, and peak_depth is the expected value of the K-mer depth.
Genome assembly, evaluation, SNP calling and SSR motif identification
SOAPdenovo2 (Luo et al., 2012) was employed to individually assemble the clean reads into distinct contigs and scaffolds. The assembly genome sequences were evaluated by BUSCO using actinopterygii_odb10 database (Seppey et al., 2019). Simultaneously, the conserved gene sequences of each genome were identified. For SNP calling, the clean reads were mapped to X. elongatus genome using BWA-mem method (Li, 2014) and the variance were identified by GATK (v 4.1.9.0) (DePristo et al., 2011) with parameters of “QD < 2.0, MQ < 40.0, FS > 60.0, SOR > 3.0, MQRankSum < -12.5, ReadPosRankSum < -8.0, DP < 8.0”. The raw variances were filtered using vcf2phylip (v2.0) (Ortiz, 2019). SNPs with integrity of 100% were analyzed in the followed study. The identification of potential microsatellite motifs was conducted using the Perl script “misa.pl” from the MISA software (Beier et al., 2017). The search parameters were configured to detect dinucleotide, trinucleotide, tetranucleotide, pentanucleotide, and hexanucleotide microsatellite motifs with a range of five-to-fifteen repeats.
Mitochondrial genome assembly and phylogenomic inference
The clean data were employed for assembling the mitochondrial genome using NOVOplasty v4.2 (Dierckxsens et al., 2017). The resulting mitochondrial genome sequences were annotated and visualized as circular maps using OrganellarGenomeDRAW (Greiner et al., 2019). As an outgroup, mitochondrial genome sequences of Gymnammodytes semisquamatus (16,484 bp, MT410950), Ammodytes personatus (16,527 bp, KF672362), Parapercis cylindrica (16,195 bp, AP006022), Trachinus draco (16,810 bp, AP006024), and Parapercis sexfasciata (16,497 bp, AP006816) were retrieved from NCBI. RAxML v8.2.12 (Stamatakis, 2014) was employed to reconstruct the maximum-likelihood (ML) tree using the optimal GTRGAMMAI substitution model and 1,000 bootstrap replicates. For constructing the mitochondrial genome based phylogenetic tree, all genes were stringed together to form a supergene as input. For constructed the core-genome origined conserved gene tree, all BUSCO identified genes were clustered using OrthMCL to find the single copy gene families. For each gene families, a tree was constructed and the final tree was generated by merging tree of each gene family using ASTRAL (Sayyari and Mirarab, 2016).
Effective population size inferring
PSMC (Li and Durbin, 2011) was employed for inferring the effective population size of each individual. Specifically, clean reads were aligned to the assembled genome sequence using BWA-mem method. Samtools (v0.1.19) (Danecek et al., 2021) was used to handing the mapped bam file using parameter of “-bF 12”. Then, bcftools and vcftools were used to convert the sorted bam files into “fq.gz” file, and “fq2psmcfa” script in PSMC was used to convert the “fq.gz” file into psmcfa file with parameter of “-q20”. For running PSMC, the generation interval (g) was set to 2 years, and the mutation rate (μ) was set at 2.5×10⁻⁸ (Song et al., 2022), with the remaining parameters set to their default values.
Results
Genomic characteristic estimation
After conducting the data quality control step, a total of 396.69 Gb of high-quality sequencing data was successfully obtained from seven samples, with each sample’s data ranging from 41.77 to 74.46 Gb. All samples exhibited Q30 values surpassing 91.96%, indicating an exceptionally high overall sequencing quality. The sequencing depth for each sample ranged from 64× to 122×, averaging at 87×, meeting the prerequisites for subsequent genome prediction (Supplementary Table S1).
K-mer analysis was employed to evaluate genome size, heterozygosity rates, and the proportion of repetitive sequences for different samples (Table 2). The assessment revealed that all samples were diploid, with genome sizes ranging from 536 Mb to 650 Mb. Notably, U. japonicus displayed the largest genome at 652.49 Mb, while U. bicinctus exhibited the smallest genome at 536 Mb. In comparison to cyprinid fish, the Uranoscopidae fishes showcased relatively low proportions of repetitive sequences, ranging from 20.09% to 36.64%. Despite all seven fish species belonging to the Uranoscopidae family, there were considerable differences in heterozygosity rates among individuals, none exceeding 1%. U. oligolepis recorded the highest heterozygosity rate at 0.88%, while I. pollicaris exhibited the lowest at 0.41%. This implies significant diversity in effective population size among these fish species under natural conditions.
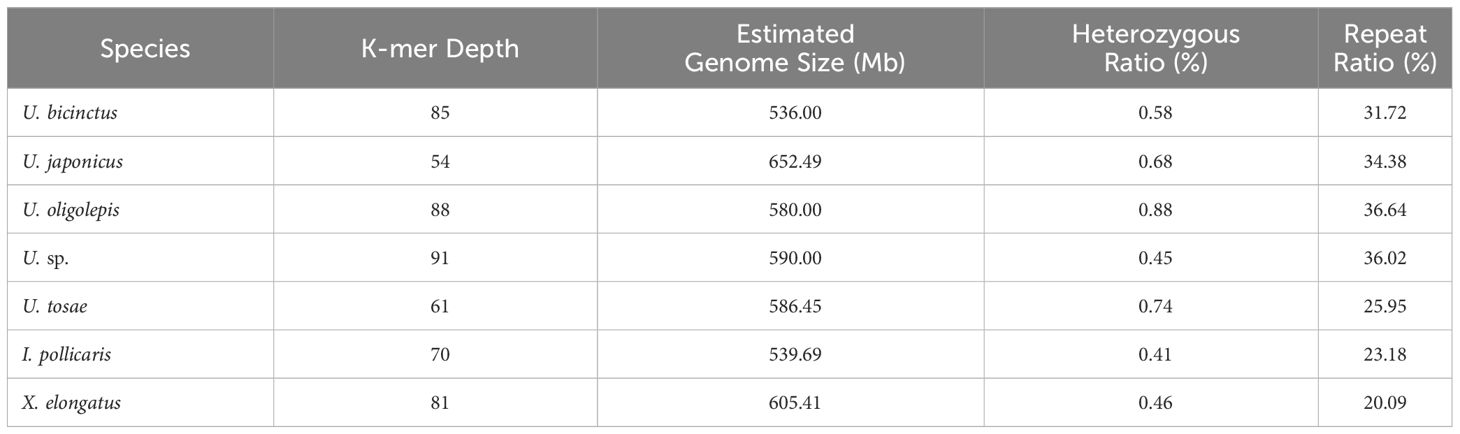
Table 2 The statistical information of K-mer-based genome survey result.
Genomic assembly and estimation
We employed the SOAPdenovo2 software for assembling clean data, yielding genome sizes ranging from 533 Mb to 669 Mb (Table 3). The assembled genome sequences for all samples accounted for 85.54% to 114.09% of the genome sizes assessed by K-mer method, indicating relative completeness in all assembled genome sequences. Due to the use of next-generation sequencing (NGS) data for assembly, the scaffold N50 for all seven sequences was relatively low, ranging from 7.3 Kb to 62.5 Kb. Besides, the genome continuity was suboptimal, with varying numbers of scaffolds between 172,912 and 837,792. Evaluating genome completeness using BUSCO revealed significant differences in completeness among different assembly sequences, ranging from 14.6% to 86.3% (Supplementary Table S2). Among the seven samples, U. sp. exhibited the highest number of contigs with the lowest contig N50, resulting in low complete BUSCOs. Conversely, X. elongatus demonstrated the best assembly performance, boasting the highest scaffold N50 at 62,497 bp and the longest contig reached 1.14 Mb. Meanwhile, BUSCO evaluation indicated an impressive completeness of 86.30%, with 85.5% of BUSCO genes being complete and single-copy. This is reasonable, as X. elongatus genome exhibited very low heterozygosity (0.41%) and relatively low repetitive sequence proportion (20.09%).
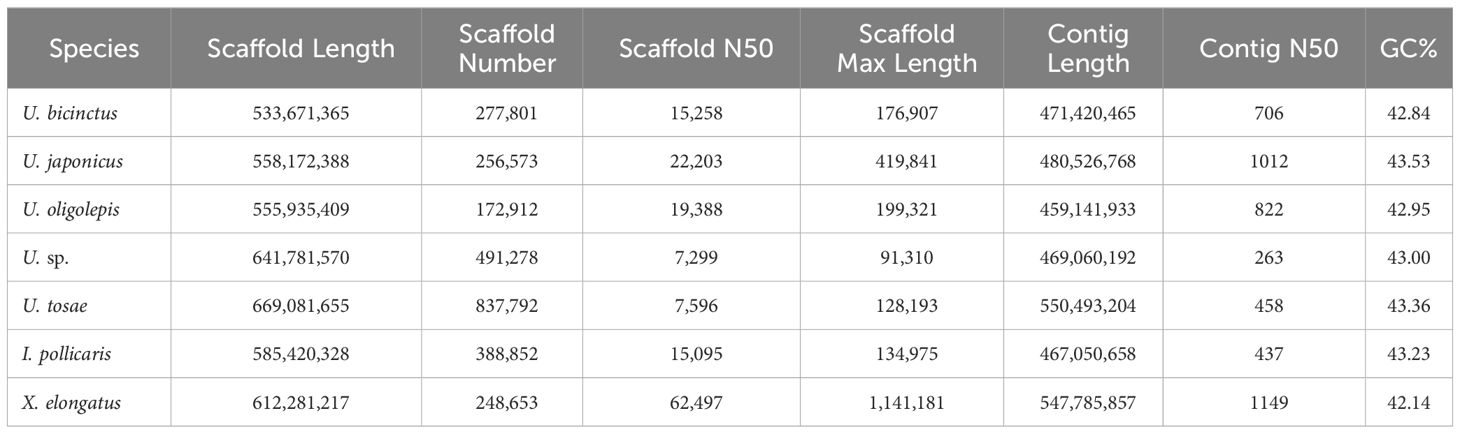
Table 3 Features of assembled seven Uranoscopidae genomes.
Identification and statistics of SSR molecular markers
Utilizing the assembled genome, we performed the prediction of simple sequence repeats (SSR). The predicted SSR counts for the seven species closely aligned, ranging from 248,600 to 294,869 (Table 4). When assessed in relation to the assembled sequence lengths, the SSR density exhibited striking similarity across different species, with each Mb sequence containing 403-510 SSRs. The SSR composition patterns are highly similar across all seven species (Figure 2A). In general, SSRs with higher unit repetition numbers constitute a smaller proportion of the overall composition. This trend is observed in Trinucleotide, Tetranucleotide, Pentanucleotide, and Hexanucleotide SSRs. As for Dinucleotide SSRs, with the exception of X. elongatus, both the six-unit and ten-unit repetitions are notably higher compared to SSRs with other repetition numbers in the remaining six species.

Table 4 Statistics of microsatellite recognition results.
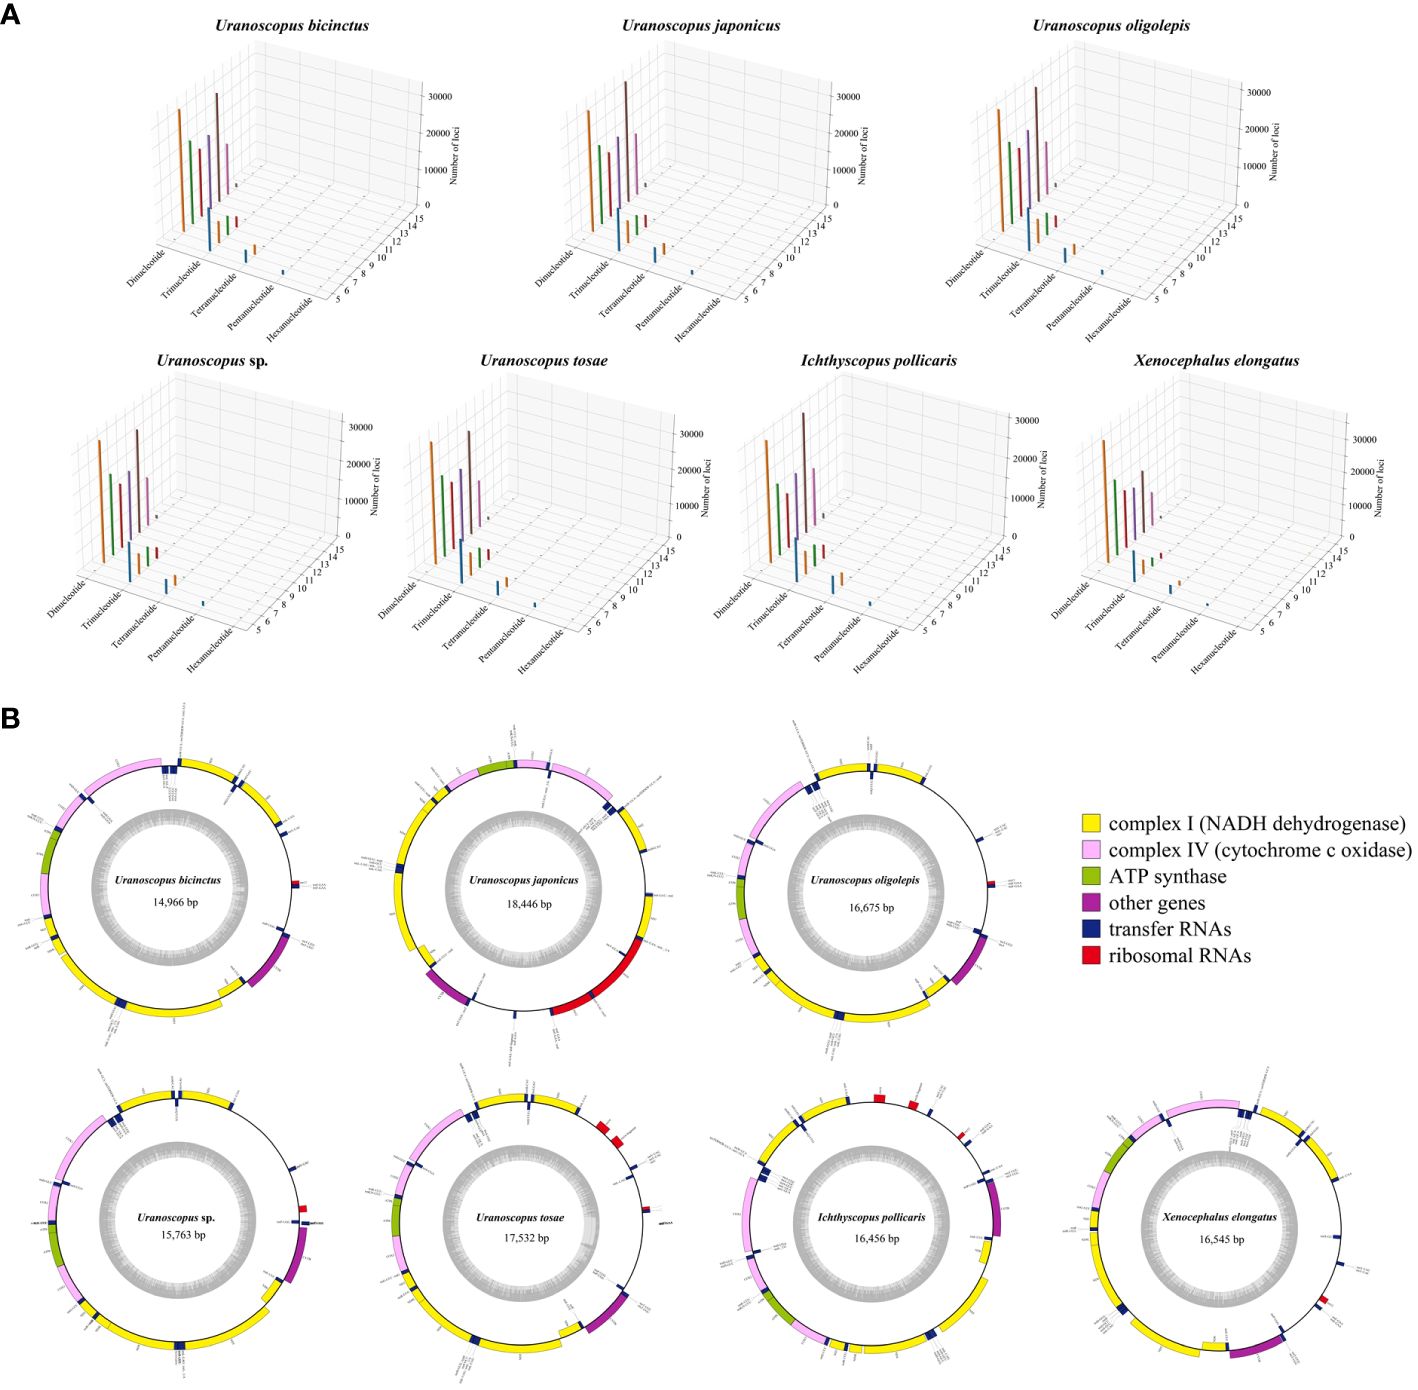
Figure 2 3D plot depicting genomic annotated single sequence repeats (A) and circular plot illustrating the mitochondrial genomes (B) of the seven Uranoscopidae species.
Single copy conserved homologous genes identification and phylogenetic analysis.
To explore the evolutionary relationships among different species, we used zebrafish as an outgroup and constructed an evolutionary tree based on conserved genes in the genomes. The conserved genes identified by the BUSCO prediction model for each species were utilized as input, resulting in the identification of a total of 90 shared single-copy genes. Subsequently, we employed the maximum likelihood method to construct an evolutionary tree comprising 8 species (Figure 3). The results reveal that I. pollicaris and X. elongatus both belong to the Ammodytidae family, clustering together on the evolutionary tree. The genus Uranaosopus belongs to the Uranoscopodae family, with its 5 species forming a cluster on a branch. The bootstrap support rate between the two families is 100%. Within the genus Uranaosopus, U. japonicus is evolutionarily closer to I. pollicaris and X. elongatus, with a bootstrap support rate of 100%. The support rate among other species within the genus Uranaosopus also exceeds 76%.
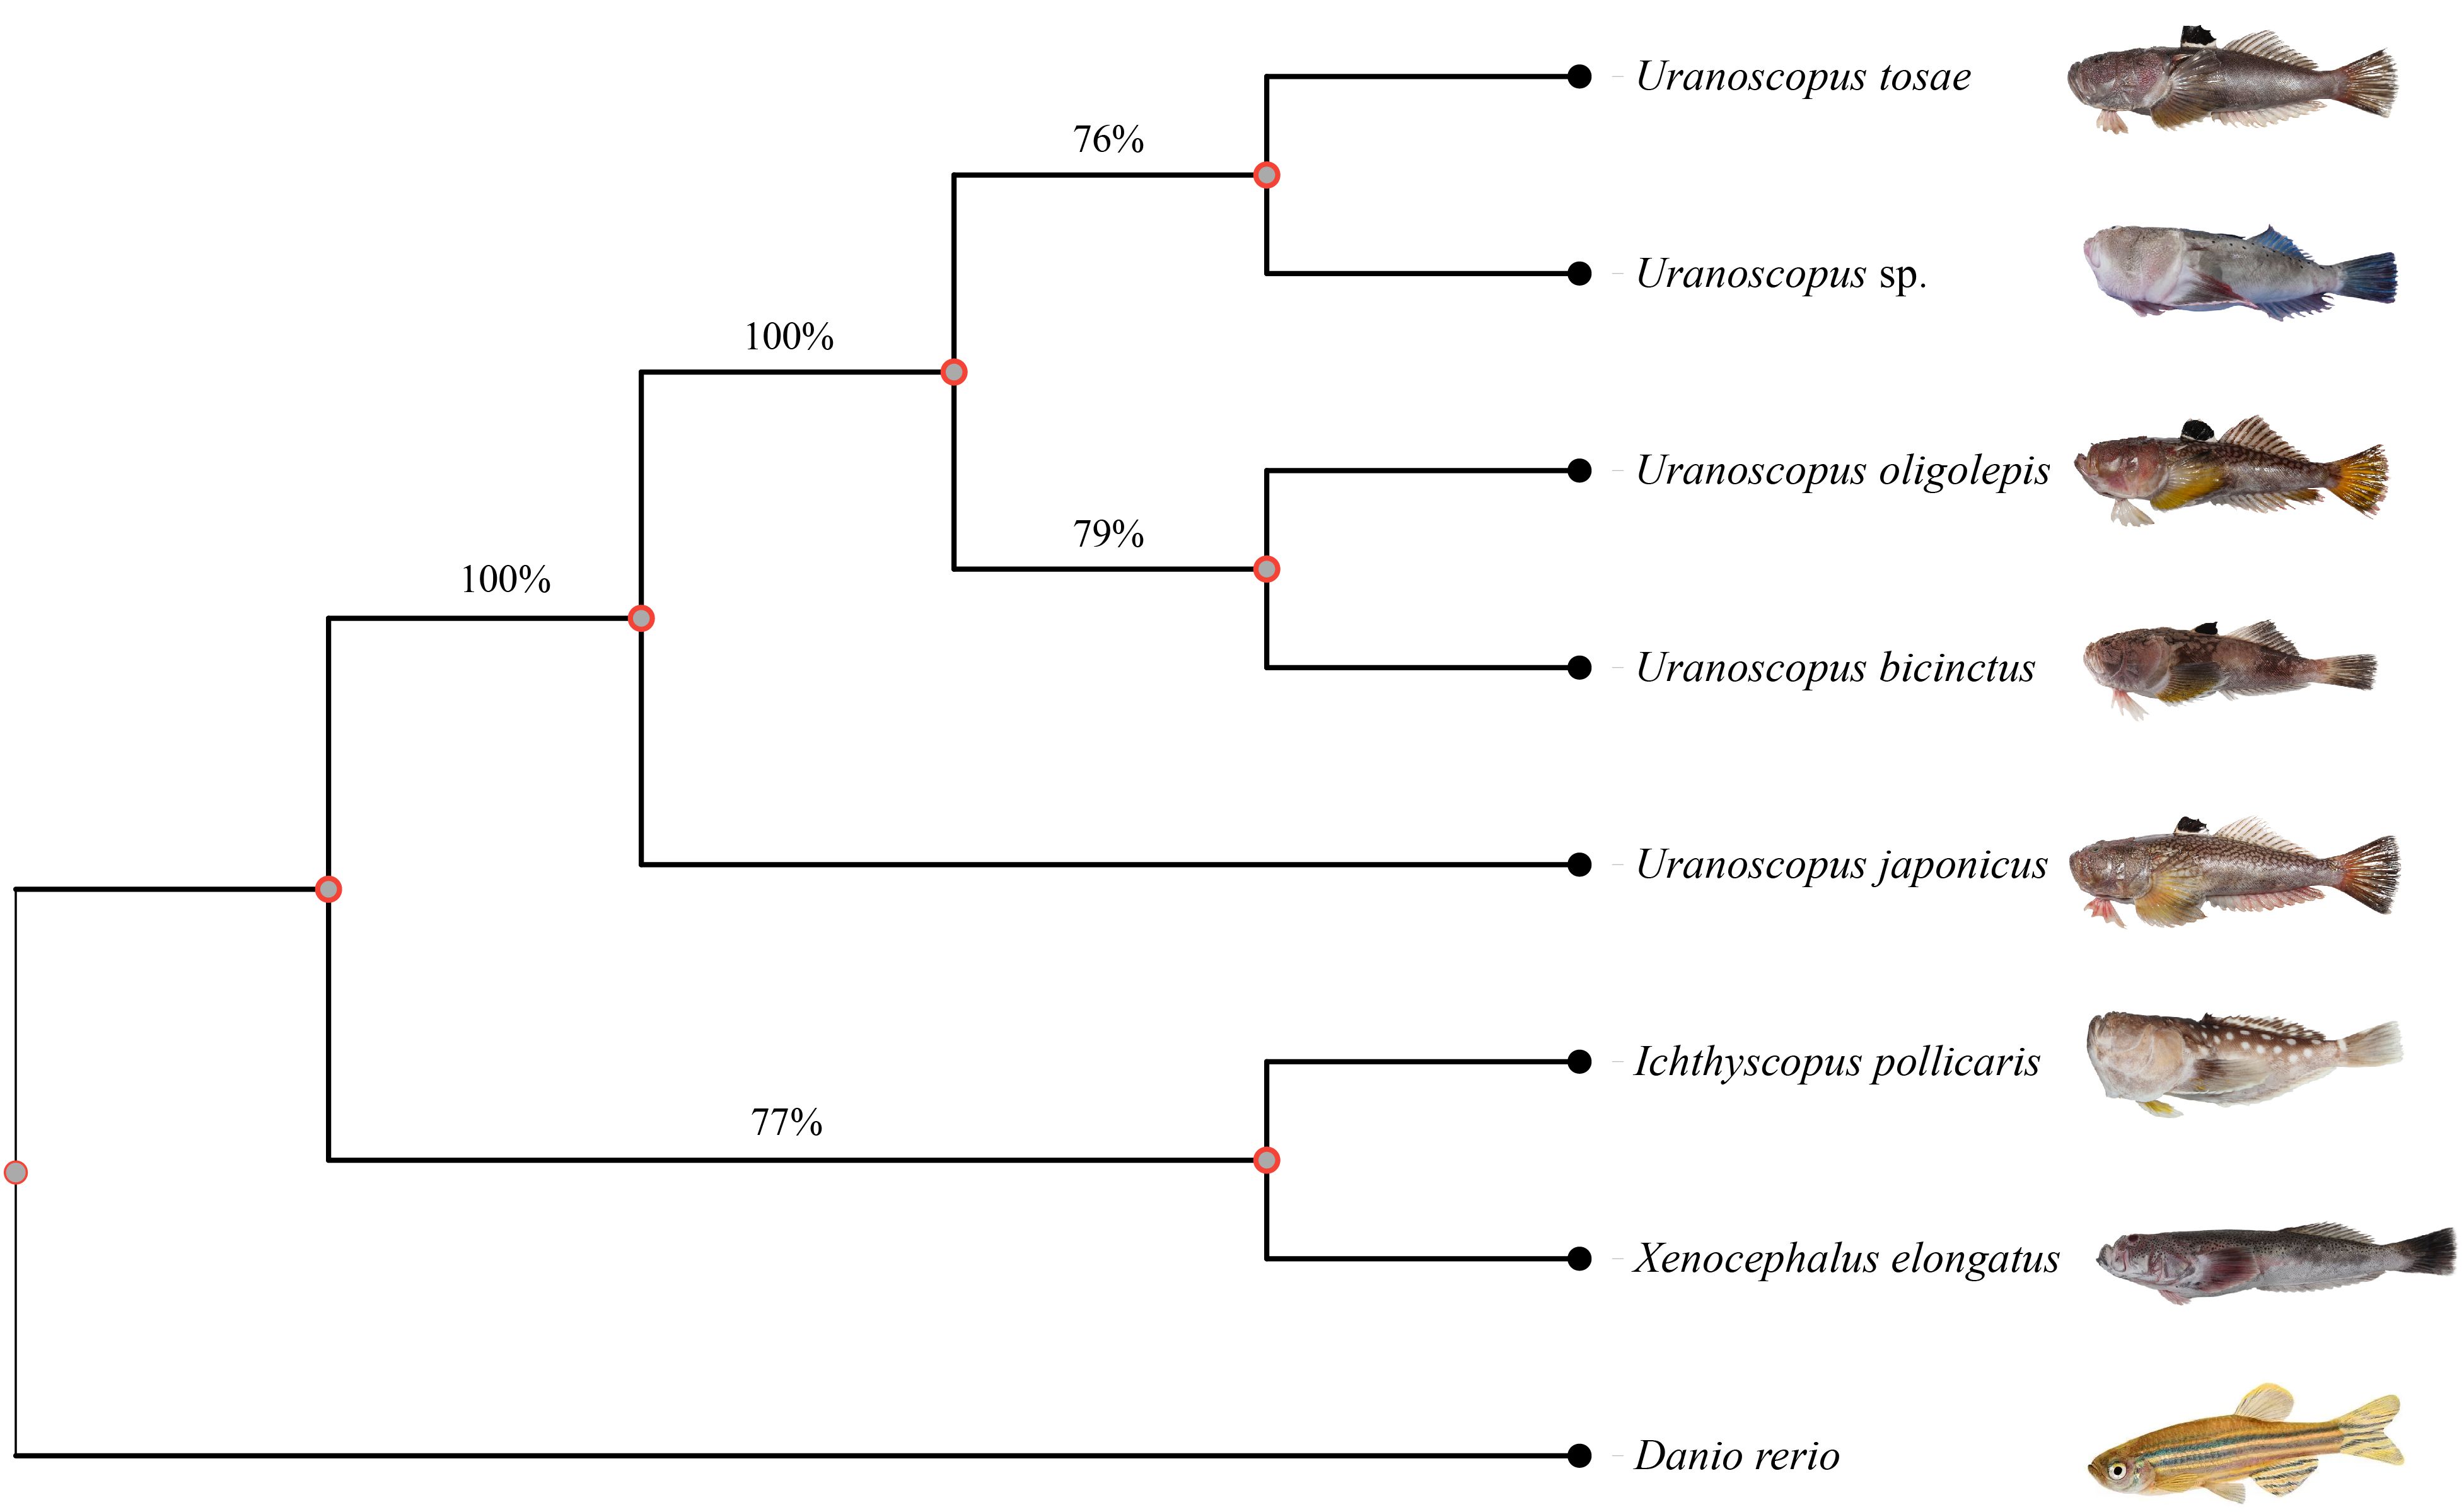
Figure 3 Phylogenetic tree for Uranoscopidae species based on BUSCO conserved genes. A total of 90 single-copy conserved genes were used to construct this phylogenetic tree using maximum likelihood method. The numbers under the branches stand for the concordance rates of bootstrap analysis.
Whole genome based phylogenetic analysis
To further validate the evolutionary relationships within the nuclear genome of the seven species, we utilized whole-genome genetic variance to construct an additional phylogenetic tree. The X. elongatus genome was chosen as the reference genome due to its superior integrity and continuity, evidenced by the highest BUSCO completeness value, contig N50, and scaffold N50, as well as the lowest scaffold number among the seven assembled genomes. A total of 3,756,984 SNPs, constituting 0.69% of the assembled X. elongatus contig sequence, were identified across the seven species, with the number of single species SNP variants amount ranging from 2.19 million to 2.49 million (Supplementary Table S3). After filtering variant loci with integrity below 100%, 1,771,650 SNPs were retained for construction the phylogenetic tree. Notably, the resulting tree demonstrated a high level of consistency with the tree derived from common conserved genes, thus reaffirming the reliability of the nuclear genome phylogenetic relationships (Figure 4).
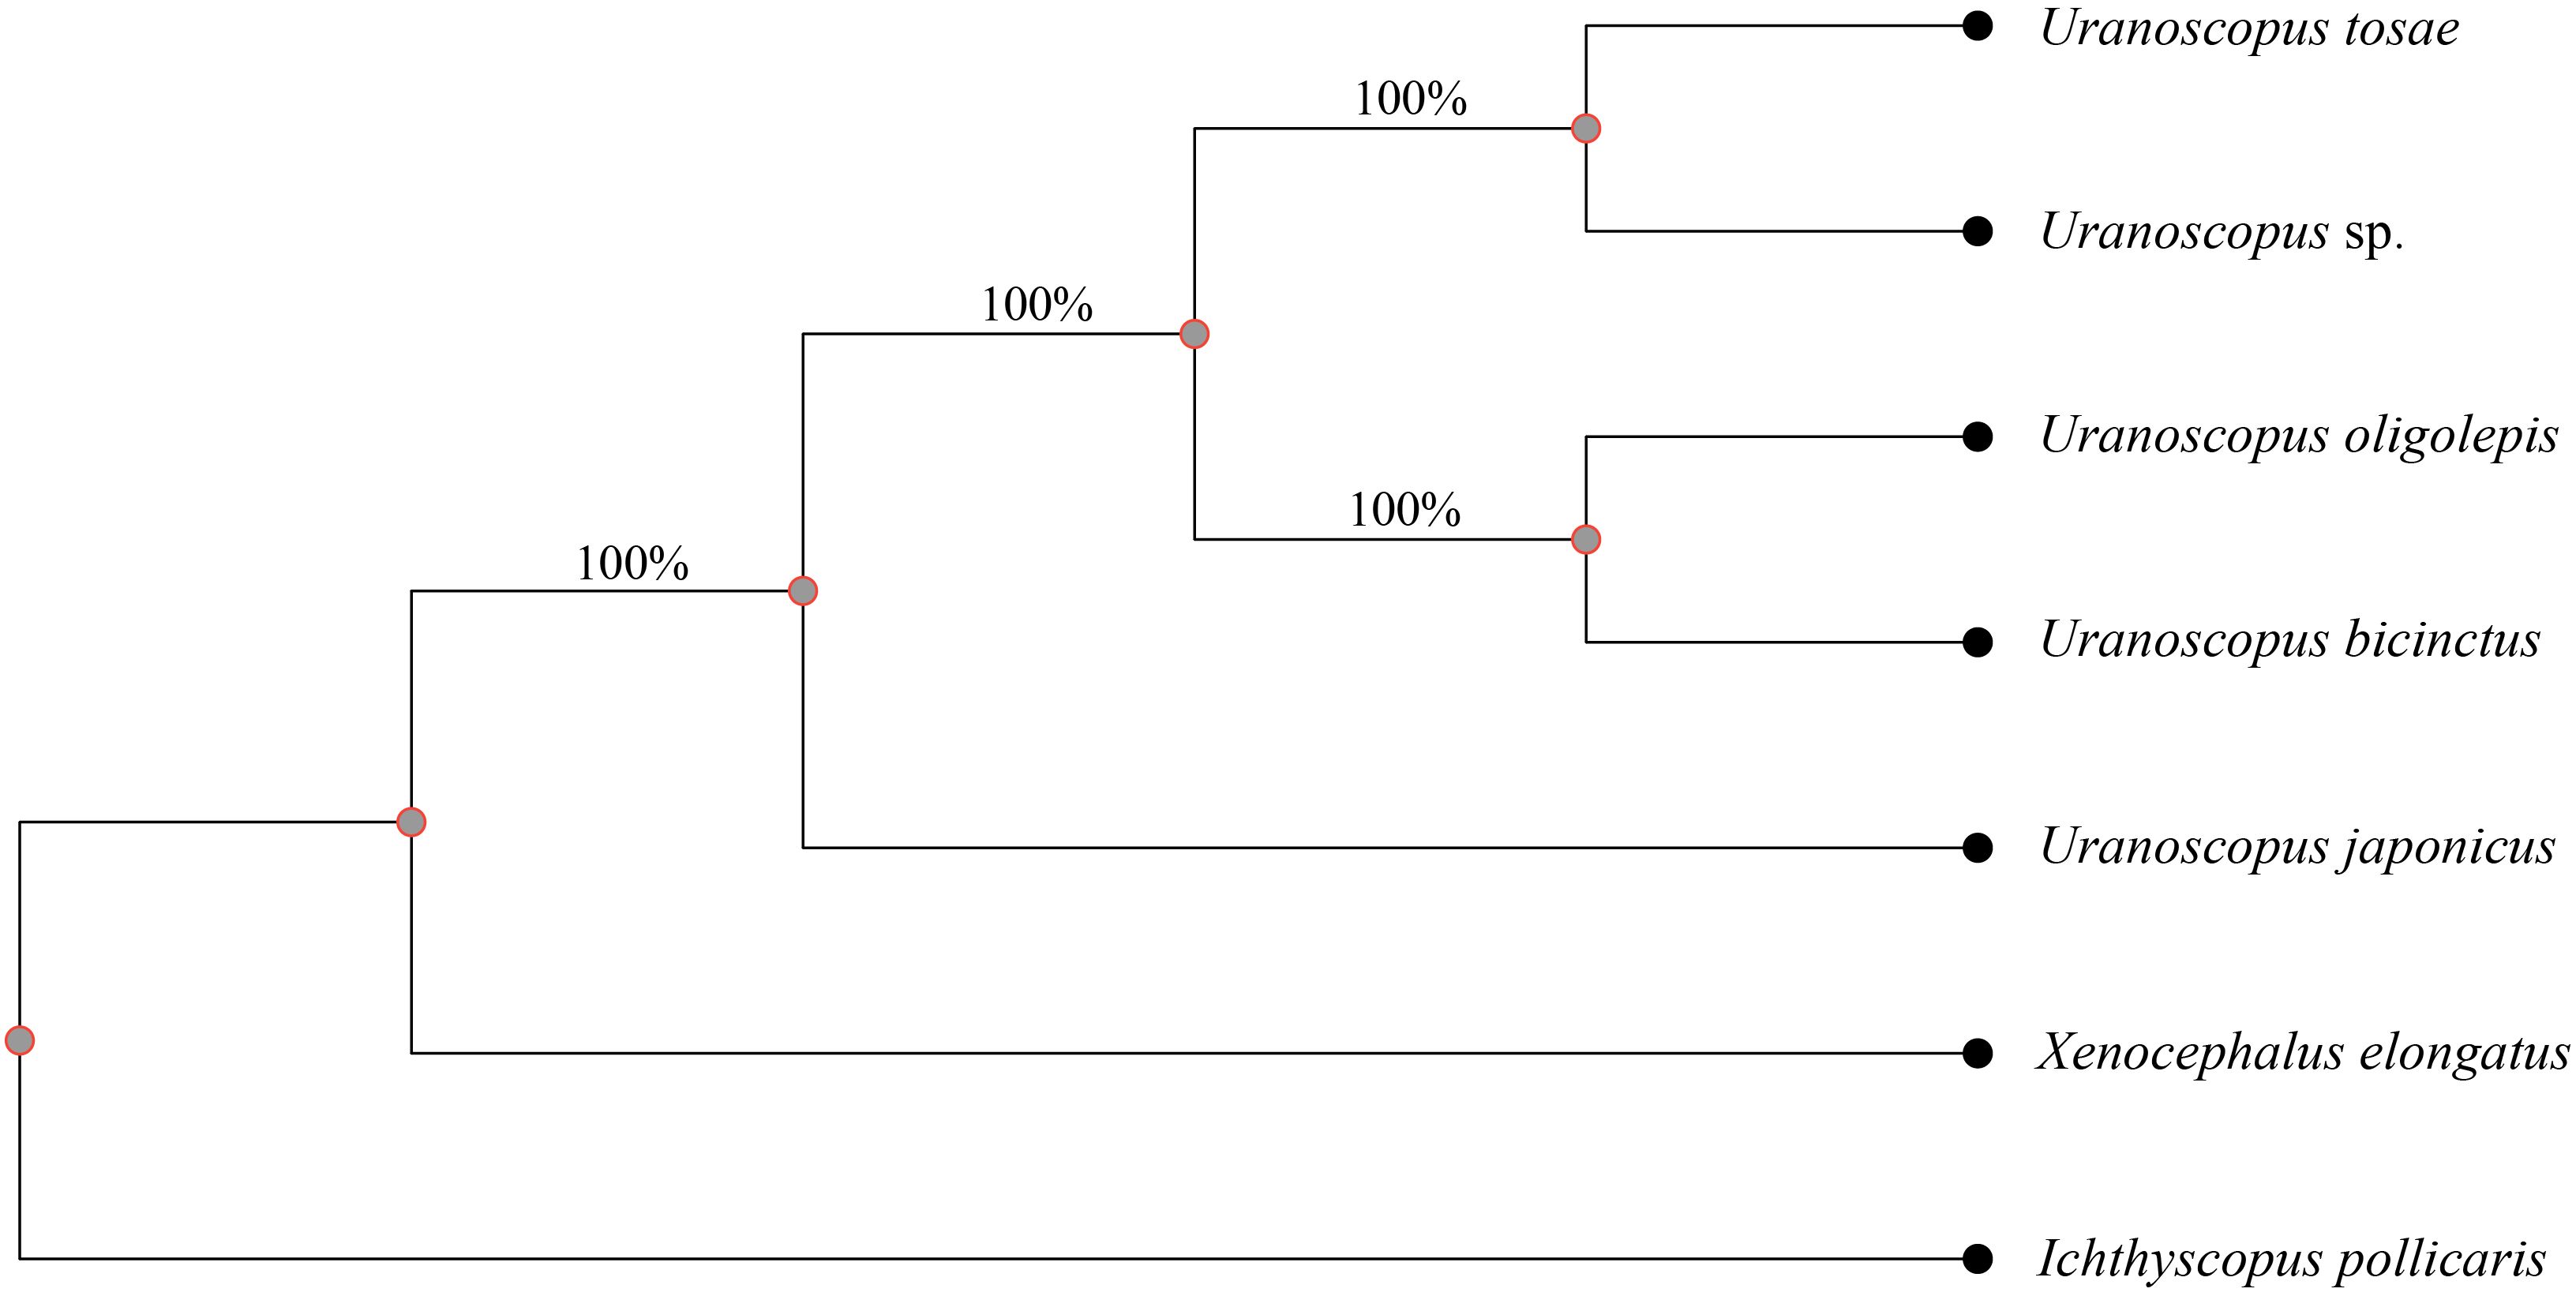
Figure 4 Phylogenetic tree based on SNP variance between the seven fishes. A total of 1,771,650 SNPs were used to construct tree and the numbers beneath the branches indicate the concordance rates of bootstrap analysis.
Characterization of mitochondrial DNA genomes
The assembled total lengths of the mitogenomes for U. tosae, U. japonicus, U. sp., U. bicinctus, U. oligolepis, I. pollicaris, and X. elongatus were 17,532 bp, 18,446 bp, 15,763 bp, 14,966 bp, 16,675 bp, 16,456 bp, and 16,546 bp, respectively (Figure 2B). Each mitochondrial genome encompasses a variable number of genes, ranging from 36 to 39 (Table 5). Typically, except for one NADH dehydrogenase coding gene (ND6) and eight tRNA genes (Glu, Ala, Asn, Cys, Tyr, Ser, Gln, and Pro) were encoded on the L-strand, most mitochondrial genes were encoded on the H-strand. All 13 protein-coding genes, comprising 7 NADH dehydrogenases, 3 cytochrome c oxidases, 1 cytochrome b, and 2 ATP synthases, were identified in these mitochondrial sequences. The number of transfer RNA (tRNA) and ribosomal RNA (rRNA) genes varies among the seven sequences, with most species having 23 tRNA genes and 1 rRNA gene.
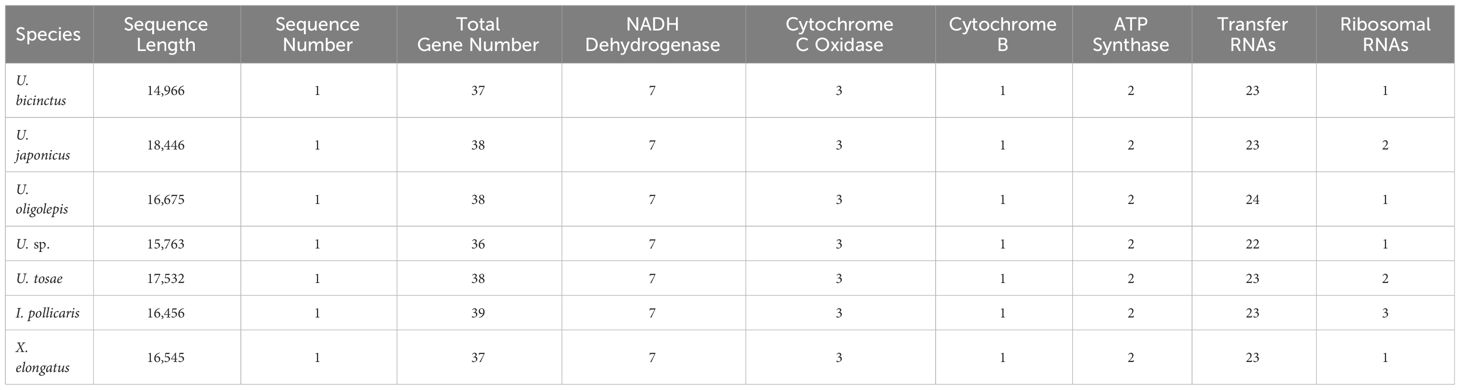
Table 5 Statistics of mitochondrial genome annotations.
Mitochondrial genomes based phylogenetic tree
To further unravel the evolutionary relationships among different species within the genus Uranaosopus, we constructed a species phylogenetic tree using all conserved genes in the mitochondrial genome. As outgroups, we selected five species from the Perciformes order, including two from the Ammodytidae family (Gymnammodytes semisquamatus and Ammodytes personatus), two from the Pinguipedidae family (Parapercis cylindrica and Parapercis sexfasciata), and one from the Trachinidae family (Trachinus draco). At the suborder level, all species, except T. draco, belong to Uranoscopoidei, with T. draco serving as the outgroup for the entire tree.
The mitochondrial genome-based gene tree exhibits strong consistency with the nuclear-genome-conserved-genes based tree. I. pollicaris and X. elongatus, along with U. japonicus and U. bicinctus, maintain consistent positions of two trees. However, there is inconsistency in the relative relationships among the other three species in genus Uranoscopus. Although the bootstrap support rates among these three species exceed 50%, they are slightly lower compared to other consistent branches (Figure 5).
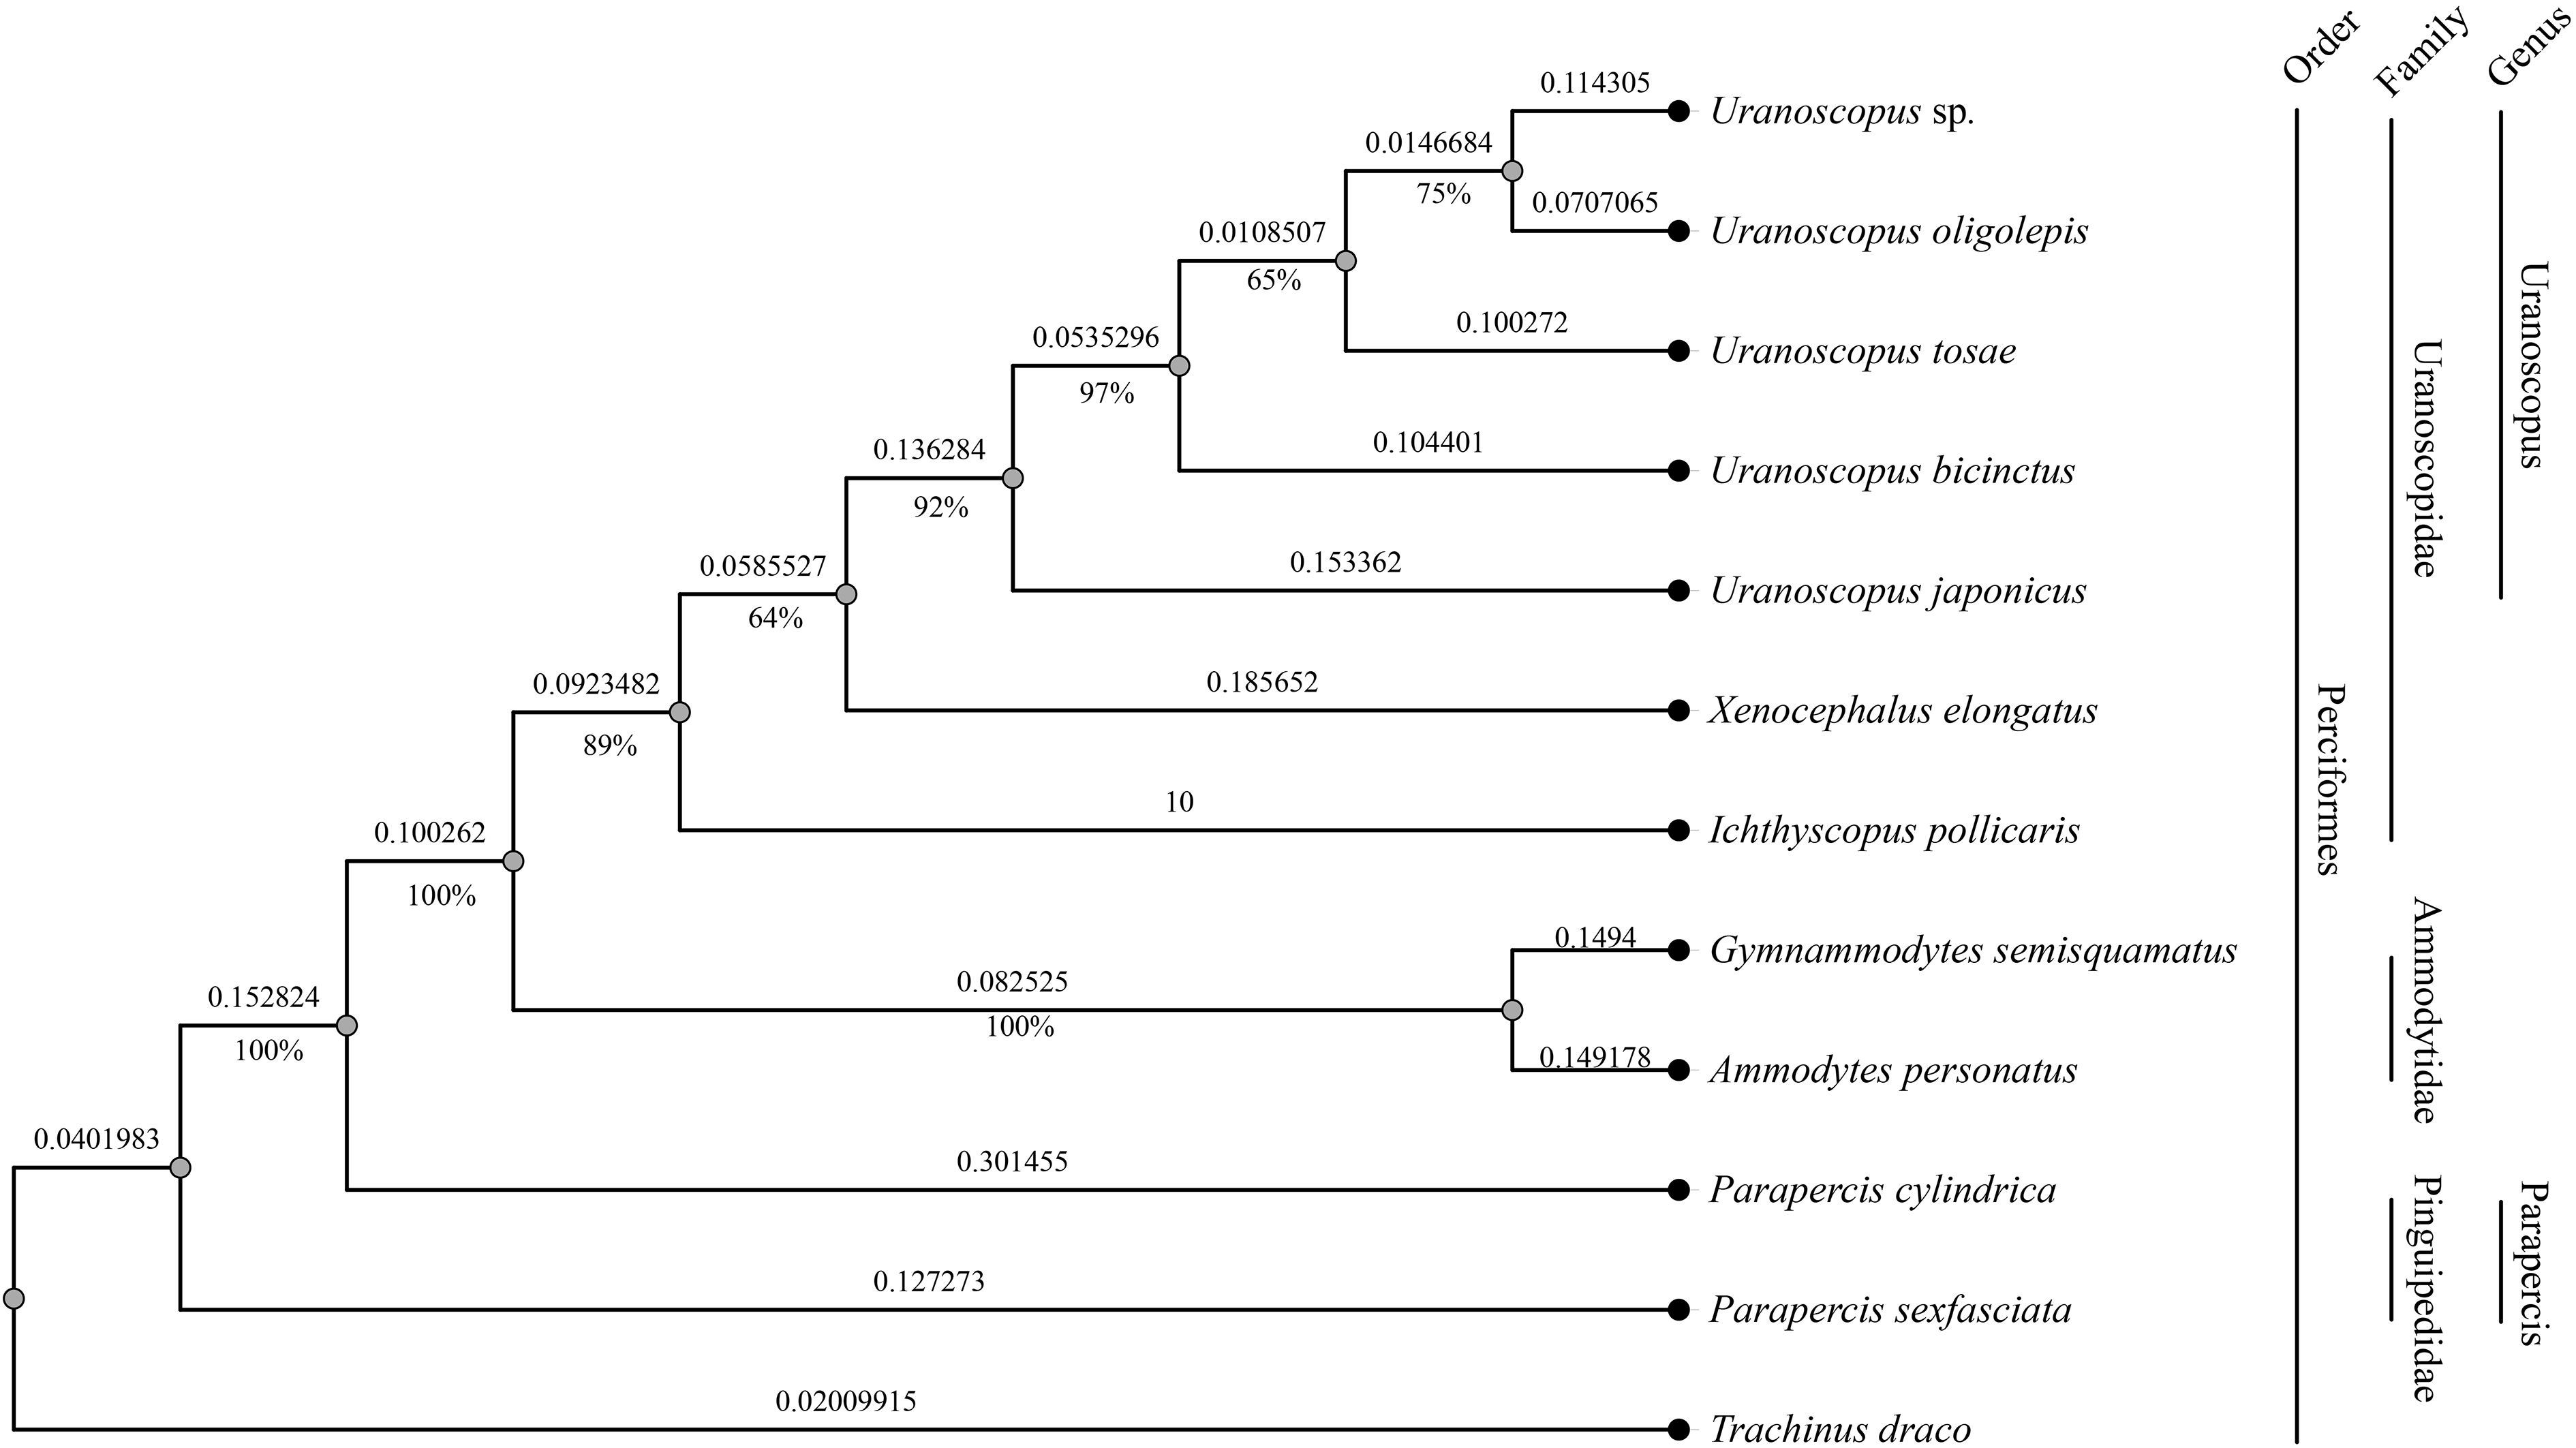
Figure 5 Phylogenetic tree based on mitochondrial genomes of 12 fish species in the Perciformes order. The numbers beneath the branches indicate the concordance rates of bootstrap analysis, while the values along the branches represent the branch lengths.
Historical dynamics of Uranoscopidae populations
We conducted a population history analysis of various species within the Uranoscopidae family using PSMC (Figure 6). The results reveal that following the Last Interglacial Period (LIP), all species underwent a rapid expansion in population size. By the time of the Last Glacial Period (LGP), the effective populations size of U. bicinctus and U. japonicus started to decline, experiencing a bottleneck effect. U. oligolepis began to undergo a bottleneck effect towards the end of the Last Glacial Period (LGP). Notably, based on the speculative results, U. tosae, X. elongatus, U. sp., and I. pollicaris have remained unaffected by bottleneck events since the LIP. Furthermore, significant differences in effective population sizes are observed among these species. Although U. sp. and I. pollicaris underwent expansion in one branch after LIP, they still maintained relatively small populations. In comparison, U. bicinctus, U. oligolepis, and U. japonicus consistently maintained higher population levels.
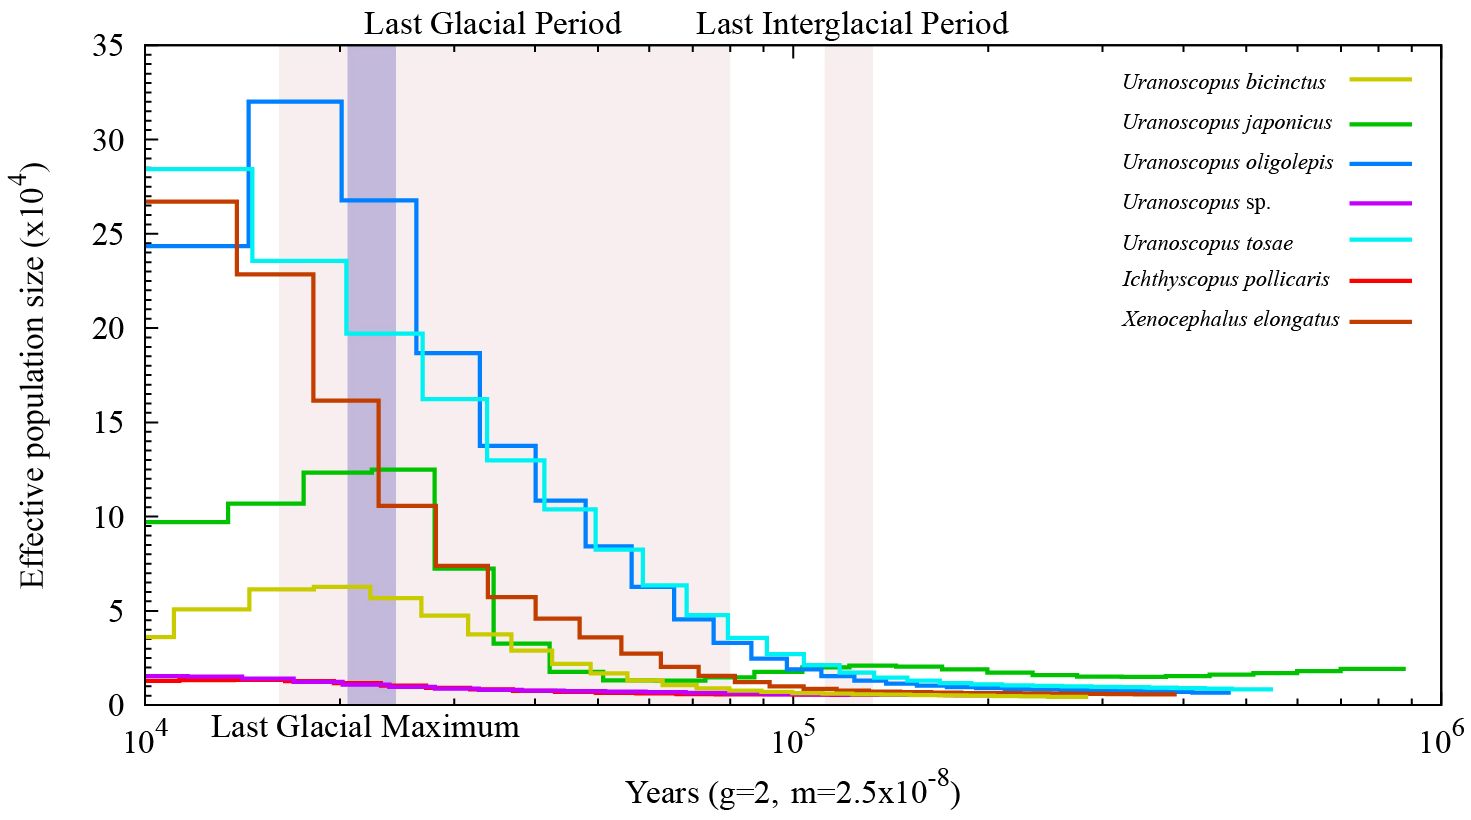
Figure 6 Inference of the effective population size of seven Uranoscopidae species.
Discussion
The development of sequence assembling algorithms and improvement of high-throughput sequencing technology have enabled obtaining plenty of whole genome sequences at high efficiency and low cost (Gaither et al., 2018; Kon et al., 2021). The rapid development of life science has been greatly promoted by the exponential growth in genome sequences (Xu et al., 2017). Species have varying genome sizes and complexities, necessitating the use of genome survey analysis in whole genome sequencing (Xu et al., 2019; Jo et al., 2021).
In this study, we utilized NGS technology to conduct whole-genome sequencing for seven species across three different genera within the Uranoscopidae family. Subsequently, a comprehensive genomic analysis was performed. According to the K-mer analysis index, the calculated genome sizes of these seven Uranoscopidae species ranged from 536.00 Mb to 652.49 Mb, with repeat sequence proportions between 20.09% and 36.64%, and heterozygosity levels ranging from 0.41% to 0.88%. Most reported fish genomes are less than 1 Gb, and the seven Uranoscopidae species in this study conform to this pattern. However, it is noteworthy that U. tosae, U. japonicus, and U. oligolepis exhibit relatively high heterozygosity rates (>0.68%), potentially affecting the following high-quality genome construction. The elevated heterozygosity also suggests potentially larger population sizes for these three species in their natural environments (Rougemont et al., 2019; Molnár et al., 2020). As an important index for sequencing, the GC content can affect the randomness of the genome (Xu et al., 2014).The average GC content for Trichiuridae species ranged from 42.14% to 43.53% in this study, which was mid-GC content and in the normal range (Zhou et al., 2013; Chen et al., 2020). Overall, the genomes of the seven Trichiuridae fish species appear relatively simple, making them suitable for more in-depth whole-genome sequencing studies.
In this study, we conducted initial genome assembly for seven species using NGS data. However, due to the limitations of NGS technology, the assembly results are quite fragmented. Employing the latest sequencing technologies, such as PacBio HiFi sequencing and Hi-C techniques, should enable the acquisition of high-quality genome sequences with greater ease. We utilized the assembled genomes for the identification of SSRs. In general, the distribution density and basic characteristics of SSRs among the seven species are highly similar. However, it is worth noting that the proportions of Dinucleotide 10-time repeats in six species are relatively high, potentially linked to some specific components within the genomes.
Additionally, three phylogenetic trees were constructed in this study. Two trees were based on conserved genes and SNP variance from the nuclear genome, while the third utilized gene variance from the mitochondrial genome. Notably, the two trees constructed using nuclear genome genetic markers exhibited identical tree structures, affirming the high reliability of genetic relationships among the seven fishes. The mitochondrial DNA-based tree only revealed consistent evolutionary relationships for I. pollicaris, X. elongatus, U. japonicus, and U. bicinctus when compared to the nuclear genome based trees. Upon analyzing the results, the bootstrap support rates for all trees are above 65%, indicating relatively high confidence in the respective outcomes. This inconsistency might be attributed to the discordance in evolutionary rates between mitochondrial and nuclear genome. Due to experiencing relatively lower selection pressure, the evolutionary rate of the mitochondrial genome is typically much higher than that of the nuclear genome.
Before this study, the mitogenomes of U. tosae (17,286 bp, KX641475.1) and U. japonicus (17,878 bp, AP017446.1) have been previously reported, with both exhibiting shorter lengths than observed in the same species within this study. Notably, in comparison to the previously reported sequences, an additional tRNA gene was identified in the newly assembled sequences. Meanwhile, while the mitochondrial genomes were identified to possess an equal number of coding genes, subtle variations were observed among them. Besides, variances in the quantities of tRNA and rRNA genes were observed, contributing to different sizes of the mitochondrial genomes. The mitochondrial genome sequences of the other species investigated in this study have not been previously reported. The sequences assembled in this study will serve as a foundational basis for molecular research in subsequent studies on the evolution of these species and the taxonomic classification of related species.
Furthermore, we conducted estimations on the historical effective population sizes of these seven species. The findings reveal an overall expansion in population size for all species after the LIP, with the majority reaching peak levels during the LGP. Notably, U. bicinctus, U. japonicus, and U. oligolepis exhibited a bottleneck effect at the end of the LGM. Concurrently, there are substantial differences in the effective population sizes among different species. These variations may be correlated with the geographical distribution and environmental disparities of each species.
Conclusions
In summary, this study involved preliminary investigations and explorations using NGS technology on the genomes, SSR situations, species evolutionary relationships, mitochondrial genomes, and population historical dynamics of seven fish species within the Uranoscopidae family.
Our findings underscore the importance of integrating phylogenetic methodologies, including analyses of conserved genes, whole-genome variation, and mitochondrial genome sequences, to elucidate the evolutionary relationships among fish within the Uranoscopidae family. The results of this research will provide a reference for subsequent high-quality genome construction and offer valuable resources for the marine biodiversity conservation and the population genetic study.
Data availability statement
The data produced in this study has been uploaded to Chinese National Genome Data Center (https://ngdc.cncb.ac.cn/) with the project number of PRJCA023011 and the data accession number of CRA014566. The data has also been uploaded to the SRA database of the National Center for Biotechnology Information (NCBI), under the BioProject PRJNA1085788.
Ethics statement
The animal study was approved by Ethics committee of Zhejiang Ocean University. The study was conducted in accordance with the local legislation and institutional requirements.
Author contributions
QL: Data curation, Formal Analysis, Visualization, Writing – original draft. XZ: Writing – review & editing. YQQ: Resources, Writing – review & editing. YW: Resources, Writing – review & editing. XG: Resources, Writing – review & editing. WL: Resources, Writing – review & editing. TG: Conceptualization, Writing – review & editing. YQ: Conceptualization, Writing – review & editing.
Funding
The author(s) declare financial support was received for the research, authorship, and/or publication of this article. This study was supported by the National Key Research and Development Program of China (2023YFD2401903) and the National Innovation and Entrepreneurship Training Project for University (China) (202210340001).
Conflict of interest
Author QL was employed by the company Wuhan Onemore-tech Co., Ltd.
The remaining authors declare that the research was conducted in the absence of any commercial or financial relationships that could be construed as a potential conflict of interest.
Publisher’s note
All claims expressed in this article are solely those of the authors and do not necessarily represent those of their affiliated organizations, or those of the publisher, the editors and the reviewers. Any product that may be evaluated in this article, or claim that may be made by its manufacturer, is not guaranteed or endorsed by the publisher.
Supplementary material
The Supplementary Material for this article can be found online at: https://www.frontiersin.org/articles/10.3389/fmars.2024.1383635/full#supplementary-material
References
Beier S., Thiel T., Münch T., Scholz U., Mascher M. (2017). MISA-web: a web server for microsatellite prediction. Bioinformatics 33, 2583–2585. doi: 10.1093/bioinformatics/btx198
Berthelot C., Brunet F., Chalopin D., Juanchich A., Bernard M., Noël B., et al. (2014). The rainbow trout genome provides novel insights into evolution after whole-genome duplication in vertebrates. Nat. Commun. 5, 3657. doi: 10.1038/ncomms4657
Betancur R. R., Wiley E. O., Arratia G., Acero A., Bailly N., Miya M., et al. (2017). Phylogenetic classification of bony fishes. BMC Evol. Biol. 17, 162. doi: 10.1186/s12862-017-0958-3
Brawand D., Wagner C. E., Li Y. I., Malinsky M., Keller I., Fan S., et al. (2014). The genomic substrate for adaptive radiation in African cichlid fish. Nature 513, 375–381. doi: 10.1038/nature13726
Chen B., Sun Z., Lou F., Gao T. X., Song N. (2020). Genomic characteristics and profile of microsatellite primers for Acanthogobius ommaturus by genome survey sequencing. Biosci. Rep. 40. doi: 10.1042/BSR20201295
Chen S. F., Zhou Y. Q., Chen Y. R., Gu J. (2018). fastp: an ultra-fast all-in-one FASTQ preprocessor. Bioinformatics 34, i884–i890. doi: 10.1093/bioinformatics/bty560
Chen W. J., Bonillo C., Lecointre G. (2003). Repeatability of clades as a criterion of reliability: a case study for molecular phylogeny of Acanthomorpha (Teleostei) with larger number of taxa. Mol. Phylogenet. Evol. 26, 262–288. doi: 10.1016/S1055-7903(02)00371-8
Danecek P., Bonfield J. K., Liddle J., Marshall J., Ohan V., Pollard M. O., et al. (2021). Twelve years of SAMtools and BCFtools. GigaScience 10. doi: 10.1093/gigascience/giab008
Degnan J. H., Rosenberg N. A. (2006). Discordance of species trees with their most likely gene trees. PloS Genet. 2, e68. doi: 10.1371/journal.pgen.0020068
Delsuc F., Brinkmann H., Philippe H. (2005). Phylogenomics and the reconstruction of the tree of life. Nat. Rev. Genet. 6, 361–375. doi: 10.1038/nrg1603
DePristo M. A., Banks E., Poplin R., Garimella K. V., Maguire J. R., Hartl C., et al. (2011). A framework for variation discovery and genotyping using next-generation DNA sequencing data. Nat. Genet. 43, 491–498. doi: 10.1038/ng.806
Dettai A., Lecointre G. (2004). In search of notothenioid (Teleostei) relatives. Antarct. Sci. 16, 71–85. doi: 10.1017/S095410200400183X
Dettai A., Lecointre G. (2005). Further support for the clades obtained by multiple molecular phylogenies in the acanthomorph bush. Cr. Biol. 328, 674–689. doi: 10.1016/j.crvi.2005.04.002
Dettaï A., Lecointre G. (2008). New insights into the organization and evolution of vertebrate IRBP genes and utility of IRBP gene sequences for the phylogenetic study of the Acanthomorpha (Actinopterygii: Teleostei). Mol. Phylogenet. Evol. 48, 258–269. doi: 10.1016/j.ympev.2008.04.003
Dierckxsens N., Mardulyn P., Smits G. (2017). NOVOPlasty: de novo assembly of organelle genomes from whole genome data. Nucleic. Acids Res. 45, e18. doi: 10.1093/nar/gkw955
Doolittle W. F., Logsdon J. M. Jr (1998). Archaeal genomics: do archaea have a mixed heritage? Curr. Biol. 8, R209–R211. doi: 10.1016/S0960-9822(98)70127-7
Froese R., Pauly D. (Eds.). (2023). FishBase (World Wide Web electronic publication). Available at: www.fishbase.org.
Gaither M. R., Gkafas G. A., de Jong M., Sarigol F., Neat F., Regnier T., et al. (2018). Genomics of habitat choice and adaptive evolution in a deep-sea fish. Nat. Ecol. Evol. 2, 680–687. doi: 10.1038/s41559-018-0482-x
Gomon M. F., Bray D. J., Kuiter R. H. (2008). Fishes of Australia's southern coast (Australia: New Holland Chatswood).
Greiner S., Lehwark P., Bock R. (2019). OrganellarGenomeDRAW (OGDRAW) version 1.3.1: expanded toolkit for the graphical visualization of organellar genomes. Nucleic. Acids Res. 47, W59–W64. doi: 10.1093/nar/gkz238
Howe K., Clark M. D., Torroja C. F., Torrance J., Berthelot C., Muffato M., et al. (2013). The zebrafish reference genome sequence and its relationship to the human genome. Nature 496, 498–503. doi: 10.1038/nature12111
Imamura H., Yabe M. (2002). Demise of the Scorpaeniformes (Actinopterygii: Percomorpha): an alternative phylogenetic hypothesis. Bull. Faculty Fisheries Hokkaido Univ. 53, 107–128.
Jo E., Cho Y. H., Lee S. J., Choi E., Kim J., Kim J. H., et al. (2021). Genome survey and microsatellite motif identification of Pogonophryne albipinna. Biosci. Rep. 41. doi: 10.1042/bsr20210824
Kawai T., Imamura H., Nakaya K. (2003). Paraheminodus kochiensis Kamohara 1957 (Teleostei: Peristediidae), a junior synonym of Paraheminodus murrayi (Günther 1880), with a comparison of Paraheminodus murrayi and Paraheminodus laticephalus (Kamohara 1952). Ichthyol. Res. 51, 73–76. doi: 10.1007/s10228-003-0188-0
Klicka J., Voelker G., Spellman G. M. (2005). A molecular phylogenetic analysis of the "true thrushes" (Aves: Turdinae). Mol. Phylogenet. Evol. 34, 486–500. doi: 10.1016/j.ympev.2004.10.001
Kon T., Pei L., Ichikawa R., Chen C., Wang P., Takemura I., et al. (2021). Whole-genome resequencing of large yellow croaker (Larimichthys crocea) reveals the population structure and signatures of environmental adaptation. Sci. Rep. 11, 11235. doi: 10.1038/s41598-021-90645-1
Lautredou A.-C., Motomura H., Gallut C., Ozouf-Costaz C., Cruaud C., Lecointre G., et al. (2013). New nuclear markers and exploration of the relationships among Serraniformes (Acanthomorpha, Teleostei): the importance of working at multiple scales. Mol. Phylogenet. Evol. 67, 140–155. doi: 10.1016/j.ympev.2012.12.020
Li H. (2014). Toward better understanding of artifacts in variant calling from high-coverage samples. Bioinformatics 30, 2843–2851. doi: 10.1093/bioinformatics/btu356
Li B., Dettaï A., Cruaud C., Couloux A., Desoutter-Meniger M., Lecointre G. (2009). RNF213, a new nuclear marker for acanthomorph phylogeny. Mol. Phylogenet. Evol. 50, 345–363. doi: 10.1016/j.ympev.2008.11.013
Li H., Durbin R. (2011). Inference of human population history from individual whole-genome sequences. Nature 475, 493–496. doi: 10.1038/nature10231
Liu Z., Liu S., Yao J., Bao L., Zhang J., Li Y., et al. (2016b). The channel catfish genome sequence provides insights into the evolution of scale formation in teleosts. Nat. Commun. 7, 11757. doi: 10.1038/ncomms11757
Liu B. H., Shi Y. J., Yuan J. Y., Hu X. S., Zhang H., Li N., et al. (2013). Estimation of genomic characteristics by analyzing k-mer frequency in de novo genome projects. arXiv. doi: 10.48550/arXiv.1308.2012
Luo R., Liu B., Xie Y., Li Z., Huang W., Yuan J., et al. (2012). SOAPdenovo2: an empirically improved memory-efficient short-read de novo assembler. GigaScience 1, 18. doi: 10.1186/2047-217X-1-18
Mirande J. M. (2017). Combined phylogeny of ray-finned fishes (Actinopterygii) and the use of morphological characters in large-scale analyses. Cladistics 33, 333–350. doi: 10.1111/cla.12171
Molnár T., Benedek I., Kovács B., Zsolnai A., Lehoczky I. (2020). Genetic consequences of pond production of a pikeperch (Sander lucioperca L.) stock with natural origin: the effects of changed selection pressure and reduced population size. PeerJ 8, e8745. doi: 10.7717/peerj.8745
Nakhleh L. (2013). Computational approaches to species phylogeny inference and gene tree reconciliation. Trends. Ecol. Evol. 28, 719–728. doi: 10.1016/j.tree.2013.09.004
Near T. J., Dornburg A., Harrington R. C., Oliveira C., Pietsch T. W., Thacker C. E., et al. (2015). Identification of the notothenioid sister lineage illuminates the biogeographic history of an Antarctic adaptive radiation. BMC Evol. Biol. 15, 1–14. doi: 10.1186/s12862-015-0362-9
Ortiz E. M. (2019). vcf2phylip v2.0: Convert a VCF matrix into several matrix formats for phylogenetic analysis (v2.0). Zenodo. doi: 10.5281/zenodo.2540861
Pietsch T. W. (1989). Phylogenetic relationships of trachinoid fishes of the family Uranoscopidae. Copeia 1989, 253–303. doi: 10.2307/1445425
Prokofiev A. M. (2021). To the taxonomy of the stargazers of the genus Uranoscopus of the indo-Pacific waters with a description of three new species (Uranoscopidae). J. Ichthyol 61, 655–679. doi: 10.1134/S0032945221050131
Purkhold U., Pommerening-Röser A., Juretschko S., Schmid M. C., Koops H. P., Wagner M. (2000). Phylogeny of all recognized species of ammonia oxidizers based on comparative 16S rRNA and amoA sequence analysis: implications for molecular diversity surveys. Appl. Environ. Microbiol. 66, 5368–5382. doi: 10.1128/AEM.66.12.5368-5382.2000
Rougemont Q., Carrier A., Le Luyer J., Ferchaud A. L., Farrell J. M., Hatin D., et al. (2019). Combining population genomics and forward simulations to investigate stocking impacts: A case study of Muskellunge (Esox masquinongy) from the St. Lawrence River basin. Evol. Appl. 12, 902–922. doi: 10.1111/eva.12765
Sayyari E., Mirarab S. (2016). Fast coalescent-based computation of local branch support from quartet frequencies. Mol. Biol. Evol. 33, 1654–1668. doi: 10.1093/molbev/msw079
Schwarzhans W. (2019). A comparative morphological study of recent otoliths of the so-called Trachinoidei. Memorie della Società Italiana di Sci. naturali e del Museo di Storia naturale di Milano 46, 371–388.
Seppey M., Manni M., Zdobnov E. M. (2019). BUSCO: assessing genome assembly and annotation completeness. Methods Mol. Biol. 1962, 227–245. doi: 10.1007/978-1-4939-9173-0_14
Smith W. L., Craig M. T. (2007). Casting the percomorph net widely: the importance of broad taxonomic sampling in the search for the placement of serranid and percid fishes. Copeia 2007, 35–55. doi: 10.1643/0045-8511(2007)7[35:CTPNWT]2.0.CO;2
Smith W. L., Wheeler W. C. (2004). Polyphyly of the mail-cheeked fishes (Teleostei: Scorpaeniformes): evidence from mitochondrial and nuclear sequence data. Mol. Phylogenet .Evol. 32, 627–646. doi: 10.1016/j.ympev.2004.02.006
Smith W. L., Wheeler W. C. (2006). Venom evolution widespread in fishes: a phylogenetic road map for the bioprospecting of piscine venoms. J. Hered. 97, 206–217. doi: 10.1093/jhered/esj034
Song N., Zhao X., Cai C., Gao T. (2022). Profile of the genomic characteristics and comparative studies of five Trichiuridae species by genome survey sequencing. Front. Mar. Sci. 9. doi: 10.3389/fmars.2022.962307
Springer M. S., Cleven G. C., Madsen O., de Jong W. W., Waddell V. G., Amrine H. M., et al. (1997). Endemic African mammals shake the phylogenetic tree. Nature 388, 61–64. doi: 10.1038/40386
Stamatakis A. (2014). RAxML version 8: a tool for phylogenetic analysis and post-analysis of large phylogenies. Bioinformatics 30, 1312–1313. doi: 10.1093/bioinformatics/btu033
Thacker C. E., Satoh T. P., Katayama E., Harrington R. C., Eytan R. I., Near T. J. (2015). Molecular phylogeny of Percomorpha resolves Trichonotus as the sister lineage to Gobioidei (Teleostei: Gobiiformes) and confirms the polyphyly of Trachinoidei. Mol. Phylogenet. Evol. 93, 172–179. doi: 10.1016/j.ympev.2015.08.001
Vilasri V. (2013). Comparative anatomy and phylogenetic systematics of the family Uranoscopidae (Actinopterygii: Perciformes). Memoirs Faculty Fisheries Sciences Hokkaido Univ. 55, 1–106.
Vilasri V., Ho H. C., Kawai T., Gomon M. F. (2019). A new stargazer, Ichthyscopus pollicaris (Perciformes: Uranoscopidae), from east Asia. Zootaxa 4702. doi: 10.11646/zootaxa.4702.1.10
Wu H. L., Zhong J. S. (2021). Key to marine and estuatial fishes of China (Beijing: China Agriculture Press), 20–888.
Xiong Y., Lei X., Bai S., Xiong Y., Liu W., Wu W., et al. (2021). Genomic survey sequencing, development and characterization of single- and multi-locus genomic SSR markers of Elymus sibiricus L. BMC Plant Biol. 21, 3. doi: 10.1186/s12870-020-02770-0
Xu J., Bian C., Chen K., Liu G., Jiang Y., Luo Q., et al. (2017). Draft genome of the northern snakehead, Channa argus. Gigascience 6, 1–5. doi: 10.1093/gigascience/gix011
Xu P., Zhang X., Wang X., Li J., Liu G., Kuang Y., et al. (2014). Genome sequence and genetic diversity of the common carp, Cyprinus carpio. Nat. Genet. 46, 1212–1219. doi: 10.1038/ng.3098
Xu S., Zhao L., Xiao S., Gao T. (2019). Whole genome resequencing data for three rockfish species of Sebastes. Sci. Data 6, 97. doi: 10.1038/s41597-019-0100-z
Keywords: Uranoscopidae, genome survey, mitochondria, genomic characteristics, phylogenetic evolution
Citation: Liu Q, Zhao X, Qu Y, Wang Y, Guo X, Li W, Gao T and Qiao Y (2024) A comprehensive genome survey study unveils the genomic characteristics and phylogenetic evolution of fishes in the Uranoscopidae family. Front. Mar. Sci. 11:1383635. doi: 10.3389/fmars.2024.1383635
Received: 07 February 2024; Accepted: 03 May 2024;
Published: 21 May 2024.
Edited by:
Andrew Stanley Mount, Clemson University, United StatesReviewed by:
Mbaye Tine, Gaston Berger University, SenegalQiong Shi, BGI Academy of Marine Sciences, China
Copyright © 2024 Liu, Zhao, Qu, Wang, Guo, Li, Gao and Qiao. This is an open-access article distributed under the terms of the Creative Commons Attribution License (CC BY). The use, distribution or reproduction in other forums is permitted, provided the original author(s) and the copyright owner(s) are credited and that the original publication in this journal is cited, in accordance with accepted academic practice. No use, distribution or reproduction is permitted which does not comply with these terms.
*Correspondence: Tianxiang Gao, Z2FvdGlhbnhpYW5nMDYxMUAxNjMuY29t; Ying Qiao, cWlhb3lpbmcwNjE4QGhvdG1haWwuY29t