- 1Third Institute of Oceanography, Ministry of Natural Resources, Xiamen, China
- 2Fujian Provincial Key Laboratory of Marine Physical and Geological Processes, Xiamen, China
- 3Xiamen Ocean Vocational College, Xiamen, China
The effects of high-intensity impulsive noise generated by pile driving on fish are a major concern in environmental impact assessments. Numerical acoustic models are essential for predicting underwater-acoustic-related problems in complex coastal environments prior to offshore construction. However, underwater noise modeling for impact pile driving has often been performed using simplistic propagation models that are inadequate for three-dimensional (3D) environments. A 3D parabolic equation method (PE) was established in this study to better predict broadband transmission loss (TL) from impact pile driving in complex coastal environments and its influence on the large yellow croaker (Pseudosciaena crocea). The effects of 3D propagation were investigated using two realistic scenarios with different bathymetric complexities. The values and attenuation rate of the broadband TL for the steeply sloped bottom were significantly greater than those for the flat and weakly varying bottoms over 3 km. At a water depth of 5 m, a difference of approximately 10 dB was observed between the two TL scenarios at a distance of 4.5 to 5 km. The simulation results are in reasonable agreement with the field measurement data, with a difference of less than 3 dB. The zones of behavioral response and injury in the large yellow croaker were estimated using the For3D model. The results showed that the effects of the noise generated by the impact pile driving on the large yellow croaker were evident and three-dimensional. Therefore, 3D propagation effects should be considered when analyzing the influence of underwater noise on marine animals.
Introduction
Marine ecological environments have suffered as a result of the last ten years’ rapid advancements in marine engineering. Particularly, the ecological effects of underwater noise generated by marine engineering operations on fish, invertebrate species, and marine mammals have given rise to grave concerns (Williams et al., 2015; Popper and Hawkins, 2016; Hastie et al., 2019). Impact pile driving during the installation of offshore foundations is a major contributor to anthropogenic underwater noise, and the noise levels increase with increasing pile diameter and hammer energy (Martin and Barclay, 2019).
Many recent investigations have indicated that the high-intensity impulsive noise generated by impact pile driving leads to temporary or permanent hearing damage in marine mammals and increases the risk to fish species (Bailey et al., 2010; Popper and Hawkins, 2019; Ainslie et al., 2020). Considerable work has been conducted on the potential effects of noise on fish (Popper and Calfee, 2023; Stöber and Thomsen, 2019). However, major gaps remain in the information concerning the potential effects of noise on fish (Hawkins et al., 2020), especially on the Large Yellow Croaker, Pseudosciaena crocea, a major economically important aquaculture fish species in China (Niu et al., 2023). Therefore, we focused on assessing the impact of pile-driving noise on large yellow croakers.
In most projects, an environmental impact assessment that includes the prediction of noise levels is required prior to installing piles in most projects (Stöber and Thomsen, 2019). Environmental risk assessments typically require knowledge of the zero-to-peak sound pressure level (SPLpk), root-mean-square SPL (SPLrms), and cumulative sound exposure level (SELcum) (Popper et al., 2014; Southall et al., 2019; Hawkins et al., 2020). The noise generated from impact pile driving includes a short signal with a high peak pressure amplitude followed by fast decay, and its spectrum is broadband, with most of the energy below 1 kHz (Leunissen and Dawson, 2018).
With the increase in computerization and the need for deeper knowledge of noise generation and propagation, various models have been proposed. Numerical models are often used to solve underwater acoustic-related problems in complex coastal environments and to accurately predict the source levels generated by impact pile driving and transmission loss (TL) before proceeding with offshore construction. The generation and propagation of low-frequency pulse sounds from offshore pile driving have been extensively studied using various computational modeling methods (Fang et al., 2019; Tsouvalas, 2020; Peng et al., 2021; Song et al., 2023). Sound generation models are typically based on finite-element (FE) or finite-difference methods (Reinhall and Dahl, 2011; Zampolli et al., 2013; MacGillivray, 2014). Sound propagation models for calculating TL at different distances include the normal mode, wavenumber integration, and parabolic equation (PE) methods (Kim et al., 2012; Lippert and von Estorff, 2014; Wilkes et al., 2016). The numerical predictions of these models were consistent (Lippert and von Estorff, 2014). Underwater sound propagation in shallow-water environments, however, can be greatly impacted by three-dimensional (3D) effects, such as physical, oceanographic, and geological features that can cause the horizontal reflection, refraction, and diffraction of sound. Therefore, 3D acoustic propagation models that can accurately predict the range within which underwater noise exerts an impact have been presented and used to study the propagation of the noise generated by pile driving (Lin et al., 2019; von Pein et al., 2019; Oliveira et al., 2021). Based on the governing equations and numerical schemes, 3D underwater acoustic models can be divided into three main groups: PE, normal mode, and ray- and beam-tracing models (Oliveira et al., 2021). However, the study of the 3D acoustic propagation of impact pile driving noise is still in its infancy (Porter, 2019). At present, 3D models have rarely been used to assess acoustic ecological implications. Noise modeling for acoustic risk assessments is often performed using simplistic propagation models (Clark et al., 2009; Pine et al., 2020). For instance, sound propagation is often simplified in one or several (N) planes (2D) (Aulanier et al., 2017; Cominelli et al., 2020) instead of using a full 3D propagation model. Nevertheless, 2D or N×2D models that ignore the horizontal refraction of rays are limited in complex geometries, like coastal and estuarine areas (Porter, 2019; Sagers et al., 2019; Richard et al., 2023).
The 3D acoustic propagation of noise from impact pile driving in a complex coastal environment and its effects on the large yellow croaker (Pseudosciaena crocea) are investigated in the present study. The main purpose of this study is to explain the 3D effects of noise on marine life. The sound exposure source level (SL) of the impact pile driving noise was obtained from file measurements (Niu et al., 2023). The zones of behavioral disturbance and PTS effects in large populations of yellow croakers were then evaluated using broadband TL estimations based on the 3D PE model. This study showed that the range of effects on croakers differs in different directions.
Sound propagation models
Models for calculating underwater sound propagation include the ray, PE, wavenumber integral, normal wave, and FE methods. These models often idealize seawater as a uniform fluid medium with flat upper and lower boundaries, and the seafloor is assumed to be composed of one or multiple layers of sediment of uniform thickness. However, the ocean boundaries are not completely flat in real-world environments. Seafloor structures, such as steep slopes and basins, have a significant 3D distribution. Azimuth-independent (Nx2D) mode is frequently used when running 3D normal mode models (Kraken3D). Owing to their approximate nature, 3D ray models (Bellhop3D) are typically better at high frequencies (Jensen et al., 2011), which could present some limitations in practical applications for impact pile driving noise. 3D PE models are regarded as one of the most efficient and accurate methods for modeling sound propagation in complex range-dependent environments; therefore, they were utilized in the present study. Furthermore, the method was chosen because it is suitable for low-frequency calculations (below approximately 3000 Hz), where most of the pile driving energy is contained (Stockham et al., 2010).
A 3D wave propagation model of the parabolic approximation type (For3D) is considered to be an efficient and accurate method for solving 3D ocean acoustic problems. The For3D model uses the Lee-Saad-Schultz method to solve the 3D wide-angle wave equation (Botseas et al., 1987; Lee et al., 1992). The model was designed to predict TL in ocean environments that vary as functions of range, depth, and azimuth. Propagation situations classified as 3D or N×2D are described in For3D. The output result of N×2D is a pseudo-3D sound field that ignores the change in sound energy caused by the change in the horizontal orientation based on the independent calculation and interpolation of each section. The azimuthal coupling is considered in the calculation for full 3D propagation. The propagation in at least one vertical plane of constant azimuth is coupled to that in another plane, which is more suitable for an actual ocean environment. Therefore, the 3D version of the For3D model used in this study has higher calculation precision and accuracy than the non-3D versions.
Study area and simulation scenarios
Sandu Bay, Ningde City, Fujian Province, China, was chosen as the study area because of its extremely complex environment, especially its highly variable bathymetry (Figure 1A). By interpolating the measured values, the bathymetry of the studied area was ascertained. In the study area, there is a deep-water channel that runs northeast at depths between 42 and 55 meters. Water depths along the southeastern and northwestern directions were shallow and varied significantly. The water column sound speed profile (SSP; Figure 1B) of the study area was also measured using an SVP (Minos X, AML Oceanographic) during the construction of the Dong-Wu-Yang cross-sea bridge (26.66°N, 119.94°E) in April 2022 (Niu et al., 2023). The SSP used in the simulation was assumed to be independent of range.
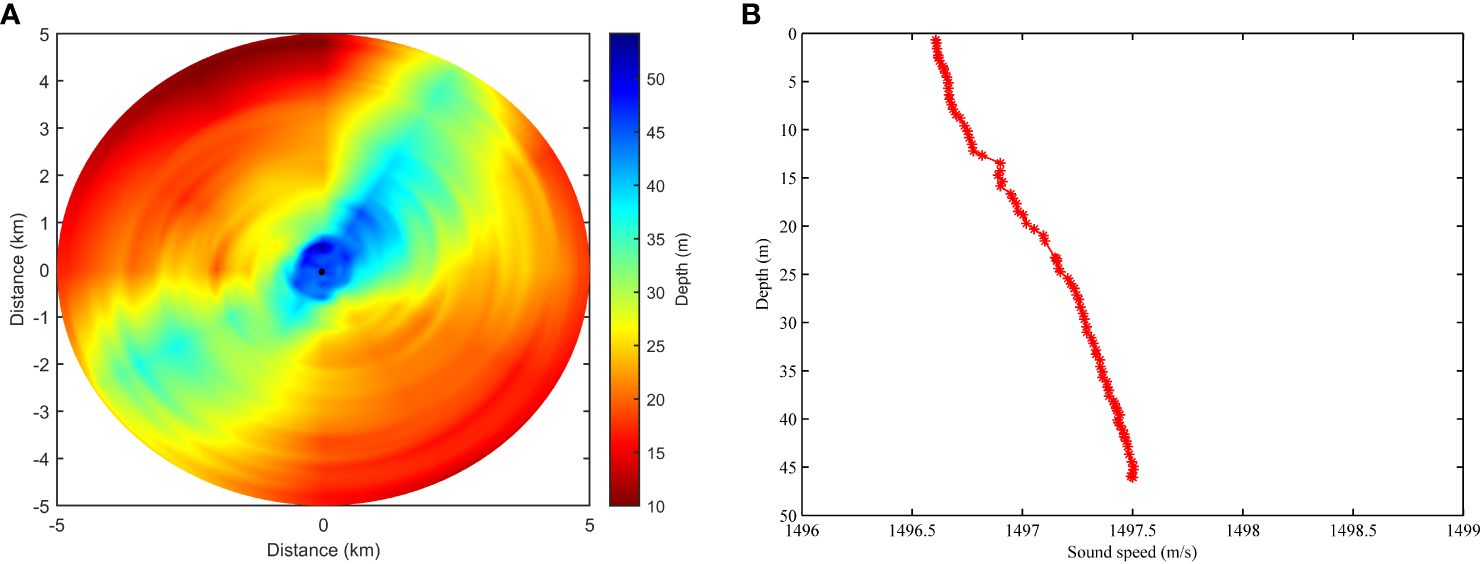
Figure 1 Bathymetry (A) and Sound speed profile (B) used in the simulation. The black solid circle indicates the location of the sound source to be modeled.
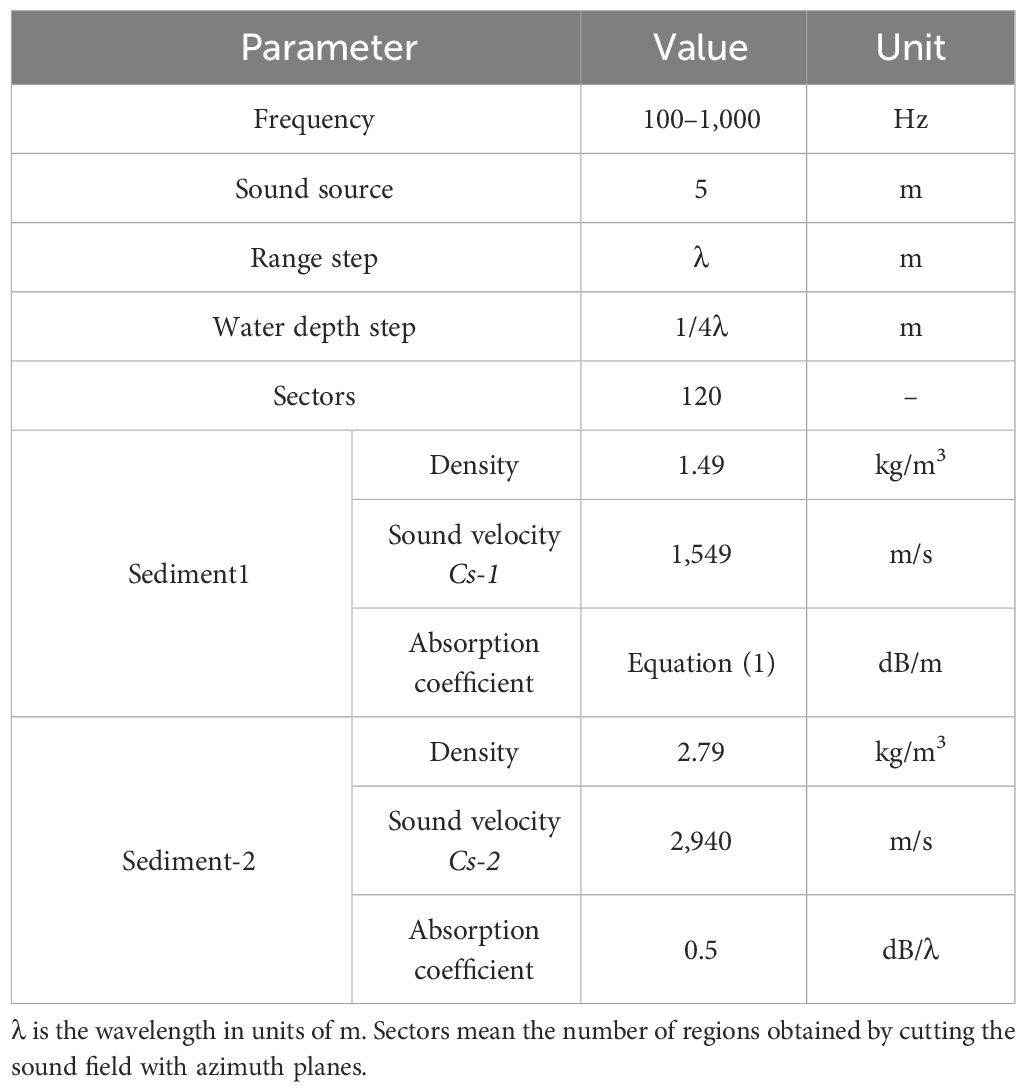
The ocean bottom was divided into two layers. The sound speed and density of the first layer in the simulation were 1,549 m/s and 1.49 kg/m3, respectively. The absorption coefficient of the first sediment layer was calculated as Equation 1 (Zhou et al., 2009):
where f is frequency in units of kHz.
For the second layer, the values corresponding to the bottom characteristics were 2,940 m/s, 2.79 kg/m3, and 0.5 dB/λ, respectively. where λ is the wavelength (m).
The location of the impact pile driving (black solid circle in Figure 1A) was selected to model the noise source. The starting field of the For3D model was Gaussian. Simulations of all one-thirds of the octave frequencies within 100 and 1,000 Hz were performed using a sound source placed at a depth of 5 m. In total, 120 sectors were used in the simulations. The azimuthal resolution of the sound propagation model was 3°. As the wavelength decreases with increasing frequency, smaller spatial distances between the calculation points must be used. Therefore, the range and water depth steps were set to one wavelength and approximately one-quarter of the wavelength in the simulations, respectively. The details of the critical parameters in the simulations using the For3D model are listed in Table 1. Simultaneously, because the boundary effect introduced by the 3D PE model may lead to anomalies at the bottom boundary on both sides of the sector, the abnormal calculation results for the benthic boundary layer were removed. Two realistic scenarios were selected to simulate different levels of bathymetry complexity. The first scenario was selected to study sound propagation on a flat and weakly varying bottom along the 30° direction. The second scenario, with a steeply sloped bottom, was selected to investigate the 3D effects of sound through an upward slope of 5 km in length, with the water depth varying from 55 to 20 m along the direction of 183°.
Through field measurements, the sound source level of the noise produced by impact pile driving was determined. The length, diameter, and wall thickness of the steel casing piles were 80, 2.5, and 2.6 cm, respectively. The pile was driven into the seabed by using a hydraulic impact hammer (IHC-800; IHC, Kinderdijk, Netherlands) with a strike energy rating of 245 kJ. Autonomous low-power underwater acoustic recorders (USR2000, IOACAS) with omnidirectional hydrophones at a depth of 5 m were used to record the noise generated from the impact pile driving. The effective receive sensitivity of the hydrophone was −220 dB re V/μPa with a flat frequency response (within ±2 dB) over the frequency band 20 Hz to 20 kHz.
Pile driving signals and various metrics such as the SPLpk and SEL of each hammer strike signal were analyzed using custom scripts written in MATLAB R2019a (MathWorks, Inc., Natick, MA, USA). SPLpk and SEL indicate the maximum peak pressure of the impulse signal and total sound energy for the duration of a single pulse, respectively. All the SEL values reported in this study are single-strike values and can better characterize the pulse signal by processing the signal from the strike energy. The SPLpk and SEL were calculated using the following Equations 2 and 3:
where p(t) is the sound pressure time series recorded at the receiver. The pulse duration T for impulsive signals denotes an interval containing 90% sound energy (ISO 18406, 2017). The signal duration boundary is typically selected as the time duration when the cumulative energy exceeds 5% of the total energy and ends when the cumulative energy reaches 95% (Southall et al., 2007). The peak-to-peak sound pressure SL and single-pulse sound exposure SL for impact pile driving derived from the literature (Niu et al., 2023) were 244.7 dB re 1 μPa @1m and 208.1 dB re 1 μPa2·s @1m, respectively.
The results of the simulation by For3D showed transmission loss at one frequency, whereas the majority of sound energy from impact pile driving was broadband and concentrated at a low frequency between 0.1 and 1 kHz (Niu et al., 2023). Therefore, the broadband TL of the 1/3-octave-bands between 0.1 and 1 kHz is calculated as Equation 4:
where is the TL at the i-th center frequency. and denote the upper and lower limits of the i-th 1/3-octave-band, respectively.
The received levels (RLs) at any location and depth in the study area were estimated using the impact pile driving the SL and TL matrices provided by For3D. The equation is as Equation 5:
To investigate the 3D effects of propagation models in the context of environmental risk assessment, the estimated received noise levels must be coupled to known biological effects. The study’s two primary effects, behavioral responses and injuries, are the two main effects to be taken into account when analyzing potential effects on fish (Popper et al., 2014; Hawkins et al., 2020). Based on the results of Popper and Hawkins (2019) and Niu et al. (2023), the thresholds of behavioral response and injury for the large yellow croaker in this study were set to 207 dB re 1 μPa (SPLpk for single strike) and 140 dB re 1 μPa2·s (SEL for single strike), respectively.
Numerical results
Numerical results of sound propagation model
A comparison of the broadband TL obtained using the For3D model for the two scenarios is shown in Figure 2. The bathymetry and broadband TL over a range of 5 m for the two scenarios are shown in Figure 3. Although the change in the trends of TL with the change in distance was consistent, the values and attenuation rate of TL for the steeply sloped bottom were significantly greater than those for the flat and weakly varying bottoms over 3 km. In the first scenario, the water depth changed significantly along both sides of the propagation path, which induced intense horizontal refraction and mode coupling between the azimuthal angles. A difference of approximately 10 dB was observed between the two TL scenarios at 4.5 and 5 km at 5m of water depth.
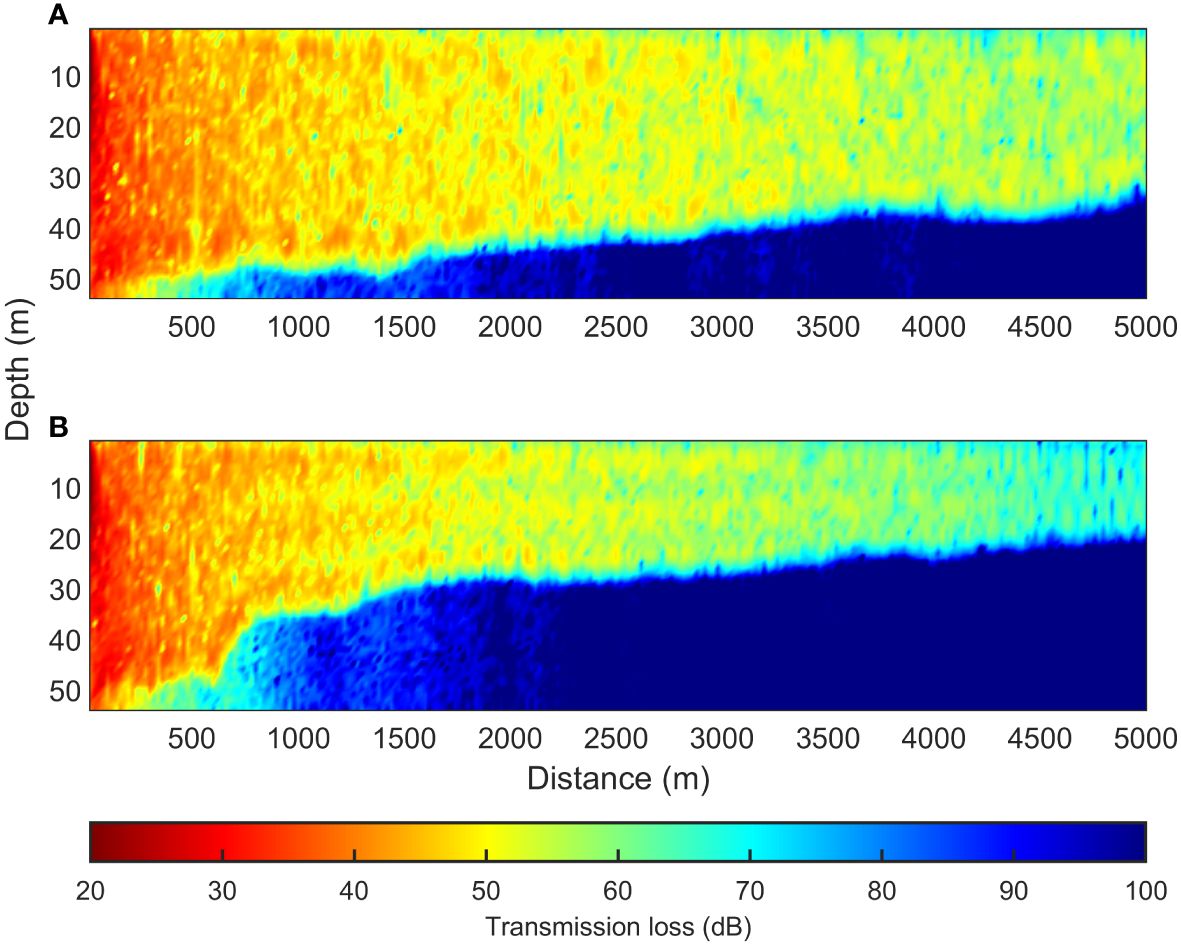
Figure 2 Comparison of broadband transmission losses between the two scenarios. (A) flat and weakly varying bottom, and (B) steeply sloped bottom.
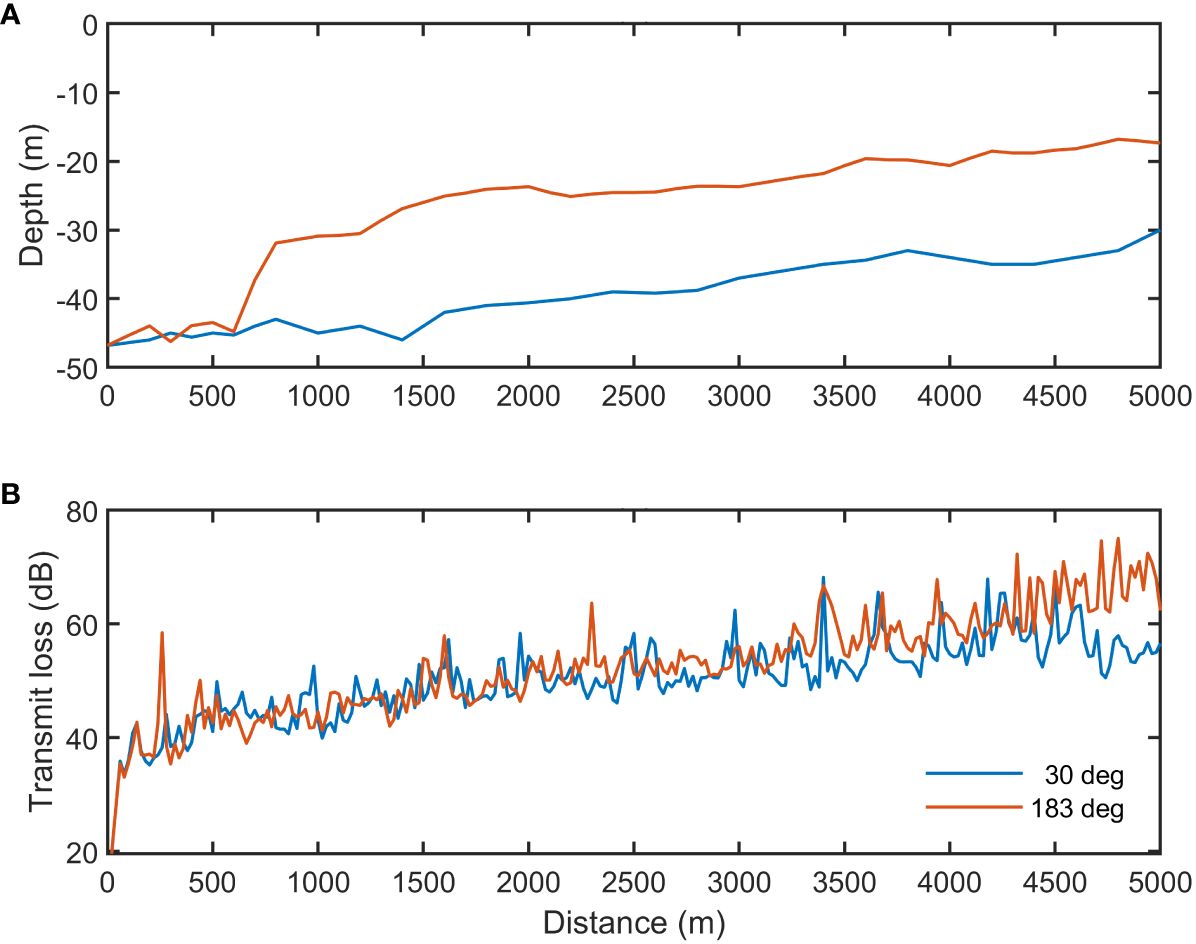
Figure 3 Comparison of the bathymetry (A) and broadband TL (B) over the range at a water depth of 5 m for the two scenarios.
To investigate the 3D effects of focusing and horizontal refraction, Figure 4 shows a comparison of the broadband TL of all azimuths at 5m water depth at receiving distances of 1000m, 3000m, and 5000 m. A comparison of the broadband TL between the 2D and 3D models at a depth of 5 m at the three receiving distances is shown in Figure 4. However, at the same receiving distance, the broadband transmission losses for different azimuths are different. The TL values at azimuths of 80°, 150°, and 220° unexpectedly increased by more than 15 dB at a distance of 1000m from the source (Figure 4A). For a distance of 5000m, the increased TL values were distributed at azimuths of 90°, 190°, and 310° (Figure 4C). Nonetheless, for the 3000m distance, there were no abrupt increases in some azimuths, even though the values of TL varied (Figure 4B).
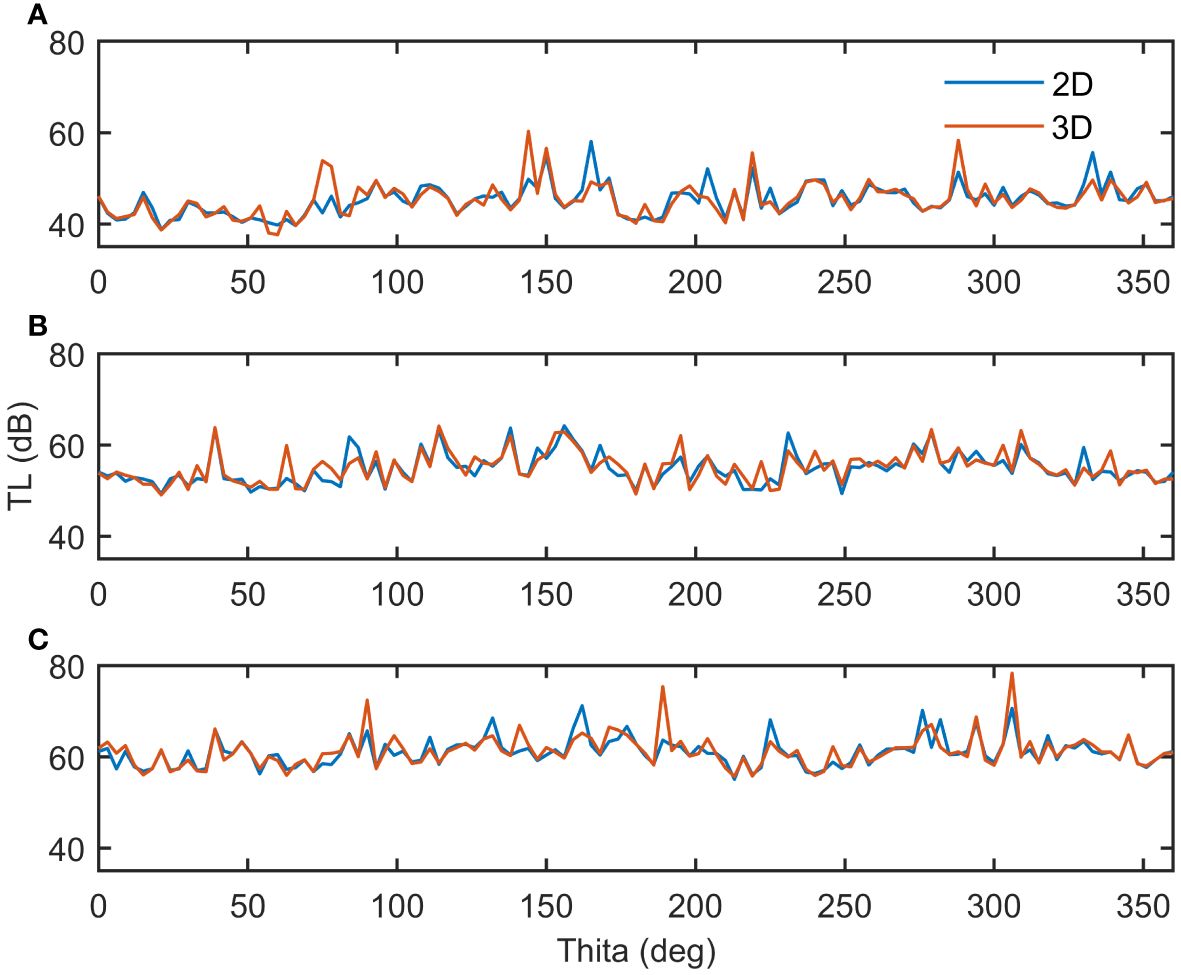
Figure 4 Comparison of the broadband TL of all azimuths at 5m water depth in 1,000m (A), 3,000m (B), and 5,000m (C) receiving distances, respectively. The blue and orange solid lines represent the broadband TL at N×2D and 3D, respectively.
A comparison of the SEL between the simulation and the field measurement data is presented in Table 2. Although the model results were slightly higher than the measured values, the TL values obtained using the For3D model at a depth of 5 m were in reasonable agreement with the measured values provided by Niu et al. (2023). The differences between the simulation and reality at multiple sites were less than 3 dB, excluding at a distance of 3563m with 8 dB. The relatively large difference is caused by the inconsistency between the interpolation of the bathymetry variables over the range and the realistic water depth.

Table 2 Comparison of SEL between the field measurement data by Niu et al., 2023 and the model data.
Effects of noise on large yellow croaker
The zones of behavioral response and injury estimated using the For3D model at a receiving depth of 5m for all azimuths are presented in Figure 5. As shown in Figure 5, the effects of noise generated from impact pile driving on the large yellow croaker are evident and three-dimensional. The range of behavioral responses for large yellow croakers was estimated to be approximately 4,500–5,000 m, which was greater in the northeast and southwest directions. The three-dimensional effects were more significant in injured areas (Figure 5B). The injury range for some azimuths was more than twice that of adjacent azimuths. Therefore, three-dimensional effects should be considered when analyzing the influence of underwater noise on marine animals.
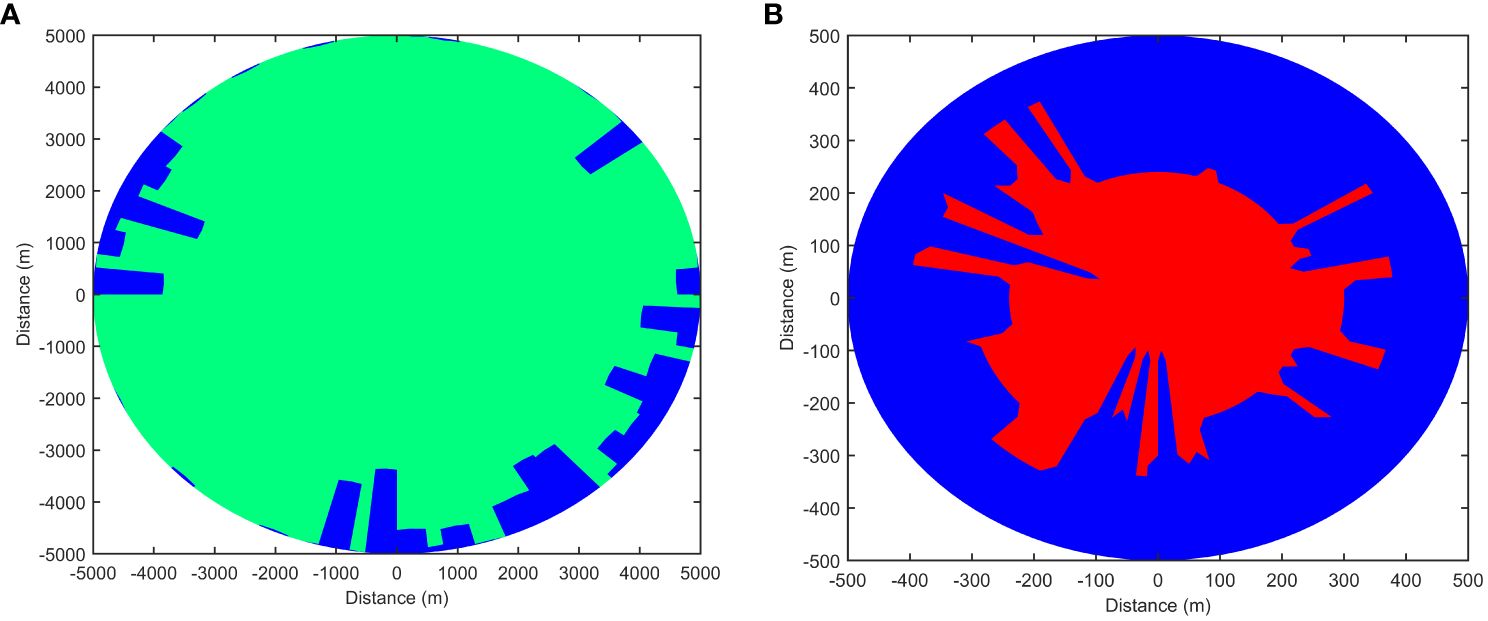
Figure 5 Zones of behavioral response (A) and injury (B) estimated by the For3D model at a receiving depth of 5m in all azimuths. Areas where behavioral response effects are depicted in green, and areas where injury effects are depicted in red.
Comparisons of the zones of behavioral response and injury between the two scenarios are shown in Figure 6, which reveals the 3D effects of the noise generated by impact pile driving on the large yellow croaker. The distances of the behavioral responses for the two scenarios were more than 4.2 km and extended to 5 km for the first scenario, with a weakly varying bottom. Based on the results of field observations of the behavioral response of the large yellow croaker in the first scenario during impact pile driving, strong behavioral responses, such as fleeing quickly with some jumping out of the water and rolling their belly, were observed in the 1000 m range. The degree of the behavioral response decreased with increasing distance. However, there were still slight changes in behavior, such as swimming faster and closer to 5 km. A detailed description can be found in Niu et al., 2023. Owing to multiple reflections at the interfaces and phase dispersion in the waveguide, there were several small areas in the behavioral response zone where SEL was less than 140 dB re 1 μPa2·s. Under both conditions, the damage areas were not larger than 500 m. Additionally, no discernible variations between the two scenarios were found.
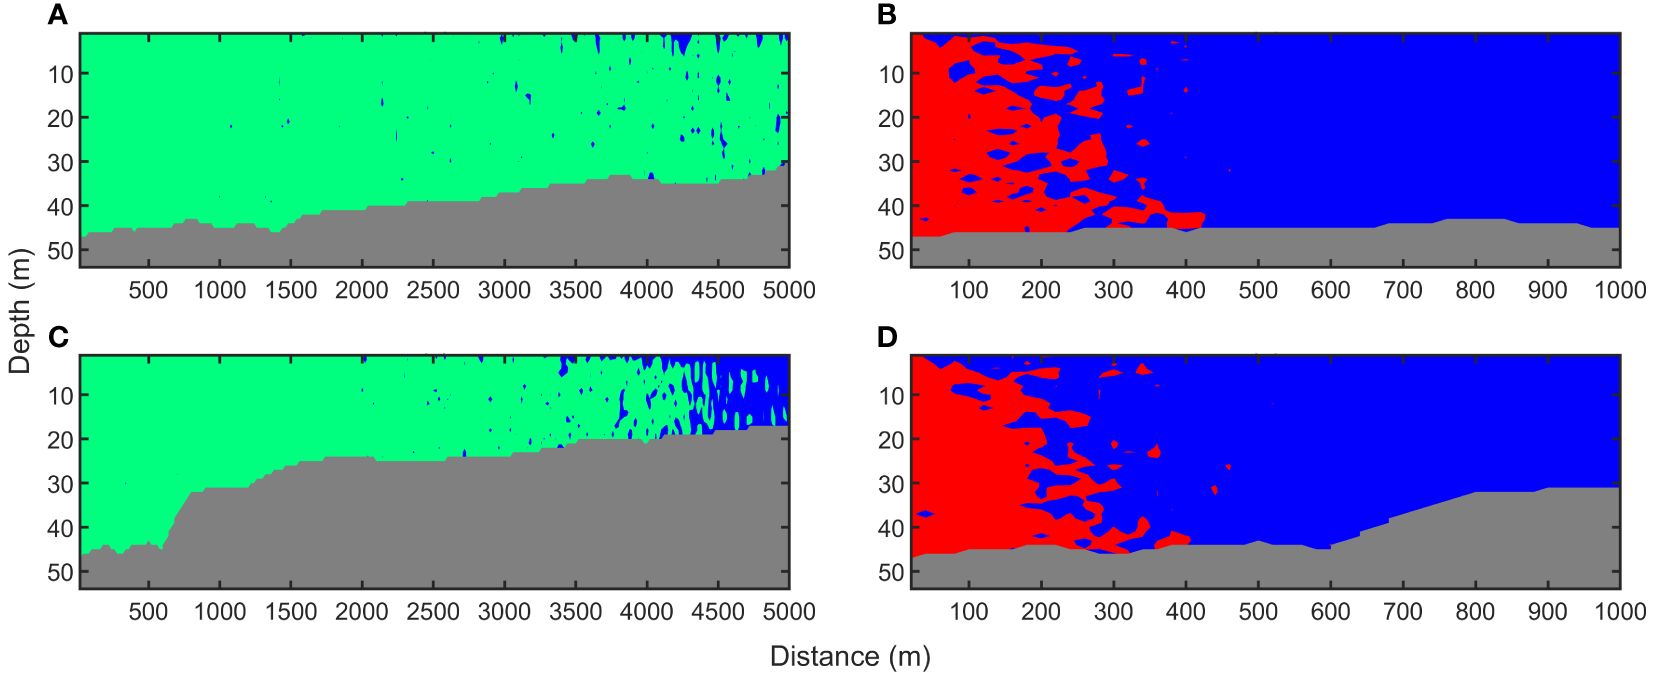
Figure 6 Comparison of the zones of behavioral response (left panel) and injury (right panel) between the two scenarios with a flat and weakly varying bottom (A, B) and a steeply sloped bottom (C, D). The seafloor is shown in gray, areas where behavioral response effects are depicted in green, and areas where injury effects are depicted in red.
Discussion and conclusion
The prediction of underwater sound levels is important for assessing environmental impacts. Sound levels are difficult to predict because of the dynamic and time-variant nature of the pile source and its dependence on complex and range-dependent underwater environments. During impact pile driving, the impact between the hammer and pile causes deformation in the pile material, which results in an initial pressure field in the environment. When the impulse force acted on top of the pile, compression waves were generated and propagated downward as Mach wave cones. The compression wave repeats an up-and-down oscillation process for a single strike until the energy is dissipated (Zampolli et al., 2013). There was no change in the energy generated by the impact pile driving without external energy interference in the ambient field. Therefore, energy loss caused by the water body was considered in the acoustic propagation model. In this study, a 3D PE underwater sound propagation model (For3D) was applied to predict the impact of pile driving noise in a complex shallow-water environment. The sound source levels used in this study were the measured values derived from the literature (Niu et al., 2023).
Underwater acoustic models can be used as an effective method for predicting the effects of noise on marine animals for environmental impact assessments when field acoustic data are unavailable (Aulanier et al., 2017; Lin et al., 2019; Richard et al., 2023). For coastal and estuarine areas, a full 3D acoustic propagation model is essential to predict the growth of anthropogenic noise pollution (Oliveira et al., 2021; Richard et al., 2023). The broadband TL of noise generated from impact pile driving and its potential effects on the large yellow croaker were investigated using the For3D model. The For3D model was more accurate at fine spatial scales, particularly in complex shallow-sea environments. In the present study, the 3D effects were mainly caused by bathymetric changes occurring on both sides of the propagation along a narrow deep-water channel. The results of the simulation using the For3D model showed reasonable agreement with the measured values in the same environment (Table 2). The inconsistency between the realistic water depth and the bathymetry variables interpolated over the range resulted in a significant discrepancy between the simulation and measured values only at a distance of 3,563 m.
Vibratory pile driving is a common methodology used for pile driving. Compared with impact pile driving, vibratory impact driving produces lower sound energy at frequencies below 100 Hz. Although strong behavioral changes in croakers, such as jumping out of water and rolling their bodies, appeared near the pile source during vibratory pile driving, there were no significant behavioral changes over a distance of 2000 m. However, the zones of behavioral response for croakers were predicted to be 5000 m for impact pile driving. Therefore, the high-energy impulses generated from impact pile driving were more harmful to the larger yellow croaker.
Marine life in coastal seas is likely to be exposed to the noise generated by anthropogenic activities (Duarte et al., 2021; Oliveira et al., 2021). The strong noise generated by impact-pile driving can potentially affect croakers who are sensitive to sound. In previous studies, the effects of noise on large yellow croaker populations have been investigated using simple linear regression and 2D propagation models. Based on field data under the same marine engineering and marine environment as in the present study, Niu et al. (2023) studied the propagation properties of impact pile driving noise by linear fitting regression and predicted that the range of behavioral responses for an adult large yellow croaker was 4,798 m. The predicted values are consistent with the results of this study. Wang et al. (2017) investigated the noise field distribution of underwater blasting and assessed its impact on a large yellow croaker using a 2D Monterey-Miami Parabolic Equation model. The results suggest that for a 155 kg charge, the adult yellow croaker requires a safe range of approximately 900 m. However, these studies assumed that the influence distance of each orientation was the same and did not provide three-dimensional effects. These predictions are not accurate for complex environments, such as the first scenario in this study. Therefore, the effects of 3D propagation in coastal environments must be considered. For marine environmental impact assessments in coastal areas, a full 3D propagation model has been established and is highly recommended; however, due to the high computational cost of these models, optimization is necessary. The development of tools to accelerate 3D propagation models, for example, through parallel computation, should be the focus of future research. Validating 3D acoustic models using in-situ measurements is also a future research priority. Such a validation would provide greater confidence in the models used to predict noise pollution.
The 3D acoustic model can accurately predict the influence of noise on the large yellow croaker, thereby improving risk assessment prior to marine and offshore construction. Furthermore, based on the predicted results, noise mitigation measures can be developed to protect the croakers. Although this investigation focused on the noise generated by impact pile driving and its effects on croakers, the results provide valuable information for developing underwater acoustic applications to reduce the effects of other types of impulse noise on fish species.
Data availability statement
The original contributions presented in the study are included in the article/supplementary material. Further inquiries can be directed to the corresponding author.
Ethics statement
This study conducted a numerical simulation of the effect of underwater noise on a large yellow croaker. No acoustic experiments have been conducted on the large yellow croaker. Ethical approval was not required for this study.
Author contributions
JX: Investigation, Methodology, Formal analysis, Writing – original draft. RX: Methodology, Data curation, Writing – original draft. FN: Methodology, Funding acquisition, Investigation, Supervision, Writing – review & editing. BC: Methodology, Validation, Writing – review & editing. YY: Methodology, Validation, Writing – review & editing.
Funding
The author(s) declare financial support was received for the research, authorship, and/or publication of this article. This research was supported by grants from the National Natural Science Foundation of China (41976175) and Natural Science Foundation of Fujian Province (2023J011377).
Conflict of interest
The authors declare that the research was conducted in the absence of any commercial or financial relationships that could be construed as a potential conflict of interest.
Publisher’s note
All claims expressed in this article are solely those of the authors and do not necessarily represent those of their affiliated organizations, or those of the publisher, the editors and the reviewers. Any product that may be evaluated in this article, or claim that may be made by its manufacturer, is not guaranteed or endorsed by the publisher.
References
Ainslie M. A., Halvorsen M. B., MÜller R. A. J., Lippert T. (2020). Application of damped cylindrical spreading to assess range to injury threshold for fishes from impact pile driving. J. Acoust. Soc Am. 148, 108–121. doi: 10.1121/10.0001443
Aulanier F., Simard Y., Roy N., Gervaise C., Bandet M. (2017). Effects of shipping on marine acoustic habitats in canadian arctic estimated via probabilistic modeling and mapping. Mar. pollut. Bull. 125, 115–131. doi: 10.1016/j.marpolbul.2017.08.002
Bailey H., Senior B., Simmons D., Rusin J., Picken G., Thompson P. M. (2010). Assessing underwater noise levels during pile-driving at an offshore windfarm and its potential effects on marine mammals. Mar. pollut. Bull. 60, 888–897. doi: 10.1016/j.marpolbul.2010.01.003
Botseas G., Lee D., King D. (1987). FOR3D: A computer model for solving the LSS three-dimensional, wide angle wave equation. Nav. Underwater Syst. Ctr Tech. Rept. 7943.
Clark C., Ellison W., Southall B., Hatch L., Van Parijs S., Frankel A., et al. (2009). Acoustic masking in marine ecosystems: intuitions, analysis, and implication. Mar. Ecol. Prog. Ser. 395, 201–222. doi: 10.3354/meps08402
Cominelli S., Halliday W. D., Pine M. K., Hilliard R. C., Lawson J. W., Duman N. I., et al. (2020). Vessel noise in spatially constricted areas: modeling acoustic footprints of large vessels in the Cabot Strait. Eastern Canada. Ocean Coast. Manage. 194, 105255. doi: 10.1016/j.ocecoaman.2020.105255
Duarte C. M., Chapuis L., Collin S. P., Costa D. P., Devassy R. P., Eguiluz V. M., et al. (2021). The soundscape of the Anthropocene ocean. Science 371, eaba4658. doi: 10.1126/science.aba4658
Fang Y. Y., Sung P. J., Hu W. C., Chen C. F. (2019). Underwater noise simulation of impact pile driving for offshore wind farm in Taiwan. J. Theor. Comp. Acoust. 27, 1950009. doi: 10.1142/S2591728519500099
Hastie G., Merchant N. D., GÖtz T., Russell D. J. F., Thompson P., Janik V. M. (2019). Effects of impulsive noise on marine mammals: Investigating range-dependent risk. Ecol. Appl. 29, e01906. doi: 10.1002/eap.1906
Hawkins A. D., Johnson C., Popper A. N. (2020). How to set sound exposure criteria for fishes. J. Acoust. Soc Am. 147, 1762–1777. doi: 10.1121/10.0000907
ISO 18406 (2017). Underwater acoustics measurement of radiated underwater sound from percussive pile driving (Geneva, Switzerland: International Organization for Standardization). doi: 10.3403/30275155u
Jensen F. B., Kuperman W. A., Porter M. B., Schmidt H. (2011). Computational Ocean Acoustics (Berlin: Springer Science and Business Media). doi: 10.1007/978-1-4419-8678-8
Kim H., Potty G. R., Miller J. H., Smith K. B., Dossot G. (2012). Long range propagation modeling of offshore wind turbine noise using finite element and parabolic equation models. J. Acoust. Soc Am. 131, 3392–3396. doi: 10.1121/1.4708798
Lee D., Botseas G., Siegmann W. L. (1992). Examination of three-dimensional effects using a propagation model with azimuth-coupling capability (FOR3D). J. Acoust. Soc Am. 91, 3192–3202. doi: 10.1121/1.402856
Leunissen E. M., Dawson S. M. (2018). Underwater noise levels of pile-driving in a New Zealand harbour, and the potential impacts on endangered Hector’s dolphins. Mar. pollut. Bull. 135, 195–204. doi: 10.1016/j.marpolbul.2018.07.024
Lin Y. T., Newhall A. E., Miller J. H., Potty G. R., Vigness-Raposa K. J. (2019). A three-dimensional underwater sound propagation model for offshore wind farm noise prediction. J. Acoust. Soc Am. 145, EL335–EL340. doi: 10.1121/1.5126011
Lippert T., von Estorff O. (2014). The significance of parameter uncertainties for the prediction of offshore pile driving noise. J. Acoust. Soc Am. 136, 2463–2471. doi: 10.1121/1.4896458
MacGillivray A. O. (2014). Finite difference computational modeling of marine impact pile driving. J. Acoust. Soc Am. 136, 2206–2211. doi: 10.1121/1.4900002
Martin S. B., Barclay D. R. (2019). Determining the dependence of marine pile driving sound levels on strike energy, pile penetration, and propagation effects using a linear mixed model based on damped cylindrical spreading. J. Acoust. Soc Am. 146, 109–121. doi: 10.1121/1.5114797
Niu F. Q., Xie J. R., Zhang X. X., Xue R. C., Chen B. Q., Liu Z. W., et al. (2023). Assessing differences in acoustic characteristics from impact and vibratory pile installation and their potential effects on the large yellow croaker (Pseudosciaena crocea). Front. Mar. Sci. 10. doi: 10.3389/fmars.2023.1106980
Oliveira T. C. A., Lin Y. T., Porter M. B. (2021). Underwater sound propagation modeling in a complex shallow water environment. Front. Mar. Sci. 8. doi: 10.3389/fmars.2021.751327
Peng Y. X., Tsouvalas A., Stampoultzoglou T., Metrikine A. (2021). A fast computational model for near- and far-field noise prediction due to offshore pile driving. J. Acoust. Soc Am. 149, 1772–1790. doi: 10.1121/10.0003752
Pine M. K., Nikolich K., Martin B., Morris C., Juanes F. (2020). Assessing auditory masking for management of underwater anthropogenic noise. J. Acoust. Soc Am. 147, 3408–3417. doi: 10.1121/10.0001218
Popper A. N., Calfee R. D. (2023). Sound and sturgeon: Bioacoustics and anthropogenic sound. J. Acoust. Soc Am. 154, 2021–2035. doi: 10.1121/10.0021166
Popper A. N., Hawkins A. D., Fay R. R., Mann D. A., Bartol S., Carlson T. J., et al. (2014). “Introduction,” in ASA S3/SC1.4 TR-2014 Sound Exposure Guidelines for Fishes and Sea Turtles: A Technical Report prepared by ANSI-Accredited Standards Committee S3/SC1 and registered with ANSI (Springer, Cham). doi: 10.1007/978–3-319–06659-2_1
Popper A. N., Hawkins A. (2016). The Effects of Noise on Aquatic Life II (New York, USA: Springer). doi: 10.1007/978–1-4939–2981-8
Popper A. N., Hawkins A. (2019). An overview of fish bioacoustics and the impacts of anthropogenic sounds on fishes. J. Fish Biol. 94, 692–713. doi: 10.1111/jfb.13948
Porter M. B. (2019). Beam tracing for two-and three-dimensional problems in ocean acoustics. J. Acoust. Soc Am. 146, 2016–2029. doi: 10.1121/1.5125262
Reinhall P. G., Dahl P. H. (2011). Underwater Mach wave radiation from impact pile driving: Theory and observation. J. Acoust. Soc Am. 130, 1209–1216. doi: 10.1121/1.3614540
Richard G., Mathias D., Collin J., Chauvaud L., Bonnel J. (2023). Three-dimensional anthropogenic underwater noise modeling in an Arctic fjord for acoustic risk assessment. Mar. pollut. Bull., 114487. doi: 10.1016/j.marpolbul.2022.114487
Sagers J. D., Lenhart R. D., Ballard M. S. (2019). Observation of out-of-plane ambient noise on two vector sensor moorings in Lake Travis. J. Acoust. Soc Am. 146, 1903–1912. doi: 10.1121/1.5125429
Song Z., Li H., Su Y., Cao P., Ou W., Sun S., et al. (2023). “Investigation on pile driving noise production and mitigation through bubble curtain,” in 2023 International Conference on Marine Equipment & Technology and Sustainable Development. METSD 2023. Lecture Notes in Civil Engineering, vol. 375 . Ed. Yang D. (Springer, Singapore). doi: 10.1007/978–981-99–4291-6–1
Southall B. L., Bowles A. E., Ellison W. T., Finneran J. J., Gentry R. L., Greene C. R. Jr., et al. (2007). Marine mammal noise exposure criteria: Initial scientific recommendations. Aquat. Mamm. 33, 1–121. doi: 10.1578/AM.33.4.2007.411
Southall B. L., Finneran J. J., Reichmuth C., Nachtigall P. E., Ketten D. R., Bowles A. E., et al. (2019). Marine mammal noise exposure criteria: Updated scientific recommendations for residual hearing effects. Aquat. Mamm 45, 125–232. doi: 10.1578/AM.45.2.2019.125
Stöber U., Thomsen F. (2019). Effect of impact pile driving noise on marine mammals: A comparison of different noise exposure criteria. J. Acoust. Soc Am. 145, 3252–3259. doi: 10.1121/1.5109387
Stockham M. L., Reinhall P. G., Dahl P. H. (2010). “Characterizing underwater noise from industrial pile driving at close range,” in OCEANS 2010 MTS/IEEE SEATTLE (Seattle, WA, USA: IEEE), 1–4. doi: 10.1109/OCEANS.2010.5663899
Tsouvalas A. (2020). Underwater noise emission due to offshore pile installation: A review. Energies 13, 3037. doi: 10.3390/en13123037
von Pein J., Klages E., Lippert S., von Estorff O. (2019). “A hybrid model for the 3D computation of pile driving noise,” in OCEANS 2019 -Marseille, Marseille, France, June 17–20. 1–6. doi: 10.1109/OCEANSE.2019.8867294
Wang R. W., Xu X. M., Zou Z. G., Zhou Y. L. (2017). “Prediction of underwater blasting safe range for Large yellow croaker (Pseudosciaena crocea),” in 2017 IEEE International Conference on Signal Processing, Communications and Computing (ICSPCC), Xiamen, China. doi: 10.1109/ICSPCC.2017.8242546
Wilkes D. R., Gourlay T. P., Gavrilov A. N. (2016). Numerical modeling of radiated sound for impact pile driving in offshore environments. IEEE J. Oceanic. Eng. 41, 1072–1078. doi: 10.1109/JOE.2015.2510860
Williams R., Wright A. J., Ashe E., Blight L. K., Bruintjes R., Canessa R., et al. (2015). Impacts of anthropogenic noise on marine life: Publication patterns, new discoveries, and future directions in research and management. Ocean Coast. Manage. 115, 17–24. doi: 10.1016/j.ocecoaman.2015.05.021
Zampolli M., Nijhof M. J., de Jong C. A., Ainslie M. A., Jansen E. H., Quesson B. A. (2013). Validation of finite element computations for the quantitative prediction of underwater noise from impact pile driving. J. Acoust. Soc Am. 133, 72–81. doi: 10.1121/1.4768886
Keywords: underwater noise, 3D PE, impact pile driving, large yellow croaker (Pseudosciaena crocea), effect
Citation: Xie J, Xue R, Niu F, Chen B and Yang Y (2024) Three-dimensional acoustic propagation of noise from impact pile driving in a complex costal environment and its effects on large yellow croaker (Pseudosciaena crocea). Front. Mar. Sci. 11:1395120. doi: 10.3389/fmars.2024.1395120
Received: 03 March 2024; Accepted: 03 May 2024;
Published: 17 May 2024.
Edited by:
Youji Wang, Shanghai Ocean University, ChinaReviewed by:
Zhongchang Song, Xiamen University, ChinaQuanyou Guo, Chinese Academy of Fishery Sciences, China
Copyright © 2024 Xie, Xue, Niu, Chen and Yang. This is an open-access article distributed under the terms of the Creative Commons Attribution License (CC BY). The use, distribution or reproduction in other forums is permitted, provided the original author(s) and the copyright owner(s) are credited and that the original publication in this journal is cited, in accordance with accepted academic practice. No use, distribution or reproduction is permitted which does not comply with these terms.
*Correspondence: Fuqiang Niu, bml1ZnVxaWFuZ0B0aW8ub3JnLmNu
 Jiarui Xie1
 Fuqiang Niu