 Hao Wang1
 Jicong Yang
- 1School of Management, Tianjin University of Technology, Tianjin, China
- 2School of Computer Science and Engineering, Tianjin University of Technology, Tianjin, China
Marine economy is a valuable pillar for the development of coastal areas. It is of profound significance to explore the influence of marine economy development on economic resilience of coastal areas. This paper constructs an economic resilience assessment framework based on resistance, adaptability, and evolutionary power, adopts the entropy method to calculate the economic resilience development level in China’s coastal areas from 2006 to 2019, and examines in detail the driving factors affecting the economic resilience from the indicator level. Furthermore, panel regression models are used to explore the influence of marine economic development on the economic resilience of China’s coastal areas and its mechanism of action. The results show that: (1) China’s coastal areas have an overall trend of rising economic resilience. The spatiotemporal differentiation characteristics of different economic resilience factors are significant. (2) Factors such as regional economic scale, innovation input, industrial transformation, resident income, consumption scale, degree of marketization, and financial scale are key factors to enhance the economic system resilience of coastal areas. (3) There is a significant positive impact of the marine economy on the economic resilience of coastal areas, and this promotion effect is regulated and constrained by the level of diversification of marine industries and the level of concentration of marine industries. (4) Heterogeneity analysis shows that there are significant individual differences in the impact of Marine economy on economic resilience, and its marginal effect first increases and then decreases. The corresponding policy implications are further analyzed based on the research results.
1 Introduction
In recent years, the oceans have become an important space for development and a source of resources, adding tremendous value to the world economy. Since the beginning of the twenty-first century, the marine economy has contributed about $1.5 trillion annually, accounting for about 3% of the value added of global trade, and is expected to more than double by 2030 (Sun et al., 2022). The marine industry in countries around the world has been developed at a deeper level, especially among coastal countries and regions, and the marine economy has become a new growth point for regional economic development. Taking the value of foreign merchandise trade between China and the United States as an example, the ocean carries 60% of the total value of China’s foreign trade and 95% of the total foreign trade of the United States (Zheng and Tian, 2021). As a new engine of development for coastal countries, the marine economy has been included in the overall strategic position of each country’s economic development.
With the combination of regional systems theory and resilient development theory, economic resilience has emerged as a new concept to measure regional development (Wink, 2014). Economic resilience as a “quality checker” of regional health development, is a comprehensive measure to judge whether the coastal areas are stable and benign development (Martin and Sunley, 2015). While enjoying enormous benefits, coastal areas have also experienced a series of disruptions, such as over-development of marine resources, marine natural disasters and economic crises. Therefore, a highly resilient economic system has become particularly important for the high-quality development of coastal areas. The marine economy, as an important component of the economies of coastal countries and regions, is closely related to regional development. By specifically analyzing the impact of the development of the marine economy in coastal areas on economic resilience, it contributes to a deeper understanding and appreciation of the important role of the marine economy in coastal areas.
As a country with a vast coastline, China attaches great importance to the development of its marine economy. According to the preliminary accounting of China’s Ministry of Natural Resources, China’s gross marine product in 2022 will amount to 9,462.8 billion yuan, accounting for 7.8% of its gross domestic product, and the marine economy has become an important force in China’s economic development. In addition, in order to accelerate the construction of an ocean power with Chinese characteristics, China’s coastal regions have successively introduced marine economic development plans, which are of profound significance in opening up economic development paths, preventing systemic risks in coastal areas, and enhancing the ability to cope with external environmental shocks. Therefore, on the basis of assessing the economic system resilience of China’s coastal areas, it is of great significance to explore the important impact of the marine economy on economic resilience for promoting the global ocean industry and the sustainable development of regional economies.
Accordingly, this paper scientifically measures the resilience of the regional economic system based on the adoption of relevant data from 11 provinces (municipalities) in China’s coastal region (excluding Hong Kong, Macao and Taiwan due to data limitations) from 2006–2019, introduces the PLS model to quantitatively identify the dominant driving factors, and empirically examines the impact effect of the development of the marine economy on the resilience of the regional economic system. There are three innovations in this paper: The first point is the topic of the research, which demonstrates the influence of marine economic development on enhancing the elasticity of regional economic system and enriches the research results on regional economic system resilience. The second point is the research method. factor analysis and regression analysis are used to identify the driving factors and direct influencing factors of coastal economic system resilience. The third point is the practical significance, it specially analyze the effect of marine economic development in coastal areas on enhancing the resilience of economic system, and explore its mechanism of action and dynamic evolution rule based on the threshold effect analysis and heterogeneity analysis, so as to provide support and basis for improving the resilience of economic system in coastal areas in the new era.
The paper is divided into five sections, with the remaining chapters organized as follows. Section 2 provides a systematic overview of the literature on the marine economy and economic resilience, according to which the internal mechanism of the impact of ocean economic development on regional economic resilience is analyzed. Section 3 highlights the specific meanings of the relevant variables, the empirical model and the data used. Section 4 presents the empirical results and analysis. Relevant research conclusions, policy implications and prospect are presented in section 5.
2 Literature review, theoretical analysis and research hypothesis
2.1 Literature review
The academic researches on the meaning, influencing factors, and measurement of economic resilience are becoming more and more abundant. In terms of the definition of regional economic system resilience, Martin (2012) proposes that it refers to the ability of regional economic system to meet and accept shocks and maintain stable system development of the system. Hassink (2010) argues that it is the ability of regional economy to recover the equilibrium state effectively in the crisis and shock. With the continuous enrichment of the connotation of regional economic system resilience, research has gradually turned to its quantitative measurement. The main measurement methods include the index system method (Tan et al., 2017; Bruneckienė et al., 2018), the method of measuring the change in GDP growth rate or employment rate (Cainelli et al., 2019; Martin and Gardiner, 2019), the method of building spatial econometric models for counterfactual forecasting (Doran and Fingleton, 2017), and the method of survey questionnaires (Oxborrow and Brindley, 2012; Slocum and Kline, 2014). The influencing factors of regional economic resilience are diversified. Giannakis and Bruggeman (2017) study concluded that the factors influencing economic resilience include innovation, migration, and level of urbanization. Pendall et al. (2010) argues that unemployment rates, poverty rates, and local government have an impact on regional economic resilience. In addition, some scholars have studied the relationship between a specific factor and regional economic resilience from the ways of human capital (Kitsos and Bishop, 2018), income inequality (Lewin et al., 2018; Rahe et al., 2019), quality of government (Rios and Gianmoena, 2020), and industrial diversification (Brown and Greenbaum, 2017; Rocchetta and Mina, 2019). Meanwhile, studies on the resilience of regional industrial economies to economic systems have focused on the digital economy, tourism and banking development, and relatively little research has been done on the marine economy. For example, Fargnoli and Meyermans (2018) argues that the digital economy can strengthen resilience to shocks while reducing operational costs; Watson and Deller (2021) argues that dependence on tourism can enhance regional economic resilience; Stewart and Chowdhury (2021) argues banking stability can promote economic resilience. A review of the above literature reveals that regional industrial economies have a positive impact on economic system resilience. Then, what is the impact of marine industry economy as an important driver of economic development in coastal areas on regional economic system resilience? Exploring this question has important practical significance for the high-quality development of coastal regions.
Few studies have addressed the relationship between the impact of the Marine economy on regional economic resilience. Previous studies have focused on the importance of the marine economy to regional economic development. Khan et al. (2022) emphasized the outstanding contribution of the marine economy to the UK’s regional economic growth and stabilization of national employment when analyzing the impact of the Brexit from the European Union. Chang and Khan (2019) argued that the oceans have a bearing on the security and development of the coastal areas, and that guaranteeing marine security is an important task to realize the stable development of regional economy. Yin et al. (2018) in analyzing the industrial linkage effect of China’s marine land economy found that the marine economy is closely related to the land economy and has a certain symbiotic relationship. Global governance relies heavily on the interconnectedness of the two systems, ocean and land (Zulfiqar et al., 2023). Ji et al. (2024) based on the data of China’s coastal areas from 2006–2019, used random forest regression plots and partial dependency graphs to reveal the driving role of the marine economy on the high-quality economic growth of China’s coastal areas. Johansen et al. (2019) argue that fisheries and aquaculture have both direct and indirect impacts on the Norwegian economy as a whole and largely determine employment and settlement in the Norwegian coastal areas. Most of the above literature focuses on the extent to which the marine economy contributes to regional economic growth and impacts on a particular aspect of the economic system, but the importance of the marine economy for stable economic development has been well recognized. The findings provide useful inputs for analyzing the theoretical links between marine economic development and regional economic resilience.
2.2 Theoretical analysis and research hypothesis
The ocean plays a pivotal role in the pattern of economic development. On the one hand, the unique location advantage, rich marine resources, and the implementation of the strong maritime nation strategy by the sea have made the marine industry grow rapidly in the coastal areas at the forefront of China’s opening to the outside world, providing an important driving force for the land-based economy development, and the increasing role of the marine economy as an engine for sustainable economic development. On the other hand, the marine economy development can promote the absorption of employment, drive fiscal revenue and foreign exchange earnings, and promote scientific and technological progress and improve social livelihood, which lay a profound foundation for improving the ability of the regional economic system to resist changes in the external environment. Therefore, hypothesis 1 (H1) is formulated:
H1: Marine economic development can significantly improve the level of resilience of regional economic systems.
If the study is only limited to the strengths and weaknesses of the marine economy to discuss the relationship between it and the resilience of regional economic system, while ignoring the structural differences caused by the characteristics of the marine economy’s own development, it may lead to errors between research results and practice. This paper argues that the effect of the marine economy on strengthening the elasticity of regional economic system is related to the influence of diversity and agglomeration degree of regional marine industrial structure. That is, there are certain threshold conditions for the effect of marine economy on the elasticity of economic system in coastal areas. On the one hand, the full employment and large income brought by the marine economy need a diversified industrial system to carry, and the higher the benefits brought by the marine economy in regions with diversified industrial structures. The development of marine economy provides continuous power and support for the diversified development of industrial structure, while the diversification of industrial structure can promote technological progress and accelerate the marine economy development (Zhou et al., 2020). The interdependence of marine economy and industry not only accelerates the efficient flow of factor resources and promotes the diversified development of industrial structure, but also the more developed the marine economy is, the more diversified the industrial development will be, which makes the region blunt economic fluctuations and reduce uncertainty (Bishop, 2018; Cainelli et al., 2019), and enhances the stability of coping with external shocks. On the other hand, marine industry agglomeration provide some sort of platform for marine and maritime related activities or businesses to co-ordinate and communicate (Chang, 2011), which in turn leads to the sharing and dissemination of knowledge, generating a chain reaction of innovation (Maskell and Lorenzen, 2004), and provide support for the development of marine economy (Ciccone, 2002). However, when agglomeration reaches a certain level, its economic effect decreases or even turns negative, and the phenomenon of diseconomies of scale emerges (Williamson, 1965; Brülhart and Sbergami, 2009), which weakens the promoting effect of marine economy on the economic system resilience. Therefore, this paper presents the hypothesis:
H2: The higher the level of regional marine industry structure diversification, the stronger the promotion of the marine economy to the economic system resilience.
H3: An excessively high level of regional marine industry agglomeration may lead to a weakening of promotion effect of marine economy on economic system resilience.
As far as different coastal areas are concerned, when developing marine economy, they will make differentiated strategic positioning according to their own situations, which leads to the differences in the paths and ways of promoting marine economy development. The development level of their economic resilience will also be affected by resource endowment, industrial structure differences, scientific and technological innovation competitiveness, resource and environmental carrying capacity and government function positioning. To be specific, external impact will cause fatal damage to the fragile economic system, which will not only greatly slow down the development speed of marine economy, but also destroy the industrial structure and industrial development path within the system. It does not well highlight the role of marine economy, and leads to an insignificant impact on economic resilience. In the context of unstable development, it is difficult for marine economy to find new effective development impetus, but can only rely on government support and subsidies. This is a heavier burden for low-resilience regions, which may make the marine economy have a certain negative impact on economic resilience in low-resilience regions. However, the ability of the region to withstand various risks and the economic system resilience after risks will gradually improve with the further improvement of economic resilience. At this stage, it is more obvious that the marine economy is contributing to economic resilience. When the regional economic resilience reaches a certain level, the elements of the multi-dimensional economic system become more diverse and complex, and other industrial economies may have a “substitution effect” on the marine economy, thus reducing the marginal effect of the marine economy. Therefore, this paper gives the following hypothesis:
H4: There may be individual differences in the impact of marine economy on economic resilience in coastal regions, and the driving effect of marine economy in regions with low economic resilience is weak, and may even show a negative impact. With the continuous improvement of economic resilience, marine economy may have a significant positive driving effect on economic resilience, and its marginal effect is weak for the coastal areas with high economic resilience.
3 Study design
3.1 Variable settings
(1) Explained variable: economic resilience (er). Due to the perspective of evolutionary economic system resilience, this study refers to the research on measuring the regional economic systems resilience, and constructs a comprehensive index evaluation system, and selects 20 evaluation indexes from three aspects: resistance, adaptability, and evolutionary power (Table 1). Resistance is the ability of the economic system to withstand shocks and maintain its own structure and function, which is mainly reflected in the specific performance of the “troika” (investment, foreign trade and consumption) driving economic growth, social stability and residents’ resistance to risks. Adaptability means that the speed and degree of economic recovery are realized by the rapid and diversified response measures of the economic system. It reflects the resource allocation ability of government and market in the economic system. Evolutionary power is the level of innovation and transformation ability of the economic system in creating a new development mode, and the indicators are mainly selected from innovation ability, industrial transformation and green transformation.
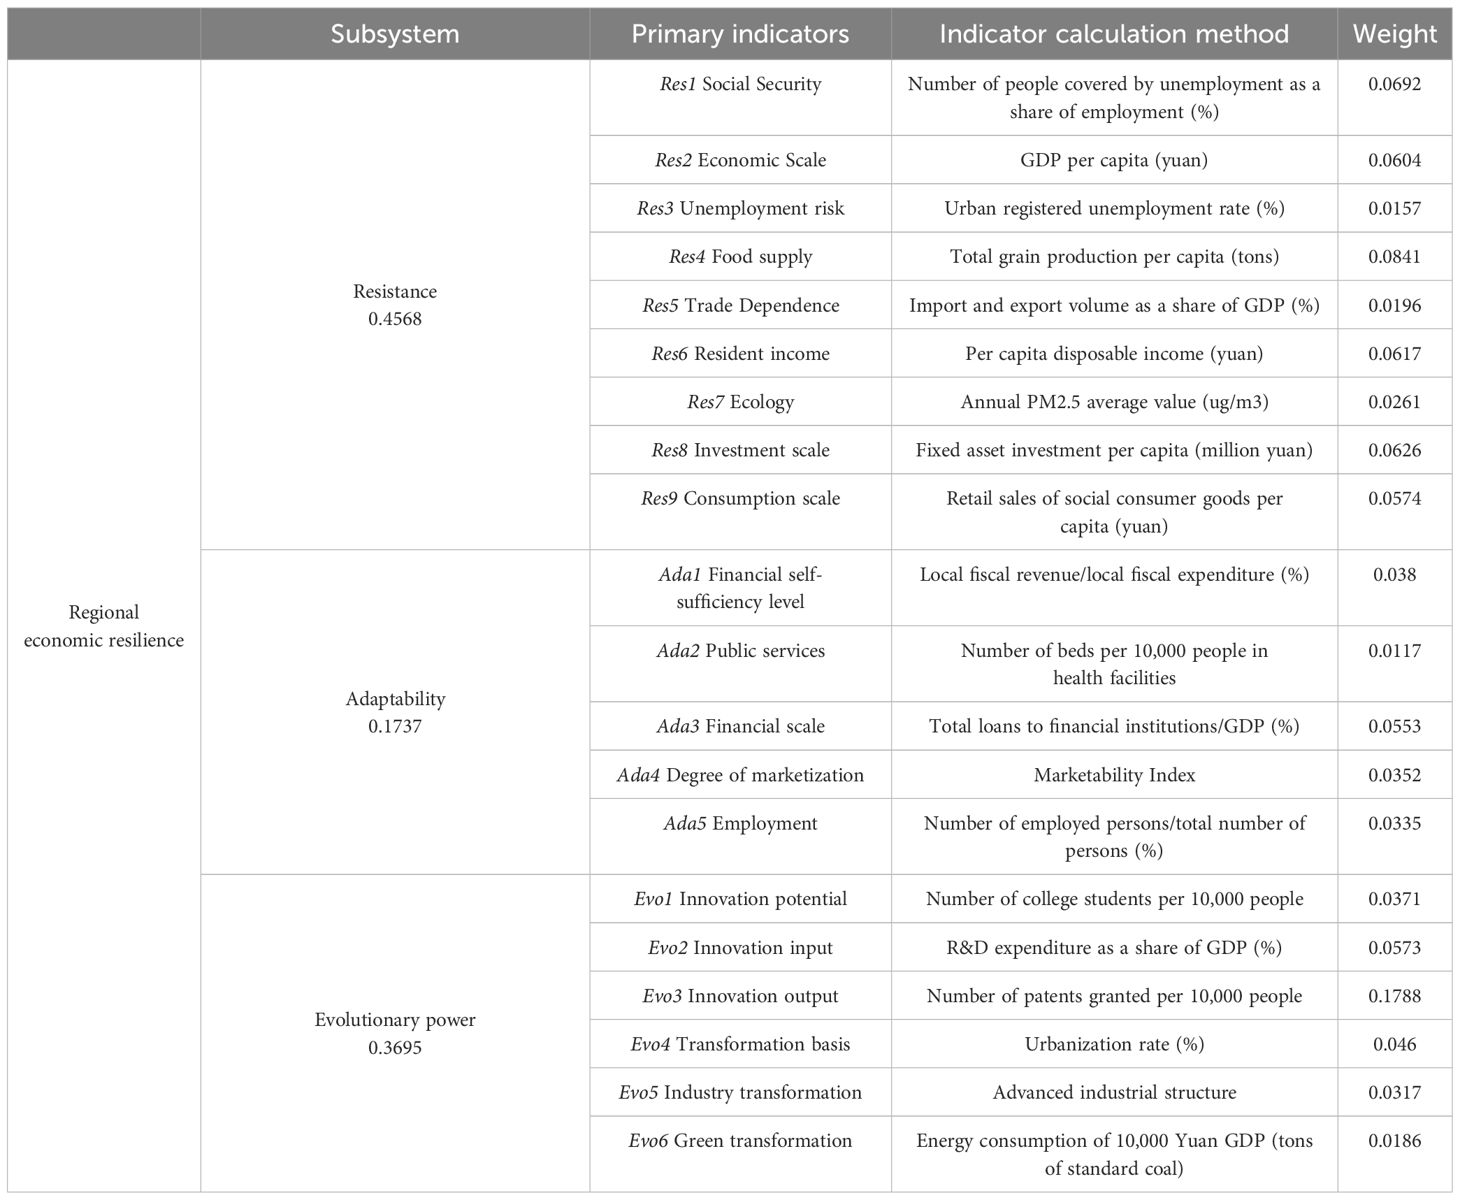
Table 1 Comprehensive evaluation index system of economic resilience.
(2) Core explanatory variable: marine economic development (oe). Coastline economic density (marine GDP divided by coastline length) can fully reflect the economic activities per unit of coastline in coastal areas, so we choose coastline economic density as a proxy variable for marine economic development in coastal areas. In addition, we also choose per capita gross marine product (pogdp) for robustness testing.
(3) To control for other characteristics that affect economic resilience, this paper introduces the following four control variables. The level of informatization (inf) represents the degree of interconnection between different entities and the speed of response to the economic system’s ability to re-adapt to new changes (Martin et al., 2015). Therefore, this paper takes the level of informatization as a control variable, which is measured by the proportion of total postal and telecommunication business to GDP. Environmental regulation (env) can promote technological innovation and structural adjustment in polluting industries, thus generating better economic performance and improving economic resilience (Xia et al., 2022). Based on this, this paper uses the green coverage of built-up areas to measure the level of environmental regulation in the region, and introduces it in the regression equation to control its interference with economic resilience. Cultural resources (cul) abundant regions are better able to cope with natural disasters, structural changes and economic crises (Liu et al., 2023). Therefore, this paper also controls for cultural resources, measured by the number of books in public libraries per 10,000 people. Transportation infrastructure (road) contributes to the resilience of local economies by improving accessibility and creating a reciprocal feedback loop between regions to better respond to changes brought about by external shocks (Chacon-Hurtado et al., 2020). Therefore, this paper includes transportation infrastructure in the research framework, specifically measured by road area per capita.
(4) Threshold variable: marine industry structure diversification (ind), industrial structure entropy can measure the overall balance of industrial structure, diversification (Wang et al., 2020), the specific formula is as follows:
Where, j represents the marine industry; pj represents the proportion of the jth industry to the gross marine product; a larger ind value indicates that the structural ratio of each industry in the coastal area tends to be equal, i.e., the industrial structure tends to develop in the direction of diversification. On the contrary, the structural ratios of industries in the study area differ more, that is, the industrial structure tends to develop in the direction of specialization.
Marine industry agglomeration level (agg), based on data availability, this study chooses the locational entropy index to measure the marine industry agglomeration level (Dong et al., 2020), the formula is as follows:
Where, i denotes region and j denotes marine industry; xij represents the gross value of marine the jth industry in region i; Yi denotes the gross value of region i; Xj denotes the national marine the jth gross value; Y denotes the national gross value; pj represents the share of the jth industry in marine gross value.
3.2 Empirical model construction
In this paper, 11 coastal provinces (municipalities) in China are used as the research sample, which has a small sample capacity, and thus a long panel estimation method different from the short panel is needed. Based on the long panel regression strategy, this paper adopts a comprehensive Feasible Generalized Least Squares (FGLS) method to investigate the impact of the development of the coastal marine economy on the regional economic resilience, and the specific models are as follows:
where, i and t represent region and year, respectively; erit is the explained variable regional economic system resilience; oeit is the core explanatory variable marine economic development; Xit is the control variable; is the time fixed effect, which is controlled by adding a time trend term in this paper; is the individual fixed effect.
3.3 Data source
This study utilizes stata16.0 as an econometric analysis tool and follows the method of selecting the sample of China’s coastal area in most studies. Regarding the sample, we make the following clarifications: First, this paper selects China’s coastal provinces (municipalities) as the research sample. According to the availability of data, the sample period is 2006–2019. The sample period basically covers the major economic events in China in recent years including the world financial crisis, the trade war between China and the United States, and so on. Second, due to data availability, the sample deletes the three coastal regions of Hong Kong, Macau, and Taiwan, and the final sample contains 11 coastal provinces (municipalities) in China specifically including Liaoning, Hebei, Tianjin, Shandong, Jiangsu, Shanghai, Zhejiang, Fujian, Guangdong, Guangxi, and Hainan. Third, Tianjin and Shanghai, as municipalities directly under the central government, are provincial administrative units and can be empirically analyzed together with other coastal provinces.
The relevant data used in this paper are from official published data. The PM2.5 data come from the Center for Socioeconomic Data and Research at Columbia University. Marketability Index data from China Marketability Index Database. Other data from the previous years “China Marine Statistical Yearbook” “China Statistical Yearbook”, as well as the provincial and municipal statistical yearbooks.
4 Analysis of results
4.1 Spatial and temporal heterogeneity of economic resilience in coastal areas
The economic system resilience of the coastal areas steadily increased during the period 2006–2019 without significant fluctuations and each coastal province and city increased year by year according to their respective development trends (Figure 1A), which indicates that the economic development of China’s coastal regions is a stable and positive trend, and the future development potential is huge. The regional coefficient of variation decreases from 0.346 in 2006 to 0.277 in 2019, which shows that the regional differences in the economic resilience of coastal areas are small during the study period and the distribution of economic resilience levels becomes more balanced over time. By region, Tianjin and Shanghai have the best economic system resilience, and the worst are Fujian, Hebei, Guangxi and Hainan, while the economic resilience of other regions is almost all in one level gradient.
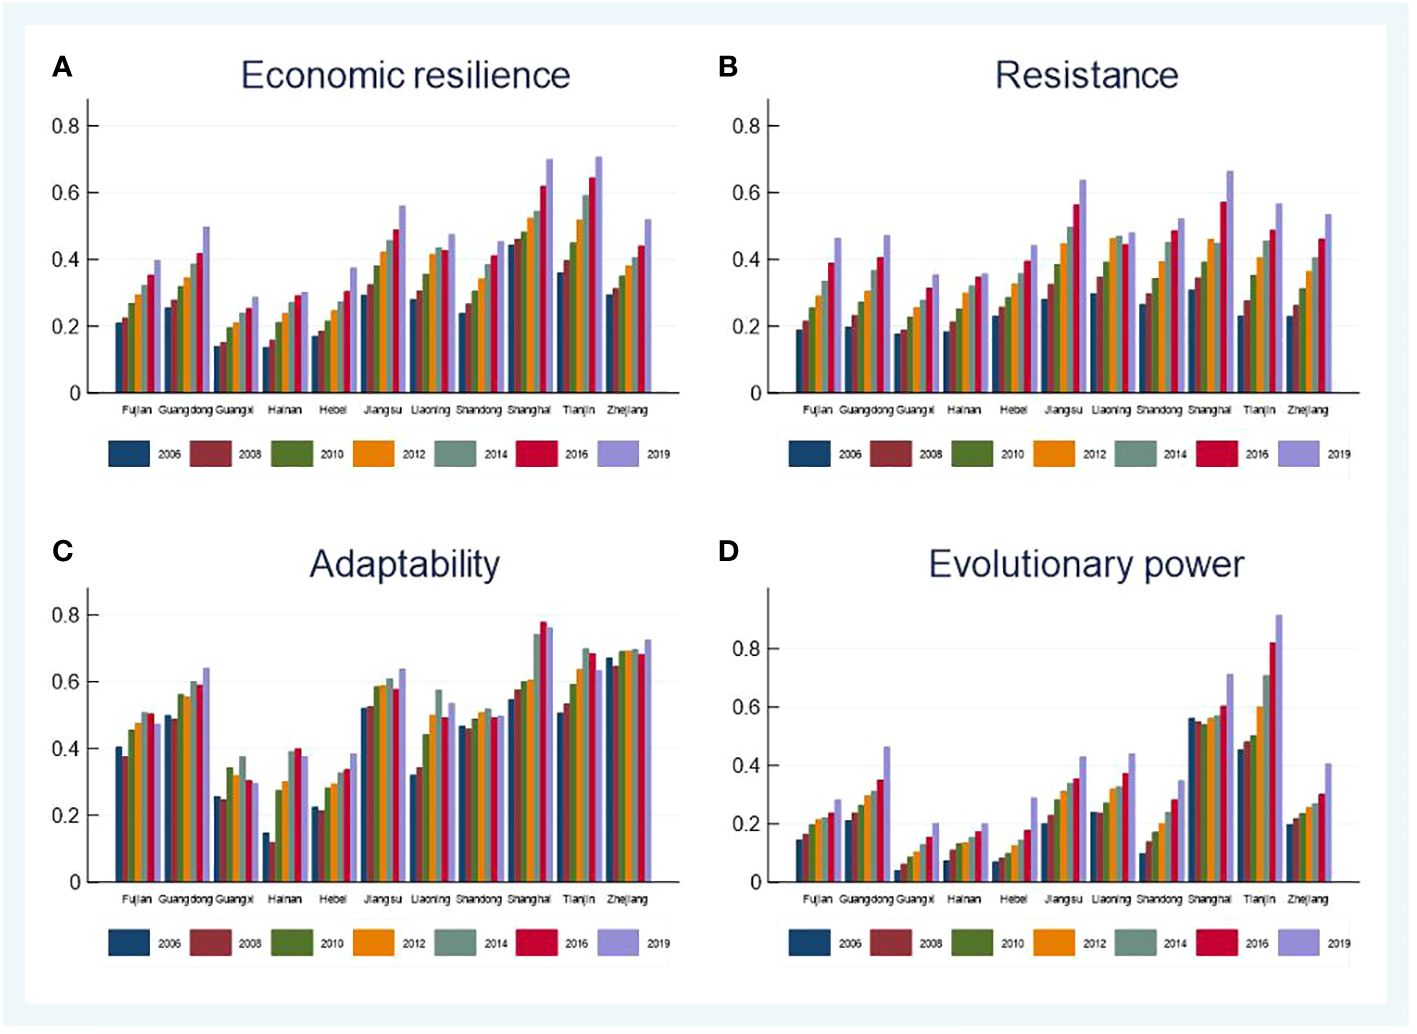
Figure 1 Spatial and temporal differences in economic resilience and its subsystems in coastal regions, 2006–2019.
The resistance index of coastal regions was higher than its evolutionary power index, which increased steadily during 2006–2019 (Figure 1B). The regional coefficient of variation ranged from 0.189 in 2006 to 0.19 in 2019, which shows that the regional differences in the resistance index of coastal regions are relatively small, the economic and social stability of each coastal region do not differ significantly, and the level of development rate is similar over time.
The adaptability index of the coastal region area is generally increasing, but the development trend is unstable and fluctuated greatly (Figure 1C). When coastal regions are subject to risky shocks, the resource allocation ability of the government and the market will also be affected to a certain extent, resulting in a poor performance of the adaptability index for a period of time after the shock, but with the government's control and market regulation, the adaptability will also gradually improve. As shown in the Figure 1C, at the outbreak of the global economic crisis in 2008, the adaptability of all regions decreased except Tianjin, Liaoning, Jiangsu and Shanghai, that is because the fiscal self-sufficiency, financial scale and market-oriented development level suffered risky perturbations after the crisis, which reduced the adaptability of coastal regions. The regional variation coefficient declined from 0.366 in 2006 to 0.266 in 2019, indicating that the distribution of adaptability indices in coastal regions is less different and increasingly balanced.
The evolutionary power index of coastal regions also showed an increase during 2006-2019 (Figure 1D), which implies that the learning and adapting capacity of coastal regions to cope with the risk of external shocks is increasing. The regional coefficient of variation declined from 0.746 in 2006 to 0.485 in 2019, indicating that the evolutionary power of coastal regions had large regional differences during the study period, showing extremely divergent characteristics, and this divergent situation has moderated over time, but it is still not optimistic. The evolutionary power index of Tianjin and Shanghai are higher than those of other regions and are in the stage of rapid increase, which on the one hand indicates that the evolutionary power of innovation and transformation development of this region is better than those of other regions, and on the other hand indicates that the inter-regional communication and linkage of innovation and transformation development of the performance coastal regions are weak, and the regions with high evolutionary power fail to give full play to the driving role
4.2 Analysis of the evolutionary drivers of economic resilience in coastal areas
This study uses the importance of variable projection to calculate the explanatory power of each driving factor to identify the main driving factors of economic resilience. The VIP will be obtained through PLS regression, and it is generally considered that VIP>1 represents excellent explanatory role, 0.5<VIP<1 represents average explanatory role, and VIP<0.5 represents weak explanatory role. The dependent variable is economic resilience, and the independent variable is 20 factor indicators. According to SIMCA calculation results show that the PLS regression model has 98.5% of the independent variable set of summary accuracy, and 98.6% of the coastal areas of the economic resilience of the explanation ability, it shows that the model has high precision, good effect and is suitable for PLS analysis. In terms of the overall factor explanatory strength (Figure 2), the factor indicators of Res2, Evo2, Evo5, Res6, Res9, Evo4, Evo3, Res1, Ada4, and Ada3 are larger (VIP>1) from 2006–2019. It can be considered that the three capabilities of coastal areas have strong performance on economic resilience. The development of economic resilience in coastal areas is mainly driven by economic scale, innovation input, industrial transformation, resident income, consumption scale, marketization degree, financial scale and other factors. In addition, the driving effects of Res7, Ada5, and Res3 on economic resilience are weak (VIP<0.5), indicating that the ecological environment, employment situation, and unemployment risk in coastal areas are still the key influencing factors for the improvement of local economic resilience.
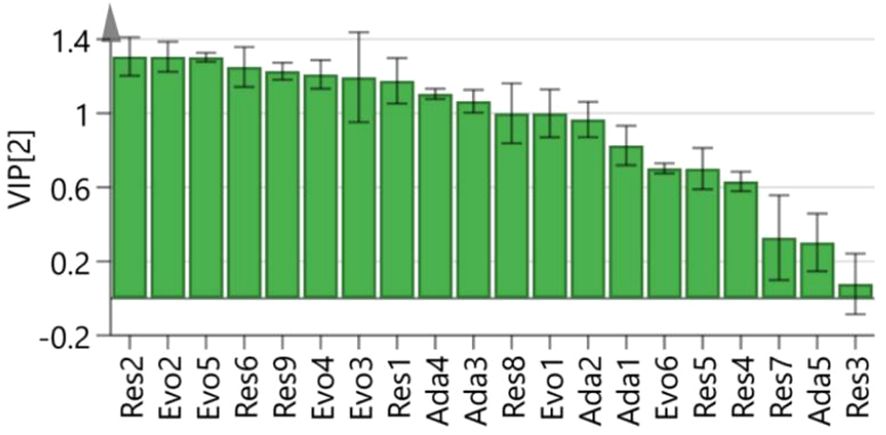
Figure 2 Projected importance of the variable of economic resilience in coastal areas from 2006 to 2019.
From the analysis of the correspondence between Y (dependent variable) and X (independent variable) data set variables (Figure 3), most of the factors are located near Y on the right side, indicating that all factors except Evo6, Ada5, and Res4 are highly correlated with economic resilience, which also indicates that reducing energy consumption, expanding employment capacity and securing food supply are important tasks for coastal regions to improve economic resilience.
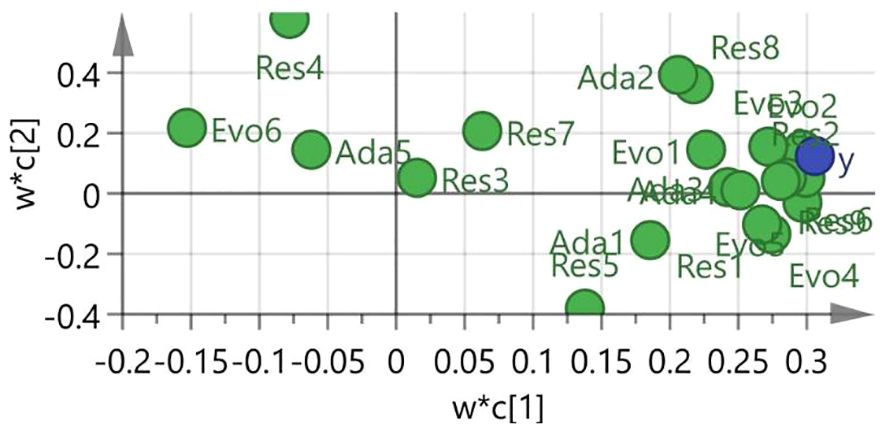
Figure 3 Scatter distribution of correlations between variables in Y and X data sets.
4.3 Analysis of the impact of marine economic development on economic resilience
4.3.1 Baseline regression results
This paper uses an empirical model to test autocorrelation and heteroscedasticity for long panel data, and Table 2 shows the specific test results. when conducting the regression, if heteroskedasticity and autocorrelation exist among the data, still continuing to use mixed OLS, fixed effects and random effects models for estimation will cause serious errors. Therefore, summarizing the results of each test, this paper will use the comprehensive FGLS method of regression considering heteroskedasticity and autocorrelation to avoid the interference of the above problems and to enhance the persuasive power of the results.
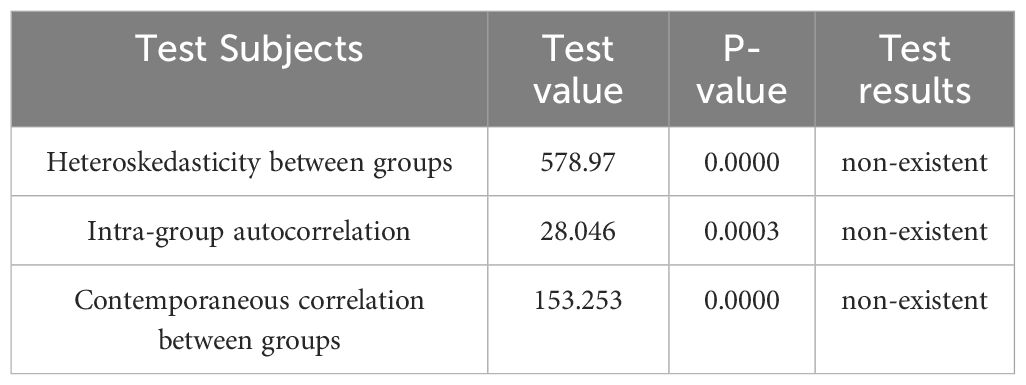
Table 2 Heteroskedasticity and autocorrelation tests.
In order to facilitate comparison, the regression of LSDV method and LSDV method based on panel correction standard error is carried out in this paper. It can be seen from Table 3 that the coefficient of the marine economic development level (oe) in coastal areas is significantly positive regardless of the method used and with or without the inclusion of control variables. It means that the marine economy development level in coastal areas can promote the regional economic system resilience. Therefore, local governments in coastal areas should attach importance to the marine economy development. Hypothesis H1 was tested.
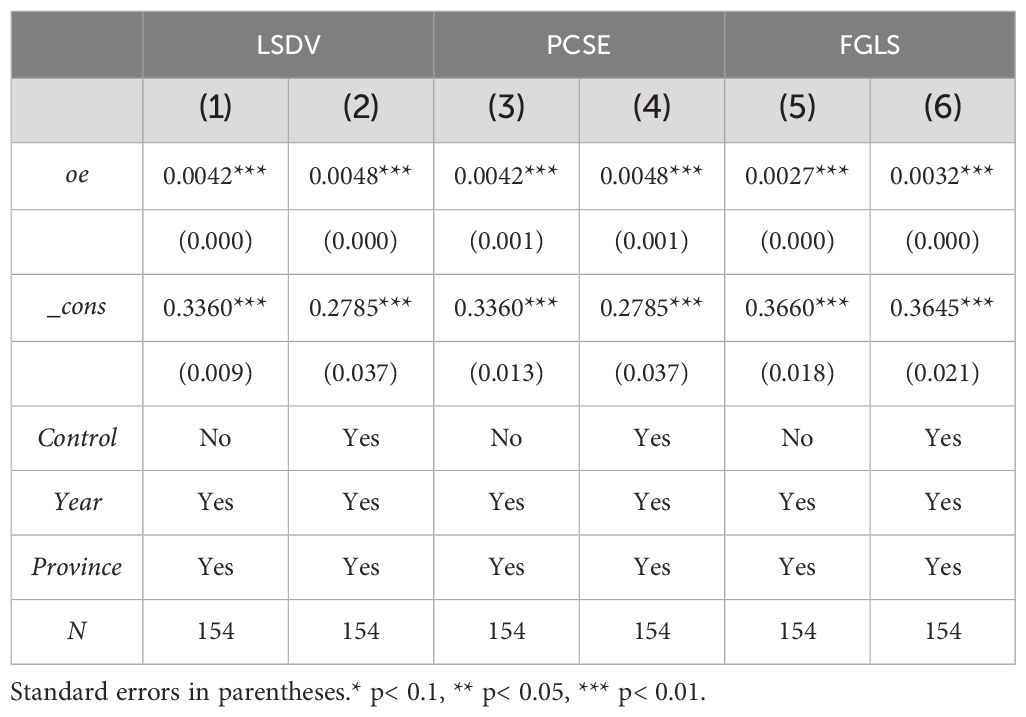
Table 3 Panel model regression results.
4.3.2 Treatment of endogenous problems
(1) GMM (generalized moment estimation method) model regression. The possible endogeneity problem in this paper mainly exists in that regional economic resilience may have an impact on the marine economy development in coastal areas, and therefore the explanatory variables may have a reciprocal causal effect with the main explanatory variables. Based on this, we built the dynamic panel model and uses the GMM model to evaluate. The lagged terms of the explanatory variables are used as instrumental variables for model estimation, and the results of Sargan statistic and Arellano-Bond serial autocorrelation test for overidentification test are reported in Table 4. During the regression process, neither AR test results nor Sargan test results of the model can reject the original hypothesis that there is no autocorrelation of disturbance term and no overrecognition problem of instrumental variables within the significance level of 10%. So the GMM model estimation is robust and reliable. In Table 4, the coefficients of the marine economic development level (oe) are all significantly positive under the GMM model estimation method, which prove the reliability of the previous benchmark regression results.
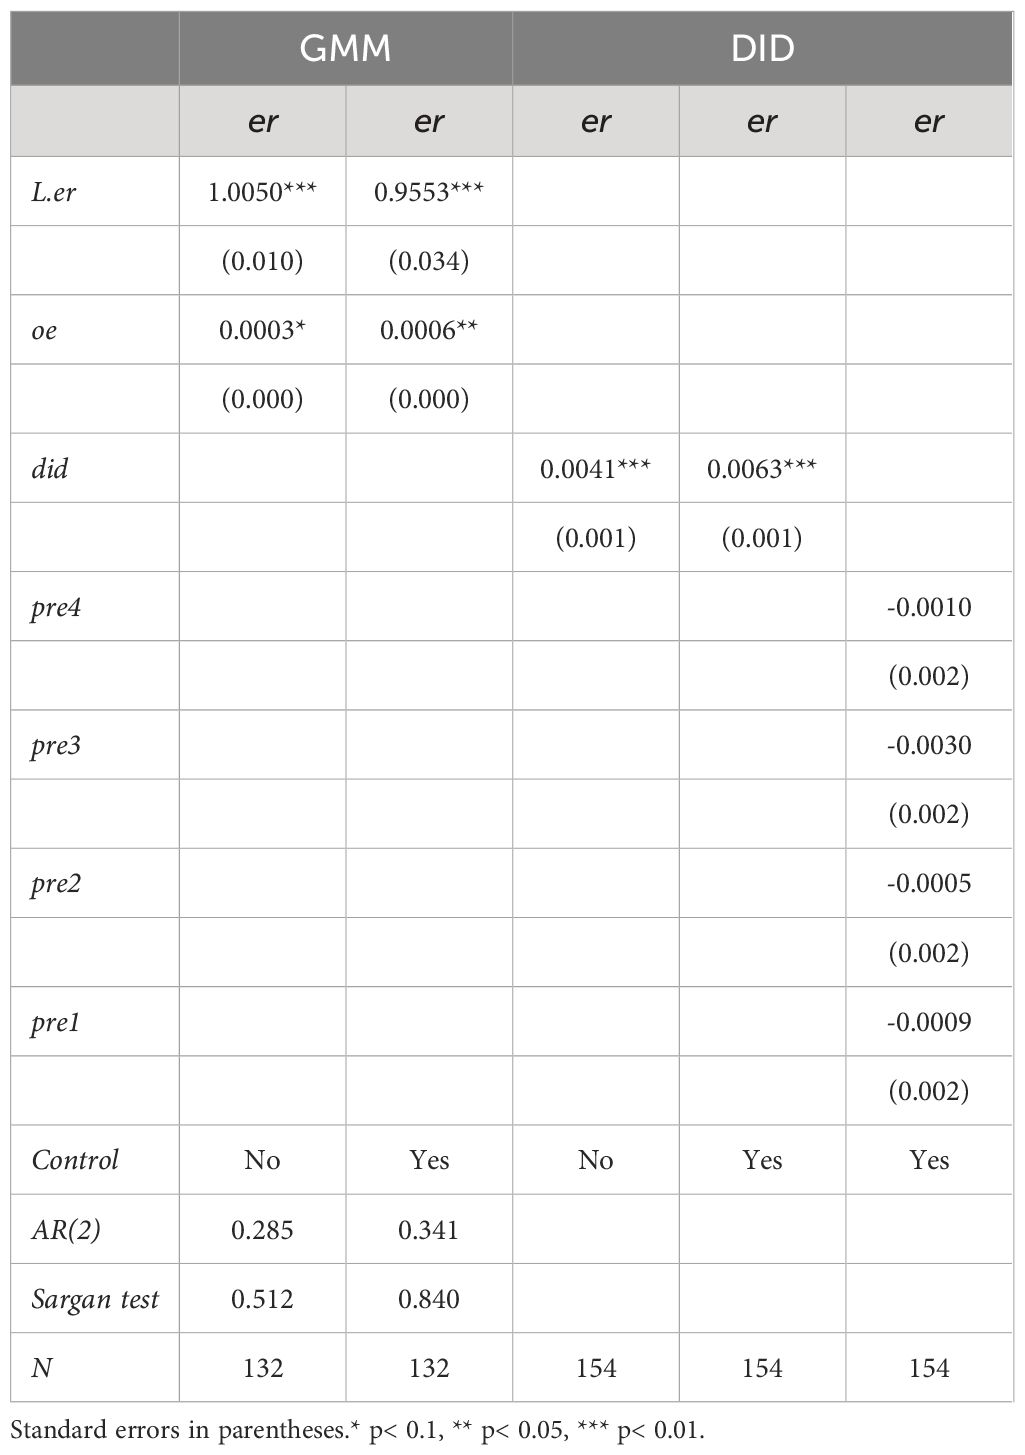
Table 4 Treatment of endogenous problems.
(2) Introduction of policy shocks. Since 2010, China has identified five coastal provinces - Shandong, Zhejiang, Guangdong, Fujian and Tianjin as pilot marine economy development projects in order to increase the long-term development of the marine economy, and has proposed a series of improving strategic initiatives. Considering that this pilot policy was selected by the state, it is a relatively exogenous shock for coastal areas to promote their marine economic development. Therefore, this paper can use this pilot policy to construct a DID model to mitigate the potential endogenous problems. In this paper, the policy dummy variable did is set according to the pilot region and the corresponding approval time, and the comprehensive FGLS method is applied to conduct empirical regressions, the results of which are shown in Table 4. At the 1% level, the coefficient of the policy dummy variable (did) is significantly positive, and it is consistent with the expected result. The parallel trend assumption is a key assumption for the unbiased DID estimator. This study determines whether the parallelism assumption is satisfied by adding the dummy variables (pre4, pre3, pre2, and pre1) before the policy implementation in the regression. That is to say, the difference between pilot areas and non-pilot areas before the implementation of pilot policies was not significant, which satisfies the parallelism assumption of DID.
4.3.3 Robustness tests
(1) Replacement of the benchmark regression model. Since the economic resilience of coastal areas (er) has non-negative truncation, a panel Tobit model is used to test the robustness of the benchmark regression results. (2) Replace the core explanatory variables. It further uses the gross marine product per capita (pogdp) to do the baseline regression calculations. The results in Table 5 are still robust.
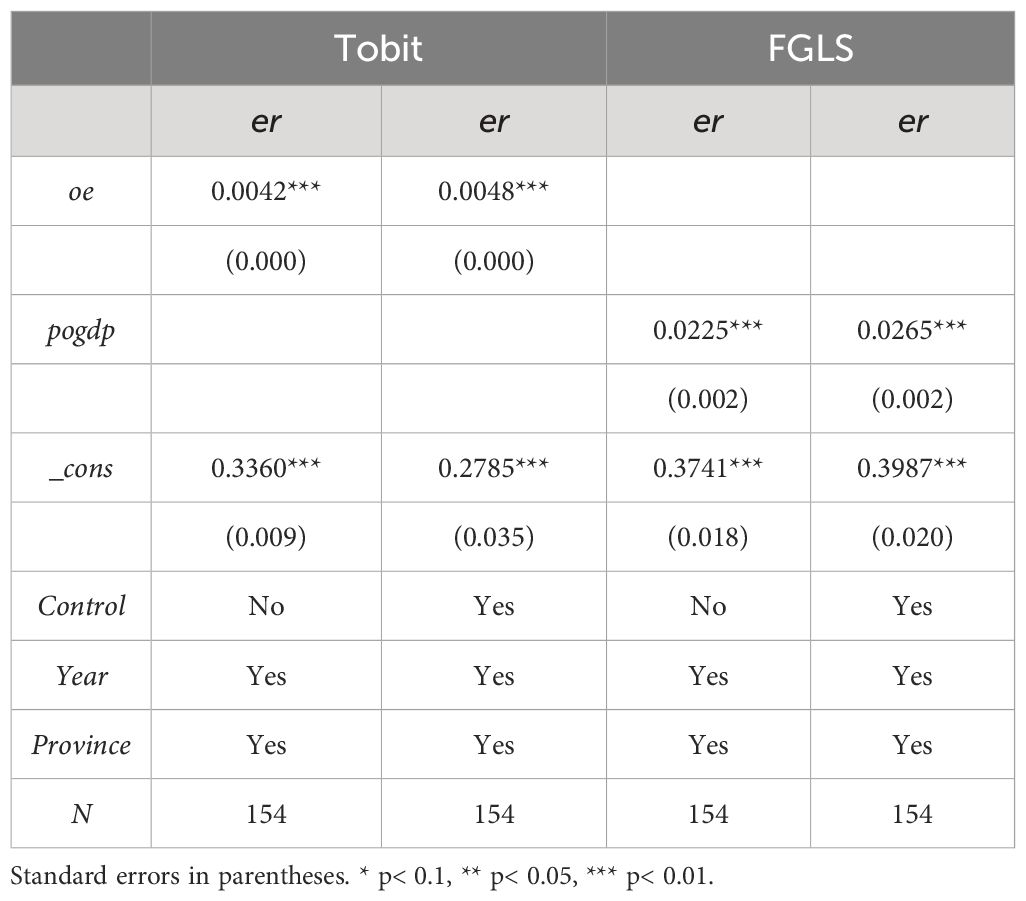
Table 5 Robustness tests.
4.3.4 Threshold effect analysis
This paper argues that the structural diversity of marine industries in coastal areas (ind) and marine industry agglomeration (agg) will play a certain moderating or constraining role in the relationship between marine economic development and regional economic resilience, so a panel threshold regression model regression model is constructed to test their roles.
is the threshold condition variable, q denotes the threshold value, I(-) is the indicative function, and the rest of the variables are the same as the baseline model.
To ensure the robustness of the regression results, two models are adopted for regression in this paper, i.e., individual fixed effects only and two-way fixed effects regression models. The F-tests for the different threshold models and the P-values obtained by Bootstrap self-help method with 300 samples are shown in Table 6. It is obvious that a single threshold exists significantly while a double threshold does not, so the threshold model can be used for further regression. The regression results are shown in Table 7.

Table 6 Results of the threshold effect test.
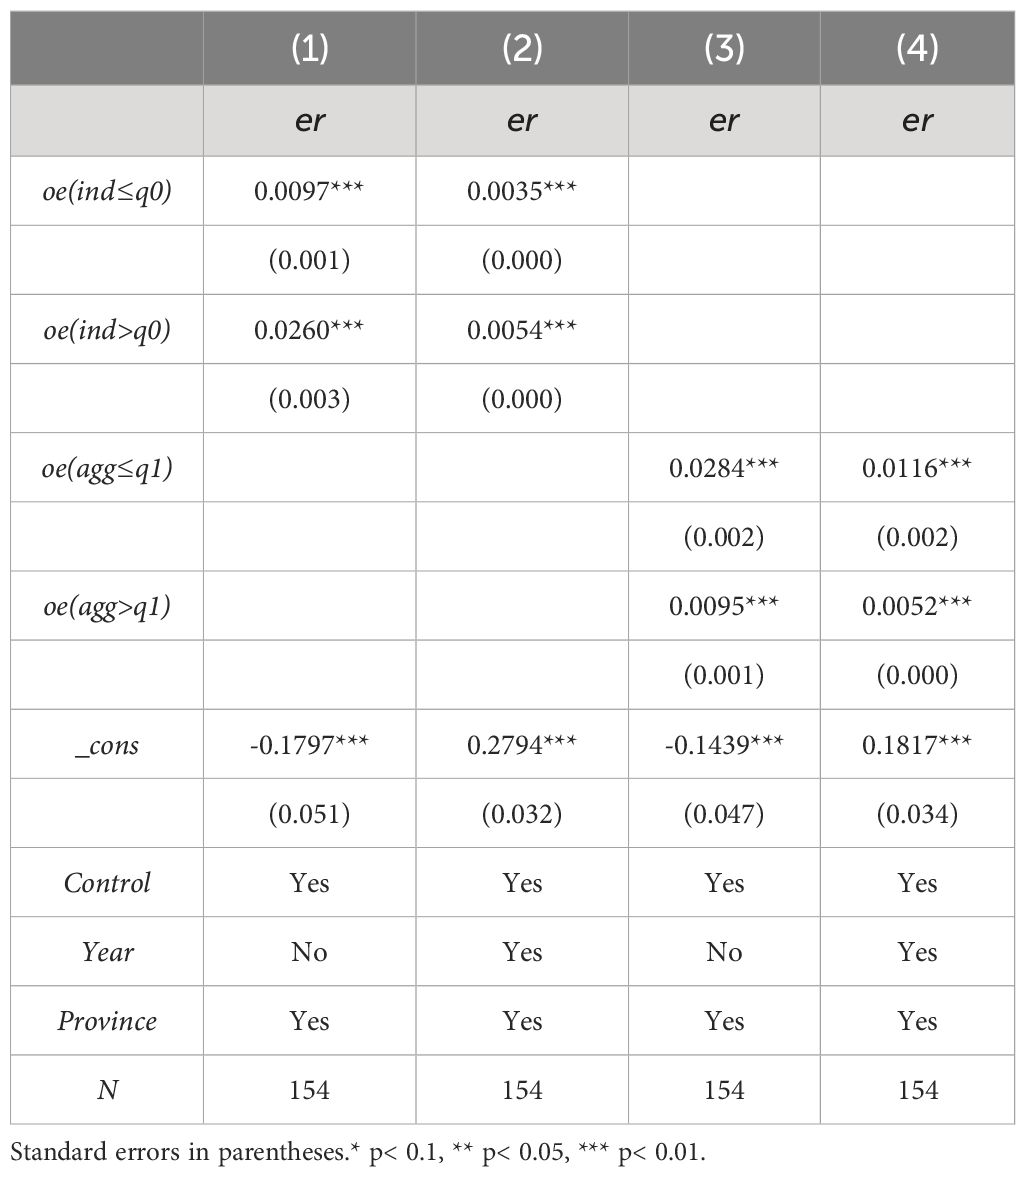
Table 7 Threshold model regression results.
From the results of the threshold regression, when the locational entropy of the industrial structure in coastal areas reaches a certain level, marine economy will significantly strengthen the positive effect of economic resilience. When the level of marine industry agglomeration reaches the certain limit, this promotion effect will be weakened. H2 and H3 are verified.
4.3.5 Heterogeneity analysis
Considering the individual characteristics of marine economic development, this study introduces a variable coefficient model to capture the heterogeneity relationship between marine economic development and economic resilience in each region. The results are shown in Table 8. Column (1) presents the result of the coefficient of variation model without control variables, and column (2) presents the result with control variables. It is found that the coefficients and significance levels in two columns have not change significantly, which indicates that the results are reliable. In summary, the marine economy in most coastal areas contributes to increased economic resilience, but the results in Hainan and Fujian are not significant. Even the individual regression results in Guangxi showed a negative significance. One of the most likely reasons for these different results is that different coastal areas have different levels of economic resilience.
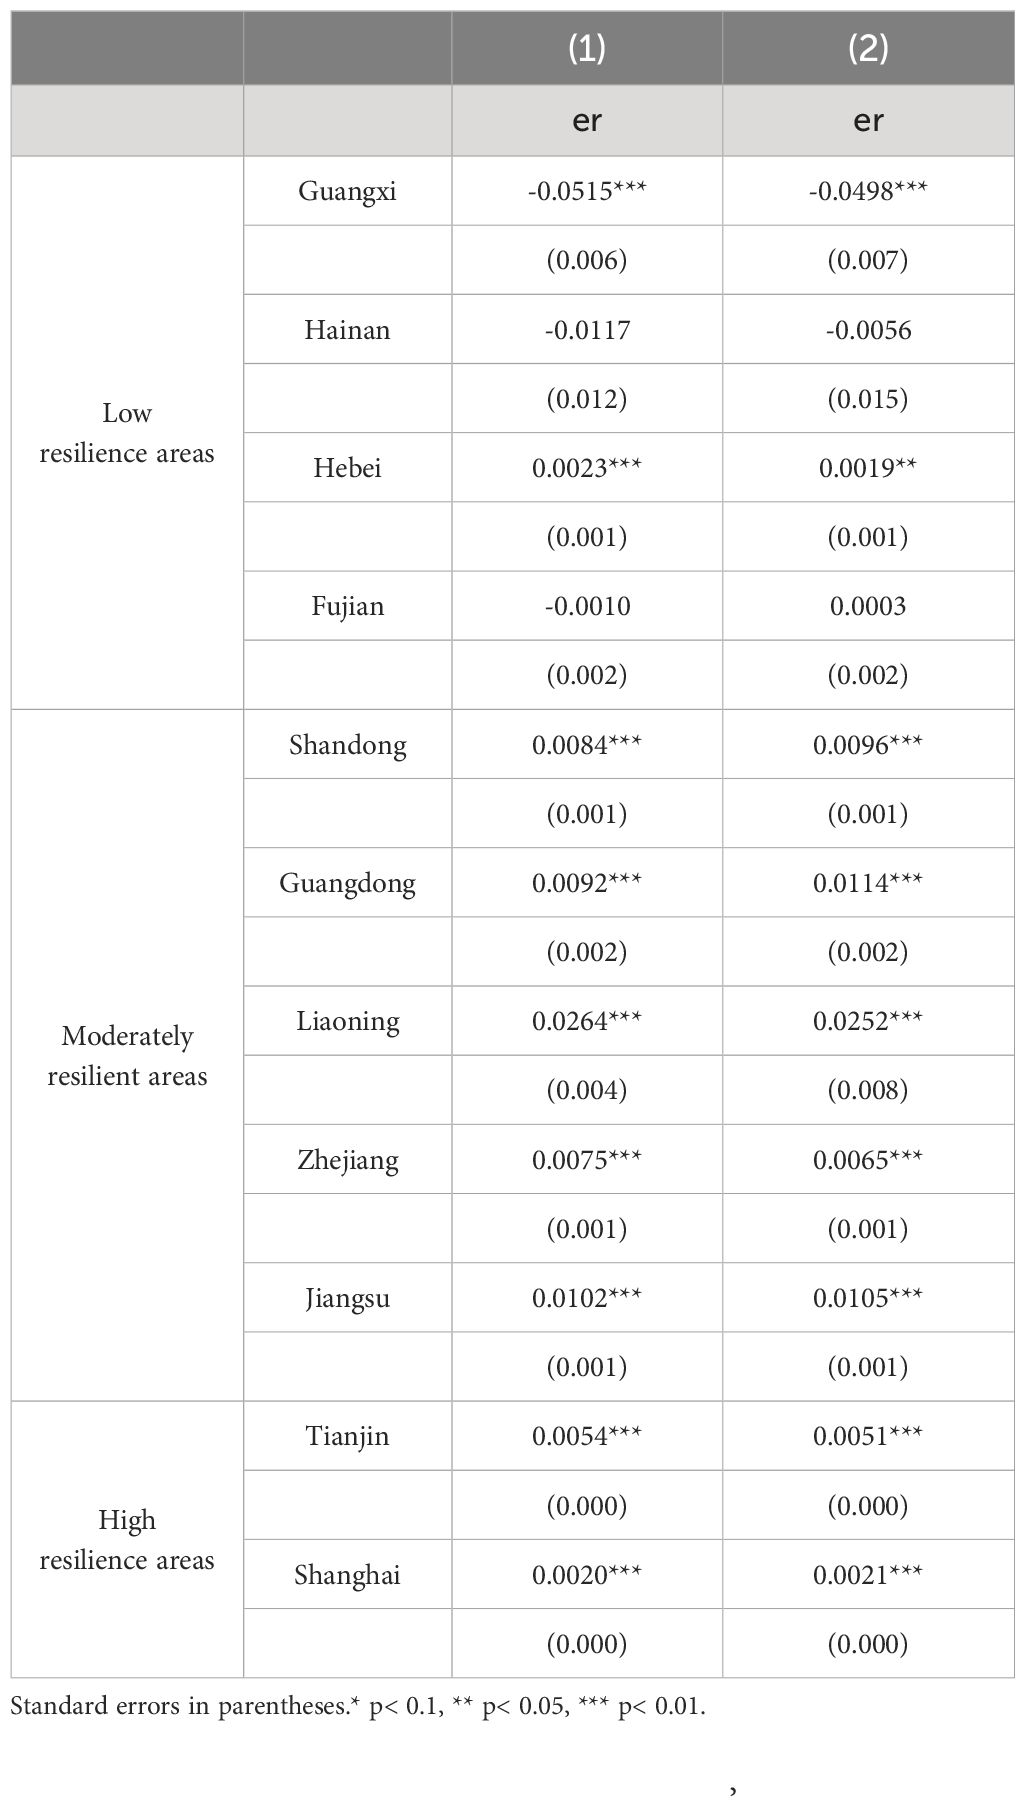
Table 8 Heterogeneity analysis.
To further explore the effects of the marine economy on economic resilience in different stages of development, this study divides the 11 provinces within the sample period into “high resilience regions”, “medium resilience regions” and “low resilience regions” according to the relevant research in section 4.1. The high resilience regions include Tianjin and Shanghai; the medium resilience regions include Liaoning, Shandong, Jiangsu, Zhejiang, and Guangdong; the low resilience regions include Fujian, Hebei, Guangxi, and Hainan. The coastal areas in Table 8 are ranked from lowest to highest based on the economic resilience development level. The results show that in the low resilience regions, marine economy has a weak or even negative effect and has a stronger promoting effect in high resilience regions. In the medium resilience areas, the effect of marine economy on economic resilience is significantly positive, and it basically shows that the promoting effect of marine economy is stronger in the individuals with higher economic resilience. In the high resilience regions, the effect of marine economy on economic resilience remained positive, but its coefficient is smaller than that in the regions with medium resilience, showing that the promoting effect of marine economy on economic resilience begins to decline. Based on these findings, H4 is verified.
In order to more intuitively and accurately observe the marginal effect of marine economy and its dynamic evolution trajectory under different development stages of economic resilience, this study selectes panel quantile regression with the 0.25, 0.5, and 0.75 quantiles. The changing trend in Table 9 is consistent with the previous analysis, which further verifies H4.
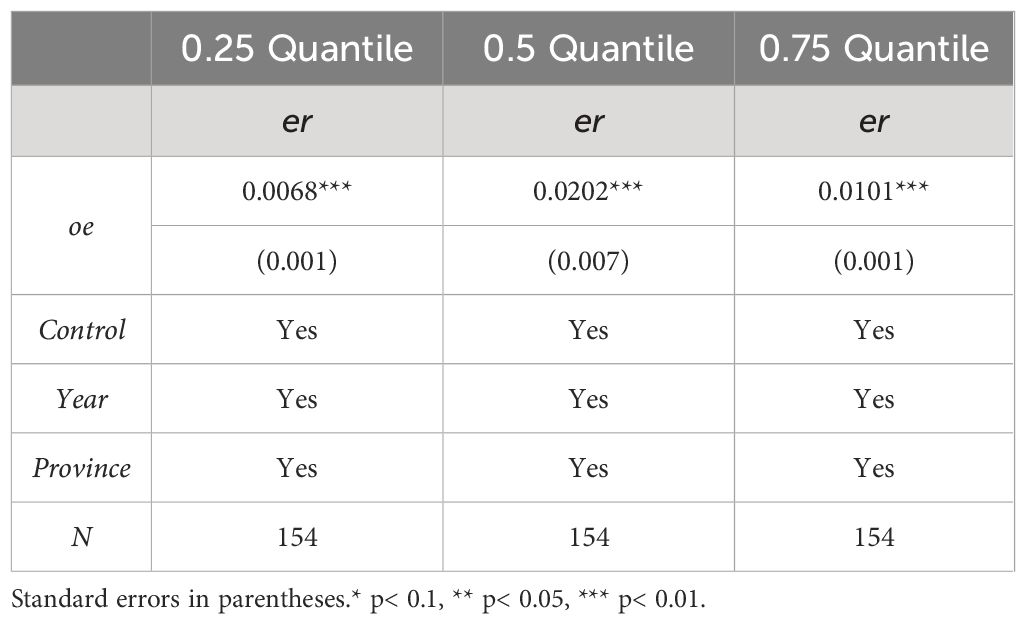
Table 9 Panel quantile regression.
5 Conclusion and Insights
5.1 Conclusion
This paper explores the driving factors affecting the economic resilience with the help of relevant data from 11 provinces in coastal areas from 2006–2019, and empirically tests the impact of marine economic development on the economic resilience of China’s coastal areas and its mechanism of action. The main findings are as follows:
Resistance, as the primary ability of the coastal region’s geographical external shocks, is the embodiment of regional economic growth and social stability, and the cornerstone of regional economic resilience, among which economic scale, residents’ income, consumption scale and social security are important manifestations of the coastal region’s resistance, while the protection of ecological environment and prevention and resolution of unemployment risks need to be strengthened. Adaptability is the economic recovery ability of the coastal region after suffering from pressure, reflecting the regulation ability and efficiency of the government and the market, and is also the key to the economic resilience of the coastal region, of which the degree of marketization and financial scale show a strong driving role, but the regional employment situation is restricting the further improvement of the resilience of this economic system. Evolutionary power is the decisive force for coastal regions to achieve sustainable development, among which innovation input, industrial transformation, transformation base and innovation output have a strong driving role.
During the study period, the marine economy has a significant enhancement effect on the economic system resilience in coastal areas, and this result also holds after the treatment of endogenous problems and a series of robustness tests. The threshold effect analysis shows that this promoting effect will be regulated and restricted by the equilibrium and agglomeration level of regional marine industrial structure. When the equilibrium level of marine industrial structure reaches a certain threshold value, the positive effect between them will be significantly enhanced. But when the concentration level limit of marine industry breaks through a certain limit, that boost will be diminished. Heterogeneity analysis shows that there are significant individual differences in the effect of marine economic development on economic resilience. The impact of marine economy is dynamic in different regions with economic resilience, and shows a trend of first increasing and then decreasing. In the low resilience regions, the marine economy has a weak impact on economic resilience, which is lower than that in the medium resilience regions and the high resilience regions. In the medium resilience areas, the positive effect of marine economy is larger and the promoting effect becomes stronger with the improvement of regional resilience level. In the high resilience regions, the relationship between marine economy and economic resilience is still positive, which is lower than in medium resilient regions, but still higher than in low resilient regions.
5.2 Policy insights and outlook
Based on the empirical results, this paper puts forward applicable policy recommendations: First, it should fully develop the different capacity factors that make up economic resilience and lead the way by focusing on scale and social stability, increasing innovation investment and social transformation, raising household incomes and expanding consumer markets. Second, governments in coastal areas should reasonably plan the marine economic system and formulate strategies, encourage more investment in capital, technology and various production factors, enhance the awareness of the marine ecological environment protection, and focus on their own advantages to promote sustainable development of the marine economy. It need to improve and establish unified marine management laws and regulations, enhance the management capacity of the ocean, improve the regional economic resilience level, and make greater contribution to the rapid growth of the national economy. Third, it should form a diversified model of marine industry development, establish the industry layout coordination mechanism, strengthen the macro-guidance of the layout of marine industry, actively transform and upgrade the traditional marine industry, and vigorously develop the new marine industry. The government should guide the marine industry to cluster appropriately, and it is necessary to consider the regional differences and carrying capacity, control the degree and scale of agglomeration, and prevent negative externalities that may result from excessive concentration, thus weakening the promoting link between marine economy and economic resilience.
This paper still has the following shortcomings: firstly, due to the limitation of data availability, the research object is set to coastal provinces, while prefecture-level cities, county-level cities and even relevant enterprises in coastal areas are not examined in this regard. Secondly, this paper only tested the driving factors of economic resilience, but failed to further identify its mechanism of action. Therefore, detecting the mechanism of action of resilience factors is a necessary research tool for coastal regions to achieve sustainable development. Thirdly, a more comprehensive and in-depth exploration of the evolution of economic resilience in coastal areas is also an issue that needs to be further studied and explored in the follow-up.
Data availability statement
Publicly available datasets were analyzed in this study. This data can be found here: https://beta.sedac.ciesin.columbia.edu/; https://cmi.ssap.com.cn/; https://www.stats.gov.cn/sj/ndsj/.
Author contributions
HW: Conceptualization, Formal analysis, Methodology, Writing – original draft, Writing – review & editing. JY: Data curation, Writing – original draft, Writing – review & editing, Formal analysis, Methodology, Visualization. HSW: Data curation, Writing – original draft, Writing – review & editing, Validation. CN: Investigation, Software, Writing – original draft, Writing – review & editing.
Funding
The author(s) declare that no financial support was received for the research, authorship, and/or publication of this article.
Acknowledgments
We thank CN and Dr. Yukai Han for their valuable comments on the manuscript.
Conflict of interest
The authors declare that the research was conducted in the absence of any commercial or financial relationships that could be construed as a potential conflict of interest.
Publisher’s note
All claims expressed in this article are solely those of the authors and do not necessarily represent those of their affiliated organizations, or those of the publisher, the editors and the reviewers. Any product that may be evaluated in this article, or claim that may be made by its manufacturer, is not guaranteed or endorsed by the publisher.
References
Bishop P. C. (2018). Knowledge diversity and entrepreneurship following an economic crisis: an empirical study of regional resilience in Great Britain. Entrepreneur. Region. Dev. 31, 496–515. doi: 10.1080/08985626.2018.1541595
Brown L., Greenbaum R. T. (2017). The role of industrial diversity in economic resilience: An empirical examination across 35 years. Urban Stud. 54, 1347–1366. doi: 10.1177/0042098015624870
Brülhart M., Sbergami F. (2009). Agglomeration and growth: cross-country evidence. CEPR discussion paper series. J Urban Econ. 65 (1), 48–63. doi: 10.1016/J.JUE.2008.08.003
Bruneckienė J., Palekienė O., Simanavičienė Ž., Rapsikevičius J. (2018). Measuring regional resilience to economic shocks by index. Eng. Econ. 29 (4), 405–418. doi: 10.5755/j01.ee.29.4.18731
Cainelli G., Ganau R., Modica M. (2019). Industrial relatedness and regional resilience in the European Union. Pap. Region. Sci. 98, 755–778. doi: 10.1111/pirs.12377
Chacon-Hurtado D., Losada-Rojas L. L., Yu D., Gkritza K., Fricker J. D. (2020). A proposed framework for the incorporation of economic resilience into transportation decision making. J. Manage. Eng. 36 (6), 04020084. doi: 10.1061/(ASCE)ME.1943-5479.0000834
Chang Y. C. (2011). Maritime clusters: What can be learnt from the South West of England. Ocean Coast. Manage. 54, 488–494. doi: 10.1016/j.ocecoaman.2011.03.005
Chang Y. C., Khan M. I. (2019). China–Pakistan economic corridor and maritime security collaboration: A growing bilateral interests. Maritime Business Rev. 4, 217–235. doi: 10.1108/MABR-01-2019-0004
Ciccone A. (2002). Agglomeration-effects in Europe. Eur. Econ. Rev. 46 (2), 213–227. doi: 10.1016/S0014-2921(00)00099-4
Dong F., Wang Y., Zheng L., Li J., Xie S. (2020). Can industrial agglomeration promote pollution agglomeration? Evidence China. J. Cleaner Product. 246, 118960. doi: 10.1016/j.jclepro.2019.118960
Doran J., Fingleton B. (2017). US Metropolitan Area Resilience: Insights from dynamic spatial panel estimation. Environ. Plann. A: Econ. Space 50, 111–132. doi: 10.1177/0308518X17736067
Fargnoli R., Meyermans E. (2018). Digitalisation of the euro area economy and impact on resilience. Q. Rep. Euro Area (QREA) 17, 31–48.
Giannakis E., Bruggeman A. (2017). Determinants of regional resilience to economic crisis: A European perspective. Eur. Plann. Stud. 25, 1394–1415. doi: 10.1080/09654313.2017.1319464
Hassink R. (2010). Regional resilience: a promising concept to explain differences in regional economic adaptability? Cambridge J. Regions Econ. Soc. 3, 45–58. doi: 10.1093/cjres/rsp033
Ji J., Chi Y., Yin X. (2024). Research on the driving effect of marine economy on the high-quality development of regional economy–evidence from China’s coastal areas. Region. Stud. Mar. Sci. 74, 103550. doi: 10.1016/j.rsma.2024.103550
Johansen U., Bull-Berg H., Vik L. H., Stokka A. M., Richardsen R., Winther U. (2019). The Norwegian seafood industry–importance for the national economy. Mar. Policy 110, 103561. doi: 10.1016/j.marpol.2019.103561
Khan M. I., Lokhande S., Chang Y. C. (2022). Brexit and its impact on the co-operation along with the 21st century maritime Silk Road—Assessment from Port Governance. Front. Mar. Sci. 9, 906566. doi: 10.3389/fmars.2022.906566
Kitsos A., Bishop P. C. (2018). Economic resilience in Great Britain: the crisis impact and its determining factors for local authority districts. Ann. Region. Sci. 60, 329–347. doi: 10.1007/s00168-016-0797-y
Lewin P. A., Watson P., Brown A. L. (2018). Surviving the Great Recession: the influence of income inequality in US urban counties. Region. Stud. 52, 781–792. doi: 10.1080/00343404.2017.1305492
Liu H., Fang Y., Liu J., Chen Y. (2023). The interaction of cultural and creative industries clusters and regional economic resilience from the perspective of spatial analysis. Sustainability 15, 5542. doi: 10.3390/su15065542
Martin R. (2012). Regional economic resilience, hysteresis and recessionary shocks. J. Econ. Geogr. 12, 1–32. doi: 10.1093/jeg/lbr019
Martin R., Gardiner B. (2019). The resilience of cities to economic shocks: A tale of four recessions (and the challenge of Brexit). Pap. Region. Sci. 98 (4), 1801–1833. doi: 10.1111/pirs.12430
Martin R., Sunley P. (2015). On the notion of regional economic resilience: conceptualization and explanation. J. Econ. Geogr. 15, 1–42. doi: 10.1093/jeg/lbu015
Martin R., Sunley P., Tyler P. (2015). Local growth evolutions: recession, resilience and recovery. Cambridge J. Regions Econ. Soc. 8, 141–148. doi: 10.1093/cjres/rsv012
Maskell P., Lorenzen M. (2004). The cluster as market organization. Urban Studies 41 (5-6), 991–1009. doi: 10.1080/00420980410001675878
Oxborrow L., Brindley C. (2012). Regional resilience in recessionary times: a case study of the East Midlands. Int. J. Retail Distrib. Manage. 40, 882–899. doi: 10.1108/09590551211267629
Pendall R., Foster K. A., Cowell M. (2010). Resilience and regions: building understanding of the metaphor. Cambridge J. Regions Econ. Soc. 3, 71–84. doi: 10.1093/cjres/rsp028
Rahe M. L., Weber B. A., Wu X., Fisher M. (2019). Income inequality and county economic resistance to job loss during the great recession. Rev. Region. Stud. 49 (1), 129–147. doi: 10.52324/001c.7935
Rios V., Gianmoena L. (2020). The link between quality of government and regional resilience in Europe. J. Policy Model. 42, 1064–1084. doi: 10.1016/j.jpolmod.2020.02.005
Rocchetta S., Mina A. (2019). Technological coherence and the adaptive resilience of regional economies. Region. Stud. 53, 1421–1434. doi: 10.1080/00343404.2019.1577552
Slocum S. L., Kline C. S. (2014). Regional resilience: opportunities, challenges and policy messages from Western North Carolina. Anatolia 25, 403–416. doi: 10.1080/13032917.2014.888673
Stewart R., Chowdhury M. (2021). Banking sector distress and economic growth resilience: Asymmetric effects. J. Econ. Asymmetries 24, e00218. doi: 10.1016/j.jeca.2021.e00218
Sun J., Miao J., Mu H., Xu J., Zhai N. (2022). Sustainable development in marine economy: Assessing carrying capacity of Shandong province in China. Ocean Coast. Manage. 216, 105981. doi: 10.1016/j.ocecoaman.2021.105981
Tan J., Zhang P., Lo K., Li J., Liu S. (2017). Conceptualizing and measuring economic resilience of resource-based cities: Case study of Northeast China. Chin. Geograph. Sci. 27, 471–481. doi: 10.1007/s11769-017-0878-6
Wang J., Yang Z., Qian X. (2020). Driving factors of urban shrinkage: Examining the role of local industrial diversity. Cities 99, 102646. doi: 10.1016/j.cities.2020.102646
Watson P., Deller S. C. (2021). Tourism and economic resilience. Tourism Econ. 28, 1193–1215. doi: 10.1177/1354816621990943
Williamson J. G. (1965). Regional inequality and the process of national development: A description of the patterns. Econ. Dev. Cult. Change 13, 1–84. doi: 10.1086/450136
Wink R. (2014). Regional economic resilience: policy experiences and issues in Europe. Raumforschung und Raumordnung 72, 83–84. doi: 10.1007/s13147-014-0283-x
Xia Q., Quan M., Li H., Hao X. (2022). Is environmental regulation works on improving industrial resilience of China? Learning from a provincial perspective. Energy Rep. 8, 4695–4705. doi: 10.1016/j.egyr.2022.03.168
Yin K., Xu Y., Li X., Jin X. (2018). Sectoral relationship analysis on China’s marine-land economy based on a novel grey periodic relational model. J. Cleaner Product. 197, 815–826. doi: 10.1016/j.jclepro.2018.06.071
Zheng L., Tian K. (2021). The contribution of ocean trade to national economic growth: A non-competitive input-output analysis in China. Mar. Policy 130, 104559. doi: 10.1016/j.marpol.2021.104559
Zhou X., Pan Z., Shahbaz M., Song M. (2020). Directed technological progress driven by diversified industrial structural change. Struct. Change Econ. Dynam. 54, 112–129. doi: 10.1016/j.strueco.2020.04.013
Keywords: marine economy, economic resilience, threshold effects, coastal areas, mechanism of action
Citation: Wang H, Yang J, Wu H and Niu C (2024) Research on the impact of marine economic development in coastal areas on regional economic resilience: evidence from China. Front. Mar. Sci. 11:1414663. doi: 10.3389/fmars.2024.1414663
Received: 09 April 2024; Accepted: 17 May 2024;
Published: 03 June 2024.
Edited by:
Qingji Zhou, Tianjin University, ChinaReviewed by:
Yusheng Zhou, Nanyang Technological University, SingaporeYen-Chiang Chang, Dalian Maritime University, China
Copyright © 2024 Wang, Yang, Wu and Niu. This is an open-access article distributed under the terms of the Creative Commons Attribution License (CC BY). The use, distribution or reproduction in other forums is permitted, provided the original author(s) and the copyright owner(s) are credited and that the original publication in this journal is cited, in accordance with accepted academic practice. No use, distribution or reproduction is permitted which does not comply with these terms.
*Correspondence: Jicong Yang, eWpjNzc3QHN0dWQudGp1dC5lZHUuY24=