 Kai Zhu
 Kaida Xu
- Key Laboratory of Sustainable Utilization of Technology Research for Fishery Resources of Zhejiang Province, Zhejiang Marine Fisheries Research Institute, Scientific Observing and Experimental Station of Fishery Resources for Key Fishing Grounds, Ministry of Agriculture and Rural Affairs, Zhoushan, China
Introduction: Pelagic cephalopods play a key role in the Chinese food supply. The market value of seafood frequently fluctuates based on its geographical origin and species, making it imperative to trace the origin and distinguish forms to guarantee food quality and accurate information.
Methods: In this study, we used biochemical tracers, including stable isotope analysis and fatty acid composition profiling, to trace the origin of purpleback flying squid (Sthenoteuthis oualaniensis) from the Indian Ocean and South China Sea. We measured the δ13C and δ15N values and fatty acid (FA) contents in samples from different forms of S. oualaniensis obtained from these two oceanic regions. We analyzed the feeding and nutritional differences among these populations and conducted discriminant analysis.
Results and discussion: Significant regional and form differences were observed in both isotopic values and FA profiles in the muscle tissues of S. oualaniensis. Forms with larger sizes exhibited higher δ13C and δ15N values, potentially resulting from different feeding preferences and geographical environments. The discriminant analysis revealed that isotopic composition could effectively distinguish individuals from different oceanic regions, whereas FA composition was more effective in distinguishing different forms within the same oceanic region. The combination of isotopes and FAs could accurately discriminate S. oualaniensis of different forms and from different oceanic regions, achieving a discrimination accuracy of 100%. This study provides a reference for tracing the origin of pelagic cephalopods with complex form structures.
1 Introduction
As a crucial pelagic fishery resource, the purpleback flying squid (Sthenoteuthis oualaniensis) has a prominent position in global fisheries and a widespread distribution, with major fishing grounds encompassing the Ryukyu Islands, the Gulf of Aden, and the northwestern Indian Ocean (IO) (Zuyev et al., 2002). Abundant resources of S. oualaniensis are found in the South China Sea (SCS) and IO (Zhou et al., 2008; Zhang et al., 2018) and have substantial developmental potential. The potential of this resource becomes even more evident with the current decline facing coastal fishery resources. S. oualaniensis is regarded as a high-quality seafood raw material because of the high-protein and low-fat characteristics of the muscle tissue. Despite challenges such as the excessive sour taste and high endogenous formaldehyde content (Fu et al., 2020), diverse applications, including processing into dried products and fish feed, provide favorable commercial markets. With the increasing harvesting of S. oualaniensis, the regulation of the subsequent food quality and safety has become crucial. However, the complex form structure (Staaf et al., 2010) and diverse product specifications of S. oualaniensis pose challenges for market supervision. The market value of seafood often varies depending on the origin and species. Consequently, origin tracing and form discrimination have emerged as crucial means to ensure food quality and information transparency.
Traditional methods for cephalopod form discrimination primarily rely on morphology and molecular biology (Lü et al., 2013; Gong et al., 2018). However, morphology-based approaches are unsuitable for processed squid products. Although molecular biology studies have revealed significant genetic differentiation among different forms of S. oualaniensis, uncertainty remains in the analytical results (Liu et al., 2008, 2017; Li et al., 2019). Form discrimination methods based on isotopes and fatty acids (FAs) have recently emerged as promising approaches, serving as valuable complements to cephalopod form identification (Kim et al., 2015; Ortea & Gallardo, 2015). Isotope and FA composition in organisms is strongly influenced by food sources and species accumulation processes and are therefore effective tools for form identification and habitat tracing (Spangenberg, 2016; Zhang et al., 2017).
Carbon and nitrogen stable isotopes can reflect the accumulation of feeding information in organisms, and their stable enrichment phenomena reveal the organic matter sources and food composition of consumers within the food web (Peterson and Fry, 1987). These isotopes undergo fractionation and transformation processes within organisms (Dubois et al., 2007), which can reveal the transfer of organic matter among biological tissues. The isotopic signatures of different tissues reflect feeding conditions across various time scales, making isotopic composition an ideal indicator of the living environment of an organism. Furthermore, FAs play a crucial role in marine ecosystems as essential nutrients and energy sources for marine animals. Marine animals have a limited ability to synthesize and modify FAs, particularly for highly unsaturated FAs, and they must therefore obtain these FAs from their prey and maintain the original structure of the FAs within their tissues (Parrish et al., 2000; Kharlamenko et al., 2001; Chaguri et al., 2017). Consequently, FAs have emerged as an important biomarker for tracing the flow of substances in marine ecological food webs (Raclot et al., 1998). The composition of FAs within organisms can reflect their living environments (Kasai, 2003; Hasegawa et al., 2014), and the muscles of cephalopods, as their main energy storage tissues, contain food information from a specific period. In addition, environmental factors can produce significant differences in the FA composition of muscle and hard tissues of cephalopods from different oceanic regions (Gong et al., 2018; Zhu et al., 2018).
Different forms of S. oualaniensis are recognized, including the medium form (MF) distributed in all oceanic regions, the dwarf form (DF) primarily found in equatorial waters, and the giant form (GF) primarily inhabiting the IO (Nesis, 1993). Previous studies have posited that GF is merely a plastic phenotype of MF, while many scholars speculate that the DF may represent an independent species distinct from the MF (Clarke, 1965; Snyder, 1998). However, molecular analyses have revealed that GF and DF both exhibit considerable genetic distances from MF, indicating a high probability of their being mutually independent species (Li et al., 2019; Xu et al., 2020; Jeena et al., 2023). This intraspecific diversity, observed in S. oualaniensis, is echoed in other cephalopod species as well (Fernández-Álvarez et al., 2021). These forms exhibit morphological, reproductive, and ecological variations (Jereb & Roper, 2010). Owing to the diversity of its habitat, S. oualaniensis from different oceanic regions displays significant differences in reproduction, growth characteristics, and other aspects (Yatsu et al., 1997; Chen et al., 2007; Chembian & Mathew, 2014; Lin et al., 2015). For species with complex form structures and significant habitat variations, isotopic and FA composition can reveal the nutritional characteristics of different forms and geographical populations, thereby enabling the tracing and tracking of such groups. The present study used isotope and FA techniques to trace the geographical origin of S. oualaniensis from the IO and SCS. By collecting samples from different forms in these two regions and measuring their population-level δ13C and δ15N values as well as their FA contents, this study aimed to reveal differences in feeding habits and nutritional ecology among the various populations. The successful application of isotope and FA techniques in form identification and geographical tracing will provide valuable references for tracing the origin of oceanic cephalopods with complex form structures.
2 Material and methods
2.1 Sample collection and sample pretreatment
S. oualaniensis specimens were collected on various commercial jigging cruises operating in the IO (14°33’N–18°55’N、61°21’E–63°57’E) from November to December in 2022 and light falling-net fisheries in the SCS (9.80°N–17.25°N, 110.25°E–115.02°E) from May to June in 2022 (Figure 1). All specimens were collected fresh, immediately frozen at −20°C, and then transported to the laboratory. A total of 79 specimens were randomly sampled. Specific population numbers and mantle lengths of four populations are detailed in Table 1.

Figure 1 Study region for sampling of Sthenoteuthis oualaniensis in the South China Sea (SCS) and Indian Ocean (IO).
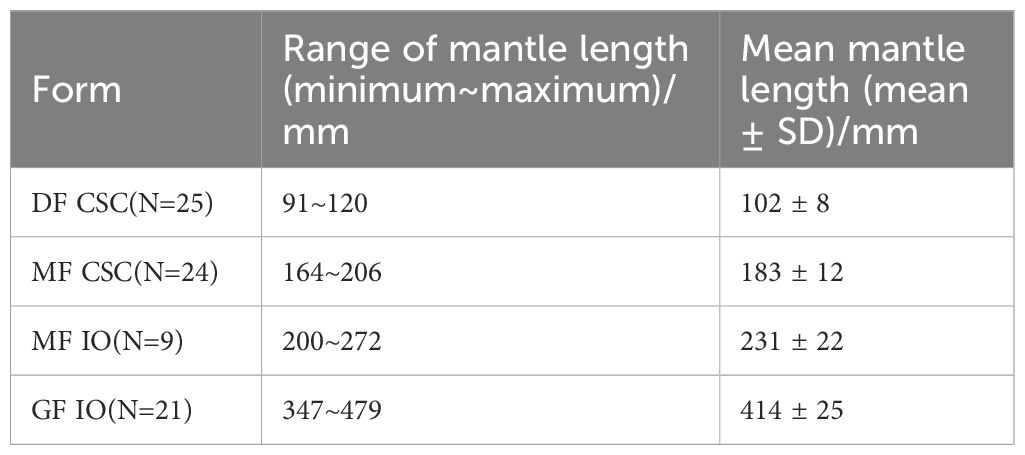
Table 1 Sample composition for the dwarf form (DF) and medium form (MF) of Sthenoteuthis oualaniensis in the South China Sea and giant form (GF) and MF of S. oualaniensis in the Indian Ocean.
After being defrosted in the laboratory at room temperature, S. oualaniensis specimens from the SCS were categorized into DF and MF groups based on the absence or presence of dorsal photophores (Zhu et al., 2016; Wang et al., 2019), whereas specimens from the IO were categorized into GF and MF groups based on the distribution range of mantle length in sexually mature individuals (Snyder, 1998; Zuyev et al., 2002). The dorsal mantle lengths were measured to the nearest 1 mm, and body weights were measured to the nearest 1 g. Muscle tissues (approximately 2 × 2 cm) were excised from the same area near the funnel locking-cartilage, washed using distilled water, and then frozen at −35°for subsequent analyses. Each muscle piece was freeze-dried at −55°for 48 h using a Christ Alpha 1–4 (Martin Christ, Harz, Germany), pulverized using a Mixer mill MM440 (Retsch, Haan, Germany), and then stored under dry conditions.
2.2 Stable isotope ratio analysis
Dried muscle tissue powder (1 mg) was used for analysis. After extracting lipids from samples, the carbon stable isotope was analyzed on an elemental analyzer (Elementar Analysensysteme GmbH, Hanau, Germany). To accomplish this, solid residues were collected and fat removed for FA analysis. The δ13C sample was then dried in an oven at 30°for 24 h, and 1 mg of lipid-extracted powder subsample was weighed in a tin capsule.
The δ13C or δ15N natural abundance is expressed in δ-notation in parts per thousand (‰) relative to international reference materials USGS 24 (δ13C = −16.049‰) and USGS 26 (δ15N = 53.7‰). After every 10 samples, a laboratory standard (protein: δ13C = −26.98‰ and δ15N = 5.96‰) was analyzed three times with a blank sample. The analytical error was ±0.05‰ and ±0.06‰ for δ13C and δ15N values, respectively.
2.3 FA analysis
Lipid extraction was performed according to the modified Folch method. Approximately 200 mg of powdered sample was blended in a 15-mL mixture of CHCl3/MeOH (2:1, v/v) for ≥20 h. The extract was washed with a 0.9% (w/v) NaCl solution and then left to stand for separation into two phases. The organic (lower) phase was collected and dried under N2. The extracted lipid was dissolved in 4 mL of 0.5 M NaOH/MeOH solution and refluxed for 30 min (water bath, 100°C). Thereafter, 4 mL of BF3/MeOH (14%, w/v) was added, followed by further refluxing for 30 min. After cooling, 4 mL of n-heptane was added, and the mixture was shaken for 2 min, followed by the addition of 10 mL of a saturated NaCl solution. After each separation, the upper organic layer, containing FA methyl esters (FAMEs) in n-heptane, was transferred to a sample bottle before analysis. The FA concentrations were determined via gas chromatography–mass spectrometry using a 7890B gas chromatograph interfaced with a 5977A single quadrupole mass spectrometer (both from Agilent Technologies, Santa Clara, CA, USA) and equipped with a HP-88 capillary column (60 m × 0.25 nm × 0.20 μm; Agilent Technologies). The chromatographic separation was achieved using helium as the carrier gas, and an injection volume of 10 μL, injector temperature of 250°C, and initial temperature of 125°C; the oven temperature was increased to 145°at 8°C/min and held at 145°for 26 min, then to 220°at 2°C/min, and held for 1 min and finally increased to 227°at 1°C/min and held for 1 min. The split ratio was 10:1. The electron ionization (EI) source was operated in scan mode from m/z 50 to 500 at a source temperature of 230°C. The ionization energy and scanning frequency were 70 eV and 3 scans/s, respectively. The identification of FAMEs was performed by comparison of retention times and full-scan EI mass spectra with those of a known concentration of reference standard of 37 FAMEs (GLC 37, Nu-Chek Prep, Inc., Elysian, MN, USA). The FA concentrations are reported in relation to the total concentrations of FAs (% of the total FAs), as well as the total proportion of saturated, monounsaturated, and polyunsaturated FAs (SFAs, MUFAs, and PUFAs, respectively).
2.4 Statistical analysis
To explore differences among forms and areas of samples, a one-way analysis of variance (ANOVA) with a post hoc Tukey’s honestly significant difference test was performed on the FA profiles and isotopic datasets. Stepwise discriminant analysis (SDA) was performed to identify significant discriminatory variables (Rencher, 2002). A linear discriminant analysis was developed to discriminate between the two forms and between SCS and IO using the selected variables. Finally, leave-one-out cross-validation was used to determine the rate of correct classification for different forms and areas. All statistical tests were performed in SPSS version 19.0 (IBM Corp., Armonk, NY, USA) using a significance level of p ≤ 0.05. Results are presented as mean value ± standard deviation (SD).
3 Results
3.1 Stable isotopes
Analysis of S. oualaniensis from the SCS and IO identified significant differences for both δ13C and δ15N values (δ15N, F = 891.783, P < 0.01; δ13C, F = 79.399, P < 0.01). The δ15N and δ13C values of S. oualaniensis from the IO were higher than those of S. oualaniensis from the SCS (Table 2), indicating the geographic population differences. Similar results were obtained for isotopic values among forms. The MF from the SCS had higher δ15N and δ13C values (δ15N, F = 58.611, P < 0.01; δ13C, F = 117.829, P < 0.01), and the GF from the IO had higher δ15N and δ13C values (δ15N, F = 16.272, P < 0.01; δ13C, F = 5.356, P < 0.05). These observations indicate that isotopic values of S. oualaniensis differed not only between geographic populations but also between forms, although scatterplots of δ13C and δ15N values showed considerable overlap between forms at the same sampling area (Figure 2).
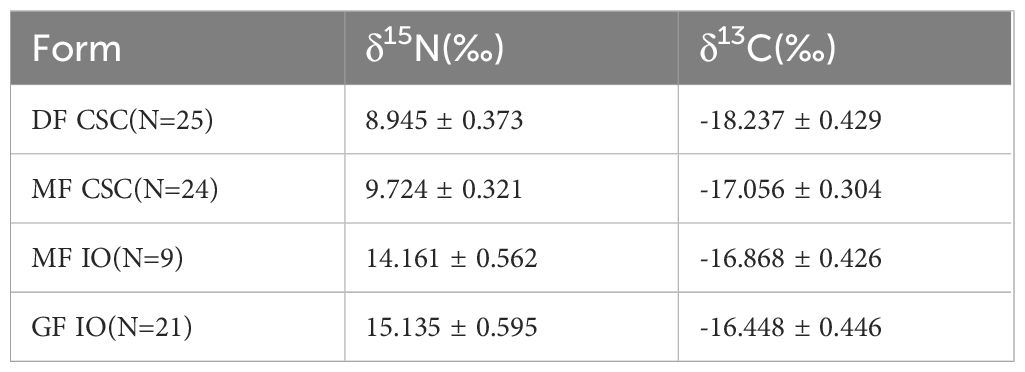
Table 2 δ13C and δ15N values (mean ± SD) for the dwarf form (DF) and medium form (MF) of Sthenoteuthis oualaniensis in the South China Sea and giant form (GF) and MF of S. oualaniensis in the Indian Ocean.
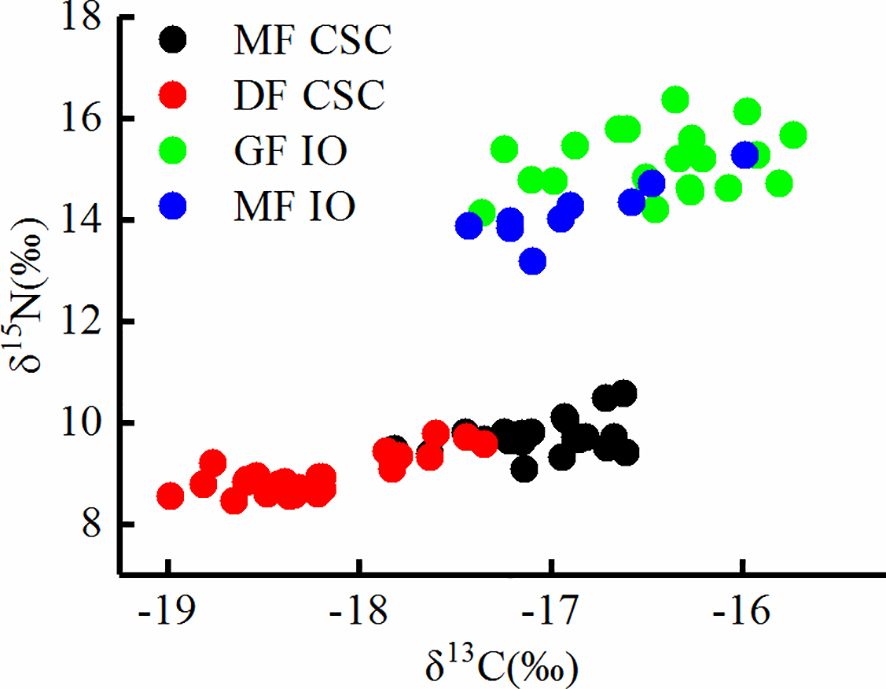
Figure 2 Stable carbon and nitrogen isotope compositions for the dwarf form (DF) and medium form (MF) of Sthenoteuthis oualaniensis in the South China Sea (SCS) and giant form (GF) and MF of S. oualaniensis in the Indian Ocean (IO).
3.2 FA profiles
A total of 24 FAs were identified in the muscle of S. oualaniensis, where PUFAs were the major FAs, accounting for 54.36%–62.73% of the total FAs, followed by SFAs and MUFAs (Table 3). The total content of SFAs in IO S. oualaniensis was significantly lower than that in SCS S. oualaniensis (ANOVA, F = 5.672, P < 0.05). Each SFA (except for 14:0 and 15:0) also exhibited a significant difference in the content between specimens from the SCS and IO. The total content of MUFAs in IO S. oualaniensis was significantly higher than that in SCS S. oualaniensis (ANOVA, F = 58.963, P < 0.01), and the content of most of the MUFAs differed between regions except for C16:1n7 and C18:1n9c. S. oualaniensis from the IO showed a higher content for most of PUFAs except for C20:5n3, C22:2n6, and C22:6n3 (Table 3). Among the PUFAs, both 22:6n3(DHA) and 20:5n3(EPA) were the major FAs and comprised >33% and 6% of the total FA content, respectively.
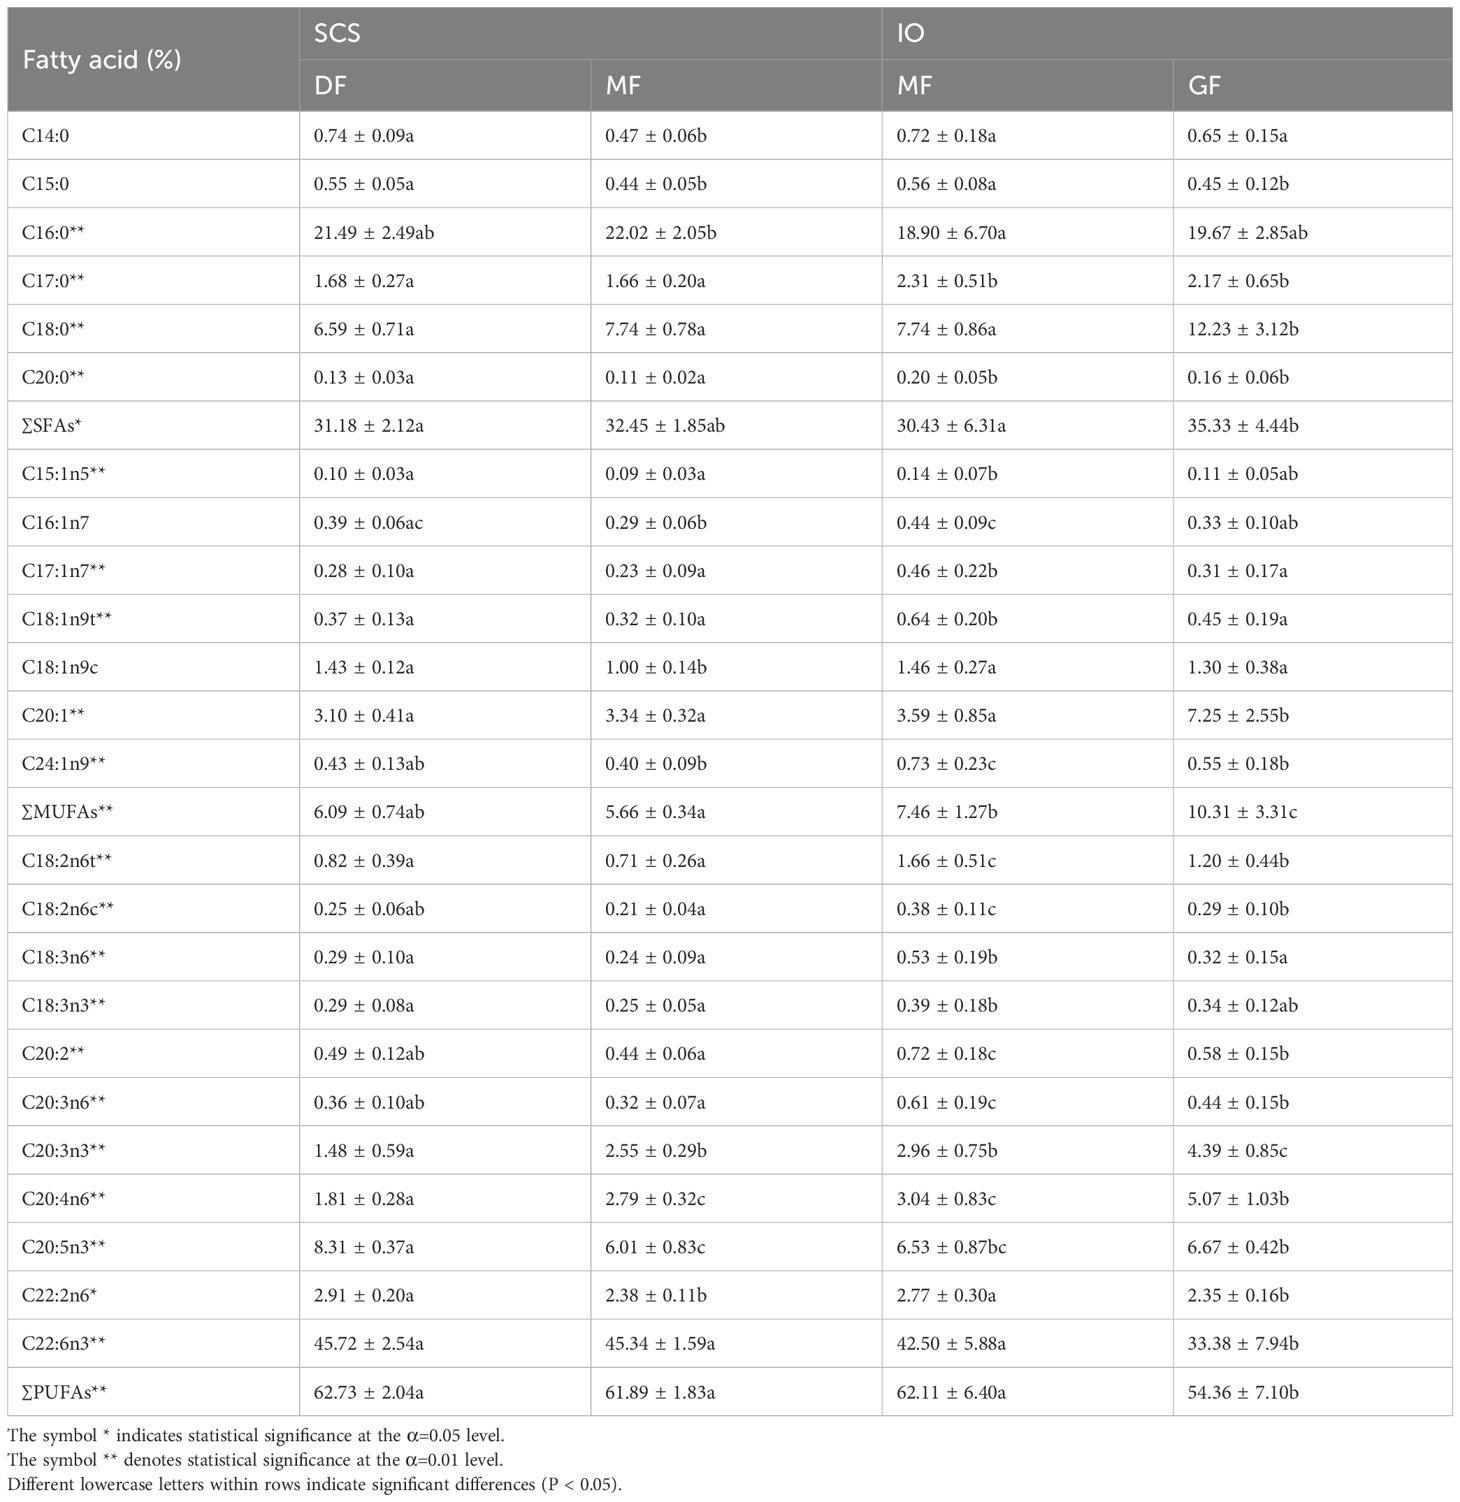
Table 3 Percentages (%) of total FAs for the dwarf form (DF) and medium form (MF) of Sthenoteuthis oualaniensis in the South China Sea and giant form (GF) and MF of S. oualaniensis in the Indian Ocean.
Principal component analysis (PCA) performed on the FAs revealed clear discriminations between forms as well as sampling regions (Figure 3). PC1 explained 51.0% of variance, and the highest contributions to PC1 were C20:0, C20:2, C24:1n9, C20:3n6, C17:0, and C18:2n6c (Table 4). PC2 yielded 19.1% of explainable results, with large contributions from C20:3n3, C22:2n6, and C20:4n6. Furthermore, PC3 explained 7.5% of variance with the most contributing descriptors being C14:0 and C18:1n9c (Table 4).
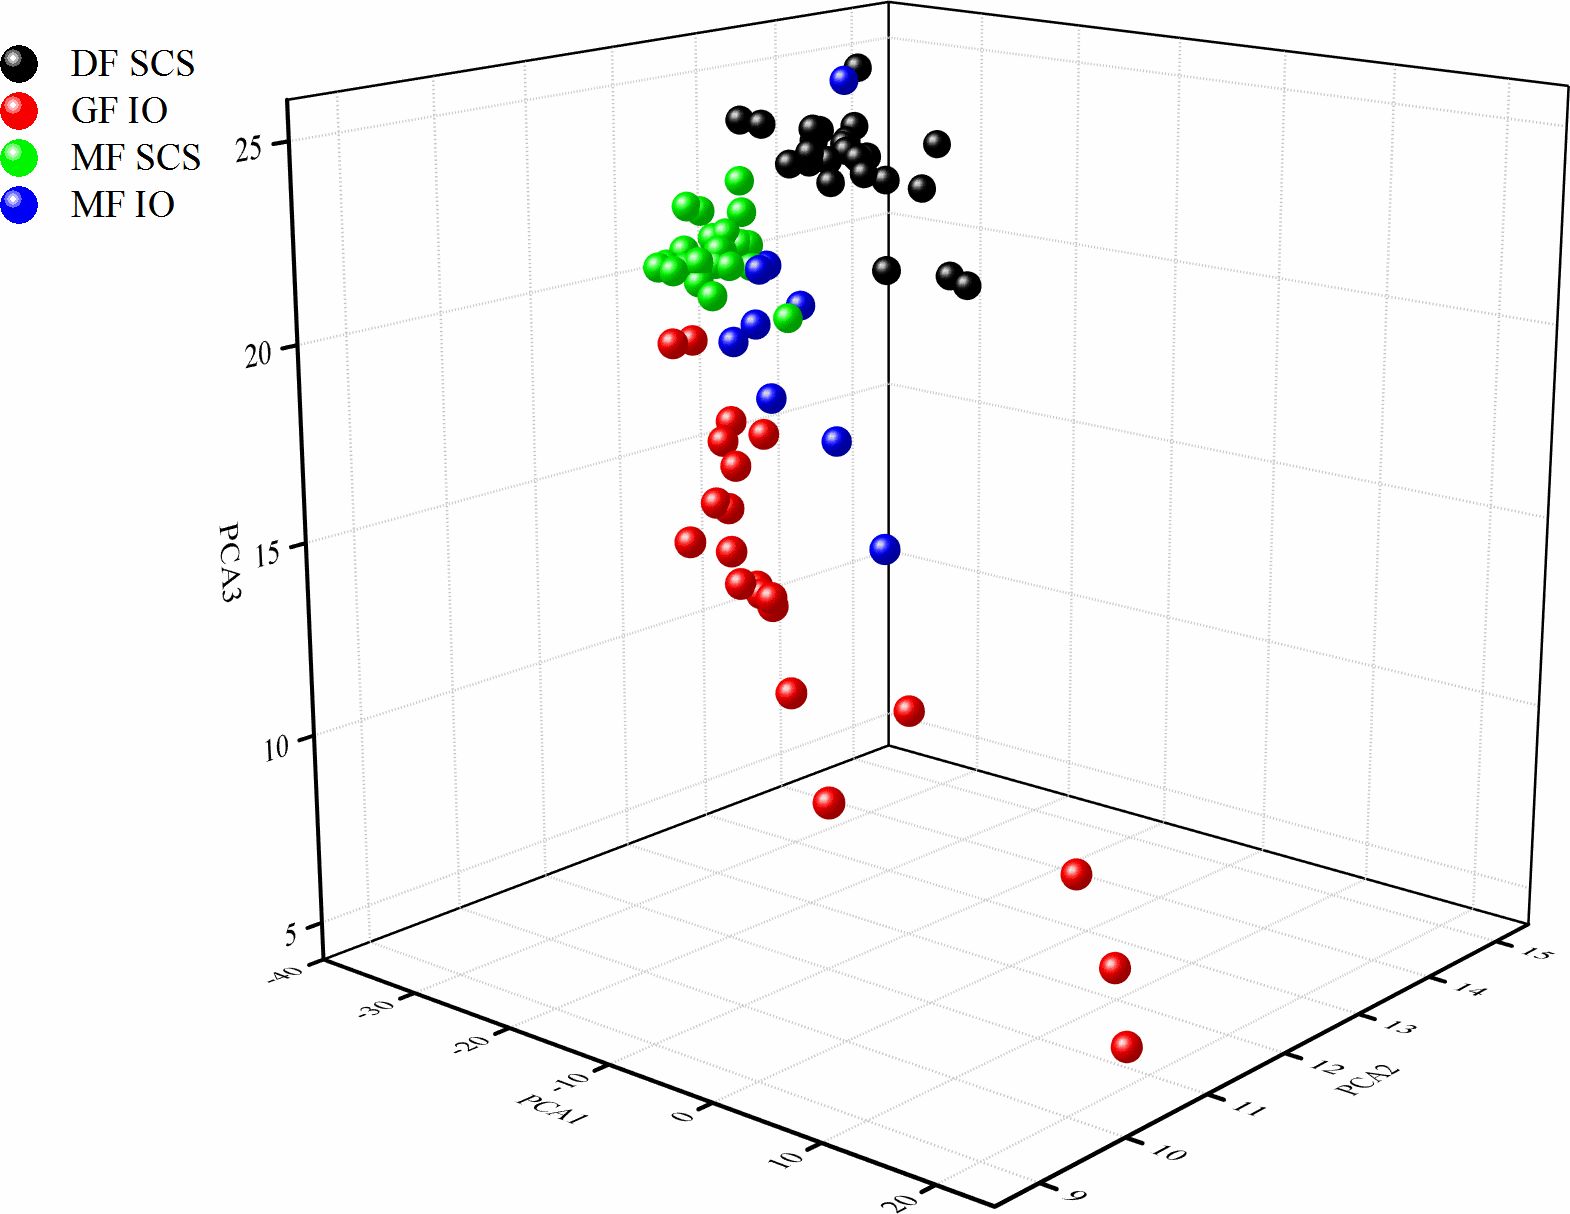
Figure 3 Principal component analysis (PCA) of the fatty acid (FA) composition of the dwarf form (DF) and medium form (MF) of S. oualaniensis in the South China Sea (SCS) and the giant form (GF) and MF of S. oualaniensis in the Indian Ocean (IO).
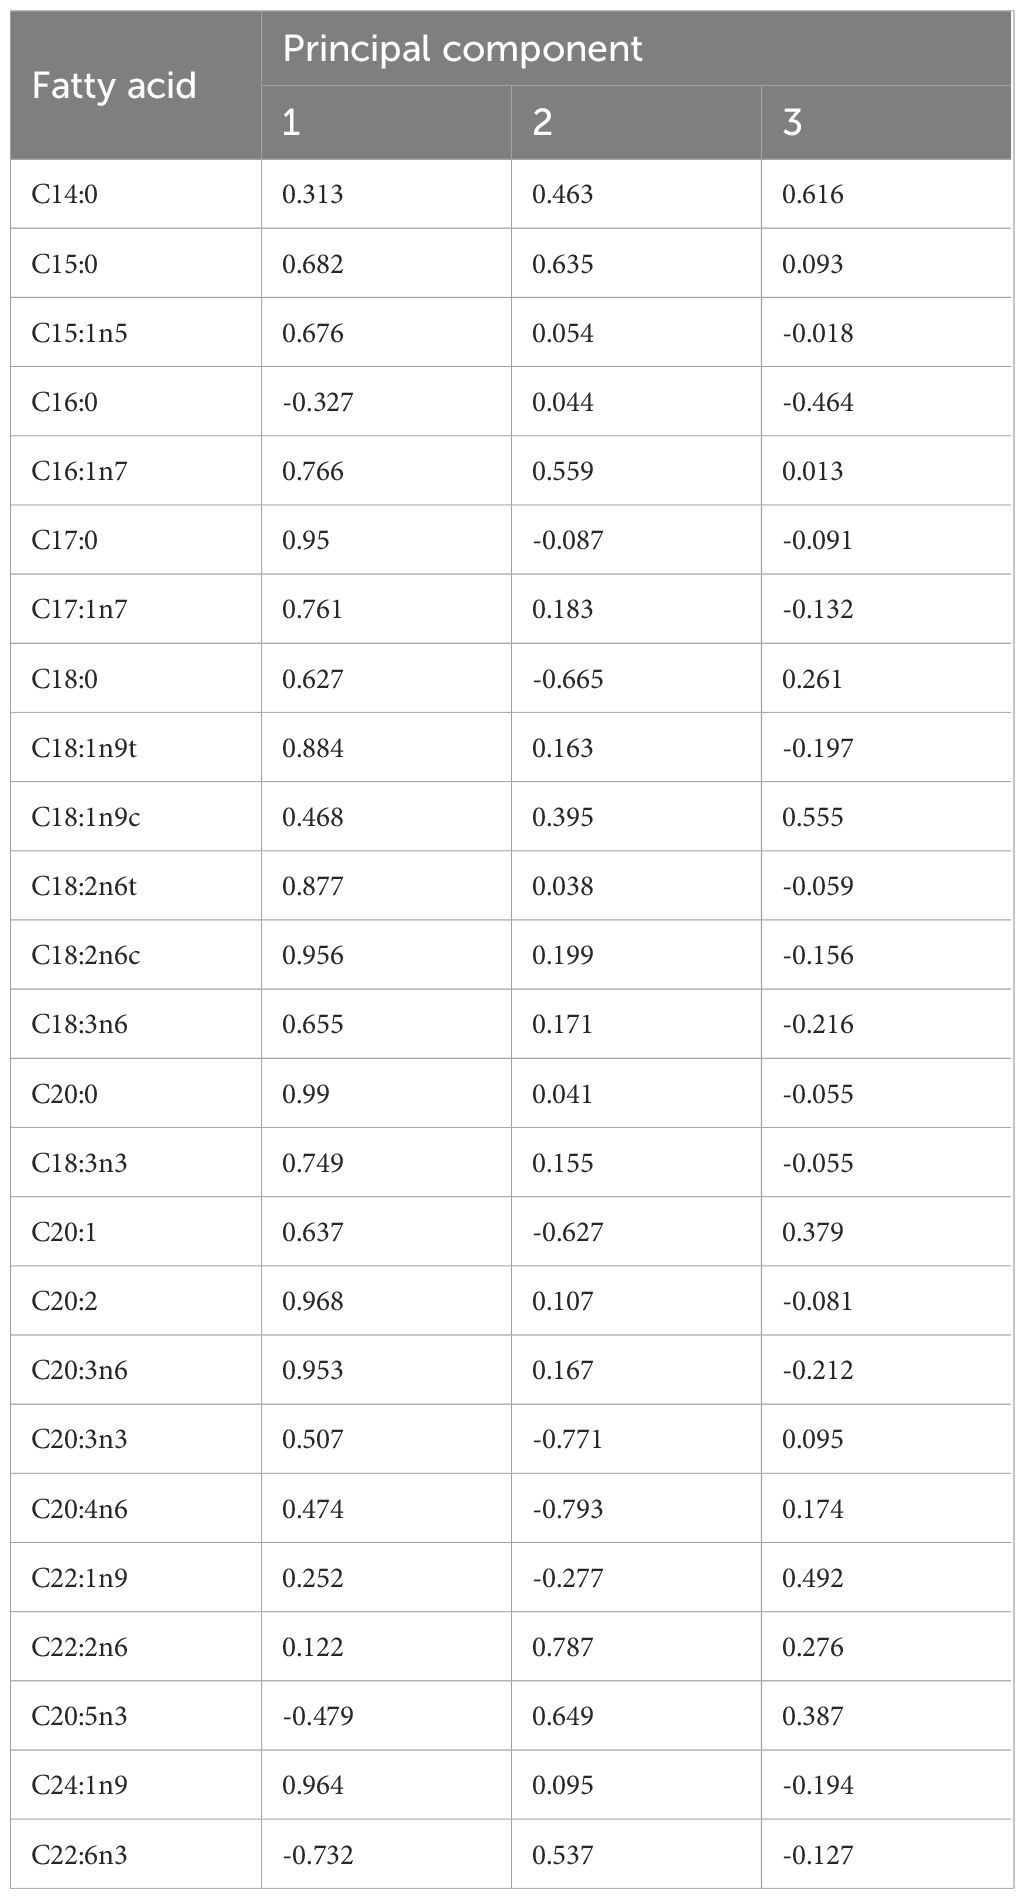
Table 4 Fatty acid (FA) contributions to principal component analysis (PCA) of dwarf form (DF) and medium form (MF) of S. oualaniensis in the South China Sea (SCS), and giant form (GF) and MF of S. oualaniensis in the Indian Ocean (IO).
The separation between areas or forms was apparent in a three-dimensional plot (Figure 3). Thus, forms of S. oualaniensis could be effectively distinguished according to the PCA results, where the most significant distinction existed between GF and the other forms (Figure 3). Moreover, the results indicate that FA profiles, combined with PCA, can be used for authentication and traceability on the level of forms and areas of S. oualaniensis in the SCS and IO.
3.3 Combined analysis of stable isotope and FA compositions
Different forms and areas of S. oualaniensis may be identified through combined analysis of stable isotope and FA compositions as the analysis of a single stable isotope cannot effectively distinguish all forms in single area and the analysis of FAs cannot effectively distinguish all areas of origin. The results show that stable isotope compositions cannot be used as an indicator to distinguish between the DFs and MFs in the SCS or between the MFs and GFs in the IO. Meanwhile, FAs for the DF in the SCS and the MF in the IO partially overlap (Figure 3). Therefore, the combined use of stable isotope and FA markers can be a promising method to distinguish between different forms or origins of S. oualaniensis.
SDA was used to classify the four groups of S. oualaniensis by their different forms or origins according to the compositions of the stable isotope and FA contents (Figure 4). Three discriminant functions were obtained after applying SDA. The variables selected by general statistics demonstrated that δ15N, δ13C, C20:4n6, and C20:5n3 contributed the most to the first discriminant function, whereas C22:6n3 and C20:5n3 contributed the most to the second and third discriminant functions, respectively (Table 5). A complete separation of the four groups was achieved. The recognition ability of the discriminant functions for all groups was 100%, where the first, second and the third discriminant functions accounted for 91.3%, 7.3%, and 1.4%, respectively. The results indicate that δ15N, δ13C, and FA compositions, combined with SDA are promising effective methods for classifying and identifying the different forms of S. oualaniensis in the SCS and IO.
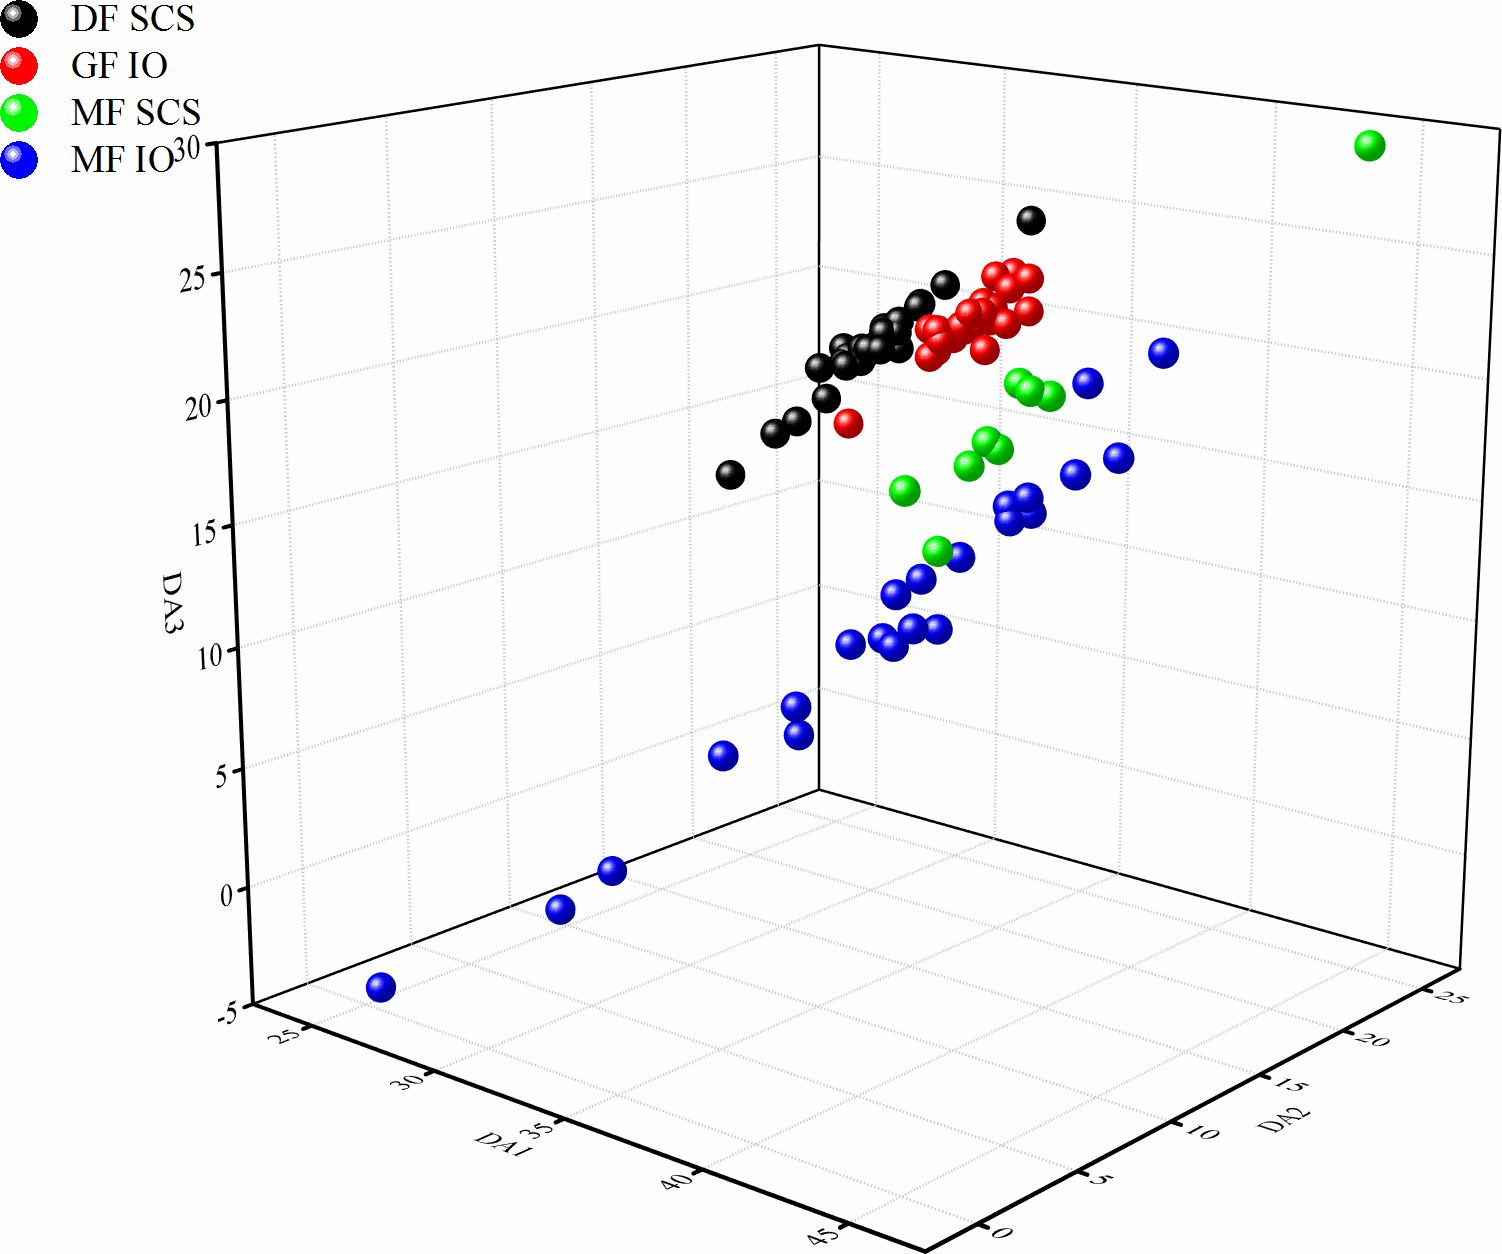
Figure 4 Discriminant analysis (DA) of stable isotope and fatty acid compositions of the dwarf form (DF) and medium form (MF) of S. oualaniensis in the South China Sea (SCS) and the giant form (GF) and MF of S. oualaniensis in the Indian Ocean (IO).
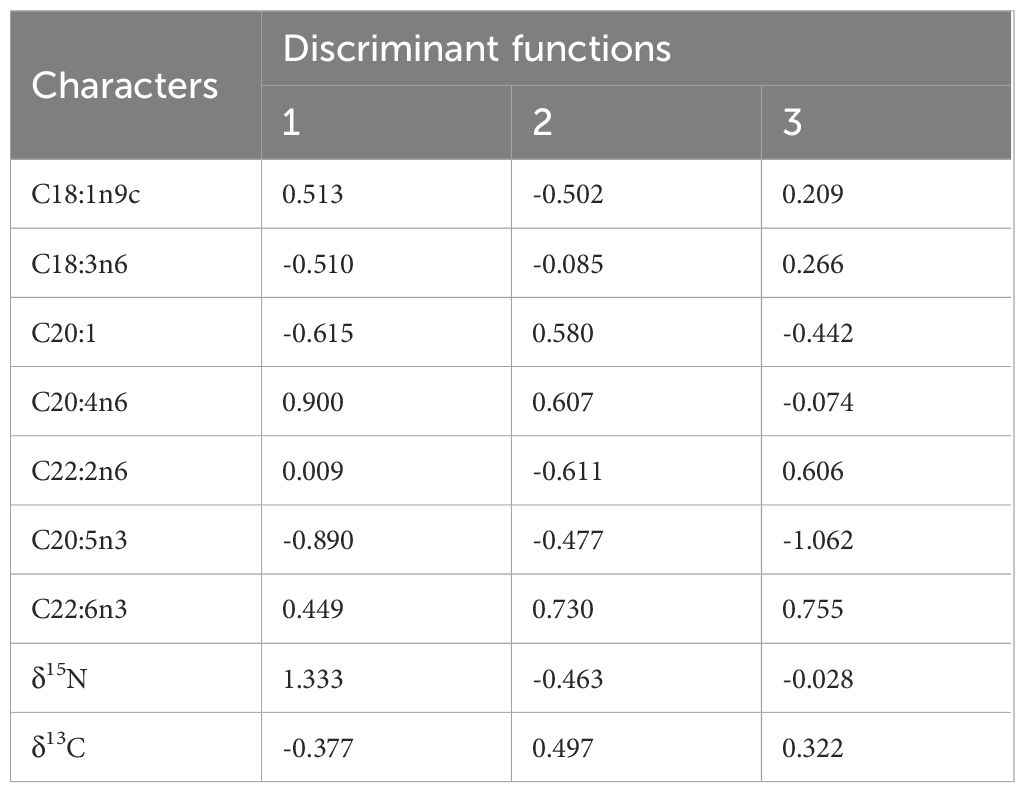
Table 5 Contribution of fatty acid (FA) and stable isotopes to discriminant functions of dwarf form (DF) and medium form (MF) of S. oualaniensis in the South China Sea (SCS) as well as giant form (GF) and MF in the Indian Ocean (IO).
4 Discussion
4.1 Stable isotope ratios
The accumulation of stable isotopes in fish tissues is a comprehensive reflection of their complex physiological processes, encompassing their metabolism, growth, and feeding. Feeding is the primary source of exogenous isotopes and plays a particularly significant role in determining δ13C and δ15N values (MacNeil et al., 2005). In aquatic ecosystems, plankton, benthic algae, and certain aquatic and terrestrial higher plants (e.g., seagrass and mangroves) are the primary contributors to organic carbon. The carbon isotope ratios of consumers typically closely resemble those of their food sources. Since δ13C exhibits a relatively low fractionation across trophic levels, this is often used to indicate the food sources of organisms (Doi et al., 2005). Nitrogen stable isotopes are limited in excretion during protein synthesis within organisms, producing higher δ15N values in consumers compared with their food sources (Peterson and Fry, 1987). The trophic fractionation of δ15N between adjacent trophic levels typically averages 3.4‰, which is crucial for indicating the trophic niche of fish species within the food chain (Yokoyama et al., 2005). Herein, we revealed that δ13C and δ15N values are both relatively high in S. oualaniensis from the IO, whereas δ13C values from S. oualaniensis from the SCS exhibit a broader distribution range. This observation suggests that S. oualaniensis in the IO occupy higher trophic levels, whereas in the SCS, they have more diverse food sources. Such differences in distribution patterns are jointly determined by prey availability and geographical environments in different oceanic regions. Notably, the dietary composition significantly differed between S. oualaniensis from SCS and IO. In the IO, the prey mainly comprises fish, cephalopods, and crustaceans (Chen et al., 2007), whereas in the SCS, this primarily comprises large copepods, krill, amphipods, Myctophidae, and Gonatus onyx (Gong et al., 2016).
The two oceanic regions are geographically distant, producing notable disparities in environmental factors, including terrestrial inputs, precipitation, and temperature. These ecological variations impact the stable isotope composition of organisms as reported by Suh and Shin (2013). Specifically, the SCS, as a semi-enclosed basin, experiences diverse influences from terrestrial inputs and freshwater runoff. This diversity produces a wide array of basic prey species and an abundance of primary carbon sources, ultimately generating a broader distribution of δ13C values among the fish fauna. The differences in δ15N values primarily reflect the trophic positions of fish species within their respective food webs in the two oceanic regions. S. oualaniensis in the IO are characterized by larger body sizes and occupy higher trophic levels at the apex of the food chain and accumulate distinct nitrogen isotope signatures in their bodies. Furthermore, isotopic variations between the two regions are closely associated with primary productivity. In the open waters of the SCS, the existence of a thermocline obstructs the vertical mixing of seawater, impeding the replenishment of nitrogen and phosphorus from deeper, nutrient-rich layers to the euphotic zone. This limitation decreases the primary productivity (Shen et al., 2008), subsequently reducing the absolute isotopic values. Comparable observations have been documented in studies of Dosidicus gigas, where individuals inhabiting the oligotrophic waters off the coast of the middle east Pacific exhibit lower isotopic values than those found along the western coast of South America (Gong et al., 2018). The variations in stable isotope composition among fish species from different marine regions are attributable to multifactorial influences, including prey composition, geographical settings, terrestrial inputs, ecological conditions, and primary productivity. Collectively, these factors determine the positions and trophic niches occupied by fish species within the food chain, offering crucial scientific insights for the in-depth investigation of fish ecology, behavior, and resource distribution.
This study reveals differences in the isotope composition among various forms of S. oualaniensis within the same marine region. Specifically, larger-sized S. oualaniensis forms exhibited higher δ13C and δ15N values. These differences are closely related to the distinct trophic levels occupied by these forms within the ecosystem and the diversity of their food sources. According to food chain theory, predators prefer larger prey as they grow to maximize their nutrient intake. Therefore, larger S. oualaniensis forms are more inclined to prey on larger fish and cephalopods. This variation in feeding habits produces a diverse carbon source selection among the different forms, ultimately causing the differences in δ13C values as reflected in their isotopic accumulation (Pitt et al., 2009). In addition to food sources, the stable isotope composition of organisms is influenced by their own metabolism. Biochemical processes involving carbon and nitrogen isotope fractionation impact the isotopic composition of organisms (Cui, 2012). Further research indicates that the habitat depth of S. oualaniensis gradually increases with their growth, and notable differences occur in the metabolic pathways of larger individuals. In the deep-sea regions of the IO, the GF can even use proteins as an energy source. Moreover, variations in life history among different forms can influence isotope accumulation. The metabolic effects associated with life history cannot be ignored in isotope analysis. Studies have revealed substantial differences in the life cycles of different forms of S. oualaniensis. For instance, the DF in the SCS has the shortest life cycle of approximately 80 days (Jiang et al., 2019), whereas the MF has a life cycle of approximately 200 days (Lu et al., 2022). Conversely, the life cycles of the MF and GF in the IO exceed one year. During metabolic processes, heavier isotopes tend to accumulate in the body, and older individuals typically exhibit a heavier isotope composition (Malej et al., 1993; Overman and Parrish, 2001).
4.2 FA compositions
FAs, as crucial components of organisms, exhibit stability during energy transfer, making FAs a characteristic indicator of the feeding habits of a predator over a certain period (Rajendran et al., 1993; Stübing and Hagen, 2003). The current study revealed discrepancies in the FA composition of S. oualaniensis from different sea areas, which concurs with the isotopic analysis results. Notably, the content of C17:0 in individuals from the IO was consistently higher than that of individuals from the SCS, which is potentially linked to the distinct ecological systems of these two regions. Such differences in feeding preferences among S. oualaniensis across various sea areas have been observed in other marine habitats. In further exploring these disparities, we hypothesized that the variations in FA composition may reflect adaptations to the unique trophic environments of each sea area. The higher concentration of C17:0 in the IO suggests a potential preference for prey species that are rich in this particular FA. Conversely, the lower levels in the SCS may indicate a different dietary profile, possibly because of the availability of different prey species or trophic niches. Understanding these feeding preferences is crucial in elucidating the trophic interactions and ecological roles of S. oualaniensis within diverse marine ecosystems.
We applied PCA and observed that the distribution of the same form across different sea areas was closer than the distribution distances between different forms. This suggests a degree of similarity in feeding strategies among MF individuals in the IO and the SCS. Consistent with this, the isotopic δ13C values showed considerable overlap among MF individuals in these two sea areas. Additionally, the FA composition of S. oualaniensis from different forms notably differed. The food composition of individuals of different forms varies because of size-related differences. DF individuals in the SCS exhibit a feeding preference for nektonic and planktonic organisms (Gong et al., 2018) and primarily feed on cephalopods, followed by crustaceans such as shrimps and copepods (Xie et al., 2021). Conversely, MF individuals have a nektonic feeding type (Gong et al., 2016). and primarily consume cephalopods and fish (Xie et al., 2021). In the northwestern IO, the MF primarily feeds on fish (62.4%) and cephalopods (35.8%) (Chembian and Mathew, 2014), whereas the GF mainly feeds on myctophids. The distribution of FA compositions within the two forms in the SCS exhibits a smaller overlap compared with that between the two forms in the IO, potentially because of a higher similarity in feeding habits among the IO forms. Regardless of whether they live in the SCS or IO, GF individuals possess a higher content of SFAs than DF individuals, with a particularly prominent trend observed in the IO. This could be attributed to the role of SFAs in energy supply as larger individuals require a greater energetic input. Higher concentrations of C15:0 in the GFs across both oceans may be linked to varying feeding strategies among different forms. Additionally, the FA analysis suggests a preference for algae among S. oualaniensis. DF individuals in both oceans exhibit higher levels of C16:1n7 and C18:1n9, whereas those in the SCS also contain a higher amount of EPA. However, no significant difference in the EPA content was observed between the GF and MF individuals in the IO. The presence of C20:4n6, an indicator of benthic feeding, was higher in individuals from the IO than in those from the SCS. The larger-sized form in both oceans also demonstrated higher levels of C20:4n6, which was potentially related to the differing depths of their habitats as larger individuals often inhabit deeper water layers (Chesalin and Zuyev, 2002). The high content of DHA and EPA in S. oualaniensis from the SCS allows for the analysis of trophic levels through the DHA/EPA ratio. Our study reveals a trophic level hierarchy: the MF in the SCS > the MF in the IO > the DF in the SCS > the GF in the IO. This trophic ranking based on DHA/EPA differs from that obtained through isotopic analysis. Although deep-sea fish obtain DHA from consuming algae, the DHA in S. oualaniensis is probably accumulated through the predation of deep-sea fish. Notably, the DHA content in the GF of the IO was significantly lower than that in both SCS forms and the MF of the IO, potentially because of a stronger preference for squid in their diet, which subsequently reduces the accumulation of DHA in their bodies.
4.3 SDA using isotope ratios and FA compositions
Abundant studies on cephalopod form classification have primarily focused on morphological and molecular perspectives. However, this study innovatively classified geographical and form groups from a feeding ecology angle, and this dietary-based approach demonstrates a significantly higher accuracy than morphological-based methods. For instance, using the SDA method, the final correct cross-validated classification rates ranged from 44.3% to 75.2% among the four geographic regions (north-western Indian Ocean, Tropical Eastern Pacific, Bashi Channel and SCS) based on the beak morphology (Liu et al., 2018). Conversely, discrimination accuracy based on external morphology for different groups of S. oualaniensis in the Bashi Channel and the SCS is 68.2% (Wang et al., 2019). Researchers have posited that discrimination accuracy using a single method is lower than that achieved by combining multiple methods. However, combining two standardized hard structures increases the correct classification of SDA by nearly 20% compared with using only one structural element (Fang et al., 2014). Consistent with our findings, isotopic composition distinguishes individuals from different sea areas but not from distinct forms within the same sea area. Conversely, FA composition differentiates between forms in the same sea area but not between individuals from separate sea areas. However, combining isotopic and FA methods facilitates accurate discrimination of S. oualaniensis from diverse sea areas and forms, achieving a discrimination accuracy of 100%. This is attributable to significant carbon source variations among S. oualaniensis from different sea areas, whereas those from the same region may overlap in feeding patterns and ecological niches influenced by factors such as growth. Distinct feeding strategies among various forms in the same sea area produce differing FA profiles, whereas similar feeding preferences among forms across sea areas result in some overlap in their FA composition. These disparities between sea areas and forms are ultimately reflected in variations of isotopic and FA profiles. Notably, isotopic composition plays a more pivotal role than FA composition in discriminating Atlantic salmon from distinct regions (Thomas et al., 2008). This underscores the significance of an integrated approach that merges isotopic and FA analyses for precise cephalopod form discrimination. Although employing isotopic or FA methods separately can yield valuable insights, their combined application offers a more comprehensive understanding of cephalopod form structures and ecologies. This interdisciplinary approach, integrating biochemical and ecological perspectives, is promising for future investigations aiming to elucidate the intricate relationships among cephalopod feeding ecologies, population dynamics, and their environmental habitats. This method exhibits high practicality and can function as an efficient tool for monitoring the source of S. oualaniensis on the market, thereby guaranteeing its traceability. Furthermore, the study has revealed significant variations in food sources and ecological niches across diverse geographical regions and forms of S. oualaniensis, thus offering crucial insights for fisheries management. More specifically, by leveraging these differences, fisheries managers can formulate more targeted management strategies, aiming to foster sustainable exploitation of distinct sea areas and forms, and concurrently minimize the hazards linked to overfishing.
In conclusion, this study measured δ13C and δ15N values as well as the FA content in samples from distinct forms of S. oualaniensis in two marine regions. We conducted a thorough analysis of feeding and trophic ecological disparities among these groups, followed by SDA. The findings indicated that individuals from the IO occupied higher trophic levels, whereas those from the SCS exhibited a more diverse dietary range. Variations in δ13C distributions among individuals from the two marine regions were jointly influenced by feeding preferences and geographical conditions. Conversely, the discrepancies in δ15N values were primarily attributed to the trophic positions of individuals within their respective food webs. Forms with larger body sizes tended to possess higher δ13C and δ15N values, reflecting their occupation of distinct trophic levels and dietary sources within the ecosystem. Isotopic composition effectively distinguished individuals from different marine regions, whereas FA composition discriminated among forms within the same marine region. Therefore, a combined approach using both isotopes and FAs enabled the accurate discrimination of S. oualaniensis from various marine regions and forms. This study utilized samples of S. oualaniensis collected from the SCS and the IO. While these two regions possess a certain level of representativeness, they do not fully encapsulate the entire distribution range of the species. To further investigate the morphological variations and source diversity of S. oualaniensis, future research efforts could expand sample collection to encompass a broader geographical scope, including other oceanic regions and diverse ecological environments. Such an approach is anticipated to significantly enhance the generality and precision of research findings.
Data availability statement
The data analyzed in this study is subject to the following licenses/restrictions: The original contributions presented in the study are included in the article/supplementary material. Further inquiries can be directed to the corresponding authors. Requests to access these datasets should be directed to Kai Zhu emh1a2FpbGRAMTI2LmNvbQ==.
Author contributions
KZ: Writing – original draft. KX: Writing – review & editing. WZ: Writing – review & editing.
Funding
The author(s) declare financial support was received for the research, authorship, and/or publication of this article. This study was financially supported by the Open Fund for Key Laboratory of Sustainable Exploitation of Oceanic Fisheries Resources in Zhejiang Marine Fisheries Research Institute (No. 2020 KF002) and 2023-2024 routine monitoring project for distant-water fishery resources (No. 2024HZ003).
Acknowledgments
We thank the staff members of the Scientific Observing and Experimental Station of Fishery Resources for Key Fishing Grounds, Ministry of Agriculture, Marine Fisheries Research Institute of Zhejiang for providing assistances at laboratory. We are also grateful to all the reviewers for their valuable comments and advices.
Conflict of interest
The authors declare that the research was conducted in the absence of any commercial or financial relationships that could be construed as a potential conflict of interest.
Publisher’s note
All claims expressed in this article are solely those of the authors and do not necessarily represent those of their affiliated organizations, or those of the publisher, the editors and the reviewers. Any product that may be evaluated in this article, or claim that may be made by its manufacturer, is not guaranteed or endorsed by the publisher.
Abbreviations
IO, Indian Ocean; SCS, South China Sea; FA, fatty acid; SFA, saturated FA; MUFA, monounsaturated FA; PUFA, polyunsaturated FA; MF, medium form; DF, dwarf form; GF, giant form; SDA, stepwise discriminant analysis.
References
Chaguri M. P., Maulvault A. L., Costa S., Gonçalves A., Nunes M. L., Carvalho M. L., et al. (2017). Chemometrics tools to distinguish wild and farmed meagre (Argyrosomus regius). J. Food. Process. Pres. 41, e13312. doi: 10.1111/jfpp.2017.41.issue-6
Chembian A. J., Mathew S. (2014). Population structure of the purpleback squid Sthenoteuthis oualaniensis (Lesson,1830) along the south-west coast of India. Indian. J. Fish. 61, 20–28.
Chen X. J., Liu B. L., Tian S. Q., Qian W. G., Zhao X. H. (2007). Fishery biology of purpleback squid, Sthenoteuthis oualaniensis, in the northwest Indian Ocean. Fish. Res. 83, 98–104. doi: 10.1016/j.fishres.2006.09.005
Chesalin M. V., Zuyev G. V. (2002). Pelagic cephalopods of the Arabian Sea with an emphasis on Sthenoteuthis oualaniensis. B. Mar. Sci. 71, 209–221. doi: 10.1016/S0025–3227(02)00178–0
Clarke M. R. (1965). Larger light organs on the dorsal surface of the squids Ommastrephes pteropus, ‘Symplectoteuthis oualaniensis’ and ‘Dosidicus gigas’. J. Mollus. Stud. 36, 319–321. doi: 10.1093/oxfordjournals.mollus.a064961
Cui Y. (2012). Study on the carbon flow within the estuarine ecosystem in China based on stable isotopes and fatty acid composition. East China Normal University, China.
Doi H., Matsumasa M., Toya T., Toya T., Satoh N., Mizota C., et al. (2005). Spatial shifts in food sources from acrozoobenthos in an estuarine ecosystem: carbon and nitrogen stable isotope analyses. Estuar. Coas.t Shelf. S. 64, 316–322. doi: 10.1016/j.ecss.2005.02.028
Dubois S., Jean-Louis B., Bertrand B., Lefebvre S. (2007). Isotope trophic-step fractionation of suspension-feeding species: Implications for food partitioning in coastal ecosystems. J. Exp. Mar. Biol. Ecol. 351, 121–128. doi: 10.1016/j.jembe.2007.06.020
Fang Z., Liu B. L., Li J. H., Su H., Chen X. J. (2014). Stock identification of neon flying squid (Ommastrephes bartramii) in the North Pacific Ocean on the basis of beak and statolith morphology. Sci. Mar. 78, 239–248. doi: 10.3989/scimar.03991.06A
Fernández-Álvarez F. Á., Sánchez P., Villanueva R. (2021). Morphological and molecular assessments of bobtail squids (Cephalopoda: Sepiolidae) reveal a hidden history of biodiversity. Front. Mar. Sci. 7. doi: 10.3389/fmars.2020.632261
Fu M. W., Cai Y. P., Liu J. H., Lü F., Li Z. G., Ding Y. T., et al. (2020). Analysis of sour substances in the muscle of Ryukyu Squid (Symplectoteuthis oualaniensis). Food. Sci. 41, 185–192. doi: 10.7506/spkx1002–6630-20190828–300
Gong Y., Li Y. K., Chen X. J., Chen L. (2018). Potential use of stable isotope and fatty acid analyses for traceability of geographic origins of jumbo squid (Dosidicus gigas). Rapid. Commun. Mass. Spectrom. 32, 583–589. doi: 10.1002/rcm.8071
Gong Y. Y., Zhan F. P., Yang Y. T., Zhang P., Kong X. L., Jiang Y. E., et al. (2016). Feeding habits of Symplectoteuthis oualaniensis in the South China Sea. S. China. Fish. Sci. 12, 80–87. doi: 10.3969/i.issn.2095–0780.2016.04.010
Hasegawa N., Sawaguchi S., Tokuda M., Unuma T. (2014). Fatty acid composition in sea cucumber Apostichopus japonicus fed with microbially degraded dietary sources. Aquac. Res. 45, 2021–2031. doi: 10.1111/are.2014.45.issue-12
Jeena N. S., Sajikumar K. K., Rahuman S., Ragesh N., Koya K. P. S., Chinnadurai S., et al. (2023). Insights into the divergent evolution of the oceanic squid Sthenoteuthis oualaniensis (Cephalopoda: Ommastrephidae) from the Indian Ocean. Integr. Zool. 18, 924–948. doi: 10.1111/1749-4877.12705
Jereb P., Roper C. (2010). Cephalopods of the world: an annotated and illustrated catalogue of cephalopod species known to date (Rome: Food and Agriculture Organization of the United Nations), 315–318.
Jiang Y. E., Chen Z. Z., lin Z. J., Qiu Y. S., Zhang P., Fang Z. Q. (2019). Comparison of fishery biology between medium-form and dwarf-form of Sthenoeuthis oualaniensis in South China Sea. J. Fish. China. 43, 454–466. doi: 10.11964/jfc.20171211089
Kasai T. (2003). Lipid contents and fatty acid composition of total lipid of sea cucumber Stichopus japonicus and Konowata (salted sea cucumber entrails). Food. Sci. Technol. Res. 9, 45–48. doi: 10.3136/fstr.9.45
Kharlamenko V. I., Kiyashko S. I., Imbs A. B., Vyshkvartzev D. I. (2001). Identification of food sources of invertebrates from the seagrass Zostera marina community using carbon and sulfur stable isotope ratio and fatty acid analyses. Mar. Ecol-Prog. Ser. 220, 103–117. doi: 10.3354/meps220103
Kim H., Kumar K. S., Shin K. H. (2015). Applicability of stable C and N isotope analysis in inferring the geographical origin and authentication of commercial fish (Mackerel, Yellow Croaker and Pollock). Food. Chem. 172, 523–527. doi: 10.1016/j.foodchem.2014.09.058
Li M., Zhang P., Zhang J., Zhang K., Chen Z. Z. (2019). Genetic differentiation of the purpleback flying squid Sthenoteuthis oualaniensis in the south China Sea: population or species divergence. J. Fish. Sci. China. 26, 133. doi: 10.3724/SP.J.1118.2019.18193
Lin L., Li C. H., Chen Z. Z., Xu S. N., Liu Y. (2015). Development and characterization of twenty-three microsatellite markers for the purpleback flying squid (Symplectoteuthis oualaniensis). Conserv. Genet. Resour. 7, 161–163. doi: 10.1007/s12686-014-0318-1
Liu B. L., Chen X. J., Wang X. H., Du F. Y., Fang Z., Xu L. L. (2018). Geographic, intraspecific and sexual variation in beak morphology of purpleback flying squid (Sthenoteuthis oualaniensis) throughout its distribution range. Mar. Freshwater. Res. 70, 417–425. doi: 10.5343/bms.2017.1173
Liu J. L., Chen X. J., Xu Q. H. (2008). Population genetic structure of Sthenoteuthis oualaniensis in the northwestern Indian Ocean by RAPD analysis. S. China. Fish. Sci. 4, 43–49. doi: 10.3969/j.issn.2095–0780.2008.02.007
Liu L. W., Zhou Y. D., Lu H. J., Chen X. J. (2017). Genetic structure of Sthenoteuthis oualaniensis population in the northwest Pacific Ocean. J. Fish. Sci. China. 41, 1355–1364. doi: 10.11964/jfc.20160910527
Lu H. J., Chen Z. Y., Liu K., Ou Y. Z., Zhao M. L., Sun T. (2022). Statolith microstructure estimates of the age, growth, and population structure of purpleback flying squid (Sthenoteuthis oualaniensis) in the waters of the xisha islands of the South China Sea. Fishes. 7, 234. doi: 10.3390/fishes7050234
Lü Z. M., Cui W. T., Liu L. Q., Li H. M., Wu C. W. (2013). Phylogenetic relationships among Octopodidae species in coastal waters of China inferred from two mitochondrial DNA gene sequences. Genet. Mol. Res. 12, 3755–3765. doi: 10.4238/2013.September.19.7
MacNeil M. A., Skomal G. B., Fisk A. T. (2005). Stable isotopes from multiple tissues reveal diet switching in sharks. Mar. Ecol-Prog. Ser. 302, 199–206. doi: 10.3354/meps302199
Malej A., Faganeli J., Pezdifi J. (1993). Stable isotope and biochemical fractionation in the marine pelagic food chain: the jellyfish Pelagia noctiluca and net zooplankton. Mar. Biol. 116, 565–570. doi: 10.1007/BF00355475
Nesis K. N. (1993). “Population structure of oceanic ommastrephids, with particular reference to sthenoteuthis oualaniensis: a review,” in Recent advances in f isheries biology. Eds. Okutani T., O’Dor R. K., Kubodera T. (Takai University Press, Tokyo), 375–383.
Ortea I., Gallardo J. M. (2015). Investigation of production method, geographical origin and species authentication in commercially relevant shrimps using stable isotope ratio and/or multi-element analyses combined with chemometrics: An exploratory analysis. Food. Chem. 170, 145–153. doi: 10.1016/j.foodchem.2014.08.049
Overman N. C., Parrish D. L. (2001). Stable isotope composition of walleye: 13N accumulation with age and area-specific differences in δ13C. Can. J. Fish. Aquat. Sci. 58, 1253–1260. doi: 10.1139/cjfas-58-6-1253
Parrish C. C., Abrajano T. A., Budge S. M., Helleur R. J., Hudson E. D., Pulchan K., et al. (2000). Lipids and phenolic biomarkers in marine ecosystems: analysis and applications. In The Handbook of Environmental Chemistry (Wangersky P., ed.), pp. 193–223. Berlin: Springer.
Peterson B. J., Fry B. (1987). Stable isotopes in ecosystem studies. Annu. Rev. Ecol. Evol. S. 18, 293–320. doi: 10.1146/annurev.es.18.110187.001453
Pitt K. A., Connolly R. M., Meziane T. (2009). Stable isotope and fatty acid tracers in energy and nutrient studies of jellyfish: a review. Hydrobiologia. 616, 119–132. doi: 10.1007/978-1-4020-9749-2
Raclot T., Groscolas R., Cherel Y. (1998). Fatty acid evidence for the importance of myctophid fishes in the diet of king penguins, Aptenodytes patagonicus. Mar. Biol. 132, 523–533. doi: 10.1007/s002270050418
Rajendran N., Suwa Y., Urushigawa Y. (1993). Distribution of phospholipid ester-linked fatty acid biomarkers for bacteria in the sediment of Ise Bay, Japan. Mar. Ecol-Prog. Ser. 42, 39–56. doi: 10.1016/0304-4203(93)90248-M
Rencher A. C. (2002). Methods of multivariate analysis. 2nd edition (New York: John Wiley & Sons, Inc). doi: 10.1002/SERIES1345
Shen S. H., Leptoukh G. G., Acker J. G., Yu Z. J., Kempler S. J. (2008). Seasonal variations of chlorophyll a concentrations in the Northern South China Sea. IEEE Geosci. Remote. S. 5, 315–319. doi: 10.1109/LGRS.2008.915932
Snyder R. (1998). Aspects of the biology of the giant form of Sthenoteuthis oualaniensis (Cephalopoda: Ommastrephidae) from the Arabian Sea. J. Mollus. Stud. 64, 21–34. doi: 10.1093/mollus/64.1.21
Spangenberg J. E. (2016). Bulk C, H, O, and fatty acid C stable isotope analyses for purity assessment of vegetable oils from the southern and northern hemispheres. Rapid. Commun. Mass. Spectrom. 30, 2447–2461. doi: 10.1002/rcm.7734
Staaf D. J., Ruiz-Cooley R. I., Elliger C., Lebaric Z., Campos B., Markaida U., et al. (2010). Ommastrephid squids Sthenoteuthis oualaniensis and Dosidicus gigas in the eastern Pacific show convergent biogeographic breaks but contrasting population structures. Mar. Ecol-Prog. Ser. 418, 165–178. doi: 10.3354/meps08829
Stübing D., Hagen W. (2003). Fatty acid biomarker ratios—suitable trophic indicators in Antarctic euphausiids? Polar. Biol. 26, 774–782. doi: 10.1007/s00300–003-0550–8
Suh Y. J., Shin K. H. (2013). Size-related and seasonal diet of the Manila clam (Ruditapes philippinarum), as determined using dual stable isotopes. Estuar. Coast. Shelf. S. 135, 94–105. doi: 10.1016/j.ecss.2013.06.029
Thomas F., Jamin E., Wietzerbin K., Guérin R., Lees M., Morvan E., et al. (2008). Determination of origin of Atlantic Salmon (Salmo salar): The use of multiprobe and multielement isotopic analyses in combination with fatty acid composition to assess wild or farmed origin. J. Agric. Food. Chem. 56, 989–997. doi: 10.1021/jf072370d
Wang X. H., Liu B. L., Qiu Y. S., Zhang P., Du F. Y., Chen X. J., et al. (2019). Regional and intraspecific variation in Sthenoteuthis oualaniensis (Cephalopoda: Ommastrephidae) morphology from the western central Pacific Ocean. B. Mar. Sci. 95, 1–12. doi: 10.5343/bms.2017.1173
Xie J. Y., Zhang L. Z., Wu W. X., Zhou B. H., Chen Q. J., Zhao C. X., et al. (2021). Feeding habit and trophic niche of purpleback flying squid (Sthenoteuthis oualaniensis) in the Nansha Islands area, South China Sea. J. Fish. Sci. China. 45, 1993–2002. doi: 10.11964/jfc.20201012452
Xu L., Liu P., Wang X. H., Damme K. V., Du F. Y. (2020). Phylogenetic relationships and cryptic species in the genus Sthenoteuthis (Cephalopoda: Ommastrephidae) in the South China Sea. Mol. Phylogenet. Evol. 149, 106846. doi: 10.1016/j.ympev.2020.106846
Yatsu A., Midorika W. A. S., Shimada T., Uozumi Y. J. (1997). Age and growth of the Neon flying squid, Ommastrephes bartramii, in the North Pacific Ocean. Fish. Res. 29, 257–270. doi: 10.1016/S0165-7836(96)00541-3
Yokoyama H., Tamaki A., Harada K., Shimoda K., Koyama K., Ishihi Y. (2005). Variability of diet-tissue isotopic fractionation in estuarine macrobenthos. Mar. Ecol-Prog. Ser. 296, 115–128. doi: 10.3354/meps302199
Zhang J., Qiu Y. S., Chen Z. Z., Zhang P., Zhang K., Fan J. T., et al. (2018). Advances in pelagic fishery resources survey and assessment in open South China Sea. S. China. Fish. Sci. 14, 118–127. doi: 10.12131/20180037
Zhang X., Liu Y., Li Y., Zhao X. (2017). Identification of the geographical origins of sea cucumber (Apostichopus japonicus) in northern China by using stable isotope ratios and fatty acid profiles. Food. Chem. 218, 269–276. doi: 10.1016/j.foodchem.2016.08.083
Zhou J. G., Chen X. J., Liu B. L. (2008). Notes on the present status of exploitation and potential of cephalopod resources in the world. Mar. Fisheries. 30, 268–275. doi: 10.1136/bmj.1.5070.579-c
Zhu K., Wang X. H., Zhang P., Du F. Y. (2016). A study on morphological variations and discrimination of medium and dwarf forms of purple flying squid. Sthenoteuthis oualaniensis South. South China Sea. J. Trop. Oceanography 35, 82–88. doi: 10.11978/2016011
Zhu G. P., Zhang H. T., Song Q., Yang Y., Wang S. Q., Yang Q. Y. (2018). Inferring trophic variation for Antarctic krill (Euphausia superba) in the Antarctic Peninsula from the austral fall to early winter using stable isotope analysis. Acta Oceanol. Sin. 37, 90–95. doi: 10.1007/s13131-018-1176-6
Keywords: Sthenoteuthis oualaniensis, stable isotopes, fatty acid, morphological discrimination, South China Sea, Indian Ocean
Citation: Zhu K, Xu K and Zhu W (2024) Discrimination of different forms and oceanic regions of purpleback flying squid (Sthenoteuthis oualaniensis) based on stable isotopes and fatty acid composition. Front. Mar. Sci. 11:1415976. doi: 10.3389/fmars.2024.1415976
Received: 11 April 2024; Accepted: 17 June 2024;
Published: 08 July 2024.
Edited by:
Fernando Ángel Fernández-Álvarez, Institute of Marine Sciences, Spanish National Research Council (CSIC), SpainReviewed by:
Wei Yu, Shanghai Ocean University, ChinaJiajun Li, Chinese Academy of Fishery Sciences (CAFS), China
Copyright © 2024 Zhu, Xu and Zhu. This is an open-access article distributed under the terms of the Creative Commons Attribution License (CC BY). The use, distribution or reproduction in other forums is permitted, provided the original author(s) and the copyright owner(s) are credited and that the original publication in this journal is cited, in accordance with accepted academic practice. No use, distribution or reproduction is permitted which does not comply with these terms.
*Correspondence: Wenbin Zhu, emh1d2VuYmluMjAyMUAxMjYuY29t