 Wenshu Lin
 Yun Qiu
 Xutao Ni
 Xinyu Lin1
- 1Fujian Provincial Key Laboratory of Marine Physical and Geological Processes, Third Institute of Oceanography, Ministry of Natural Resources, Xiamen, China
- 2Laboratory for Regional Oceanography and Numerical Modeling, Qingdao Marine Science and Technology Center, Qingdao, China
- 3Southern Marine Science and Engineering Guangdong Laboratory (Zhuhai), Zhuhai, China
Knowledge of spring warm pool in the Bay of Bengal (BoBWP) is key for further understanding the climate variability in this region and beyond, but little is known about the BoBWP climatological state and the related mechanisms. In this study, we investigate the spatial structure and evolution of the BoBWP using daily Optimum Interpolation SST data from 1982-2022 in combination with multi-source data. Our analysis shows that the BoBWP is located in the central bay (6°-13°N) with a thickness around 20 m ~ 40 m. Composite analysis indicates that the BoBWP emerges in early April, peaks in early May and dissipates in early June. During the developing period, the net heat flux dominates the formation of spring warm pool through significant air-sea coupling processes, and induces the warming rate of 0.27°C/10d in the mixed layer, which is far larger than the contribution of oceanic dynamical processes (0.01°C/10d). During the decaying period, the net heat flux also plays a dominant role, with a cooling rate of -0.21°C/10d, meanwhile ocean dynamical processes contribute to the cooling of the warm pool with a rate of -0.01°C/10d. Additionally, the SST and the area of the BoBWP are significantly correlated with ENSO (r=0.66 and 0.73, p=0.05). During El Niño decaying year, the BoBWP primarily expands in a southward direction, with a 75% increase in area. Conversely, during La Niña decaying year, the BoBWP almost disappears, with a 52% decrease.
1 Introduction
Warm pools, characterized by sea surface temperatures (SST) exceeding 28, are present extensively in the tropical oceans, such as the well-known Western Pacific Warm Pool and the Eastern Indian Ocean Warm Pool (Wyrtki, 1989). The spring warm pool in the Bay of Bengal (BoBWP) is an important component of the East Indian Ocean Warm Pool. It can trigger the summer monsoon vortex, thereby exerting a vital influence on the onset date and intensity of the South Asian monsoon (Wu et al., 2010; Li et al., 2015). Furthermore, the BoBWP plays a crucial role in modulating tropical cyclone genesis and dissipation processes through air-sea interaction processes (Lin et al., 2012; Pathirana et al., 2022). Therefore, the study of the BoBWP can help to improve our understanding of the dynamics for the evolution processes of the South Asian monsoon and tropical cyclones, and thereby enhance their forecasting capabilities.
Influenced by a large amount of freshwater input from monsoonal rainfall (Prasad, 1997) and river discharges (Subramanian, 1993), the Bay of Bengal (BoB) has the lowest sea surface salinity (SSS) over the Indian Ocean, particularly in the northern BoB (Chaitanya et al., 2015). Near surface stratification associated with the low SSS maintains shallow mixed layers in the BoB (De Boyer Montégut et al., 2007). In the northern BoB (>15°N), mixed layer depth (MLD) remained shallow (~20 m) for most of the year without any seasonality; in contrast, the southern region (<15°N) shows a strong semi-annual variability with deep MLD during summer and winter and shallow MLD during spring and fall (Narvekar and Kumar, 2006). As shallow MLD responds quickly to the atmospheric heating (Shenoi et al., 2002), it provides a favorable condition for the development of the BoBWP. The highest SST was observed in the central BoB during spring, accompanied the shallowest MLD there (Uddin et al., 2014).
Till now, several studies have been conducted to explore the spatial structure and evolution characteristics of the BoBWP (Vinayachandran and Shetye, 1991) noticed the seasonal SST peak in the BoB during spring for the first time, and named it as the spring warm pool. The analysis of SST time series observed from buoys by Vimala et al. (2014) showed a remarkable diurnal oscillation and intraseasonal oscillation of SST are present in the developing and decaying stages of the BoBWP, respectively. Pathirana and Priyadarshani (2020) examined the evolution characteristics of BoBWP based on OISST daily SST. They showed that the BoBWP develops in April and occupies most of the bay in May while decaying in early June, and they speculated that its formation is induced by positive net heat flux and weak wind during spring inter-monsoon. Whereas, the relative contributions of these factors to the BoBWP weren’t quantified in their study. Using observations from moored buoys during spring of 1998-2020, Sengupta et al. (2002) found that the mixed layer warming of the north Indian Ocean warm pool is due to net surface heat flux minus penetrative solar radiation. Liu et al. (2013) studied the evolution of BoBWP during 2008, and concluded that both of the development and decay of BoBWP are primarily caused by the heat flux term. In addition, the entrainment term plays an important cooling role to offset the heating from net surface heat flux in the developing stage, and the horizontal advection term contributes to the decaying of the BoBWP. However, the years selected in Sengupta et al. (2002) and Liu et al. (2013) (i.e., 1998-2000 and 2008) are La Niña years (Yuan and Yan, 2013) To what extent their results represent the common situation is still unclear.
Thangaprakash et al. (2016) explored extensively seasonal evolution of SST in the BoB, and revealed that although net surface heat flux is the primary factor determining seasonal variation of mixed layer heat balance and SST in the BoB, ocean dynamics also play a crucial role. During the spring period, the mixed layer temperature balance is predominantly controlled by net surface heat flux and penetrative shortwave radiation below the shallow mixed layer, and accounts for 72%-85% of mixed layer variability (Thangaprakash et al., 2016). Parampil et al. (2010) suggested that the intraseasonal variability of SST is mainly forced by heat flux during summer, however, the horizontal advection is important for the mixed layer heat budget in winter and spring due to much larger magnitude of SST gradients compared to that in summer.
Summarizing the studies mentioned above, we can see that some researchers have limited their analysis of evolution characteristics of the BoBWP (e.g., Vinayachandran and Shetye, 1991; Vimala et al., 2014; Pathirana and Priyadarshani, 2020). Some scholars have conducted analyses on the forcing mechanisms for the formation and decay of the BoBWP during the selected individual years (e.g., Sengupta et al., 2002; Liu et al., 2013). Other studies explored the dynamics on seasonal evolution of SST in the BoB using some individual observations from buoys and Argo floats (e.g., Parampil et al., 2010; Thangaprakash et al., 2016). However, these case studies do not entirely capture the dynamics on the evolution of the BoBWP in the climatological view. In addition, as affected by El Niño-Southern Oscillation (ENSO) and Indian Ocean Dipole (IOD), the ocean-atmosphere system shows remarkable interannual variabilities in the BoB (Li et al., 2021; Feng et al., 2022), which in turn may induce strong interannual variabilities of the BoBWP. The interannual changes of the BoBWP and its relationship with ENSO and IOD are also unknown. Therefore, in this paper, we use multi-year observations together with reanalysis data to explore the three-dimensional structure of the BoBWP, its seasonal evolution characteristics and mechanisms. Its interannual variabilities associated with ENSO and IOD is then examined. Considering the shallow MLD responds quickly to the atmospheric heating (Shenoi et al., 2002), it tends to facilitate the development of the BoBWP. Thus, the contribution of MLD to the BoBWP is also addressed in the present study.
The rest of this paper is organized as follows: section 2 introduces the data and methods, section 3 analyzes spatial structure and evolution characteristics of the BoBWP and the related mechanisms, and section 4 presents the discussion and conclusion.
2 Materials and methods
2.1 Materials
The temperature and salinity datasets are provided by the Asia-Pacific Data-Research Center (APDRC), to characterize the three-dimensional structure of the BoBWP and its evolution. They include daily Optimum Interpolation SST(OISST) (Reynolds et al., 2007), with a spatial resolution of 0.25°×0.25° and a time span of January 1982 to December 2022; the climatological monthly World Ocean Atlas 2018 (WOA18) temperature and salinity with a spatial resolution of 0.25°×0.25°; and daily temperature and salinity time series observations from three Research Moored Array for African-Asian-Australian Monsoon Analysis and Prediction (RAMA) buoys along 90°E at 8°N, 12°N and 15°N during the period of May 2008 and December 2020 (Mcphaden et al., 2009). SODA version 3.15.2 reanalysis data is also used (Carton et al., 2018), including temperature, salinity, currents, and sea surface heat flux data with a horizontal resolution of 0.5° × 0.5°. And SODA data has a time span from January 1982 to December 2022, and is used to calculate the mixed-layer heat budget.
In addition, daily Cross Calibrated Multi-Platform (CCMP) surface 10 m wind, Ocean Surface Current Analyses Real-time (OSCAR) surface current and the fifth generation ECMWF (ERA5) surface heat flux reanalysis data are used to quantify the contribution of ocean dynamical processes and sea surface heating on the evolution of the BoBWP. The CCMP wind field dataset is provided by Physical Oceanography Distributed Active Archive Center (PO.DAAC) (Ardanuy et al., 2008), with a spatial resolution of 0.25° × 0.25° and a time span from January 2003 to December 2017. The OSCAR currents are from the National Aeronautics and Space Administration (NASA) (Bonjean and Lagerloef, 2002), with a horizontal resolution of 1/3° × 1/3° and a time span of January 1993 to December 2018. ERA5 sea surface heat flux data provided by the European Center for Medium-Range Weather Forecasts (ECMWF) (Olauson, 2018), with a spatial resolution of 0.25° × 0.25° and a time span of January 1982 to December 2022. Furthermore, Dipole Mode Index (DMI) and Niño 3.4 SST Index provided by the NOAA Physical Sciences Laboratory (PSL) are used to calculate the interannual variability of the BoBWP. All datasets mentioned above were visualized in MATLAB R2023b.
2.2 Methods
2.2.1 Calculation of the mixed layer depth
The MLD is defined as the depth where the potential density . Here is the potential density of the 10m layer, and is the increase in potential density caused by a 0.2°C decrease in temperature relative to the 10m layer (De Boyer Montégut et al., 2007).
2.2.2 Mixed layer heat budget analysis
The mixed layer heat balance equation can be expressed as (Nigam et al., 2018):
Equation 1 shows, from left to right, the temperature tendency term, the heat flux term, the horizontal advection term, the vertical entertainment term, and the residual term. Where represents the mixed layer temperature, represents the sea surface net heat flux, represents the shortwave radiation penetrating the mixed layer, and is the density of seawater taken as 1024 kg/m3, and is the specific heat capacity of seawater, which is 4000 , is the depth of the mixed layer, is the horizontal velocity of the mixed layer, is the vertical entrainment velocity at the bottom of the mixed layer, and is the temperature difference from the top to the bottom of the mixed layer. is the residual term.
The shortwave radiation that penetrates the mixed layer is calculated as follows (Jouanno et al., 2011):
Where is the shortwave radiation, and a constant e-folding depth of 25 m ().
Vertical entertainment velocity is given by:
Where is the MLD trend term, and is the vertical velocity at the bottom of the mixed layer.
3 Results
3.1 Spatial structure and evolution characteristics of the BoBWP
3.1.1 Spatial structure
First, we comprehensively analyze the three-dimensional structure of the BoBWP by using satellite SST (Figure 1), WOA and SODA data (Figure 2). In March, Figure 1A shows that SST in the bay ranges from 27.75°C to 29.00°C, with an increasing trend toward south. The warm pool marked by SST higher than 29.75°C has not yet formed in the bay, but appears in some areas along the Sumatra coast. In April (Figure 1B), the whole study region warms, particularly in the southern bay where SST warms much faster than at the equator. Consequently, a warming center with SST higher than 29.75°C (i.e., the spring warm pool) is formed in the southern bay (6°-13°N). The BoBWP reaches its highest temperatures (~30°C) in May, and its location has a northward shift to 10°-15°N. As the summer monsoon onset in June (Mao and Wu, 2007), the warm pool collapses rapidly.
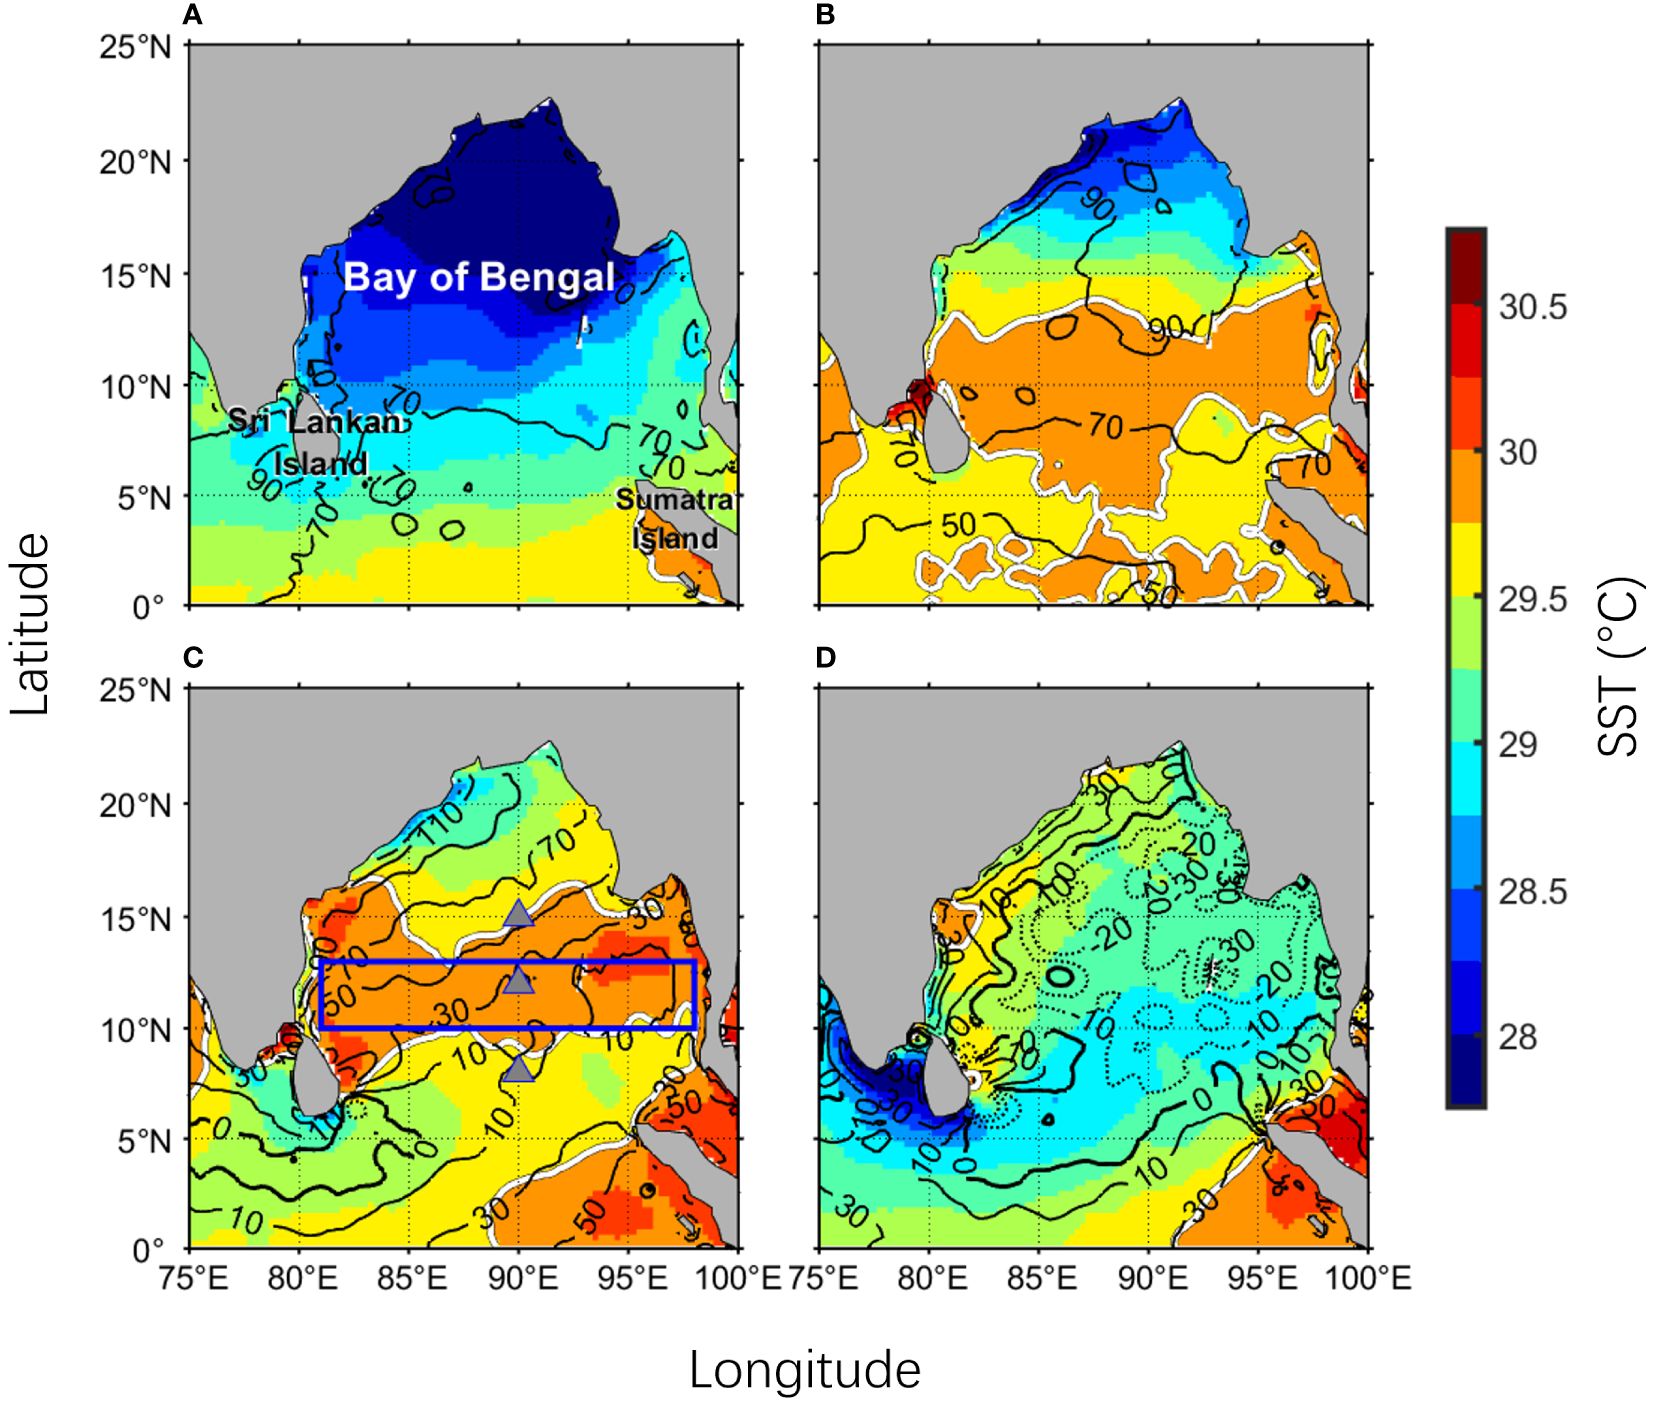
Figure 1 Distribution of monthly sea surface temperature (SST, shading, unit: ) and net heat flux (NHF, contours with solid curves denoting downwards, unit: W/m2) in the Bay of Bengal (BoB): (A) March, (B) April, (C) May, (D) June. The thick white curves (i.e., the 29.75°C contour) in the figure represent the BoBWP. In (C), the blue box represents the core area of the BoBWP (10°-13°N, 81°-98°E), and three gray solid triangles denote the three RAMA buoys deployed along 90°E, with latitude positions of 8°N, 12°N, and 15°N.
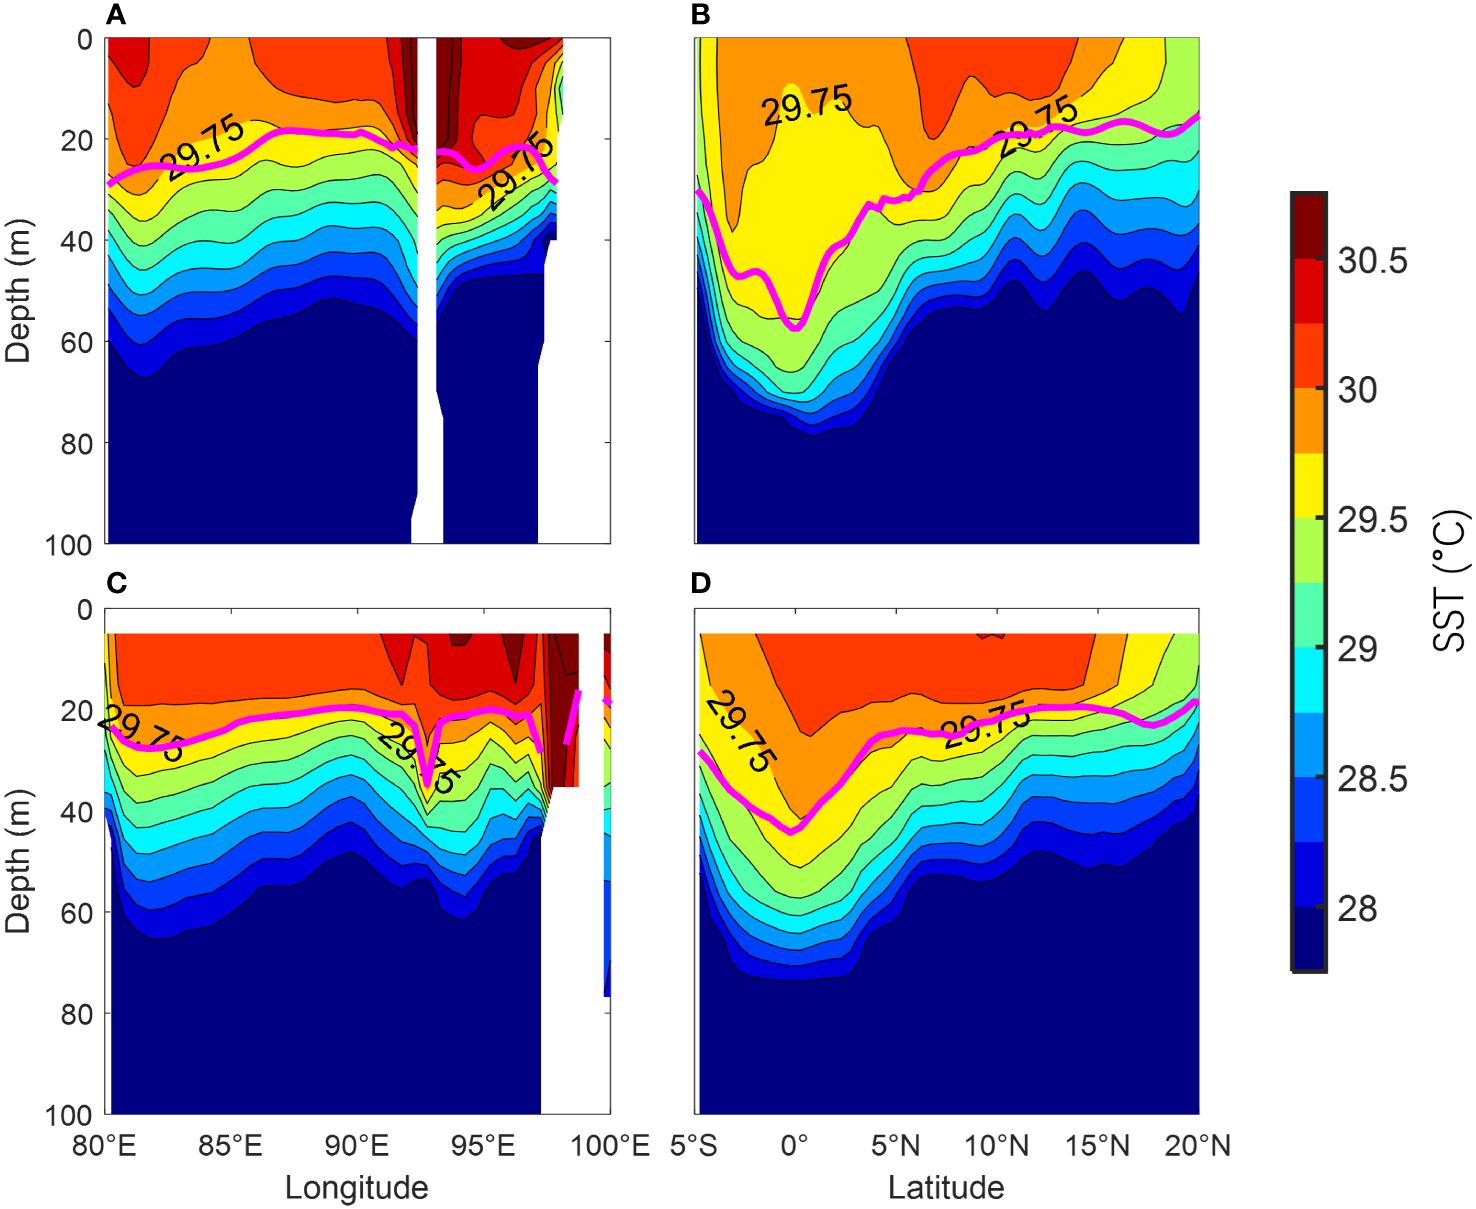
Figure 2 Vertical temperature structure of the BoBWP from WOA data in April and May: (A) 12°N section, (B) 90°E section. (C, D) Same as (A, B), respectively, but for SODA data averaged over the period of 2005-2017. The thick purple curves in the figure represent MLD.
In terms of surface heat fluxes, during the development phase in April and May, the net heat fluxes are positive throughout the ocean, implying an important contribution to the pool. The spatial distribution pattern shows that the strongest heating is located in the northern bay (north of 15°N) during these two months, with net heat fluxes of ∼90 W/m2 and 70-110 W/m2, respectively. In contrast, over most of the southern bay, the net heat flux is relatively small, at 70-90 W/m2 and 30-50 W/m2 in April and May, respectively. Therefore, the location of the BoBWP in the southern bay cannot be well explained by the net heat flux alone, and the driving mechanisms of its formation will be discussed in detail later. It is also worth mentioning that the aforementioned warm pool off the Sumatra coast, similar to the BoBWP, intensifies in April and reaches its peak in May but lasts until June. As it is outside the scope of this study, it will not be discussed in detail here.
The vertical structure of the BoBWP is explored by using the temperature data of WOA and SODA. From the WOA results (Figures 2A, B), the warm pool is mainly located within the mixed layer, with a thickness of about 30m. The distribution range of the warm pool along the longitude direction is consistent with that of satellite SST (Figures 1B, C, 2A), which completely covers cross the whole section at that latitude with a stable thickness of ~30 m (Figure 2A). However, in the latitudinal direction, the BoBWP has a larger range compared to the results of satellite SST mentioned above, which is connected to the equatorial warm water, extending from 15°N to the south of the equator, and its thickness increases from 20 m at 15°N to ~40 m at its southern edge. Although SODA temperature is somewhat higher than that of WOA (Figure 2), the vertical structure of the BoBWP exhibited by SODA is highly consistent with that of the WOA (Figures 2C, D). This good consistency illustrates the reliability of the SODA temperature. It should be noted that both WOA and SODA can’t clearly present the southern boundary of the BoBWP. The insufficient sample size of the WOA observations and the overestimation of temperature in the SODA reanalysis, are the possible reasons that make both of the two datasets unable to resolve the southern boundaries of the BoBWP as shown in the satellite SST data (Figures 1B, C).
3.1.2 Evolution characteristics
To characterize the evolution of the BoBWP, the distribution of SST at 5-d intervals averaged over 1982-2022 is shown in Figure 3. It can be seen that the warm pool (SST > 29.75°C) first appears along the Sumatra coast during March 30-April 3, and then rapidly extends northward. The warm pool is basically established in the southern Bay during April 14 - 18, and the SST and the range of the BoBWP reach their peak half a month later (April 29 - May 3). After half a month (May 14 - May 18), the warm pool begins to weaken and almost disappears by early June. From the 5-d evolution of SST, we can see that the BoBWP is connected with the equatorial warm water during April 14 and May 13.
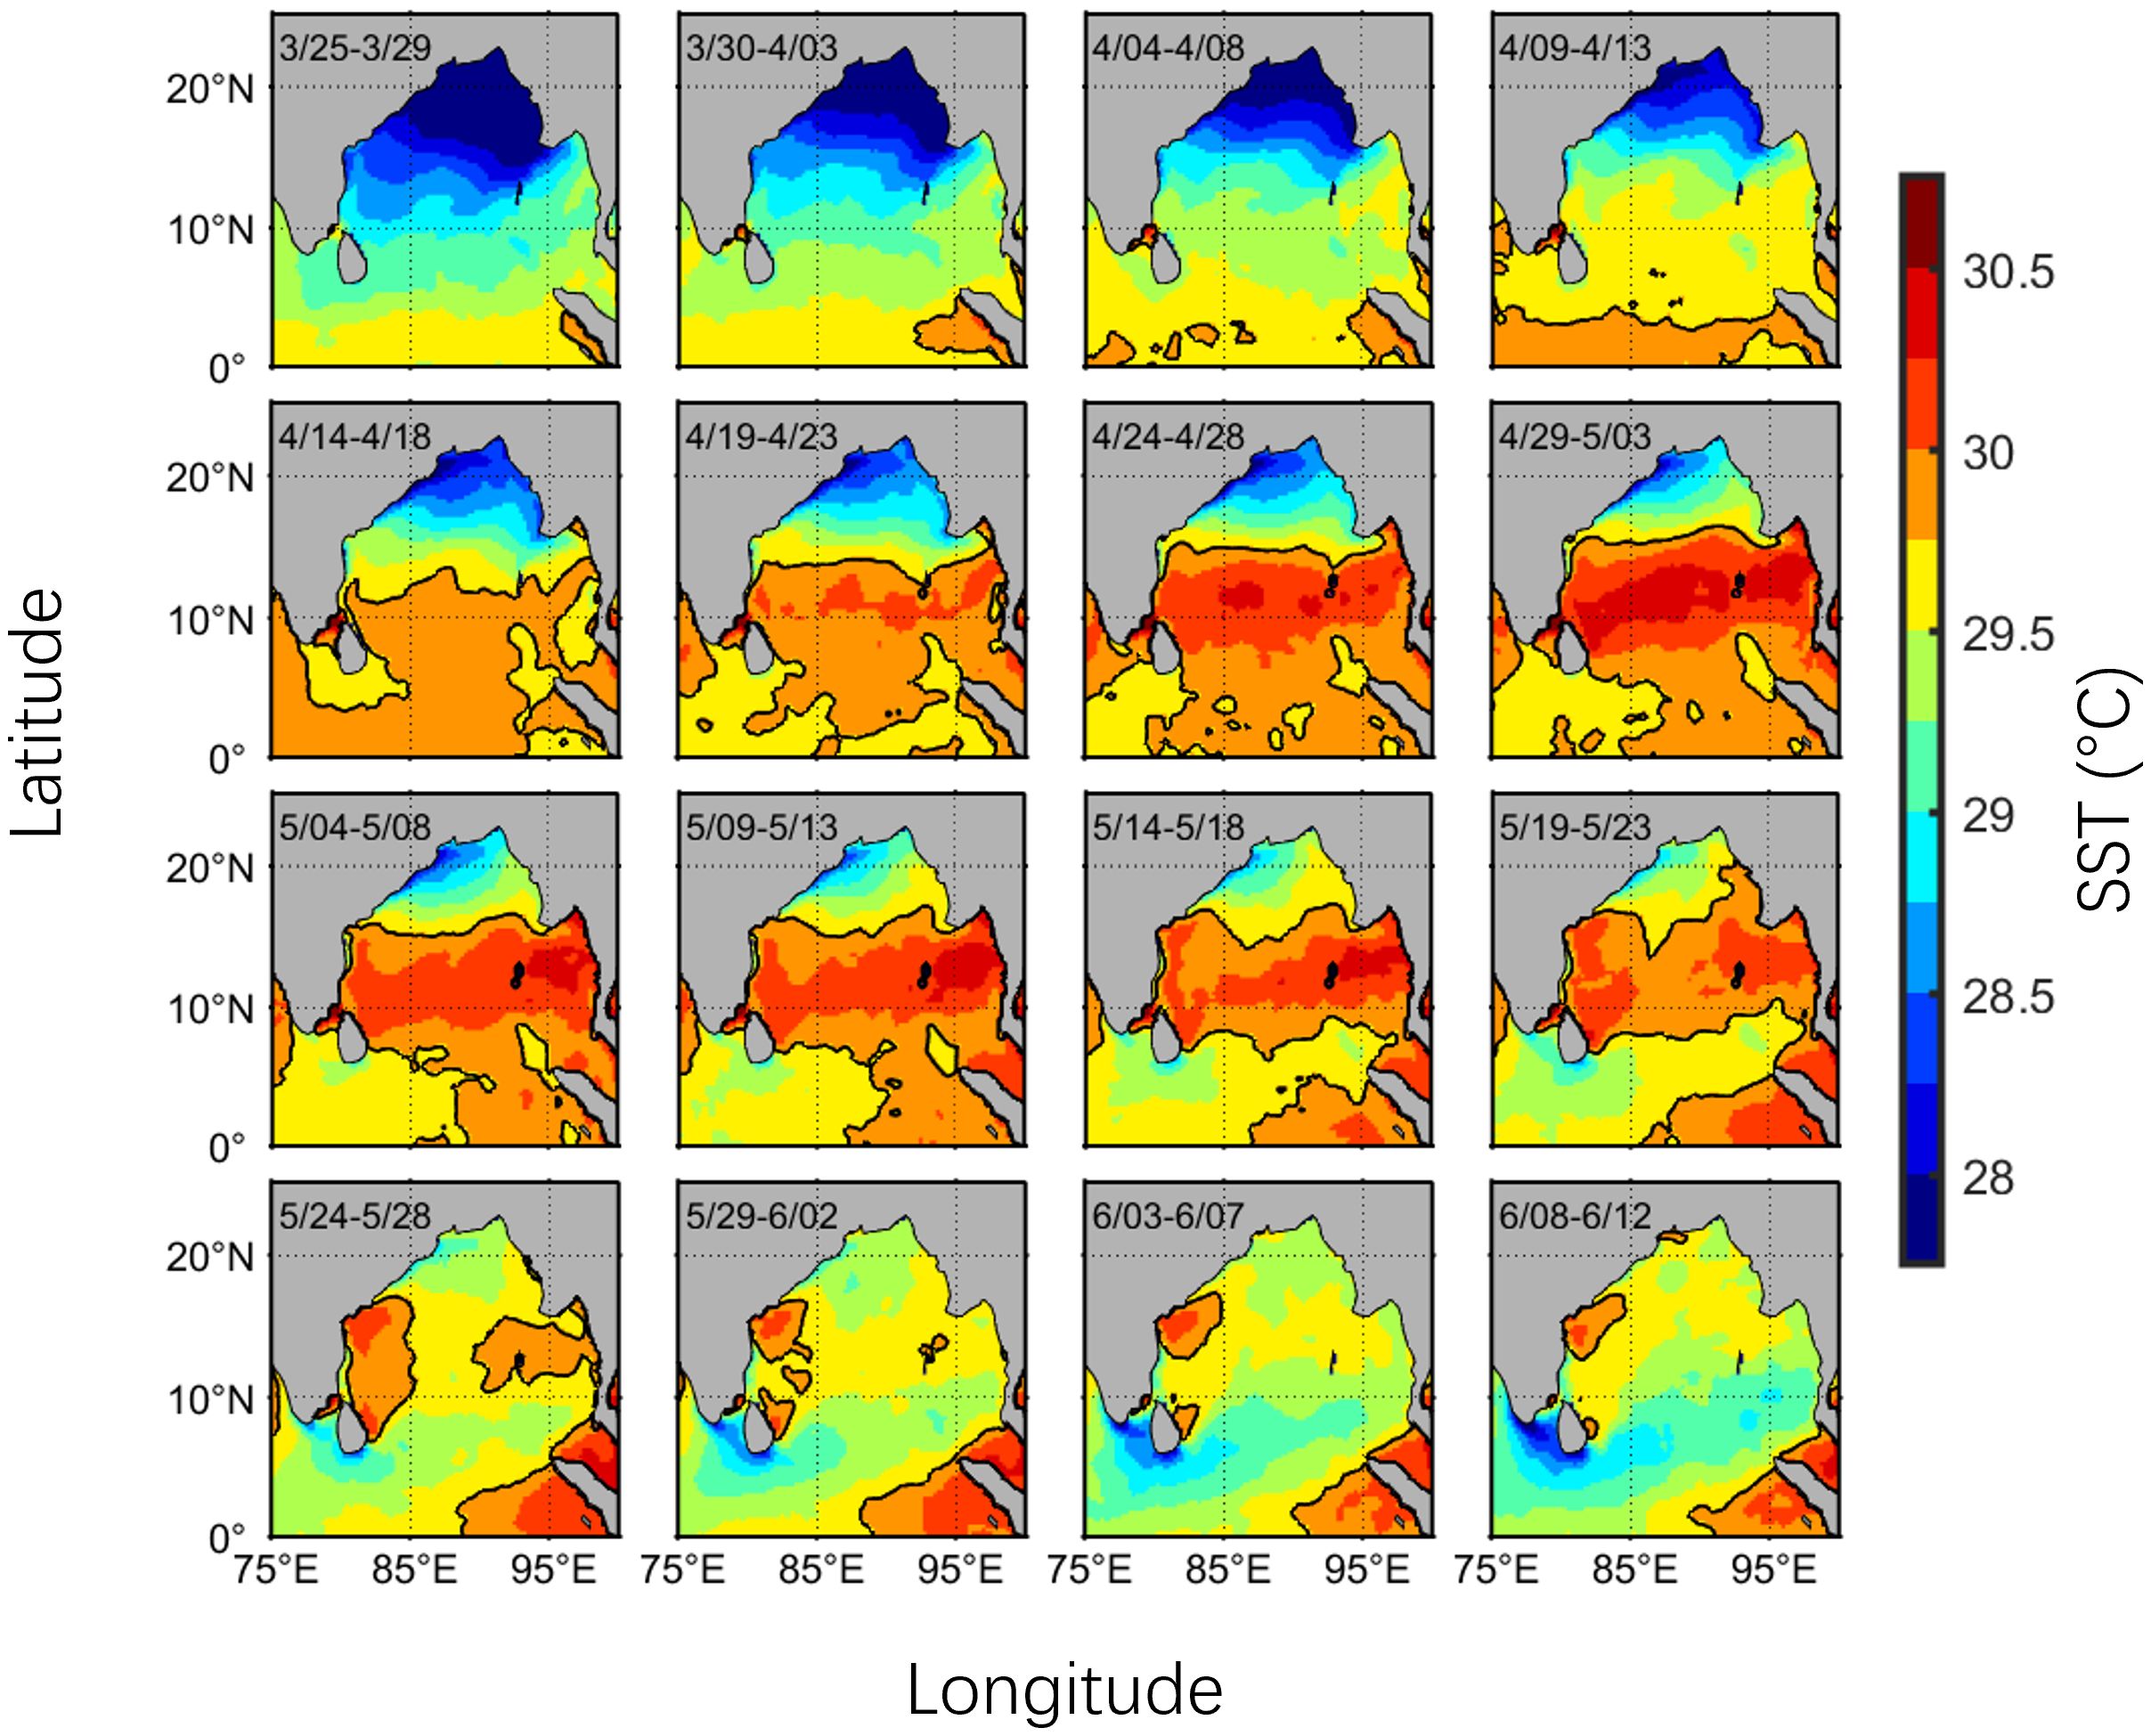
Figure 3 The composited SST represent every 5-day SST averaged for each year from March 25 to June 12 during the period of 1982-2022, to show the climatological evolution process of the BoBWP. Dark curves (i.e., the contour of 29.75°C) in the figure indicate the boundary of the BoBWP.
We further use the daily observations from the RAMA buoy to explore the evolution characteristics of the vertical structure of the BoBWP (Figure 4). We can see that the RAMA buoys not only show the development of the BoBWP beginning from the south and extending to the north (Figures 1, 3), but also show that its decay also starts from the south (Figures 4A–C). During the warm pool development period (i.e., before reaching its maximum temperature), the MLD is thin (∼20 m, Figures 4D–F) due to the influence of the near-surface low-salinity water (Figures 4A–C). Shenoi et al. (2002) pointed out that the weak winds in the bay are unable to overcome the strong near-surface stratification induced by a low-salinity surface layer, which leads to a shallow MLD. Consequently, the shallow mixed layer caused by the low-salinity water makes the temperature in the mixed layer warm rapidly under the sea surface heating, which may be an important mechanism of the formation of the BoBWP. In addition, during the decaying phase from mid to end of May, we also see that the vertical extent of the warm pool extends below the mixed layer at the 15°N RAMA buoy. Its thickness increases from about 20 m to about 40 m, followed by the presence of a thick barrier layer (Figure 4C). This existence of the salinity-induced barrier layer may contribute to maintaining the warm pool there during its decaying period. However, the climatological monthly distribution of barrier layer indicates that it is almost absent over the region of BoBWP during BoBWP’s evolution months (i.e., April and May, Figure not shown). Thus, the general impact of barrier layer on the BoBWP may be weak.
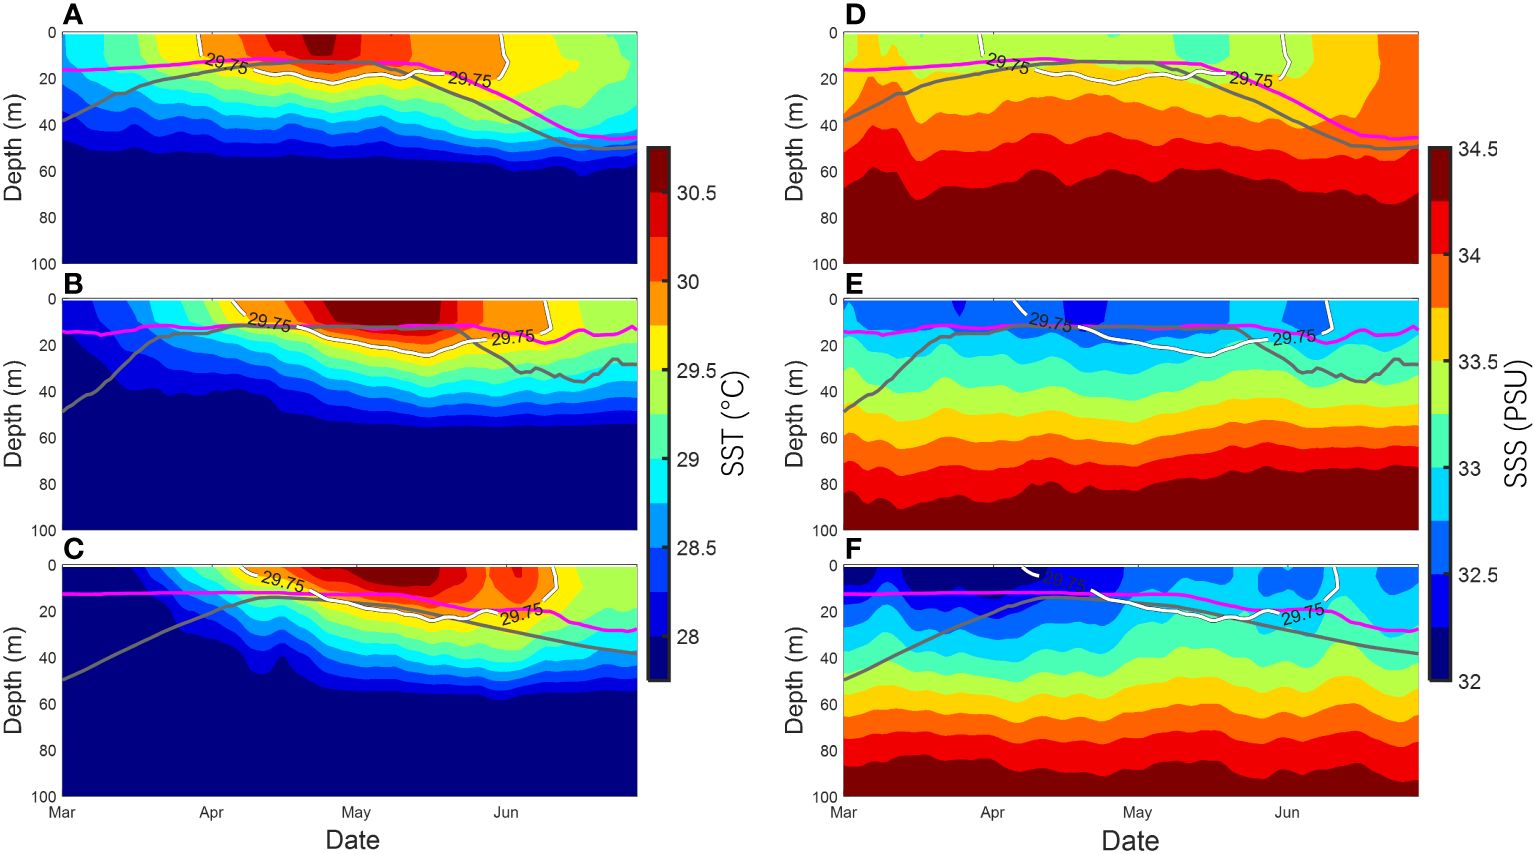
Figure 4 The evolution process of the BoBWP observed by the RAMA buoys deployed along 90°E (in ): (A) 8°N, (B) 12°N, and (C) 15°N. (D–F) are the same as in (A–C), respectively, but for salinity. The bold red curves in the figure represent MLD.
3.2 Mechanisms for the evolution of the BoBWP
3.2.1 Major oceanic and atmospheric factors related with the evolution of the BoBWP
Our analysis above shows that the surface heat flux and MLD play important roles in the development of the BoBWP. To further explore their relationship, the time series of net heat flux, SST, and MLD averaged over the core area of the warm pool are shown in Figure 5. Based on the SST time series, the evolution of the warm pool delineated into two phases: the development period (March 30 - May 3) and the decay period (May 4 - June 12).
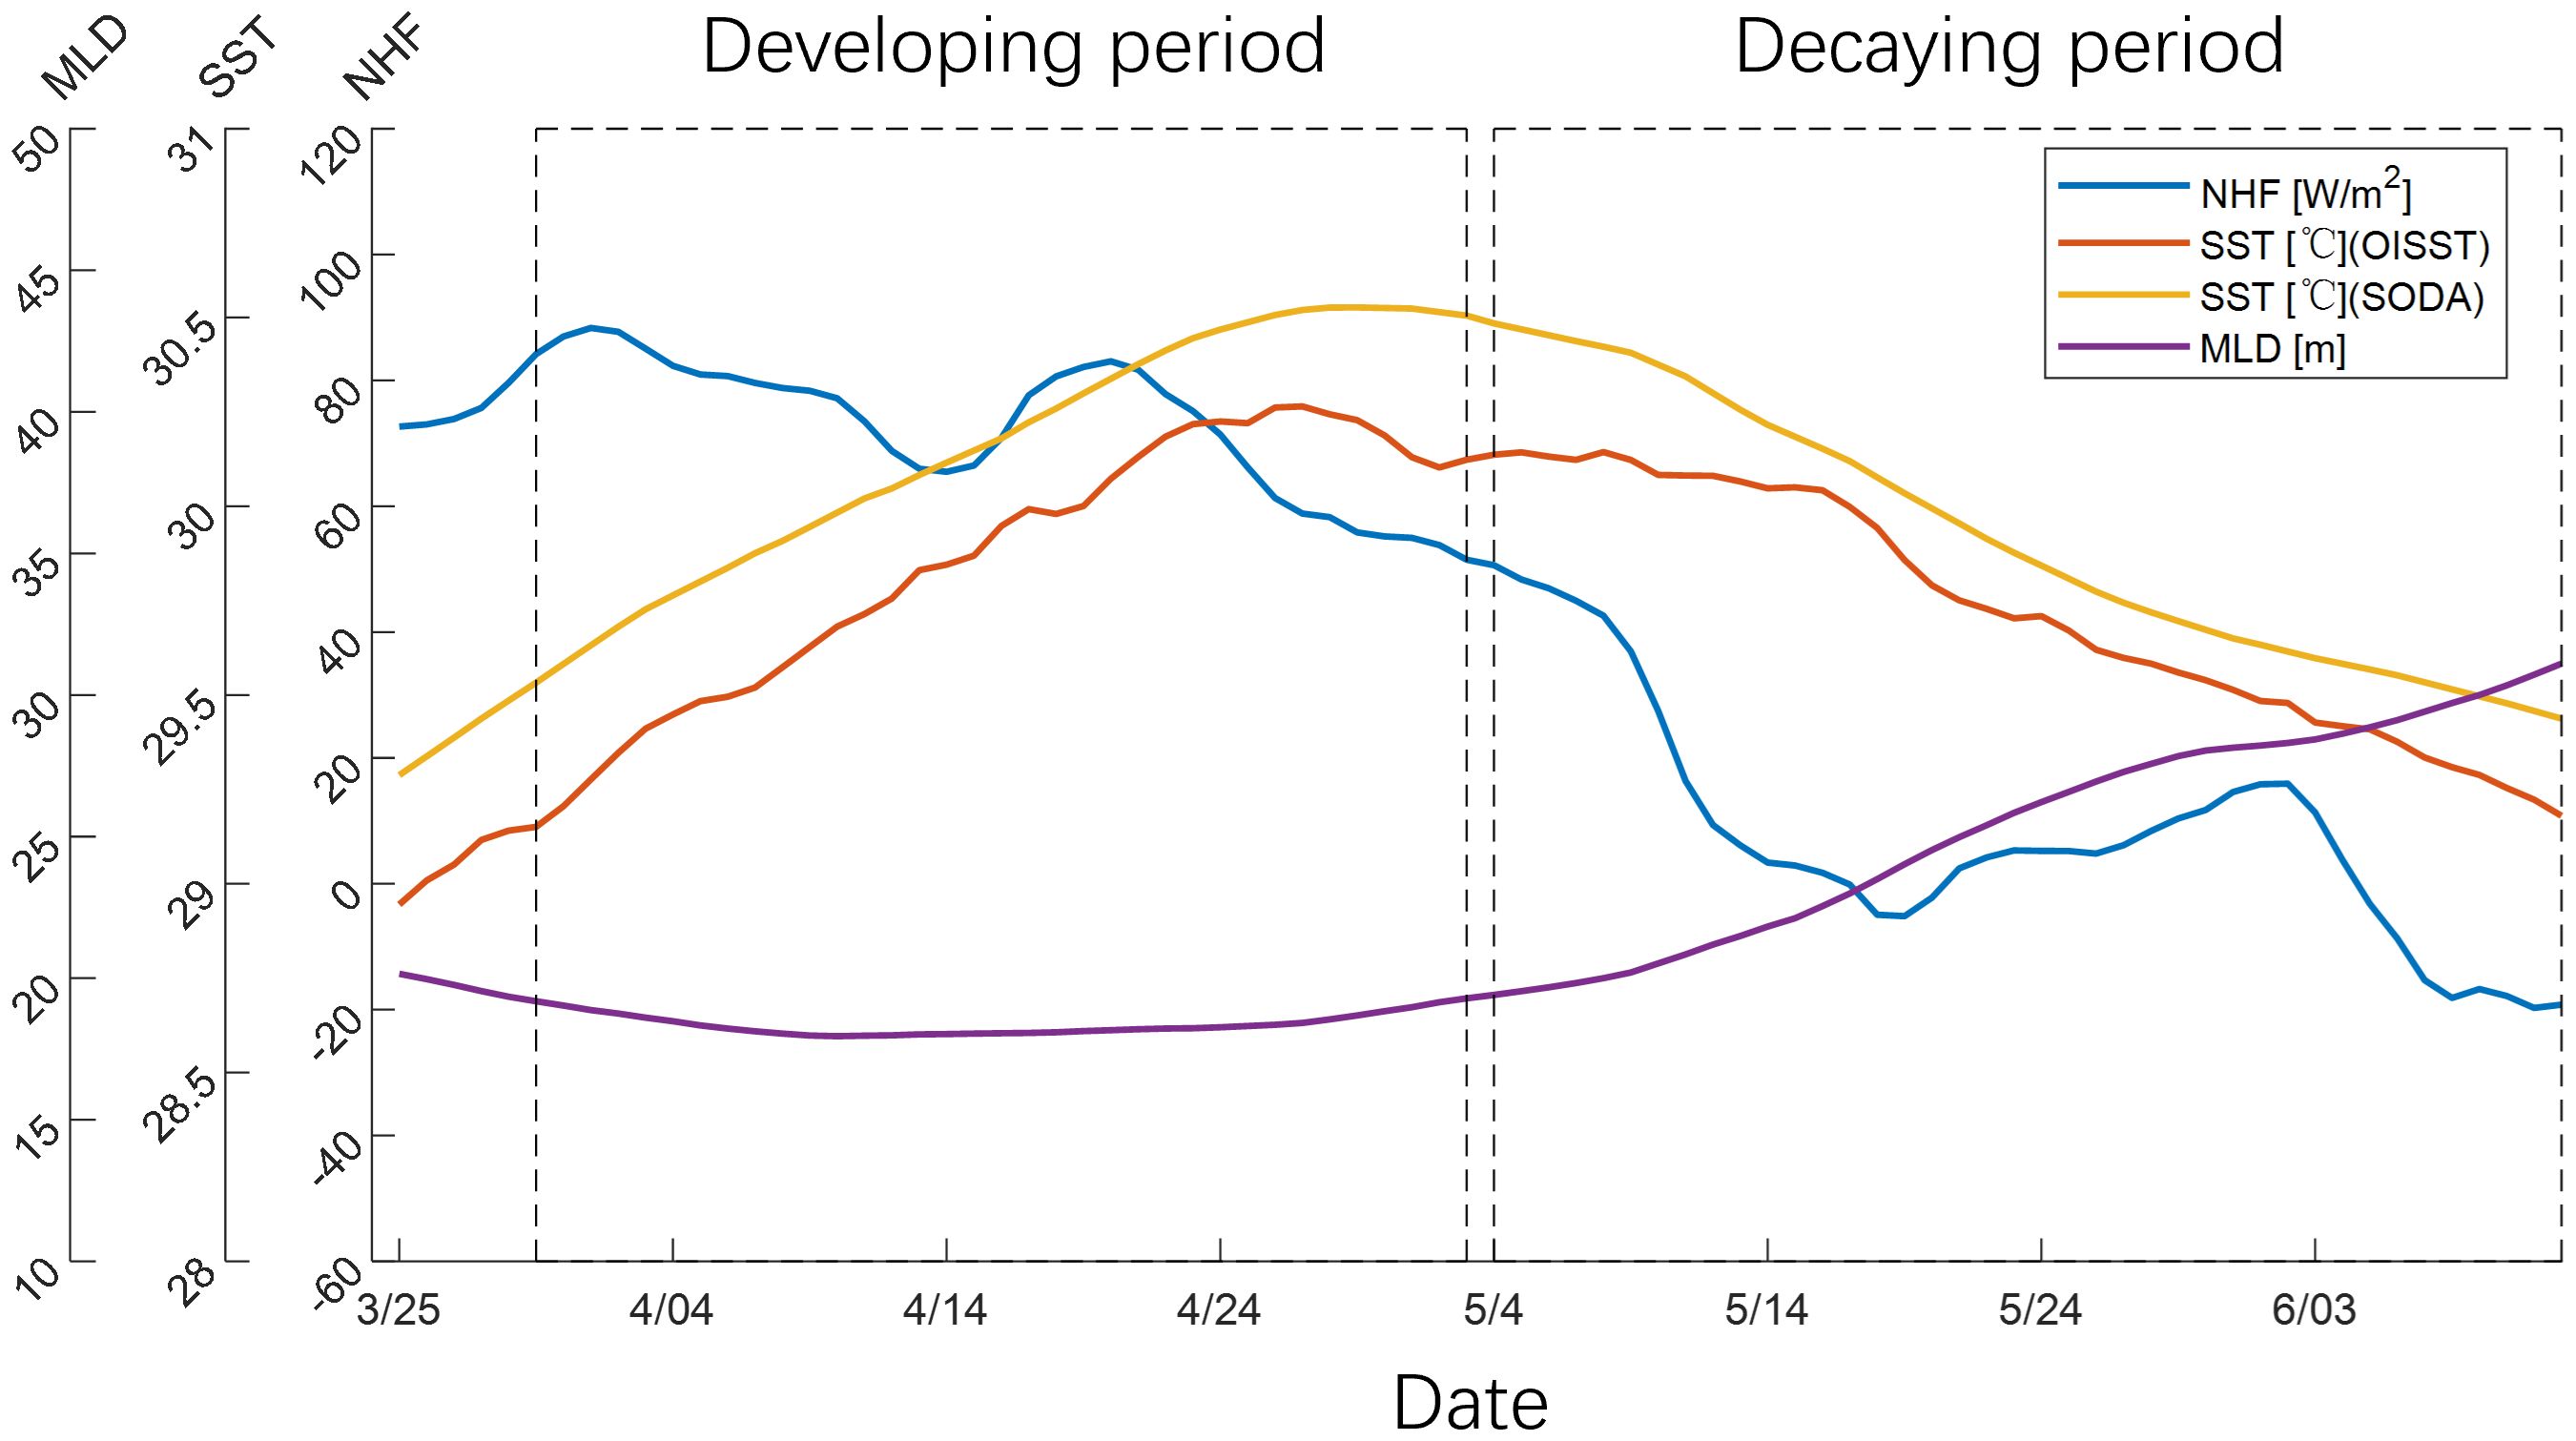
Figure 5 Evolution characteristics of net heat flux (NHF), SST and MLD in the core area of the BoBWP. The two dashed boxes in the figure represent the developing period and decaying period of the warm pool, respectively. MLD is calculated from SODA data. The core area of the warm pool is shown as blue box in Figure 1C.
We can see that during the developing period, there is a correlation between the gradually increasing SST, the shallowing MLD and the decreasing net heat flux, implying a significant sea-air coupling process between them. Under clear weather condition and weak surface winds (Figure 6A), the enhanced net shortwave radiation and weak latent heat flux release lead to a positive net heat flux at the sea surface, resulting in rising SST and strengthening atmospheric convection. Consequently, on the one hand, the strengthening atmospheric convection brings more precipitation, resulting in stronger near-surface stratification and a shallower mixed layer, making SST more sensitive to sea surface heating, which is a positive feedback process. On the other hand, the strengthening of deep atmospheric convection weakens the shortwave radiation by increasing cloudiness, resulting in a decrease in net heat flux, which is a negative feedback process. Obviously, these coupling processes between SST, MLD and net heat flux play a dominant role in the development of the BoBWP, which is consistent with the previous research (Shenoi et al., 2002). Figure 7A shows that the ratio of the daily net heat flux and the daily MLD during the developing period of the warm pool. Their ratio is positive over the entire study region. The larger values observed at the eastern boundary, throughout the upper region, and across most of the southern bay (south of 17°N) suggest a more pronounced warming of the mixed layer, which is induced by the net heat flux. This stronger warming for net heat flux over these regions, overlapped the relatively higher SST in the southern bay (Figures 1A, 3), leads to the formation of the warm pole (i.e., BoBWP) in the southern bay. To explore the roles of surface heat flux components in shaping the spatial range of the BoBWP, the ratios of shortwave radiation, latent heat flux, and longwave radiation to MLD are shown (Figures 7B–D), we can see that among these major heat components, the ratio of shortwave radiation to MLD has the largest magnitude, and its spatial pattern highly resemble that of net heat flux (Figure 7A). This underpins that the shortwave radiation, together with the MLD play the dominant role in regulating the spatial location of the BoBWP.
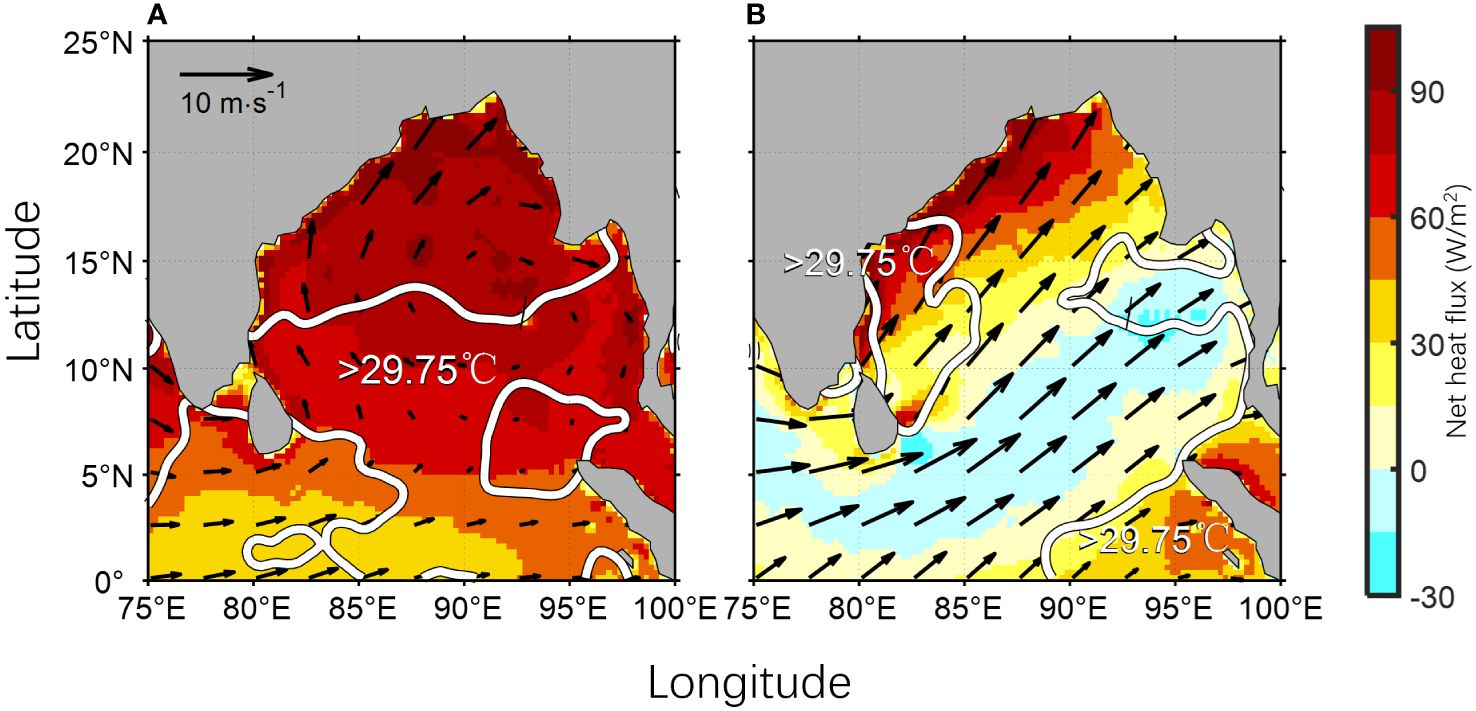
Figure 6 Net heat flux (Shading; unit: W/m2), sea surface wind (vector, unit: m/s) during the developing period (A) and the decaying period (B). The area surrounded by the white curves represents the BoBWP.
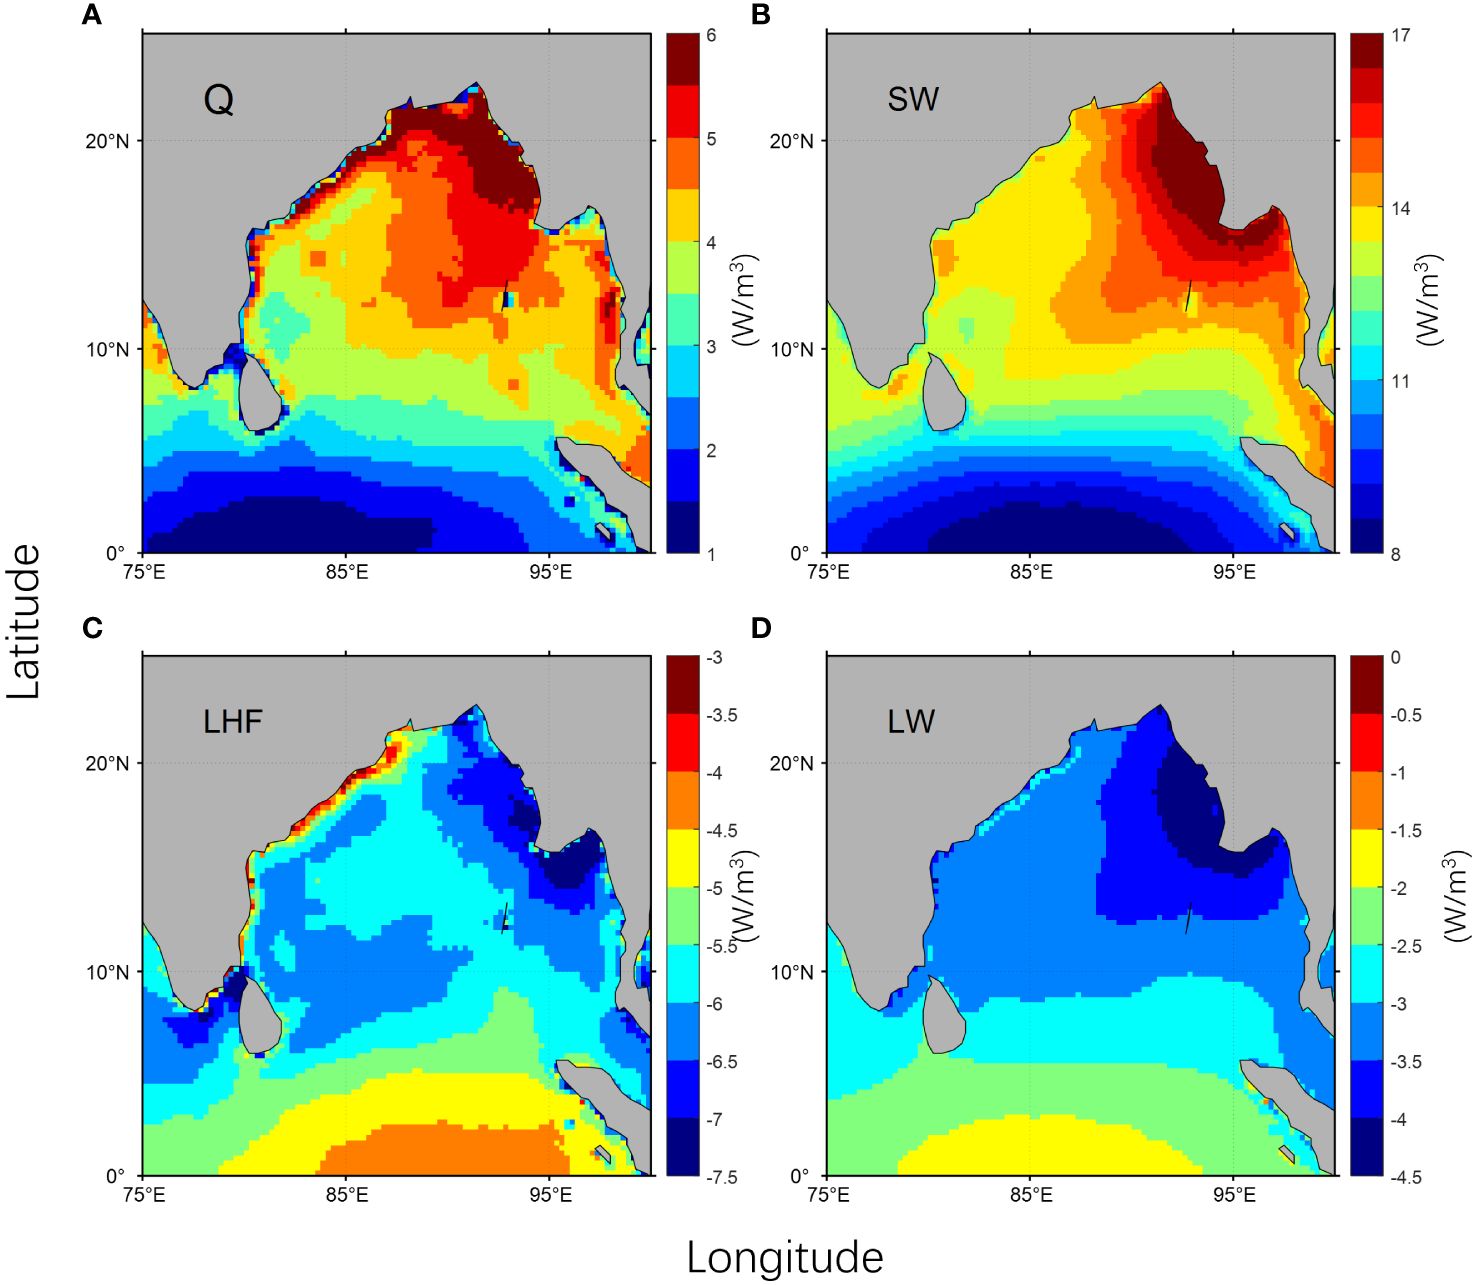
Figure 7 Ratio (W/m3) of daily net heat flux (W/m2) to daily MLD (m) during warm pool developing period (A). (B–D) Same as (A), but for shortwave radiation, latent heat flux and longwave radiation to MLD (B–D).
Due to the onset of the summer monsoon, the increasing latent heat flux release and the decreasing net shortwave radiation (Figure 6B) result in the great weakening of net heat flux, which even reverses to be negative for most of the decaying period (Figure 5). It dominates the decaying of the warm pool (Figure 6B). In addition, the mixed layer is also gradually deepened, implying that ocean dynamical processes such as vertical entrainment may also play important roles in the reduction of the warm pool SST (Figure 8). Figure 8B shows that the southwesterly winds, blocked by the Sri Lankan islands, form a positive cyclone over the southern bay between 5°-15°N, and the associated upward Ekman pumping allows the subsurface cold water to enter the mixed layer, which makes important contributions to the reduction of the mixed-layer temperature during the decaying period. In addition, during the decaying period, the strong southwest monsoon current (approximately 0.20 m s-1) extends from the southern coast of Sri Lanka into the BoB (up to 10°N, Figure 8B). It transports the upwelling from the Indian Peninsula and the southern coast of Sri Lanka into the southern bay, also contributes to the decay of the BoBWP (Li et al., 2021). The relative contributions of surface heating and ocean dynamics are further quantified by mixed layer heat budget analysis in the following text. It should be pointed out that although SODA SST is warmer than OISST (Figure 5), the evolution characteristics of the warm pool shown by the two datasets are basically the same, which further illustrates the reliability of the SODA data.
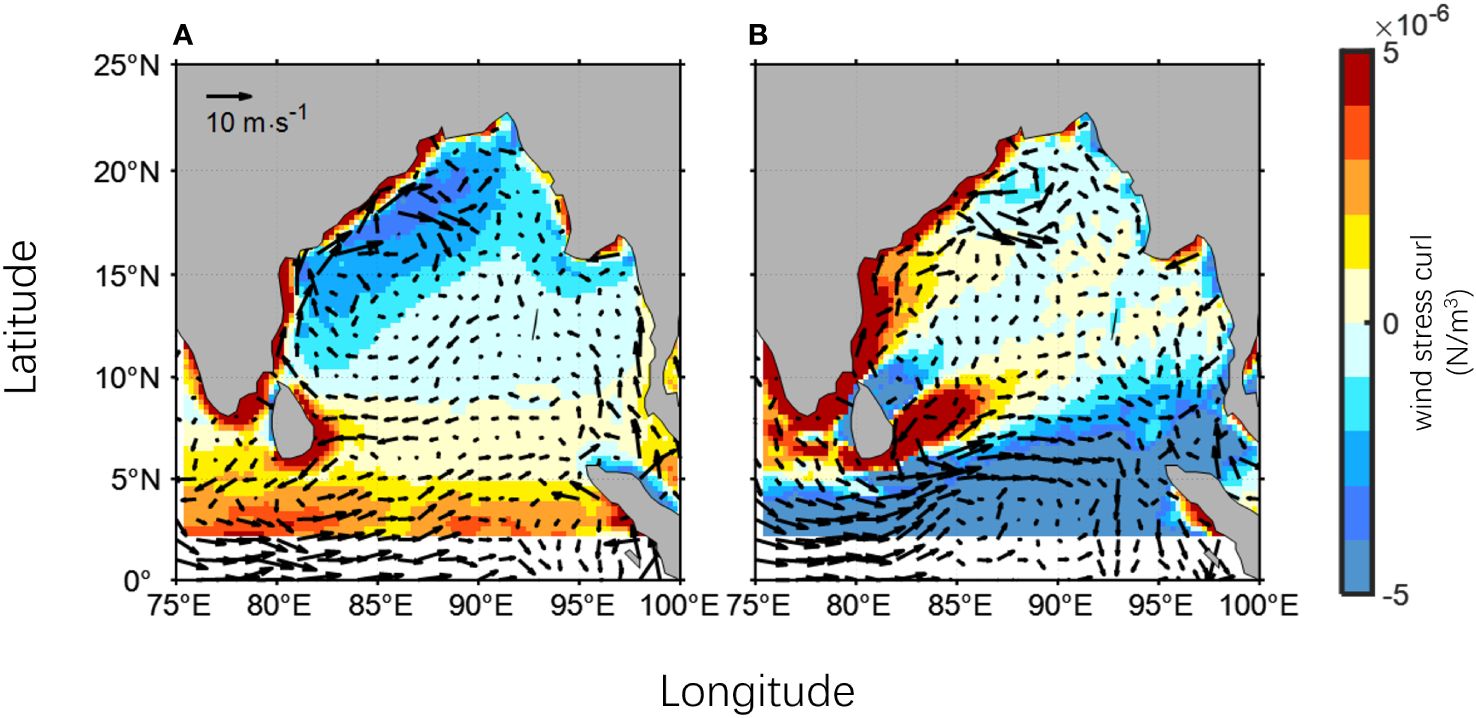
Figure 8 Sea surface wind stress curl (shading, in N/m3) and currents (vector, in m/s) during the warm pool developing and decaying processes: (A) the developing period, (B) the decaying period.
3.2.2 Mixed layer heat budget analysis
In order to quantify the relative contribution of each of the oceanic and atmospheric forcing factors mentioned above to the evolution of the BoBWP, we analyze the mixed layer heat budget during the developing and decaying periods according to Equations 2, 3 (Figures 9, 10). During the developing period, consistent with the qualitative analysis mentioned above, the heat flux term dominates the mixed layer warming throughout the study area (Figure 9). The warming trend of the mixed layer (0.33°C/10d) is dominated by the surface net heat flux term (0.27°C/10d), while the influence of ocean dynamical processes is over one order smaller compared to net heat flux (0.01°C/10d, Figure 9E).
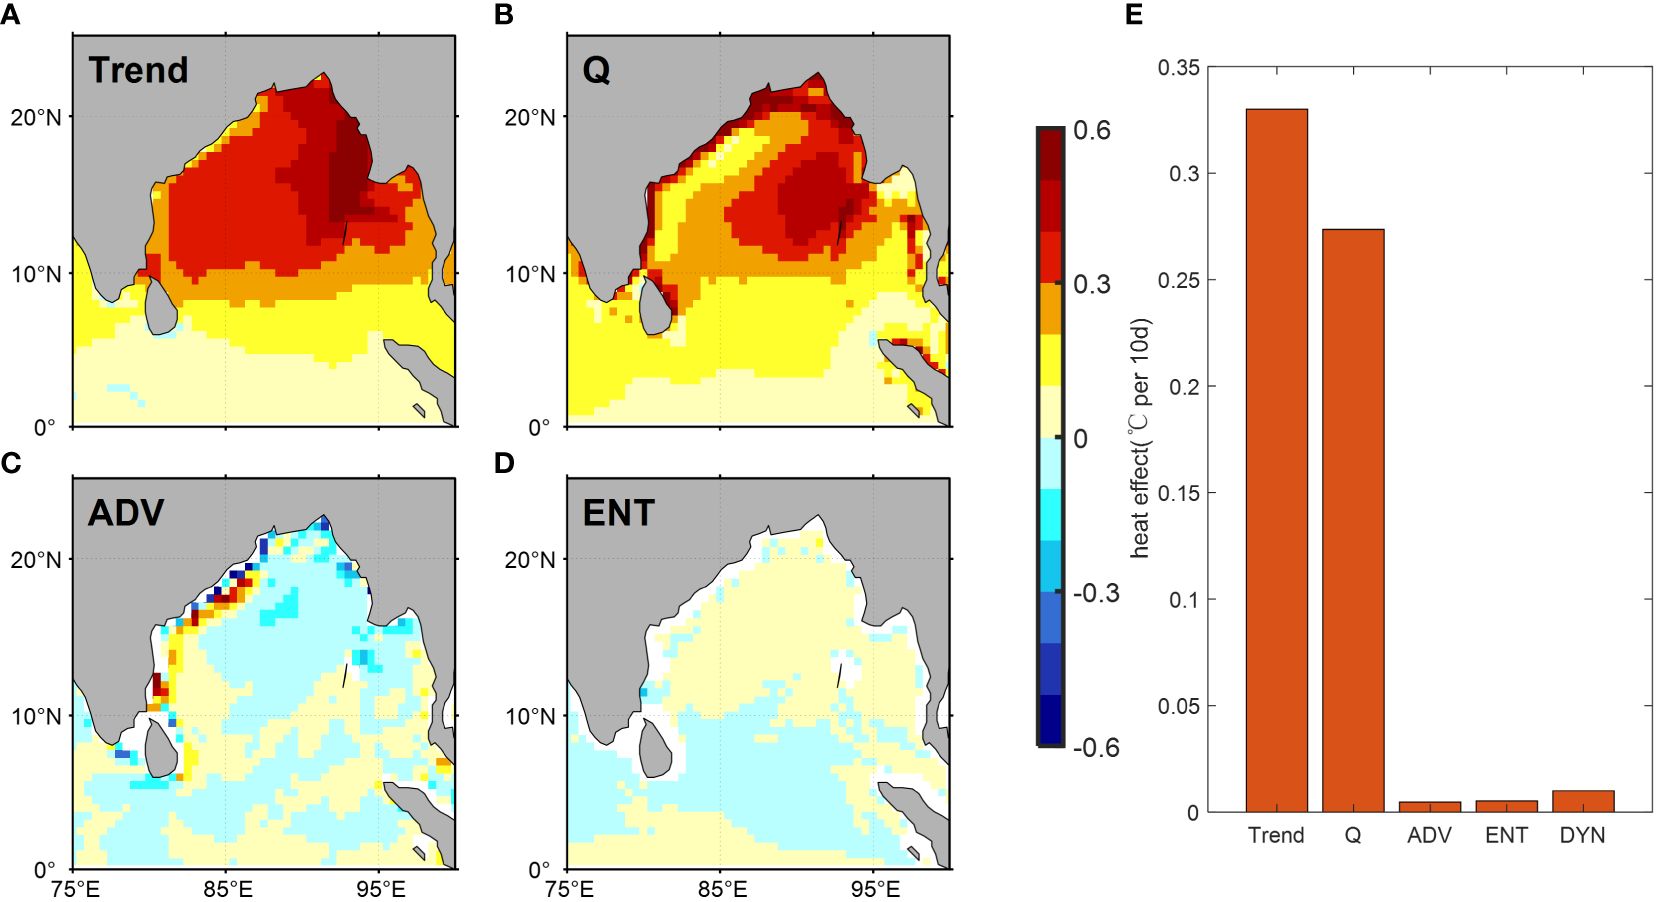
Figure 9 Contribution of different processes to the temperature variation of the BoBWP mixed layer during the developing period (°C per 10 d) :temperature tendency term (Trend) (A), net heat flux term (Q) (B), horizontal advection term (ADV) (C), and vertical entrainment term (ENT) (D); (E) shows the thermal effects of the above components and the dynamical term (the sum of the horizontal advection term and the vertical entrainment term, DYN) in the core area of the warm pool (in/10day). The core area of the warm pool is shown as blue box in Figure 1C.
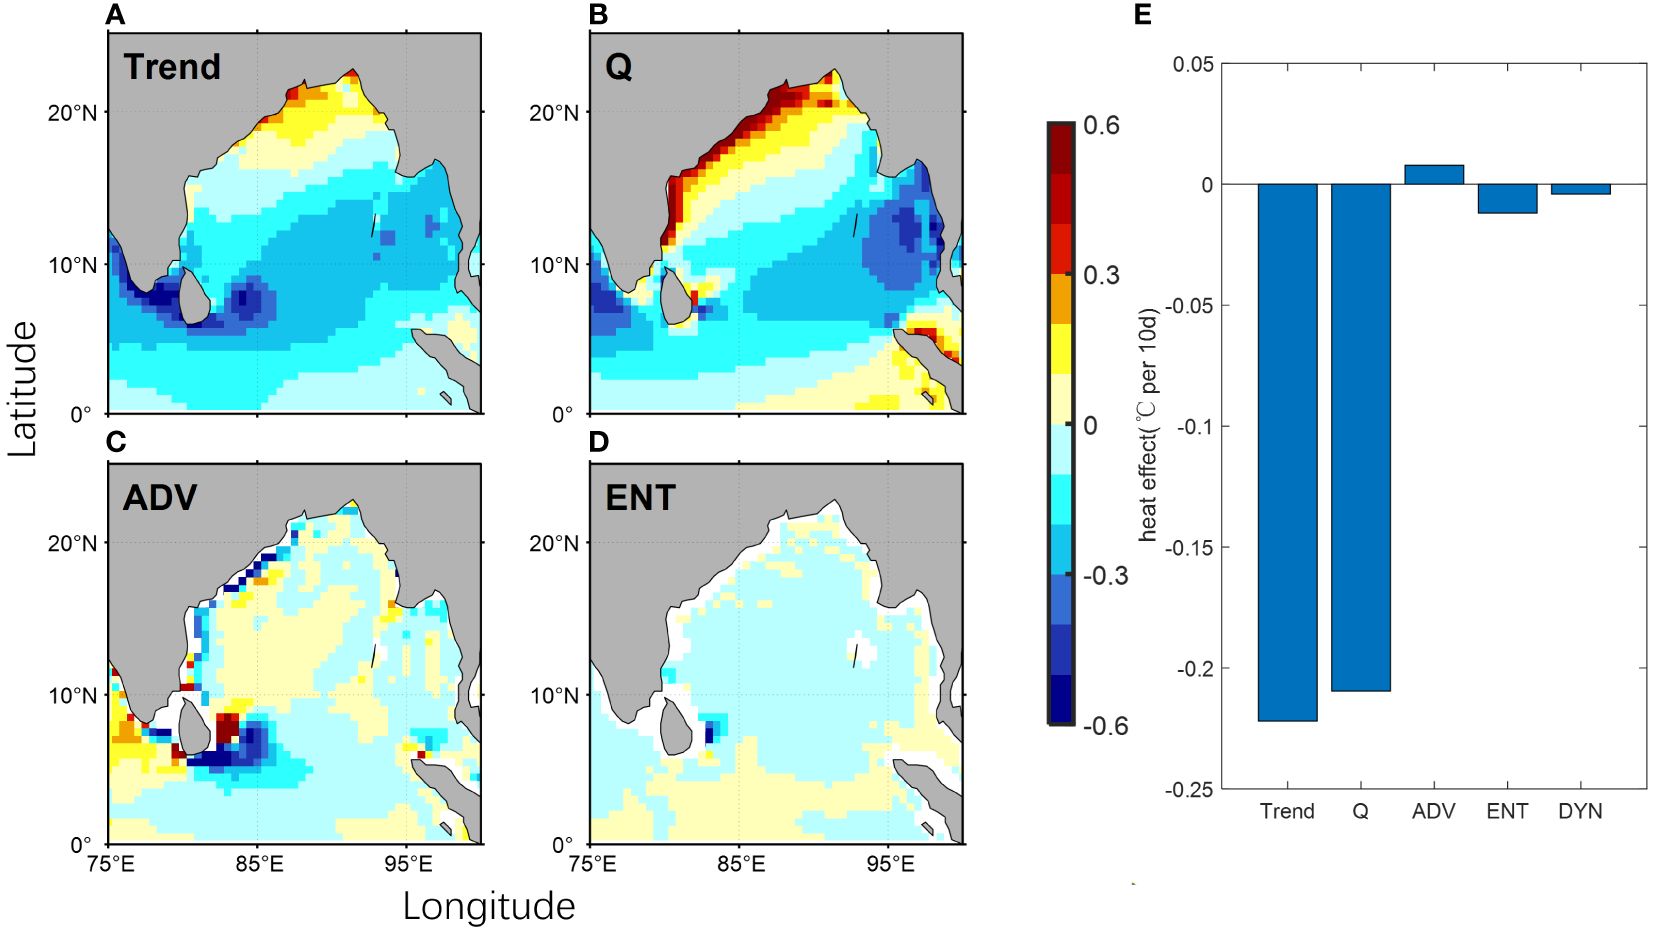
Figure 10 Contribution of different processes to the temperature variation of the BoBWP mixed layer during the decaying period (°C per 10 d):temperature tendency term (Trend) (A), net heat flux term (Q) (B), horizontal advection term (ADV) (C), and vertical entrainment term (ENT) (D); (E) shows the thermal effects of the above components and the dynamical term (the sum of the horizontal advection term and the vertical entrainment term, DYN) in the core area of the warm pool (in/10day). The core area of the warm pool is shown as blue box in Figure 1C.
During the decaying period, the net heat flux term dominates the mixed layer temperature tendency in most of the bay, while in the east of Sri lank Island, the net heat flux term is comparable in magnitude to those of ocean dynamical processes. In particular, similarly to the developing period, the net heat flux plays much more contributions (-0.21°C/10d) than that of ocean dynamical processes (-0.01°C/10d) to the warming trend of mixed layer (-0.22°C/10d).
3.3 Interannual variability of the BoBWP
Previous studies (Chanda et al., 2018; Pathirana and Priyadarshani, 2020) have discussed the interannual variability of SST anomaly (SSTa) in the BoB, they find that most El Niño (La Niña) phases or positive IOD (negative IOD) are accompanied by a positive (negative) SSTa. However, Chanda et al. (2018) found that when El Niño coincided with a nIOD or La Niña with a pIOD, the influence of the ENSO phases on SST and rainfall in the BoB overrode the effects of the IOD phases, indicating that the ENSO phases overruled the IOD phases in BoB. Nonetheless, their study did not explicitly investigate the interannual variability of the BoBWP.
To assess the individual effects of ENSO and IOD on the BoBWP, we decoupled their influences through a linear fitting method and then performed lead-lag correlation analyses (Figures 11A, B). The results reveal that the SST of BoBWP is highly correlated with El Niño events (r = 0.66, p = 0.05), lagging the onset of El Niño by 2 to 8 months, whereas its correlation with IOD events is relatively weaker (r = -0.35), indicating that the previous influence of IOD events on BoB SST is brought by ENSO. Furthermore, the area of the BoBWP exhibits a strong correlation of 0.73 (p=0.05) with the Niño 3.4 index (Figure 12), suggesting a tendency for a larger (smaller) warm pool area of more than 0.5 standard deviations in the year following an El Niño (La Niña) event (yellow/blue background in Figure 12).
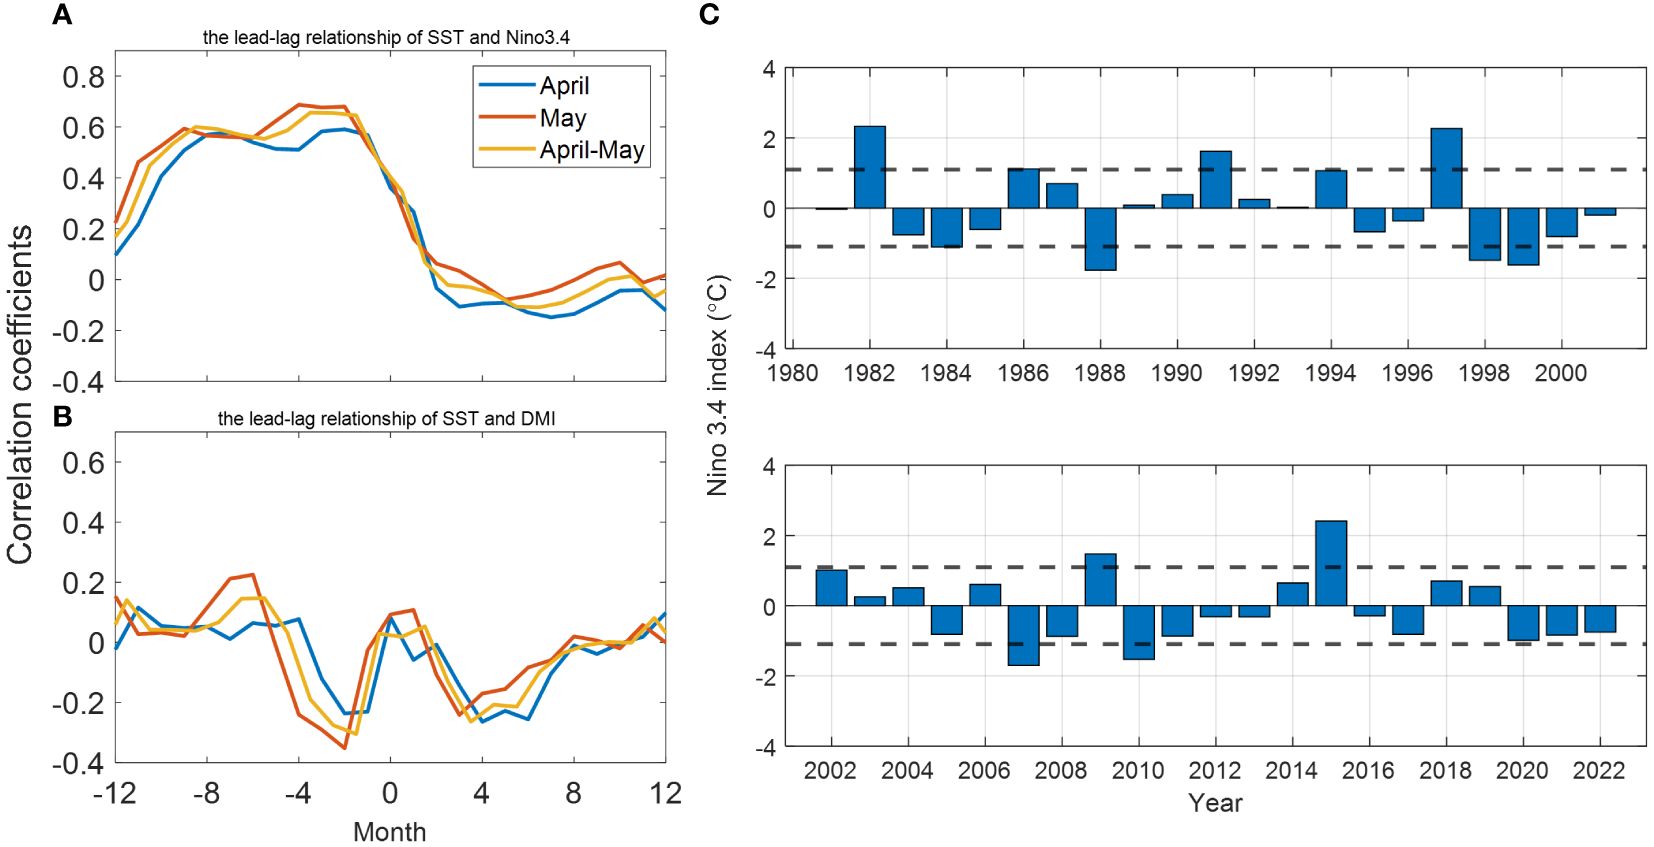
Figure 11 Lead-lag correlation between the SST over core area of BoBWP and (A) the IOD index DMI and (B) the ENSO index Niño3.4 for April (blue line), May (red line), and the April-May average (orange line). (C) Time series of the Niño 3.4 index averaged from December to February, with the black dashed line representing one standard deviation of the Niño 3.4 index. The core area of the warm pool is shown as the blue box in Figure 1C.
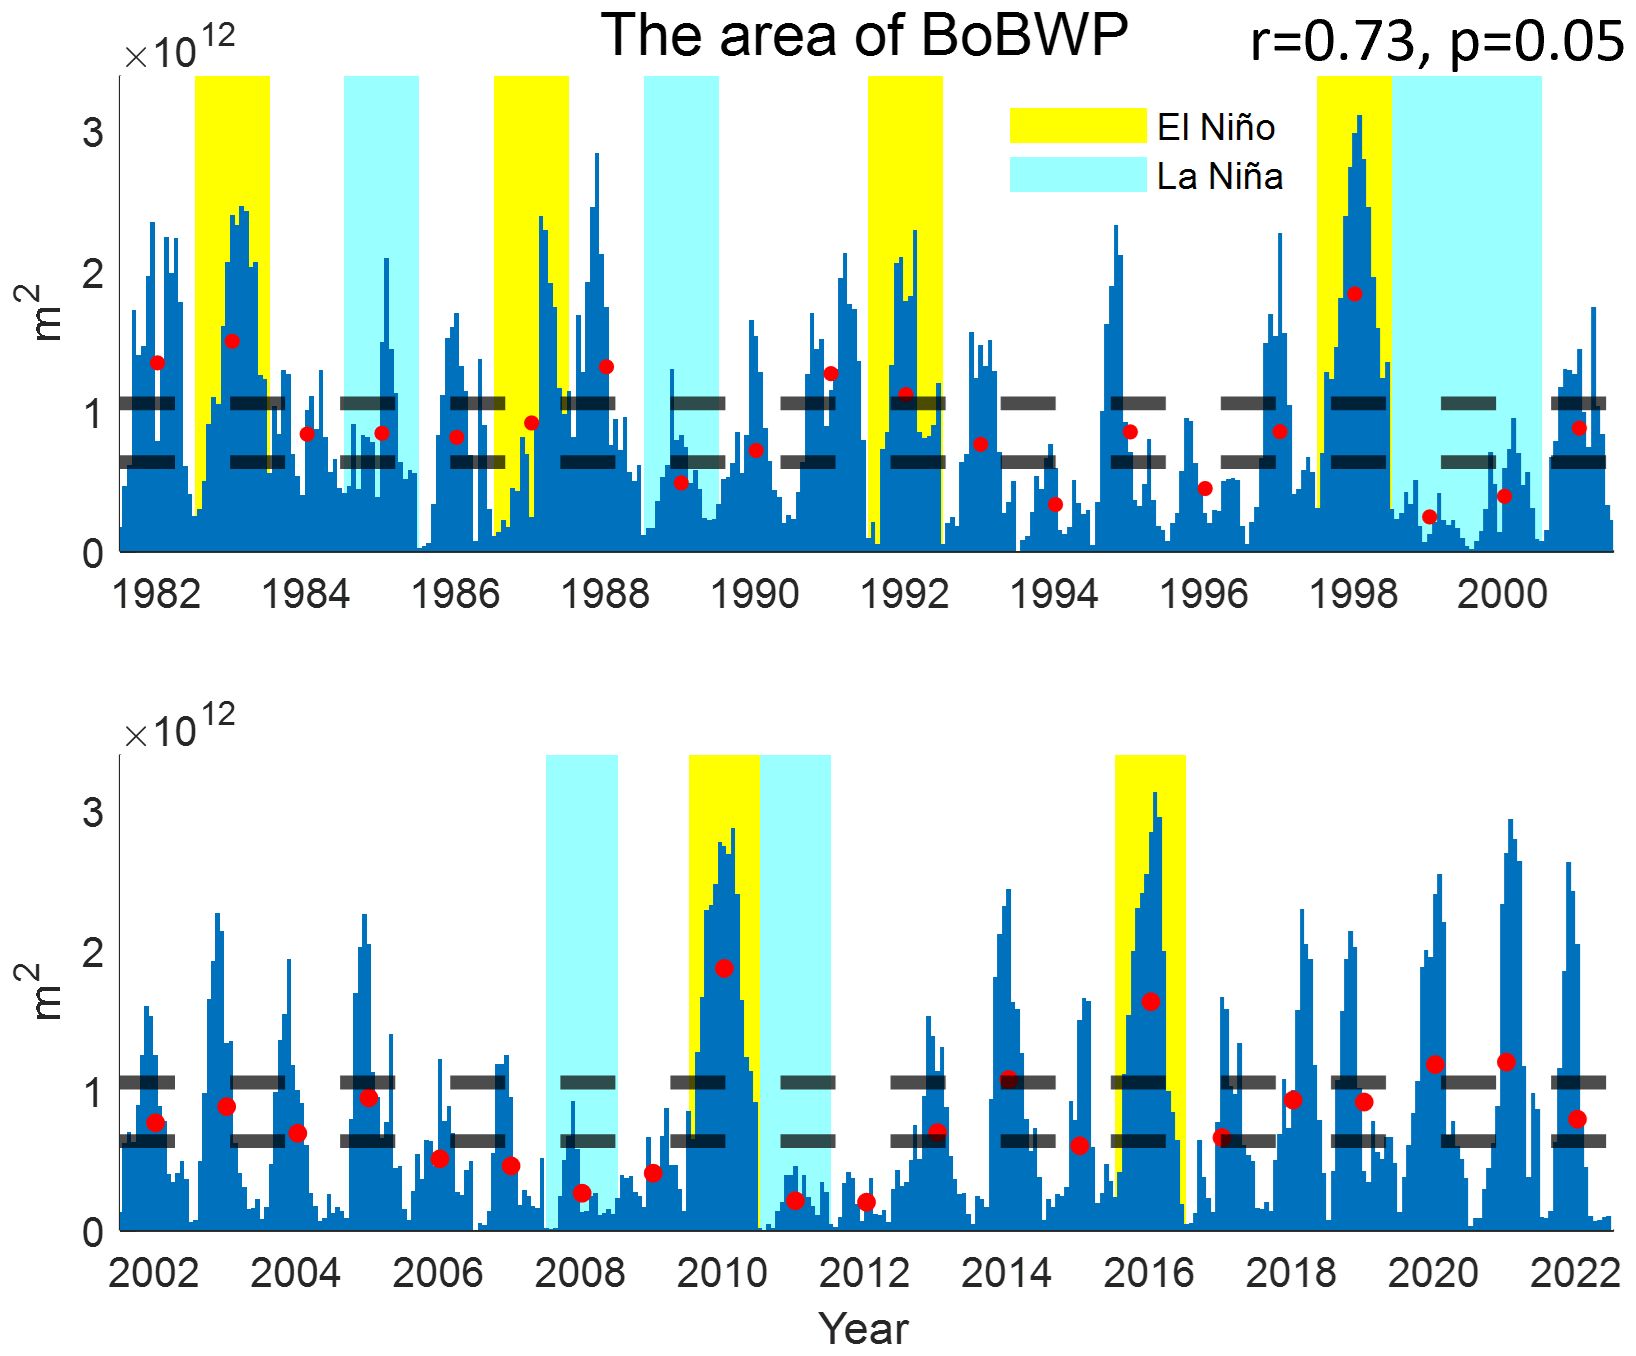
Figure 12 Time series of BoBWP area (>5°N) from March 25 to June 12 during 1982–2022 (the area calculated is daily mean every 5 days; red dots indicate the average area of BoBWP during this period). The dashed lines represent ±0.5 standard deviations. The yellow/blue background highlights six El Niño/La Niña decaying years selected in Figure 11C.
To quantify the specific variations in the BoBWP during ENSO events, the distributions of SST and SST anomalies (SSTa) are examined, averaged over the BoBWP peak phase during April 24-28 in El Niño/La Niña decaying years (Figure 13). During El Niño decaying years, the northern edge of the BoBWP shifts slightly northward, and the southern side expands and becomes contiguous with the equatorial warm pool, resulting in a 75% increase in the area. In contrast, during La Niña decaying years, the southeastern BoB experiences cooling, and the BoBWP nearly disappears, with a 52% decrease in the area (Figure 12).
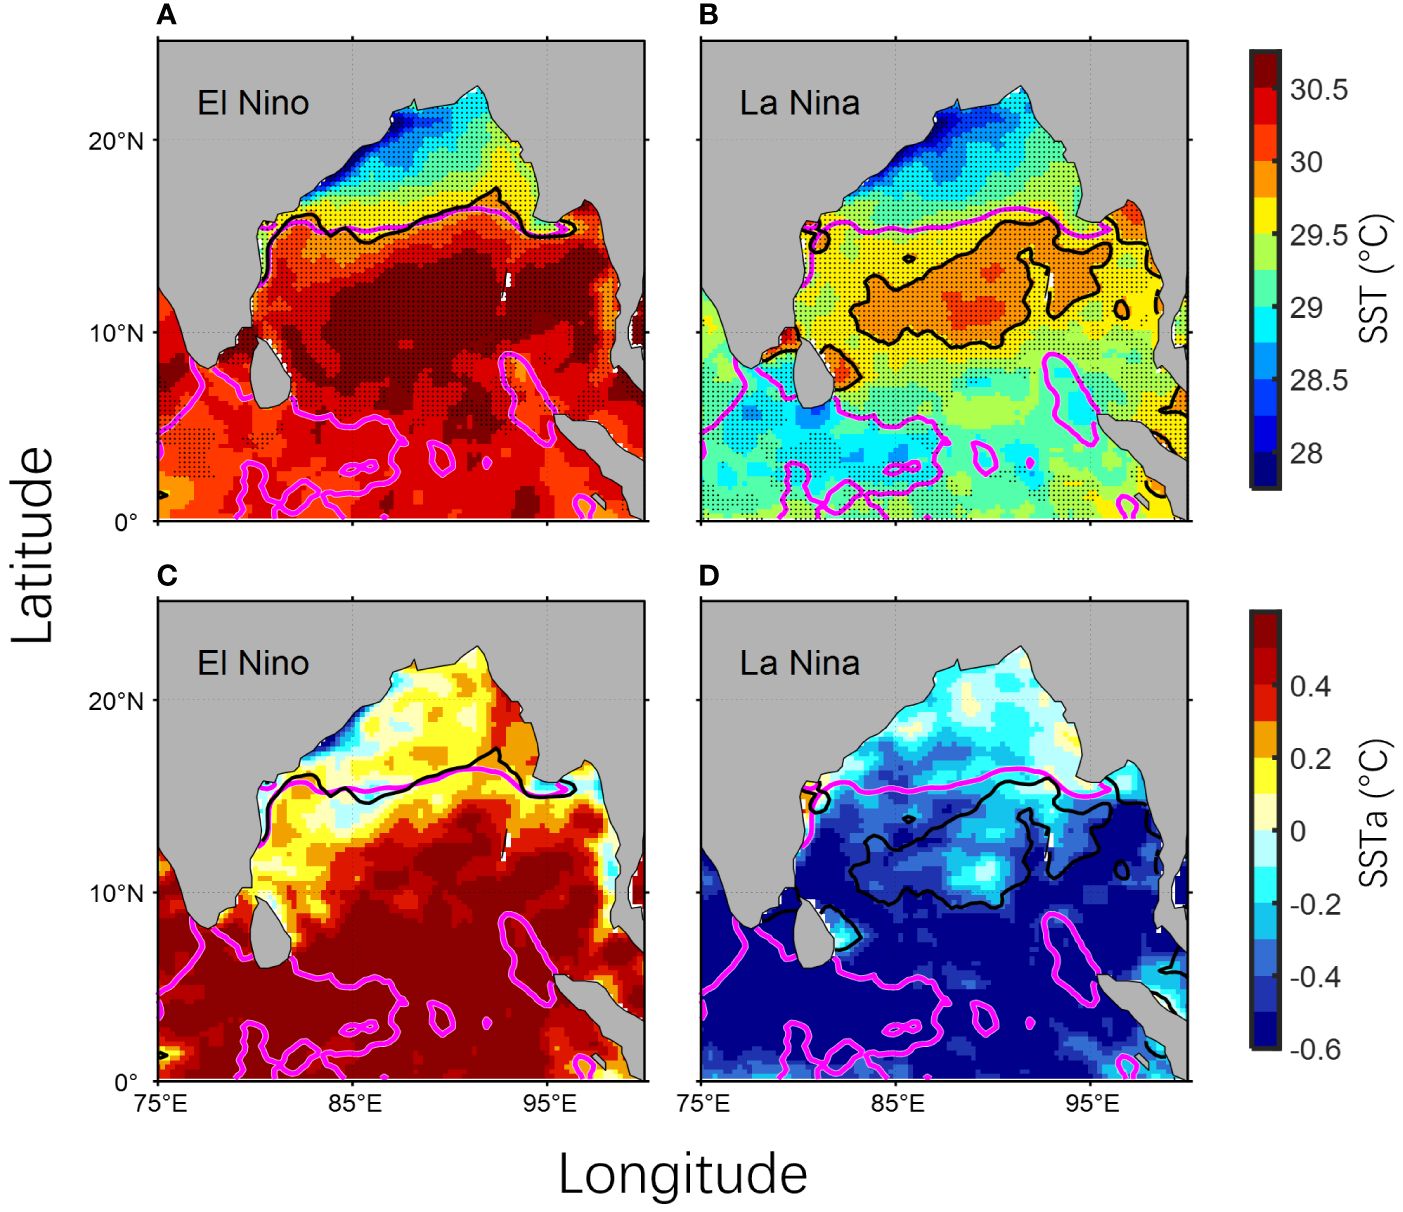
Figure 13 Mean SST for April 24-28 in BoB during the El Niño (A) and La Niña (B) decaying years, where the black line represents the warm pool boundary (>29.75°C), the pink line is the climatological warm pool boundary, and the shading represents the more than 95% confidence level. (C, D) Same as (A, B), respectively, but for SSTa.
This strong modulation of the BoBWP area by ENSO can be attributed to the basin-scale atmospheric and oceanic teleconnections associated with these climate modes. During El Niño years, the weakening of the Walker circulation and the eastward displacement of convective activity over the tropical Pacific can lead to anomalous subsidence and reduced cloudiness over the BoB region. These conditions favor increased insolation and ocean heating, facilitating the expansion of the BoBWP. Conversely, La Niña events are characterized by enhanced convection and cloudiness over the Indo-Pacific warm pool, which can inhibit the formation and maintenance of the BoBWP through reduced surface heating (Klein et al., 1999). Furthermore, warm/cold ENSO events modulate the vertical coupling of the upper and lower level circulation over the South Asia, thereby increasing/decreasing the timing of warm pool development by inducing later/earlier onset of the summer monsoon (Liu et al., 2015).
4 Discussion and conclusions
In this study, we explore the spatial structure and evolution characteristics of BoBWP based on OISST together with multi-source datasets. The results show that the BoBWP occurs mainly during April and May. It forms in the southern bay (6°-13°N) in April, peaks between April 29 and May 3, and moves northward to 10°-15°N in May. The thickness of the BoBWP is 20m ~ 40m and it has a remarkable increase with decreasing latitude. This climatological structure and evolution characteristics we present here is well consistent with the results from Pathirana and Priyadarshani (2020). Their results revealed that the development of the warm pool is present in April, which occupies most of the bay in May while decaying in early June.
The development and decay of the BoBWP are primarily caused by the surface heating. In particular, at the core of the warm pool, the mixed layer warming (0.33°C/10day) is dominated by the net heat flux term (0.27°C/10day). In contrast, the oceanic dynamical processes (entrainment + horizontal advection) induced a much weaker warming in the mixed layer (0.01°C/10day), and its contribution is approximately an order smaller compared to net heat flux. Our result confirms the dynamics for the formation of the BoBWP raised by the previous case studies (i.e., Sengupta et al., 2002; Liu et al., 2013). The important point is that we find that the formation of the warm pool has a positive feedback mechanism associated with air-sea coupling processes. To be specific, during the developing period (March 30 to May 3), influenced by the anticyclonic atmosphere circulation in the bay (Dai et al., 2023), the positive net heat flux brought by clear weather and weak surface winds leads to an increase in SST and an enhancement of atmospheric convection. Enhanced atmospheric convection brings more precipitation, forming stronger stratification and shallower mixed layers, making SST more sensitive to thermal forcing and forming a positive feedback mechanism. At the same time, enhanced deep atmospheric convection reduces solar radiation by increasing cloudiness, forming a negative feedback mechanism. The coupling relationship between SST, mixed layer and sea surface thermal forcing plays a leading role in the development of the warm pool. Shenoi et al. (2002) conducted the analysis of the heat budgets of the near-surface Arabian Sea and BoB during summer monsoon (June-September), and found a similar positive feedback cycle work in the BoB, which makes the BoB being warmer than the Arabian Sea during summer. In the present study, we show that such positive feedback in the ocean-atmosphere system plays a key role on the rapid warming in the mixed layer, which makes the central BoB to be one of the highest SST regions in the tropical oceans during spring.
During the decaying period (May 4 to June 12), the cooling effect induced by the net heat flux is almost dominate over the entire warm pool. The onset of the summer monsoon reduces the net shortwave radiation input and increases the latent heat flux release, which significantly weakens the net heat flux or even turns it negative for most of the period, resulting in the decay of the warm pool. The cooling rates (-0.22°C/10day) of the entire warm pool during the decaying stage, is predominantly caused by net heat flux (-0.21°C/10day) and the cooling effect induced by ocean dynamical processes are much weaker (-0.01°C/10day) This result is well consistent with the previous studies (Sengupta et al., 2002; Liu et al., 2013). However, we can see that over the southwestern bay, the cooling effect induced by the ocean dynamical processes (entrainment + horizontal advection) is comparable in magnitude to that of net heat flux term. The strong southwest monsoon current extends from the southern coast of Sri Lanka into the BoB (up to 10°N, Figure 8B), which transports the upwelling cold water from the Indian Peninsula and the southern coast of Sri Lanka into the southern bay (Li et al., 2021), also contributes to the decay of the BoBWP. Influenced by the climate modes, such as ENSO and IOD, the interannual variabilities of the BoBWP are remarkable. Our study shows a strong correlation between the El Niño event and the warm pool area and SST in the core area of BoBWP. Following the El Niño event, a notable warming trend was observed in the central and southern Bay of Bengal, leading to the expansion of the warm pool towards the south. Conversely, the La Niña event was preceded by a pronounced cooling in the southern and eastern BoB, resulting in a westward retreat of the warm pool. However, our research lacks in-depth analysis of the formation and quantification of mechanisms of the interannual variability of the warm pool, which awaits future research.
Data availability statement
The original contributions presented in the study are included in the article/supplementary material. Further inquiries can be directed to the corresponding author.
Author contributions
WL: Conceptualization, Formal analysis, Writing – original draft, Writing – review & editing. YQ: Conceptualization, Supervision, Writing – original draft, Writing – review & editing. XN: Formal analysis, Writing – original draft. XL: Supervision, Writing – original draft, Formal analysis. TL: Supervision, Writing – original draft.
Funding
The author(s) declare financial support was received for the research, authorship, and/or publication of this article. This work was funded by the National Natural Science Foundation of China (42130406), Scientific Research Foundation of Third Institute of Oceanography, MNR (2022027, 2023018 and 2023014), Global Change and Air-sea Interaction II (GASI-01-SIND-STwin), Asian Countries Maritime Cooperation Fund (99950410) and Laoshan Laboratory.
Conflict of interest
The authors declare that the research was conducted in the absence of any commercial or financial relationships that could be construed as a potential conflict of interest.
Publisher’s note
All claims expressed in this article are solely those of the authors and do not necessarily represent those of their affiliated organizations, or those of the publisher, the editors and the reviewers. Any product that may be evaluated in this article, or claim that may be made by its manufacturer, is not guaranteed or endorsed by the publisher.
References
Atlas R., Ardizzone J., Hoffman R. N. (2008). Application of satellite surface wind data to ocean wind analysis. Remote Sens. System Engineering SPIE. 7087, 118–124. doi: 10.1117/12.795371
Bonjean F., Lagerloef G. S. E. (2002). Diagnostic model and analysis of the surface currents in the tropical pacific ocean. J. Phys. Oceanography 32, 2938–2954. doi: 10.1175/1520-0485(2002)032<2938:DMAAOT>2.0.CO;2
Carton J. A., Chepurin G. A., Chen L. (2018). SODA3: A new ocean climate reanalysis. J. Climate 31, 6967–6983. doi: 10.1175/JCLI-D-18-0149.1
Chaitanya A. V. S., Durand F., Mathew S., Gopalakrishna V. V., Papa F., Lengaigne M., et al. (2015). Observed year-to-year sea surface salinity variability in the Bay of Bengal during the 2009–2014 period. Ocean Dynamics 65, 173–186. doi: 10.1007/s10236-014-0802-x
Chanda A., Das S., Mukhopadhyay A., Ghosh A., Akhand A., Ghosh P., et al. (2018). Sea surface temperature and rainfall anomaly over the Bay of Bengal during the El Niño-Southern Oscillation and the extreme Indian Ocean Dipole events between 2002 and 2016. Remote Sens. Applications: Soc. Environ. 12, 10–22. doi: 10.1016/j.rsase.2018.08.001
Dai L., Cheng T. F., Wang B., Lu M. (2023). Subseasonal features of the Indian monsoon. J. Climate. 36 (20), 7199–7211. doi: 10.1175/JCLI-D-23-0099.1
De Boyer Montégut C., Mignot J., Lazar A., Cravatte S. (2007). Control of salinity on the mixed layer depth in the world ocean: 1. General description. J. Geophys. Res.: Oceans 112 (C6), 2006JC003953. doi: 10.1029/2006JC003953
Feng J., Qiu Y., Dong C., Ni X., Lin W., Teng H., et al. (2022). Interannual variabilities of the southern bay of bengal cold pool associated with the el niño–southern oscillation. Remote Sens. 14, 6169. doi: 10.3390/rs14236169
Jouanno J., Marin F., Du Penhoat Y., Sheinbaum J., Molines J.-M. (2011). Seasonal heat balance in the upper 100 m of the equatorial Atlantic Ocean. J. Geophys. Res. 116, C09003. doi: 10.1029/2010JC006912
Klein S. A., Soden B. J., Lau N.-C. (1999). Remote sea surface temperature variations during ENSO: evidence for a tropical atmospheric bridge. J. Climate 12, 917–932. doi: 10.1175/1520-0442(1999)012<0917:RSSTVD>2.0.CO;2
Li K., Liu Y., Yang Y., Li Z., Liu B., Xue L., et al. (2015). Possible role of pre-monsoon sea surface warming in driving the summer monsoon onset over the Bay of Bengal. Climate Dynamics 47, 753–763. doi: 10.1007/s00382-015-2867-8
Li Y., Qiu Y., Hu J., Aung C., Lin X., Jing C., et al. (2021). The strong upwelling event off the southern coast of Sri Lanka in 2013 and its relationship with Indian ocean dipole events. J. Climate 34, 3555–3569. doi: 10.1175/JCLI-D-20-0620.1
Lin I. I., Goni G., Knaff J., Forbes C., Ali M. M. (2012). Ocean heat content for tropical cyclone intensity forecasting and its impact on storm surge. Nat. Hazards 66, 1481–1500. doi: 10.1007/s11069-012-0214-5
Liu B., Wu G., Ren R. (2015). Influences of ENSO on the vertical coupling of atmospheric circulation during the onset of South Asian summer monsoon. Climate Dynamics 45, 1859–1875. doi: 10.1007/s00382-014-2439-3
Liu Y., Yu W., Li K., Li Z., Wang H. (2013). Mixed layer heat budget in Bay of Bengal:Mechanism of the generation and decay of spring warm pool. Acta Oceanologica Sinica(in Chinese) 35, 1–8. Available at: http://www.hyxbocean.cn/article/id/20130601.
Mao J., Wu G. (2007). Interannual variability in the onset of the summer monsoon over the Eastern Bay of Bengal. Theor. Appl. Climatol. 89, 155–170. doi: 10.1007/s00704-006-0265-1
Mcphaden M. J., Meyers G., Ando K., Masumoto Y., Murty V. S. N., Ravichandran M., et al. (2009). RAMA: the research moored array for african–asian–Australian monsoon analysis and prediction*. Bull. Am. Meterol. Soc. 90, 459–480. doi: 10.1175/2008BAMS2608.1
Narvekar J., Kumar S. P. (2006). Seasonal variability of the mixed layer in the central Bay of Bengal and associated changes in nutrients and chlorophyll. Deep Sea Research Part I: Oceanographic Research Papers 53 (5), 820–835. doi: 10.1016/j.dsr.2006.01.012
Nigam T., Pant V., Prakash K. R. (2018). Impact of Indian ocean dipole on the coastal upwelling features off the southwest coast of India. Ocean Dynamics 68, 663–676. doi: 10.1007/s10236-018-1152-x
Olauson J. (2018). ERA5: The new champion of wind power modelling? Renewable Energy 126, 322–331. doi: 10.1016/j.renene.2018.03.056
Parampil S. R., et al. (2010). Intraseasonal response of mixed layer temperature and salinity in the Bay of Bengal to heat and freshwater flux. J. Geophys. Res.: Oceans 115 (C5), 2009JC005790. doi: 10.1029/2009JC005790
Pathirana G., Priyadarshani K. (2020). A mini-warm pool during spring in the Bay of Bengal. J. Natl. Sci. Foundation Sri Lanka 48 (4), 345–355. doi: 10.4038/jnsfsr.v48i4.9256
Pathirana G., Wang D., Chen G., Abeyratne M. K., Priyadarshana T. (2022). Effect of seasonal barrier layer on mixed-layer heat budget in the Bay of Bengal. Acta Oceanologica Sin. 41, 38–49. doi: 10.1007/s13131-021-1966-0
Prasad T. G. (1997). Annual and seasonal mean buoyancy fluxes for the tropical Indian Ocean. Curr. Sci. 73 (8), 667–674. Available at: http://www.jstor.org/stable/24100427.
Reynolds R. W., Smith T. M., Liu C., Chelton D. B., Casey K. S., Schlax M. G. (2007). Daily high-resolution-blended analyses for sea surface temperature. J. Climate 20, 5473–5496. doi: 10.1175/2007JCLI1824.1
Sengupta D., Ray P. K., Bhat G. S. (2002). Spring Warming of the Eastern Arabian Sea and Bay of Bengal from Buoy Data: SPRING WARMING OF THE NORTH INDIAN OCEAN. Geophys. Res. Lett. 29 (15), 24-1–24-4. doi: 10.1029/2002GL015340
Shenoi S., Shankar D., Shetye S. R. (2002). Differences in heat budgets of the near-surface Arabian Sea and Bay of Bengal: Implications for the summer monsoon. J. Geophys. Res. 107 (C6), 5-1–5-14. doi: 10.1029/2000JC000679
Subramanian V. (1993). Sediment load of Indian rivers. Curr. Sci. 64 (11/12), 928–930. Available at: http://www.jstor.org/stable/24096213.
Thangaprakash V. P., et al. (2016). What Controls Seasonal Evolution of Sea Surface Temperature in the Bay of Bengal? Mixed Layer Heat Budget Analysis Using Moored Buoy Observations Along 90°E. Oceanography 29 (2), 202–213. doi: 10.5670/oceanog.2016.52
Uddin M. M., Chowdhury Z. R., Ahammed S., Basak S. C. (2014). Seasonal variability of mixed layer depth (MLD) in the Bay of Bengal. Indian J. Mar. Sci. 43 (3), 400–407. Available at: http://nopr.niscpr.res.in/handle/123456789/27330.
Vimala J., et al. (2014). Observed Buildup and Collapse of Warm Pool in the Eastern Arabian Sea and Bay of Bengal from Moored Buoy SST Records during 1998–2008. Int. J. Ocean Clim. Syst. 5 (1), 13–22. doi: 10.1260/1759-3131.5.1.13
Vinayachandran P. N., Shetye S. R. (1991). The warm pool in the Indian Ocean. J. Earth System Sci. 100, 165–175. doi: 10.1007/BF02839431
Wu G., Guan Y., Wang T., Liu Y., Yan J., Mao J. (2010). Vortex genesis over the Bay of Bengal in spring and its role in the onset of the Asian Summer Monsoon. Sci. China Earth Sci. 54, 1–9. doi: 10.1007/s11430-010-4125-6
Wyrtki K. (1989). “Some thoughts about the west Pacific warm pool,” in Proceedings of the Western Pacific International Meeting and Workshop on TOGA- COARE1 Noumea (ORSTOM, New Caledonia), 99–109.
Keywords: Bay of Bengal, spring warm pool, mixed layer, air-sea interaction, heat budget
Citation: Lin W, Qiu Y, Ni X, Lin X and Liu T (2024) Evolution characteristics and mechanisms of the spring warm pool in the Bay of Bengal. Front. Mar. Sci. 11:1425722. doi: 10.3389/fmars.2024.1425722
Received: 30 April 2024; Accepted: 05 July 2024;
Published: 23 July 2024.
Edited by:
Toru Miyama, Japan Agency for Marine-Earth Science and Technology, JapanReviewed by:
Junde Li, Hohai University, ChinaMd Masud-Ul-Alam, University of Georgia, United States
Ankur Srivastava, Indian Institute of Tropical Meteorology (IITM), India
Copyright © 2024 Lin, Qiu, Ni, Lin and Liu. This is an open-access article distributed under the terms of the Creative Commons Attribution License (CC BY). The use, distribution or reproduction in other forums is permitted, provided the original author(s) and the copyright owner(s) are credited and that the original publication in this journal is cited, in accordance with accepted academic practice. No use, distribution or reproduction is permitted which does not comply with these terms.
*Correspondence: Yun Qiu, cWl1eXVuQHRpby5vcmcuY24=