 Ling Fang
 Eun Jin Yang
 Junho Yoo
 Minkyoung Kim
- 1Shaanxi Key Laboratory of Earth Surface System and Environmental Carrying Capacity, Urban and Environment Sciences Department, Northwest University, Xi’an, China
- 2Division of Ocean Sciences, Korea Polar Research Institute, Incheon, Republic of Korea
- 3Department of Oceanography, Kyungpook National University, Daegu, Republic of Korea
- 4KNU G-LAMP Project Group, KNU Institute of Basic Sciences, Kyungpook National University, Daegu, Republic of Korea
Arctic fjords are inherently vulnerable to global warming, particularly because of the substantial freshwater influx resulting from the melting of glaciers. In this study, precipitation, river water, surface ice, and seawater samples from Kongsfjorden were collected to identify the main sources of freshwater. The dual water isotope (δ18O and δD) results and temperature–salinity profiles revealed that between 0% and 7% freshwater contributed to the fjord’s water. Furthermore, different freshwater sources for surface and deep water were identified by the dual water isotope analysis. Turbidity profiles confirmed the alter in particle discharge associated with surface runoff and subglacial discharge. Our study highlighted the sensitivity of water isotope analysis in elucidating the hydrological processes within the fjord system and demonstrated its potential for investigating the impact of meltwater on biological processes in the Arctic.
1 Introduction
The Arctic has warmed nearly four times faster than the global mean (Rantanen et al., 2022). The rapid melting of glaciers and ice sheets in the Arctic realm has raised significant concerns because the climate system is sensitive to changes in the freshwater budget through deep-water formation and thermohaline circulation (Aagaard and Carmack, 1989; White et al., 2007; Yang et al., 2016; Spolaor et al., 2024). Arctic fjords serve as channels that link melting glaciers and ice sheets within the Arctic basin (Brogi et al., 2019). In this context, the mixing of water masses in fjord systems plays an important role by, facilitating the storage and redistribution of freshwater, heat, and nutrients (Cottier et al., 2010; Calleja et al., 2017; Santos-Garcia et al., 2022). Therefore, studies on water mass mixing contribute to a better understanding of the freshwater budget and its impact on marine biogeochemical processes (Halbach et al., 2019).
Traditionally, temperature–salinity relationships have been used as a viable method for distinguishing water masses (Tang et al., 2004). Nevertheless, this method is limited when used for tracing the mixing of water masses with similar salinities and temperatures in coastal areas (Bigg and Rohling, 2000; Lao et al., 2022). In Arctic fjords, freshwater originates from various sources such as subglacial meltwater, glacier calving, precipitation, and river runoff, which exhibit similar salinity levels; this complicates the determination of their respective contributions. In contrast, dual water isotope analysis (δ18O and δD) is advantageous because the levels of the isotopes differ across various freshwater sources (MacLachlan et al., 2007; Tiwari et al., 2018). Variations in the δ18O and δD isotope values in surface seawater are largely controlled by physical processes such as precipitation, evaporation, advection, upwelling, and runoff input (Craig and Gordon, 1965; Rohling, 2013). Water isotopes and salinity exhibit similar responses to these physical processes, manifesting lower values in freshwater compared with seawater (Tiwari et al., 2018). Therefore, the δ18O and δD values in coastal waters decrease with increasing freshwater flushing and precipitation and increase with higher evaporation and seawater intrusion (Richards et al., 2018). Accordingly, different water masses exhibit different δ18O–δD and δ18O–salinity relationships; this is, useful for studying the hydrographic processes in high-latitude oceans, such as the Arctic fjords (MacLachlan et al., 2007) and the Southern Ocean (Tiwari et al., 2015).
The archipelago of Svalbard is one of the rapidly changing regions in the Arctic with increasing water temperatures (Hop et al., 2019), water column stratification (Promińska et al., 2017), precipitation (Hanssen-Bauer et al., 2019), and retreating glaciers (Østby et al., 2017). Kongsfjorden, an Artic fjord on the Spitsbergen, Svalbard archipelago, is surrounded by glaciers, including Kongsvegen, Kronebreen, Kongsbreen, Conwaybreen, and Blomstrandbreen (Figure 1A). The fjord is between 4 and 10 km wide, ~27 km long, and has a total volume of about 29.4 km3 (Ito and Kudoh, 1997; Brogi et al., 2019). Kongsfjorden experiences contributions of subglacial meltwater from five tidewater glaciers, ice calving, and direct discharge (~29 × 106 m3) from the Bayelva River, which receives runoff from two small land-terminating glaciers, Austre and Vestre Brøggerbreen (Figure 1A, Zhu et al., 2016; McGovern et al., 2022). Subglacial discharge strongly impacts the hydrographic dynamics in Kongsfjorden (Everett et al., 2018; Halbach et al., 2019). Furthermore, Svendsen et al. (2002) report that high precipitation during the summer and winter seasons may affect the fjord’s freshwater dynamics (Svendsen et al., 2002). These on-going transition from tidewater glaciers to land-terminating glaciers do not only impacts the watermass characteristics but also the biogeochemical properties and its ecosystem consequences in Kongsfjorden within a warming Arctic. Freshwater originating from glacial meltwater, precipitation, and river runoff has distinct δ18O and δD values, yet the δ18O–δD relationship remains unexplored. In this study, we present a dataset encompassing dual water isotope values, temperature, and salinity profile results obtained from the water column of the Kongsfjorden in June 2023. The goal of this study is to discern mixing patterns among the different water masses in Kongsfjorden, providing insights into the fjord’s freshwater mixing processes.
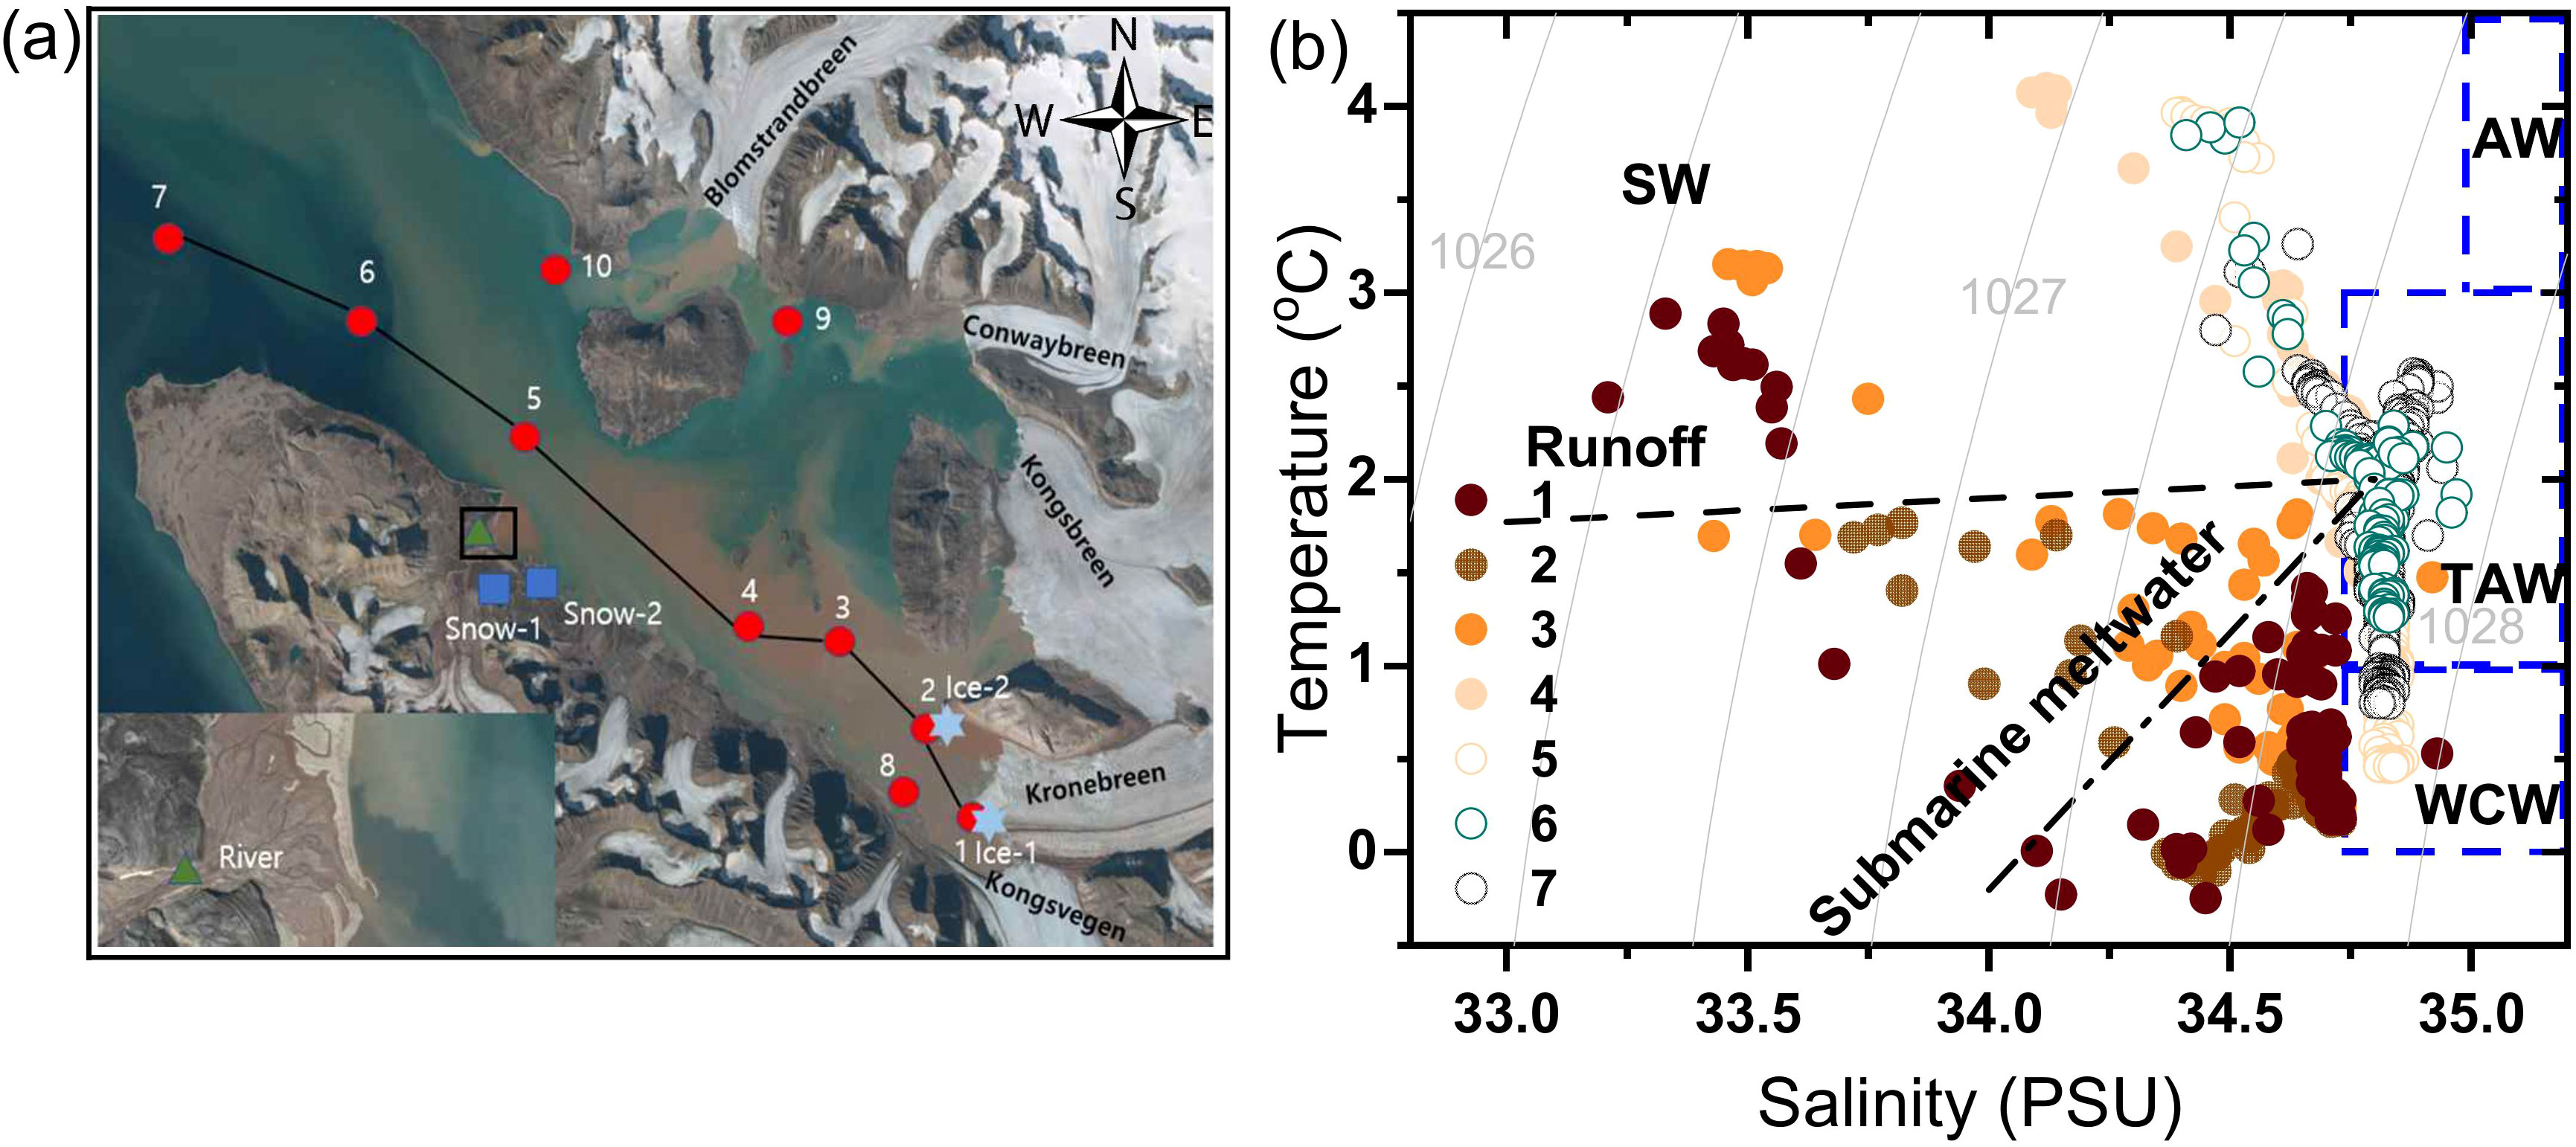
Figure 1. (A) Map of Kongsfjorden showing the dual water isotope sampling locations in the sea water (red circles). The black line indicates a cross-section of the sampling stations from the inner to the outer fjord. The green triangle indicates the river water sampling location and the blue squares represent snow sampling stations. Ice samples were collected in front of glaciers, indicated by blue stars. (B) The temperature–salinity diagram for Kongsfrjoden’s water column: Atlantic Water (AW), Transformed Atlantic Water (TAW), Winter Cold Water (WCW), and Surface Water (SW). The boundaries of each water mass are shown according to Payne and Roesler (2019). Dashed lines represent the mixing line with runoff (river and supraglacial discharge; towards 0°C and salinity of 0 practical salinity unit (PSU)) and subglacial discharge (towards −90°C and salinity of 0 PSU) (Mankoff et al., 2016; Halbach et al., 2019).
2 Materials and methods
2.1 Sampling
Sampling was conducted in Kongsfjorden in June 2023 (Figure 1A; Supplementary Table S1). A total of 22 seawater samples were collected at each of the 10 stations from three nominal water depths (surface, 100 m, and bottom depth) using 10 L Niskin bottles on board of MS Teisten. Station 1 in the inner fjord was the closest accessible sampling location from the Kronebreen for the safety region. Seawater samples for dual water isotope analyses were filtered through acetate membranes (0.45 μm pore size) to prevent the effect of bioprocesses on water isotopes after sampling in the vial. The filtrate was transferred to a glass vial (Labco, 12 mL borosilicate vial, non-evacuated) that was pre-baked at 450°C and wrapped with parafilm (PM-996, Amcor, Switzerland) to reduce biological effects and avoid isotopic fractionation through evaporation, and then stored at 4°C before analysis.
Hydrographic data at each station included salinity, conductivity, temperature, fluorescence and turbidity obtained with CTD (SD204, SAIV A/S, Norway). To distinguish between different freshwater sources, freshwater end-members from the region were also sampled (Figure 1A). Two ice samples from Station 1 and 2 (Ice-1 and Ice-2) were collected using a bucket; one Bayelva River water sample and two precipitation samples (Snow-1 and Snow-2) samples were also obtained. Ice and snow samples were collected in zipper−closed plastic bags and transported to the Kings Bay Marine Laboratory in Svalbard. The samples were immediately melted at room temperature and treated in the same method as seawater.
2.2 Stable water isotopes
Dual water isotope analysis determines the ratios of the stable isotopes of oxygen (i.e., 18O and 16O) and hydrogen (i.e., 2H and 1H). The ratios are reported in per mil (‰) deviations from the Vienna Standard Mean Ocean Water (V-SMOW), denoted as δ18O and δD, as follows:
where Rsample and RV-SMOW indicate the 18O/16O and 2H/1H ratios in the sample and V-SMOW, respectively.
The dual water isotope analyses were performed using a Picarro water isotope analyzer (L2140-I, Picarro, USA) at the Shaanxi Key Laboratory of Earth Surface System and Environmental Carrying Capacity. Five standards were used for the calibration curve including USFS53 (USGS RSIL, USA), GBW04458, GBW04459, GBW04460 and GBW04461 (National Institute of Metrology, China). Results have been reported in the standard delta notation as δ18O and δD relative to the V-SMOW. The precision of the Picarro analyzer was ±0.2‰ and ±0.5‰ for the δ18O and δD, respectively. The reproducibility of the δ18O and δD of this study’s samples were ±0.1‰ and ±0.2‰, with an average relative standard deviation (RSD) of 9% and 6.5%, respectively, based on duplicate analyses of four samples.
The deuterium excess (d-excess), defined as d = δD – 8 × δ18O, has long been used as a diagnostic tool for analyzing moisture sources, hydrological cycles, and local climate conditions (Dansgaard, 1964; Uemura et al., 2008). Scientific studies and isotope models have linked higher d-excess values of precipitation to continental recycled moisture or lower condensation temperature, and lower d-excess values to maritime moisture or sub-cloud evaporation in dry climates.
2.3 Mixing model
A simplified two end-member mixing model was used to determine the δ18O and δD values of freshwater input based on the isotopic mass balance as follows:
where Ss, δ18Os, and δDs represent the salinity, δ18O, and δD of the samples, respectively, Ssw, δ18Osw, and δDsw represent the salinity, δ18O, and δD of the open sea water, respectively, and Ff is the fraction of freshwater. Equation 3, 4 can be expressed as follows:
Accordingly, the intercept of the linear correlation between the water isotopes and salinity in fjord water is the water isotope signal for the freshwater discharge.
To better quantify the surface discharge and subglacial meltwater contribution, here we also separate freshwater source into surface freshwater (sf) and deep freshwater (df), representative to surface discharge and subglacial meltwater. A three end-member mixing model is implied:
3 Results
3.1 Hydrological properties
Water masses within Kongsfjroden are composed of warm and saline Atlantic Water (AW; T > 1°C, S > 34.9), transformed AW, fresh meltwater, winter cold water, and surface water (Figure 1B, Payne and Roesler, 2019; Tverberg et al., 2019; Vonnahme et al., 2023). In the inner fjord (Stations from 1–4), fresher and colder water masses were observed while the water masses in the outer fjord (Stations from 5–7) had higher salinity and temperature. Winter cold water was the dominant source of deepwater in the inner fjord, while AW and transformed AW were the primary sources of saline water in the outer fjord (Figure 1B). On the western flank of Svalbard, warm and salty AW is carried northward along the shelf edge by the West Spitsbergen Current and enters the Arctic Ocean, supplying the continental slope at Kongsfjorden (Cottier et al., 2005; Payne and Roesler, 2019). Previous investigations have indicated the intrusion of AW into the Kongsfjorden continental shelf is characterized by elevated salinity and temperatures (Torsvik et al., 2019). Our observation confirms that transformed AW spreads below the surface and intermediate waters, and extends to the bottom of the outer fjord (Promińska et al., 2017).
In the inner fjord at deeper depths, the temperature and salinity fall below the mixing line between transformed AW and cold subglacial meltwater, indicating the involvement of winter cold water. Surface temperature and salinity are influenced by mixing processes involving transformed AW, runoff, and warm surface water. Cross-sectional profile of salinity reveals a surface meltwater contribution down to a depth of 15 m, while temperature suggests a cold water source at depth of 15–30 m in front of tidewater glacier (Figures 2A, B).
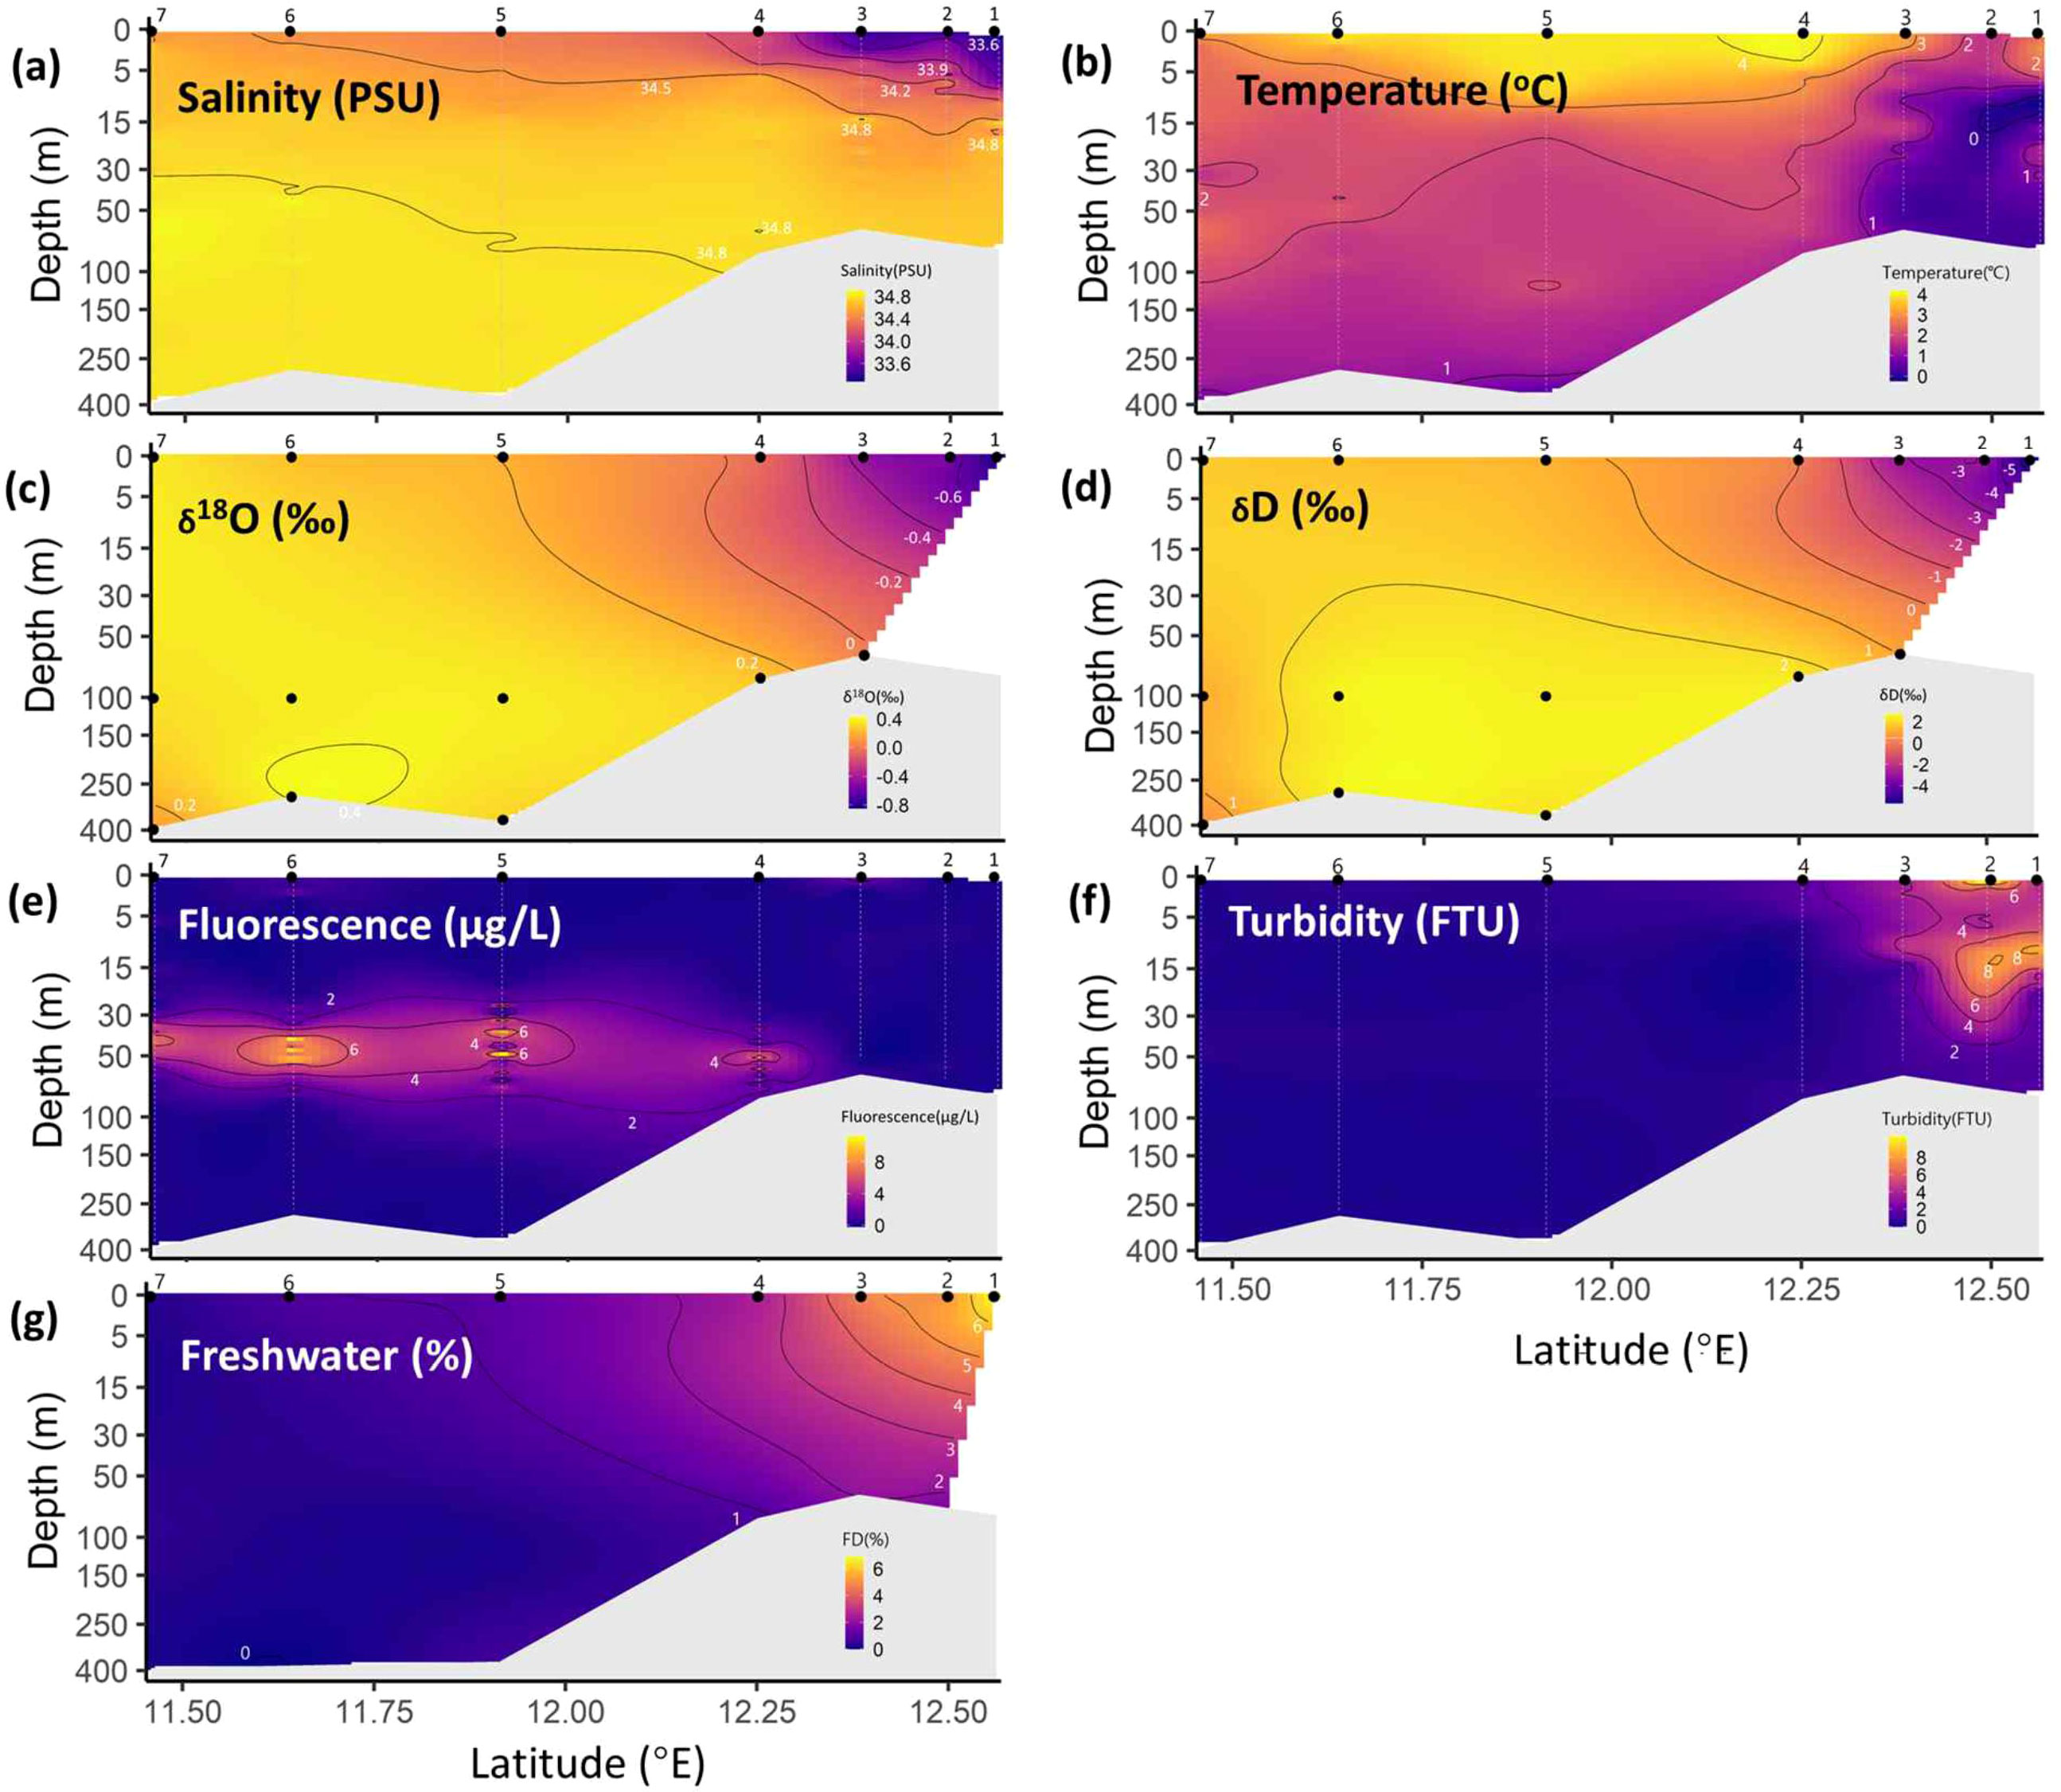
Figure 2. Cross-sectional distributions of (A) salinity, (B) temperature, (C) δ18O, (D) δD, (E) fluorescence, (F) turbidity, and (G) estimated freshwater content. Station numbers are indicated above each panel, and sampling locations and depths for (C) δ18O and (D) δD values are indicated with black dots.
3.2 Spatial variability in the δ18O and δD values
The lowest dual water isotope values were observed in the glacier calving ice samples collected at Stations 1 and 2, with an average δ18O and δD of –14.0‰ and –101.7‰, respectively (Table 1). Slightly higher δ18O and δD values were observed in fresh snow and precipitation, remaining relatively constant at –12.2‰ and –92.0‰, for the δ18O and δD, respectively. These values were closely aligned with the ones for Bayelva River water, where similar isotope values of –12.9‰ and –91.7‰ were observed for δ18O and δD, respectively. The δ18O and δD values of all seawater samples spanned between –0.85‰ and 0.41‰ and –5.6‰ and 2.5‰, respectively.

Table 1. Sources of freshwater input and their respective water isotope ratios.
The cross-sectional profiles of the δ18O exhibit spatial patterns similar to those in salinity (Figures 2A, C). The δ18O of surface water increased with the distance from the glacier in the fjord system, showing particularly low values in the inner fjord. In general, the δ18O values were lower in surface water compared with bottom water. A similar trend was observed in the δD values; however, there was larger variability. Additionally, the cross-sectional profiles of the δ18O and δD values demonstrated that the intrusion of freshwater extended to a depth between 15–30 m (Figures 2C, D), in contrast, a difference was difficult to differentiate in the salinity profiles.
3.3 Spatial variability in fluorescence and turbidity
The fluorescence data were obtained using a CTD fluorometer to observe relative variations among stations. Lower fluorescence was observed in the inner fjord (Stations 1–4), with values ranging between nearly 0 and <2 μg/L (Figure 2E). The cross-section of fluorescence demonstrated higher fluorescence concentrations in the outer fjord (Stations 5 and 6) with a subsurface peak at depths of between 30–50 m. In addition, a slight decrease in fluorescence (peaked at 7.5 μg/L) was observed at Station 7.
In contrast, elevated turbidity was determined in the inner fjord (Station 1–4), exhibiting a gradual decrease towards the outer fjord stations. The highest values were retrieved from the subsurface water (10–30 m) in front of the glacier, indicating a subglacial discharge (Figure 2F). This suggests that particulate matter could be delivered from subglacial meltwater and penetrated to deeper depths by fast deposition. Furthermore, highest turbidity was observed in the surface water at Station 8 near the coast.
4 Discussion
4.1 Factors affecting water isotope values in Kongsfjorden
The δ18O and δD values of all the seawater samples were within the range bounded by the Arctic meteoric water line (Wetzel, 1990) and global ocean water line (Rohling, 2007, Figure 3A). Within the inner fjord, a significant positive correlation was observed between the δ18O and δD values (R2 = 0.99, n = 14). All the inner fjord samples (Stations 1–4, 8 and 9) were located above the global ocean water line, suggesting a contribution from freshwater, such as meltwater and precipitation. In contrast, the outer fjord samples generally had higher δ18O and δD values and aligned around the global ocean water line (Figure 3A), indicating that ocean water was dominant in the outer fjord water mass. Figure 3B shows that the seawater d-excess is negatively correlated with the δ18O values for all the samples, underscoring the role of kinetic fractionation (evaporation and precipitation) in the distribution of water isotopes.
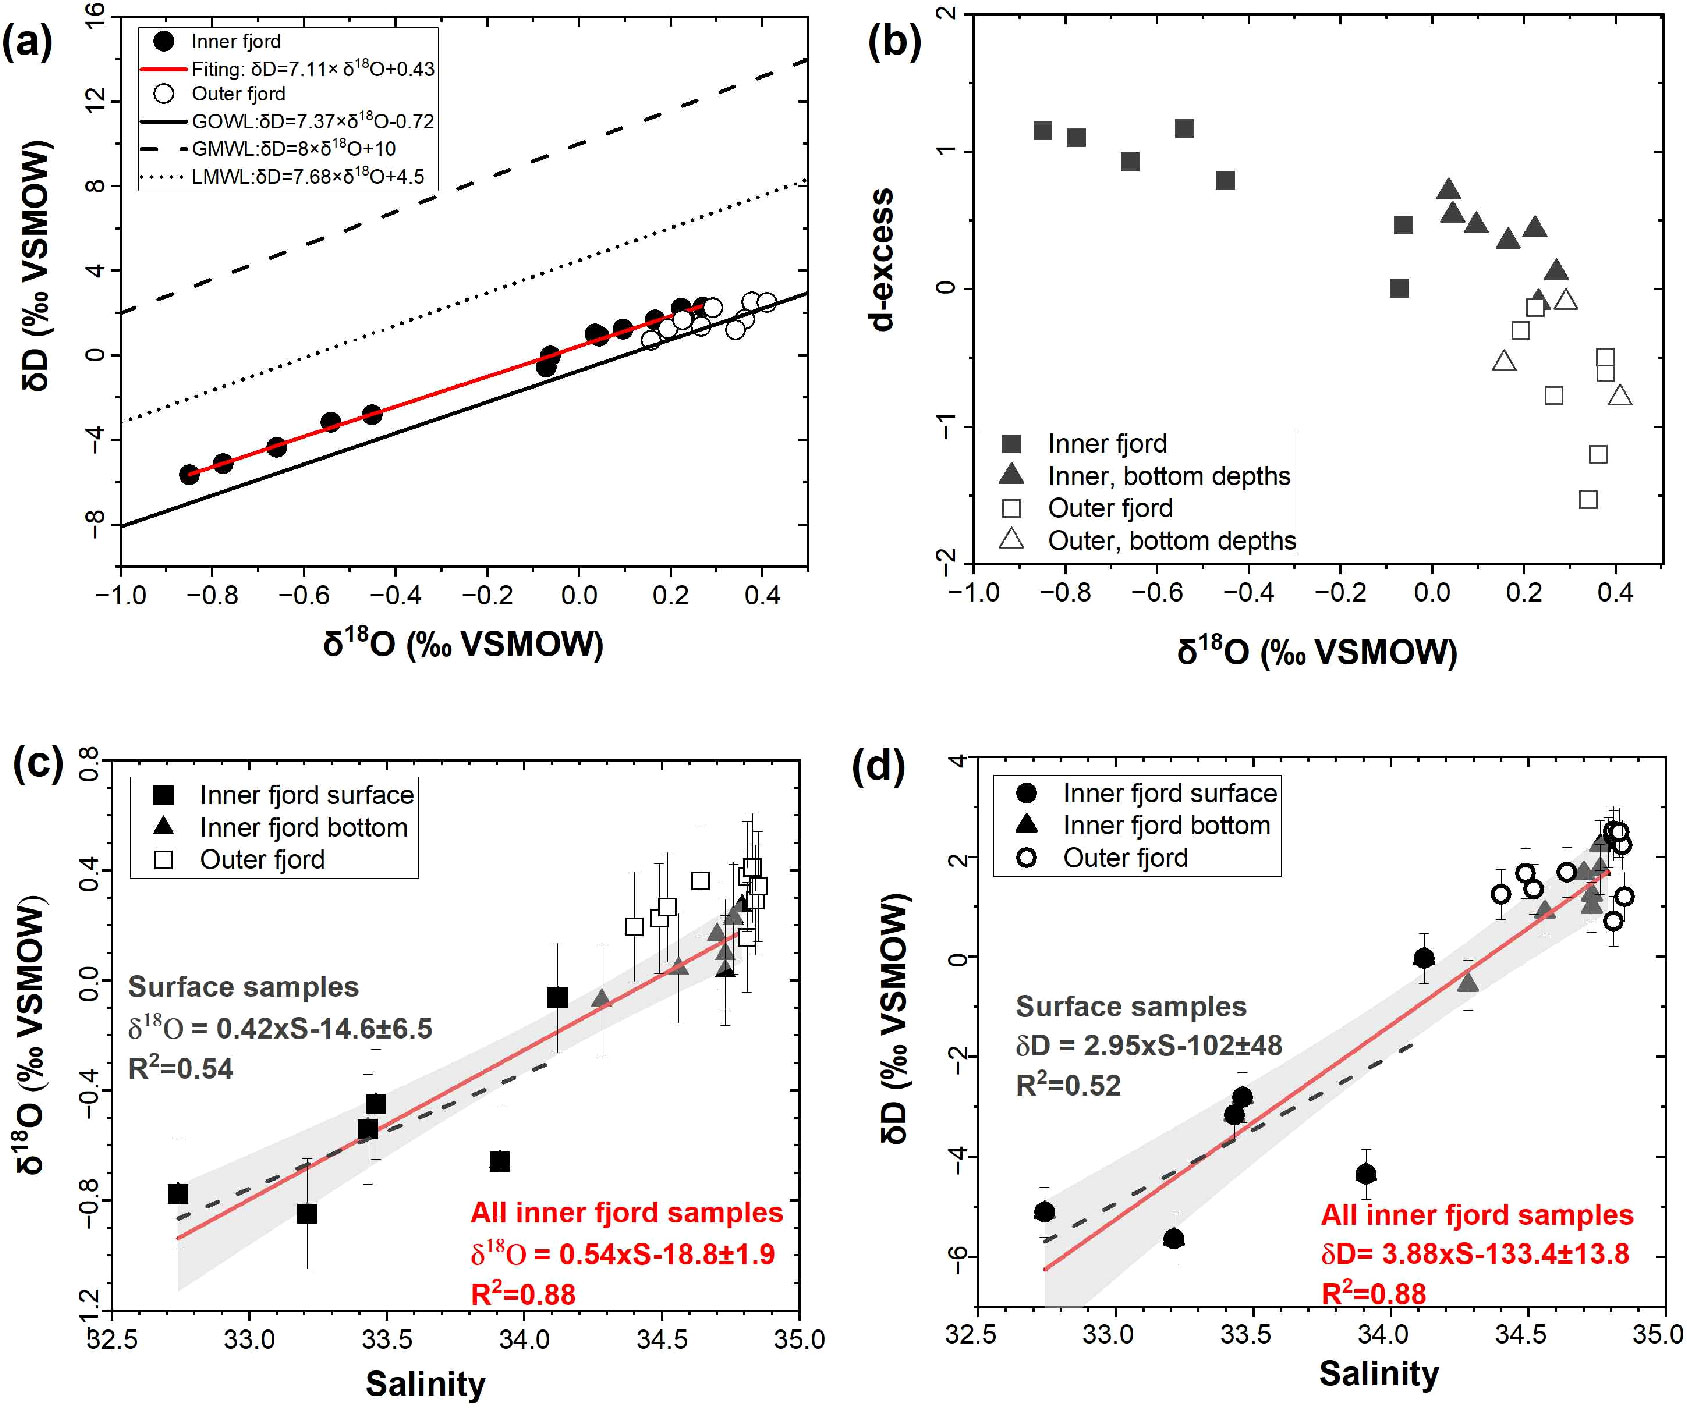
Figure 3. (A) δD–δ18O relationship for water samples in Kongsfjorden. The inner and outer fjord samples are indicated with solid and open dots, respectively. The global ocean water line (GOWL; solid line), global metric water line (GMWL; dashed line), and local metric water line (LMWL; dotted line) from Arctic metric water are shown. (B) The d-excess with δ18O for all the seawater samples. Samples collected at bottom depths of each station are shown in triangles. (C) The δ18O and (D) δD–salinity mixing line. Linear regression is indicated by a red line with a 95% confidence band.
An important element of Kongsfjorden hydrological cycling is the subsurface discharge of meltwater (Darlington, 2015). This study’s salinity profiles demonstrate that the freshwater input was limited to a depth of 15 m, while temperature suggests a cold water source at deeper depth of 15–30 m (Figure 2A). Water isotopes generally confirm freshwater effects at greater depths (Figure 2G). The missing salinity changes in the subglacial meltwater plume may be explained by the specific sampling location. The station was along the Kronebreen transect, which experiences less pronounced subglacial discharge effects compared with Kongsbreen (Torsvik et al., 2019). Furthermore, previous observations in Kronebreen have indicated an efficient drainage system on the north side of the glacier terminus (How et al., 2017), while our sampling location was limited to the south side of the Kronebreen terminus. In addition, studies have shown that the modification of a subsurface plume through mixing occurs close (within 2 km) of the glacier (MacLachlan et al., 2007; Torsvik et al., 2019). Apparently, salinity alone is not sensitive enough to detect contributions from subglacial meltwater.
4.2 Identifying isotopic signature of freshwater sources
The δ18O values were strongly correlated with salinity in the inner fjord samples (R2 = 0.88, n = 14, Figure 3C), with a slope of 0.54 and an intercept of –18.8 ± 1.9‰, which is consistent with the previously reported δ18O–salinity relationship in Kongsfjorden (δ18O = 0.54 × salinity – 18.42, Tiwari et al., 2018, Supplementary Figure S1). However, it was lower than the value (–14.3‰) reported by MacLachlan et al. (2007). Notably, the intercept of surface samples in our study (–14.6‰) is closely alined with MacLachlan et al. (2007).
The offset between the results of studies is likely caused by the depth of water sampling. In MacLachlan et al. (2007), the majority of samples (12 of 16) collected from the surface rather than throughout the water column. Therefore, their intercept of linear regression was mainly driven by the surface freshwater sources and the intercept of the surface samples was closely aligned with the δ18O observed in floating ice (–14.0‰). In contrast, the intercept of δ18O–salinity regression for all inner fjord samples indicated a freshwater source was depleted in δ18O compared with this study’s end-emebers as follows: floating ice (–14.0 ± 0.6‰), precipitation (–12.2 ± 0.3‰), and river water (–12.9‰) (Figure 4). Intriguingly, these results were in the range of previously reported δ18O values for glaciers and ice cores (between –15.7‰ and –26.5‰; Table 1, Isaksson et al., 2001; Watanabe et al., 2001; Isaksson et al., 2003; MacLachlan et al., 2007). Using the Arctic precipitation water line equation (Wetzel, 1990), the δD value for freshwater based on δ18O was estimated as –139.9‰, following δD = 7.68 × δ18O + 4.5.
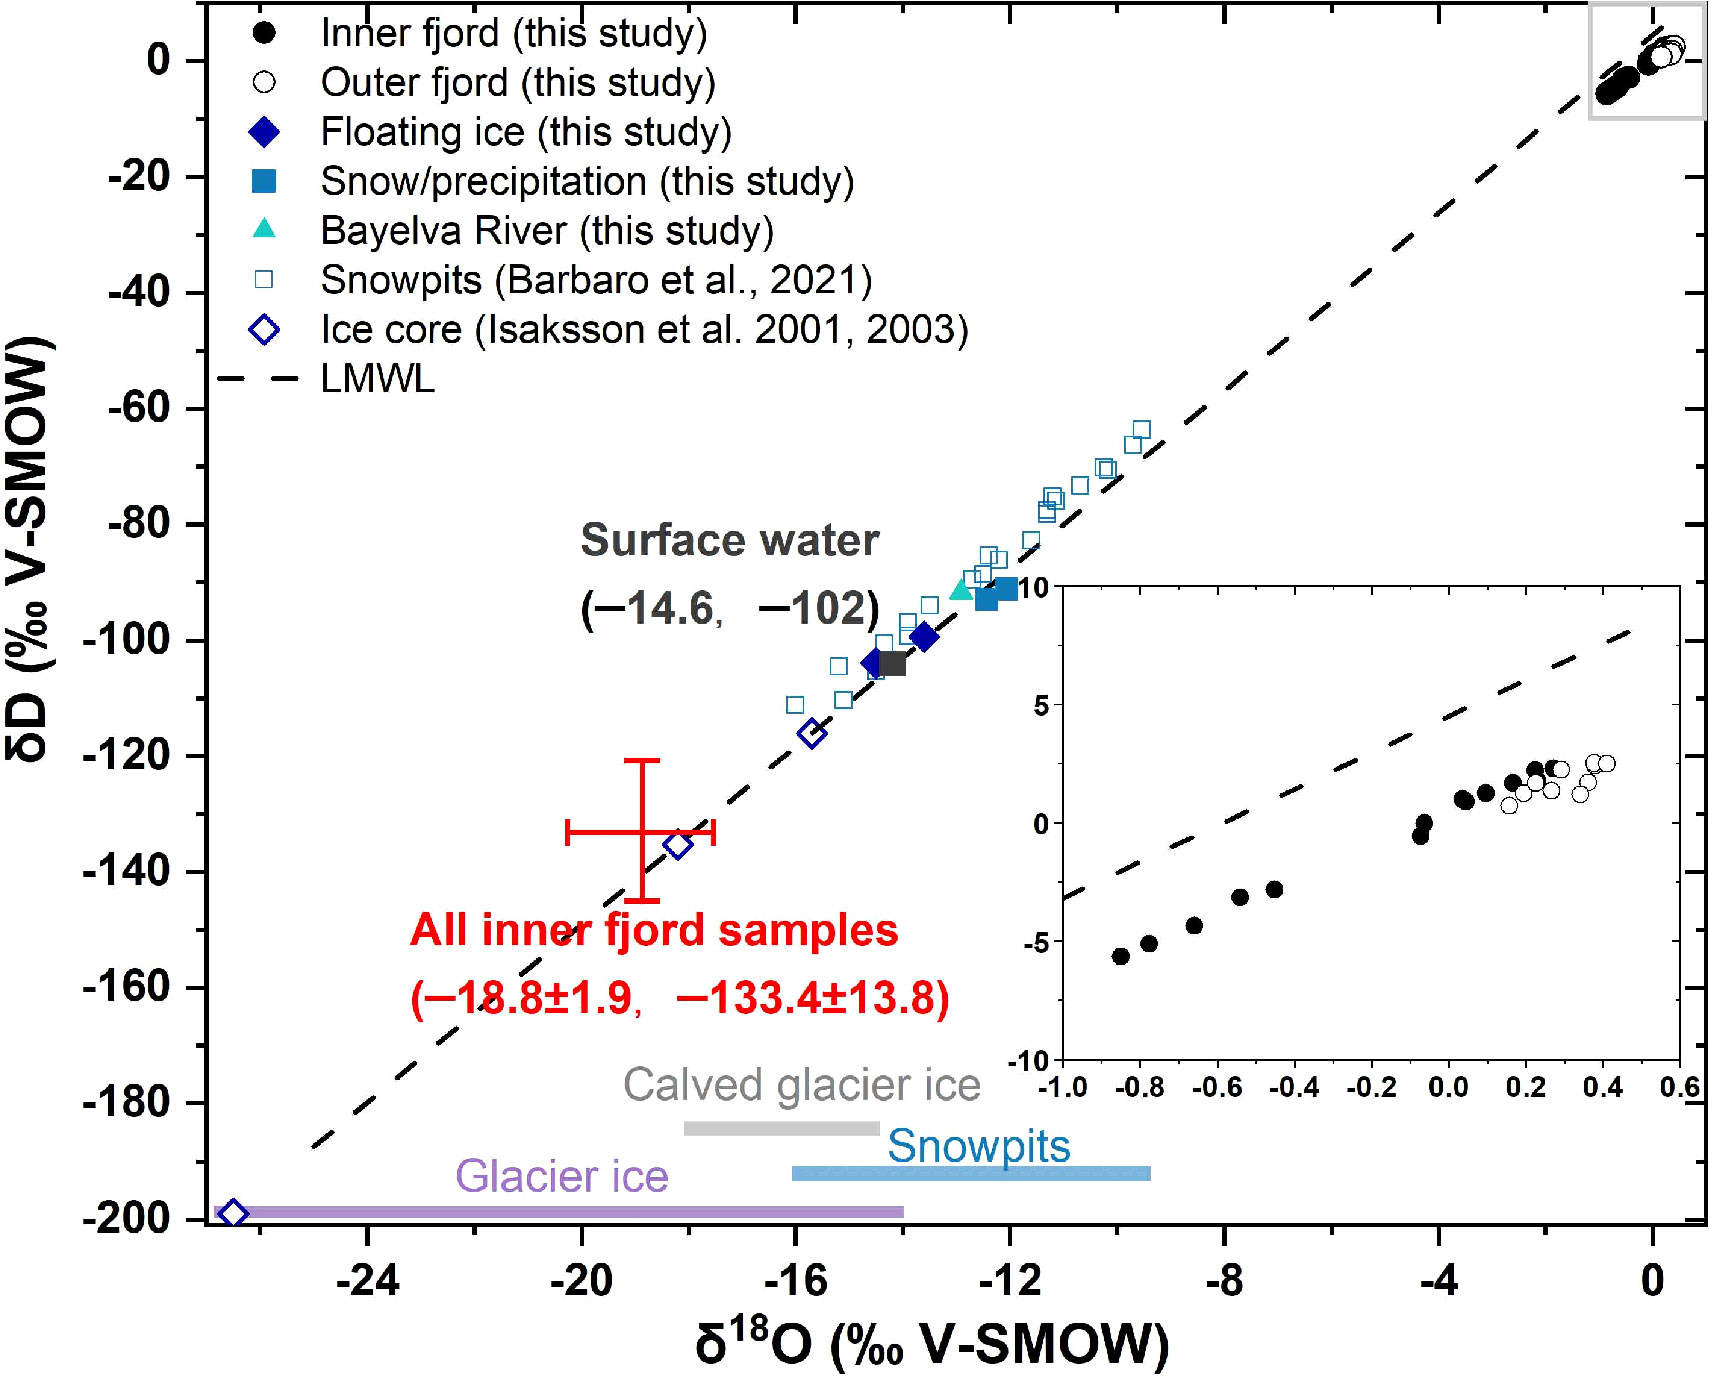
Figure 4. Distribution of the dual water isotope (δ18O and δD) values. The cross demonstrates the intercept of the δ18O–salinity and δD–salinity regressions. Snowpit sample values were taken from Barbaro et al. (2021), are indicated as open squares. Ice core sample values were obtained from Isaksson et al. (2001 and 2003), are shown as open diamonds. The δ18O values of calved glacier ice were obtained from MacLachlan et al. (2007). The inner and outer fjord samples are indicated with solid and open dots, respectively. The data shown for floating ice, snow and river samples are from this study.
Similarly, the δD is positively correlated with salinity (R2 = 0.88, n = 14, Figure 3D), featuring an intercept of –133.4 ± 13.8‰, which is close to the estimated value based on Arctic precipitation water (–139.9‰). In addition, this intercept was significantly lower than the intercept when considering the surface samples only (–102‰). All end-members did not fully cover the water isotope depleted sources, since a higher δD was observed in surface floating ice (–101.7‰), precipitation/snow (–92.0‰), and river water (–91.7‰) in Kongsfjorden (Table 1). The δD record from ice cores in Svalbard is limited, with only one value reported from the Lomonosovfonna ice core (average δD value of –116.1‰, Isaksson et al., 2001). Nevertheless, δD values of all the inner fjord water samples in this study confirmed the presence of freshwater sources with low isotope values in Kongsfjorden, probably subglacial meltwater.
For evaluating the freshwater distribution, we employed freshwater isotope signals from the linear regressions (δ18O and δD; –18.8 ± 1.9‰ and –133.4 ± 13.8‰, respectively). The estimations from the sample’s water isotopes and salinity results were tightly correlated (R2 = 0.88). However, the fractions obtained based on the salinity were generally slightly lower (a slope > 1; Supplementary Figure S2), possibly due to uncertainty of freshwater source that we implied. The freshwater distribution in Kongsfjorden was estimated by combining the δ18O, δD, and salinity values, and ranged between near 0% and 7% in the fjord. The averaged distribution of freshwater based on all indicators in the fjord is shown in Figure 2F, there was no obvious subglacial meltwater plume observed deeper than 15 m (see Section 4.1). Nevertheless, a detailed in-depth profile was constrained by the lack of a high-resolution water isotope dataset.
We hypothesized that the surface freshwater mainly originated from precipitation, river, glacier calving, and supraglacial runoff, while the subsurface freshwater is mainly from subglacial meltwater. Sampling for end-members was limited in this study. Therefore, previously reported water isotope values were adapted (Figure 4). Precipitation/snow samples vary with elevation and season, therefore, this study utilized the δ18O and δD values reported by Barbaro et al. (2021) for Svalbard snowpits (Barbaro et al., 2021). In our study, we barely distinguished between the precipitation and river water samples’ isotope values, indicating significant contribution of melting snow to river runoff. Furthermore, two surface floating ice samples had similar water isotope values (averaged of –14.0 ± 0.6‰ and –102 ± 3‰ for δ18O and δD, respectively), which aligned with previous reported calved ice samples from Kongsfjorden, varied from –18.0 to –14.6‰ (MacLachlan et al., 2007). These values may have been the result of mixing between glacier ice and seawater. For the subglacial meltwater, the δ18O values were obtained from previously reported Svalbard ice core values (Isaksson et al., 2001, 2003) and the δD values were calculated using the local precipitation water line equation (δD = 7.68×δ18O + 4.5, Wetzel, 1990).
The intercept of the δ18O–salinity and δD–salinity regression for all fjord samples (represented as a red cross) and only surface samples (grey square) were indicated on the Figure 4. Water isotope signal of freshwater throughout the water column is lower than the snowpit’s water isotope values but within the range of the glacier ice. In addition, the intercept of the δ18O–salinity and δD–salinity regression based on surface water is identical to that of the out floating ice samples. Since the calved ice originally containly similar water isotope values with glacier ice core, the enrichment in δ18O and δD from freshwater in surface is likely caused by other sources such as river discharge, precipitation, and melting snow. Although this study’s water isotope dataset did not record the subglacial meltwater directly, the estimated water isotopes of the freshwater sources confirmed that different freshwater sources contributed to Kongsfjorden.
Three end-member mixing model also implied to quantify the contribution of surface discharge and subglacial meltwater contribution (Method section 2.3). Mixing model indicates the subglacial meltwater contribute significantly to the Kongsfjorden freshwater (Figure 5) and the model estimated δ18O values of subglacial meltwater is ranged from –41.2 to –19.7‰ with a median of –21.2‰. These values are closely aligned with the previous reported ice core values (Figure 4, Table 1).
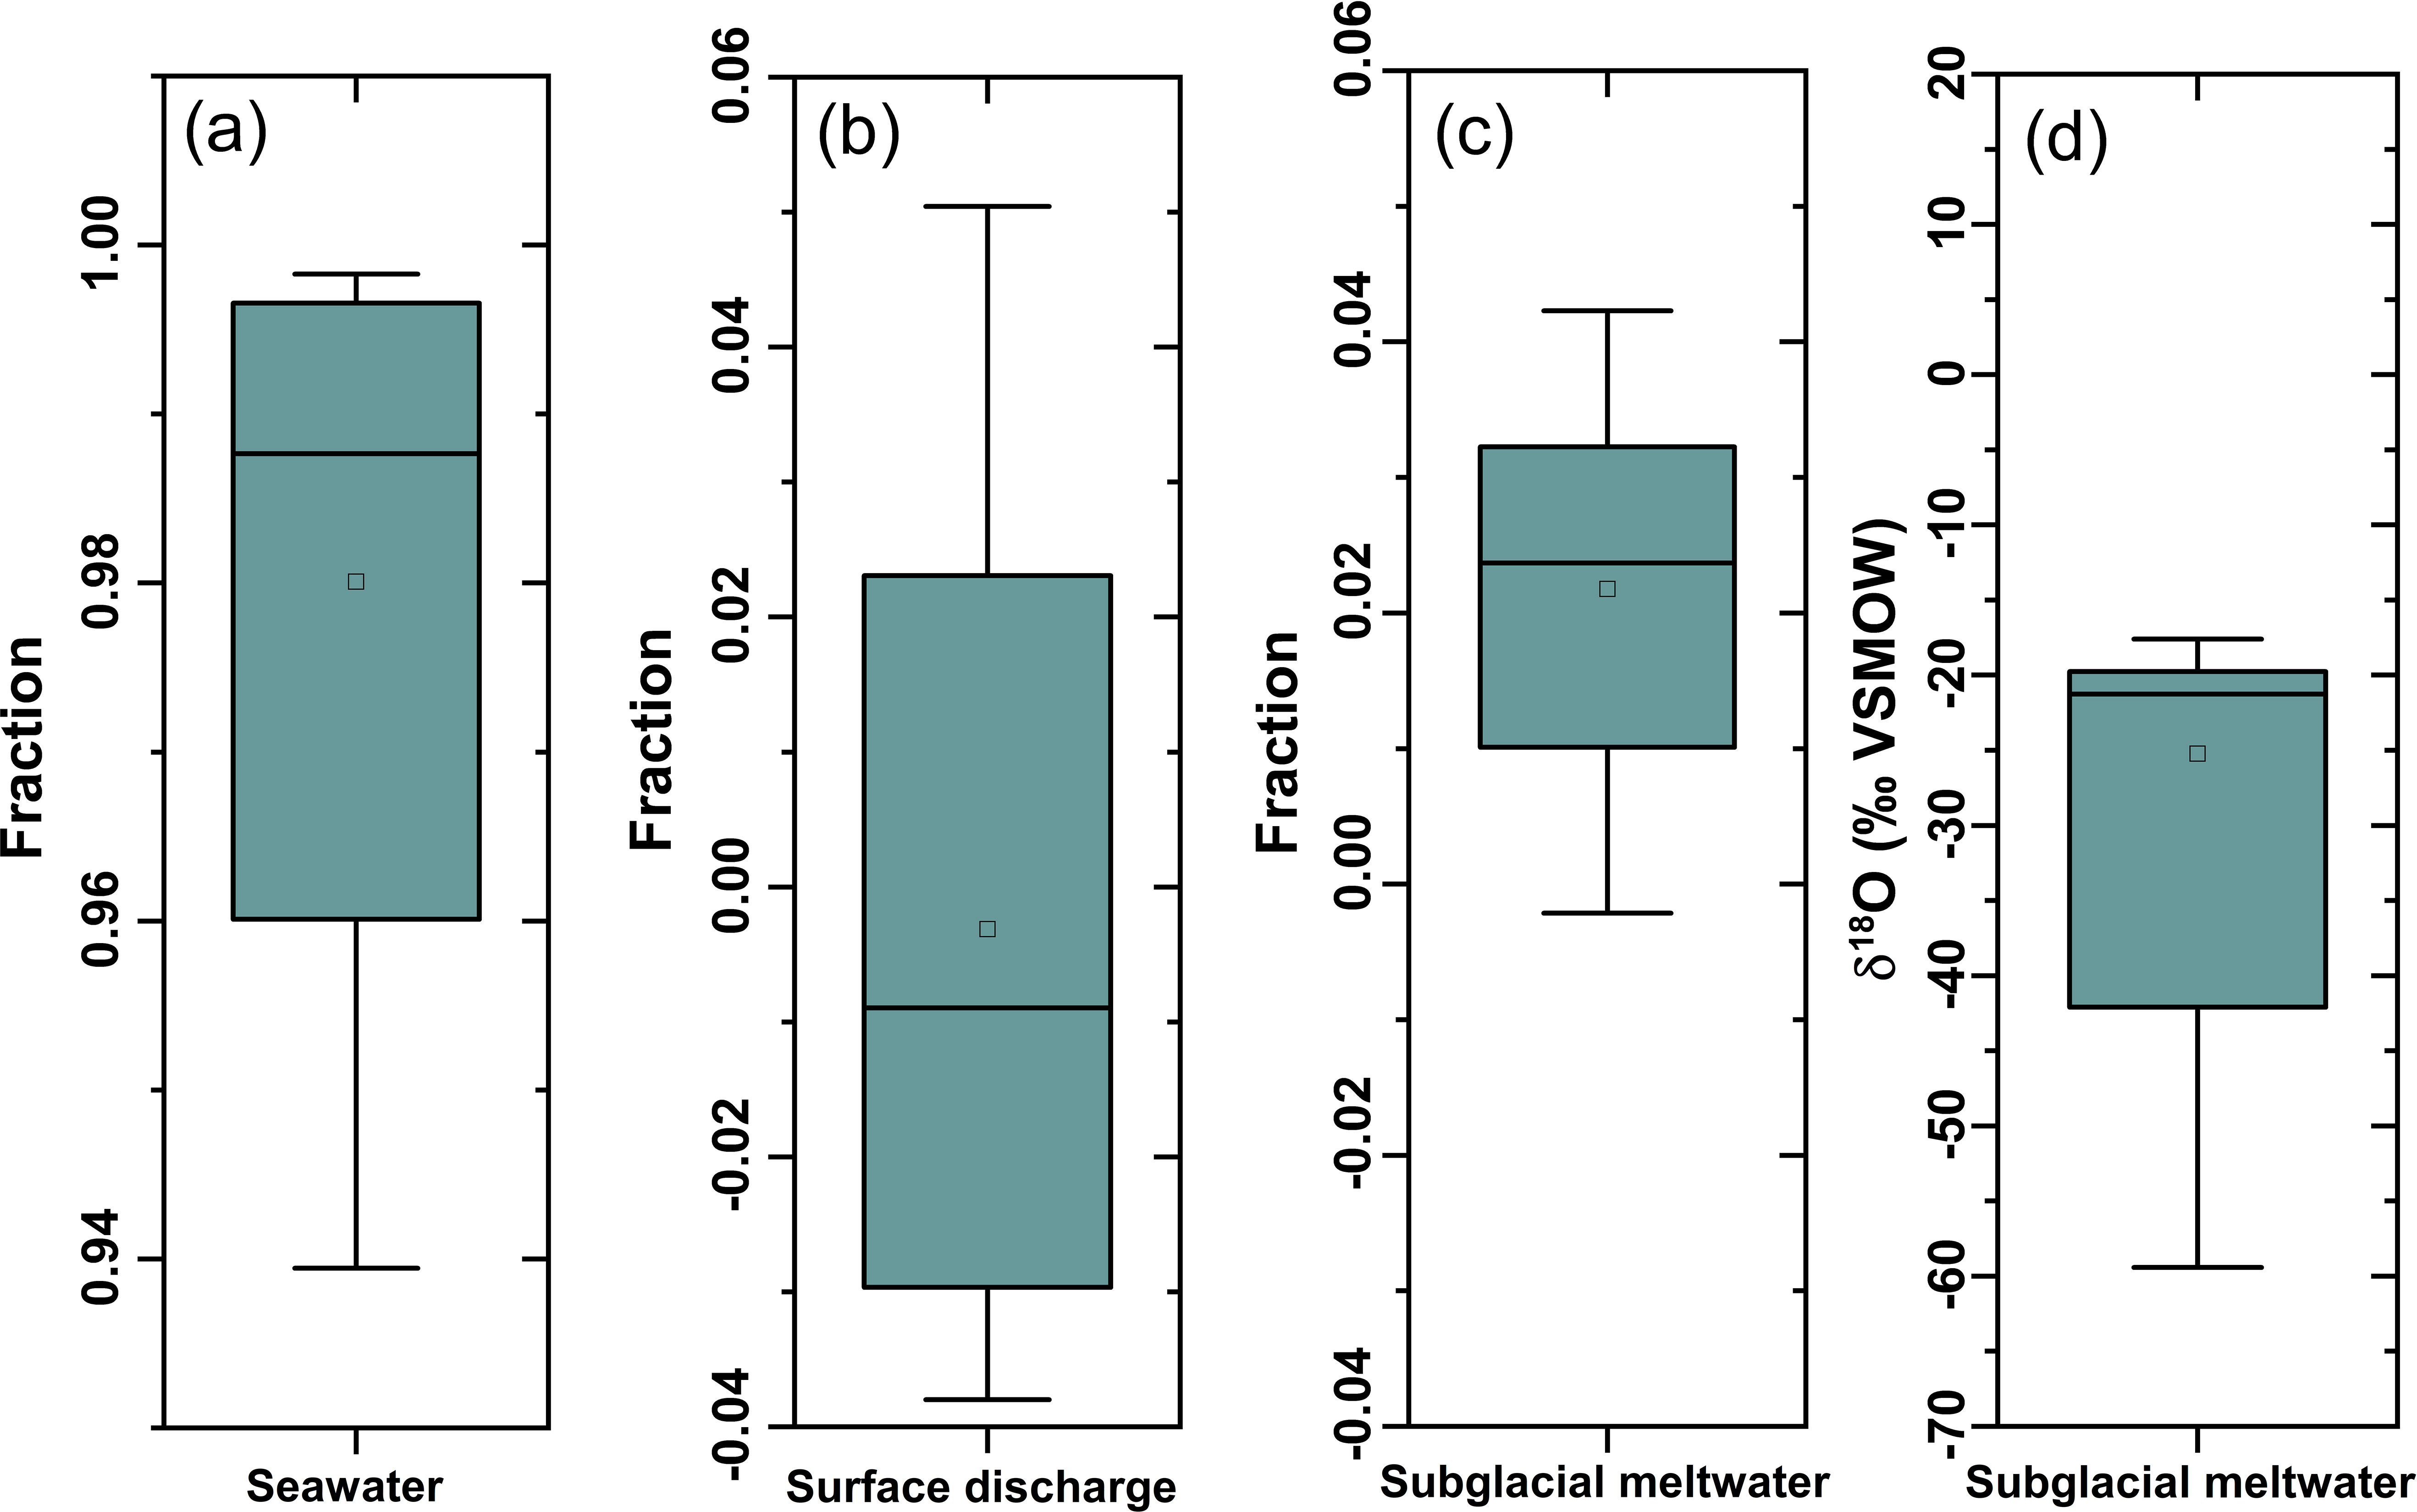
Figure 5. Mixing model results: Fraction of (A) seawater, (B) surface discharge, and (C) subglacial meltwater. (D) The model estimated δ18O of subglacial meltwater. Bars represent the 1-sigma range, with mean and median values indicated by the dot and line in the middle, respective. The error bar indicates the 2-sigma range.
4.3 Particles delivered by surface runoff and subglacial meltwater
Glacier discharge influences the availability of light and nutrients. The changes in turbidity with changes in temperature and salinity were plotted across all sampling stations (Figure 6); two distinctive particle sources, fresh and warm (~2°C) surface source and fresh and cold (<0°C) subsurface source, were identified (Figure 6A). Unfortunately, the water isotope analysis results did not aid in identifying the two distinct sources, possibly due to lack of samples (Figure 6B).
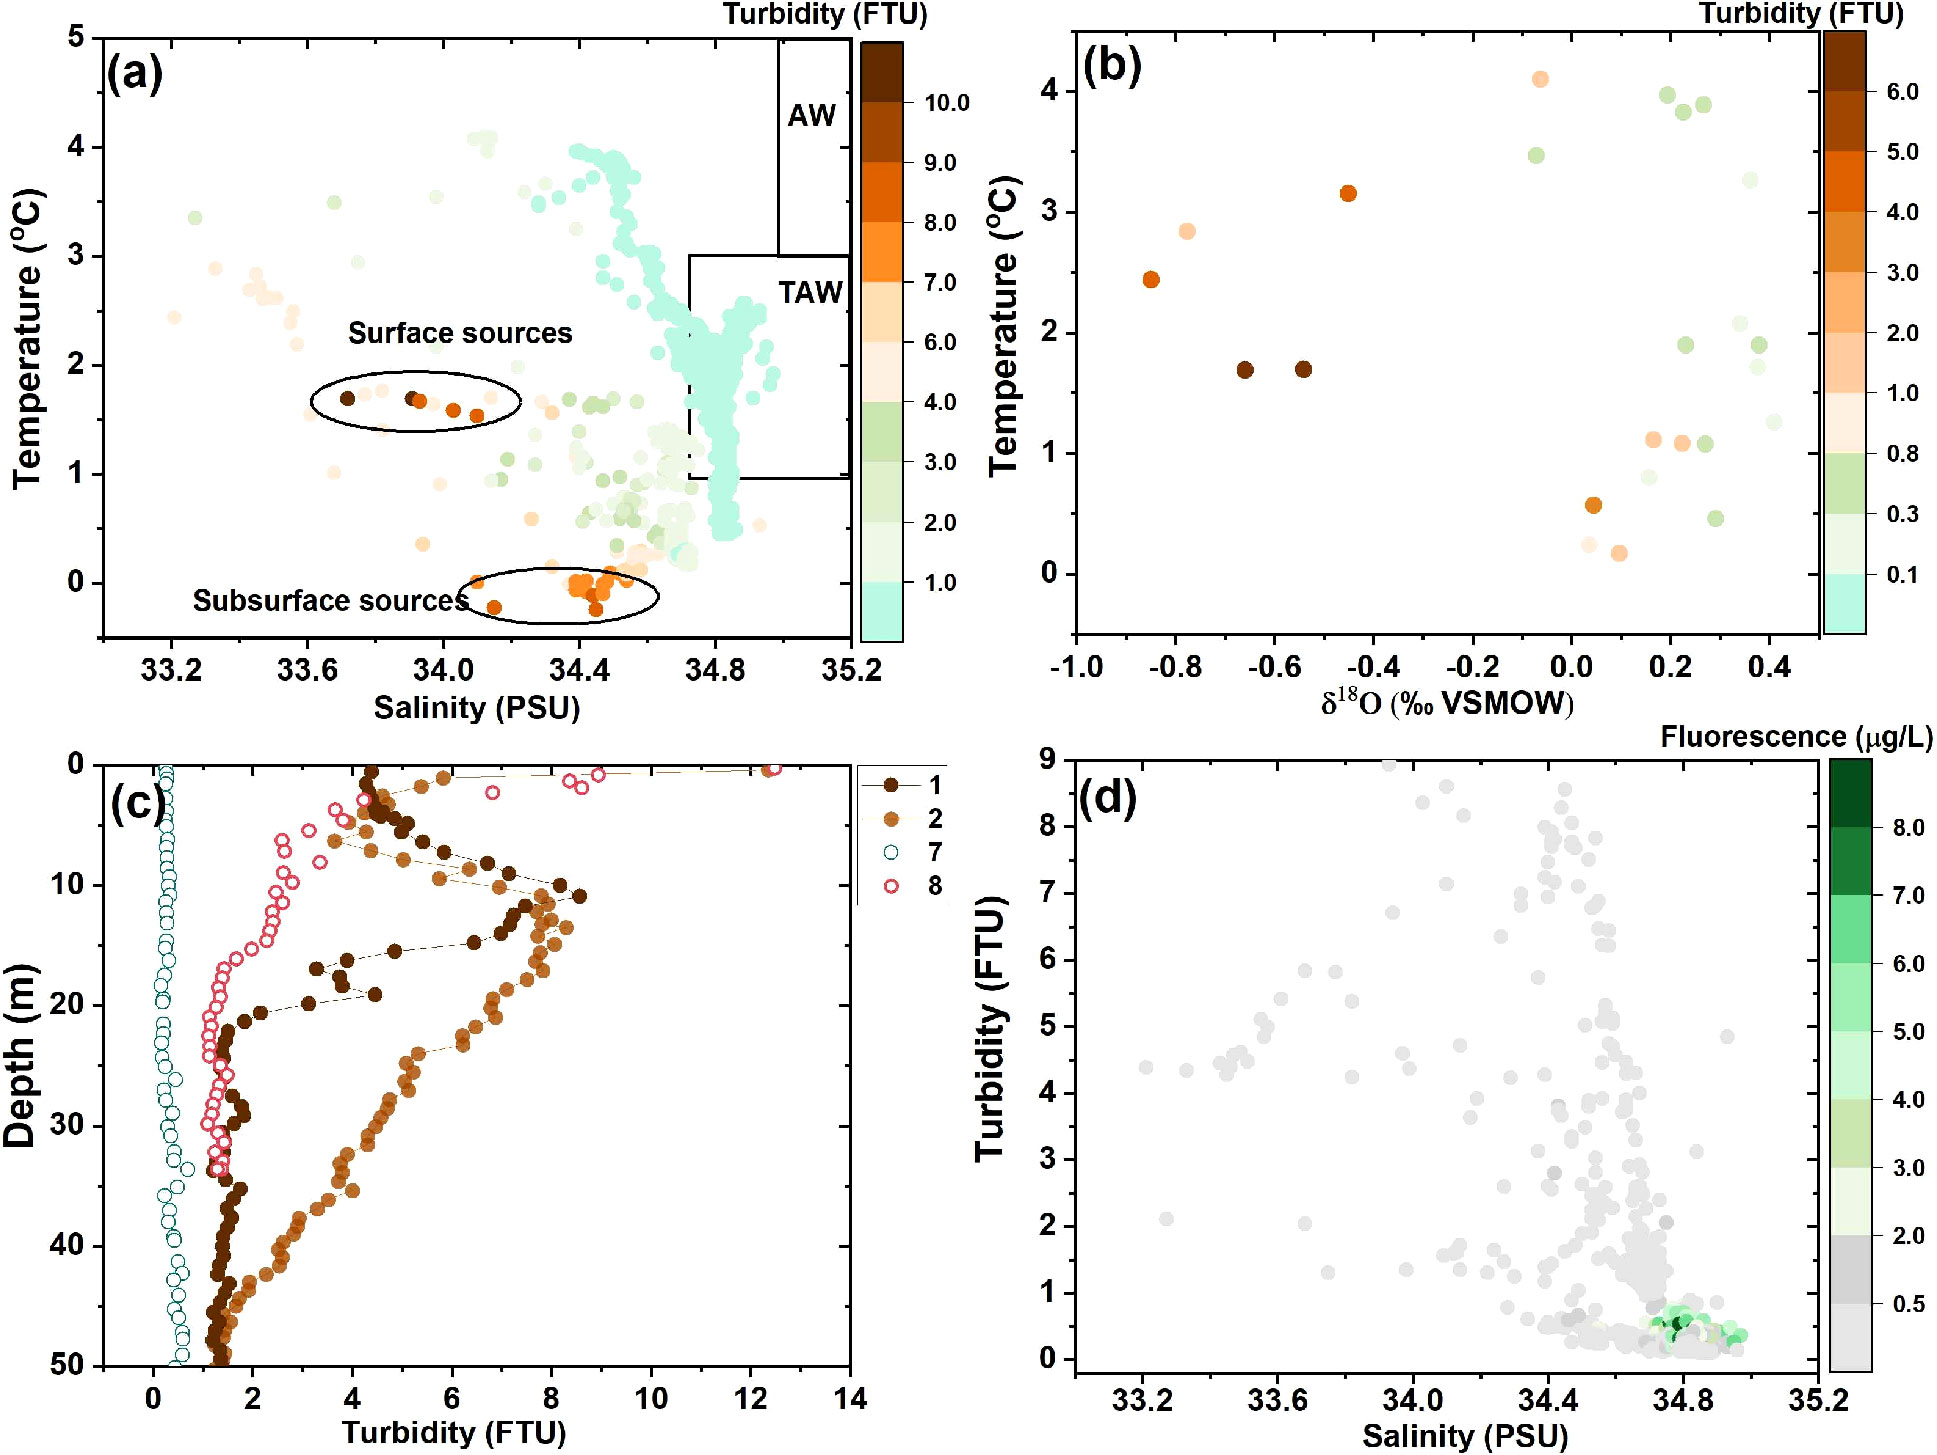
Figure 6. Variations in turbidity (Formazin Turbidity Units, FTU) with (A) temperature and salinity, and with (B) temperature and δ18O (‰) across all stations. (C) Variations in turbidity with depth (m); inner fjord (Stations 1 and 2), coastal (Station 8), outer fjord (Station 7). (D) Variations in fluorescence (μg/L) with turbidity and salinity across all stations.
According to Halbach et al. (2019), particles are carried by subglacial meltwater plumes and enetrate to deeper depths by fast deposition (Halbach et al., 2019). The turbidity confirms high particle loads in the subsurface water at the depth of 10–30 m in front of the glaciers (Figure 2F). In addition, a sharp surface particle increase was observed at Station 2 (Figure 6C). This could be the upwelled small particles from the meltwater plume. However, the higher particle load of the surface water observed at Station 2 was compared with that at Station 1 and indicated that other surface sources contributed to the particles at this site (Figure 6C). For coastal Station 8, laterally transported particles from the surface runoff were identified. This suggested that Station 2 was influenced by these two sources; the one near the surface lateral transported from the Station 8 and diffused particles from the subglacial meltwater plume in the subsurface water.
The low fluorescence values in front of the glaciers confirmed this light limitation was due to particles discharge (Halbach et al., 2019). Despite the high nutrient concentrations at the glacier front in Kongsfjorden (Halbach et al., 2019; Santos-Garcia et al., 2022), near zero inner Kongsfjorden fluorescence was attributed to the reduced light availability due to glacial discharge based on the turbidity (Figure 6D). Previous studies and our water isotope values demonstrated that subglacial meltwater is an important source of freshwater in Kongsfjorden (Everett et al., 2018). However, the released particles appeared to affect the biological production in front of the glaciers, which had nearly undetectable fluorescence. Our data suggested that the high particle load from the freshwater discharge hampered the biological production within the inner fjord. The highest biological production was observed in the outer fjord where the shelf water mixes with the inner fjord water; this finding agrees with the consistently elevated concentrations of dissolved organic carbon reported in these regions (Kim et al., 2022). The peak values of fluorescence in Kongsfjorden have been attributed to AW intrusion (Payne and Roesler, 2019). The higher biological productivity without the influence of the suspended particles in the outer fjord was demonstrated by using fluorescence.
In Greenlandic fjords, subglacial discharge from tidewater glaciers sustains high phytoplankton productivity (Meire et al., 2023). In contrast, fjords fed by land-terminating glaciers exhibit lower biological productivity compared with those nourished by tidewater glaciers. Therefore, the transition from tidewater glaciers to land-terminating glaciers excepted has negative impact to the biological productivity. Kongsfjorden northern flank was dominated by tidewater glaciers, while the southern flank was affected by surface runoff. This study reveals mixing freshwater sources for the Kongsfjorden. In addition, the results demonstrated that the subglacial discharge was enriched with fine particles, which limited light availability as well (Figure 7).
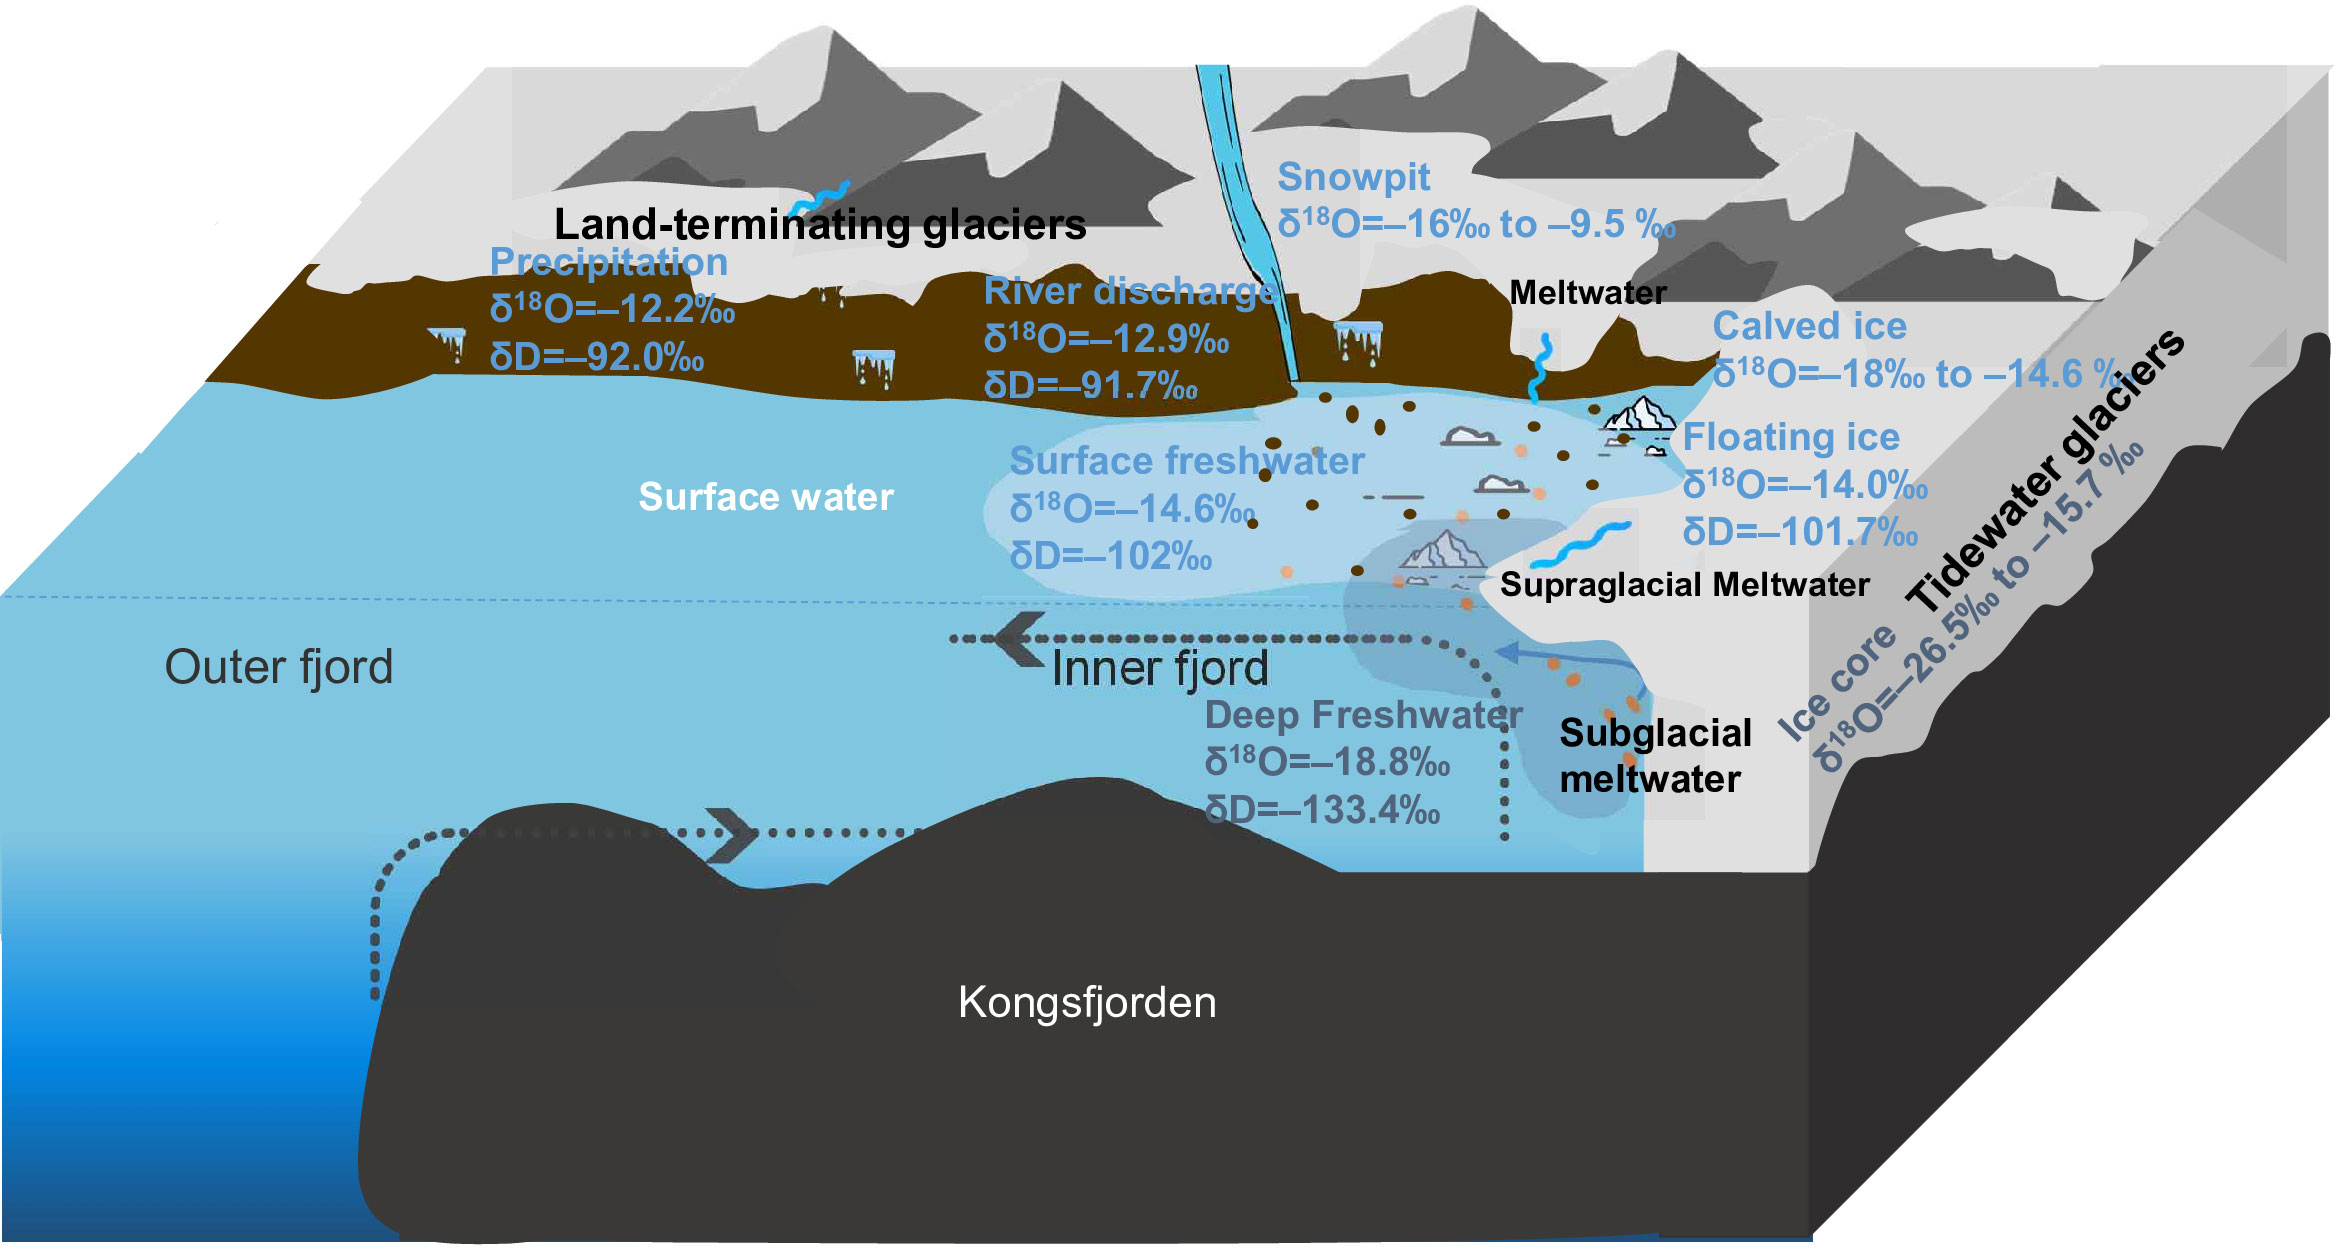
Figure 7. Schematic graph illustrating different sources contribution to freshwater and particles in the fjord. Snowpit sample values were taken from Barbaro et al. (2021). Ice core sample values were obtained from Isaksson et al. (2001 and 2003) and calved ice samples values from MacLachlan et al. (2007).
While subglacial meltwater predominated the freshwater supply in Kongsfjorden during our sampling time, the substantial presence of particles restricted the biological production within the inner fjord because of reduced light availability. Similarly, the turbidity profiles revealed two sources of particulate matter within the fjord: surface particles transported laterally and fine sediments originating from subglacial discharge, that exerted an influence on the biological productivity within the inner fjord. Overcoming these knowledge gaps, future investigations will aim to enhance the knowledge of the roles played by surface glacier calving and subglacial meltwater by determining high-resolution water isotope profiles throughout the year.
5 Conclusion
Kongsfjorden, Svalbard is a suitable region for studying the impacts of climate change on water mass mixing in fjord systems and subsequent ecosystem dynamics. Dual water isotopes and temperature–salinity profiles were used to distinguish between freshwater sources in surface and deep waters. Turbidity profiles confirmed variations in particle discharge from surface runoff and subglacial discharge. Freshwater distribution in Kongsfjorden was estimated between 0% and 7%, with a three end-member mixing model indicating that subglacial meltwater is a significant freshwater source. This study emphasized the effectiveness of water isotope analysis in understanding the fjord’s hydrological processes and its potential for studying the influence of meltwater on Arctic biological processes. This method has potential for further investigating the effects of meltwater on biological processes in the Arctic, highlighting broader implications of climate change on these ecosystems.
Data availability statement
The datasets presented in this study can be found in online repositories. The names of the repository/repositories and accession number(s) can be found in the article/Supplementary Material.
Author contributions
LF: Methodology, Writing – original draft. EY: Funding acquisition, Supervision, Writing – review & editing. JY: Data curation, Methodology, Writing – original draft. MK: Conceptualization, Project administration, Supervision, Writing – review & editing.
Funding
The author(s) declare financial support was received for the research, authorship, and/or publication of this article. The research was supported by the Korea Polar Research Institute (KOPRI) grant funded by the Ministry of Oceans and Fisheries (KOPRI PE24900). FL was supported by the National Natural Science Foundation of China (Grant No. 41971088) and the Shaanxi Nature Science Research Fund (Grant No. 2022JQ-246). MK was partly supported by the Global-Learning & Academic research institution for Master’s·PhD students, and Postdocs (LAMP) Program of the National Research Foundation of Korea (NRF) grant funded by the Ministry of Education (No. RS-2023-00301914).
Acknowledgments
The authors thank the Kings Bay Marine Laboratory staff for their assistance, and the captain of the MS Teisten and Sunmin Oh for helping with the water sampling. Water isotope analyses were supported by Huan Zhang from the Department of Urban and Environmental Sciences, Northwest University, China. The authors declare no conflicts of interest relevant to this study. We also would like to thank the reviewers for their comments and construction suggestions.
Conflict of interest
The authors declare that the research was conducted in the absence of any commercial or financial relationships that could be construed as a potential conflict of interest.
Publisher’s note
All claims expressed in this article are solely those of the authors and do not necessarily represent those of their affiliated organizations, or those of the publisher, the editors and the reviewers. Any product that may be evaluated in this article, or claim that may be made by its manufacturer, is not guaranteed or endorsed by the publisher.
Supplementary material
The Supplementary Material for this article can be found online at: https://www.frontiersin.org/articles/10.3389/fmars.2024.1426793/full#supplementary-material
References
Aagaard K., Carmack E. C. (1989). The role of sea ice and other fresh water in the Arctic circulation. J. Geophysical Research: Oceans 94, 14485–14498. doi: 10.1029/JC094iC10p14485
Barbaro E., Koziol K., Björkman M. P., Vega C. P., Zdanowicz C., Gallet J.-C., et al. (2021). Measurement report: Spatial variations in snowpack ionic chemistry and water stable isotopes across Svalbard. Atmospheric Chem. Phys. 21, 3163–3180. doi: 10.5194/acp-21-3163-2021
Bigg G. R., Rohling E. J. (2000). An oxygen isotope data set for marine waters. J. Geophysical Research: Oceans 105, 8527–8535. doi: 10.1029/2000JC900005
Brogi S. R., Jung J. Y., Ha S.-Y., Hur J. (2019). Seasonal differences in dissolved organic matter properties and sources in an Arctic fjord: Implications for future conditions. Sci. total Environ. 694, 133740. doi: 10.1016/j.scitotenv.2019.133740
Calleja M. L., Kerhervé P., Bourgeois S., Kędra M., Leynaert A., Devred E., et al. (2017). Effects of increase glacier discharge on phytoplankton bloom dynamics and pelagic geochemistry in a high Arctic fjord. Prog. Oceanography 159, 195–210. doi: 10.1016/j.pocean.2017.07.005
Cottier F., Nilsen F., Skogseth R., Tverberg V., Skarðhamar J., Svendsen H. (2010). Arctic fjords: a review of the oceanographic environment and dominant physical processes. Geological Society London Special Publications 344, 35–50. doi: 10.1144/SP344.4
Cottier F., Tverberg V., Inall M., Svendsen H., Nilsen F., Griffiths C. (2005). Water mass modification in an Arctic fjord through cross-shelf exchange: The seasonal hydrography of Kongsfjorden, Svalbard. J. Geophysical Research: Oceans 110. doi: 10.1029/2004JC002757
Craig H., Gordon L. I. (1965). Deuterium and oxygen 18 variations in the ocean and the marine atmosphere. Ed. Tongiorgi E. (Pisa, Italy: Laboratorio di Geologica Nucleare).
Dansgaard W. (1964). Stable isotopes in precipitation. tellus 16, 436–468. doi: 10.1111/j.2153-3490.1964.tb00181.x
Darlington E. F. (2015). Meltwater Delivery from the Tidewater Glacier Kronebreen to Kongsfjorden, Svalbard: Insights from In-situ and Remote-sensing Analyses of Sediment Plumes. Leicestershire, England: Loughborough University.
Everett A., Kohler J., Sundfjord A., Kovacs K. M., Torsvik T., Pramanik A., et al. (2018). Subglacial discharge plume behaviour revealed by CTD-instrumented ringed seals. Sci. Rep. 8, 13467. doi: 10.1038/s41598-018-31875-8
Halbach L., Vihtakari M., Duarte P., Everett A., Granskog M. A., Hop H., et al. (2019). Tidewater glaciers and bedrock characteristics control the phytoplankton growth environment in a fjord in the Arctic. Front. Mar. Sci. 6, 254. doi: 10.3389/fmars.2019.00254
Hanssen-Bauer I., Førland E., Hisdal H., Mayer S., Sandø A. B., Sorteberg A. (2019). Climate in svalbard 2100.A knowledge base for climate adaptation. The Norwegian Centre for Climate Services, 470. Available online at: https://www.miljodirektoratet.no/globalassets/publikasjoner/M1242/M1242.pdf.
Hop H., Wold A., Vihtakari M., Daase M., Kwasniewski S., Gluchowska M., et al. (2019). “Zooplankton in kongsfjorden, (1996–2016) in relation to climate change,” in The Ecosystem of Kongsfjorden, Svalbard. Eds. Hop H., Wiencke C. (Springer International Publishing, Cham), 229–300.
How P., Benn D. I., Hulton N. R., Hubbard B., Luckman A., Sevestre H., et al. (2017). Rapidly changing subglacial hydrological pathways at a tidewater glacier revealed through simultaneous observations of water pressure, supraglacial lakes, meltwater plumes and surface velocities. Cryosphere 11, 2691–2710. doi: 10.5194/tc-11-2691-2017
Isaksson E., Hermanson M., Hicks S., Igarashi M., Kamiyama K., Moore J., et al. (2003). Ice cores from Svalbard—-useful archives of past climate and pollution history. Phys. Chem. Earth Parts A/b/c 28, 1217–1228. doi: 10.1016/j.pce.2003.08.053
Isaksson E., Pohjola V., Jauhiainen T., Moore J., Pinglot J. F., Vaikmäe R., et al. (2001). A new ice-core record from Lomonosovfonna, Svalbard: viewing the 1920–97 data in relation to present climate and environmental conditions. J. Glaciology 47, 335–345. doi: 10.3189/172756501781832313
Ito H., Kudoh S. (1997). Characteristics of water in Kongsfjordenen, Svalbard. Proc. NIPR Symp. Polar Meteorol. Glaciol. 11, 211–232.
Kim J., Kwon S. Y., Kim K., Han S. (2022). Import, export, and speciation of mercury in Kongsfjorden, Svalbard: Influences of glacier melt and river discharge. Mar. Pollut. Bull. 179, 113693. doi: 10.1016/j.marpolbul.2022.113693
Lao Q., Zhang S., Li Z., Chen F., Zhou X., Jin G., et al. (2022). Quantification of the seasonal intrusion of water masses and their impact on nutrients in the Beibu Gulf using dual water isotopes. J. Geophysical Research: Oceans 127, e2021JC018065. doi: 10.1029/2021JC018065
MacLachlan S. E., Cottier F. R., Austin W. E., Howe J. A. (2007). The salinity: δ18O water relationship in Kongsfjorden, western Spitsbergen. Polar Res. 26, 160–167. doi: 10.1111/j.1751-8369.2007.00016.x
Mankoff K. D., Straneo F., Cenedese C., Das S. B., Richards C. G., Singh H. (2016). Structure and dynamics of a subglacial discharge plume in a G reenlandic fjord. J. Geophys. Res. Oceans. 121, 8670–8688.
McGovern M., Borgå K., Heimstad E., Ruus A., Christensen G., Evenset A. (2022). Small Arctic rivers transport legacy contaminants from thawing catchments to coastal areas in Kongsfjorden, Svalbard. Environ. pollut. 304, 119191. doi: 10.1016/j.envpol.2022.119191
Meire L., Paulsen M. L., Meire P., Rysgaard S., Hopwood M. J., Sejr M. K., et al. (2023). Glacier retreat alters downstream fjord ecosystem structure and function in Greenland. Nat. Geosci. 16, 671–674. doi: 10.1038/s41561-023-01218-y
Østby T. I., Schuler T. V., Hagen J. O., Hock R., Kohler J., Reijmer C. H. (2017). Diagnosing the decline in climatic mass balance of glaciers in Svalbard over 1957–2014. Cryosphere 11, 191–215. doi: 10.5194/tc-11-191-2017
Payne C. M., Roesler C. S. (2019). Characterizing the influence of Atlantic water intrusion on water mass formation and phytoplankton distribution in Kongsfjorden, Svalbard. Continental Shelf Res. 191, 104005. doi: 10.1016/j.csr.2019.104005
Promińska A., Cisek M., Walczowski W. (2017). Kongsfjorden and Hornsund hydrography–comparative study based on a multiyear survey in fjords of west Spitsbergen. Oceanologia 59, 397–412. doi: 10.1016/j.oceano.2017.07.003
Rantanen M., Karpechko A. Y., Lipponen A., Nordling K., Hyvärinen O., Ruosteenoja K., et al. (2022). The Arctic has warmed nearly four times faster than the globe since 1979. Commun. Earth Environ. 3, 168. doi: 10.1038/s43247-022-00498-3
Richards L. A., Magnone D., Boyce A. J., Casanueva-Marenco M. J., van Dongen B. E., Ballentine C. J., et al. (2018). Delineating sources of groundwater recharge in an arsenic-affected Holocene aquifer in Cambodia using stable isotope-based mixing models. J. Hydrology 557, 321–334. doi: 10.1016/j.jhydrol.2017.12.012
Rohling E. J. (2007). Progress in paleosalinity: Overview and presentation of a new approach. Paleoceanography 22. doi: 10.1029/2007PA001437
Rohling E. J. (2013). “Oxygen isotope composition of seawater,” in The Encyclopedia of Quaternary Science, vol. 2. (Elsevier, Amsterdam), 915–922.
Santos-Garcia M., Ganeshram R. S., Tuerena R. E., Debyser M. C., Husum K., Assmy P., et al. (2022). Nitrate isotope investigations reveal future impacts of climate change on nitrogen inputs and cycling in Arctic fjords: Kongsfjorden and Rijpfjorden (Svalbard). Biogeosciences 19, 5973–6002. doi: 10.5194/bg-19-5973-2022
Spolaor A., Scoto F., Larose C., Barbaro E., Burgay F., Bjorkman M. P., et al. (2024). Climate change is rapidly deteriorating the climatic signal in Svalbard glaciers. Cryosphere 18, 307–320. doi: 10.5194/tc-18-307-2024
Svendsen H., Beszczynska-Møller A., Hagen J. O., Lefauconnier B., Tverberg V., Gerland S., et al. (2002). The physical environment of Kongsfjorden–Krossfjorden, an Arctic fjord system in Svalbard. Polar Res. 21, 133–166. doi: 10.3402/polar.v21i1.6479
Tang C. C., Ross C. K., Yao T., Petrie B., DeTracey B. M., Dunlap E. (2004). The circulation, water masses and sea-ice of Baffin Bay. Prog. Oceanography 63, 183–228. doi: 10.1016/j.pocean.2004.09.005
Tiwari M., Nagoji S. S., Anilkumar N., Rajan S. (2015). Oxygen isotope distribution at shallow to intermediate depths across different fronts of the Southern Ocean: Signatures of a warm-core eddy. Deep Sea Res. Part II: Topical Stud. Oceanography 118, 170–176. doi: 10.1016/j.dsr2.2015.04.022
Tiwari M., Nagoji S., Kumar V., Tripathi S., Behera P. (2018). Oxygen isotope-salinity relation in an Arctic fjord (Kongsfjorden): Implications to hydrographic variability. Geosci. Front. 9, 1937–1943. doi: 10.1016/j.gsf.2017.12.007
Torsvik T., Albretsen J., Sundfjord A., Kohler J., Sandvik A. D., Skarðhamar J., et al. (2019). Impact of tidewater glacier retreat on the fjord system: Modeling present and future circulation in Kongsfjorden, Svalbard. Estuarine Coast. Shelf Sci. 220, 152–165. doi: 10.1016/j.ecss.2019.02.005
Tverberg V., Skogseth R., Cottier F., Sundfjord A., Walczowski W., Inall M. E., et al. (2019). “The Kongsfjorden transect: seasonal and inter-annual variability in hydrography,” in The Ecosystem of Kongsfjorden, Svalbard, vol. 2 . Eds. Hop H., Wiencke C. (New York, United States: Springer), 49–104.
Uemura R., Matsui Y., Yoshimura K., Motoyama H., Yoshida N. (2008). Evidence of deuterium excess in water vapor as an indicator of ocean surface conditions. J. Geophysical Research: Atmospheres 113. doi: 10.1029/2008JD010209
Vonnahme T. R., Nowak A., Hopwood M. J., Meire L., Søgaard D. H., Krawczyk D., et al. (2023). Impact of winter freshwater from tidewater glaciers on fjords in Svalbard and Greenland; A review. Prog. Oceanography 219, 103144. doi: 10.1016/j.pocean.2023.103144
Watanabe O., Motoyama H., Igarashi M., Kamiyama K., Matoba S., Goto-Azuma K., et al. (2001). Studies on climatic and environmental changes during the last few hundred years using ice cores from various sites in Nordaustlandet, Svalbard. Memoirs of National Institute of Polar Research. Special Issue, 54, 227–242. Available online at: http://id.nii.ac.jp/1291/00002378/.
Wetzel K. (1990). Isotopic peculiarities of meteoric water in polar regions. Isotopenpraxis Isotopes Environ. Health Stud. 26, 11–13. doi: 10.1080/10256019008624211
White D., Hinzman L., Alessa L., Cassano J., Chambers M., Falkner K., et al. (2007). The arctic freshwater system: Changes and impacts. J. geophysical research: Biogeosciences 112. doi: 10.1029/2006JG000353
Yang Q., Dixon T. H., Myers P. G., Bonin J., Chambers D., Van Den Broeke M., et al. (2016). Recent increases in Arctic freshwater flux affects Labrador Sea convection and Atlantic overturning circulation. Nat. Commun. 7, 10525. doi: 10.1038/ncomms10525
Keywords: stable water isotopes, meltwater, turbidity, terrestrial particle discharge, Arctic fjord, Kongsfjorden
Citation: Fang L, Yang EJ, Yoo J and Kim M (2024) Tracing freshwater sources and particle discharge in Kongsfjorden: insights from a water isotope approach. Front. Mar. Sci. 11:1426793. doi: 10.3389/fmars.2024.1426793
Received: 02 May 2024; Accepted: 16 October 2024;
Published: 04 November 2024.
Edited by:
Manuel Dall´Osto, Spanish National Research Council (CSIC), SpainReviewed by:
Daiki Nomura, Hokkaido University, JapanHaiyan Jin, Ministry of Natural Resources, China
Copyright © 2024 Fang, Yang, Yoo and Kim. This is an open-access article distributed under the terms of the Creative Commons Attribution License (CC BY). The use, distribution or reproduction in other forums is permitted, provided the original author(s) and the copyright owner(s) are credited and that the original publication in this journal is cited, in accordance with accepted academic practice. No use, distribution or reproduction is permitted which does not comply with these terms.
*Correspondence: Minkyoung Kim, bWlua3lvdW5nQGtudS5hYy5rcg==