 Alejandra Mora-Soto1*
 Sarah Schroeder1
 Lianna Gendall1,2
 Alena Wachmann1
 Gita Narayan3
 Silven Read1Isobel Pearsall4
 Emily Rubidge5Joanne Lessard6Kathryn Martell7
 Maycira Costa1*
- 1Spectral Lab, Department of Geography, University of Victoria, Victoria, BC, Canada
- 2School of Biological Sciences and Oceans Institute, University of Western Australia, Perth, WA, Australia
- 3Fisheries and Aquaculture Department, Vancouver Island University, Nanaimo, BC, Canada
- 4Marine Science Program, Pacific Salmon Foundation, Vancouver, BC, Canada
- 5Institute of Ocean Sciences, Fisheries and Oceans Canada, Sidney, BC, Canada
- 6Pacific Biological Station, Fisheries and Oceans Canada, Nanaimo, BC, Canada
- 7Islands Trust Conservancy, Victoria, BC, Canada
The Salish Sea, a dynamic system of straits, fjords, and channels in southwestern British Columbia, is home to ecologically and culturally important bull kelp (Nereocystis luetkeana) forests. Yet the long-term fluctuations in the area and the persistence of this pivotal coastal marine habitat are unknown. Using very high-resolution satellite imagery to map kelp forests over two decades, we present the spatial changes in kelp forest area within the Salish Sea, before (2002 to 2013) and after (2014 to 2022) the ‘Blob,’ an anomalously warm period in the Northeast Pacific. This analysis was spatially constrained by local environmental conditions. Based on nearshore sea surface temperatures (SSTs) from four decades (1984–2022), we found two periods of distinct increases in SST, one starting in 2000 and another in 2014. Further, the highest SST anomalies occurred on warmer coastlines in the enclosed inlets and the Strait of Georgia, while smaller anomalies were found on colder coastlines near the Strait of Juan de Fuca and the Discovery Passage. The total area of bull kelp forests from 2014 to 2022 has decreased compared to 2002 to 2013, particularly in the northern sector of the Salish Sea. Using the satellite-derived kelp data, we also present an analysis of kelp persistence compared with historical distribution of kelp forests depicted on British Admiralty Nautical Charts from 1858 to 1956. This analysis shows that warm, sheltered areas experienced a considerable decrease in persistence of kelp beds when compared to satellite-derived distribution of modern kelp, confirming a century-scale loss. In particular, the presence of kelp forests in the Strait of Georgia and on the warmest coasts has decreased considerably over the century, likely due to warming temperatures. While the coldest coasts to the south have maintained their centennial persistence, the northern Salish Sea requires further research to understand its current dynamics. This research contributes to a wider understanding of temporal and spatial factors for kelp from the regional perspective of the Salish Sea.
1 Introduction
In natural history, persistence is understood as a population or species that did not become locally extinct during a given period of time, or if it did, it recolonized the area within certain reference bounds (Connell and Sousa, 1983). This definition recognizes the inherent variability of ecosystems in the real world, which can be particularly extreme in marine environments (Dayton et al., 1998). Abiotic factors such as patch size, rocky substrate, or wave velocity can increase the overall persistence of foundation species like kelp forests (Young et al., 2016). However, the lack of long-term, continuous surveys may underestimate the roles that biological and physical interactions plus anthropogenic impacts have exerted on them (Dayton et al., 1998). Paleoecological, archaeological, and historical proxies can provide some clues about kelp forest presence in the past (Jackson et al., 2001), allowing for the creation of accurate baselines of ecological persistence and informed perspectives toward effective management and conservation of this crucial habitat.
Monitoring kelp forests is becoming crucial for several reasons, such as their role as habitats for a multiplicity of organisms, including some of economic importance like salmon (Shaffer, 2003). They also play an important role in atmospheric carbon removal and sequestration (Pedersen et al., 2021) and have critical value to local and indigenous communities (Turner, 2001; United Nations Environment Programme, 2023; Wernberg et al., 2019), among other existential values (United Nations Environment Programme, 2023). Therefore, monitoring efforts have been conducted to estimate their trends globally (Krumhansl et al., 2016) and, specifically in British Columbia, kelps are conservation priorities for informing the development of a regional marine protected area (MPA) network (Gale et al., 2019; MPA Network BC Northern Shelf Initiative, 2023), currently under development.
In order to create a kelp monitoring framework, it is important to define the spatial and temporal bounds of the targeted kelp habitat. For example, choosing to study when kelp forests changed from a non-intervened starting point is challenging to achieve since the coast has seen continuous human occupation for more than 20,000 years in the North American Pacific region (Erlandson et al., 2007). However, there is an overall consensus that during the industrial era, several types of disturbances—such as overfishing, mechanical destruction of habitats, and climate change—have altered these ecosystems deeply (Dayton et al., 1998; Jackson et al., 2001; Steneck et al., 2002).
For a broader perspective to determine a starting point before the effects of the industrial era, important information sources are the traditional knowledge of local First Nations (Kobluk et al., 2021) and archaeological records (Dillehay et al., 2008; Erlandson et al., 2007). Historical records can also be used to document kelp distribution and help establish a baseline that goes back to the times of European exploration. This is the case for historical floating kelp records based on 1850s British Admiralty Charts in British Columbia (Costa et al., 2020) and Washington State (Berry et al., 2021; Pfister et al., 2017).
For the most recent past in the Northeast Pacific, satellite imagery has provided estimations of change from the decade of 1970s (Gendall et al., in prep.; Mora-Soto et al., 2024), 1980s (Bell et al., 2015, 2020, 2023; Cavanaugh et al., 2011; Hamilton et al., 2020; Man et al., in prep; McPherson et al., 2021; Nijland et al., 2019), and from the decade of 2000s on (Cavanaugh et al., 2019; Mora-Soto et al., 2024; Schroeder et al., 2020). The gap between the historical and the contemporary (satellite-derived) kelp records in British Columbia has not been filled yet.
A recent paper by Mora-Soto et al. (2024) analyzed the resilience of bull kelp (Nereocystis luetkeana) forests from 2005 to 2022 in the southern Salish Sea of British Columbia, including a sentinel site at the southern end of Vancouver Island with data spanning back to 1972. There, kelp forests generally showed signs of resilience to increased temperatures, probably due to a combination of fewer marine heatwaves and a higher frequency of extreme wind-wave motion during the growth season from 2020 to 2022 (Mora-Soto et al., 2024). This study, nevertheless, lacks perspective on the long-term trends in the greater Salish Sea ecosystem. Century-old kelp records from an adjacent region, the Strait of Juan de Fuca, confirmed that kelp forests have generally persisted, although they have diminished in the eastern limit (Pfister et al., 2017). In southern Puget Sound, bull kelp distribution has shown losses of up to 96% compared to an 1878 baseline (Berry et al., 2021). Sea surface temperature in the Salish Sea has shown an increase over the century (Pfister et al., 2017) by 0.57°C per decade (Amos et al., 2014), with an even warmer anomaly event in the North Pacific called the ‘Blob’ of 2014–2019 (Bond et al., 2015) and analogous events (Chen et al., 2021) that maintained lingering effects even in deep water (Jackson et al., 2018). As ocean warming is a clear threat to kelp forest persistence globally (Schiel et al., 2004; Smale, 2020), increasing nearshore temperatures may result in limited kelp presence in the Salish Sea over a longer time frame.
Here, we complement the resilience work by Mora-Soto et al. (2024) by analyzing the long-term persistence of floating kelp canopies of Nereocystis luetkeana (kelp hereafter) in the Salish Sea of British Columbia. The objectives of this research are twofold: to determine the change in areal extent in modern kelp during the period called the Blob and the years after (2014–2022) compared with previously mapped kelp areas from 2002 to 2013; and to define the long-term persistence of kelp over the century. For this analysis, we used high-resolution satellite-derived kelp areal extent to determine modern changes. Our long-term baseline is the oldest published records of kelp presence based on British Admiralty Nautical Charts from the late 19th to the early 20th centuries (Costa et al., 2020). In order to facilitate comparisons within this geographical area, the coastline was divided into clusters of similar environmental conditions. Additionally, spring and summer sea surface temperatures (SSTs) from 1984 to 2022 were used to characterize nearshore SST trends along this extensive coastline. This research adds crucial temporal and spatial data for a more comprehensive understanding of the Salish Sea nearshore ecosystem. Additionally, it brings a wider perspective about the geographical diversity of nearshore ecosystems located along temperate coastlines.
2 Methods
2.1 Environmental clusters
The study area spanned the British Columbian section of the Salish Sea, from the southern limit of the Johnstone Strait (50.37° N) to the Strait of Juan de Fuca (48.25°N) (Figure 1). In this research, the northern Gulf lslands are Denman, Hornby, Lasqueti, and Texada, whereas the southern Gulf Islands are Pender, Mayne, Salt Spring, Galiano, Penelakut, Thetis, and Gabriola, among others not mentioned in the text. The coastline of the study area was classified by environmental clusters (clusters hereafter), defined by the spatial distribution of abiotic factors, following a method developed by Mora-Soto et al. (2024). The variables used in this study were: nearshore Landsat-derived SST (Wachmann et al., 2024); climatology in spring and summer (see section 2.2); fetch or distance to the closest shore, measured as the linear distance in a 360° radius (Gregr et al., 2019); modelled wind speed at 10 m height, expressed as m/seg, obtained from the Global Wind Atlas version 3.3 (Davis et al., 2023); modelled tidal current in m/s (Foreman et al., 2004); and satellite-derived total suspended matter (TSM) for spring and summer (mg/L) (Giannini et al., 2021). These variables were sampled by alongshore points located 1000 m apart and 300 m away from the coastline. Each variable was summarized by the mean of values falling within a 100 m buffer around each point using zonal statistics. This dataset was clustered using K-means (Hartigan and Wong, 1979) in R (R Core Team, 2024).
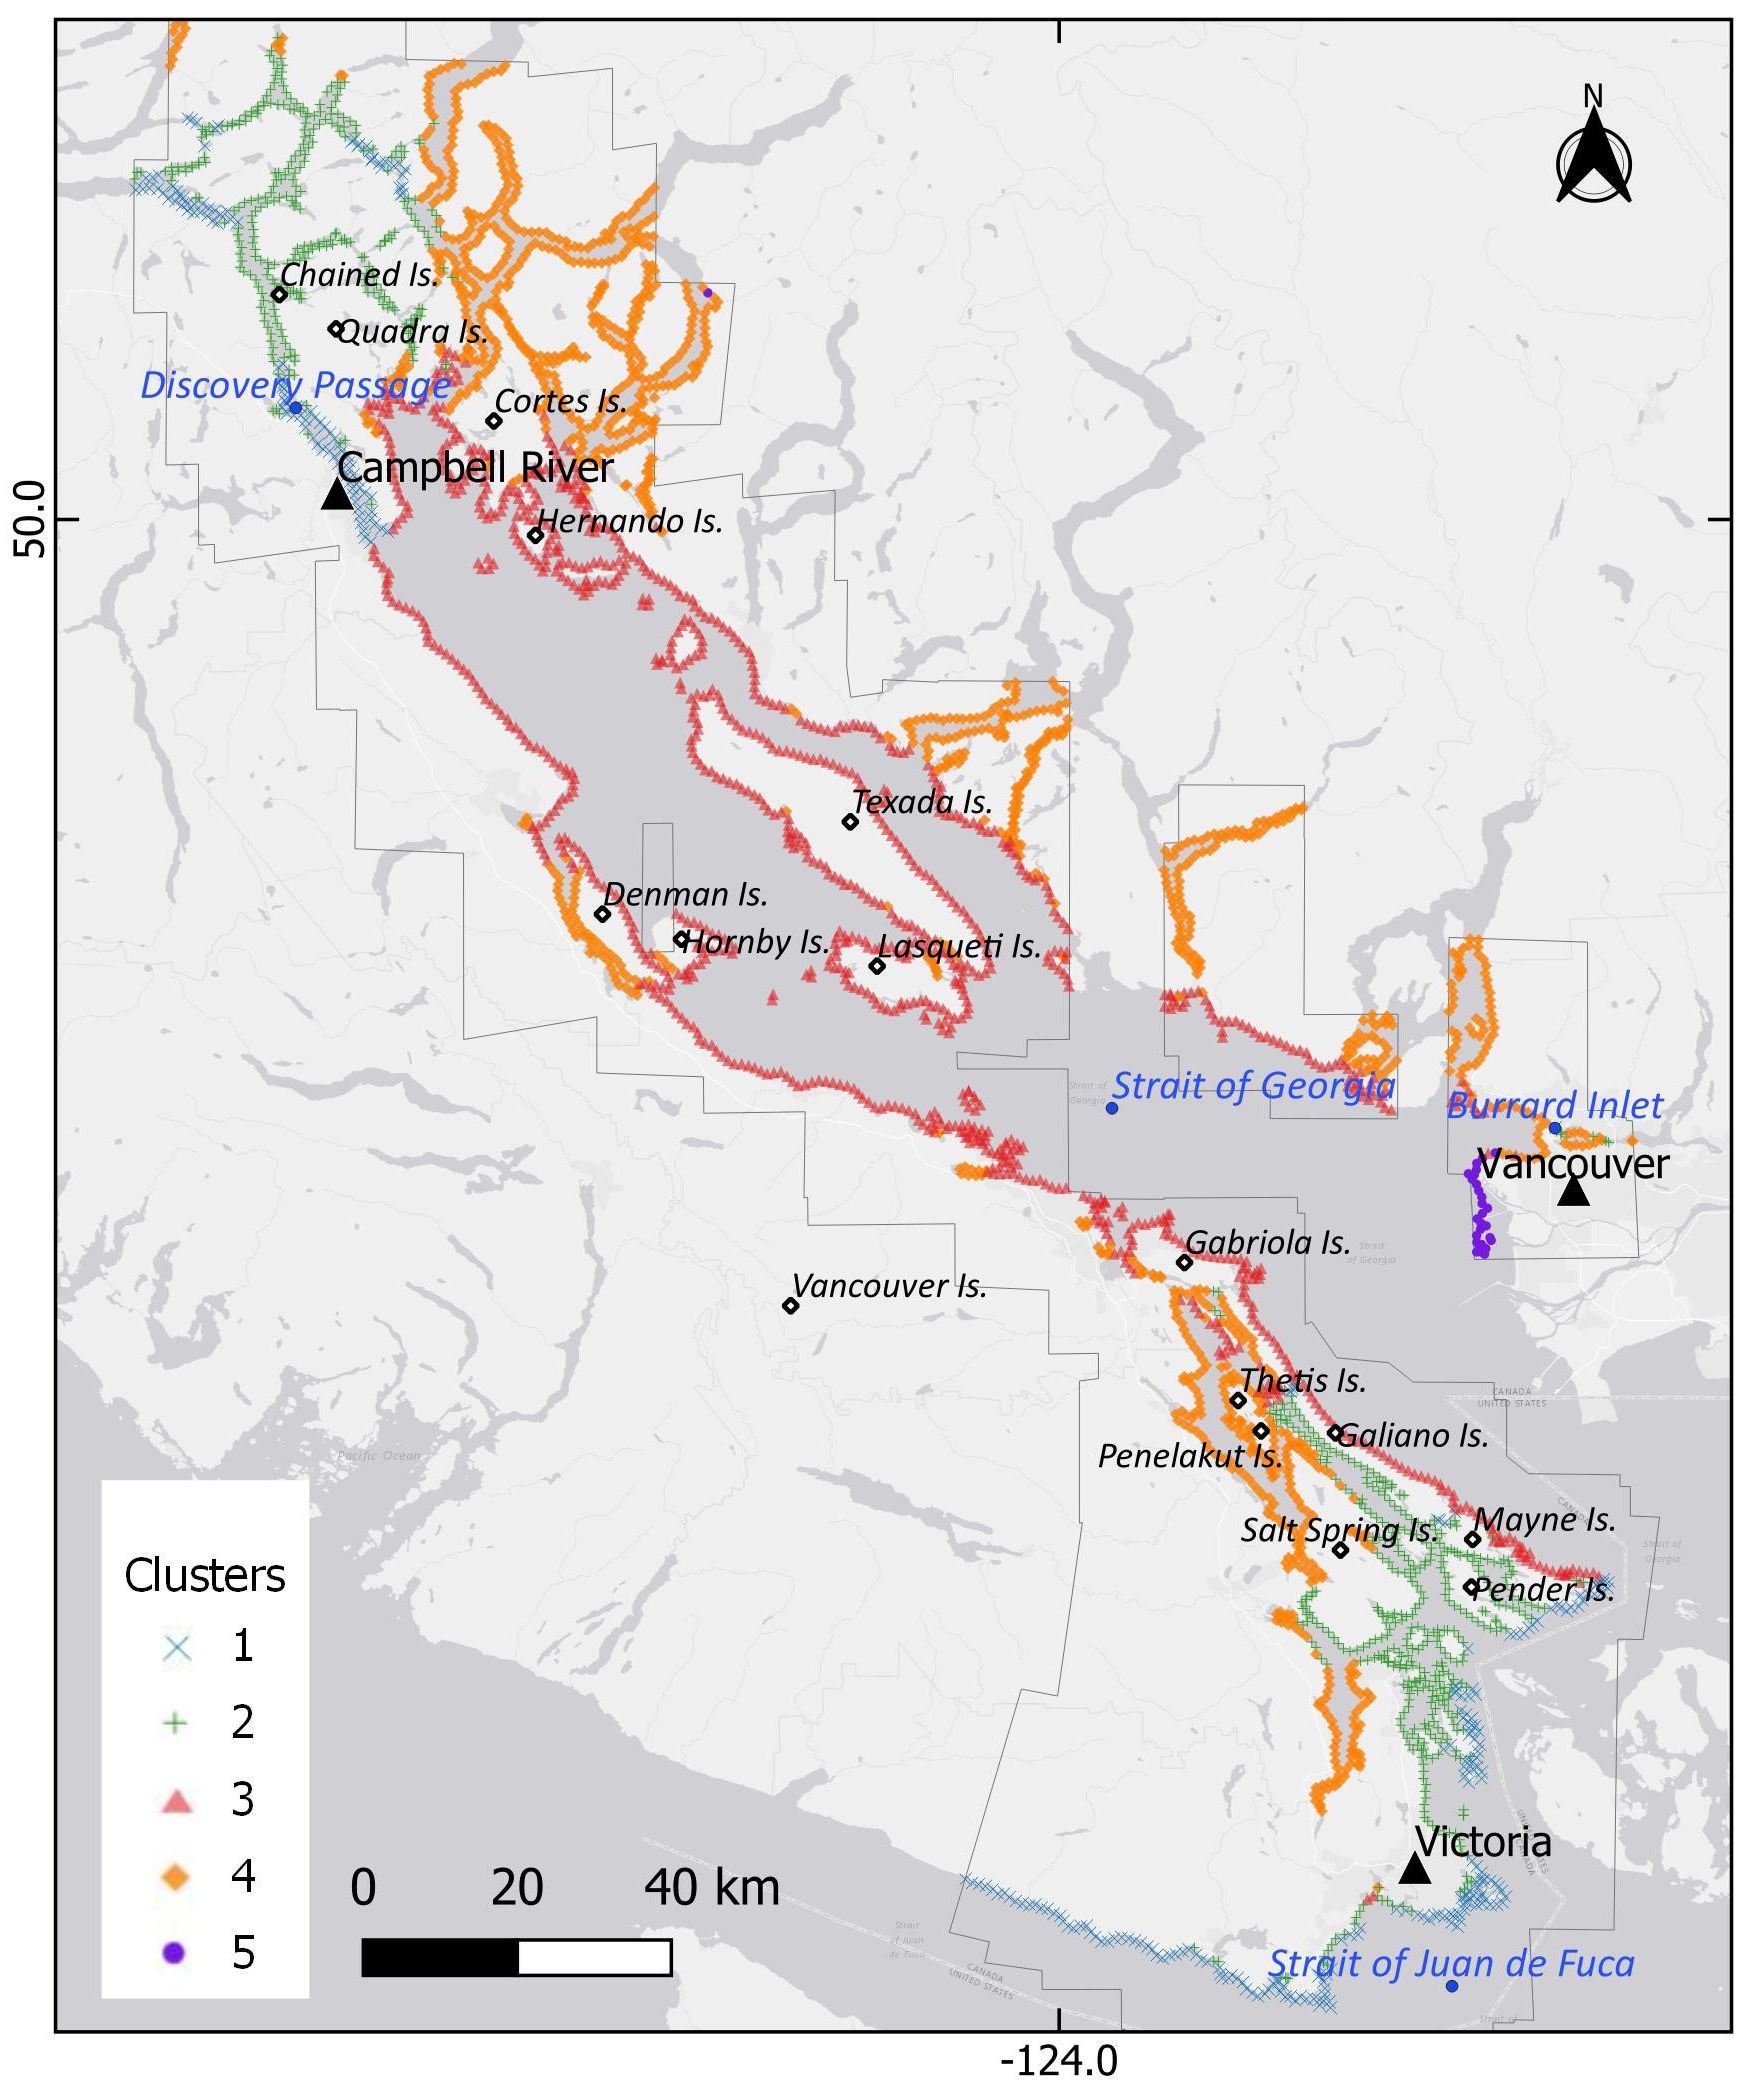
Figure 1. Map of the study area, including the toponyms mentioned in this research. The coastline is classified into clusters defined by similar environmental conditions, represented by points. The main polygons represent the total coverage of the high-resolution imagery available from 2002 to 2022.
The environmental partition of the coastline resulted in five clusters encompassing the main characteristics of the study area (Figures 1, 2). Cluster 1 is the coldest coast, with a mean SST climatology in spring and summer of 10.6°C and 12.0°C, respectively. This cluster has the longest tidal amplitude current, with a mean of 0.49 m/s. Cluster 2 is a moderately sheltered coast with a mean fetch of 178 km and a slightly higher temperature, with mean values of 12.2°C and 14.0°C for spring and summer, respectively. Cluster 3, in the Strait of Georgia, has higher temperatures (mean of 15.4°C and 18.3°C for spring and summer) and is particularly exposed, resulting in higher fetch (mean of 716 km) and wind speed (mean of 4.5 m/s). The highest mean temperatures are found in Cluster 4 (15.8°C and 18.8°C for spring and summer), as the most sheltered coast with a mean wind speed of 2.5 m/s and fetch of 157 km. Cluster 5 is characterized for having the highest TSM of the Salish Sea (mean of 15 mg/L), mainly due to the plume of sediments from the Fraser River, thus preventing this area from having any kelp presence. Lacking kelp beds, Cluster 5 is not considered in the rest of the kelp analysis.
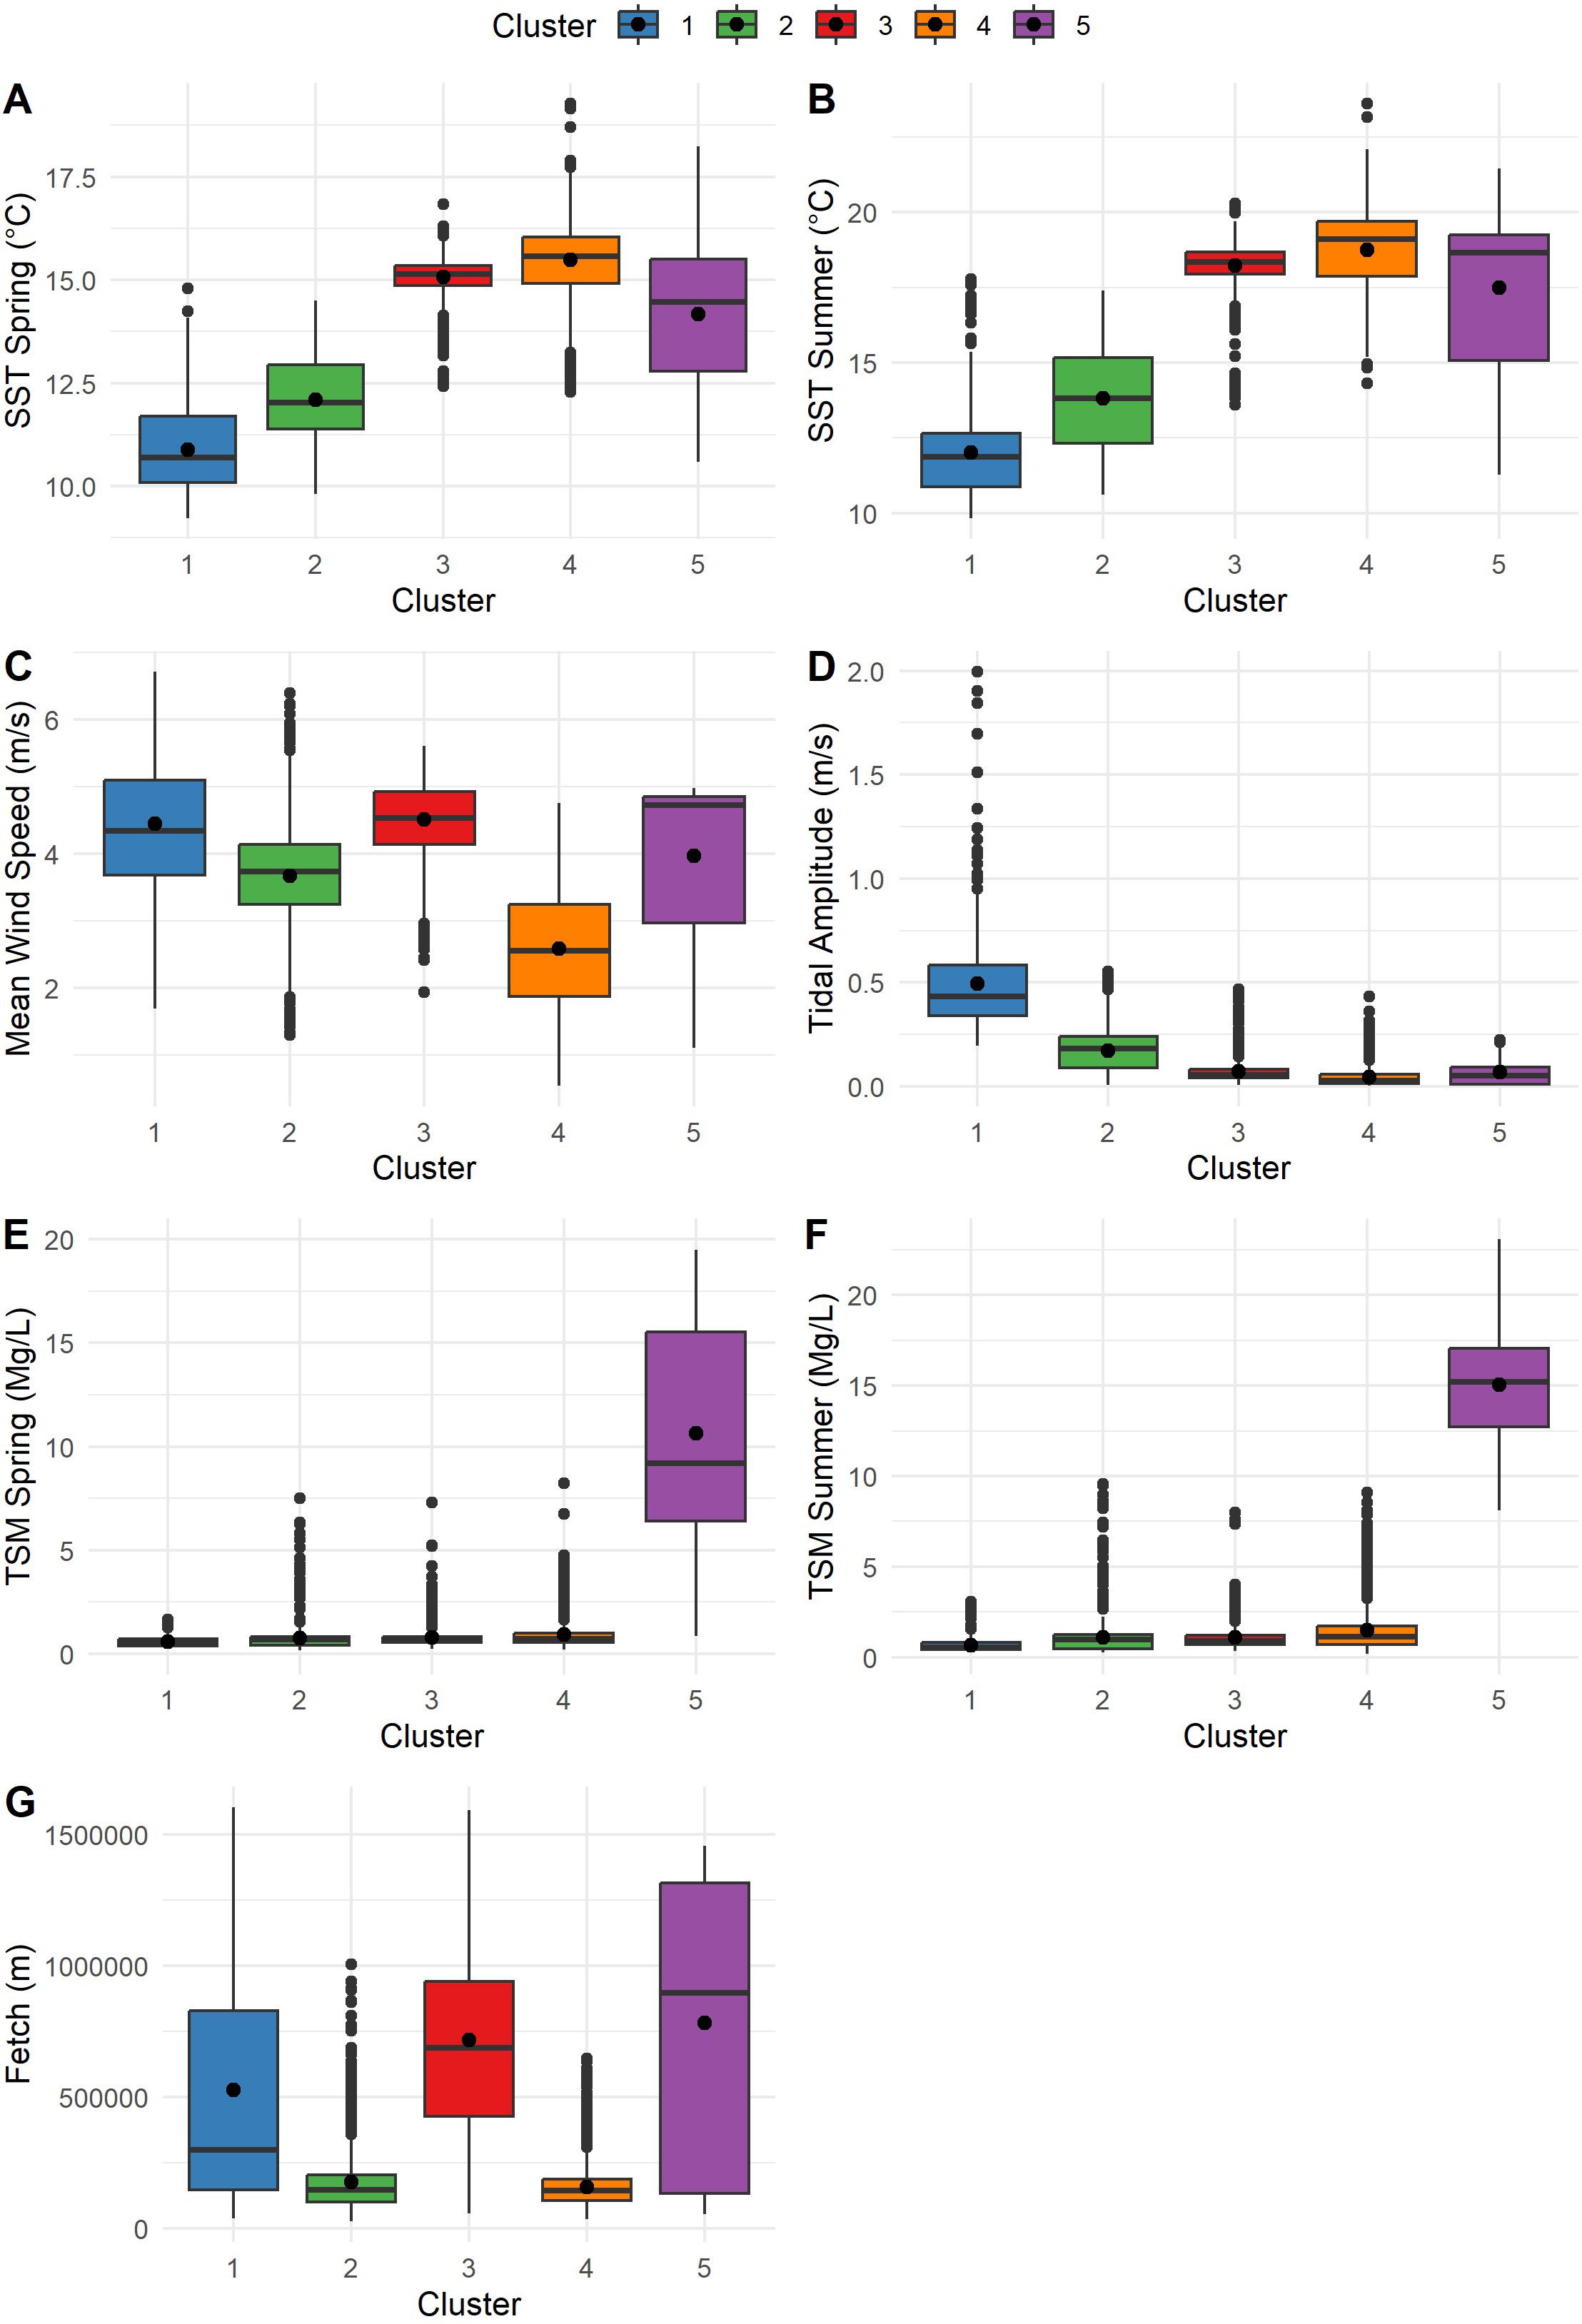
Figure 2. Box and whisker plots characterizing the clusters by variables; the point in the center denotes the mean. SST, Sea Surface Temperature; TSM, Total Suspended Matter. (A) SST climatology in spring (°C). (B) SST climatology in summer (°C). (C) Mean wind speed (m/s). (D) Tidal amplitude (m/s). (E) TSM spring (mg/L). (F) TSM summer (mg/L). (G) Fetch (m). Cluster 1 represents the coldest areas with the highest current; Cluster 2 is moderately cold and semi-sheltered; Cluster 3 is the exposed coast in the Strait of Georgia; and Cluster 4 is the most sheltered and warmest coast. Cluster 5 is the coastline with the highest total suspended matter in the Salish Sea.
2.2 Nearshore SST
Nearshore sea surface temperature records for four decades (1984–2022) were seasonally selected by spring and summer values to characterize thermal conditions during the growth season for bull kelp (Springer et al., 2010). Nearshore SST was obtained from thermal bands from the Landsat constellation (courtesy of the U.S. Geological Survey), available in Google Earth Engine (Gorelick et al., 2017) and validated as a reliable source to obtain nearshore temperature data (Wachmann et al., 2024). The temporal coverage for each satellite was 1984–2011 for Landsat 5, 1999–2002 for Landsat 7, 2013–2022 for Landsat 8, and 2022 for Landsat 9. SST was extracted from an algorithm designed to integrate different sensors and spatially overlapping imagery into a seasonal mosaic. For every spring (May, June) and summer (July, August) season, the image collection was filtered by selecting images of 50% or less cloud coverage. The thermal pixel values from the filtered collection were scaled, cloud-masked, and transformed from Kelvin to Celsius, according to Wachmann et al. (2024). Two additional filters of temperatures <7.0°C and the 30th percentile of the lowest values were applied to discard any possible fog contamination on the image. If the average value of the SST collection was within 1.5 standard deviations, it was considered a valid pixel to represent the seasonal temperature; if not, the value was discarded.
The resultant seasonal mosaic was spatially joined to the sampling points that were used as input for the cluster analysis (see section 2.1) using the Spatial Join tool, whereas missing values were interpolated using the Kriging tool in ArcGIS 10.8.1. As a result, seasonal temperature per year from 1984 to 2022 was added to the table of attributes of the points. The mean of this dataset was the seasonal climatology used in the environmental cluster definition (see section 2.1).
2.3 High-resolution satellite maps of kelp
Modern-day kelp, from 2002 to 2022 (modern kelp hereafter), was mapped with archived high-resolution imagery of <6 m of spatial resolution, which had a modest coverage for the northern sector of the Salish Sea due to cloud cover and imagery quality (see annual coverage in Supplementary Figures S1, S2). This dataset was grouped into two main periods: 1) the years before the Blob (2002–2013), hereafter called PreBlob, and 2) the period encompassing the Blob and subsequent years (2014–2022), Blob+Post hereafter. Kelp was mapped by classifying high-resolution remote sensing imagery from the summer peak (July or August) at the lowest tide. The procedure follows previous research (Cavanaugh et al., 2021; Gendall et al., 2023; Mora-Soto et al., 2024; Schroeder et al., 2019) and is summarized as follows: the corrected and georeferenced image was masked from the lowest tide mark to 40 m depth (low tide mask hereafter). Normalized Difference Vegetation Index (NDVI; Kriegler et al., 1969), Green Normalized Difference Vegetation Index (GNDVI; Gitelson et al., 1996), near-infrared bands, and visible enhanced bands were segmented using the multi-resolution segmentation tool and classified into kelp and no-kelp classes in the eCognition software (Trimble Germany GmbH, 2021) using expert knowledge. The outputs were maps of the maximum kelp extent observed per year. These classifications were compared with Google Earth imagery, ancillary data, and anecdotal observations. Additional validation was conducted with in-situ mapping surveys from different years, resulting in an accuracy of 70%.
2.4 Historical kelp surveys from the 19th and 20th centuries
The earliest written historical source of kelp distribution in British Columbia comes from the British Admiralty Nautical Charts (historical kelp hereafter), published from 1858 with successive updates until 1956 (Costa et al., 2020). Kelp canopies were often depicted as dendritic features, particularly in detailed, fine-scale charts (<1:10,000), as they posed dangers to navigation (Imray, 1870). Costa et al. (2020) georeferenced the complete dataset of nautical charts of the province, and kelp features were digitized as a multi-polygon shapefile layer. The reliability of those locations was then calculated by comparing them within a bathymetry range of 40 m, resulting in 99% reliability. However, given the diversity of scales and accuracies of the depicted kelp, our analyses relied on their distributions instead of areal extents. Non-kelp in the nautical charts may either represent a generalized representation of coastlines or the actual absence of kelp. For this reason, we only used the mapped historical kelp records for this analysis.
2.5 Spatial and statistical analysis
Our spatial analysis was conducted by kelp area comparisons between PreBlob and Blob+Post periods, nearshore SST anomalies per cluster, and kelp persistence of historical versus modern distributions (PreBlob and Blob+Post). To compare PreBlob with Blob+Post periods, the intersecting kelp area between the PreBlob and Blob+Post imagery coverages was chosen for analysis. The kelp layers from both periods were spatially analyzed within the scale of segments per cluster, as defined in section 2.1. The segments were defined by the Voronoi distance among the alongshore points that intersected with the low tide mask, consisting of polygons of ~1000 m in length. Mapped kelp layers were spatially merged to the segments, adding kelp area per segment (m2) as a variable. The non-parametric Kruskal-Wallis chi-square test (Kruskal and Wallis, 1952) was used to identify significant changes in kelp area per period (PreBlob and Blob+Post) and cluster. Further, the study area was divided into a northern sector and a southern sector to avoid underrepresentation of the generally smaller northern kelp area.
The climatological baseline was defined by extracting the averages of nearshore SSTs from 1984–2022 per cluster and season (spring and summer) for the entire study area. The data was compared with the seasonal nearshore SSTs per cluster by calculating their anomalies as the difference between the nearshore SST per cluster (by season and year) and their averages. The Kruskal-Wallis test was used to examine temporal patterns that could constitute specific periods of anomalies. For each period, the difference in positive and negative values was used to describe significant anomaly patterns and to identify differences among clusters.
Lastly, the analysis was restricted to the historical distribution of kelp beds from nautical charts to identify kelp persistence. If historical kelp presence matched PreBlob or Blob+Post kelp presence at the same segment, the segment was classified as containing persistent kelp from historical to modern times. If not, the segment was classified as non-persistent kelp.
3 Results
3.1 Nearshore SST anomalies and trends
Thermal anomalies of nearshore SST show three main periods within the 1984–2022 baseline (Figures 3A, B). First, there was an initial period of predominantly colder anomalies (0.0 to -3.0°C in spring and summer) from 1984 until 1999. A second period, starting in 2000, varied within a range of -3.0 to +3.0°C in spring and -2.0 to +2.0°C in summer. Finally, a third period, starting in 2014, had a predominance of warmer anomalies in both the spring and summer seasons.

Figure 3. Nearshore sea surface temperature anomalies per cluster in (A) spring and (B) summer; the values in the right corner show the total average from 1984 to 2022. Bold-dashed lines indicate the periods 1984–1999, 2000–2013 (PreBlob), and 2014–2022 (Blob+Post). The vertical line with * in 2002 indicates the initial year of the high-resolution mapping classification.
Mean SSTs for Cluster 1, representing the coasts with the coldest waters (see the temperatures in Table 1) and the highest tidal currents, increased by 1.0°C for the spring and summer seasons over four decades. Cluster 2, representing slightly warmer and semi-sheltered coasts, expressed a mean increase of 1.6°C in the spring and 2.0°C in the summer. Cluster 3 had an average increase of around 2.0°C for both seasons in the Strait of Georgia. Finally, Cluster 4, representing the warmest and most sheltered coastlines, showed an increase higher than 2.0°C in SSTs for both seasons. The nearshore SST per cluster and season did not change significantly from the northern to the southern sectors. All of the temporal changes across periods were statistically significant (Kruskal-Wallis test p-value <0.005).
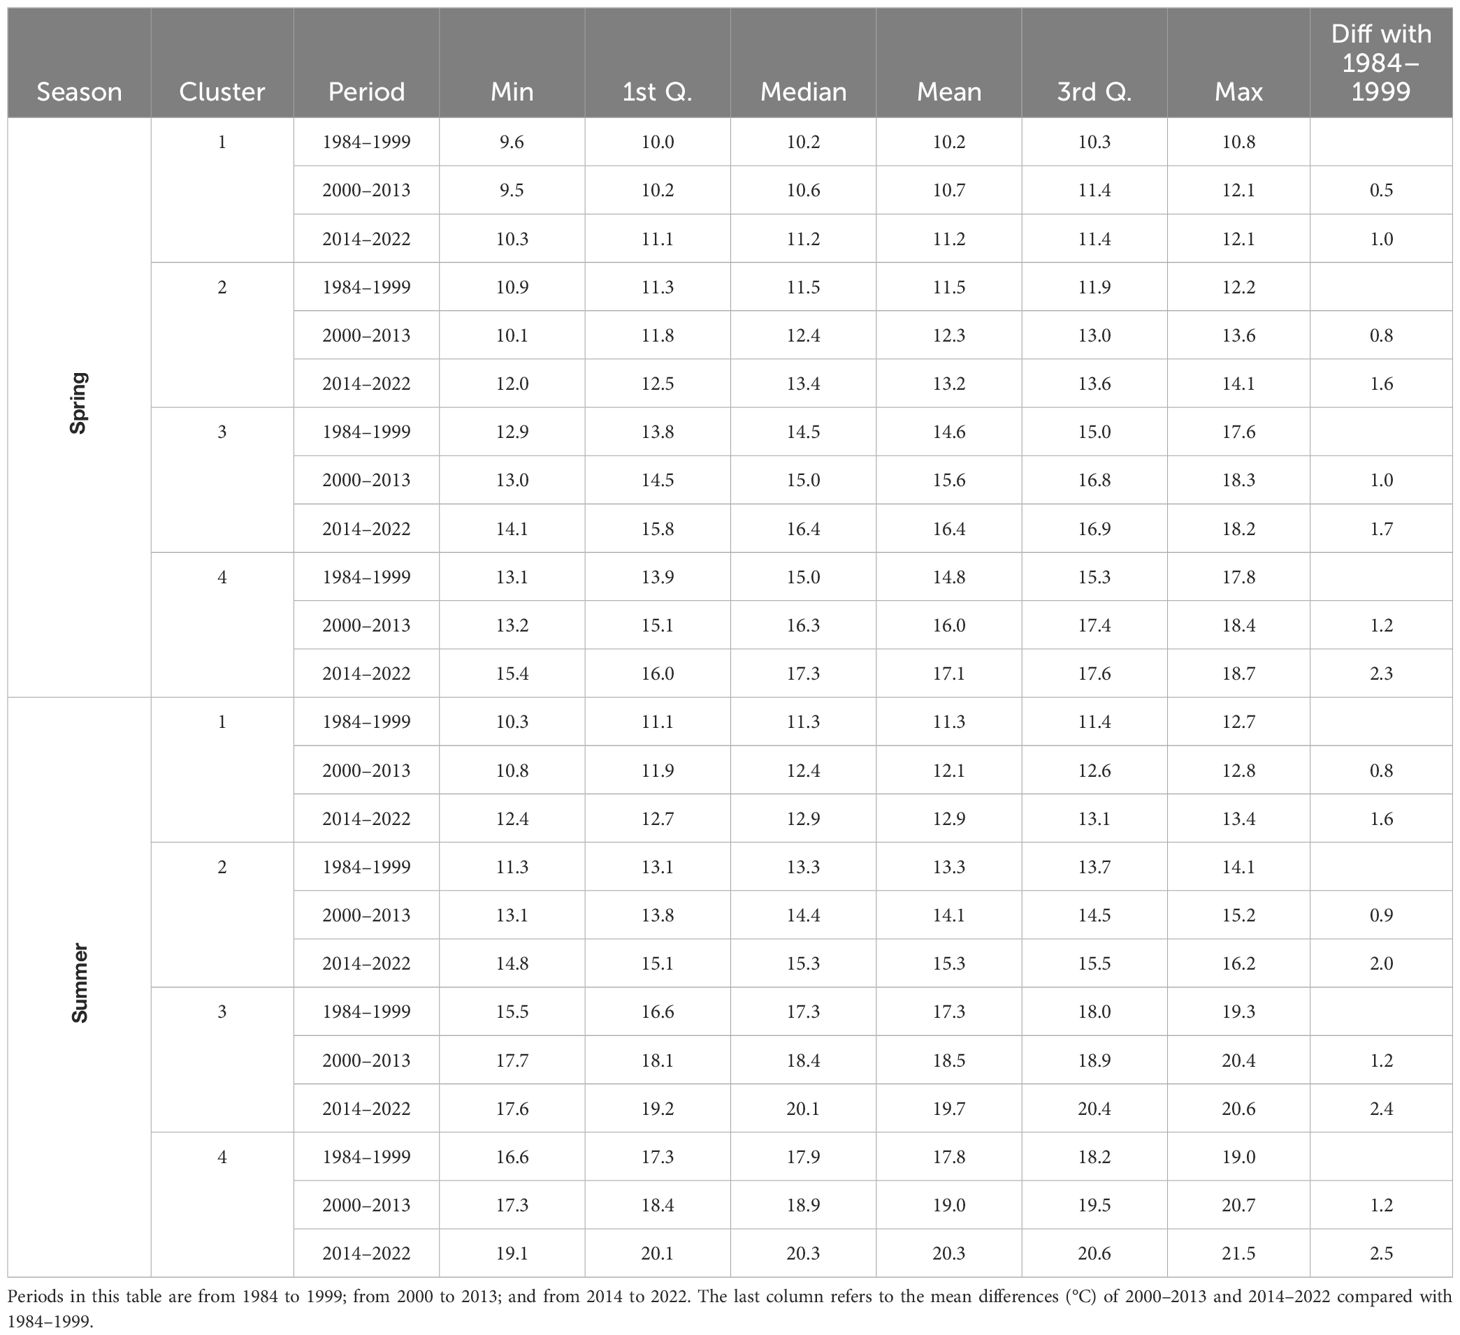
Table 1. Descriptive statistics of nearshore SST (°C) per season and cluster.
3.2 High-resolution mapped kelp changes
The total kelp area mapped from 2002 to 2022 with high-resolution imagery in the study area was 2,086 hectares. Kelp forests largely dominated the southern sector from Burrard Inlet to southern Vancouver Island (Figure 1). The northern sector had more narrow kelp forests—smaller than one hectare per segment—along the coastline of islands and channels (Figures 4A, B).
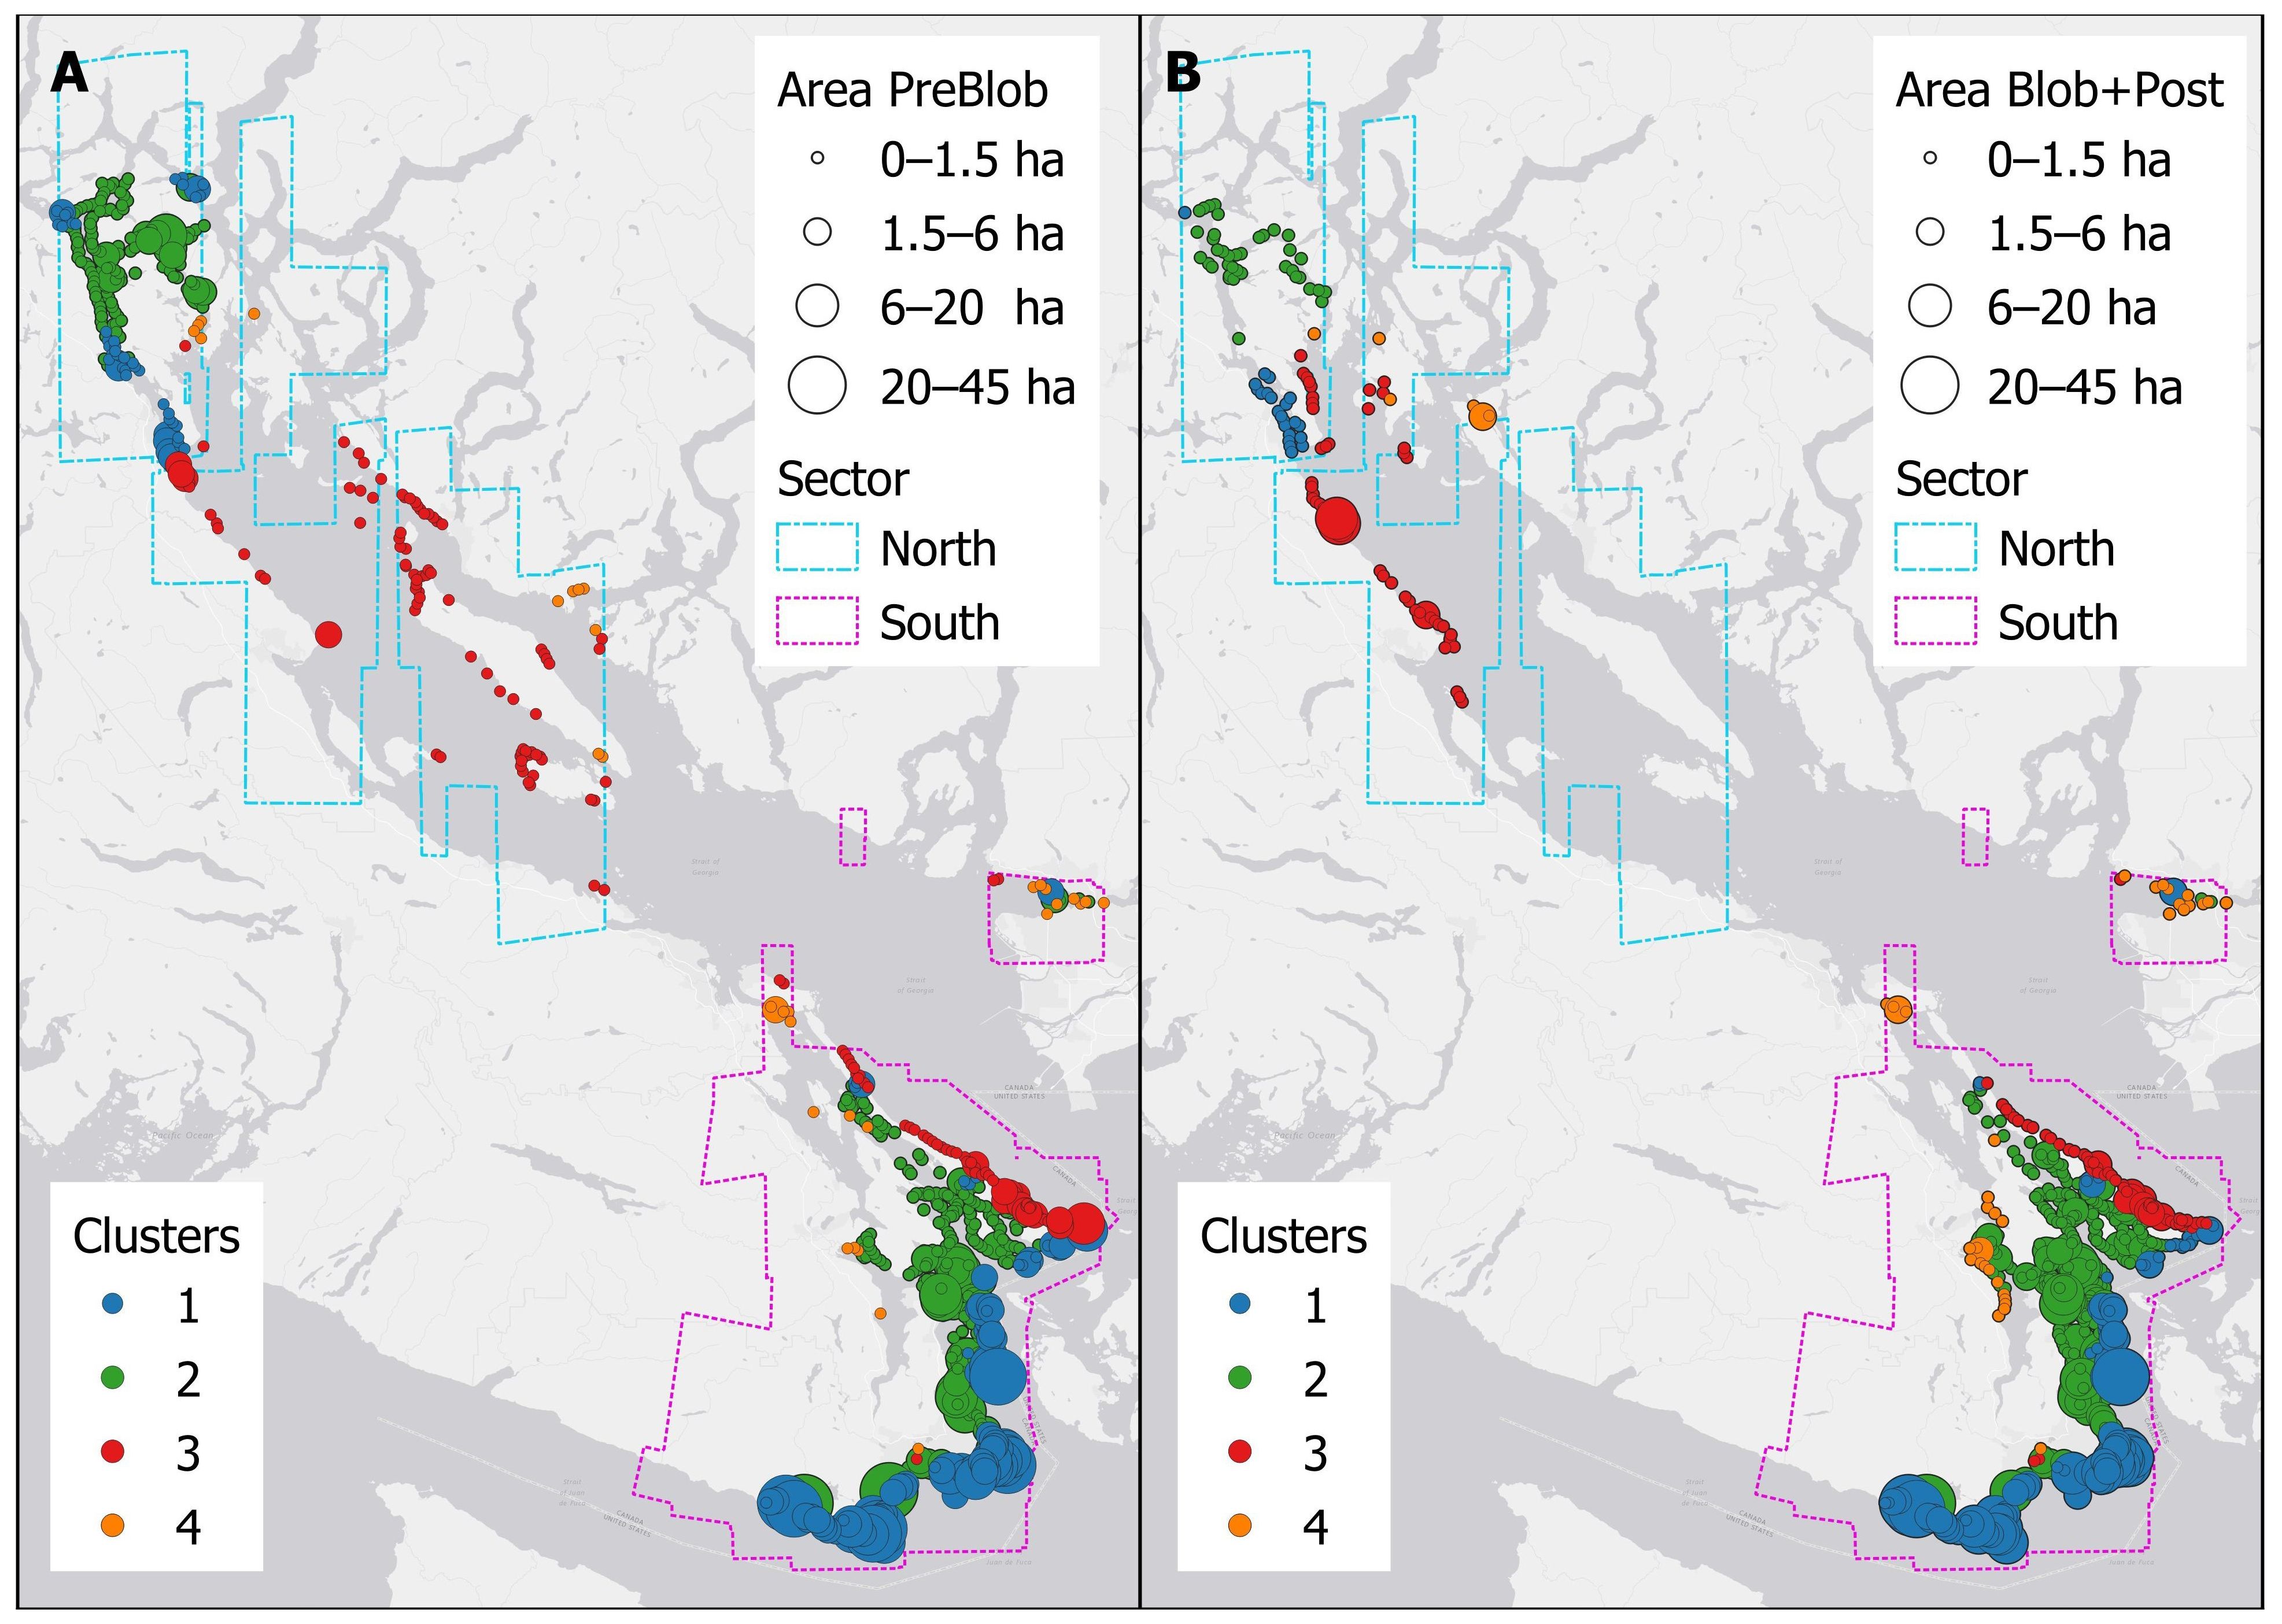
Figure 4. Kelp area during: (A) PreBlob (2002–2013), and (B) Blob+Post (2014–2022). In (A, B), the size of the circles represents area per segment.
Specifically, the PreBlob distribution (Figure 4A) spanned the complete Salish Sea; the larger areas in the southern sector (>6 ha) were located along the coasts in the Strait of Juan de Fuca (Cluster 1 south), some semi-sheltered coasts in the southern Gulf Islands (Cluster 2 south), and Burrard Inlet (Clusters 1 and 2 south). In the northern sector, relatively small and narrow but continuous kelp forests (between 1.5 to 6.0 ha) were present at Discovery Passage and Quadra Island (Clusters 1 and 2 north). Small (<1.5 ha) and relatively continuous forests were in the Strait of Georgia, particularly at Galiano, Lasqueti, Texada, and Hornby Islands (Cluster 3 north), while sparse kelps were found in more sheltered inlets (Cluster 4 north). The Blob+Post map (Figure 4B) showed a smaller and more scattered distribution of kelp, with an absence of kelp in the central Salish Sea (Strait of Georgia, Cluster 3 north), particularly around the northern Gulf Islands, as well as the Discovery Passage and Quadra Island (Clusters 1 and 2 north). In contrast, small but continuous kelp beds were mapped in the southern Gulf Islands (Clusters 2 and 4 south). The distribution of kelp beds in Cluster 1 south in the Strait of Juan de Fuca matched the PreBlob period, although the sizes of the beds were relatively smaller.
Changes in kelp abundance were evident per cluster and sector (north and south), either in the total area per cluster (Figure 5A) or as area per segment (Figure 5B). The majority of the small kelp beds mapped in the northern sector in the PreBlob period were not detected in the Blob+Post period, meaning that kelp was not present or the density of the canopies was too negligible to be detected with the high-resolution remote sensing imagery. At the cluster level (Figures 5A, B), the northern sector showed large and significant declines in area per segment (Kruskal-Wallis test p-value <0.05), in Cluster 1, Cluster 2, and Cluster 4 (1.8 ha PreBlob to 0.4 ha in Blob+Post). Despite having less kelp presence in the northern Gulf Islands, the total area in Cluster 3 remained relatively constant. In the southern sector, Cluster 1 in the Strait of Juan de Fuca and Cluster 3 in the southern part of the Strait of Georgia had reductions in total area from PreBlob to Blob+Post. In contrast, the semi-sheltered and sheltered coasts of Clusters 2 and 4 in the interior of the Gulf Islands showed significant increases in total area of kelp.
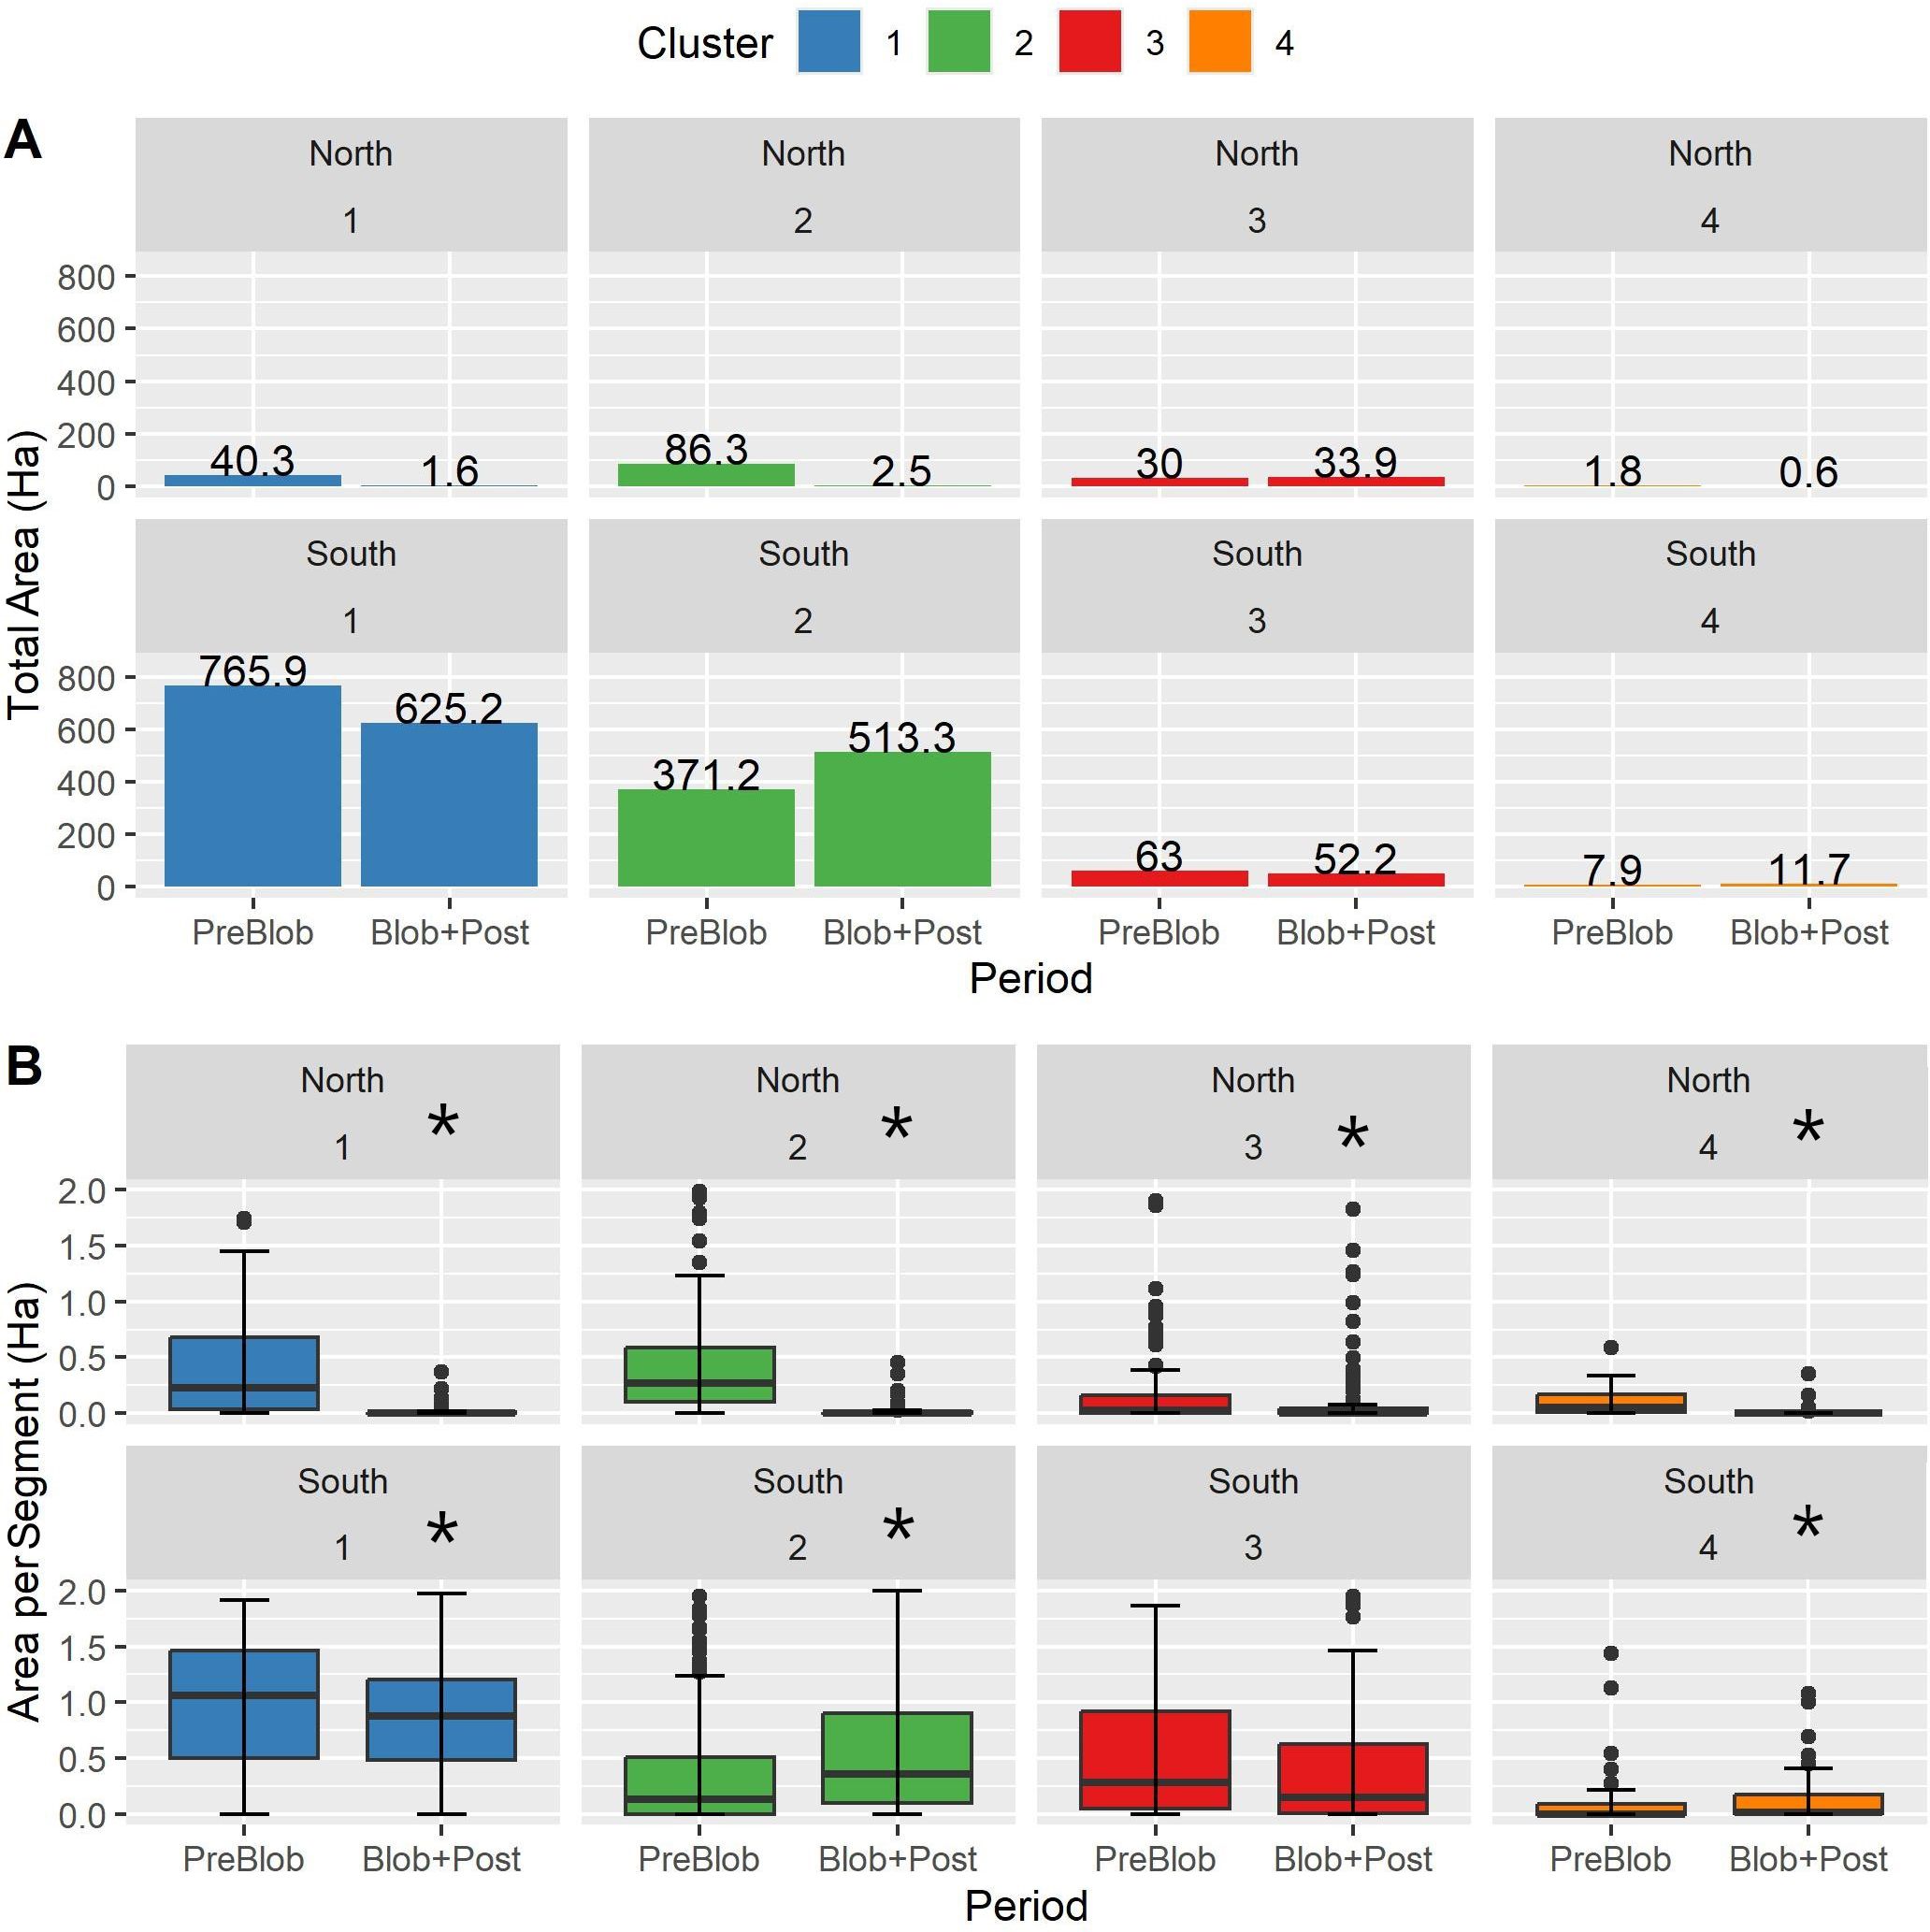
Figure 5. (A) Kelp total area by cluster corresponding to the northern and southern sectors of the Salish Sea during PreBlob (2002–2013) and Blob+Post (2014–2022) periods. (B) Kelp area per coastal segment by period, cluster, and sector. The asterisks indicate significant differences (Kruskal-Wallis test p-value <0.005).
3.3 Historical assessment of kelp persistence
Historical kelp was compared to PreBlob and Blob+Post periods to identify their persistence within a century time scale. The historical kelp forests compared to the PreBlob distribution (Figure 6A) showed a relatively high persistence of continuous kelp beds in the extreme north (Discovery Passage and around Quadra Island, Clusters 1 and 2), the southern sector (Strait of Juan de Fuca and southern Gulf Islands, Burrard Inlet), and some groups of persistent kelp near Texada and Lasqueti Islands. Non-persistent kelp areas dominated the central part of the Strait of Georgia (Cluster 3). On the other hand, the historical distribution compared to the Blob+Post period (Figure 6B) showed that non-persistent kelp dominated the Strait of Georgia from the southern Gulf Islands (Galiano, Penelakut, and Thetis Islands) to Quadra Island in the northern extreme of the Salish Sea. Kelp persistence remained in Burrard Inlet, southern Vancouver Island, and the southern Gulf Islands.
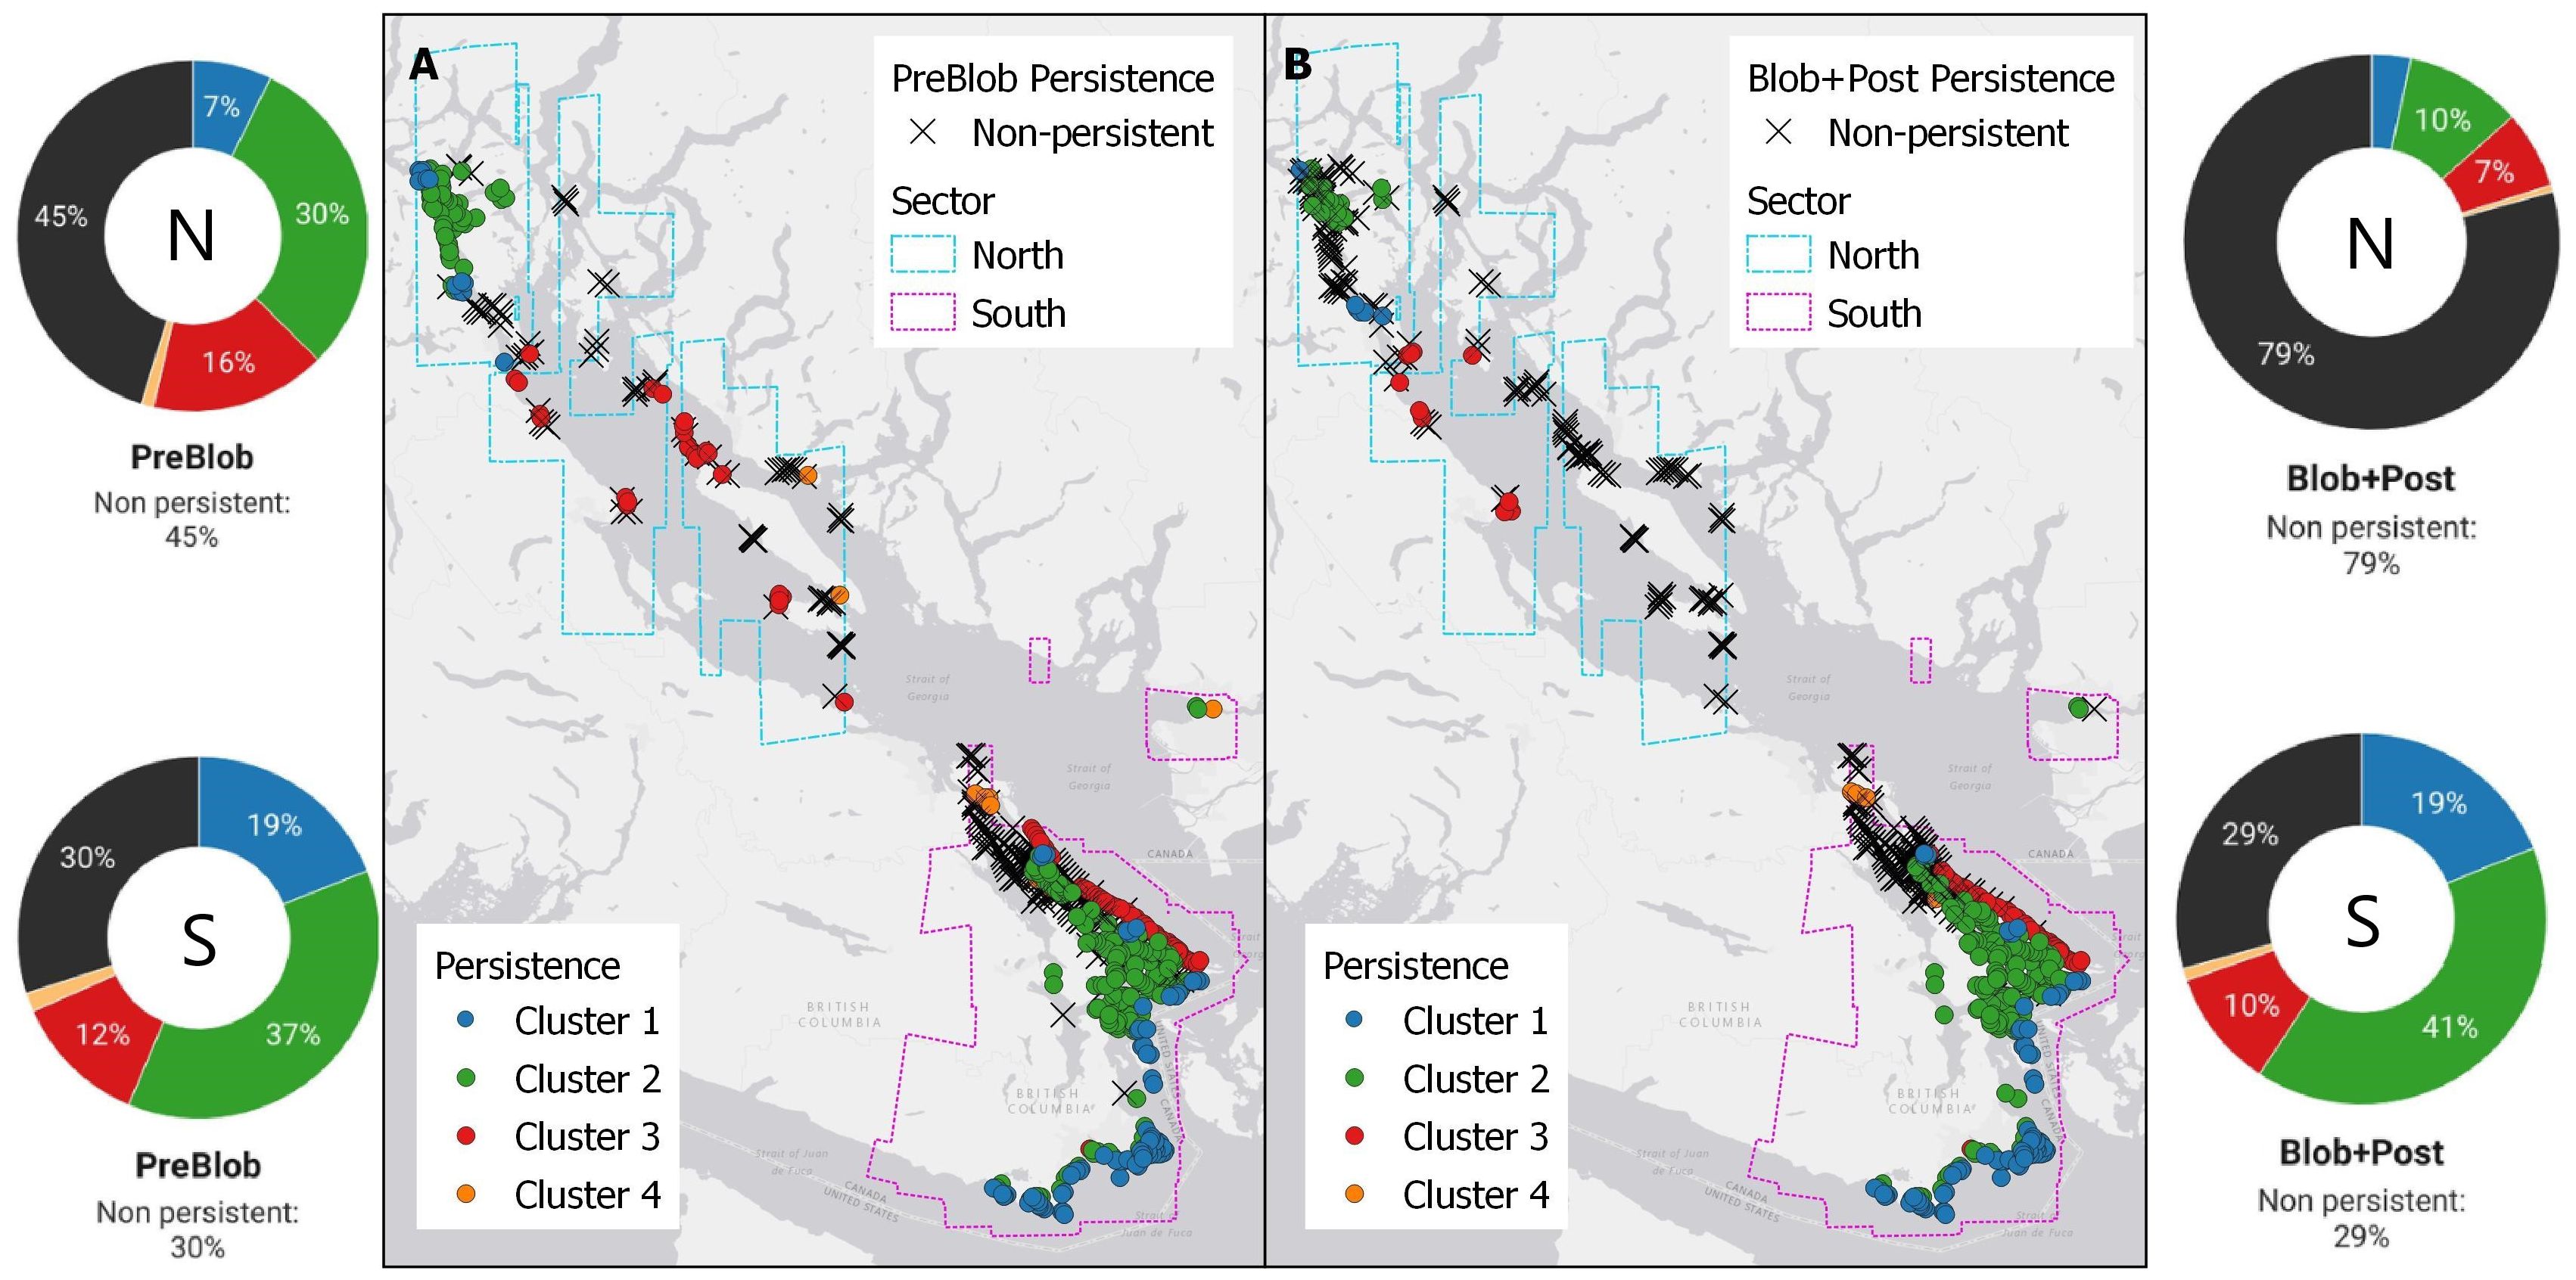
Figure 6. Comparison of historical long-term persistence of kelp from historical records with the (A) PreBlob period (2002–2013) and (B) the Blob+Post period (2014–2022). In (A, B), crosses represent non-persistence and circles represent persistence classified by cluster, compared with the historical nautical charts (1858–1956) from Costa et al., 2020. Donut charts at both sides summarize the persistence of the clusters in the northern (N) and southern (S) sectors of the Salish Sea.
Summarizing these changes at the Cluster and sector level (Figure 6 and Table 2), the northern sector had a historical kelp baseline presence of 179 segments. Among them, 45% were non-persistent in the PreBlob period and 79% in the Blob+Post period. The most exposed coastlines to high tidal current and colder temperatures (Cluster 1), as well as more sheltered areas (Cluster 2), show a moderate reduction in the PreBlob period that increased sharply in Blob+Post, suggesting that an important reduction occurred in recent years. On the exposed coasts in the Strait of Georgia (Cluster 3), a small fraction of historical kelp persisted in the PreBlob period, which also decreased for the Blob+Post. The warmest and most sheltered areas (Cluster 4) had a small record of historical kelp that was reduced to two and one segments in the PreBlob and Blob+Post periods, respectively.
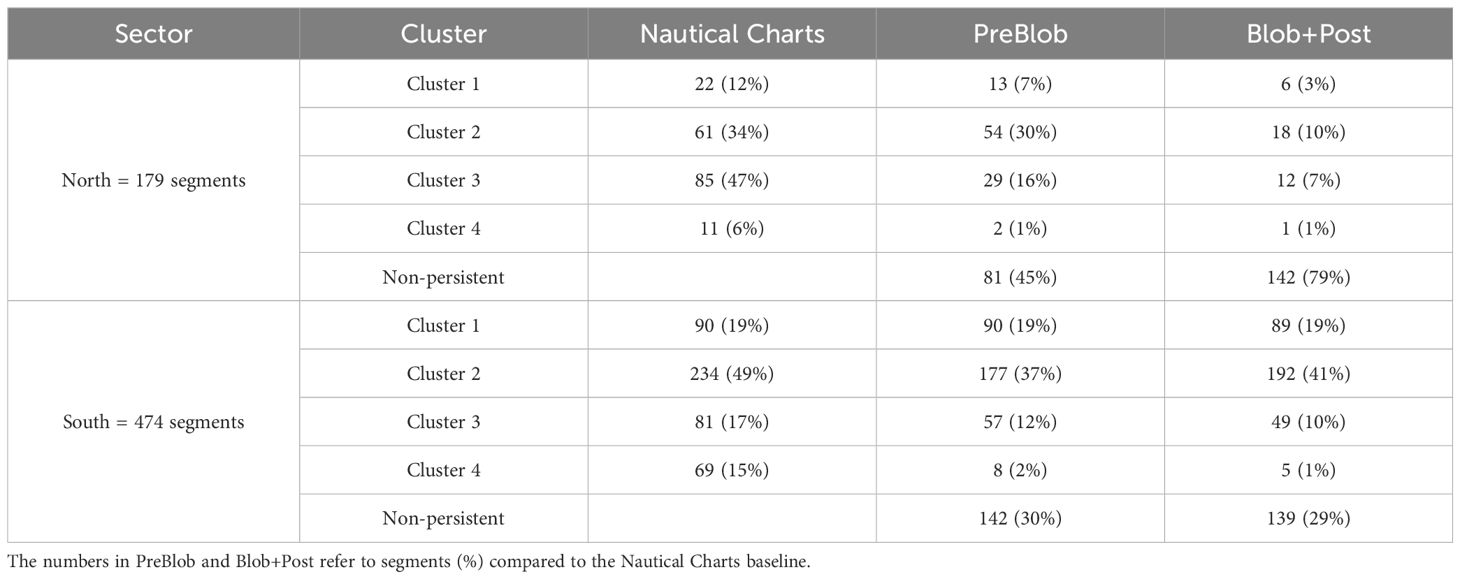
Table 2. Summary of the long-term persistence of segments in the northern and southern sectors of the Salish Sea (illustrated in Figure 6).
In the southern sector (Figure 6 and Table 2), the coldest coastlines show a noticeable long-term persistence among the 474 segments with historical kelp records. In general, 30% of the historical kelp were non-persistent in the PreBlob and Blob+Post periods. Most of the change occurred in the warmest and most sheltered areas of the southern sector (Cluster 4) and some reductions in Clusters 2 and 3; Cluster 1 remained stable in PreBlob and Blob+Post periods.
4 Discussion
4.1 General overview of kelp trends in the Salish Sea
Nearshore ecosystems are spatially and temporally variable, therefore, studies considering large spatial and temporal scales can more accurately identify patterns of change in presence and persistence (Steneck et al., 2002). In that regard, a dataset with long enough time frame and/or broad enough area can help to provide an understanding of kelp persistence beyond what is available to monitor with satellite imagery. This study used high spatial resolution satellite-derived kelp maps to compare areas and presence of kelp in PreBlob versus Blob+Post periods, and it also compared these periods with a baseline of historical nautical charts and nearshore SST. Our aim was to provide the first large spatial and temporal analysis of the long-term persistence of kelp in relation to the most recent effects of the Blob in the Salish Sea, an enclosed sea representing 3300 km of coastline of British Columbia, Canada. In the last two decades, the PreBlob and Blob+Post periods show a general decline in kelp area in the northern sector and stability in the south. However, century-old records bring a new perspective on these observations.
The comparison of the PreBlob with the Blob+Post period shows that kelp in the northern section of the Salish Sea decreased considerably in terms of area and distribution. A possible explanation for these results is the magnitude of nearshore SST anomalies using a baseline of four decades (1984–2022). Our nearshore SST records display an acute span of higher temperatures during and after the Blob anomaly of 2014–2019 (Blob+Post period). However, this increase was already preceded by an anomaly period of higher SST that started in 2000, which is in line with earlier studies (Amos et al., 2014). In the warmest coasts (Clusters 3 and 4), the Blob+Post spring and summer temperatures are 2.0°C higher than in the 1984–1999 period. For these regions, these anomalies represent temperatures near the lethal limit for gametophytes and blade tissue (20.0°C), especially during long periods (Supratya et al., 2020; Weigel et al., 2023). Consequently, we infer that the total area and likely density of kelp canopies were negatively impacted, making them less functional as forests.
To a certain extent, the local decrease of kelp in the warmer coastlines of the Salish Sea can be related to similar events affecting the broader Northeast Pacific region, including the Blob of 2014–2019. Prolonged and extreme marine heatwaves exerted devastating changes on kelp forests, shifting large areas of kelp habitat from previously healthy ecosystems to infertile urchin barrens (Arafeh-Dalmau et al., 2019; Cavanaugh et al., 2019; Rogers-Bennett and Catton, 2019). Previous anomalous warming events combined with intense storm activity and dampened nutrient levels meant a reduction in kelp growth and life span (Dayton and Tegner, 1984; Tegner et al., 1997). Although the nature and extent of kelp fluctuations have shown to be variable at the local level (Cavanaugh et al., 2019; Mora-Soto et al., 2024; Starko et al., 2022, 2024), absolute and relative high temperatures beyond a stressing level are frequently associated with devastating kelp loss and co-occurrence of cascading effects in the associated ecosystem (Cavanaugh et al., 2019; McPherson et al., 2021).
In contrast, the coldest coasts in the northern sector, represented by Clusters 1 and 2, were warmer by 1.0°C in spring and summer compared to the 1984–1999 baseline but remained within the thermal tolerance limit (<17.0°C) (Springer et al., 2010; Supratya et al., 2020). The reasons for the kelp decrease in these clusters remain unclear and require further studies. The southern section of the Salish Sea remained relatively stable compared with the northern section. Kelp beds changed in area from PreBlob to Blob+Post (-140.7 ha in Cluster 1, +142.1 ha in Cluster 2, -10.8 ha in Cluster 3, +3.8 ha in Cluster 4), but their distributions remained at similar locations, suggesting that area fluctuations do not necessarily mean strong drops in presence. This affirmation is supported by earlier research on kelp resilience in this area (Mora-Soto et al., 2024).
Our data indicates that persistent kelp happens in Clusters 1 and 2 in the southern sector. This result could be explained by local variables, such as nutrient availability and currents. Nutrient availability driven by freshwater inputs from the Fraser River (Khangaonkar et al., 2021) and others could support kelp presence, given that increased nitrogen positively increases the density and size of sporophytes within the thermal tolerance limit of 20.0°C (Weigel et al., 2023). In previous research, Berry et al. (2021) have indicated that currents, either by superficial wave velocity or deep-water mixing, play an important role in kelp persistence in the Puget Sound region of the Salish Sea because high hydrodynamic flows can bring nitrogen and other nutrients to the kelp. As Clusters 1 and 2 south are represented by high tidal amplitude current (m/s), high fetch, and lower SSTs, their behavior support Berry et al. (2021)’s observations of kelp persistence at highly dynamic and enhanced nutrient areas. In that case, high fetch could be a complementary factor that helps sustain kelp resilience under thermal stress and contributes to long-term persistence (Mora-Soto et al., 2024; Pfister et al., 2017), as well as the wind-motion regime that could potentially increase kelp resilience (Mora-Soto et al., 2024). Lacking high fetch or large freshwater inputs, Clusters 1 and 2 in the northern sector show less resilient kelp than in the south.
4.2 Historical and ecological perspectives of the Salish Sea kelp ecosystem
The persistence assessment, comparing PreBlob and Blob+Post periods with the historical baseline, reveals that kelp beds in the northern sector of the Salish Sea are present in a minor portion of the places where they existed in the late 19th and early 20th centuries (55% and 21% of persistent kelp, respectively). Most of the decreases in the northern sector occurred before the PreBlob times in the warmest coastlines and the Strait of Georgia, while a recent drop occurred in the Blob+Post times in the coldest and semi-sheltered coastlines. On the other hand, the coldest coasts in the southern sector, in the Strait of Juan de Fuca, show a constant 30% loss compared to the historical kelp baseline, implying that the fluctuations of the last decades do not reflect significant changes in long-term persistence. This result aligns with previous regional research in Washington State (Berry et al., 2021; Pfister et al., 2017). In previous research, Mora-Soto et al. (2024) showed that kelp located around southern Vancouver Island and the southern Gulf Islands (southern sector in this research) were resilient to marine heatwaves that occurred between 2014 to 2019. In this study, we show that in warmer locations like Cluster 4, a small fraction of kelp had persisted compared to a century ago, indicating that the decline happened before the decade of 2010. This finding largely agrees with previous research spanning 145 years in the southern Puget Sound, in the southern Salish Sea (Berry et al., 2021).
Other factors not analyzed in this research that may have played a role in long-term trends of kelp persistence include the presence (or lack) of nutrients (Weigel et al., 2023), plus effects of herbivory from urchins (Estes et al., 2016; Estes and Duggins, 1995; Wilmers et al., 2012) and kelp crabs (Dobkowski, 2017), with limited presence of predators like sea otters (Enhydra lutris). Century-long assessments have demonstrated that sea otters are drivers of kelp recovery and area increases (Hollarsmith et al., 2024; Nicholson et al., 2024). However, archaeological records show that sea otters have been nearly absent in the Salish Sea for the past 8,000 years (McKechnie and Wigen, 2011), contrary to the Strait of Juan de Fuca and the western side of Vancouver Island (Klinkenberg, 2012; Nichol et al., 2020). In contrast, spatial distribution models of green, red, and purple urchins in the Salish Sea built from species occurrence records from 2005–2021 (Nephin et al., 2020), provided in the Supplementary Material, show a high likelihood for the occurrence of red (Supplementary Figure S5) and green (Supplementary Figure S6) urchins in both the northern and the southern borders of the Salish Sea, matching kelp distribution patterns. The urchin-kelp-sea otter link is a well-known factor contributing to kelp persistence in the Northeast Pacific due to the key ecological role of sea otters in exerting top-down control on kelp herbivory (Estes et al., 2016; Estes and Duggins, 1995; Wilmers et al., 2012). Since there is a relative lack of sea otters in the Salish Sea, there may be more impact from urchins driving declines or preventing recovery of kelp after stressing periods like the Blob, but comparisons of past versus modern records to support that correlation are missing. Further studies that take these dynamics into account will need to be undertaken.
Another important factor to consider in future research is the role of anthropogenic disturbances (Dayton et al., 1998; Steneck et al., 2002) that could add more pressure on kelp already stressed by ocean warming. Our data show that relatively century-persistent kelp areas remain in highly populated areas like Burrard Inlet in Vancouver (Cluster 2) and around the Greater Victoria area (Clusters 1 and 2). However, a recent drop in kelp persistence occurred near Quadra Island and the Discovery Passage (Clusters 1 and 2), which is a narrow pass within the Salish Sea extending to the north of Vancouver Island, with relatively low levels of modern human occupation. Still, there are visible effects of land use changes, including logging, major shipping traffic routes, and industrial activities, among others (Hollarsmith et al., 2022). This area (Clusters 1 and 2 north) is characterized by the coldest clusters in which, for the period of analysis, temperatures did not reach sub-lethal levels for kelp growth (beyond 20.0°C; Supratya et al., 2020). Evaluating the effects of mechanical removal of fronds, pollution, or other types of disturbances could give more clues on the reasons for the decrease in remote and less populated areas, considering that urbanization and other economic activities such as lumber production and fishing have largely degraded ecosystems on the eastern border of the Strait of Juan de Fuca and Puget Sound (Berry et al., 2021; Pfister et al., 2017).
4.3 Use of remote sensing data to determine long-term changes of kelp in the study area
We acknowledge both the strengths and limitations of our remote sensing approach. In the northern section, our modest imagery coverage (limited by cloud cover and archived data availability) for modern kelp was mainly represented by narrow kelp beds along the coastline, while the more comprehensive available imagery for the southern section showed more extensive kelp beds. Narrow kelp beds are prevalent on the coastlines of British Columbia, characterized by high-slope bathymetries and a complex geography of islands and channels (Cavanaugh et al., 2021; Gendall et al., 2023). In these areas, kelp beds are prone to more uncertainties when mapped with medium-resolution (~30 m) satellite imagery versus areas of low-slope bathymetries where kelp areas are generally larger (Gendall et al., 2023; Mora-Soto et al., 2021; Nijland et al., 2019). For this reason, this research used only high-resolution imagery, which is limited in frequency but brings the best results at detecting kelp in this region. In the northern sector, the lack of modern kelp does not necessarily mean that kelps have vanished completely; currents, tidal fluctuations, water mixing, and the frequency of available imagery could have played a role in reducing their detectability (Cavanaugh et al., 2021; Gendall et al., 2023). Additionally, the semi-stochastic nature of Nereocystis (Springer et al., 2010) can cause significant variability in detecting kelp at the segment level (Mora-Soto et al., 2024). Nevertheless, our protocol, which used very high-resolution imagery compilation and a detailed mapping process, was designed to detect and map conspicuous canopies. Therefore, our results suggest that the northern canopies are not large or dense enough to form functional underwater forests as found in the more extensive kelp beds in the southern section of the study area. Our assemblage of several coastline segments at the cluster level suggests that even with very high-resolution imagery, there are fewer chances to detect fringing kelp beds in modern records.
4.4 Management implications
The results of this study can inform present and future management needs, such as managing kelp harvesting, identifying potential marine protected areas, and prioritizing kelp restoration projects in British Columbia and the Northeast Pacific (Cavanaugh et al., 2021). Specifically, this research emphasizes that realistic expectations for future restoration projects will be better informed by considering both the historical baseline and local environmental conditions. As the Strait of Georgia coastline and most sheltered coastlines (Clusters 3 and 4) predominantly show non-persistent kelp in modern times compared to historical kelp, restoring these habitats to reach the historical baseline may be a difficult task, considering the present environmental conditions. The recent kelp decrease in the northern area could be the focus of more urgent attention, while the extreme southern reaches of the study area do not seem to be of immediate concern unless environmental conditions change. Further studies are recommended to understand the causes of losses in remote areas, while more experimental in-situ data could lead to a new chapter on the conservation and restoration of coastal ecosystems in the Salish Sea.
5 Conclusion
This research explored the long-term persistence of kelp forests in the Salish Sea of British Columbia, Canada, by comparing remote sensing-derived modern snapshots (2002–2013 and 2014–2022), representing PreBlob and Blob+Post conditions, respectively, and contrasting them with historical kelp from the late 19th to early 20th centuries. These data were complemented with nearshore SST from a baseline of four decades (1984–2022). Nearshore temperatures showed a warming trend, with two anomaly periods starting in 2000 and 2014. Further, higher temperature anomalies occurred in warmer areas than in colder areas. The colder coasts in the southern section, from southern Vancouver Island to the Gulf Islands, fluctuated in kelp area but remained persistent in comparison with the historical record. Kelp area also fluctuated along the coasts of the Strait of Georgia and the most sheltered coastlines, but kelp beds only persisted in small fractions compared to their historical distributions. On the coldest coasts of the northern section, kelp was seldom found in the 2014–2022 period, suggesting that more studies are required to understand the underlying reasons for the area decrease along these coastlines. Overall, given the clear evidence of increasing temperatures and previous literature showing the adverse effects of temperature on Nereocystis, further studies should consider nearshore SST among the root causes that negatively impact kelp persistence. These data could help to determine the best strategies for conserving and restoring this ecosystem in present and future times.
Data availability statement
The raw data supporting the conclusions of this article will be made available on request to MC (maycira@uvic.ca), without undue reservation.
Author contributions
AM-S: Conceptualization, Data curation, Formal analysis, Investigation, Methodology, Software, Validation, Visualization, Writing – original draft, Writing – review & editing. SS: Conceptualization, Data curation, Investigation, Methodology, Software, Validation, Visualization, Writing – review & editing. LG: Conceptualization, Data curation, Investigation, Methodology, Software, Validation, Writing – review & editing. AW: Investigation, Methodology, Validation, Writing – review & editing. GN: Data curation, Formal analysis, Investigation, Writing – review & editing. SR: Writing – review & editing. IP: Funding acquisition, Project administration, Resources, Writing – review & editing. ER: Funding acquisition, Resources, Writing – review & editing. JL: Funding acquisition, Resources, Writing – review & editing. KM: Funding acquisition, Resources, Writing – review & editing. MC: Conceptualization, Funding acquisition, Methodology, Project administration, Resources, Supervision, Writing – review & editing.
Funding
The author(s) declare financial support was received for the research, authorship, and/or publication of this article. This work was supported by Fisheries and Oceans Canada and the Canadian Hydrographic Service to obtain the high-resolution satellite imagery, the Capital Regional District of Victoria for providing high-resolution aerial photos, and the Island Trust Conservancy for providing in-situ kelp observation for validation of classified kelp. Funds were available from the Pacific Salmon Foundation through a Mitacs Accelerate grant awarded to AM-S and technician salary to process digital images. Funds were also available from the Natural Sciences and Engineering Research Council of Canada Alliance grant awarded to MC (Ref. number: ALLRP 566735 - 21).
Acknowledgments
We thank the collaboration from local partners (Hakai Institute, MaPP, Mayne Island Conservancy, Parks Canada) at different stages of this project.
Conflict of interest
The authors declare that the research was conducted in the absence of any commercial or financial relationships that could be construed as a potential conflict of interest.
Publisher’s note
All claims expressed in this article are solely those of the authors and do not necessarily represent those of their affiliated organizations, or those of the publisher, the editors and the reviewers. Any product that may be evaluated in this article, or claim that may be made by its manufacturer, is not guaranteed or endorsed by the publisher.
Supplementary material
The Supplementary Material for this article can be found online at: https://www.frontiersin.org/articles/10.3389/fmars.2024.1446380/full#supplementary-material
References
Amos C. L., Martino S., Sutherland T. F., Al Rashidi T. (2014). Sea surface temperature trends in the coastal zone of British Columbia, Canada. J. Coast. Res. 31, 434–446. doi: 10.2112/JCOASTRES-D-14-00114.1
Arafeh-Dalmau N., Montaño-Moctezuma G., Martínez J. A., Beas-Luna R., Schoeman D. S., Torres-Moye G. (2019). Extreme marine heatwaves alter kelp forest community near its equatorward distribution limit. Front. Mar. Sci. 6. doi: 10.3389/fmars.2019.00499
Bell T. W., Allen J. G., Cavanaugh K. C., Siegel D. A. (2020). Three decades of variability in California’s giant kelp forests from the Landsat satellites. Remote Sens. Environ. 238, 110811. doi: 10.1016/j.rse.2018.06.039
Bell T. W., Cavanaugh K. C., Reed D. C., Siegel D. A. (2015). Geographical variability in the controls of giant kelp biomass dynamics. J. Biogeogr. 42, 2010–2021. doi: 10.1111/jbi.12550
Bell T. W., Cavanaugh K. C., Saccomanno V. R., Cavanaugh K. C., Houskeeper H. F., Eddy N., et al. (2023). Kelpwatch: a new visualization and analysis tool to explore kelp canopy dynamics reveals variable response to and recovery from marine heatwaves. PLoS One 18, e0271477. doi: 10.1371/journal.pone.0271477
Berry H. D., Mumford T. F., Christiaen B., Dowty P., Calloway M., Ferrier L., et al. (2021). Long-term changes in kelp forests in an inner basin of the Salish Sea. PLoS One 16, e0229703. doi: 10.1371/journal.pone.0229703
Bond N. A., Cronin M. F., Freeland H., Mantua N. (2015). Causes and impacts of the 2014 warm anomaly in the NE Pacific. Geophys. Res. Lett. 42, 3414–3420. doi: 10.1002/2015GL063306
Cavanaugh K. C., Bell T., Costa M., Eddy N. E., Gendall L., Gleason M. G., et al. (2021). A review of the opportunities and challenges for using remote sensing for management of surface-canopy forming kelps. Front. Mar. Sci. 8. doi: 10.3389/fmars.2021.753531
Cavanaugh K. C., Reed D. C., Bell T. W., Castorani M. C. N., Beas-Luna R. (2019). Spatial variability in the resistance and resilience of giant kelp in southern and Baja California to a multiyear heatwave. Front. Mar. Sci. 6. doi: 10.3389/fmars.2019.00413
Cavanaugh K. C., Siegel D. A., Reed D. C., Dennison P. E. (2011). Environmental controls of giant-kelp biomass in the Santa Barbara Channel, California. Mar. Ecol. Prog. Ser. 429, 1–17. doi: 10.3354/meps09141
Chen Z., Shi J., Liu Q., Chen H., Li C. (2021). A persistent and intense marine heatwave in the Northeast Pacific during 2019–2020. Geophys. Res. Lett. 48, e2021GL093239. doi: 10.1029/2021GL093239
Connell J. H., Sousa W. P. (1983). On the evidence needed to judge ecological stability or persistence. Am. Nat. 121, 789–824. doi: 10.1086/284105
Costa M., Le Baron N., Tenhunen K., Nephin J., Willis P., Mortimor J. P., et al. (2020). Historical distribution of kelp forests on the coast of British Columbia: 1858–1956. Appl. Geogr. 120, 102230. doi: 10.1016/j.apgeog.2020.102230
Davis N. N., Badger J., Hahmann A. N., Hansen B. O., Mortensen N. G., Kelly M., et al. (2023). The Global Wind Atlas: a high-resolution dataset of climatologies and associated web-based application. Bull. Am. Meteorol. Soc. 104, E1507–E1525. doi: 10.1175/BAMS-D-21-0075.1
Dayton P. K., Tegner M. J. (1984). Catastrophic storms, El Niño, and patch stability in a southern California kelp community. Science 224, 283–285. doi: 10.1126/science.224.4646.283
Dayton P. K., Tegner M. J., Edwards P. B., Riser K. L. (1998). Sliding baselines, ghosts, and reduced expectations in kelp forest communities. Ecol. Appl. 8, 309–322. doi: 10.1890/1051-0761(1998)008[0309:SBGARE]2.0.CO;2
Dillehay T. D., Ramírez C., Pino M., Collins M. B., Rossen J., Pino-Navarro J. D. (2008). Monte Verde: seaweed, food, medicine, and the peopling of South America. Science 320, 784–786. doi: 10.1126/science.1156533
Dobkowski K. (2017). The role of kelp crabs as consumers in bull kelp forests—evidence from laboratory feeding trials and field enclosures. PeerJ 5, e3372. doi: 10.7717/peerj.3372
Erlandson J. M., Graham M. H., Bourque B. J., Corbett D., Estes J. A., Steneck R. S. (2007). The kelp highway hypothesis: marine ecology, the coastal migration theory, and the peopling of the Americas. J. Island Coast. Archaeol. 2, 161–174. doi: 10.1080/15564890701628612
Estes J. A., Burdin A., Doak D. F. (2016). Sea otters, kelp forests, and the extinction of Steller’s sea cow. Proc. Natl. Acad. Sci. 113, 880–885. doi: 10.1073/pnas.1502552112
Estes J. A., Duggins D. O. (1995). Sea otters and kelp forests in Alaska: generality and variation in a community ecological paradigm. Ecol. Monogr. 65, 75–100. doi: 10.2307/2937159
Foreman M. G. G., Sutherland G., Cummins P. F. (2004). M2 tidal dissipation around Vancouver Island: an inverse approach. Continental Shelf Res. 24, 2167–2185. doi: 10.1016/j.csr.2004.07.008
Gale K. S. P., Frid A., Lee L., McCarthy J.-B., Robb C., Rubidge E., et al. (2019). A framework for identification of ecological conservation priorities for marine protected area network design and its application in the Northern Shelf Bioregion (Nanaimo, BC Canada: Canadian Science Advisory Secretariat). Available at: https://publications.gc.ca/site/eng/9.871144/publication.html
Gendall L., Schroeder S. B., Wills P., Hessing-Lewis M., Costa M. (2023). A multi-satellite mapping framework for floating kelp forests. Remote Sens. 15, 1276. doi: 10.3390/rs15051276
Giannini F., Hunt B. P. V., Jacoby D., Costa M. (2021). Performance of OLCI Sentinel-3A satellite in the Northeast Pacific coastal waters. Remote Sens. Environ. 256, 112317. doi: 10.1016/j.rse.2021.112317
Gitelson A. A., Kaufman Y. J., Merzlyak M. N. (1996). Use of a green channel in remote sensing of global vegetation from EOS-MODIS. Remote Sens. Environ. 58, 289–298. doi: 10.1016/S0034-4257(96)00072-7
Gorelick N., Hancher M., Dixon M., Ilyushchenko S., Thau D., Moore R. (2017). Google Earth Engine: planetary-scale geospatial analysis for everyone. Remote Sens. Environ. 202, 18–27. doi: 10.1016/j.rse.2017.06.031
Gregr E. J., Palacios D. M., Thompson A., Chan K. M. A. (2019). Why less complexity produces better forecasts: an independent data evaluation of kelp habitat models. Ecography 42, 428–443. doi: 10.1111/ecog.03470
Hamilton S. L., Bell T. W., Watson J. R., Grorud-Colvert K. A., Menge B. A. (2020). Remote sensing: generation of long-term kelp bed data sets for evaluation of impacts of climatic variation. Ecology 101, e03031. doi: 10.1002/ecy.3031
Hartigan J. A., Wong M. A. (1979). Algorithm AS 136: a K-Means clustering algorithm. J. R. Stat. Soc. Ser. C Appl. Stat. 28, 100–108. doi: 10.2307/2346830
Hollarsmith J. A., Andrews K., Naar N., Starko S., Calloway M., Obaza A., et al. (2022). Toward a conceptual framework for managing and conserving marine habitats: a case study of kelp forests in the Salish Sea. Ecol. Evol. 12, e8510. doi: 10.1002/ece3.8510
Hollarsmith J. A., Cornett J. C., Evenson E., Tugaw A. (2024). A century of canopy kelp persistence and recovery in the Gulf of Alaska. Ann. Bot. 133, 105–116. doi: 10.1093/aob/mcad149
Imray J. F. (1870). North pacific pilot, part 1: sailing directions for the west coast of North America (London: James Imray & Son).
Jackson J. B. C., Kirby M. X., Berger W. H., Bjorndal K. A., Botsford L. W., Bourque B. J., et al. (2001). Historical overfishing and the recent collapse of coastal ecosystems. Science 293, 629–637. doi: 10.1126/science.1059199
Jackson J. M., Johnson G. C., Dosser H. V., Ross T. (2018). Warming from recent marine heatwave lingers in deep British Columbia fjord. Geophys. Res. Lett. 45, 9757–9764. doi: 10.1029/2018GL078971
Khangaonkar T., Nugraha A., Yun S. K., Premathilake L., Keister J. E., Bos J. (2021). Propagation of the 2014–2016 Northeast Pacific marine heatwave through the Salish Sea. Front. Mar. Sci. 8. doi: 10.3389/fmars.2021.787604
Klinkenberg B. (2012). E-Fauna BC: electronic atlas of the fauna of British Columbia. Available online at: https://ibis.geog.ubc.ca/biodiversity/efauna/indexoneword.shtml.
Kobluk H. M., Gladstone K., Reid M., Brown K., Krumhansl K. A., Salomon A. K. (2021). Indigenous knowledge of key ecological processes confers resilience to a small-scale kelp fishery. People Nat. 3, 723–739. doi: 10.1002/pan3.10211
Kriegler F. J., Malila W. A., Nalepka R. F., Richardson W. (1969). Preprocessing transformations and their effects on multispectral recognition. Remote Sens. Environ. VI 97–131.
Krumhansl K. A., Okamoto D. K., Rassweiler A., Novak M., Bolton J. J., Cavanaugh K. C., et al. (2016). Global patterns of kelp forest change over the past half-century. Proc. Natl. Acad. Sci. 113, 13785–13790. doi: 10.1073/pnas.1606102113
Kruskal W. H., Wallis W. A. (1952). Use of ranks in one-criterion variance analysis. J. Am. Stat. Assoc. 47, 583–621. doi: 10.1080/01621459.1952.10483441
McKechnie I., Wigen R. J. (2011). “Toward a historical ecology of pinniped and sea otter hunting traditions on the coast of Southern British Columbia,” in Human impacts on seals, sea lions, and sea otters: integrating archaeology and ecology in the Northeast Pacific, 1st ed. Eds. Braje T. J., Rick T. C. (Oakland, CA: University of California Press), 129–166. doi: 10.1525/j.ctt1pntkp.10
McPherson M. L., Finger D. J. I., Houskeeper H. F., Bell T. W., Carr M. H., Rogers-Bennett L., et al. (2021). Large-scale shift in the structure of a kelp forest ecosystem co-occurs with an epizootic and marine heatwave. Commun. Biol. 4, 298. doi: 10.1038/s42003-021-01827-6
Mora-Soto A., Capsey A., Friedlander A. M., Palacios M., Brewin P. E., Golding N., et al. (2021). One of the least disturbed marine coastal ecosystems on Earth: spatial and temporal persistence of Darwin’s sub-Antarctic giant kelp forests. J. Biogeogr. 48, 2562–2577. doi: 10.1111/jbi.14221
Mora-Soto A., Schroeder S., Gendall L., Wachmann A., Narayan G. R., Read S., et al. (2024). Kelp dynamics and environmental drivers in the southern Salish Sea, British Columbia, Canada. Front. Mar. Sci. 11. doi: 10.3389/fmars.2024.1323448
MPA Network BC Northern Shelf Initiative (2023). Network action plan – A summary. Available online at: https://www.dfo-mpo.gc.ca/oceans/publications/nsb-mpan-ramp-bpn/index-eng.html (Accessed 03 July, 2024).
Nephin J., Gregr E. J., St. Germain C., Fields C., Finney J. L. (2020). Development of a species distribution modelling framework and its application to twelve species on Canada’s pacific coast. (Ottawa ON, Canada: DFO Can. Sci. Advis. Sec. Res. Doc). xii + 107 p.
Nichol L. M., Doniol-Valcroze T., Watson J. C., Foster E. U. (2020). Trends in growth of the sea otter (Enhydra lutris) population in British Columbia 1977 to 2017 (Nanaimo, BC Canada: DFO Can. Sci. Advis. Sec. Res. Doc). vii + 29 p.
Nicholson T. E., McClenachan L., Tanaka K. R., Van Houtan K. S. (2024). Sea otter recovery buffers century-scale declines in California kelp forests. PLoS Climate 3, e0000290. doi: 10.1371/journal.pclm.0000290
Nijland W., Reshitnyk L., Rubidge E. (2019). Satellite remote sensing of canopy-forming kelp on a complex coastline: a novel procedure using the Landsat image archive. Remote Sens. Environ. 220, 41–50. doi: 10.1016/j.rse.2018.10.032
Pedersen M. F., Filbee-Dexter K., Frisk N. L., Sárossy Z., Wernberg T. (2021). Carbon sequestration potential increased by incomplete anaerobic decomposition of kelp detritus. Mar. Ecol. Prog. Ser. 660, 53–67. doi: 10.3354/meps13613
Pfister C. A., Berry H. D., Mumford T. (2017). The dynamics of Kelp Forests in the Northeast Pacific Ocean and the relationship with environmental drivers. J. Ecol. 106, 1520–1533. doi: 10.1111/1365-2745.12908
R Core Team (2024). R: A language and environment for statistical computing (Vienna, Austria: R Foundation for Statistical Computing). Available at: https://www.r-project.org/.
Rogers-Bennett L., Catton C. A. (2019). Marine heat wave and multiple stressors tip bull kelp forest to sea urchin barrens. Sci. Rep. 9, 15050. doi: 10.1038/s41598-019-51114-y
Schiel D. R., Steinbeck J. R., Foster M. S. (2004). Ten years of induced ocean warming causes comprehensive changes in marine benthic communities. Ecology 85, 1833–1839. doi: 10.1890/03-3107
Schroeder S. B., Boyer L., Juanes F., Costa M. (2020). Spatial and temporal persistence of nearshore kelp beds on the west coast of British Columbia, Canada using satellite remote sensing. Remote Sens. Ecol. Conserv. 6, 327–343. doi: 10.1002/rse2.142
Schroeder S. B., Dupont C., Boyer L., Juanes F., Costa M. (2019). Passive remote sensing technology for mapping bull kelp (Nereocystis luetkeana): a review of techniques and regional case study. Global Ecol. Conserv. 19, e00683. doi: 10.1016/j.gecco.2019.e00683
Shaffer A. (2003). “Preferential use of nearshore kelp habitats by juvenile salmon and forage fish,” in Proceedings of the 2003 Georgia Basin/Puget Sound Research Conference. (Vancouver, Canada: Puget Sound Action Team), 1–11.
Smale D. A. (2020). Impacts of ocean warming on kelp forest ecosystems. New Phytol. 225, 1447–1454. doi: 10.1111/nph.16107
Springer Y. P., Hays C. G., Carr M. H., Mackey M. R. (2010). Toward ecosystem-based management of marine macroalgae—the bull kelp, Nereocystis luetkeana. Oceanogr. Mar. Biol. 48, 1. doi: 10.1201/EBK1439821169-c1
Starko S., Neufeld C. J., Gendall L., Timmer B., Campbell L., Yakimishyn J., et al. (2022). Microclimate predicts kelp forest extinction in the face of direct and indirect marine heatwave effects. Ecol. Appl. 32, e2673. doi: 10.1002/eap.2673
Starko S., Timmer B., Reshitnyk L., Csordas M., McHenry J., Schroeder S., et al. (2024). Local and regional variation in kelp loss and stability across coastal British Columbia. Mar. Ecol. Prog. Ser. 733, 1–26. doi: 10.3354/meps14548
Steneck R. S., Graham M. H., Bourque B. J., Corbett D., Erlandson J. M., Estes J. A., et al. (2002). Kelp forest ecosystems: biodiversity, stability, resilience and future. Environ. Conserv. 29, 436–459. doi: 10.1017/S0376892902000322
Supratya V. P., Coleman L. J. M., Martone P. T. (2020). Elevated temperature affects phenotypic plasticity in the bull kelp (Nereocystis luetkeana, Phaeophyceae). J. Phycol. 56, 1534–1541. doi: 10.1111/jpy.13049
Tegner M. J., Dayton P. K., Edwards P. B., Riser K. L. (1997). Large-scale, low-frequency oceanographic effects on kelp forest succession: a tale of two cohorts. Mar. Ecol. Prog. Ser. 146, 117–134. doi: 10.3354/meps146117
Trimble Germany GmbH (2021). Trimble documentation eCognition developer 10.1 user guide (Munich, Germany: Trimble Germany GmbH).
Turner N. J. (2001). “Coastal peoples and marine plants on the Northwest Coast,” in Proceedings of the International Association of Aquatic and Marine Science Libraries and Information Centers, Victoria, British Columbia.
United Nations Environment Programme (2023). Into the blue: securing a sustainable future for kelp forests (Nairobi: GRID-Arendal).
Wachmann A., Starko S., Neufeld C. J., Costa M. (2024). Validating Landsat analysis ready data for nearshore sea surface temperature monitoring in the Northeast Pacific. Remote Sens. 16, 920. doi: 10.3390/rs16050920
Weigel B. L., Small S. L., Berry H. D., Dethier M. N. (2023). Effects of temperature and nutrients on microscopic stages of the bull kelp (Nereocystis luetkeana, Phaeophyceae). J. Phycol. 59, 893–907. doi: 10.1111/jpy.13366
Wernberg T., Krumhansl K., Filbee-Dexter K., Pedersen M. F. (2019). “Status and trends for the world’s kelp forests,” in World seas: an environmental evaluation (London: Academic Press, Elsevier Inc.), 57–78. doi: 10.1016/B978-0-12-805052-1.00003-6
Wilmers C. C., Estes J. A., Edwards M., Laidre K. L., Konar B. (2012). Do trophic cascades affect the storage and flux of atmospheric carbon? An analysis of sea otters and kelp forests. Front. Ecol. Environ. 10, 409–415. doi: 10.1890/110176
Keywords: Nereocystis luetkeana, bull kelp, persistence, Salish Sea, Blob, satellite imagery
Citation: Mora-Soto A, Schroeder S, Gendall L, Wachmann A, Narayan G, Read S, Pearsall I, Rubidge E, Lessard J, Martell K and Costa M (2024) Back to the past: long-term persistence of bull kelp forests in the Strait of Georgia, Salish Sea, Canada. Front. Mar. Sci. 11:1446380. doi: 10.3389/fmars.2024.1446380
Received: 09 June 2024; Accepted: 17 July 2024;
Published: 17 September 2024.
Edited by:
Christopher Edward Cornwall, Victoria University of Wellington, New ZealandCopyright © 2024 Mora-Soto, Schroeder, Gendall, Wachmann, Narayan, Read, Pearsall, Rubidge, Lessard, Martell and Costa. This is an open-access article distributed under the terms of the Creative Commons Attribution License (CC BY). The use, distribution or reproduction in other forums is permitted, provided the original author(s) and the copyright owner(s) are credited and that the original publication in this journal is cited, in accordance with accepted academic practice. No use, distribution or reproduction is permitted which does not comply with these terms.
*Correspondence: Alejandra Mora-Soto, YWxlbW9yYXNAdXZpYy5jYQ==; Maycira Costa, bWF5Y2lyYUB1dmljLmNh