 Ernest Czermański
 Izabela Kotowska
 Aneta Oniszczuk-Jastrząbek
 Michał Pluciński3
 Elżbieta Szaruga
- 1Faculty of Economics, University of Gdansk, Gdansk, Poland
- 2Faculty of Economics and Transport Engineering, Maritime University of Szczecin, Szczecin, Poland
- 3Institute of Management, University of Szczecin, Szczecin, Poland
The purpose of the article is to fill the research gap in identifying and prioritizing the factors that determine the choice of a port for handling circular supply chains (CSC). To this end, Polish seaports handling CSC cargo with an average turnover of at least 100,000 tons in the last 10 years were analyzed. The authors analyzed CSC cargo occurring in seaports, in two stages, both in terms of quantity and quality. The first stage involved an analysis of the literature and the European Commission’s programs on the development of the Circular Economy (CE), followed by an analysis of the relationship between the size of the port, measured by the average volume of cargo handled at the studied port, and the average share of CSC cargo in total cargo handling. On the other hand, in the second stage, based on face-to-face interviews, the factors that determine the choice of a particular port for handling CSC cargo were extracted. The study revealed a significant relationship between port size and the share of CSC cargo in total cargo handling. Furthermore, the research identified and prioritized key factors influencing the choice of ports for CSC, providing valuable insights for port authorities and policymakers. These findings can serve as a foundation for further academic research aimed at optimizing port operations within circular supply chains and advancing the theoretical framework of circular economy logistics. Port authorities and businesses can leverage these insights to enhance strategic decision-making, improve operational efficiency, and strengthen their competitive advantage in the circular economy landscape.
1 Introduction
In the context of the global shift towards a more sustainable and environmentally conscious economic model, the role of ports has become increasingly crucial in the implementation and advancement of circular economy principles. Ports, as hubs of trade and transportation, possess significant potential to contribute to the transition towards a circular economy by adopting innovative practices and fostering collaboration among various stakeholders. Ports around the world are recognizing the benefits and opportunities presented by the circular economy, with a recent study indicating a 60% increase in future interest in adopting circular economy principles among port authorities (Alamoush et al., 2021).
A circular economy is defined as an alternative model that minimizes resource depletion, waste, and emissions (Geissdoerfer et al., 2020). A circular economy integrates reduction, reuse, and recycling operations for sustainable development in an effort to break the link between economic growth and development and the use of limited resources (Padilla-Rivera et al., 2020). The circular economy raises living standards while promoting waste reduction, resource conservation, and environmental preservation (Popović and Radivojevic, 2022). Through the “inclusion” of resources, circular economy activities seek to sever the connection between unsustainable patterns of production and consumption (Bjørnbet et al., 2021). Circular economy practices entail changing how goods and services are produced, consumed, and disposed of, with recycling being the most common strategy for reintroducing materials into the system (Mhatre et al., 2021). Circular economy practices include raising customer knowledge, enacting legislation and policies, cultivating a circular economy culture, raising awareness among supply chain partners, and creating goods with a circular economy mindset (Khan and Haleem, 2021).
One of the key aspects of ports’ involvement in the circular economy is their ability to collaborate with the wider supply chain and their local communities. Maritime transport is a nexus of the global supply chains, and ports have a crucial role to play in green supply and global value chains (Fredouet, 2023). Furthermore, ports’ deep integration within their local hinterlands means they can significantly impact the economic activity and sustainability of their surrounding areas (Roberts et al., 2021).
However, ports also face various challenges in their pursuit of circular economy practices. The adaptation to the redesign of supply and distribution networks, as well as the limited physical space for redevelopment, can hinder ports’ ability to fully embrace circular economy principles (Roberts et al., 2021). Despite these challenges, the potential and willingness of ports to be at the forefront of the transition to a circular economy have been identified (Alamoush et al., 2021). By adopting a collaborative and integrated approach, involving key stakeholders such as logistics providers, local governments, and supply chain partners, ports can unlock the benefits of the circular economy and contribute to a more sustainable and resilient economic system.
The purpose of this article is to fill the research gap in identifying and prioritizing the factors that determine the choice of a port for handling reverse supply chains. To achieve the above goal, specific questions were formulated:
1. what cargo occurring in seaports can be classified as CSC cargo?
2. for which ports can CSC cargo be an important area of port activity?
3. what factors determine the choice of a particular port for handling CSC cargo?
In order to answer the above research questions, the article:
● identified and classified the main CSC cargo occurring in seaports,
● determined the relationship between the size of the port (port cargo handling) and the share of CSC cargo handling in total cargo handling, identified and prioritized the factors that determined the choice of a particular port for handling CSC cargo.
Polish ports were selected as the target sample of the study due to. They are secondary ports and are predisposed to analyses related to the circular economy. The secondary ports, though limited in their ability to handle large vessels due to insufficient technical infrastructure, have ample room to expand activities such as transshipment, storage, industrial operations, distribution, and logistics. This potential can position them as key contributors to circular supply chains. Additionally, the role of stevedores is crucial in fostering this development. These workers, who are quick to adapt to shifting market trends, are proactive in finding new types of cargo to replace those that are no longer available, and adjust their services accordingly, driving the advancement of circular supply chain operations at these secondary ports (Mańkowska et al., 2020). Therefore, the studied ports play an important role as active participants in the land transport chains of CSC cargo.
2 Literature review
Seaports are quickly becoming crucial hubs for circular operations that integrate logistics, sustainability, and production. They adapt to the concepts of the circular economy through the implementation of cooperative waste management, and the creation of circular activities (Kovačič Lukman et al., 2022). Seaports concentrate on industrial growth, waterfront projects, and maritime clusters to mitigate negative effects and benefit the local community (Ferreira et al., 2022). To encourage industrial growth, waterfront economies, and circular manufacturing activities, ports must modify their business models (de Langen et al., 2020; de Martino, 2022). Cutting-edge models that highlight sustainability and waste management in port operations, such as waste-to-clean energy systems at ports, show the viability and additional value of circular approaches (Karimpour et al., 2019). Seaports that embrace circularity concepts can improve waste management procedures, develop new energy sources, and streamline overall port operations (Ferreira et al., 2022). Evaluating seaports’ circular operations using established indicators and the 9 R-strategy transitions can reveal information about their sustainability and circularity value (Kovačič Lukman et al., 2022).
Seaports successfully conduct recycling programs using a variety of ways. One method involves the use of Green Port concepts based on circular economy principles, as seen in Bali, Indonesia, where waste from various port activities is recycled to generate new energy and improve sustainability (Ferreira et al., 2022). Furthermore, the green port concept stresses environmental quality, energy and resource utilization, waste management, and habitat quality, all of which are critical for achieving green port hub status and increasing port competitiveness, as proven in the case study of Port Klang in Malaysia (Jeevan et al., 2023).
In Poland, the idea of “green ports,” which integrate economic, social, and environmental elements, is still in its infancy and is intended to promote sustainable growth (Oniszczuk-Jastrząbek et al., 2018). The importance of Polish seaports to the country’s economy has led to an increase in interest in corporate social responsibility (CSR) in these ports (Michalska-Szajer et al., 2021). Ports in Poland must implement sustainable development plans and operations to solve social and environmental challenges (Dziennik Ustaw, 2023) while retaining public approval to satisfy the needs of growing global trade (Adamowicz and Puszkarski, 2018). Because of the Baltic Sea’s vulnerability, the environmental performance of Polish ports is crucial, highlighting the necessity of environmental management systems and adherence to regulatory standards (McCallum, 2022). In general, there is an effort to guarantee the long-term viability of Polish ports by striking a balance between economic expansion and social and environmental concerns. Seaports in Poland are gradually implementing sustainable principles through bottom-up efforts by port authorities, supported by local and regional authorities, to adapt to sustainable economy principles (Bocheński et al., 2021). Seaports in Poland, like Szczecin, adapt to circular economy principles by utilizing secondary ports for sustainable supply chains, facing challenges like infrastructure, coordination, and cultural issues (Mańkowska et al., 2020). By adopting circularity, seaports enable a more economically and environmentally sustainable port ecosystem by fostering creative business models, enhancing sustainability, and producing new energy sources from waste. In general, the circular economy encourages ports to innovate, work with stakeholders, and find new ways to prosper in a more sustainable and circular future. Through circular activities, ports are acknowledged as vital centers that may improve economic competitiveness, job prospects, and investments while reducing adverse effects (Sacco and Cerreta, 2022; Roberts et al., 2021). With a suggested framework to improve cooperation and the adoption of circular practices for mutual advantages, seaports have a clear chance to lead the worldwide shift to a circular economy (Kovačič Lukman et al., 2022).
Table 1 presents some seaports that have introduced a circular economy. Based on a literature review, they were assigned types of recovered/recycled waste.
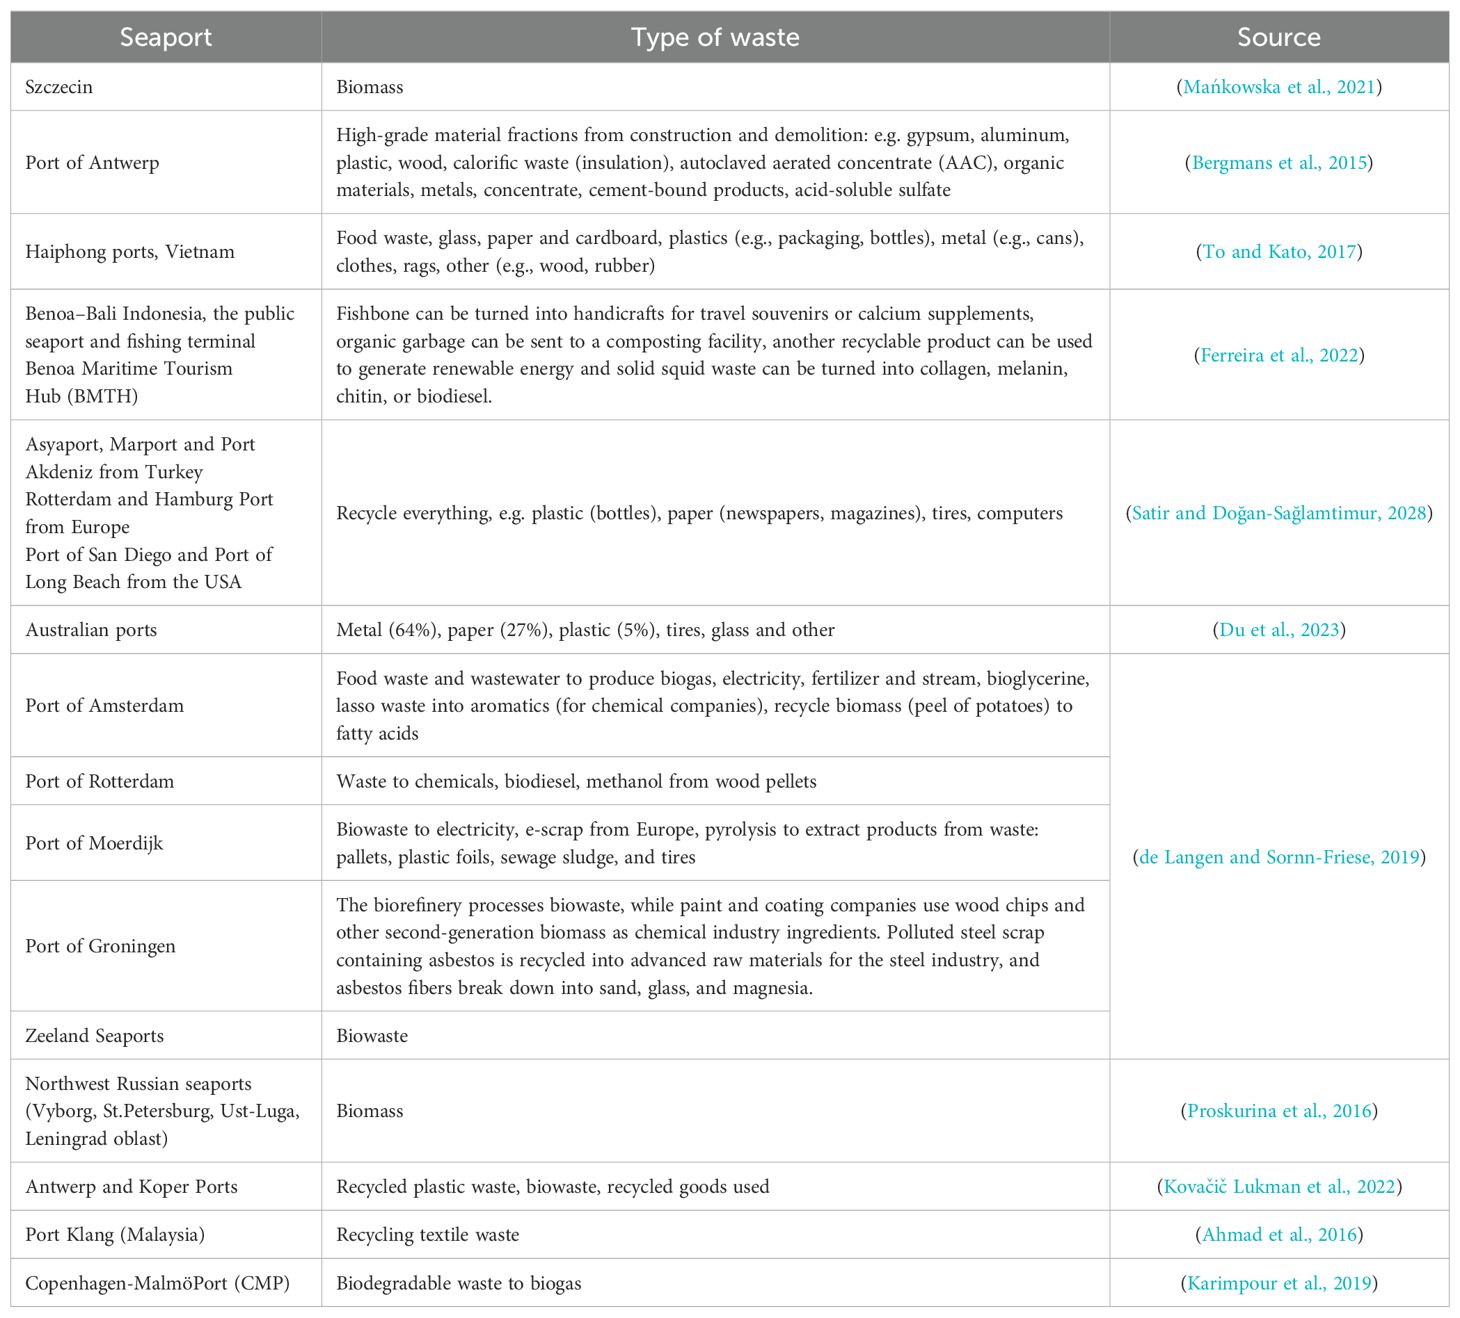
Table 1. Types of recycled waste of selected seaports from literature review.
An extension of the concept of the circular economy along with its practical impact on the functioning of selected seaports is presented in Table 2. Research to date has mainly focused on the role of seaports in the development of CE through their impact on waste treatment, the development of reverse supply chains, and the creation of a waste treatment port industry. Few studies show how CSC cargo can influence port development. However, there are no studies showing the relationship between port size and the importance of CSC cargo on port operations or development opportunities. Nor does the research to date show the factors that determine the choice of a port as a link in reverse supply chains, or which cargo occurring in seaports can be classified as CSC cargo.
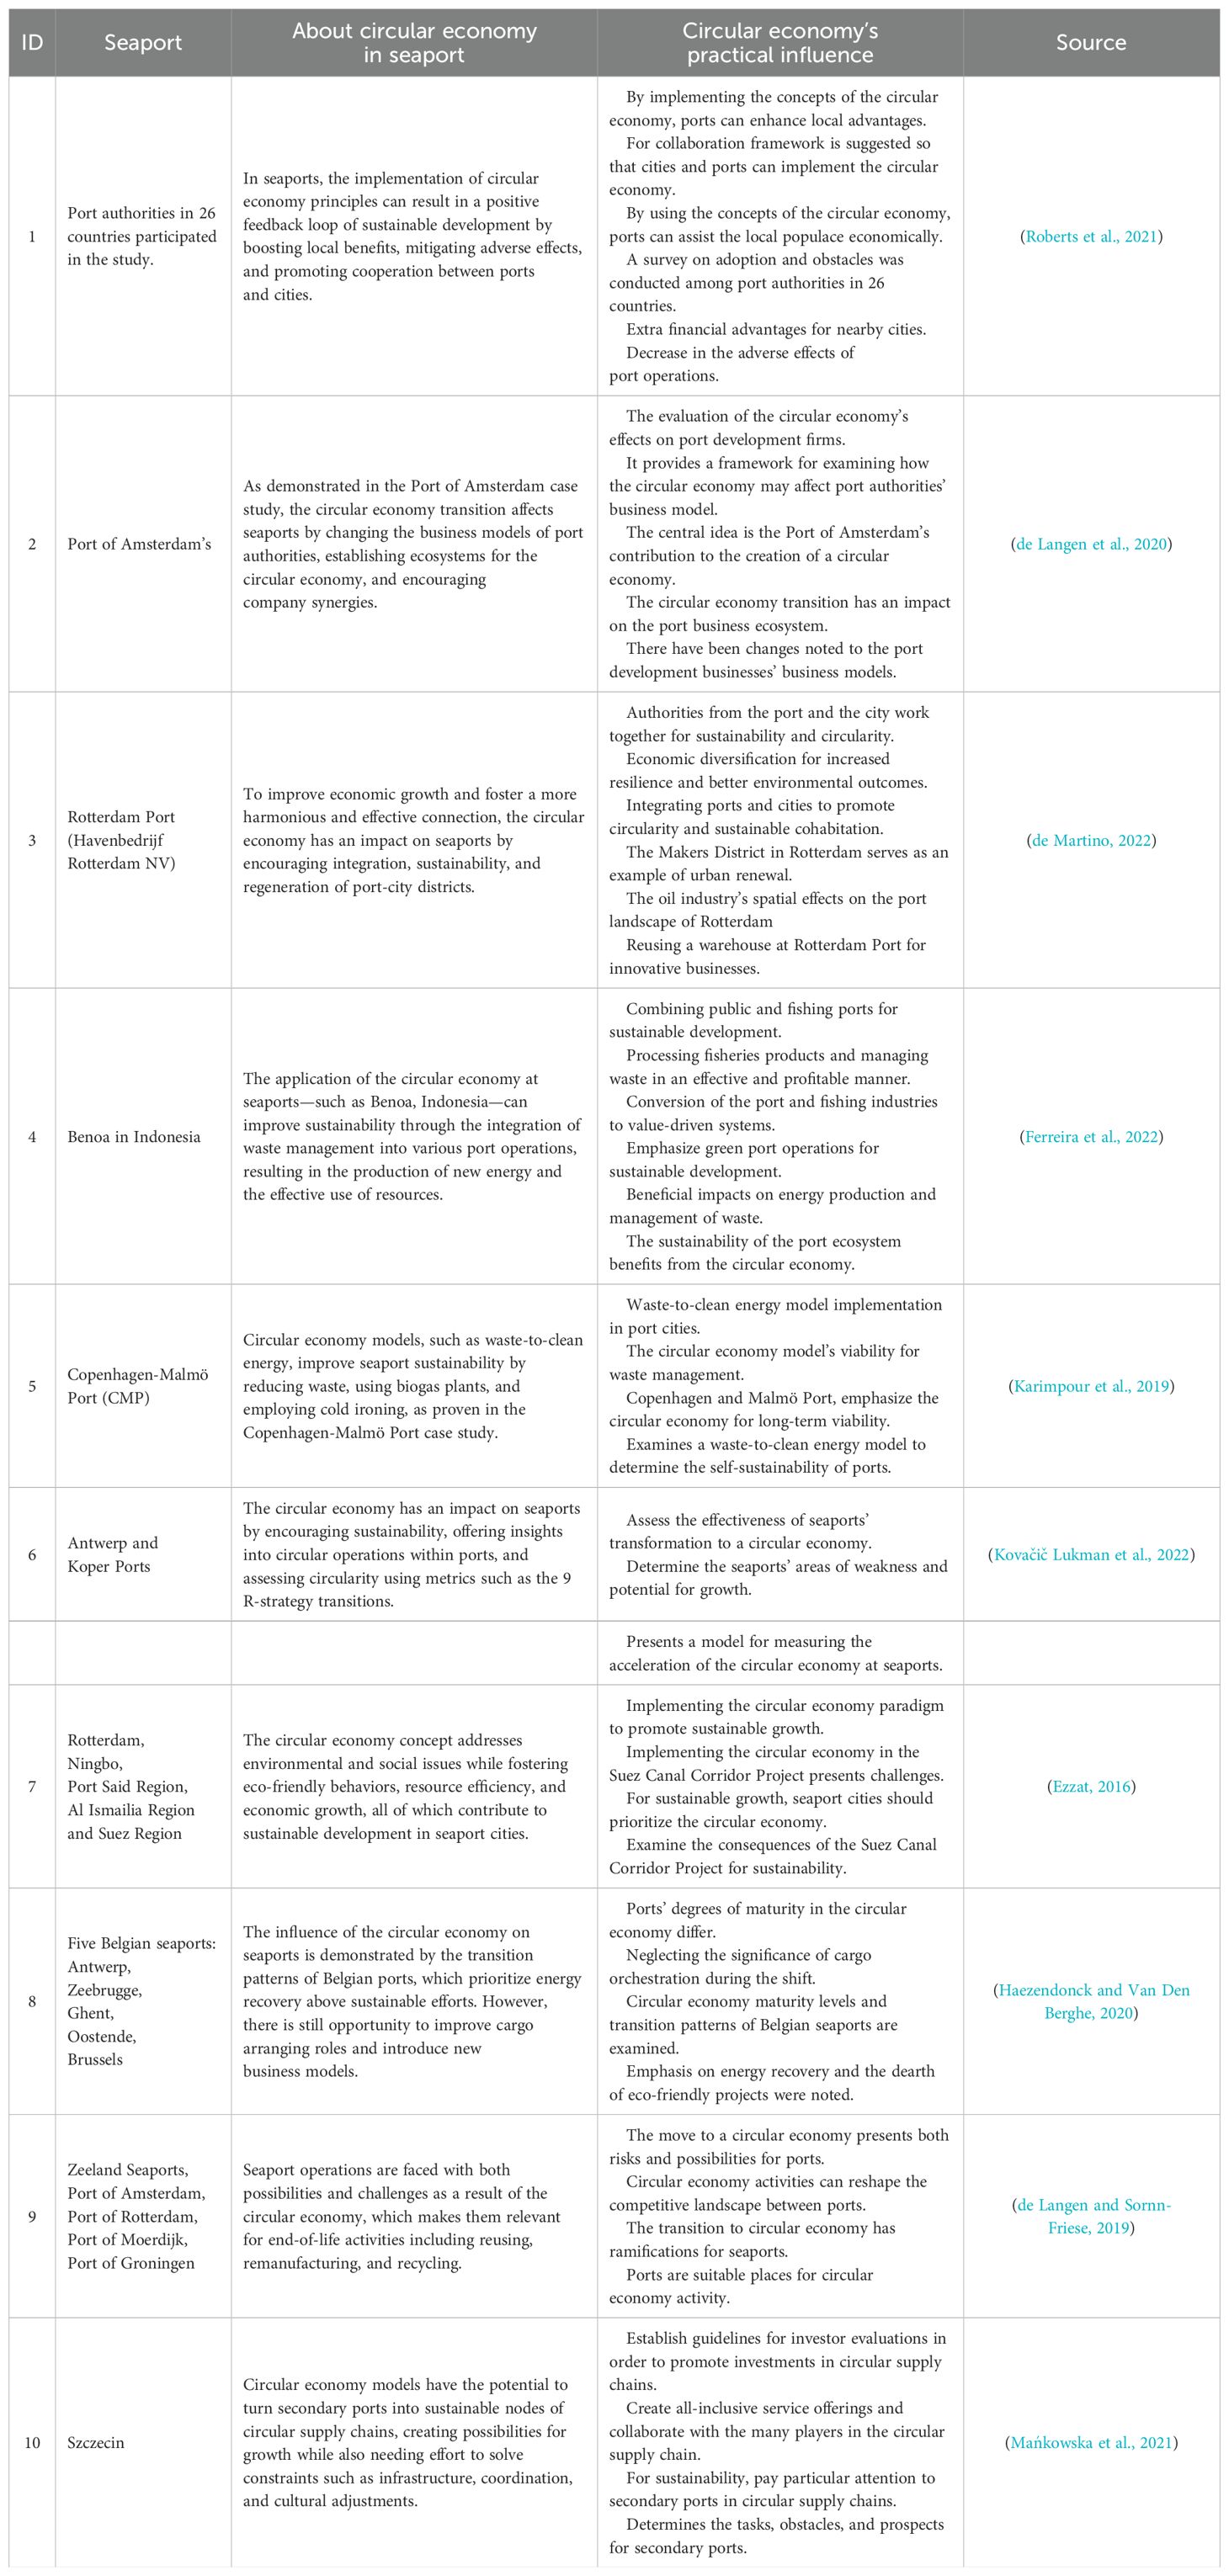
Table 2. The circular economy in seaport – practical influence from literature review.
The concept of a circular economy has gained considerable attention in recent years as a way of addressing complex and pressing sustainability challenges. One area that has received particular attention in this regard is the role of seaports, which play a key role in the movement of goods and materials in an urban context. Seaports are often located in historic city centres and are well placed to act as hubs for circular economy initiatives, such as the reuse and repurposing of buildings and land. However, implementing circular economy strategies in seaports can be challenging and there is a need for a more systematic approach to assessing and monitoring progress. To address this need, research is underway to develop criteria and indicators to assess the performance of the circular economy in seaports. Research on circular economy indicators for ports is still in an exploratory phase, characterised by a lack of in-depth studies on the development of port-related circular economy indicators. Faut et al. extracted a set of relevant and feasible CE indicators to support port authorities as well as port stakeholders in monitoring the ongoing CE transformation. Through a multi-method qualitative study, a feasible list of 12 CE indicators for ports was developed. Seven of these are highly feasible and five have medium feasibility in terms of relevance to stakeholders and ease of implementation (Faut et al., 2023). In contrast, Courtens et al. analysed the process of transitioning to a circular economy, which included six steps in the identification or discovery phase for each project: (1) identification of supply-side boundary conditions for deliberate discovery of a circular economy initiative; (2) identification of demand-side boundary conditions for deliberate discovery of a circular economy initiative using reference projects in other ports; (3) matching the dual boundary conditions (see 1 and 2) with available locations in the port area under consideration; (4) assessing the economic promise of circular economy initiative prospects that may include port users; (5) identifying a ‘coalition of the willing’ around promising circular economy initiative prospects; (6) matching available locations (see 3) with the most promising circular economy initiative prospects (see 4 and 5) in the port (Courtens et al., 2023). Based on a semi-systematic analysis of the literature review and a SWOT analysis, Barona et al. examined CE practices in seaports and the potential of adopting closed-loop business models to create value for port stakeholders and contribute to the United Nations Sustainable Development Goals (Barona et al., 2023). The study found that ports are developing circular practices and business models for technical and biological flows, but the level of implementation is moderate to low.
3 Data & methods
3.1 Characteristics of the ports under consideration
The subject of the analysis are Polish seaports handling CSC cargo with an average turnover of at least 100,000 tonnes in the last 10 years. These are ports of fundamental importance to the economy, i.e.: Gdańsk, Gdynia, Szczecin, and Świnoujście handling more than 10 million tonnes per year, as well as medium-size Polish ports of regional or local importance: Kołobrzeg and Darłowo, whose transshipments range from 100-300 thousand tonnes. The location of the studied ports on the Polish coast is shown in Figure 1. Table 3 shows the transshipments in 2011-2022.
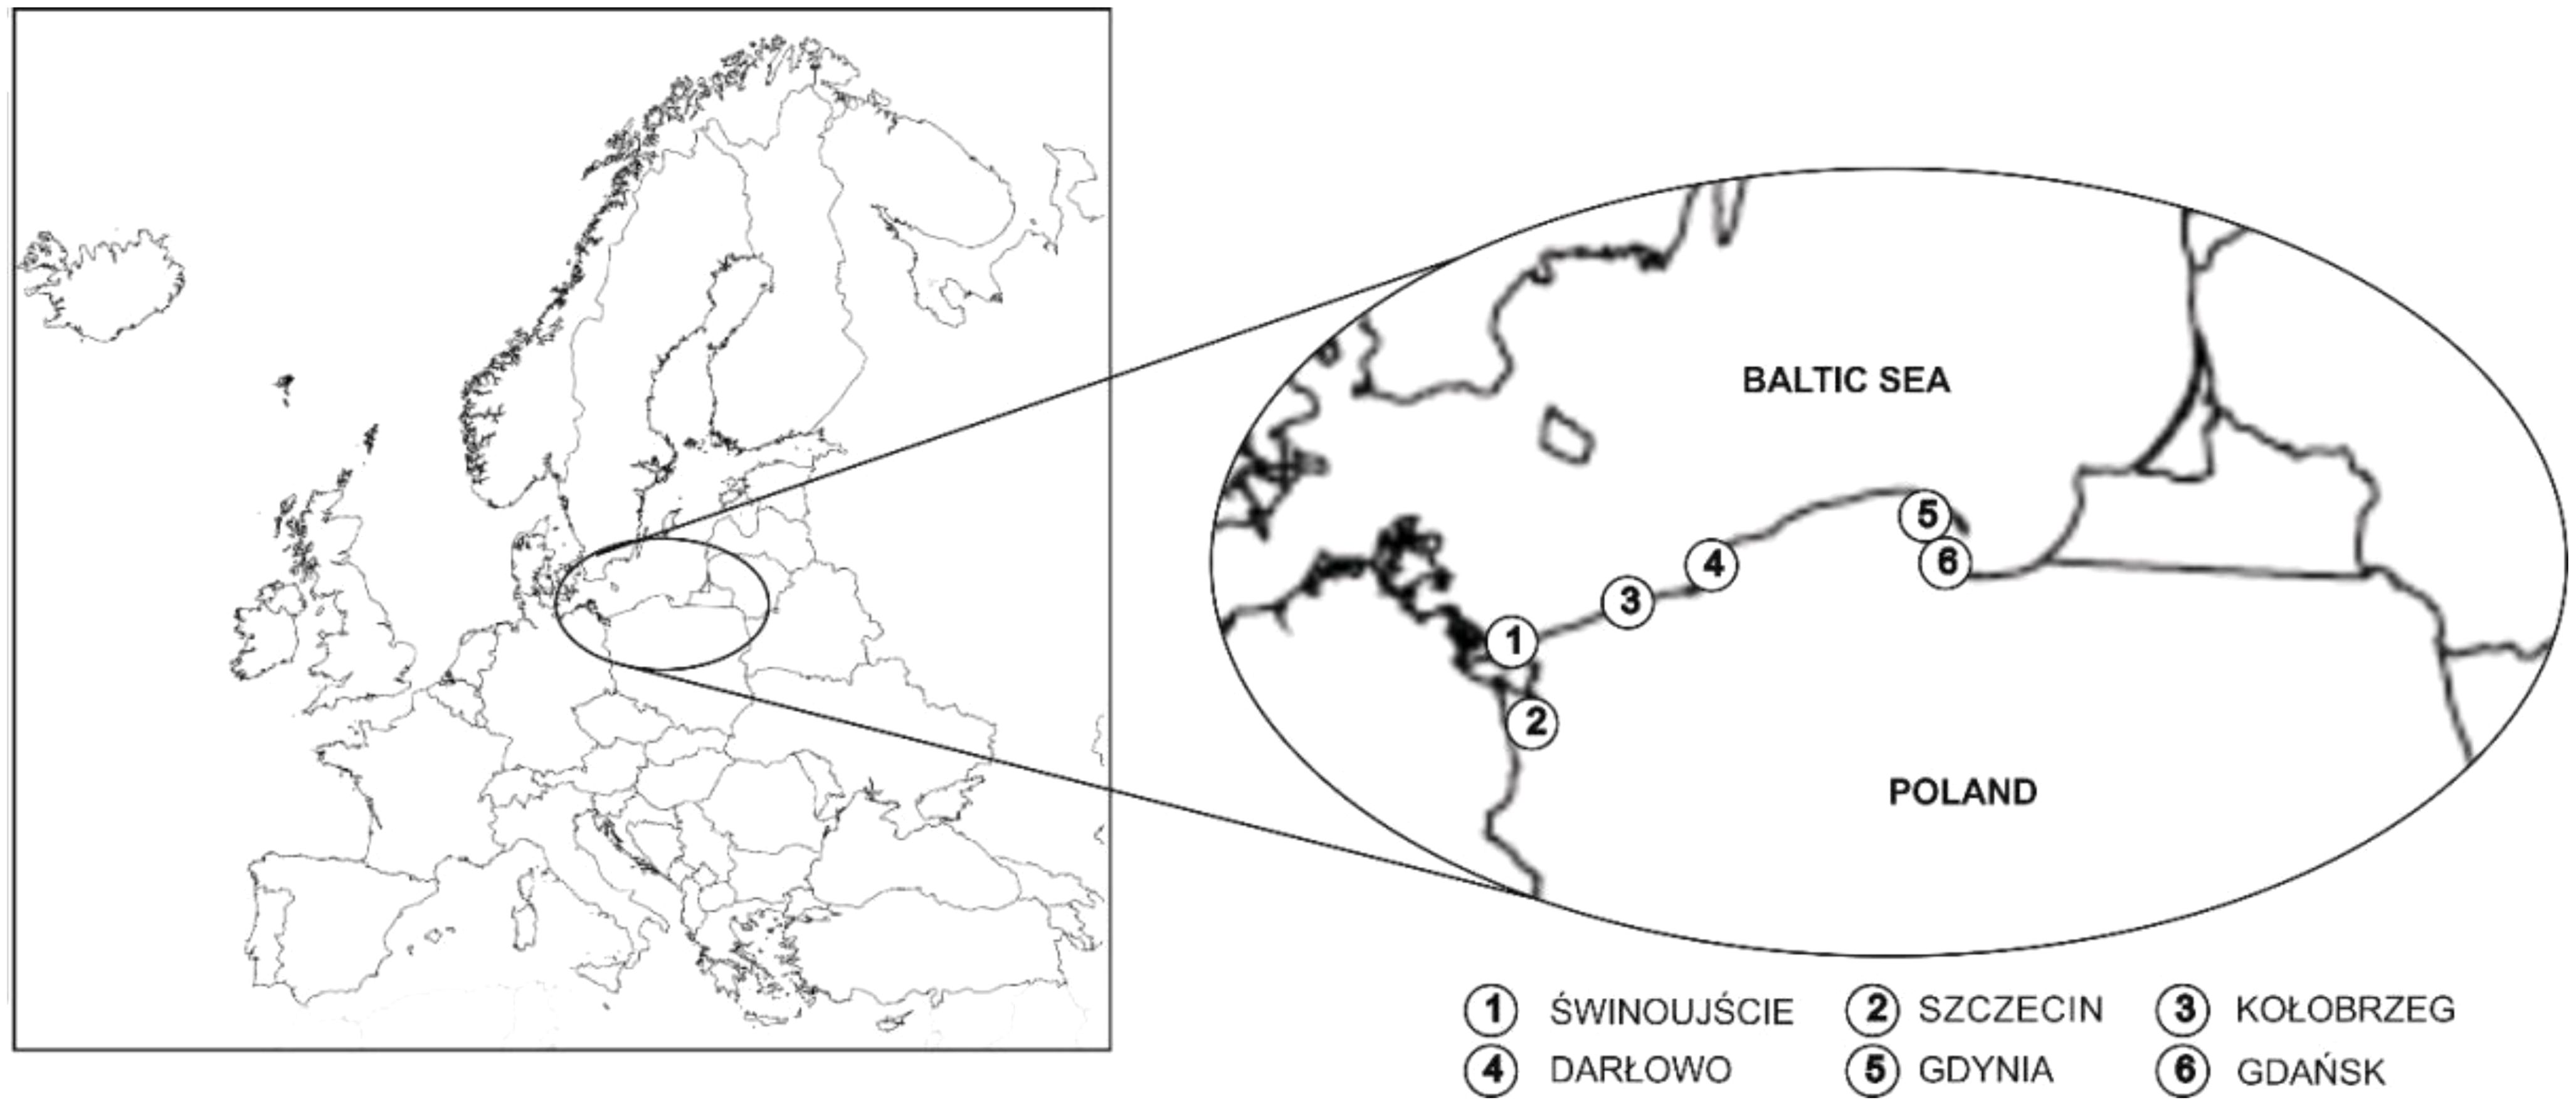
Figure 1. Location of ports surveyed.
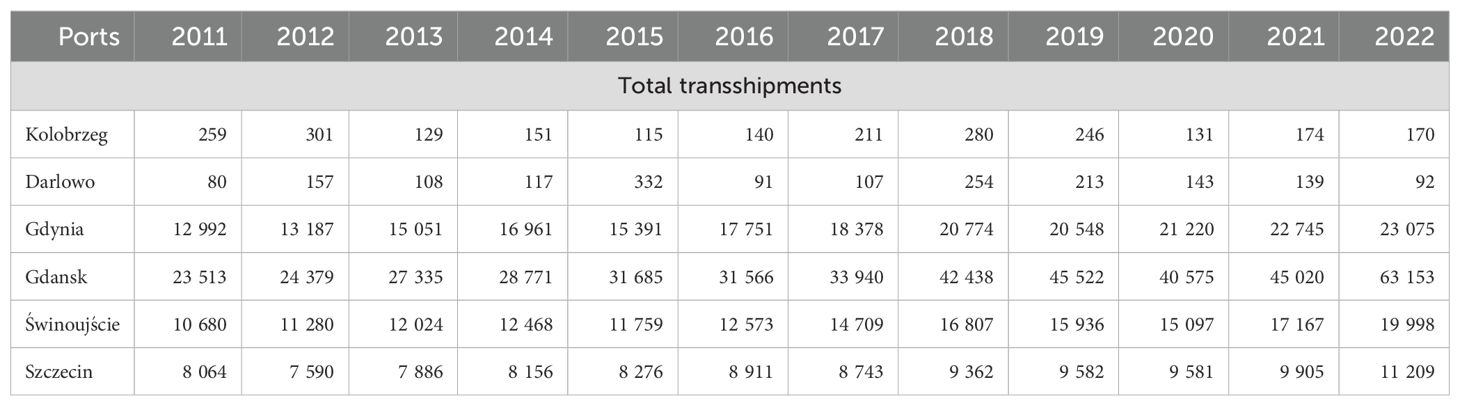
Table 3. Total transshipments from 2012 to 2022 of the studied ports.
3.2 Methods
To answer the first research question What types of cargo occurring in seaports can be classified as CSC cargo? An analysis of the literature and European Commission programs on the development of the CE was carried out (European Commission, 2020) as well as European Union and national legislation on waste management. Based on these, the loads occurring in seaports were identified, which were further subjected to statistical analysis and qualitative research.
To determine for which ports CSC cargo may be an important area of port activity (Research Question 2), the relationship between the size of the port, measured by the average turnover of cargo handled at the studied port (TT) in 2012-2022, and the average share of CSC cargo in total cargo handling (CET) was analyzed according to the formula:
The individual indicators for the ports analyzed were as follows (Table 4):
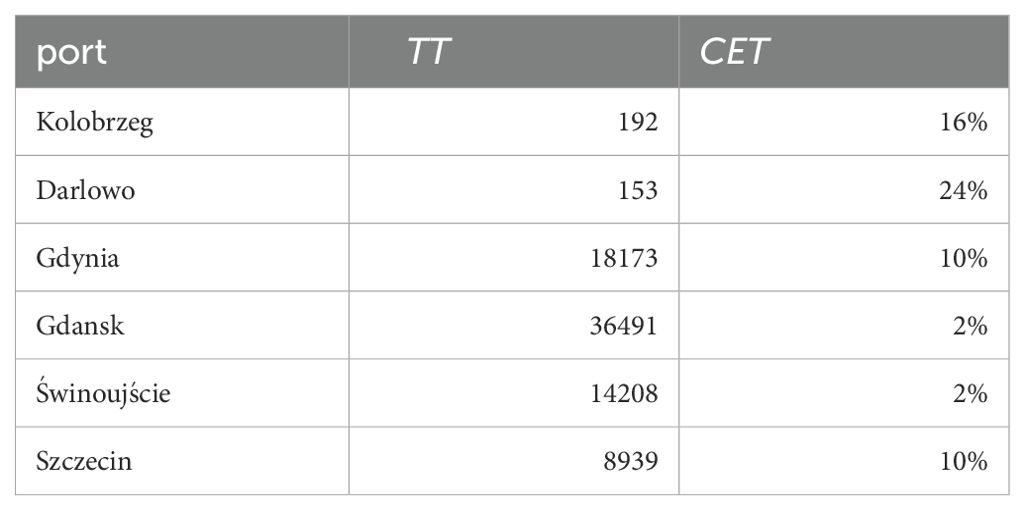
Table 4. TT and CET indicators for the ports surveyed (thousand tonnes).
The main data sources were data obtained from the Eurostat Database as well as transshipment statistics obtained directly from the ports surveyed. The results were presented in graphical form, based on which a trend function was determined.
To answer the second research question What factors determine the choice of a particular port for handling CSC cargo? Face-to-face interviews were conducted. In the case of ports generating less cargo handling (A, B), these were representatives of the entities managing these ports. For the other ports (C, D, E, F), representatives of handling and storage companies. The characteristics of the entities surveyed are shown in Table 5.
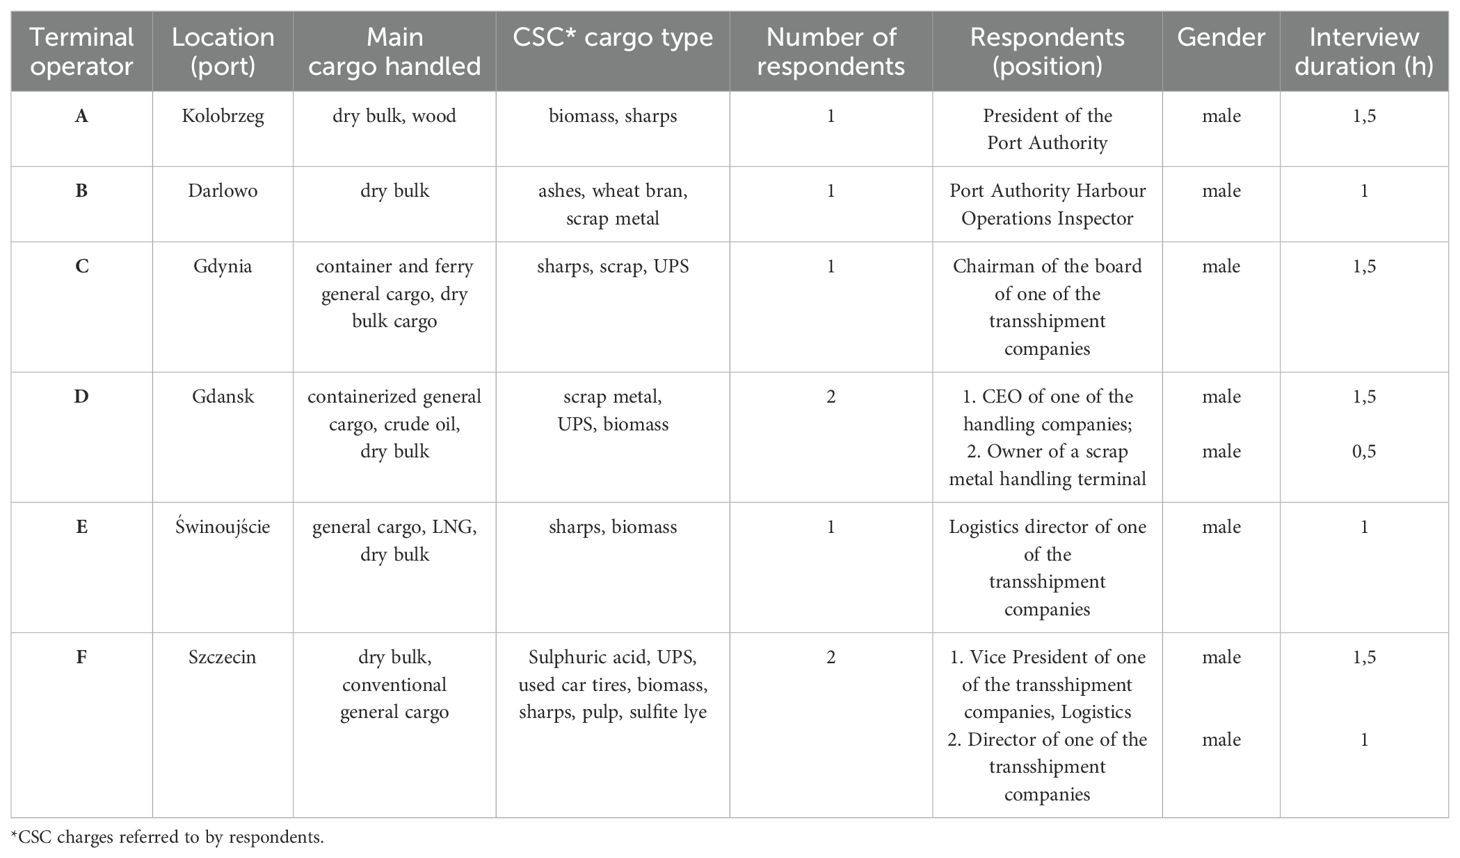
Table 5. Synthetic characteristics of respondents surveyed.
Eight interviews were conducted, the duration of which ranged from 0.5 to 1.5 hours. The average interview duration was 1 h 11 min. The location of the interview depended on the location of the port (Table 5), these were the following locations: Kołobrzeg, Darłowo, Gdynia, Gdańsk, Świnoujście, Szczecin. All respondents were men. The selection of respondents was purposeful due to their competencies and knowledge in the field of transshipment and storage of CSC cargo. In smaller ports (Darłowo, Kołobrzeg), port authorities, in addition to their management functions, directly create the directions of operational activity. In the remaining ports, the selection of entities resulted from the scope of their professional competencies.
In the next step, the identified factors were classified and prioritized and, based on these, actions (managerial implications) were proposed to be taken to intensify CSC cargo handling in seaports.
4 Results
4.1 Identification of CSC cargo handled in seaports
The circular economy is an economic system designed to maximize the use of resources and generate a minimum amount of waste for disposal (Deutz, 2020).
In March 2020, the European Commission unveiled the fresh Circular Economy Action Plan (CEAP). CE primarily, but not exclusively policy objective is to reduce waste. Actions focus on the sectors that use the most resources and where the potential for circularity is high such as electronics and ICT, batteries and vehicles, packaging, plastics, textiles, construction and buildings, food, water, and nutrients.
According to the above definition, CE’s sphere of interest is primarily waste. However, many researchers include by-products in this group (Batista et al., 2018; Lavelli, 2021; Dervojeda et al., 2014) which arise because of production and are not the main purpose of production. In practice, CSC cargo can be divided into:
● consumer waste
● production: waste and by-products (understood as substances created as a result of a production process whose primary purpose is not its production) (Figure 2).
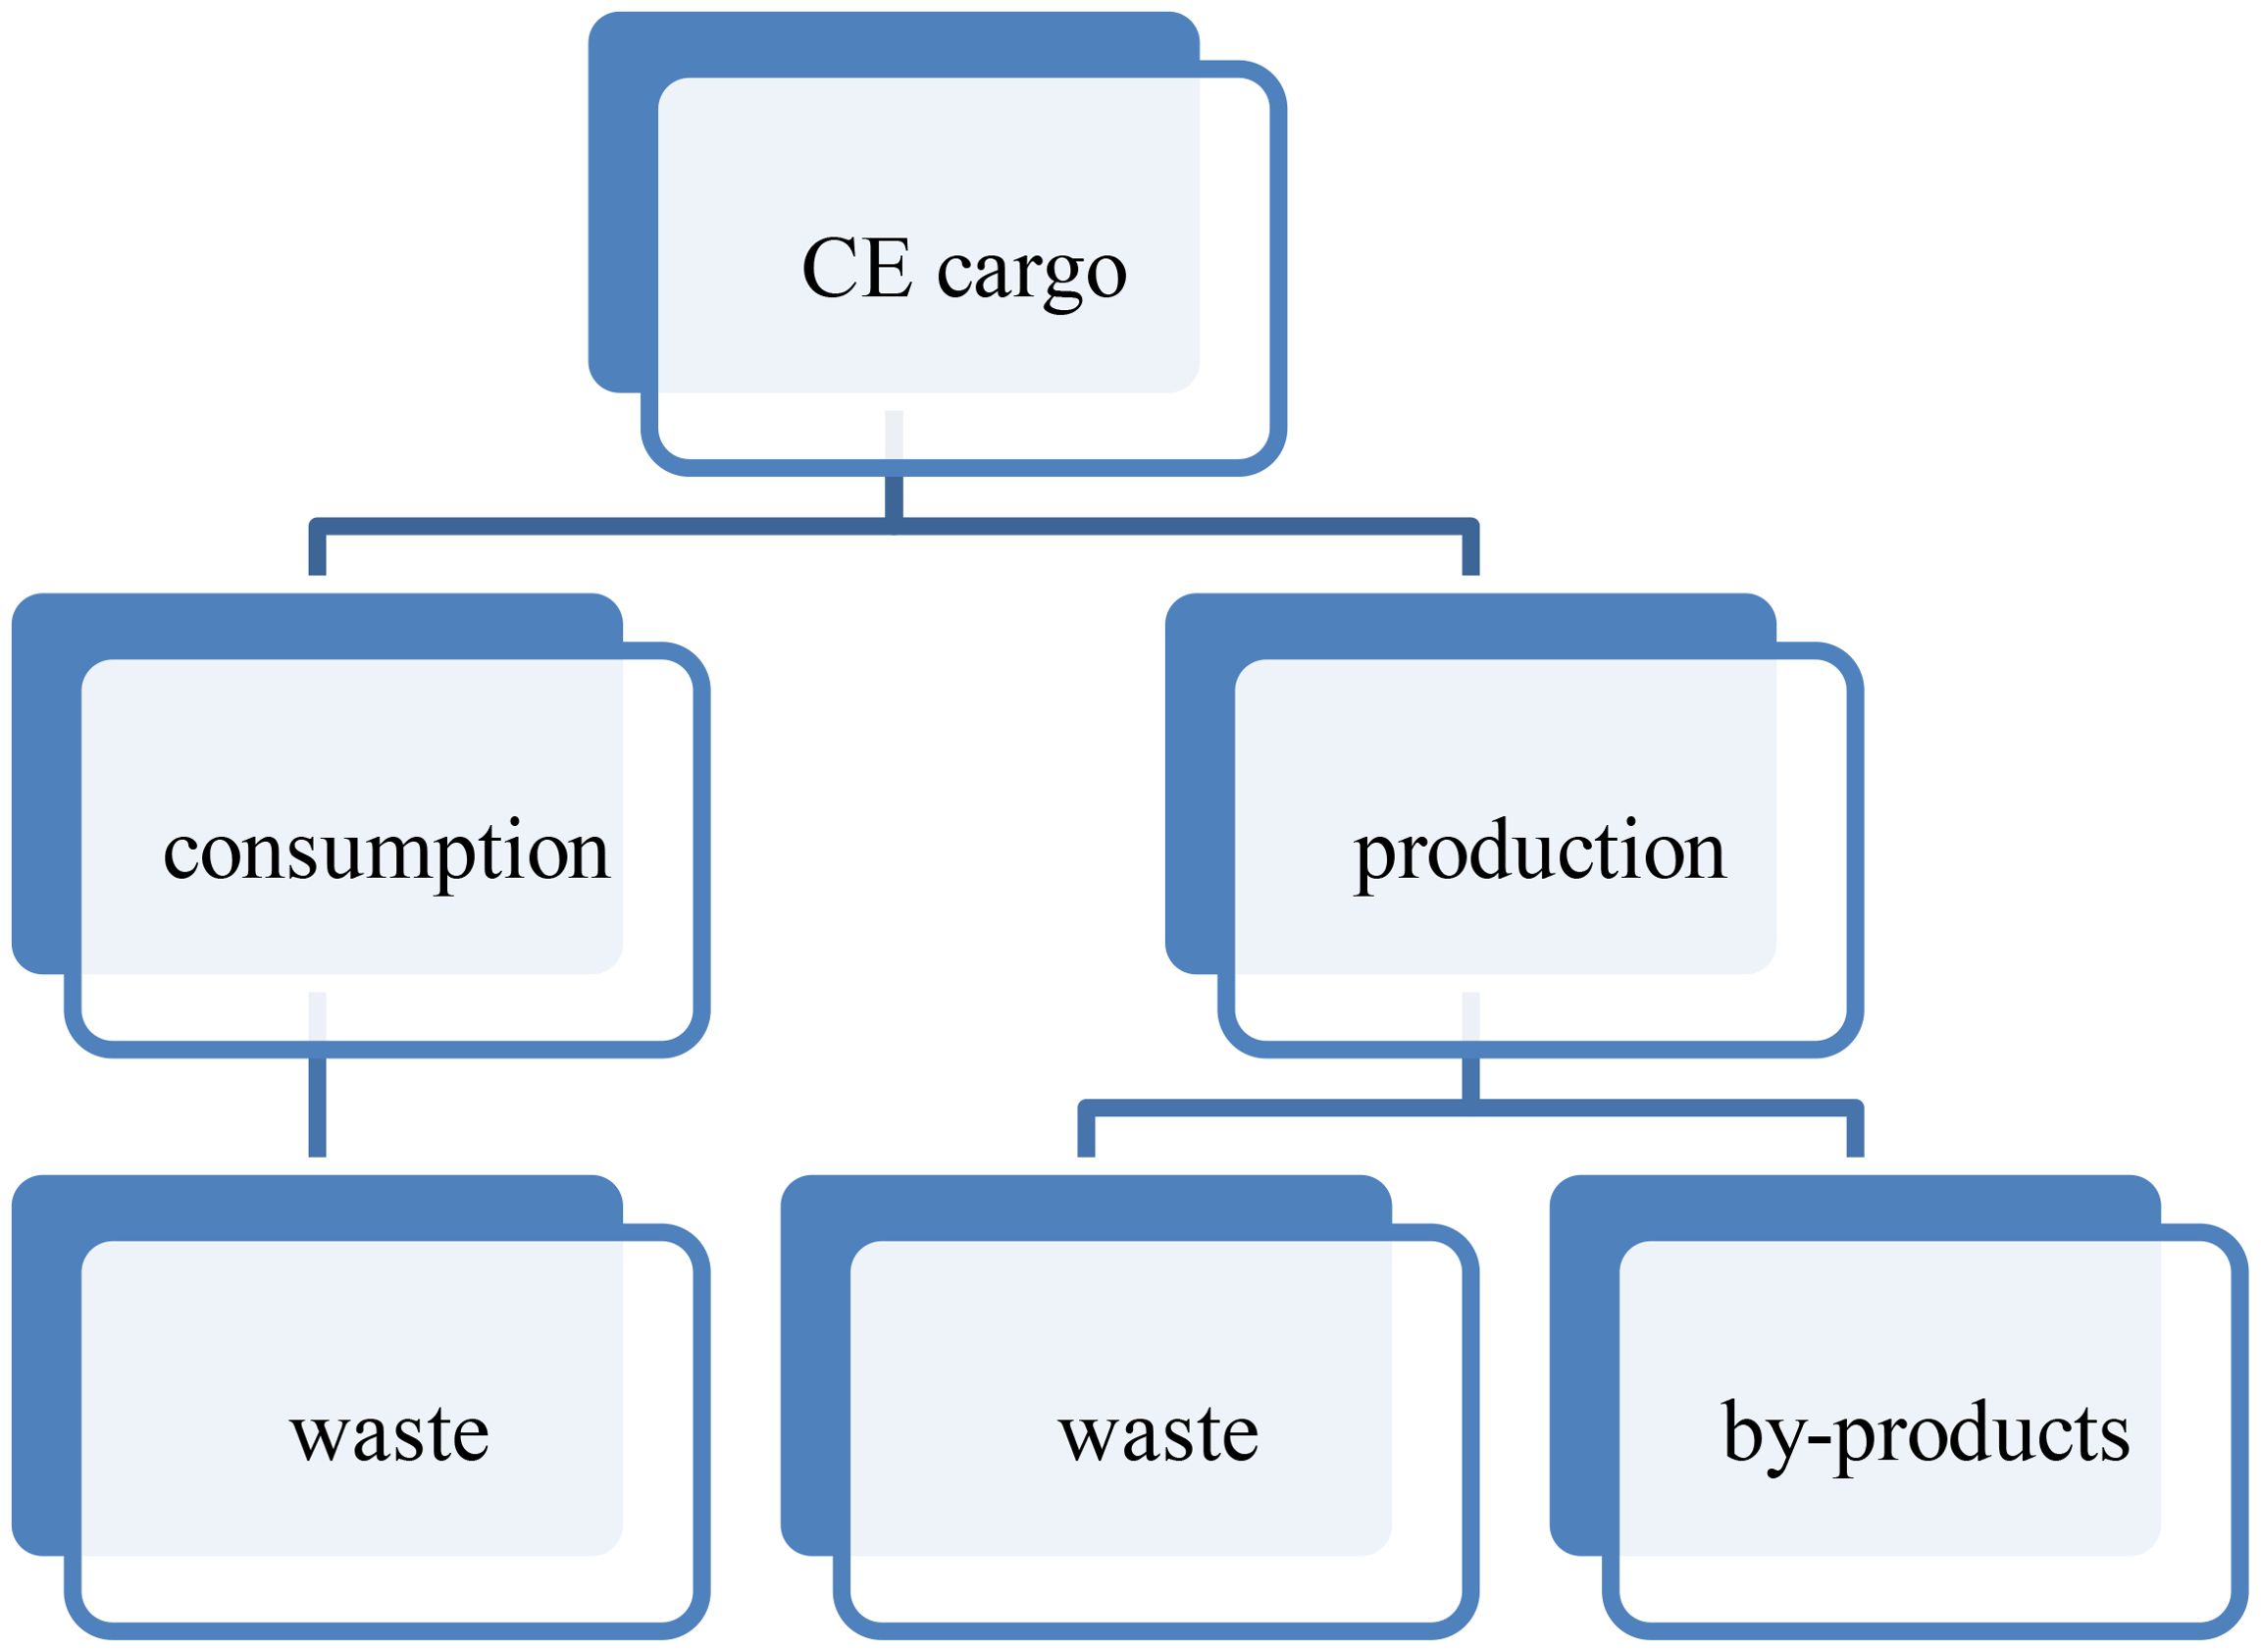
Figure 2. Circular Economy cargo.
The division of CE loads is a consequence of the classification of CE supply chains presented in the literature (and the chains owe their names to the “generators” of loads). A similar classification system of loads in the circular supply chain is presented in research (Mańkowska et al., 2020). This classification is important because it provides tools for better management of resource flows in the economy, supporting the goals of sustainable development and the circular economy, by increasing the efficiency of raw material use. There are as many as 5 premises that justify the above classification:
1. Identification of resource flows - allows for the recognition of how resources flow in the consumption and production phases through the economic system, making it easier to identify where waste is generated.
2. Optimization of production processes - waste is generated in the consumption process, but also in production. It was identified that there is a “by-product” category, which allows entities to better optimize their processes. By-products can be reused, which allows for minimizing raw material losses and increasing production efficiency.
3. Support for the idea of a circular economy - this classification indicates that there is a division into waste and by-products. This means that not all products withdrawn from the main process are useless. By-products can find new applications in other production processes, which is consistent with the idea of a closed life cycle of products/materials/raw materials.
4. Waste management - the above classification provides the basis for effective management of various types of waste, by distinguishing them between those that are created in the consumption process and those that are the result of the production process. Thanks to this, sustainable recycling and reuse systems can be created more effectively.
5. Responsible monitoring and reporting - this classification provides a premise for precise monitoring of processes related to the circular economy and contributes to transparent reporting of the impact of consumption and production processes on the environment. Thanks to the conclusions drawn from monitoring and reporting, decision-makers can create appropriate regulations and strategies focused on sustainable development.
The essence of the Circular Economy idea is to find a use for waste so that they de facto become by-products. And their use in production processes becomes profitable. One of the factors that has a significant impact on production costs is the transport of raw materials. For this reason, sea transport, due to its mass and unit cost of transport, is most predestined for handling low-value CE cargo.
The subject of the research described in this article are all CSC cargo that can constitute cargo in a seaport. While the classification of consumer waste is relatively straightforward (e.g. tires or scrap metal), it is not so straightforward in the case of production residues. In the European Union, there are regulations in place to identify and classify waste (Commission Decision, 2014) covering both used consumer products (e.g. tires, vehicles) and by-products of production processes (*e.g. waste from mineral extraction, waste from agriculture, or waste from the iron and steel industry), which can be further processed and used. However, not every by-product resulting from a production process is waste. If an object or substance resulting from a production process fulfills certain conditions, e.g. it is safe for the environment and human life and health, its use is certain without further processing, it can be considered a product and be placed on the market (Dz.U.2023.1587). It is therefore difficult to assess which of the loads subject to this analysis is a by-product and which is waste. For the purpose of the study, the analysis considers those cargo handled in seaports that can be assigned a waste code according to EU regulations (Table 6).
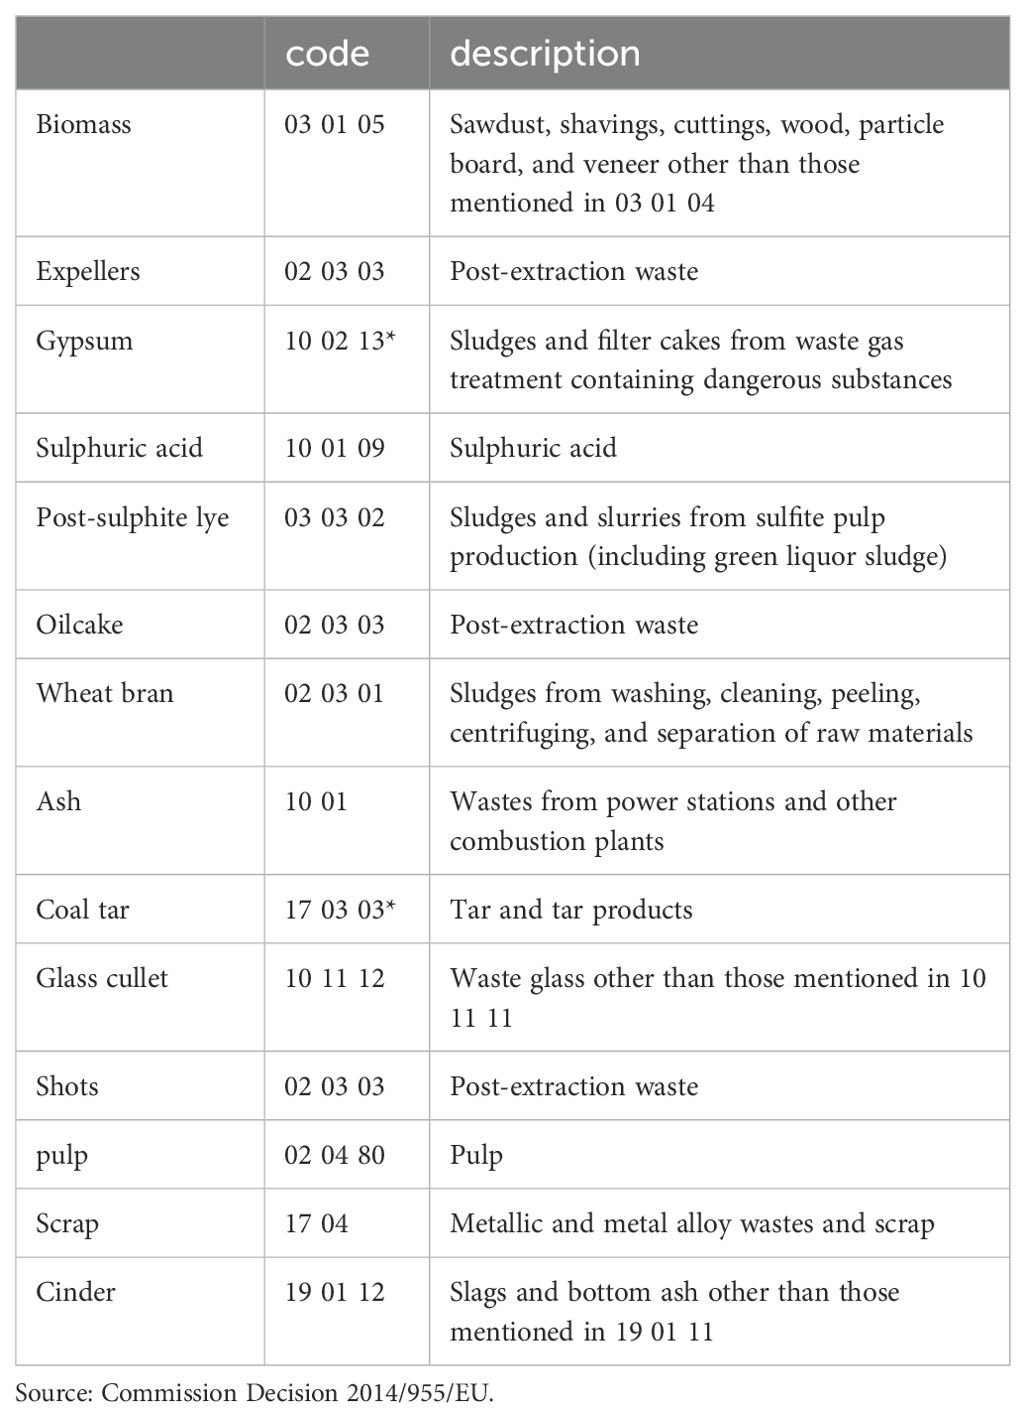
Table 6. Cargo handled in seaports subject to CE survey.
Considering sectors with potential for circularity, these are loads for:
● food sector: expellers, pulp, middlings, oilcakes, wheat bran,
● chemical and construction sectors: sulphuric acid, gypsum, ash, coal tar, glass cullet, slag, post-sulfite lye,
● energy sector: biomass
● steel sector: scrap metal.
The cargo analyzed vary greatly in value. There are products whose price does not exceed a few tens of EUR/tonne, e.g. slag, glass cullet orash. There are also products with a very high value exceeding EUR 1,000/tonne, e.g. stainless steel scrap or copper scrap. Approximate market prices of the surveyed cargo are shown in (Table 7) (as of September 2023 in Poland).

Table 7. Average unit value of selected waste in Poland by type of material and partner (Extra-EU27 (from 2020) and Intra-EU27 (from 2020)).
4.2 Analysis of CE cargo handling in the seaports studied
Ports of primary importance handle the largest volume of CSC cargo; however, these are largely agro cargo i.e. soybean meal or rapeseed, which are high-value animal feed and thus cargo desired to be handled by seaports. In the case of smaller ports, i.e. Kołobrzeg and Darłowo, these are much less valuable cargo, mainly biomass pellets and ashes (Table 8).
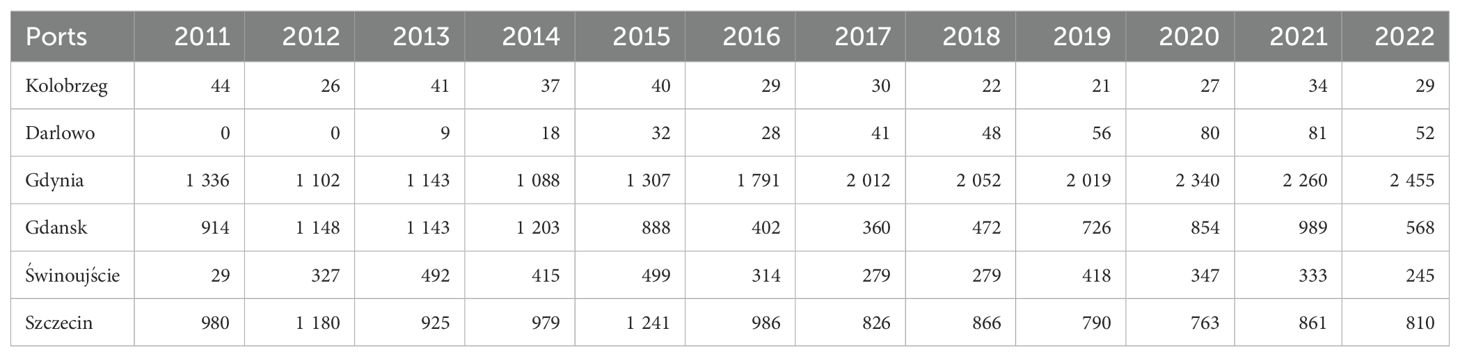
Table 8. CSC cargo transshipments between 2012 and 2022 of the ports surveyed (thousand tonnes).
The analysis of transshipments and shares of CSC cargo in total handling in seaports showed that such cargo have a different impact on the studied ports. They have the greatest impact on reloading for smaller ports, i.e. Darłowo and Kołobrzeg. Their share in reloading reached as much as 35% in Kołobrzeg (2015) and 58% in Darłowo (2021). (Figure 3), while for ports of primary importance, their share did not exceed 15%.
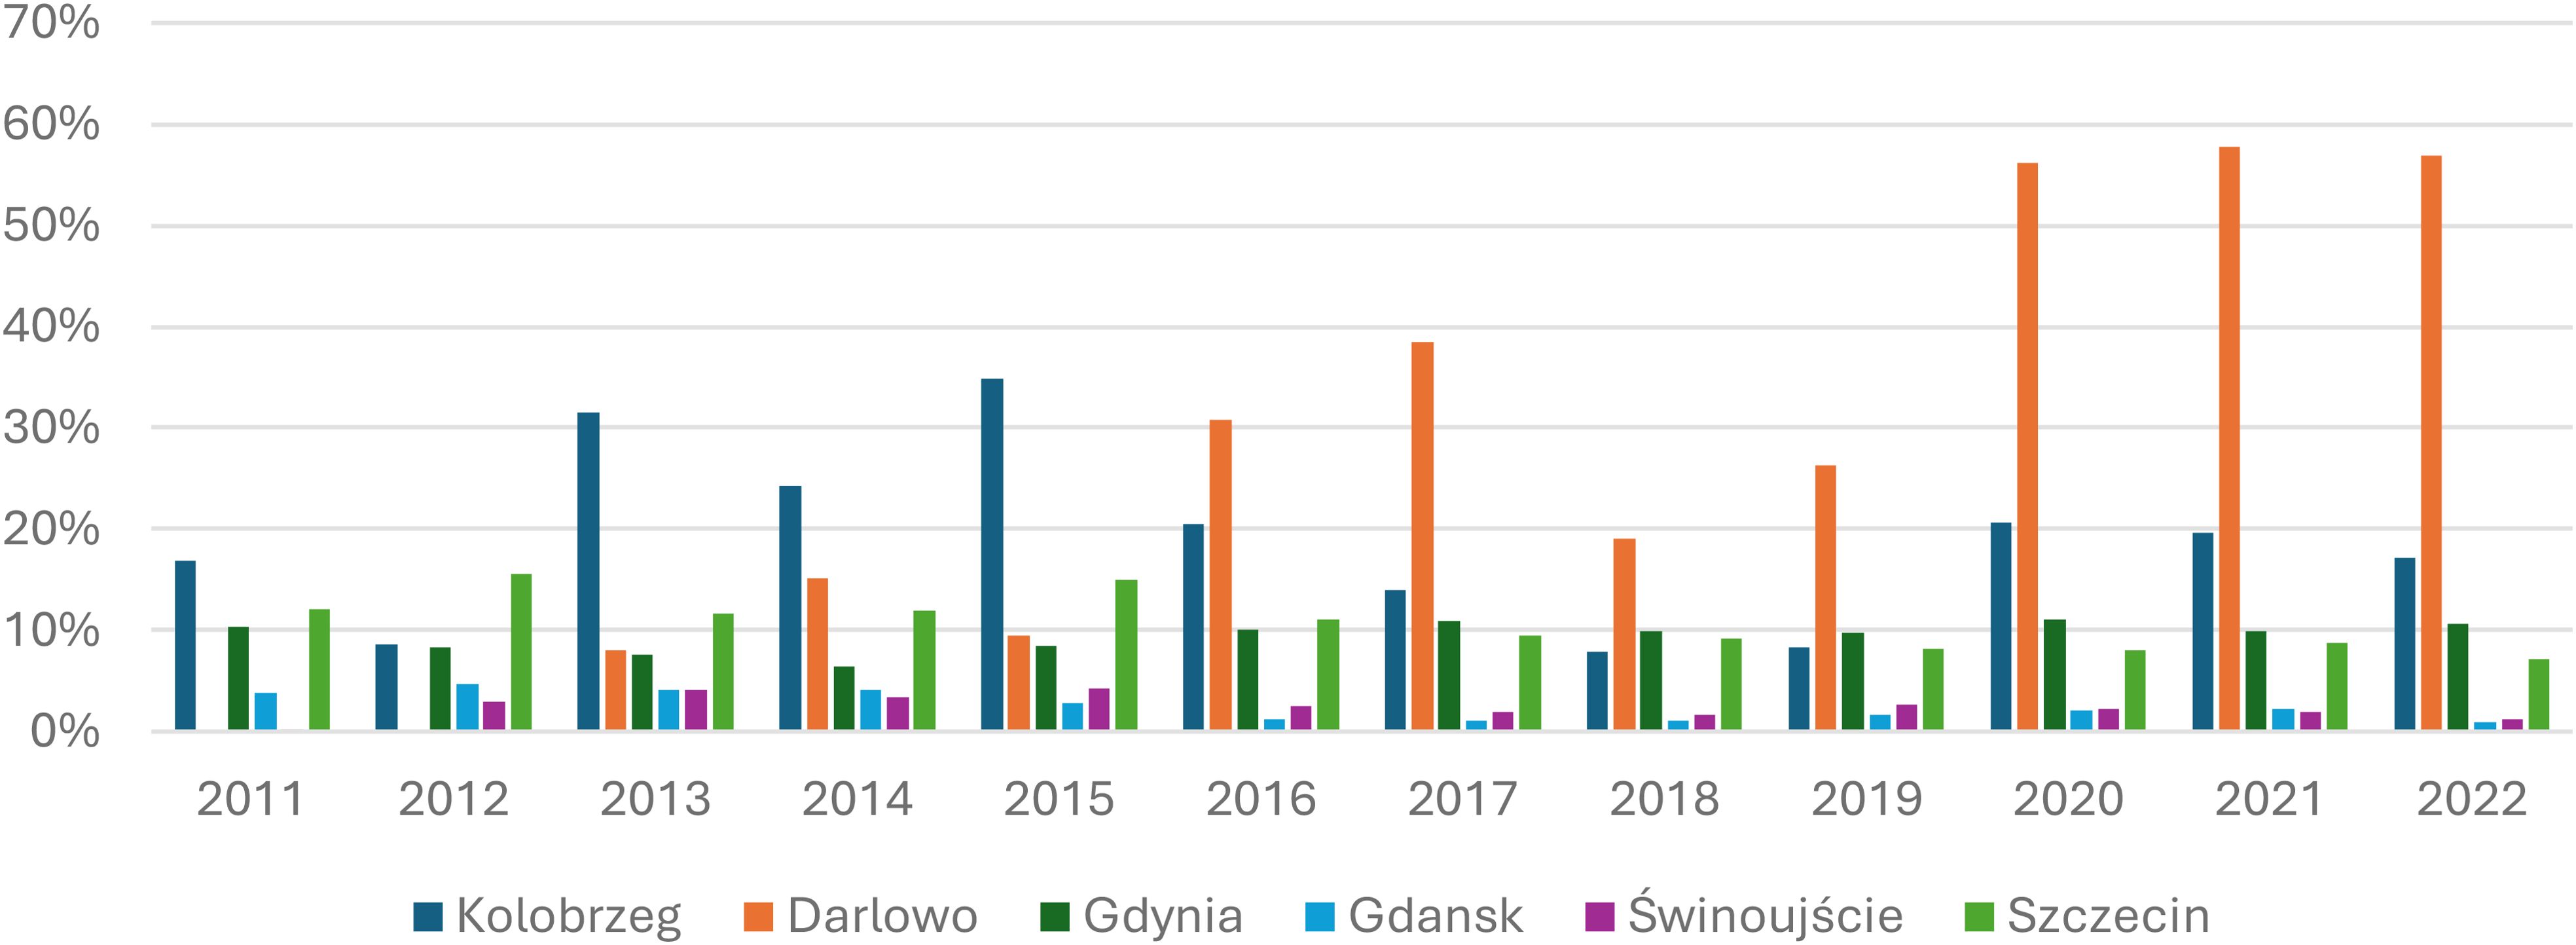
Figure 3. Share of CSC in transshipments between 2011 and 2022 in the studied ports.
An analysis of the relationship between the port’s total cargo volumes and the share of CSC cargo clearly shows a logarithmic relationship. The smaller the port’s total transshipments, the more significant the CSC share. This relationship is shown in Figure 4.
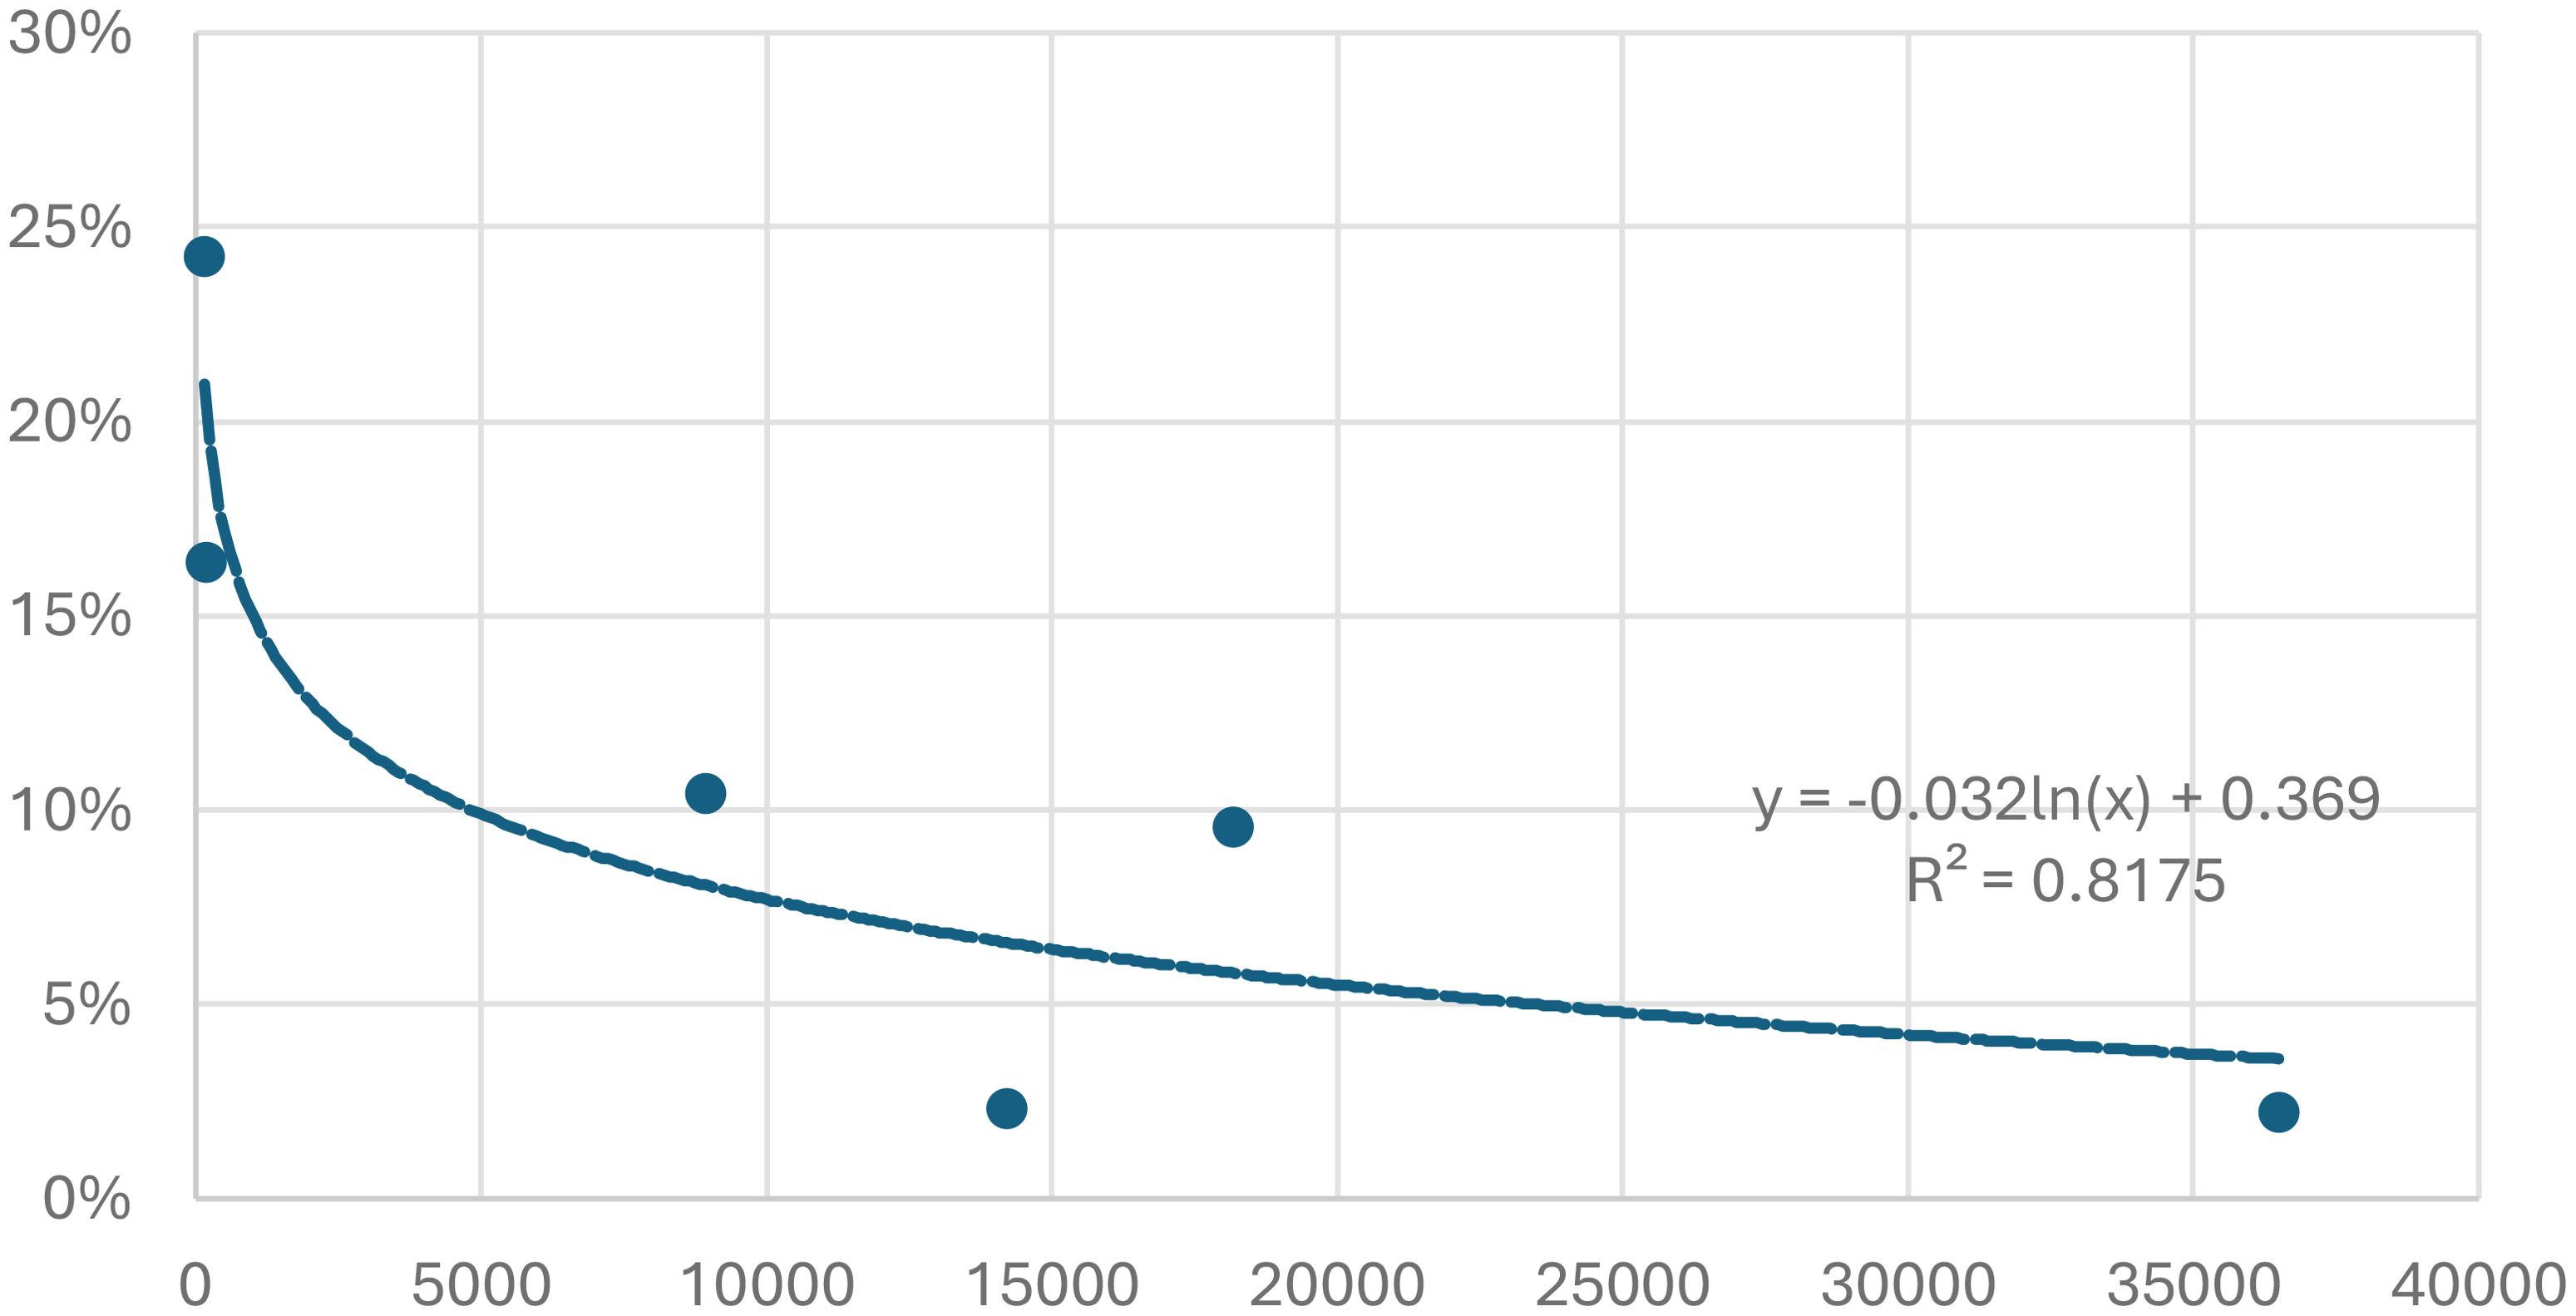
Figure 4. Relationship between port volume and share of CSC handling in total turnover.
This leads to the conclusion that it is the ports with lower total cargo handling, which have been most affected by economic and political changes that benefit the most from CSC cargo handling. In the era of changes resulting from climate policy and economic shocks (e.g. COVID-19, Ukraine war), secondary ports are replacing the decreasing transshipment of traditional cargoes such as coal or iron ore with growing transshipments of circular economy cargo.
4.3 Identification of factors determining the choice of a port for handling CSC cargo
Qualitative research - face-to-face interviews - was conducted to identify the factors that determine the choice of a port as a link in the reverse supply chain. The results of the research are presented in Table 9.

Table 9. Factors determining the choice of a particular port as a link in reverse supply chains.
Identification of the factors that determined the choice of a particular port by a gestor and the frequency of their occurrence made it possible to hierarchize them (Figure 5). The most common factor was the location of the port close to the place of production of the CSC cargo in question or its destination. This is most often due to the low value of the cargo and thus the need to minimize transport costs, in which back-end transport costs make up a significant part. Furthermore, it is a factor that is independent of the size of the port and therefore favors regional/local ports. The second most important factor is port flexibility. A port operator that is open to handling small batches of cargo with different handling and storage requirements, and often small and variable over time, is appreciated by cargo operators. This factor is not dependent on the size of the port.
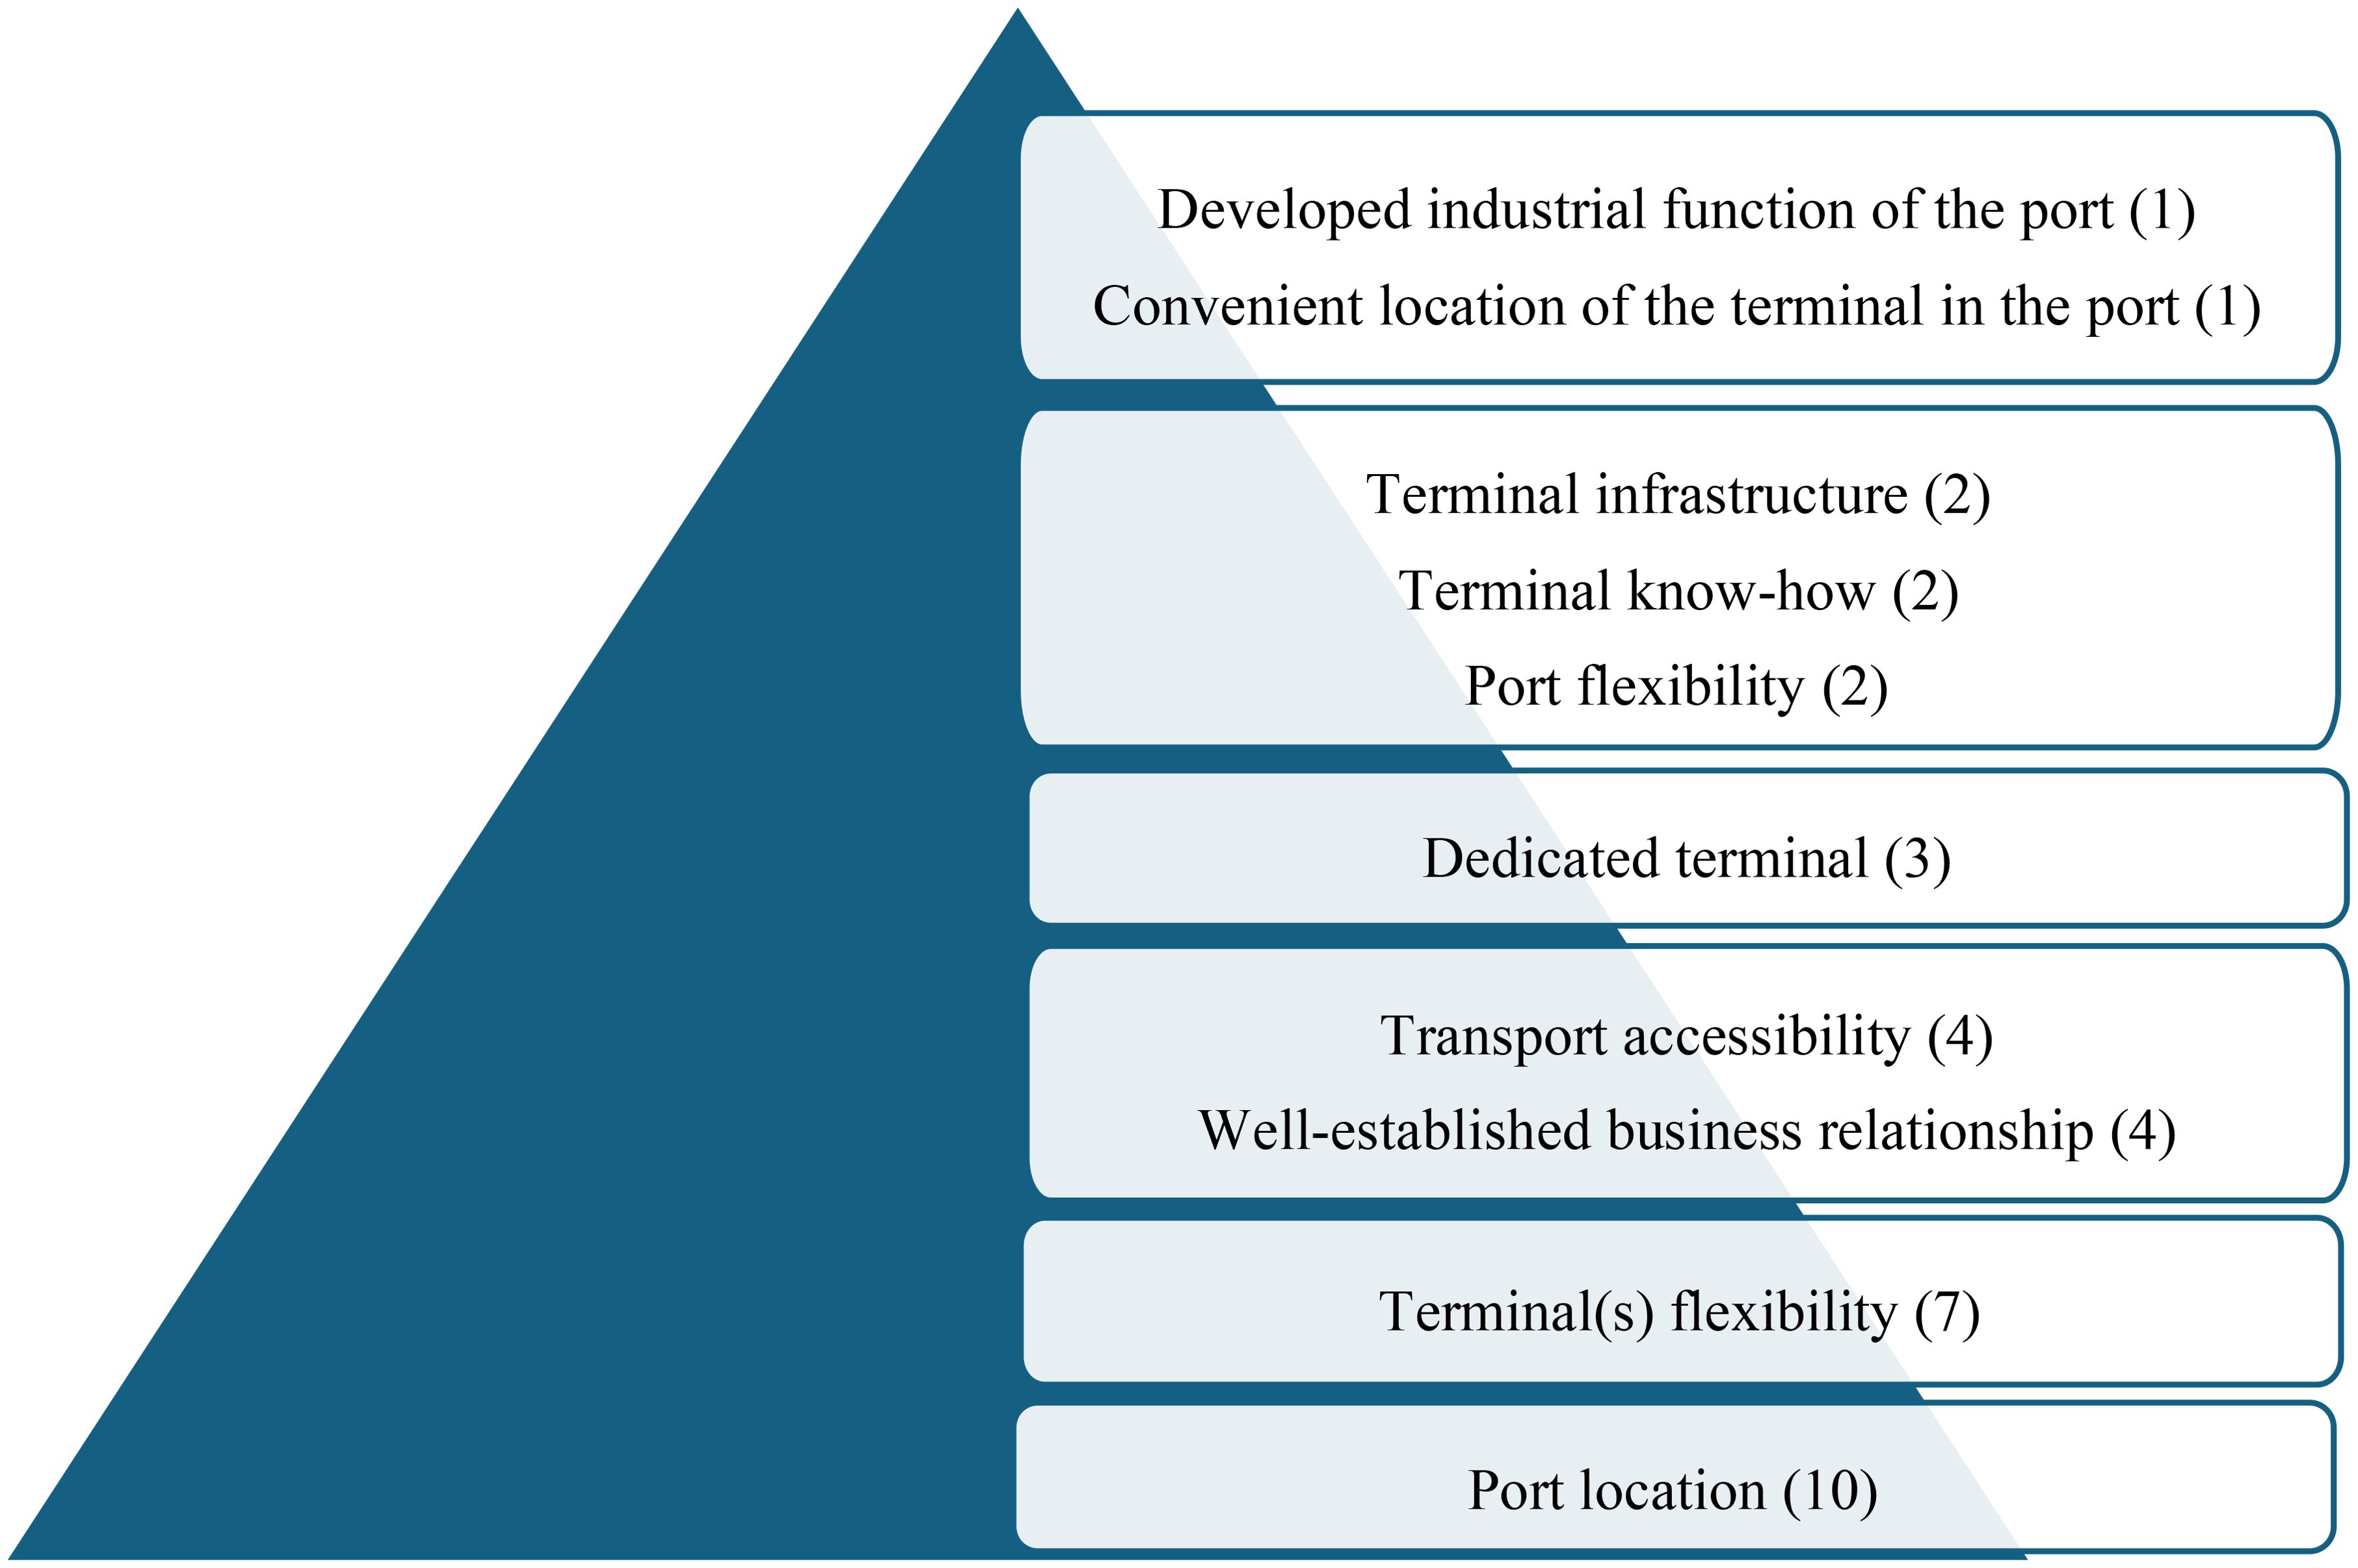
Figure 5. Hierarchy of determinants of port choice in CSC cargo handling. own research.
In four cases, the choice of port was determined by infrastructural factors, including twice the importance of the parameters of the ships to be handled and twice the importance of adequate hinterland transport. In both cases, there is little that both terminals and ports can do. Transport accessibility of the port from the hinterland and foreshore is within the scope of the state’s transport policy being implemented. In three cases, the choice of the port was determined by the operation of a dedicated terminal on the site, most often under the responsibility of one of the global traders of the cargo in question (middlings). The next most important factors, i.e.: terminal infrastructure - storage area, terminal know-how, port flexibility - are factors dependent on the port and/or terminal itself, its willingness to adapt to changing economic conditions, and not on the size of the port itself. Similarly, land reserves or the convenient location of the terminal in the port are also not necessarily related to the size of the port but can be an important factor in the development of ports with low overall cargo handling. The last factor identified - the developed industrial function of the port - is more prevalent in large ports but is also, of all those identified, the least important.
5 Discussion
The results of this study provide valuable insights into the factors influencing the choice of ports for handling CSC cargo, specifically in the context of Polish seaports. The discussion will address the key findings, their implications, potential challenges, and future research directions.
The analysis revealed several critical factors that determine the selection of ports for CSC cargo handling. Among these, the size of the port, measured by the total transshipments (TT), and the share of CSC cargo in total cargo handling (CET) emerged as significant determinants. Larger ports such as Gdańsk and Gdynia, despite their higher transshipment volumes, exhibited a relatively lower share of CSC cargo. In contrast, smaller ports like Kołobrzeg and Darłowo had higher CET percentages, suggesting a more focused or specialized approach toward CE activities.
This divergence highlights the potential role of smaller ports in pioneering CE initiatives due to their ability to adapt more swiftly to new operational models. These ports can leverage their flexibility and regional significance to become specialized hubs for CE activities, potentially fostering local economic development and enhancing sustainability.
Furthermore, the qualitative analysis identified key factors influencing port choice for CSC cargo, including logistical efficiency, proximity to waste generation and recycling centers, availability of specialized facilities, and the presence of supportive regulatory frameworks. These factors underline the importance of an integrated approach where infrastructure, policy, and market dynamics align to support the circular economy.
Despite the promising findings, several challenges must be addressed to optimize port operations for CSC cargo:
1. Infrastructure Limitations: Many ports, particularly the smaller ones, may lack the necessary infrastructure to handle diverse CSC cargo efficiently. Upgrading facilities to accommodate various types of recyclable and reusable materials is essential.
2. Coordination and Collaboration: Effective CE implementation requires robust coordination among multiple stakeholders, including port authorities, local governments, waste management companies, and logistics providers. Enhancing collaboration mechanisms is crucial to streamline operations and achieve CE goals.
3. Regulatory and Policy Support: The success of CE initiatives heavily relies on supportive regulatory frameworks. Policymakers must create conducive environments through incentives, standards, and regulations that encourage sustainable practices within ports.
4. Market Dynamics: The economic viability of CE activities is influenced by market demand for recycled and upcycled materials. Developing strong markets for CE products is necessary to sustain and scale port-based CE operations.
5.1 Future research directions
Building upon the findings of this study, several avenues for future research are proposed to deepen the understanding of the role of ports in advancing the circular economy (CE):
5.1.1 Comparative analyses
A cross-national or regional comparative study of port operations would be valuable for identifying best practices and innovative approaches in circular economy cargo handling. Such studies could highlight differences in policy, technology adoption, and stakeholder involvement that contribute to success in CE implementation.
5.1.2 Technological advancements
The role of emerging technologies, including blockchain, the Internet of Things (IoT), and artificial intelligence (AI), should be further examined in the context of optimizing logistics and operations at ports. Research could focus on how these technologies improve transparency, traceability, and efficiency in CE practices within port ecosystems.
5.1.3 Economic impact studies
Future studies could focus on conducting a thorough economic impact analysis to evaluate the contribution of circular economy activities to local and regional economies. Quantifying these impacts would provide empirical support for increased investment in CE-related infrastructure at ports and across broader supply chains.
5.1.4 Stakeholder engagement and governance models
Developing and empirically testing new models of stakeholder engagement and governance will be critical to understanding how diverse actors—ranging from government authorities to private companies—can be effectively integrated into the circular economy framework at ports. These models should assess collaboration strategies that enhance CE implementation.
5.1.5 Sustainability metrics and performance indicators
There is a need to refine and expand sustainability metrics specific to port operations, enabling more accurate monitoring and reporting of circular economy performance. This would involve the development of tailored indicators that can better capture the unique environmental and operational aspects of ports contributing to CE.
6 Conclusions
The analyses carried out showed that CSC cargo could be an important area of activity for the pores. The research showed a relationship between port size and the share of CSC cargo in transshipments. This relationship was logarithmic; the smaller the port, the greater the importance of CSC cargo. This qualitative research in Polish coastal ports allowed the identification of the main factors determining the choice of a given port by cargo managers, the most important of which was the location of the port close to the origin/destination of the cargo, which is usually associated with its low value, and the flexibility of the terminal handling the cargo. Most of the identified factors were not dependent on the size of the port handling CSC cargo and more on the terminal/port’s ability/willingness to adapt. A limiting factor for the development of small ports is insufficient transport accessibility from the hinterland as well as insufficient parameters of the vessels handled. Nevertheless, for a higher share of CSC cargo in seaport service, action must be taken at all levels of decision-making: public authorities, port boards and terminal operators. The final factor identified—the developed industrial function of the port—while more commonly observed in large-scale ports, is the least significant among those examined in this study.
Data availability statement
Publicly available datasets were analyzed in this study. This data can be found here: stat.gov.pl.
Author contributions
EC: Writing – review & editing, Writing – original draft, Investigation, Formal analysis. IK: Writing – review & editing, Writing – original draft, Investigation, Methodology, Software. AO-J: Writing – review & editing, Writing – original draft. MP: Writing – review & editing, Writing – original draft, Project administration, Data curation, Conceptualization, Investigation. ES: Writing – review & editing, Writing – original draft.
Funding
The author(s) declare financial support was received for the research, authorship, and/or publication of this article. Co-financed by the Minister of Science under the “Regional Excellence Initiative”.

Conflict of interest
The authors declare that the research was conducted in the absence of any commercial or financial relationships that could be construed as a potential conflict of interest.
The author(s) declared that they were an editorial board member of Frontiers, at the time of submission. This had no impact on the peer review process and the final decision.
Publisher’s note
All claims expressed in this article are solely those of the authors and do not necessarily represent those of their affiliated organizations, or those of the publisher, the editors and the reviewers. Any product that may be evaluated in this article, or claim that may be made by its manufacturer, is not guaranteed or endorsed by the publisher.
References
Adamowicz M., Puszkarski J. (2018). Legal aspects of sustainable development of seaports in Poland. SHS Web Conf. 57, 1001. doi: 10.1051/SHSCONF/20185701001
Ahmad S. S., Mulyadi I. M. M., Ibrahim N., Othman A. R. (2016). The application of recycled textile and innovative spatial design strategies for a recycling centre exhibition space. Proc. - Soc Behav. Sci. 234, 525–535. doi: 10.1016/J.SBSPRO.2016.10.271
Alamoush A. S., Ballini F., Ölçer A. I. (2021). Revisiting port sustainability as a foundation for the implementation of the United Nations Sustainable Development Goals (UN SDGs). J. Shipp. Trd. 6, 19. doi: 10.1186/s41072-021-00101-6
(2014). “Commission decision of 18 December 2014 amending decision 2000/532/EC on the list of waste pursuant to Directive 2008/98/EC of the European Parliament and the Council (Text with EEA relevance),” in 2014/955/EU.
Barona J., Ballini F., Canepa M. (2023). Circular developments of maritime industrial ports in Europe: a semi-systematic review of the current situation. J. shipp. trd. 8, 25. doi: 10.1186/s41072-023-00153-w
Batista L., Bourlakis M., Smart P., Maull R. (2018). In search of a circular supply chain archetype – a content-analysis-based literature review. Prod. Plan. Control 29, 438–451. doi: 10.1080/09537287.2017.1343502
Bergmans J., Broos K., Nielsen P., Dierckx P., Brijsse Y., Jacobs K. (2015). “Recycling of construction and demolition waste: case study in the port of Antwerp,” in Proceedings of the ISWA conference 2015, Antwerp; Zenodo: Antwerp.
Bjørnbet M., Skaar C., Fet A., Schulte K. (2021). Circular economy in manufacturing companies: A review of case study literature. J. Cleaner Production 294, 126268. doi: 10.1016/J.JCLEPRO.2021.126268
Bocheński T., Palmowski T., Studzieniecki T. (2021). The development of major seaports in the context of national maritime policy. The case study of Poland. Sustainability 13, 12883. doi: 10.3390/SU132212883
Courtens F. M., Haezendonck E., Dooms M., Verbeke A. (2023). Accelerating the circular economy transition process for gateway ports: the case of the Port of Zeebrugge. Maritime Transport Res. 4, 100088. doi: 10.1016/j.martra.2023.100088
de Langen P., Sornn-Friese H. (2019). Ports and the circular economy. Green Ports Inl. Seaside Sustain. Transp. Strateg, 85–108. doi: 10.1016/B978-0-12-814054-3.00005-0
de Langen P. W., Sornn-Friese H., Hallworth J. (2020). The role of port development companies in transitioning the port business ecosystem; the case of port of Amsterdam’s circular activities. Sustainability 12, 4397. doi: 10.3390/SU12114397
de Martino P. (2022). Towards circular Port–City territories: rotterdam and the port back to the city. Geoj. Libr. 128, 161–171. doi: 10.1007/978-3-030-78536-9_10/FIGURES/2
Dervojeda K., Verzijl D., Rouwmaat E., Probst L., Frideres L. (2014). Clean technologies: circular supply chains. Bus. Innov. Obs. 30, 18.
Deutz P. (2020). Circular economy. Int. Encycl. Hum. Geogr. Second Ed. 2, 193–201. doi: 10.1016/B978-0-08-102295-5.10630-4
Du L., Zuo J., O’Farrell K., Chang R., Zillante G., Li L. (2023). Transnational recycling of Australian export waste: an exploratory study. Resour. Conserv. Recycl. 196, 107041. doi: 10.1016/J.RESCONREC.2023.107041
Dziennik Ustaw D. (2023). 1587 t.j. Akt obowiązujący Wersja od: 28 października 2023 r. do: 31 grudnia 2024 r. USTAWA z dnia 14 grudnia 2012 r. o odpadach. Dz.U.2023.1587.
European Commission (2020). Communication from the Commission to the European Parliament, The Council, the European Economic And Social Committee and the Committee Of The Regions, A New Circular Economy Action Plan, for a Cleaner and More Competitive Europe COM(2020) 98 Final (Brussels: European Commission).
Eurostat Trade in Waste Type of Material and Partner. Available online at: https://ec.europa.eu/eurostat/databrowser/product/page/ENV_WASTRDMP (Accessed 7 May 2024).
Ezzat A. M. (2016). Sustainable development of seaport cities through circular economy: A comparative study with implications to suez canal corridor project. Eur. J. Sustain. Dev. 5, 509–522. doi: 10.14207/ejsd.2016.v5n4p509
Faut L., Soyeur F., Haezendonck E., el Dooms M., de Langen P. W. (2023). Ensuring circular strategy implementation: The development of circular economy indicators for ports. Maritime Transport Res. 4, 100087. doi: 10.1016/j.martra.2023.100087
Ferreira J., Bek D., Oloan R., Gurning S., Tangkau D. I. (2022). The analysis of the conceptual framework of green port implementation in Indonesia using circular economy: the case study of benoa public and fishing terminals. Sustainability 14, 6083. doi: 10.3390/SU14106083
Fredouet C. H. (2023). Identifying Maritime Ports’ Investment Drivers: The Case of French Local and Regional Ports, London, UK Vol. 2. 1–5. doi: 10.24018/maritime.2023.2.1.14
Geissdoerfer M., Pieroni M., Pigosso D., Soufani K. (2020). Circular business models: A review. SRPN: Soc. Economics (Topic) 277, 123741. doi: 10.1016/j.jclepro.2020.123741
Haezendonck E., Van Den Berghe K. (2020). Patterns of circular transition: what is the circular economy maturity of Belgian ports? Sustainability 12, 9269. doi: 10.3390/SU12219269
Jeevan J., Mohd Salleh N. H., Abdul Karim N. H., Cullinane K. (2023). An environmental management system in seaports: evidence from Malaysia. Marit. Policy Manage. 50, 1118–1135. doi: 10.1080/03088839.2022.2047814
Karimpour R., Ballini F., Ölcer A. I. (2019). Circular economy approach to facilitate the transition of the port cities into self-sustainable energy ports—a case study in Copenhagen-Malmö Port (CMP). WMU J. Marit. Aff. 18, 225–247. doi: 10.1007/S13437-019-00170-2
Khan S., Haleem A. (2021). Investigation of circular economy practices in the context of emerging economies: a CoCoSo approach. Int. J. Sustain. Eng. 14, 357–367. doi: 10.1080/19397038.2020.1871442
Kovačič Lukman R., Brglez K., Krajnc D. (20222022). A conceptual model for measuring a circular economy of seaports: A case study on Antwerp and Koper ports. Sustainability 14, 3467. doi: 10.3390/SU14063467
Lavelli V. (2021). Circular food supply chains – impact on value addition and safety. Trends Food Sci. Technol. 114, 323–332. doi: 10.1016/J.TIFS.2021.06.008
Mańkowska M., Kotowska I., Pluciński M. (20202020). Seaports as nodal points of circular supply chains: opportunities and challenges for secondary ports. Sustainability 12, 3926. doi: 10.3390/SU12093926
Mańkowska M., Pluciński M., Kotowska I. (2021). Biomass sea-based supply chains and the secondary ports in the era of decarbonization. Energies 14, 1796. doi: 10.3390/EN14071796
McCallum P. (2022). “Green ports—Sustainable port development,” in Ports 2022: Ports 2022: Port Planning and Development, eds Erbland P. J., Jones, Pap B. N.. from Sess. 16th Trienn. Int. Conf. Vol. 2, 592–600. doi: 10.1061/9780784484401.059
Mhatre P., Panchal R., Singh A., Bibyan S. (2021). A systematic literature review on the circular economy initiatives in the European Union. Sustain. Production Consumption 26, 187–202. doi: 10.1016/J.SPC.2020.09.008
Michalska-Szajer A., Klimek H., Dąbrowski J. (2021). A comparative analysis of CSR disclosure of polish and selected foreign seaports. Case Stud. Transp. Policy 9, 1112–1121. doi: 10.1016/J.CSTP.2021.05.012
Oniszczuk-Jastrząbek A., Pawłowska B., Czermański E. (2018). Polish sea ports and the green port concept. SHS Web Conf. 57, 1023. doi: 10.1051/SHSCONF/20185701023
Padilla-Rivera A., Russo-Garrido S., Merveille N. (2020). Addressing the social aspects of a circular economy: A systematic literature review. Sustainability 12, 7912. doi: 10.3390/su12197912
Popović A., Radivojevic V. (2022). The circular economy: Principles, strategies and goals. Economics Sustain. Dev. 6, 45–56. doi: 10.5937/esd2201045p
Proskurina S., Rimppi H., Heinimö J., Hansson J., Orlov A., Raghu K., et al. (2016). Logistical, economic, environmental and regulatory conditions for future wood pellet transportation by sea to europe: the case of northwest Russian seaports. Renew. Sustain. Energy Rev. 56, 38–50. doi: 10.1016/J.RSER.2015.11.030
Roberts T., Williams I., Preston J., Clarke N., Odum M., O’Gorman S. (2021). A virtuous circle? Increasing local benefits from ports by adopting circular economy principles. Sustain. 13, 7079–7079. doi: 10.3390/su13137079
Sacco S., Cerreta M. (2022). “A decision-making process for circular development of City-Port ecosystem: the East Naples case study,” in Computational Science and Its Applications – ICCSA 2022 Workshops. ICCSA 2022. Lecture Notes in Computer Science. vol 13378. eds Gervasi O., Murgante B., Misra A. M. A. C., C. Garau Rocha.. (Springer: Cham). doi: 10.1007/978-3-031-10562-3_40
Satir T., Doğan-Sağlamtimur N. (2028). The protection of marine aquatic life: green port (EcoPort) model inspired by green port concept in selected ports from Turkey, Europe and the USA. Period. Eng. Nat. Sci. 6, 120–129. doi: 10.21533/PEN.V6I1.149
Keywords: circular economy, port selection, sustainable logistics, Polish seaports, cargo handling factors
Citation: Czermański E, Kotowska I, Oniszczuk-Jastrząbek A, Pluciński M and Szaruga E (2024) Factors influencing the adoption of circular economy practices in polish seaports: an analysis of determinants and challenges. Front. Mar. Sci. 11:1465204. doi: 10.3389/fmars.2024.1465204
Received: 15 July 2024; Accepted: 22 October 2024;
Published: 11 November 2024.
Edited by:
Di Jin, Woods Hole Oceanographic Institution, United StatesReviewed by:
Yusheng Zhou, Hong Kong Polytechnic University, Hong Kong SAR, ChinaTalya ten Brink, University of Rhode Island, United States
Copyright © 2024 Czermański, Kotowska, Oniszczuk-Jastrząbek, Pluciński and Szaruga. This is an open-access article distributed under the terms of the Creative Commons Attribution License (CC BY). The use, distribution or reproduction in other forums is permitted, provided the original author(s) and the copyright owner(s) are credited and that the original publication in this journal is cited, in accordance with accepted academic practice. No use, distribution or reproduction is permitted which does not comply with these terms.
*Correspondence: Ernest Czermański, ZXJuZXN0LmN6ZXJtYW5za2lAdWcuZWR1LnBs