 Dan Yang1†
 Wenhao Huang
 Zhengbing Han
 Jun Zhao
- 1Key Laboratory of Marine Ecosystem Dynamics, Second Institute of Oceanography, Ministry of Natural Resources, Hangzhou, China
- 2Zhuhai Central Station of Marine Environmental Monitoring, State Oceanic Administration, Zhuhai, China
- 3School of Ocean Sciences, China University of Geosciences, Beijing, China
Organic carbon (OC) burial in the Antarctic marginal seas is essential for regulating global climate, particularly due to its association with ice shelf retreat. Here, we analyzed total OC (TOC), total nitrogen (TN), radiocarbon isotope, n-alkanes and relative indicators in surface and core sediments from the Ross Sea, West Antarctica. Our aim was to investigate spatial and historical changes in OC sources, and to explore the influencing factors and implications for ice shelf retreat since the last glacial maximum (LGM). Our results revealed distinct spatial patterns of OC sources as indicated by n-alkane indicators in surface sediments. In the Western Ross Sea, n-alkanes predominantly originated from phytoplankton and bacteria, as evidenced by their unimodal distribution, low carbon preference index (CPI) of short-chain n-alkanes (CPIL = 1.41 ± 0.30), and low terrestrial/aquatic ratio (TAR = 0.22 ± 0.14). In the Southwest Ross Sea, n-alkanes were derived from marine algae and terrestrial bryophytes, indicated by bimodal distribution, low ratio of low/high molecular-weight n-alkanes (L/H = 0.62 ± 0.21), low CPI of long-chain n-alkanes (CPIH = 1.18 ± 0.16), and high TAR (1.26 ± 0.66). In contrast, the Eastern Ross Sea exhibited n-alkanes that were a combination of phytoplankton and dust from Antarctic soils and/or leaf waxes from mid-latitude higher plant, as suggested by both unimodal and bimodal distributions, high L/H (1.60 ± 0.58) and CPIH (2.04 ± 0.28), and medium TAR (0.61 ± 0.30). Geologically, during the LGM (27.3 – 21.0 ka before present (BP)), there was an increased supply of terrestrial OC (TOC/TN = 13.63 ± 1.29, bimodal distribution of n-alkanes with main carbon peaks at nC17/nC19 and nC27). From 21.0 to 8.2 ka BP, as glaciers retreated and temperatures rose, the proportion of marine n-alkanes significantly increased (TOC/TN = 9.09 ± 1.82, bimodal distribution of n-alkanes with main carbon peaks at nC18/nC19 and nC25). From 8.2 ka BP to the present, as the ice shelf continued to retreat to its current position, the marine contribution became dominant (TOC/TN = 8.18 ± 0.51, unimodal distribution of n-alkanes with main carbon peak at nC17/nC18/nC19, and low TAR (0.41 ± 0.32)). This research has significant implications for understanding the variations in Antarctic OC sources and their climatic impacts in the context of accelerated glacier melting.
1 Introduction
Marine sediments, located at the interface of the hydrosphere, biosphere and lithosphere, serve a critical function as carbon reservoirs, facilitating the deposition, burial, and preservation of organic matter (LaRowe et al., 2020). The total organic carbon (TOC) in marine sediments primarily comprises various components, including lipids, proteins, carbohydrates, and humic substances (Burdige, 2007; Lomstein et al., 2012; Dittmar and Stubbins, 2014). The origins of TOC from different sources, including marine, terrestrial and bacterial origins, are often a key concern of research (Didyk et al., 1978; Gustafsson et al., 2009; Bianchi and Canuel, 2011). Traditional parameters used to characterize organic matter, such as the molar ratio of TOC to total nitrogen (TN) (Mayer, 1994; Zhang et al., 2023) and the carbon and nitrogen isotopes of organic matter (δ13C, δ15N) (Das et al., 2007; Wu et al., 2020), provide valuable insights into the main sources of TOC but exhibit limitations regarding source specificity. Given the complex nature of TOC sources, more precise methods, such as the chemical biomarker approach, are essential for tracing the origins of specific TOC components (Bianchi and Canuel, 2011; Gal et al., 2022). Chemical biomarkers are organic compounds found within the environmental matrix that can be linked back to their biological sources (Eglinton and Calvin, 1967; Meyers, 2003) and the prevailing climatic conditions at the time of their formation (Liu and An, 2020). Despite undergoing significant geochemical transformations like oxidation and reduction during early diagenesis over extended periods, these biomarkers retain the carbon chain structures of their parent molecules (Bianchi et al., 2016), making them valuable indicators of material sources.
N-alkanes, which are saturated straight-chain hydrocarbons typically ranging from nC14 to nC34 in length, are abundant in marine sediments, resistant to degradation and source-specific, making them effective biomarkers (Zhao et al., 2022). In contrast, some biomarkers such as lignin, may have certain regional limitations. For instance, lignin is commonly utilized in mid- and low-latitude seas, but is challenging to apply in Antarctica due to the absence of vascular plants (Bianchi and Canuel, 2011). Various organisms, including algae, aquatic macrophytes, terrestrial plants and bacteria, can synthesize n-alkanes. In marine sediments, n-alkanes are derived from autochthonous sources, such as algae and bacteria, and allochthonous inputs from terrestrial plants (Eglinton and Eglinton, 2008). Distinct compositional patterns exist among different sources: medium to short-chain even n-alkanes (nC12 to nC22, mainly nC16 and nC18) originate from bacteria (Grimalt and Albaigés, 1987); medium to short-chain odd n-alkanes (nC13 to nC21, mainly nC15, nC17 and nC19) are produced by marine algae (Blumer et al., 1971); medium-chain odd n-alkanes (mainly nC23 and nC25) are derived from mosses (Baas et al., 2000; Bingham et al., 2010); and long-chain n-alkanes (nC25 to nC34, with a predominance of nC27, nC29 and nC31) mainly come from terrestrial higher plants (Eglinton and Calvin, 1967; Wang et al., 2021). Various proxies based on n-alkanes of different carbon chain lengths have been developed, such as the terrestrial/aquatic ratio (TAR) (Meyers, 1997), the low molecular-weight (nC13 to nC21) to high molecular-weight n-alkanes (nC25 to nC34) (L/H), and the long-chain and short-chain carbon preference index (CPIH and CPIL) (Eglinton and Calvin, 1967; Cranwell et al., 1987). These proxies are valuable indicators for elucidating the sources, composition, and distribution of organic carbon in sedimentary environments (Zhao et al., 2018). N-alkanes also respond to variations in climate and environmental conditions (Liu and An, 2020), with the distribution patterns exhibiting systematic changes across different stages of sedimentary geological evolution (Hanisch et al., 2003; Li et al., 2008). For instance, the collective abundance of nC21 to nC33 significantly increased during glacial periods and decreased during interglacial periods, reflecting alterations in terrestrial material input (Ikehara et al., 2000; Ternois et al., 2001). Consequently, n-alkanes present in sediment cores serve as valuable proxies for reconstructing past environmental changes in marine ecosystems.
Antarctica, particularly West Antarctica, is currently experiencing a critical phase of accelerated glacial melting and significant environmental changes (The IMBIE Team, 2018; Naughten et al., 2023). These alterations have resulted in shifts in the community structure and biomass of phytoplankton and zooplankton in West Antarctica (Lin et al., 2021; Yang et al., 2022; Trinh et al., 2023). The Ross Sea is a key region in West Antarctica, with significant regional variations in hydrodynamic conditions (Wu et al., 2024) that have potential implications for organic matter preservation (Eusterhues et al., 2003; Keil and Mayer, 2014). Furthermore, the Ross Sea is undergoing modifications in sea ice extent, primary productivity, and plankton populations (Orr et al., 2005; Matson et al., 2011; Smith et al., 2012; Kim et al., 2023), all of which influence the quantity and composition of organic matter in sediments. Previous research has examined the composition and distribution of n-alkanes in various substrates, including microbial mats, mosses, lichens (Chen et al., 2019a, 2021), soils (Matsumoto et al., 2010), suspended particulates (Tao et al., 2022) and sediments (Kvenvolden et al., 1987; Venkatesan, 1988; Duncan et al., 2019; Chen, 2020) in the Ross Sea. For example, Kvenvolden et al. (1987) reported that n-alkanes in near-surface sediments in the Western Ross Sea primarily originate from two sources: both primary and reworked marine materials, and aged organic matter redeposited from terrestrial plants. Duncan et al. (2019) observed that C29 n-alkanes dominated in late Miocene sediments, while C27 n-alkanes dominated in the Oligocene, suggesting the influence of climate change on vegetation evolution. Chen (2020) found that long-chain n-alkanes (nC27 to nC35) in a 330,000-year-old deep-sea core from the Ross Sea fan area mainly come from Antarctic soils, and long-distance transport of dust from mid-latitude terrestrial sources, plant leaf waxes. Despite these studies, there remains a significant gap in comprehensive research on the sources of n-alkanes in surface sediments. Additionally, studies on the characteristics of n-alkanes in the Ross Sea since the last glacial maximum (LGM) and their response to changes in ice shelves are notably insufficient.
In this study, we analyzed grain size, TOC, TN, radiocarbon isotopes (Δ14C) and n-alkanes in 18 surface sediments and one sediment core collected from the Ross Sea. We calculated parameters related to hydrodynamic conditions and traced the sources of TOC and n-alkanes. We specifically addressed the following three issues: 1. to investigate spatial distribution variances and influencing factors of hydrodynamic conditions, OC content and sources in surface sediments; 2. to examine spatial distribution variances in the sources of n-alkanes in surface sediments; 3. to assess the impact of changes in the ice shelf on n-alkane characteristics since the LGM.
2 Study area and sample collection
2.1 Study area
The Ross Sea is located at the southwestern boundary of the Antarctic continent within the Pacific sector of the Southern Ocean, and is the second largest bay in this region, covering an area of approximately 750,000 km² (Smith et al., 2012). It is bordered by Marie Byrd Land to the east, the Transantarctic Mountains and Victoria Land to the west, and to the south, it adjoins the Ross Ice Shelf, which is the largest ice shelf in the world, spaning about 500,000 km². The Ross Sea is a vital source region for Antarctic Bottom Water (Whitworth and Orsi, 2006). Sea ice distribution in the Ross Sea displays significant seasonal fluctuations, with polynyas like the Ross Sea Polynya (RSP), McMurdo Sound Polynya (MSP), and Terra Nova Bay Polynya (TNBP) forming earlier in the summer along the front of the Ross Ice Shelf and the coast of Victoria Land, primarily due to katabatic wind (Parish et al., 2006; Tamura et al., 2008). The Ross Sea boasts high primary productivity, contributing approximately one-third of the Southern Ocean’s primary productivity (Arrigo et al., 2008a, 2008b), and hosts a thriving ecosystem. Notably, the Adélie penguin population in the Ross Sea represents one-third of the global population (Xu et al., 2021).
The Ross Sea continental shelf is geographically divided into Eastern and Western regions by approximately 180° longitude, with water depths ranging from less than 500 m to over 1000 m. The eastern shelf is predominantly characterized by a broad basin and gently undulating shoals, while the western shelf features narrow basins and more pronounced undulating shoals (Halberstadt et al., 2016; Gales et al., 2021; Ha et al., 2022). TOC in the surface sediments of the Ross Sea primarily originates from upper ocean primary production (DeMaster et al., 1996; Langone et al., 1998) based on biomarker compounds (Song et al., 2019), OC/TN ratio and δ13C (Xiu et al., 2017). The southwestern Ross Sea, including RSP and MSP, exhibits high content of biogenic components (OC, TN, and opal) and represents a distinct environment setting compared to the western Ross Sea (Zhou et al., 2022). Based on the differences in the geographic location and biogenic components, our sediment samples were categorized into three distinct groups: Southwest, Western and Eastern (Figure 1, Supplementary Table S1).
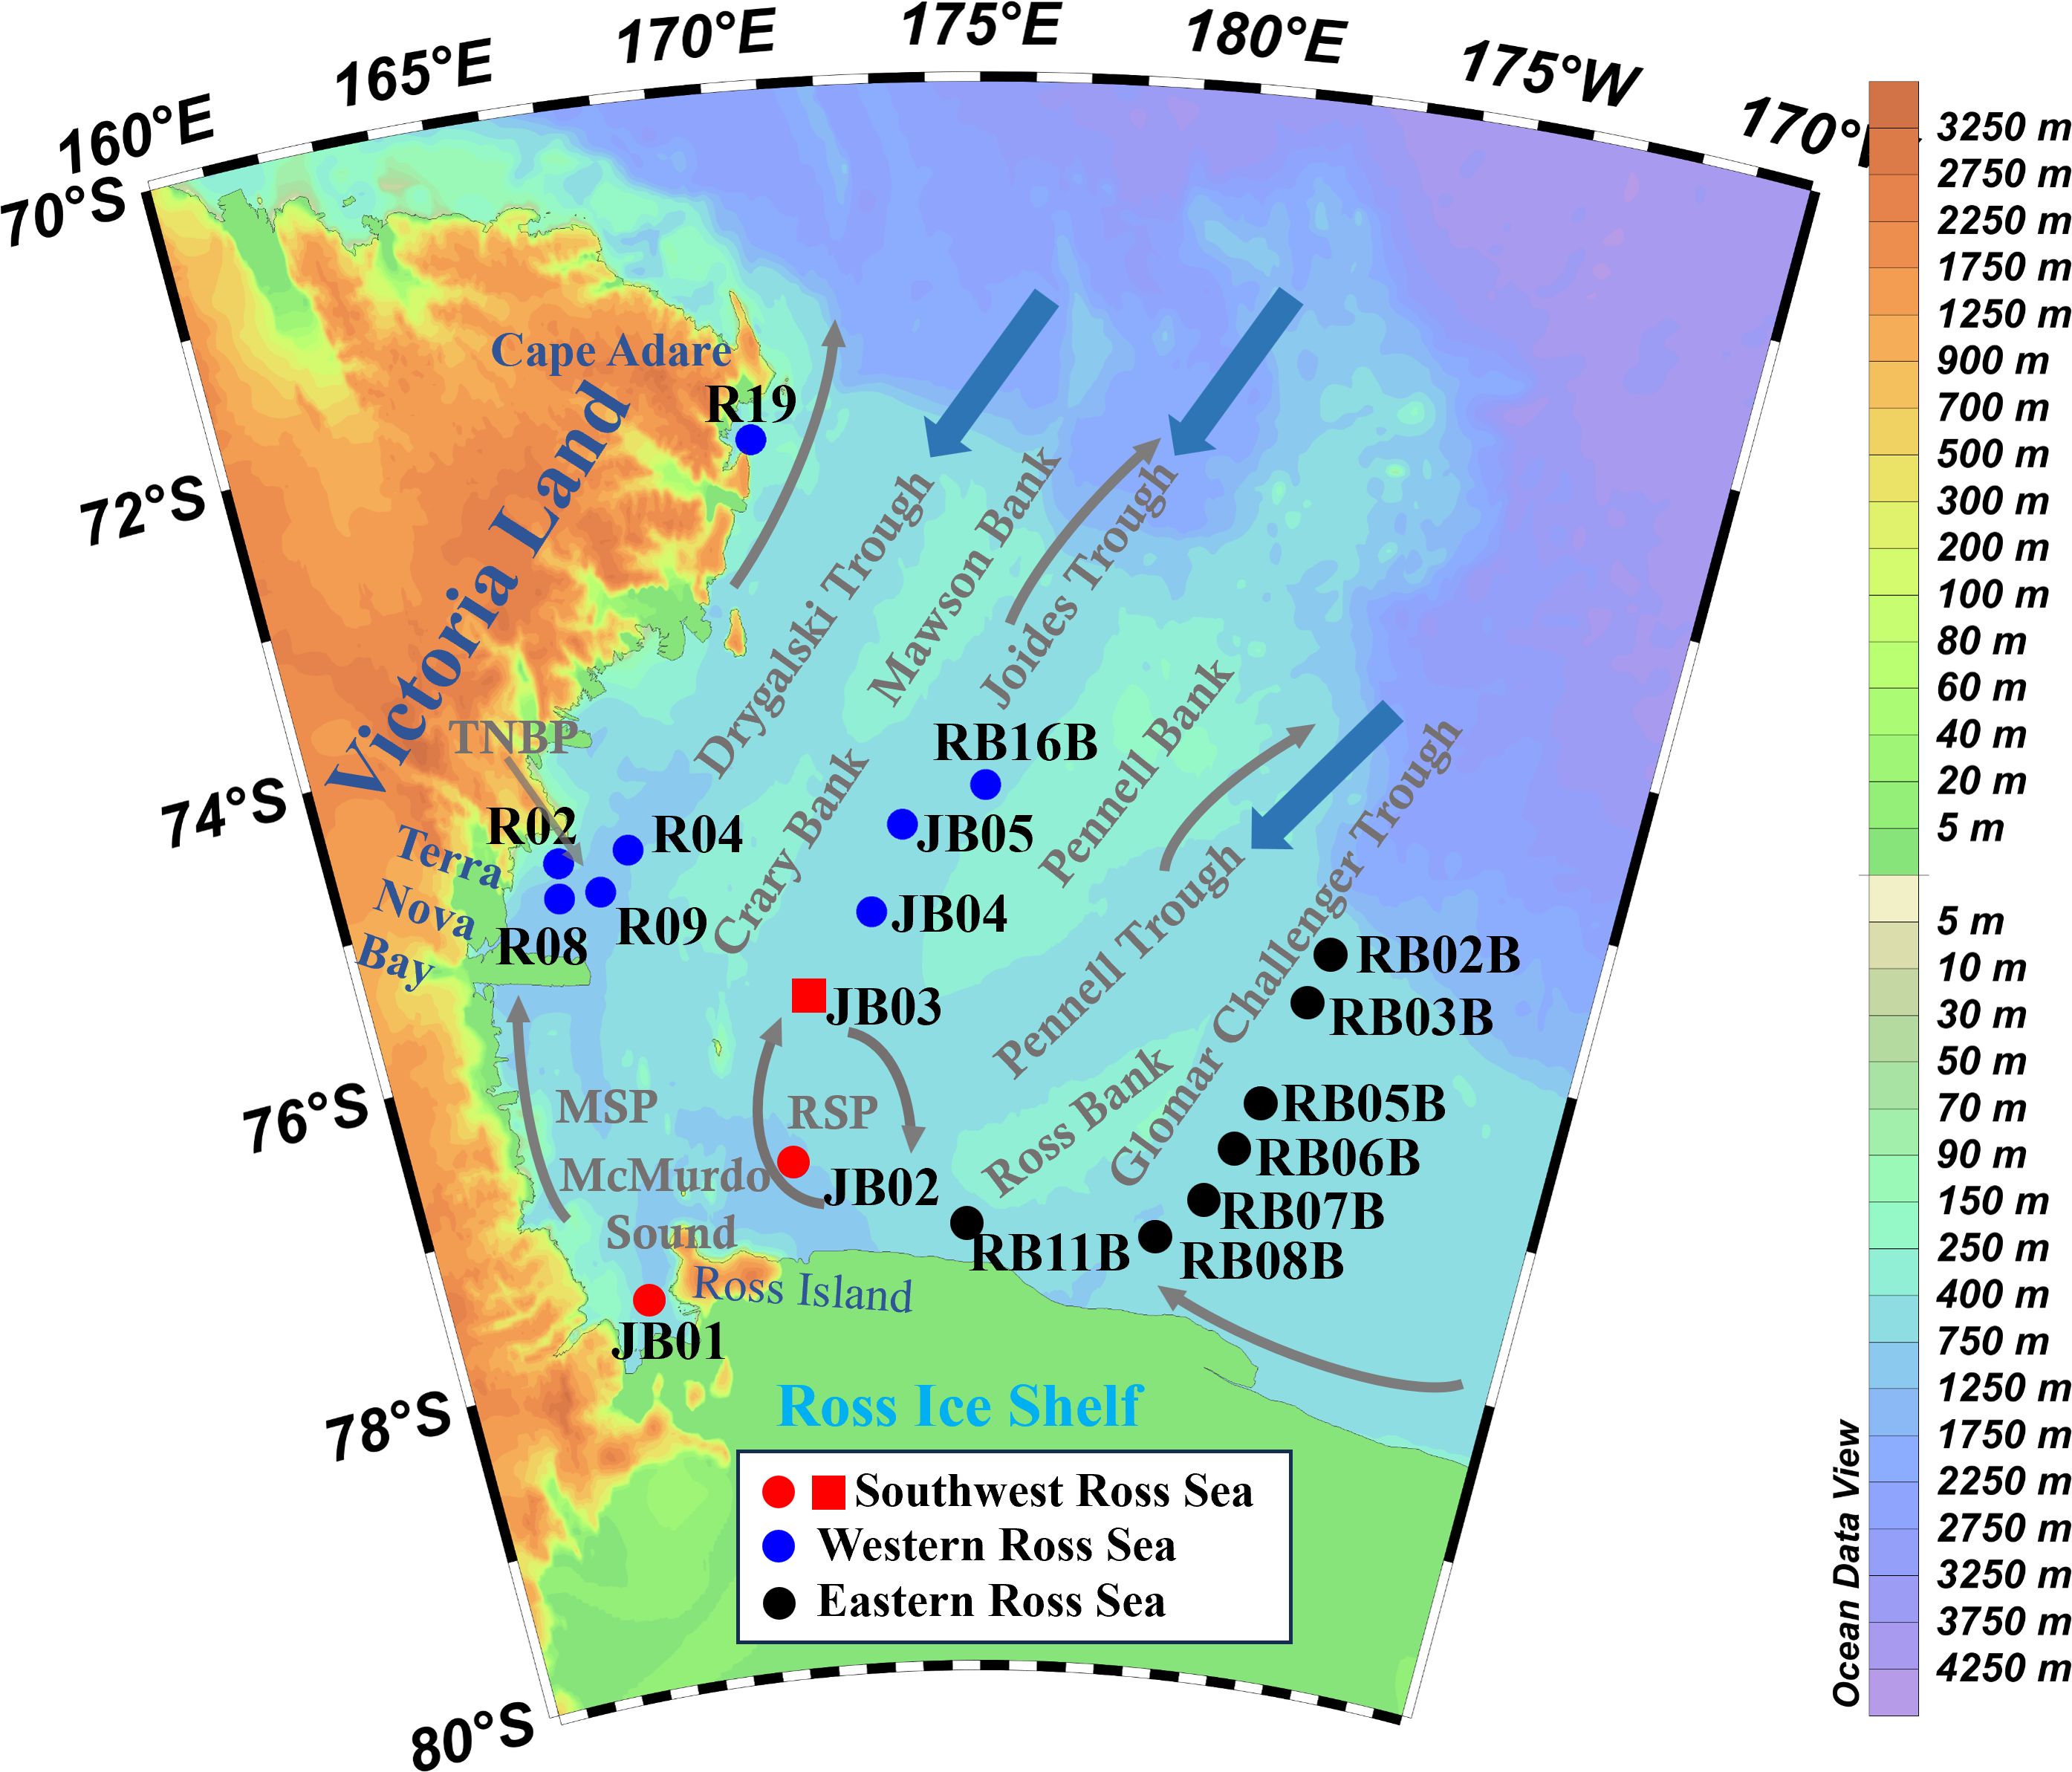
Figure 1. Surface sediment samples (dots) from Southwest (in red), Western (in blue) and Eastern (in black) Ross Sea, the sediment core sample (square), with water depth (values in legend) and circulation patterns (arrows) (Pillsbury and Jacobs, 1985; Dinniman et al., 2003; Smith et al., 2012). TNBP, Terra Nova Bay Polynya; RSP, Ross Sea Polynya; MSP, McMurdo Sound Polynya.
2.2 Sample collection
Eighteen surface sediments were collected during the 31st and 32nd Chinese National Antarctic Research Expeditions (CHINARE-31 and -32) (Figure 1). They were collected by a box sampler, and the 0 – 1 cm sediment layer was taken as the surface sample. A gravity core sediment sample at station JB03 (170.698°E, 75.804°S, water depth = 615 m) within the southern Joides Trough were collected during CHINARE-31. The total length of the sediment core was 130 cm, and was divided at 2 cm intervals. All samples were frozen at –20°C, brought back to the laboratory and kept frozen at –20°C until analysis.
3 Analytical methods
3.1 Sediment particle size analysis
The particle size of sediment samples was determined using a laser particle size analyzer (range 0.02 to 4000 μm, Mastersizer 3000, UK, the precision is better than 1%). Ca. 1.0 to 2.0 g untreated wet sediment samples was placed into beakers with a small amount of deionized water to soak the samples. A small amount of 30% hydrogen peroxide (H2O2) was added until no bubbles were produced to remove sedimentary organic matter. 0.25 mol/L of dilute HCl was added to remove carbonates in the sample, followed by 20 mL of a 1 mol/L NaCO3 solution, and the beaker was placed into a constant temperature water bath at 85°C for 4 h. Deionized water was added and the solution was stirred with a glass rod, left to stand for 24 h, and the supernatant collected. This step was repeated for 3 times, until the washing produced a neutral pH solution. 1 mL of 0.5 mol/L sodium hexametaphosphate was added to the combined supernatant as a dispersive substance, and a suspension was formed by ultrasonic oscillation for 120 s. The suspension was collected and particle sizes were measured on the instrument.
Sediment samples were separated into 3 standard size fractions: sand (> 63 μm), silt (4 – 63 μm), and clay (< 4 μm). Based on the φ values ( ) corresponding to the 5%, 16%, 25%, 50%, 75%, 84%, and 95% points on the cumulative probability curve, the mean particle size (MZ), sorting coefficient (σ), skewness (SK) and kurtosis (KG) were calculated to characterize the sedimentary environment (Folk and Ward, 1957). Generally, Mz is constrained by a value of 4 φ, with values greater than 4 φ indicating a low-energy sedimentary environment, while values less than 4 φ suggesting a high-energy environment. A smaller σ value denotes better sediment sorting. SK is used to measure the symmetry of particle size frequency distribution. Furthermore, a smaller KG value reflects a broader distribution in the sharpness of the grain size frequency curve (see Supplementary Text S1 for indicative meanings of the above parameters).
3.2 TOC and TN content
TOC and TN contents of the samples were determined by an elemental analyzer (Elementar Vario MICRO cube, Germany). TOC determination requires acid removal of inorganic carbon, while TN does not (Schubert and Nielsen, 2000). Briefly, 0.5 g of lyophilized and ground sediment samples were weighed into 15 mL glass test tubes, 10 mL of a 1 M HCl solution was added and stirred, and the tubes were placed in a constant temperature water bath at 50°C for 48 h (Faust et al., 2021). The samples were then centrifuged (2500 r/min, 5 min) and the supernatant poured into a new glass container. The samples were rinsed with distilled water until a neutral pH was achieved, and finally the samples were lyophilized in a freeze-dryer and weighed. The decarbonated samples were accurately weighed (30.0 ± 0.2 mg) into tin capsules for analysis. The sediment standard sample GB07314 (offshore marine sediments, The State Bureau of Quality and Technical Supervision of China) was analyzed in parallel as a quality control standard, with replicate measurements varying by less than 1%.
3.3 AMS14C analysis
Δ14C of TOC from 11 sub-samples (i.e., 0 – 2, 2 – 4, 18 – 20, 54 – 56, 68 – 70, 72 – 74, 78 – 80, 102 – 104, 110 – 112, 112 – 114, and 128 – 130 cm) of the core sediment were analyzed using a 250 KeV NEC single stage particle accelerator at Beta Analysis Laboratory in the USA. Results are ISO/IEC-17025:2017 accredited. Briefly, the samples were subjected to ultrasonic mixing and screening to remove impurities. Inorganic carbon was eliminated through pickling, and graphite targets were prepared for testing in an accelerator mass spectrometer. The standard was NIST SRM-4990C (oxalic acid). The analytical precision for Δ14C measurements is typically < 5‰.
3.4 N-alkanes
Ca. 3.0 to 6.0 g of lyophilized and ground sediment samples were accurately weighed and loaded into the extraction cell of a rapid solvent extractor (ASE-350, USA), and hexadecane deuterium (nC24D50) was added as an internal standard. Organic matter extracts were obtained by introducing dichloromethane and methanol (9:1, v:v) to the cell and heating at 100°C for 5 min, followed by extraction for 10 min. The heating and extraction were repeated 3 times. The extracts were initially concentrated by rotary evaporation, followed by evaporation under a steady stream of N2. When the volumes were < 10 mL, the extracts were transferred to 10 mL glass bottles and evaporated with N2 until dry. Next, a 6% potassium hydroxide in methanol solution was added and ultrasonicated for 10 min. The hydrolysate was removed by adding 4 mL of hexane and waiting for the polar and non-polar layers to separate. The non-polar layer was removed and transferred to a 20 mL glass bottle. The extraction was repeated 4 times, with all extracts combined in the new container. 0.2 mL of the combined organic matter extract was sub-sampled and dried under N2, re-constituted in a known quantity of hexane, and then separated on an activated silica gel column. The non-polar components were obtained by leaching with n-hexane.
An Agilent gas chromatograph (Agilent 6890N, USA) with a flame ionization detector (GC-FID) was used for n-alkane analysis. The GC was equipped with an HP-1 (dimethylpolysiloxane) column (50 m × 0.32 mm × 0.17 μm). Analytical conditions were as follows: inlet temperature 310°C, FID detector temperature 320°C, carrier gas (N2) flow rate 1.2 mL/min. The GC oven initial temperature was 60°C, which was held for 1 min before increasing to 200°C at a rate of 10°C/min. The temperature was then increased to 300°C at a rate of 5°C/min, and then to 310°C at a rate of 5°C/min, where it was held for 15 min. An example n-alkane chromatogram with relative abundance (station RB08B) was shown in Supplementary Figure S1. The retention time of target compounds was determined by comparing the retention time of 34 n-alkanes in a mixed standard (nC7 to nC40). The relative response values of each component peak of the mixed standard and the nC24D50 internal standard peak were applied to the peak areas of the target compounds to quantify their abundance. Yields of n-alkanes were normalized to the mass of sediment extracted, and values are expressed as ng/g.
L/H, TAR (Meyers, 1997), CPIH and CPIL (Eglinton and Calvin, 1967; Cranwell et al., 1987) were calculated based on the content of n-alkanes of different carbon numbers (see Supplementary Text S2 for indicative meanings of the above parameters):
3.5 Statistical analyses
A Pearson correlation analysis and a two-tailed test of significance were performed using the statistical software SPSS (Version 25) to determine relationships between the measured parameters. Statistically, significant differences were identified using one-way analysis of variance with a 95% confidence interval (p < 0.05).
4 Results
4.1 Chronostratigraphic framework
A reliable chronostratigraphic framework based on TOC should consider marine reservoir effects (Andrews et al., 1999; Pudsey et al., 2006) and fossil carbon contamination from glacial erosion on the Antarctic continent (Hillenbrand et al., 2010). A marine reservoir age of 825 a was referenced from Anderson et al. (2014) and Huang et al. (2016). A fossil carbon contamination age of 3045 a was referenced from station ATN31-JB06 (173.907°E, 74.473°S, water depth = 567 m) (Huang et al., 2016; Fan et al., 2021) due to the absent of foraminifera in JB03. Calendar ages were determined using the 7.10 software and Marine 13 program (http://calib.org/calib/calib.html). Linear interpolation and extrapolation were employed to establish a chronological framework, resulting in an age of 27.3 ka BP at the bottom of core JB03. The different depth intervals (0 – 72, 72 – 78 and 78 – 130 cm) corresponded to the Holocene (11.7 – 0 ka BP), the last deglaciation (21.0 – 11.7 ka BP) and the LGM (27.3 – 21.0 ka BP), respectively (Table 1; Figure 2). Sedimentation rates for each layer were calculated using 11 age control points and the interpolation method. The sedimentation rate for the interval 0 – 72 cm ranged from 6.31 to 7.35 cm/ka. The age difference between 78 – 80 cm and 72 – 74 cm layers was as high as 13.2 ka, and the lowest sedimentation rate for the whole core was calculated to be 0.45 cm/ka. Layers between 102 – 130 cm exhibited extremely high sedimentation rate, up to > 100 cm/ka (Table 1; Figure 2).
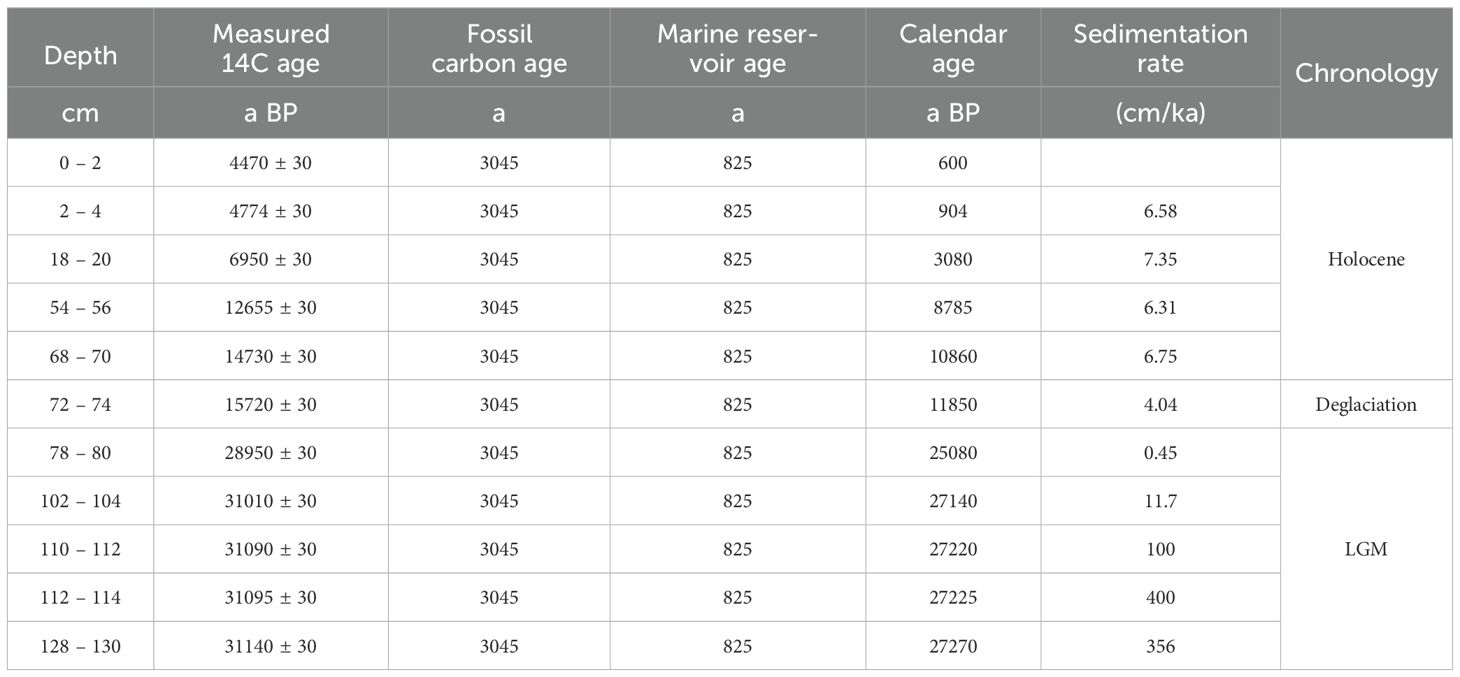
Table 1. Dating results and calculated sedimentation rate for core JB03.
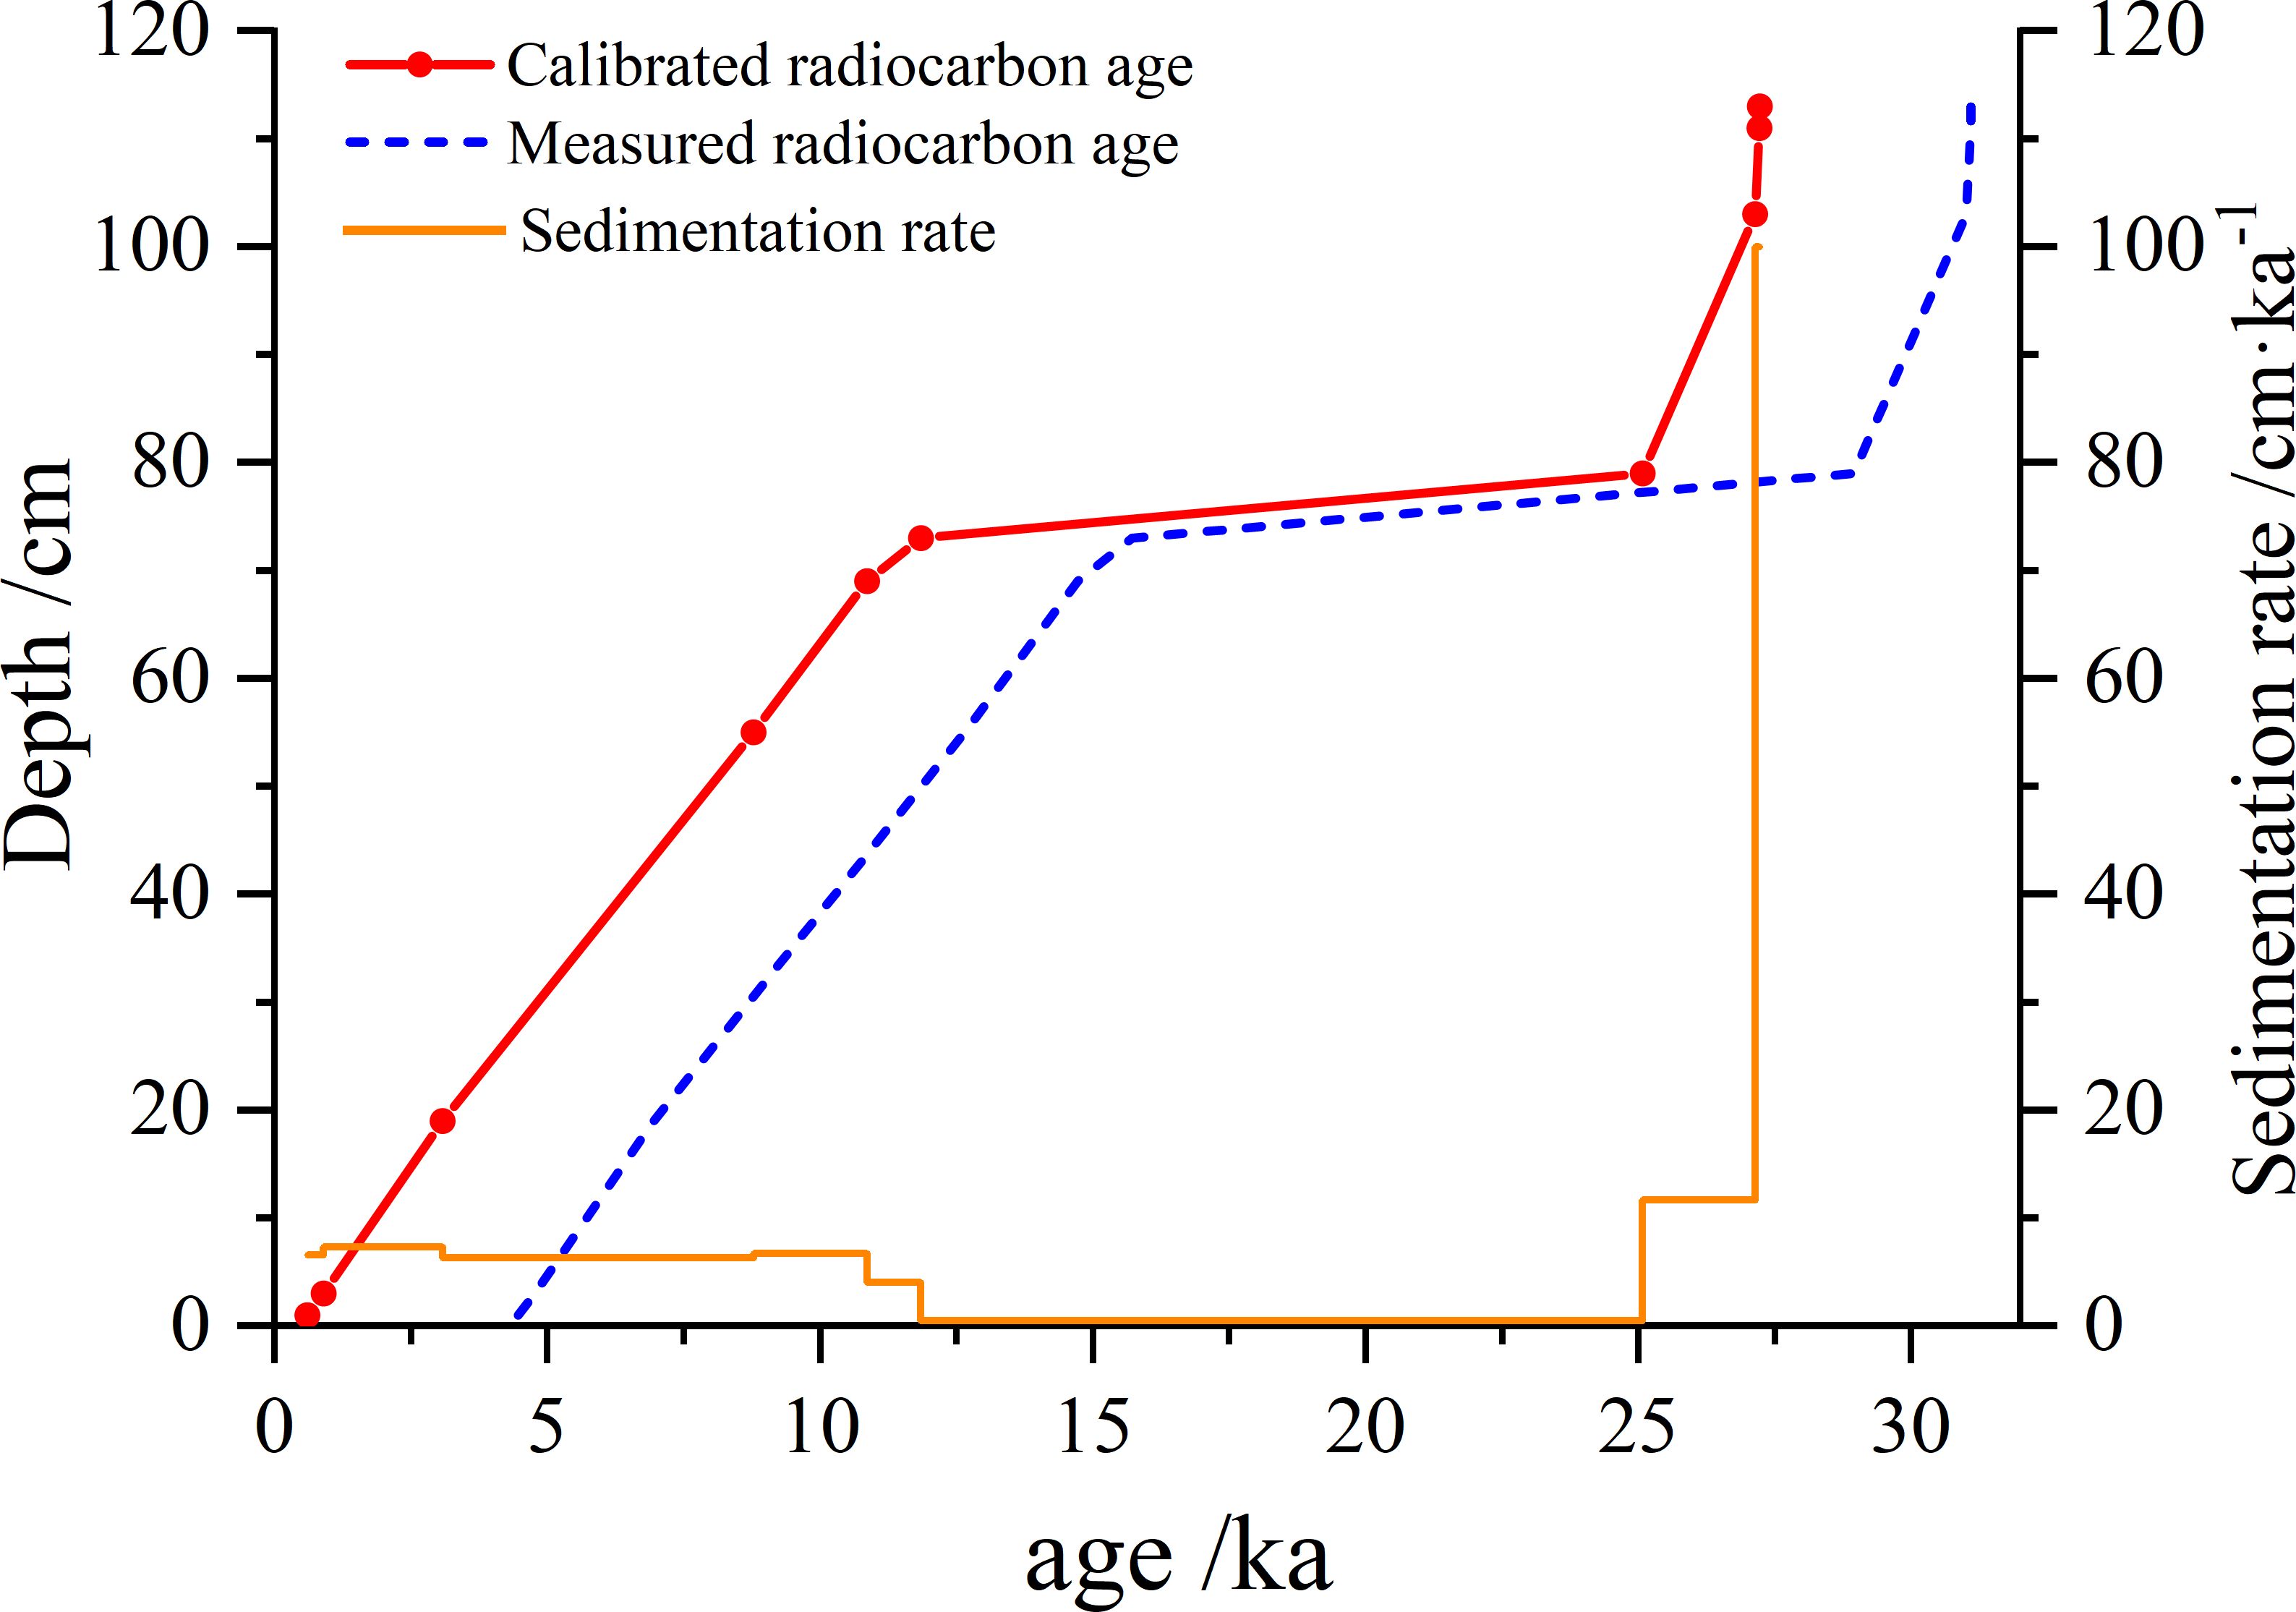
Figure 2. The measured ages, corrected ages and sedimentation rates in Core JB03 based on AMS14C results.
4.2 Particle size components
The composition of sand, silt and clay in surface sediments of the Ross Sea varied from 4.03% to 56.7%, 37.1% to 78.3% and 6.16% to 35.4%, respectively (Supplementary Table S1; Figures 3A–C). Spatially, the proportions of sand and silt did not exhibit significant (p > 0.05) differences among the three regions, while clay content in the Eastern sediment (27.0% ± 4.74%) was significantly (p < 0.01) higher than that in the Southwest and Western sediments (11.8% ± 0.25% and 13.0% ± 5.34%). Following Folk (1980) sediment classification method, the predominant sediment type in the study area was clayey silt, mainly located in Cape Adare and Glomar Challenger Trough. This was followed by sandy silt, distributed in Joides Trough and Drygalski Trough. Silty sand sediment was present at stations R02 and R08 near Terra Nova Bay, while silt sediment was at stations JB01 and JB03 in McMurdo Sound and Joides Trough (Supplementary Figure S2). Hydrodynamic indicators, including MZ, σ, SK, and KG, ranged from 4.17 to 7.00 φ, 1.63 to 2.44, –0.17 to 0.37 and 0.82 to 1.04, respectively (Supplementary Table S1; Figures 3D–G). The MZ in the Eastern sediment (6.75 ± 0.21 φ) was significantly (p < 0.01) higher than that in the Southwest and Western sediments (5.70 ± 0.24 φ and 5.42 ± 0.68 φ), while σ, SK and KG did not show significant (p > 0.05) differences among the three regions.
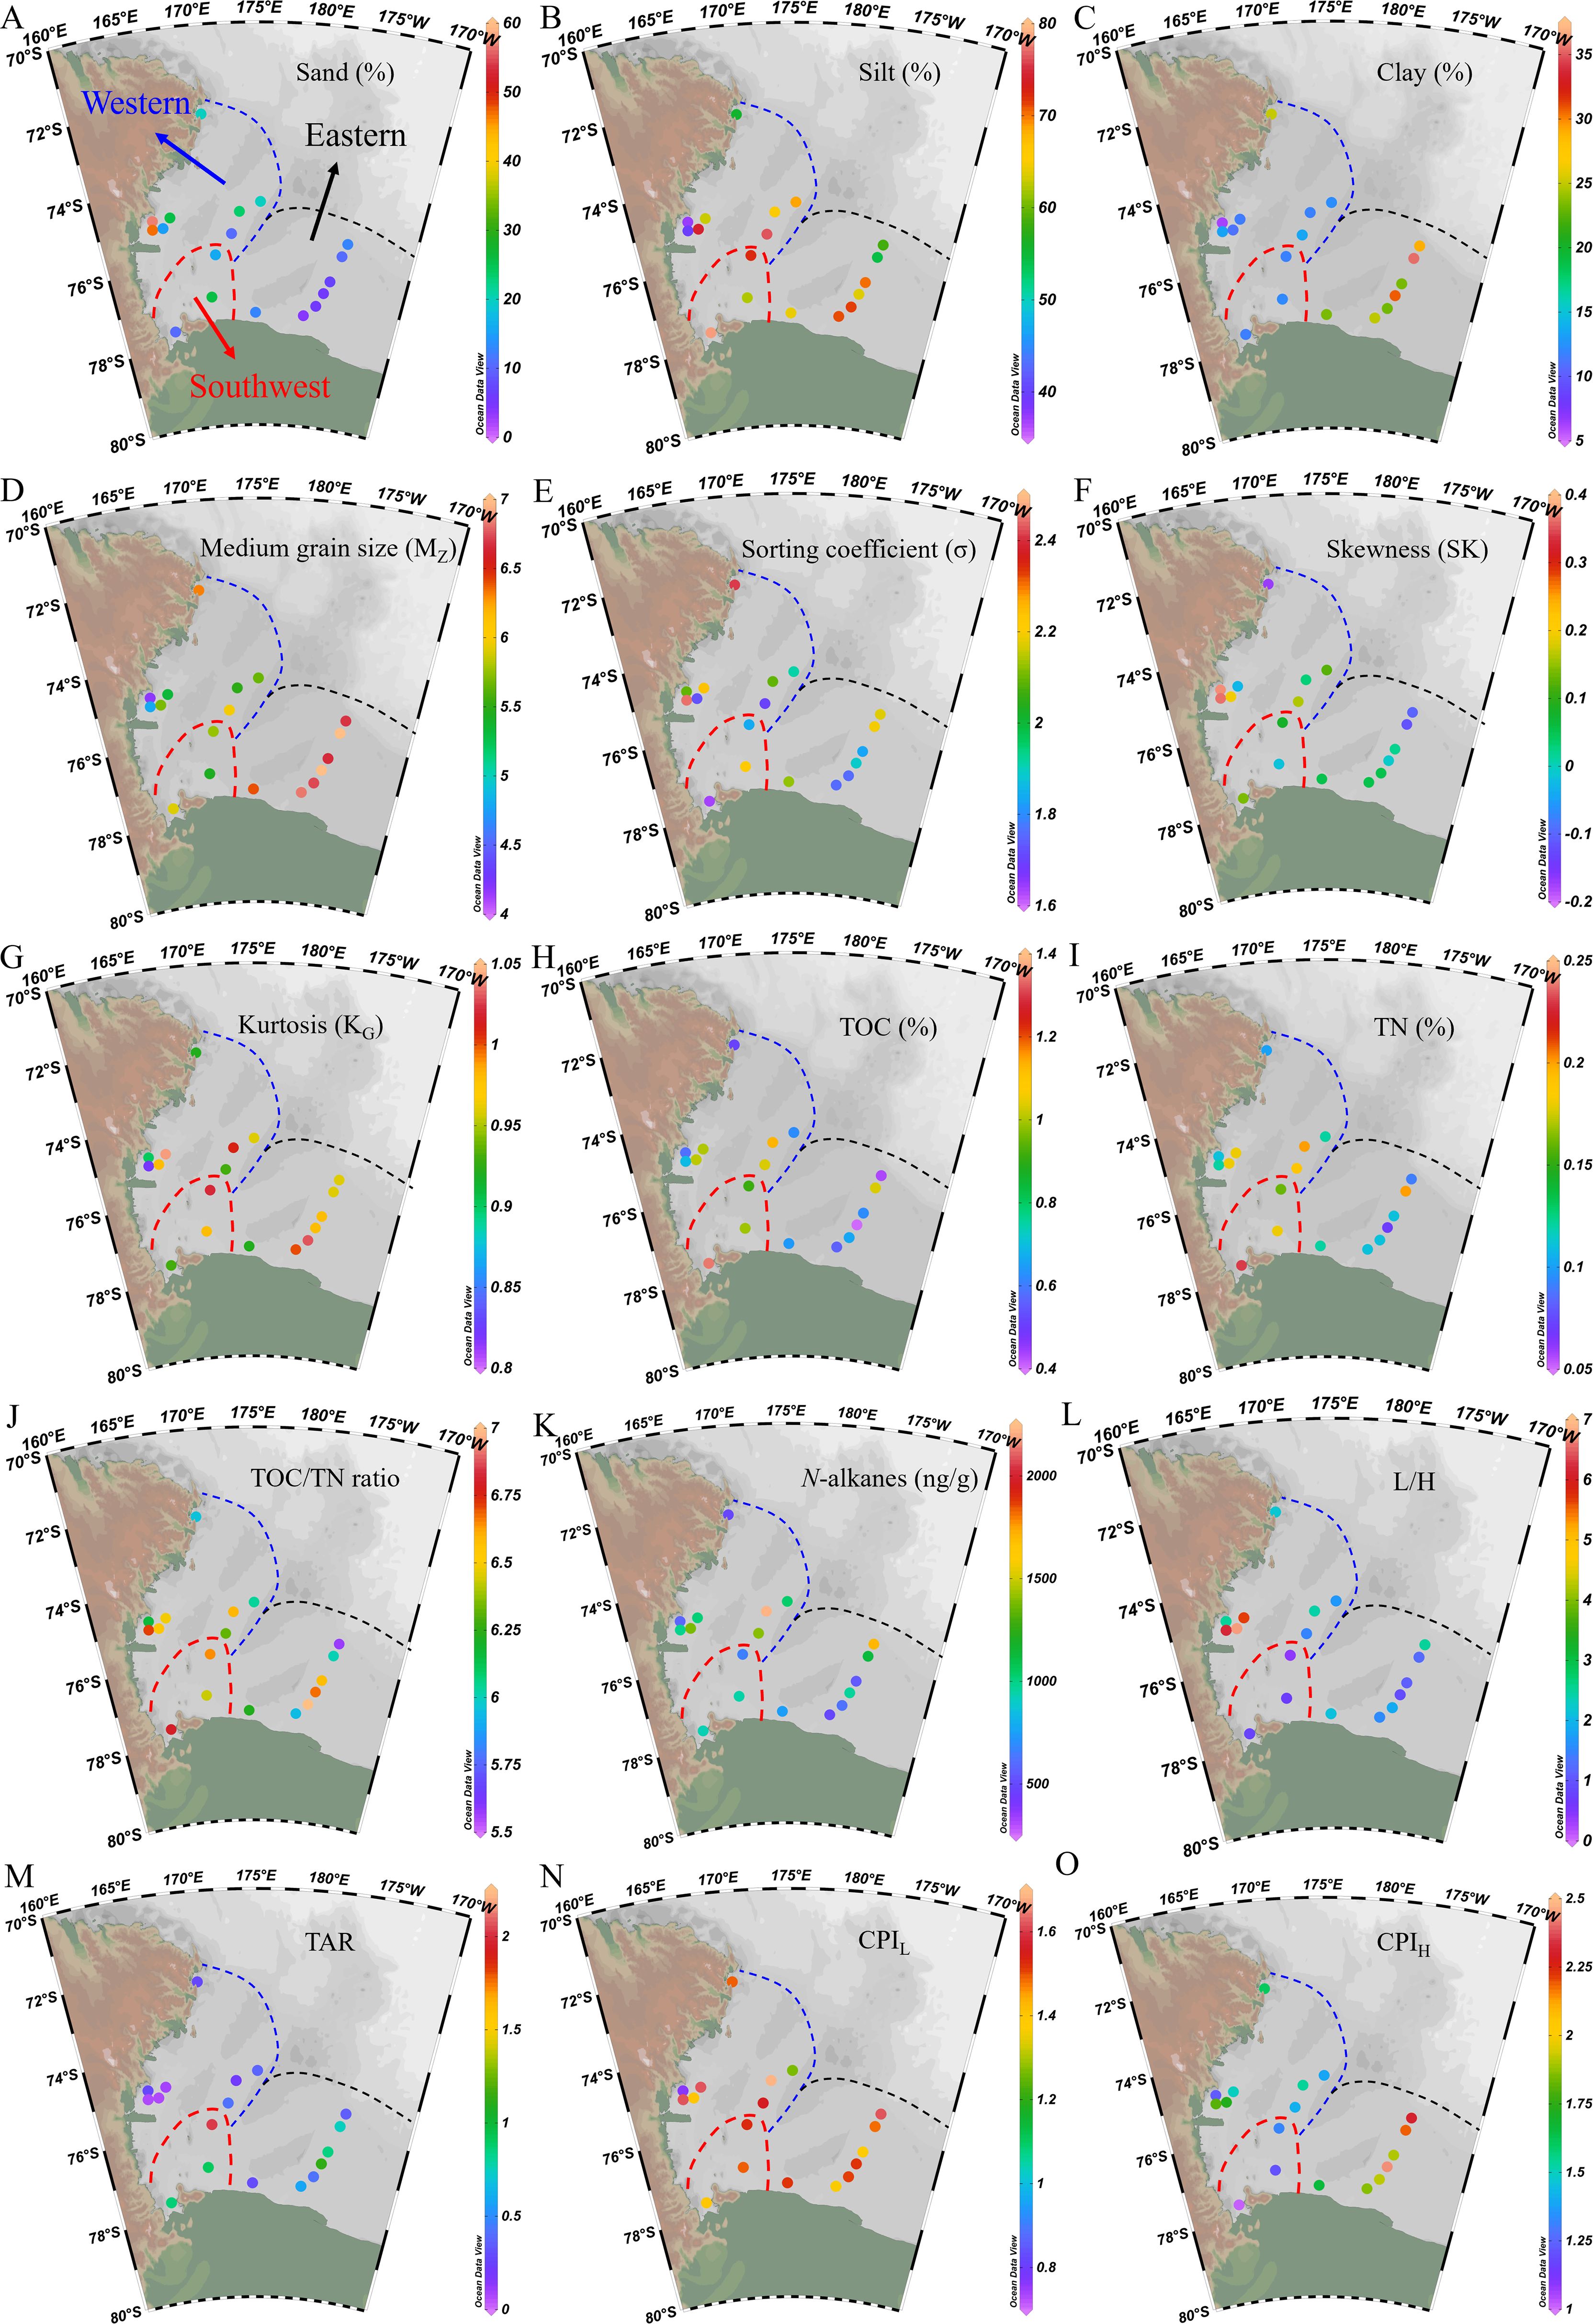
Figure 3. Spatial distribution of (A) sand (%), (B) silt (%), (C) clay (%), (D) mean particle size (MZ), (E) sorting coefficient (σ), (F) skewness (SK), (G) kurtosis (KG), (H) TOC (%), (I) TN (%), (J) TOC/TN ratio, (K) total content of n-alkanes (ng/g), (L) ratio of low molecular-weight (nC13 – nC21) to high molecular-weight n-alkanes (nC25 – nC34) (L/H), (M) terrestrial/aquatic ratio (TAR), (N, O) long-chain and short-chain carbon preference index (CPIH and CPIL) in surface sediments of the Ross Sea.
4.3 TOC, TN and TOC/TN ratio
The TOC content of surface sediment samples ranged from 0.40% to 1.34% (wt%), which is consistent with the ranges of previous studies (0.2% to 2%) (Langone et al., 1998; Andrews et al., 1999; Chen et al., 2019b). Spatially, TOC content in the Southwest sediment (1.08% ± 0.23%) was significantly (p < 0.05) higher than that in the Eastern sediments (0.62% ± 0.21%), and intermediate in the Western sediments (0.82% ± 0.24%) (Supplementary Table S1; Figure 3H). TN content ranged from 0.07% to 0.23%, showing a similar spatial distribution pattern to TOC content (Figure 3I). A significant positive correlation was observed between TOC and TN content (r = 0.99, p < 0.001, Figure 4A). The TOC/TN ratio varied from 5.57 to 7.00, with no significant differences observed among the three regions (6.62 ± 0.19, 6.35 ± 0.28 and 6.28 ± 0.49 in the Southwest, Western and Eastern Ross Sea sediments, respectively) (Supplementary Table S1; Figure 3J).
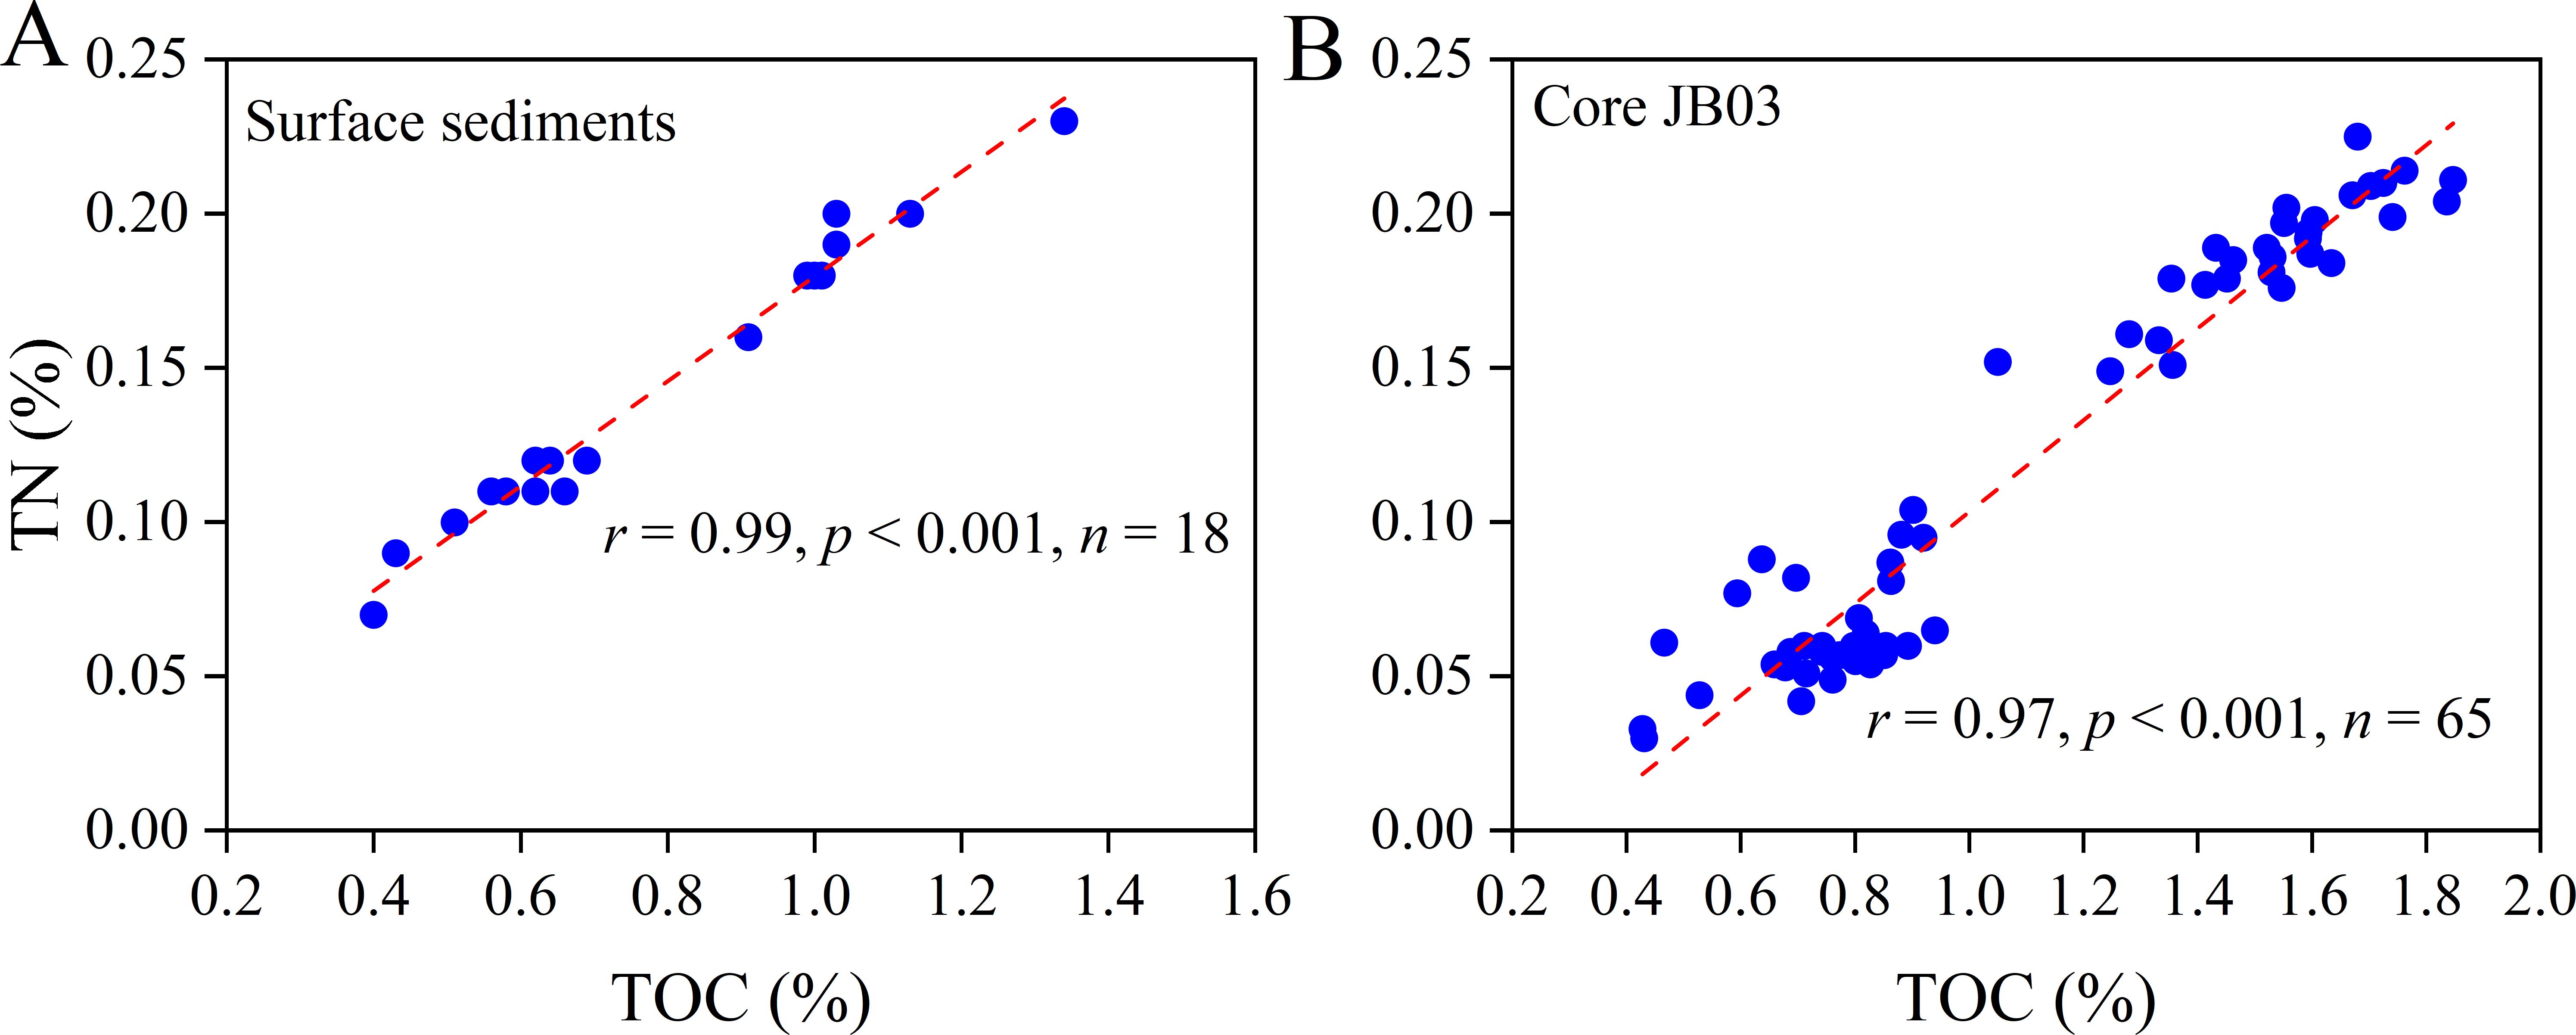
Figure 4. Diagrams of the relationship between TOC content and TN content in (A) surface sediments and (B) core JB03 of the Ross Sea.
In the JB03 core sediments, TOC content ranged from 0.43% to 1.85%, while TN content ranged from 0.03% to 0.23%. Similar to the surface sediments, a significant positive correlation between TOC and TN was noted in the core sediments (r = 0.97, p < 0.001, Figure 4B). The TOC/TN ratio ranged from 6.91 to 16.81 (Supplementary Table S2). In the downcore profiles, TOC decreased from 1.56% ± 0.30% during the period of 0.6 – 8.2 ka BP to 0.74% ± 0.12% during 21.0 – 27.3 ka BP, while the TOC/TN ratio increased from 8.18 ± 0.51 to 13.63 ± 1.29 (Figure 5).
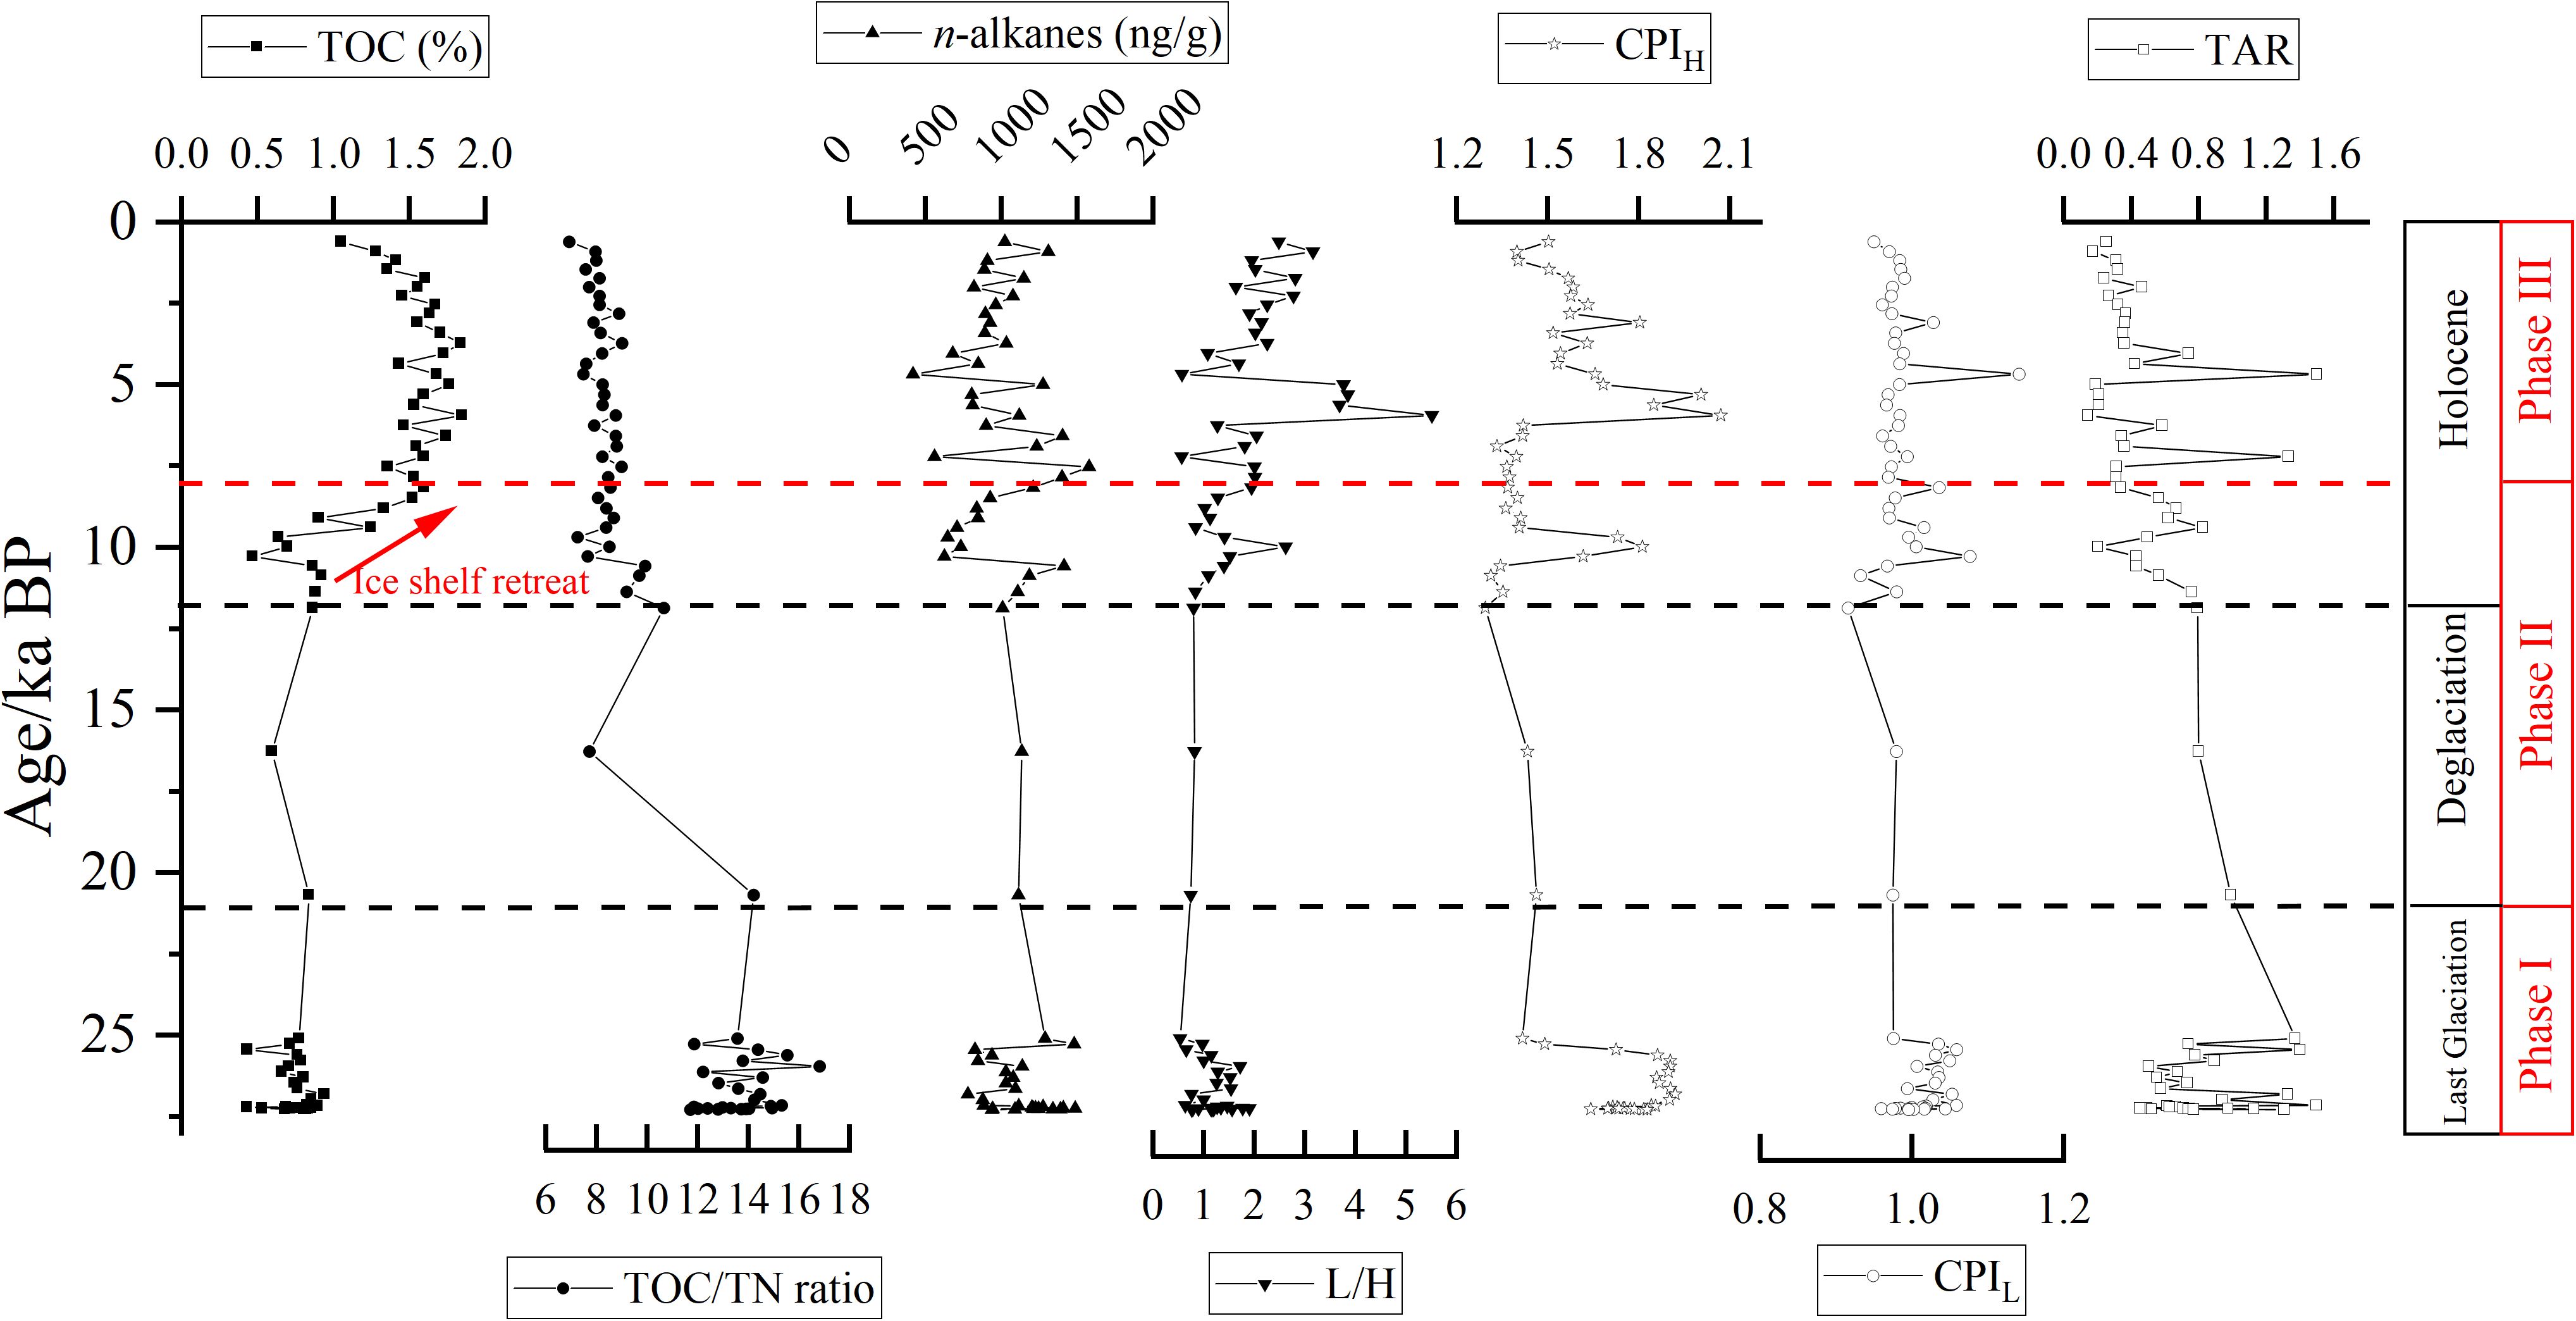
Figure 5. Downcore variability of TOC (%), TN (%), TOC/TN ratio, n-alkanes (ng/g), low molecular-weight (nC13 – nC21) to high molecular-weight n-alkanes (nC25 – nC34) (L/H), terrestrial/aquatic ratio (TAR), long-chain and short-chain carbon preference index (CPIH and CPIL) in core JB03 since LGM.
4.4 N-alkanes
The concentration of n-alkanes in the surface sediments of the Ross Sea varied from 482 to 2221 ng/g, with higher values found in the Glomar Challenger Trough and Joides Trough (stations RB02B and JB05), and the lowest concentration found near Cape Adare (station R19) (Figure 3K). The carbon chain lengths of n-alkanes ranged from nC12 to nC35, characterized by a unimodal distribution with main carbon peak at nC17 or nC19 in Western Ross Sea (Figure 6A), a bimodal distribution with main carbon peaks at nC19 and nC25 in the Southwest Ross Sea (Figure 6B), and a combination of unimodal and bimodal distributions with main carbon peaks at nC17 or nC19 and nC27 in the Eastern Ross Sea (Figure 6C). The L/H ranged from 0.38 to 6.72, being significantly (p < 0.05) higher of Western sediments (3.60 ± 2.18) than those in Southwest and Eastern sediments (0.62 ± 0.21 and 1.60 ± 0.58) (Figure 3L). The TAR varied from 0.07 to 2.03, significantly (p < 0.01) higher in the Southwest sediments (1.26 ± 0.66) than in the Western and Eastern sediments (0.22 ± 0.14 and 0.61 ± 0.30) (Figure 3M). N-alkanes exhibited odd carbon dominance (CPIL = 1.26 to 1.68), except for station R02, which displayed an even carbon distribution (CPIL = 0.76) (Figure 3N). The CPIH ranged from 1.01 to 2.43, being highest in the Eastern sediments (2.04 ± 0.28), lowest in the Southwest sediments (1.18 ± 0.16), and intermediate in the Western sediments (1.52 ± 0.19) (Figure 3O; Supplementary Table S1).
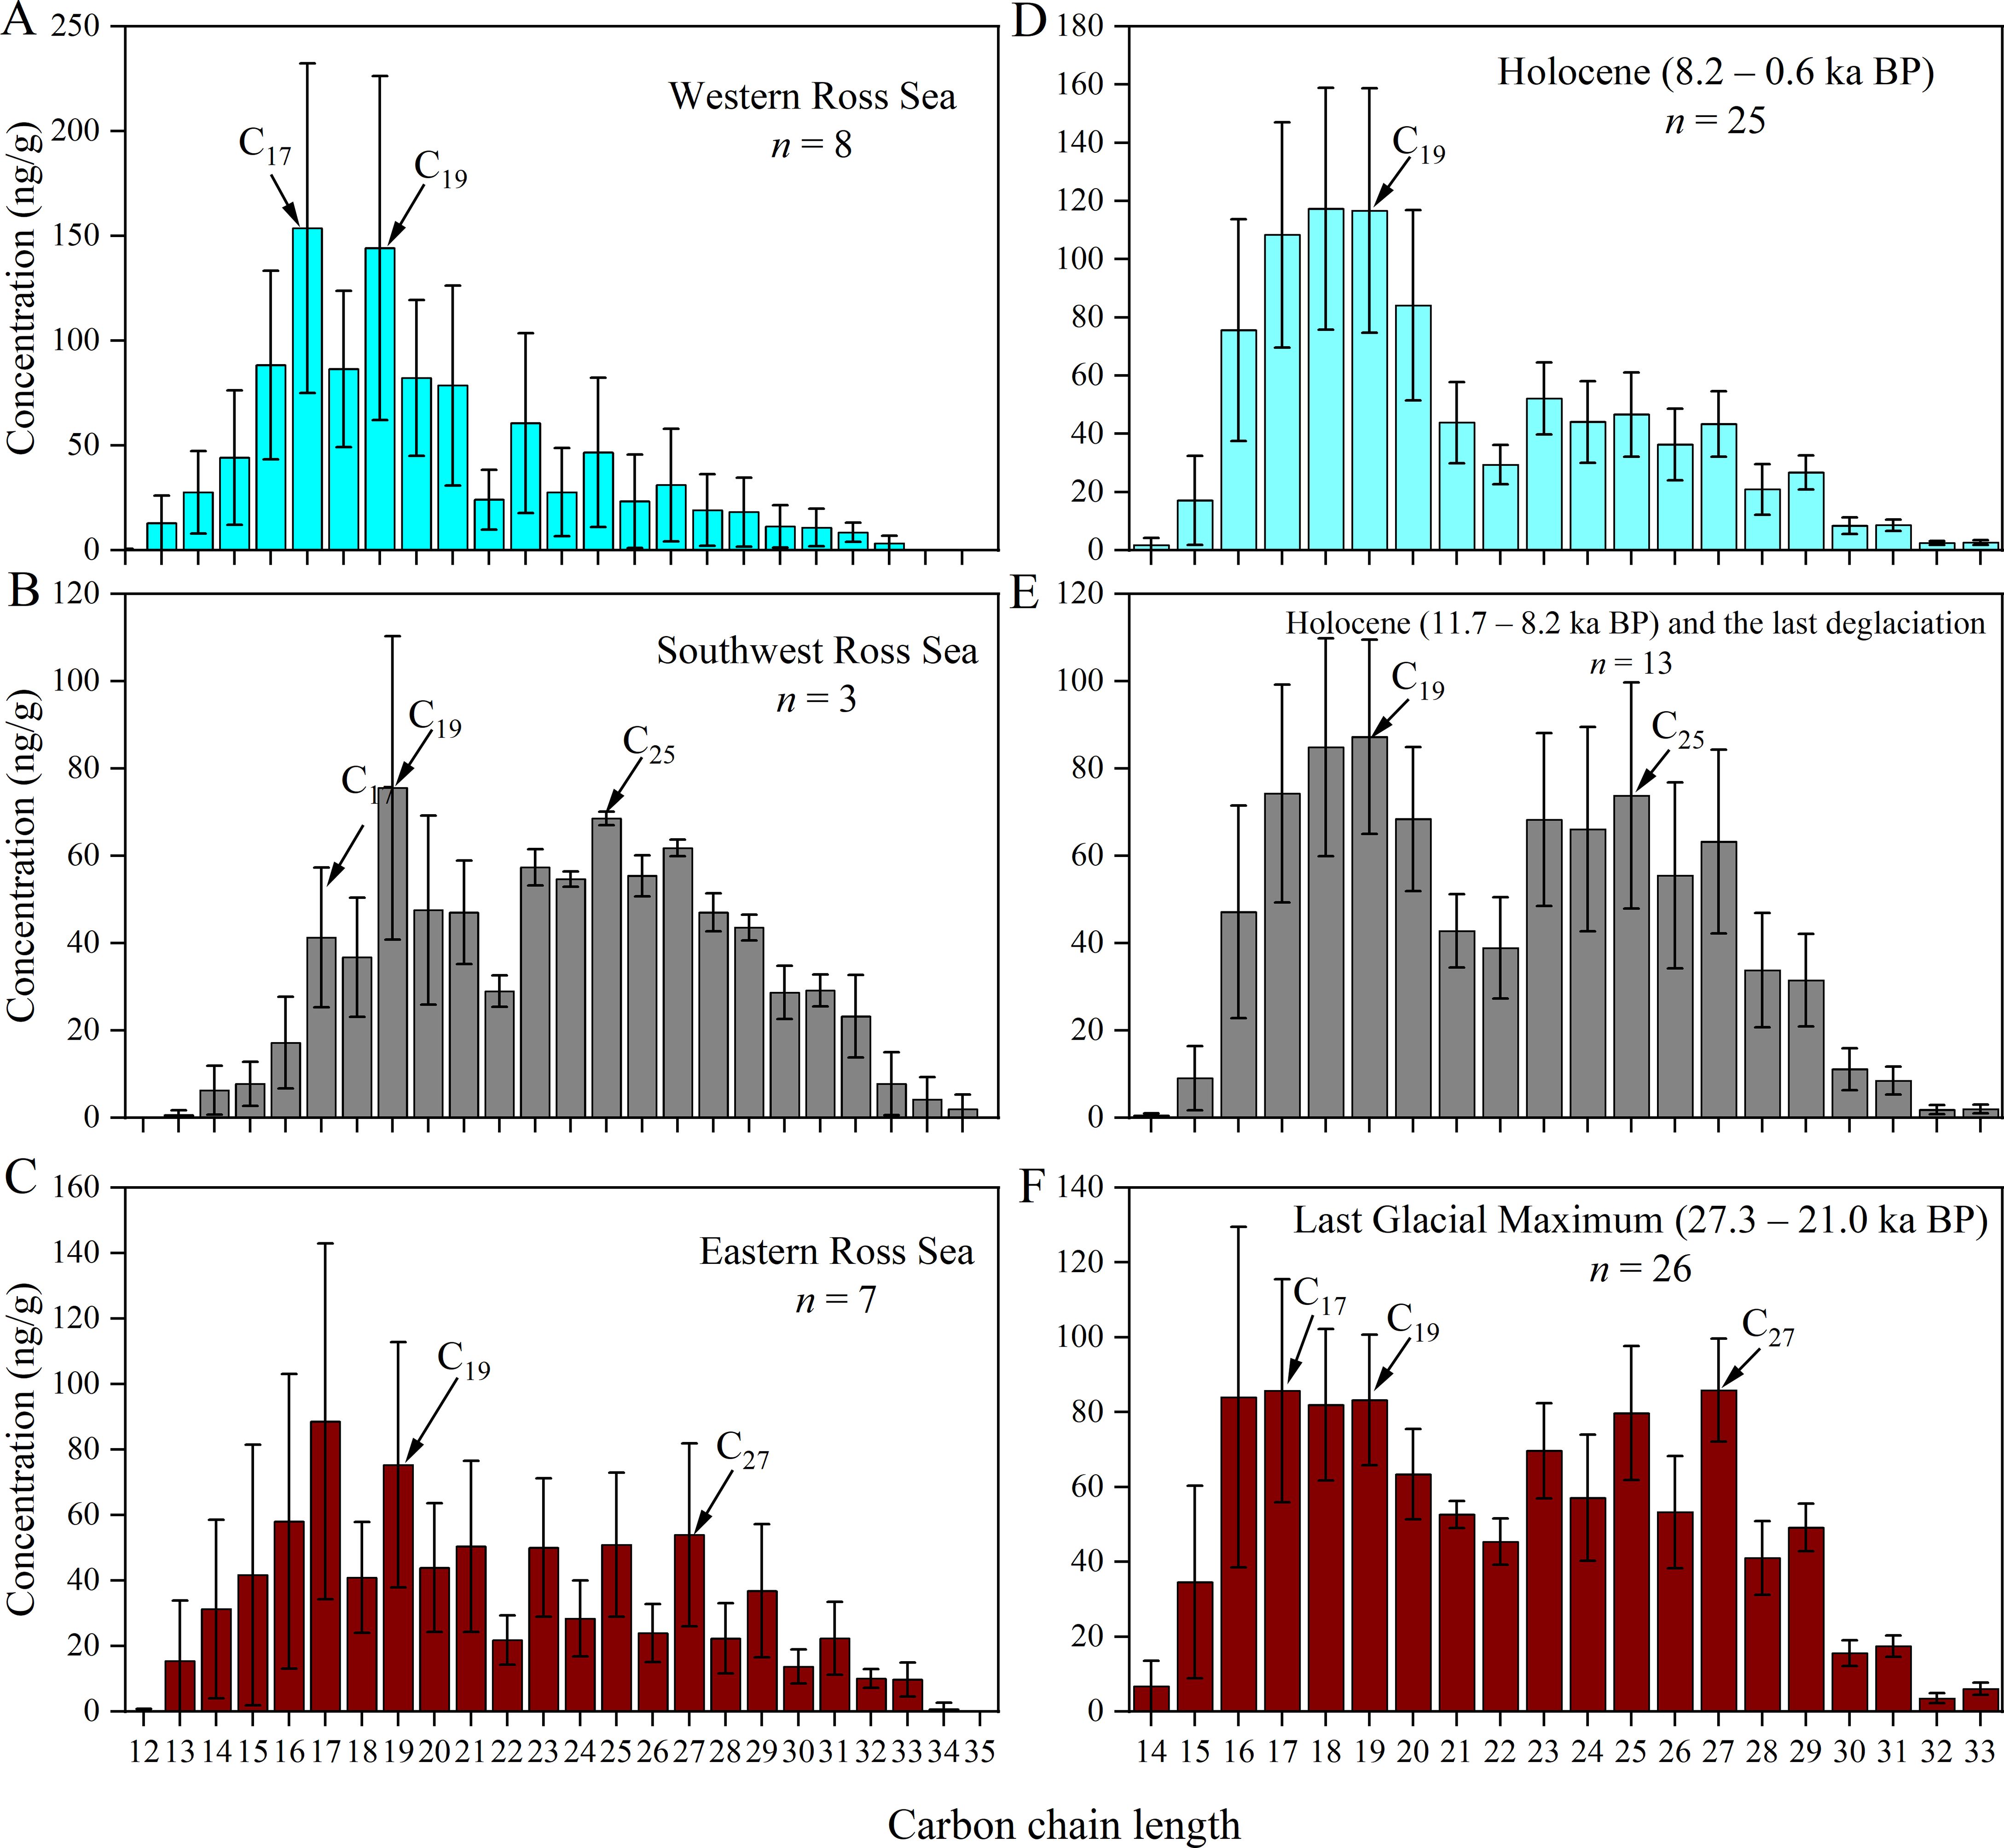
Figure 6. Abundance of n-alkanes in (A) Western, (B) Southwest, (C) Eastern surface sediment and (D) Holocene (8.2 – 0.6 ka BP), (E) early Holocene (11.7 – 8.2 ka BP) and the last deglaciation, (F) Last Glacial Maximum (27.3 – 21 ka BP) in core JB03. The error bars are the standard deviations of measured abundances in samples.
In core JB03, the n-alkane content ranged from 416 to 1577 ng/g, exhibiting a slight increasing trend downcore, which contrasts with TOC profile (Figure 5). The carbon chain lengths extended from nC13 to nC33, displaying a unimodal distribution with nC17, nC18 or nC19 as main carbon peaks during 0.6 – 8.2 ka BP (Figure 6D), bimodal distribution with main carbon peaks as nC18/nC25 and nC19/nC25 during 8.2 – 21.0 ka BP (Figure 6E), and bimodal distribution with main carbon peaks of nC17 or nC19 and nC27 during 21.0 – 27.3 ka BP (Figure 6F). The source indices, including the L/H, TAR, CPIL and CPIH, ranged from 0.53 to 5.50, 0.14 to 1.50, 0.92 to 1.14 and 1.29 to 2.07, respectively (Supplementary Table S2). Downcore analysis revealed that the L/H decreased from 2.27 ± 1.07 during 0.6 – 8.2 ka BP to 1.17 ± 0.37 during 21.0 – 27.3 ka BP. Conversely, TAR increased from 0.41 ± 0.32 to 0.83 ± 0.31, while CPIL and CPIH did not show significant downcore trends (Figure 5).
5 Discussion
5.1 Sedimentary environment and organic matter source pattern in the surface sediments
5.1.1 Sedimentary environment
Mz values were > 4.00, σ values were > 1.00 and KG values generally fell within the mid-peak range of 0.90 – 1.11 for surface sediments in the study area. These findings indicate poor sediment sorting characteristic of a low-energy, hydrodynamic stable sedimentary environment (Folk and Ward, 1957). This aligns with the characteristics of an ice-sea environment dominated by physical weathering processes, such as abrasion and sediment extraction (Wang et al., 2016). Meanwhile, a significant positive correlation was observed between Mz and clay content (r = 0.88, p < 0.01, Figure 7A), while a significant negative correlation was noted between Mz and SK (r = –0.71, p < 0.01, Figure 7B), consistent with the sediment type distribution trends. High Mz values were exhibited in Glomar Challenger Trough with high clay content, predominantly chalky texture, and SK values generally less than 0 (Supplementary Figure S2). Previous studies based on radioisotope analysis (Licht and Hemming, 2017; Shao et al., 2022 and references therein) and sediment mineralogical composition (Andrews and LeMasurier, 2021) have shown that sediments in the Eastern Ross Sea are from both Edward VII Land and Marie Byrd Land, while in the Western Ross Sea, sediments originate predominantly from Victoria Land. Weaker hydrodynamic conditions lead to in situ deposition of coarse-grained material, while fine-clay minerals may be transported over long distances to Glomar Challenger Trough. Conversely, stations at TNBP, particularly station R02, exhibited the highest sand content (56.7%), the lowest Mz (4.17) and the most positive SK (0.37), indicating the impact from terrestrial sand and gravel carried by sea ice ablation and/or relatively stronger coastal currents (DeMaster, 1992; Orsi et al., 1995).
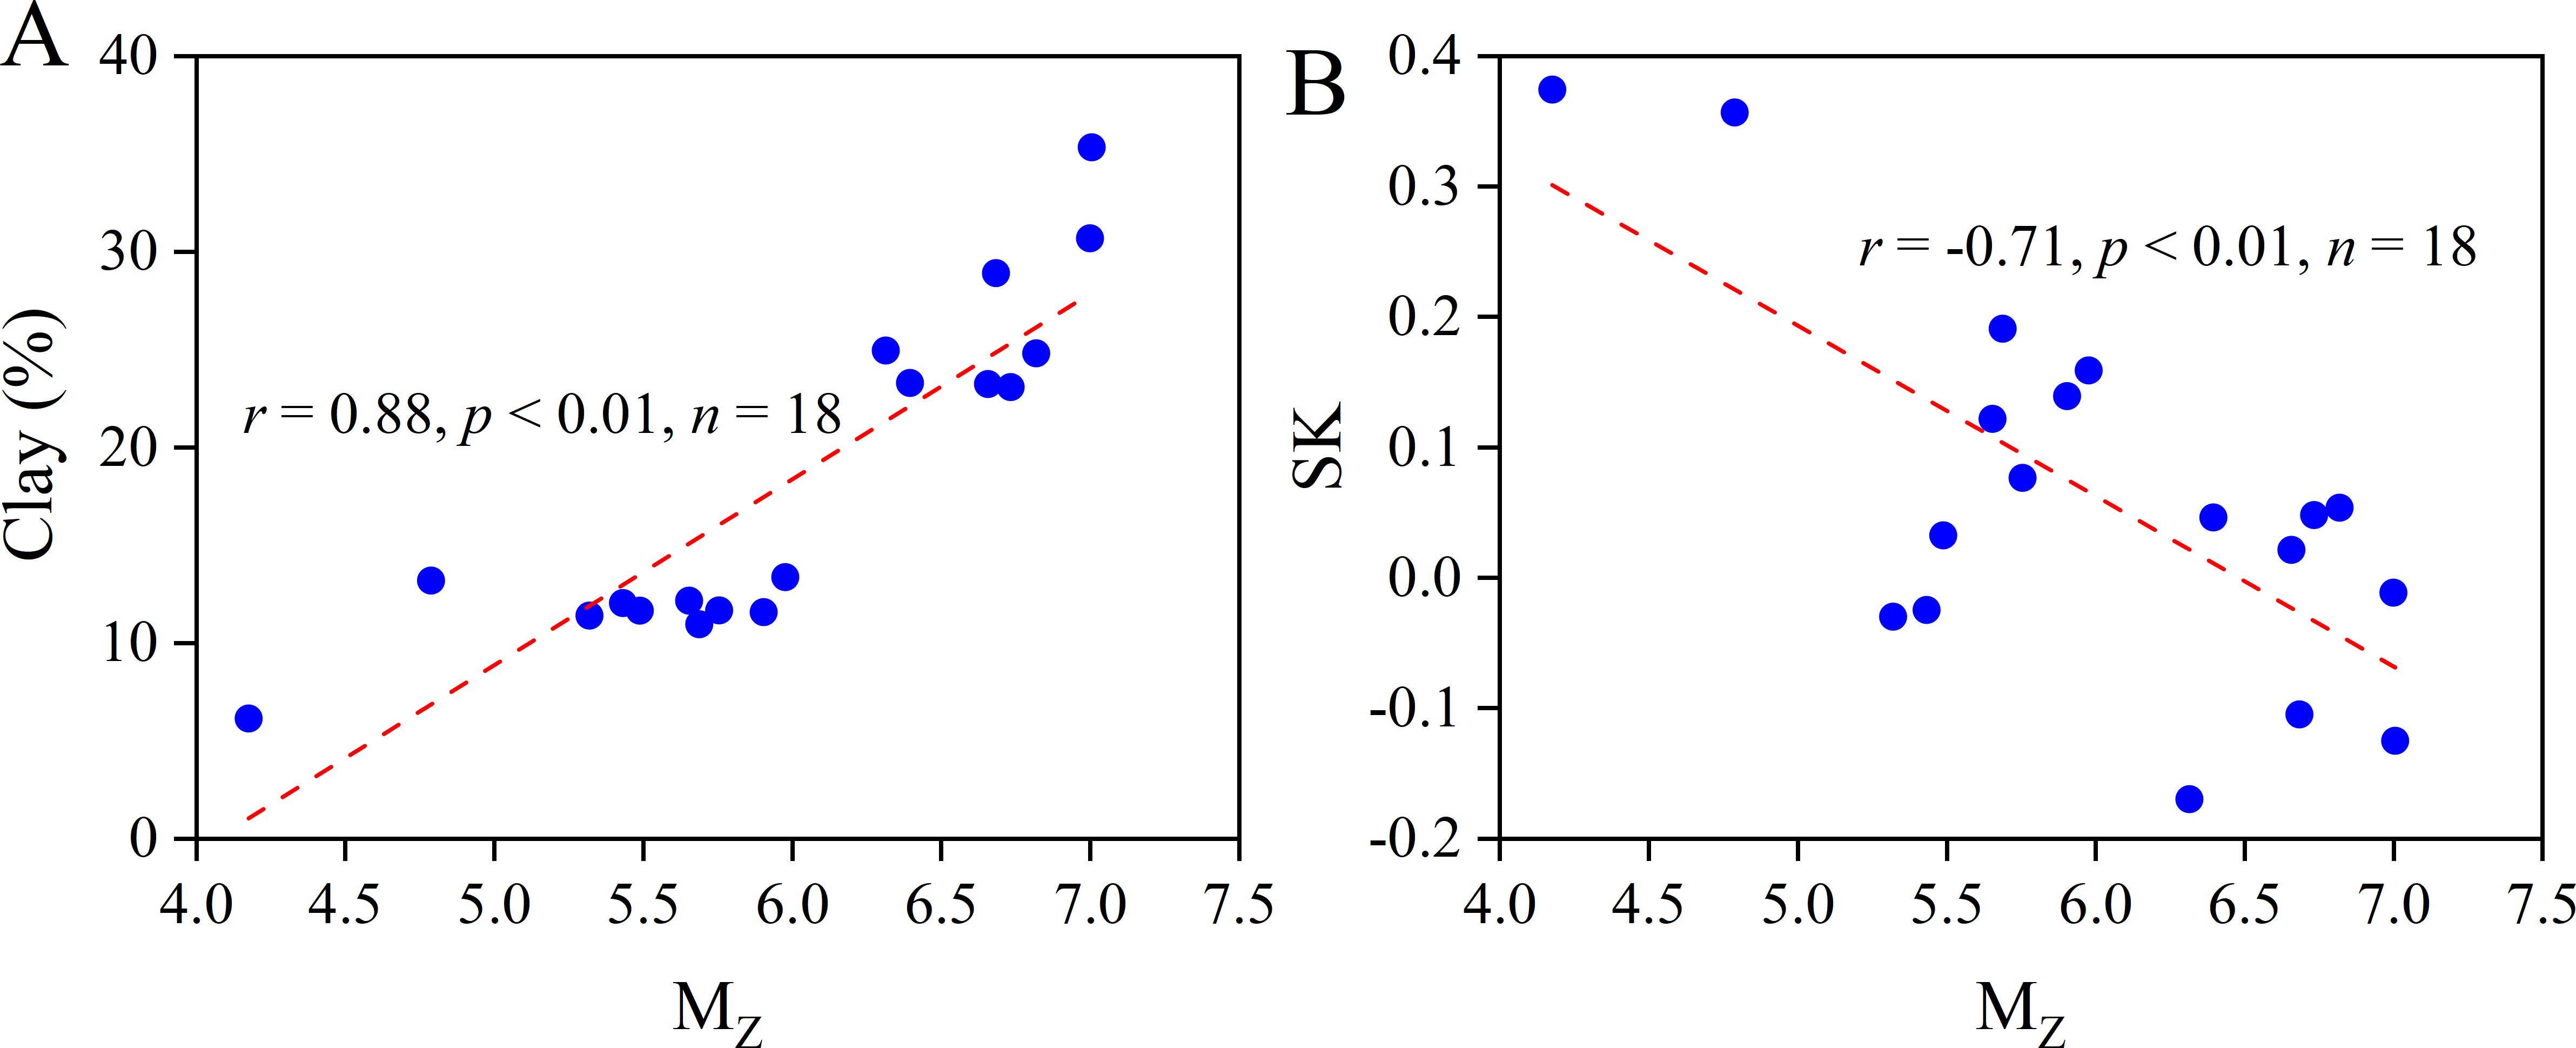
Figure 7. Diagrams of the relationship between Mz and (A) clay content, (B) SK in the surface sediments of the Ross Sea.
5.1.2 Spatial distribution and source difference of TOC
A common source for TOC and TN in the surface sediments of the study area was indicated by a significant positive correlation between TOC and TN content (Figure 4A), in line with findings from previous studies (DeMaster et al., 1996; Langone et al., 1998; Xiu et al., 2017). Studies have shown that the TOC/TN ratio varies significantly depending on the source of organic matter. For instance, the TOC/TN ratio ranges from 2.3 to 3.7 from marine microbial sources (Lee and Fuhrman, 1987; Coffin and Cifuentes, 1993), 3 to 8 from protein-rich marine organic matter (Redfield et al., 1963; Meyers, 1994), and > 12 from lignin- and cellulose-rich terrestrial higher plants (Sampei and Matsumoto, 2001). In this study, the TOC/TN ratio in the surface sediments was at 6.37 ± 0.37, showing no significant difference (p > 0.1) among the three regions (Supplementary Table S1; Figure 3J), comparable to the ratios reported in previous studies of particulate matter in the euphotic zone of the Ross Sea (6.5 on average, Fabiano et al., 1993), sediments (6.5 to 7.0 on average, Wakeham and Mcnichol, 2014; DeMaster et al., 1996), and was also close to the Redfield ratio (Redfield et al., 1963). A recent study found that TOC/TN ratio and σ are significantly correlated in the East China Sea, a large river dominated marginal sea, indicating that the TOC/TN ratio could be affected by the grain size, with potential to inferring the evolution of the sedimentary environments (Zhang et al., 2023). However, no significant (p > 0.05) correlation was found between the TOC/TN ratio and σ in the surface sediments of Ross Sea. Therefore, these results suggest that surface OC in the Ross Sea primarily originates from epipelagic phytoplankton production.
The spatial distribution of TOC exhibited a pattern of high in the west and low in the east, consistent with findings from previous studies (Andrews et al., 1999; Chen et al., 2019b; Zhou et al., 2022). This distribution discrepancy can be attributed to two factors. Firstly, the formation of polynyas and open seas occurs earlier in the summer in the Southwest and Western Ross Sea due to katabatic wind, with polynyas even observable in winter. In contrast, in the Eastern Ross Sea, the formation of open seas is delayed until later in the summer season. Chlorophyll a concentrations throughout the Ross Sea exceed 5 μg/L in December, and then decrease to < 2 μg/L in January and February. However, in the Western Ross Sea, particularly at the RSP location, chlorophyll a levels remain above 5 μg/L throughout the austral summer (Smith and Kaufman, 2018; Smith, 2022). This extended period of elevated productivity contributes to a higher accumulation of TOC in the sediments of the southwestern region. Secondly, sedimentation rates are significantly higher in the Southwest and Western Ross Sea than the Eastern (DeMaster et al., 1996). For instance, the sedimentation rate was 6.58 cm/ka on the top of core JB03 in this study, and was 8 cm/ka on the top of core RB16C from Joides Trough, Western Ross Sea (Song et al., 2019). In contrast, sedimentation rates on the Eastern Ross Sea shelf typically range from 1 to 2 cm/ka (DeMaster et al., 1996; Cui et al., 2021). High sedimentation rates facilitate the bypassing of OC early diagenesis, leading to its burial in anaerobic sediments and enhancing preservation potential (Smith et al., 2015; Faust et al., 2021). Notably, station R02 in TNBP exhibited low clay (6.16%) and TOC content (0.58%). Despite being in a highly productive area, the retention of clay fraction is poor due to strong hydrodynamic conditions, whereas clay minerals promote organic matter preservation through physical or chemical adsorption owing to their large specific surface area (Eusterhues et al., 2003; Keil and Mayer, 2014; Wu et al., 2024).
5.1.3 Spatial distribution and source difference of n-alkanes
Concentrations of n-alkanes were slightly higher in the Western Ross Sea (1136 ± 548 ng/g) than in the Southwest and Eastern Ross Sea (837 ± 161 and 884 ± 431 ng/g). The n-alkanes in Western Ross Sea exhibited a unimodal distribution, with main carbon peak at nC17 or nC19 (Figure 6A), a weak odd-carbon preference (CPIL = 1.41 ± 0.30) and the lowest TAR (0.22 ± 0.14) (Supplementary Table S1). These results suggest that n-alkanes are mainly derived from marine algae and bacteria in the upper ocean, consistent with the results of TOC/TN ratio.
The n-alkanes in the Southwest Ross Sea exhibited a bimodal distribution with main carbon peaks at nC19 and nC25 (Figure 6B), a low L/H (0.62 ± 0.21), low CPIH values (1.18 ± 0.16) and the highest TAR value (1.26 ± 0.66) (Supplementary Table S1). Previous research has demonstrated that marine phytoplankton can produce significant quantities of medium- and long-chain alkyl lipids with low CPI values (e.g., Volkman et al., 1998). Additionally, n-alkanes from peat moss (Sphagnum) are characterized by a high abundance of nC23 and nC25 (Baas et al., 2000; Bingham et al., 2010). A TAR > 1 typically indicates a higher proportion of terrestrial OC input, while a TAR < 1 suggests a predominance of marine-derived sources (Meyers, 1997). In the Southwest Ross Sea, the presence of medium- and long-chain n-alkanes, without an odd-over-even carbon preference, suggests a mixture of contributions from marine algae and terrestrial mosses. This finding is consistent with the results of Tao et al. (2022), which showed that a CPIH ~1 in suspended particulates from the Southwest Ross Sea, indicating the contribution of terrestrial organic matter.
The n-alkanes in the Eastern Ross Sea stations exhibited combination of unimodal and bimodal distributions, with main carbon peaks at nC17 or nC19 and nC27, respectively (Figure 6C). The Eastern Ross Sea is characterized by the highest CPIH values (2.04 ± 0.28) and moderate L/H and TAR values (1.60 ± 0.58 and 0.61 ± 0.30) compared to the Western and Southwest Ross Sea (Supplementary Table S1). This suggests that short-chain n-alkanes possibly originate from phytoplankton, while long-chain n-alkanes may come from terrestrial sources such as higher plant fragments. Previous research has shown that medium- and long-chain n-alkanes are more prevalent than short-chain n-alkanes in McMurdo Dry Valleys soils, with main carbon peaks at nC23, nC25 and nC27, and CPIH values from 2.0 to 2.6. These n-alkanes are mainly from lichens and higher vascular plant fragments from pre-glacial periods, specifically the Miocene to Pliocene epochs (Matsumoto et al., 1990a, 1990b, 2010). Given the similarities in n-alkane characteristics between surface sediments in the Eastern Ross Sea and soils from the McMurdo Dry Valleys, it is suggested that long-chain n-alkanes may could have been transported over long distances by ocean currents. Furthermore, research indicates that dust from mid-latitude land areas and plant leaf waxes could be carried long distances through the atmosphere to the Southern Ocean, utilizing lipid biomarkers and compound-specific stable carbon isotope ratios of n-alkanes in aerosols (Bendle et al., 2007; Jaeschke et al., 2017). These materials may serve as sources of long-chain n-alkanes in Eastern Ross Sea sediments and may undergo degradation during transport, thus altering the original n-alkanes signature (CPIH > 30 to 2.04 ± 0.28) (Bray and Evans, 1961; Naafs et al., 2019).
It is important to note that there are certain differences in the organic matter sources in the surface sediments in the Ross Sea based on the TOC/TN ratio and n-alkane related parameters. The TOC/TN indicates the general characteristics of organic matter sources but lacks specificity regarding source identification (Mayer, 1994; Bianchi and Canuel, 2011). In contrast, although n-alkanes constitute a minor fraction of TOC, they are more stable and encompass a broader range of sources, thereby providing more detailed insights into the origins of organic matter. By combining bulk OC and n-alkanes, we can achieve a more comprehensive and nuanced understanding of the sources of organic matter in Antarctic sediments.
5.2 Changes in n-alkane sources since the LGM and implications for ice shelf retreat
5.2.1 Impacts of ice shelf retreat on sedimentary age
The sedimentation rate of core JB03 during the LGM, deglaciation and Holocene differed significantly from those of neighboring cores (Huang et al., 2016; Song et al., 2019; Zhao et al., 2017), suggesting that sedimentary environments are influenced by ice shelf retreat and display considerable spatial variability. The sedimentation rate in the 102 – 130 cm layer (27.1 – 27.3 ka BP, during the LGM) was extremely high at 100 cm/ka (Figure 2 and Supplementary Table S2), in contrast to the northern cores (e.g., 3 – 4 cm/ka for JB06 and ~26 cm/ka for RB16C) (Huang et al., 2016; Song et al., 2019). The Ross Ice Shelf was expanding during the LGM, with the northernmost position of the grounding line at 74°S, as determined from seismic and multibeam data analyses (Ship et al., 1999; Halberstadt et al., 2016) and grain-size sedimentary sequences (Anderson et al., 2014; Huang et al., 2016; Zhao et al., 2017). While Huang et al. (2016) suggested that the ice shelf did not reach the seafloor at JB06 (~74.5°S), the notably high sedimentation rate observed in this study implies that the more southerly JB03 (~75.8°S) may have experienced grounding events during the LGM, rapidly accumulating sediment of equivalent or older age from the surrounding area.
An extremely low sedimentation rate (0.45 cm/ka) was recorded during the last deglaciation period (72 – 78 cm, 21.0 – 11.9 ka BP), significantly lower than the neighboring cores (~15 cm/ka for JB06 and ~10 cm/ka for RB16C) during the same timeframe (Huang et al., 2016; Song et al., 2019). Given that this period was characterized by a predominantly sub-glacial sedimentary environment (McKay et al., 2012), the absence of a stratigraphic record between 72 – 78 cm could be attributed to ice sheet collapse scouring or interruptions in sedimentation due to ice sheet coverage.
During the early Holocene (11.9 – 8.2 ka BP), the sedimentation rate increased to 6.75 cm/ka, similar to rates observed in northern cores (e.g., ~5 cm/ka for JB06 and ~3 cm/ka for RB16C) (Huang et al., 2016; Song et al., 2019). Sedimentary phase sequences and foraminifera radiocarbon dating indicated that the Ross Ice Shelf retreated rapidly during 11 – 10 ka BP (McKay et al., 2008). Finocchiaro et al. (2005) reported the presence of a patchy diatom-rich soft mud layer dating to 9.5 – 9.4 ka BP in Cape Hallett Bay, suggesting early Holocene warming and open ocean conditions. Subsequently, sandy mud deposition during 8.0 – 7.8 ka BP indicated a rapid landward retreat of regional glaciers. Consequently, due to the ongoing retreat of the ice shelf, station JB03 transitioned from a sub-glacial sedimentary environment to a marine setting.
After 8.2 ka BP, the ice shelf continued its retreat towards Ross Island (McKay et al., 2016). During this period, the sedimentation rate was stable at 6.71 ± 0.39 cm/ka, comparable to rates observed in the northern cores, such as 7 cm/ka for JB06 and RB16C (Huang et al., 2016; Song et al., 2019). Ice core δ18O records suggested that the Ross Sea experienced its second warm period of the Holocene from 7 to 5 ka BP (Masson-Delmotte et al., 2000). Station JB03 displayed a seasonal sea ice period sedimentary characteristics.
5.2.2 Changes in TOC and n-alkane sources at different historical stages
Based on the TOC content, TOC/TN ratio, n-alkane characteristics and calculated indices, the sedimentary record of JB03 can be divided into three phases. Phase I extended from 78 to 130 cm (LGM period); Phase II ranged from 52 to 78 cm (the last deglaciation and 11.9 – 8.2 ka BP in the early Holocene period); and Phase III was found at depths shallower than 52 cm (8.2 – 0.6 ka BP during the Holocene period) (Figure 5). Significant variations in sedimentary environments and their associated TOC and n-alkane sources were observed across these phases in the Ross Sea.
During Phase I, TOC content was the lowest (0.74% ± 0.12%), while the TOC/TN ratio was the highest (13.63 ± 1.29). The n-alkane distribution was predominantly bimodal, with main carbon peaks at nC17 or nC19 and nC27 (Figure 6F), and exhibited the highest CPIH (1.78 ± 0.12) and TAR (0.83 ± 0.31), and lowest L/H (1.17 ± 0.37) (Figure 5), indicating a predominance of terrestrial OC inputs. This could be due to disturbed and redeposited sediments caused by ice-shelf grounding, potentially mixed with fragments of higher vascular plants from pre-glacial periods (e.g., Oligocene and Miocene) (Duncan et al., 2019), as discussed in section 5.2.1.
The TOC content of Phase II sediments (0.90% ± 0.30%) was slightly higher than that of Phase I, exhibiting a significant increasing trend in TOC content between 11.9 – 8.2 ka BP (Figure 5 red arrow). The TOC/TN ratio (9.09 ± 1.82) indicated a mixture of OC from phytoplankton (3 – 8) and higher plants (>12) (Figure 5). The n-alkane distribution was mainly bimodal, with main carbon peaks at nC18/nC25 and nC19/nC25, differing from Phase I (Figure 6E). The CPIH (1.46 ± 0.16) and TAR (0.62 ± 0.21) were slightly lower than those of Phase I (Figure 5). These results suggest a mixture of inputs from both marine and terrestrial sources (Anderson et al., 2014; Huang et al., 2016; Zhao et al., 2017). Overall, our findings align with historical data (see section 5.2.1), indicating a notable increase in marine-derived n-alkanes due to glacier retreat, rising temperatures, and enhanced productivity during the early Holocene. Additionally, there was an increase in terrestrial input from mosses, lichens and other land sources (Kvenvolden et al., 1987), alongside a decrease in the ancient organic matter proportions.
The sediments in Phase III exhibited the highest TOC content (1.56% ± 0.30%) and the lowest TOC/TN ratio (8.18 ± 0.51) compared to the other two phases (Figure 5). The n-alkanes in Phase III closely resembled those found in modern surface sediments, showing mainly a unimodal distribution with nC17, nC18 or nC19 as main carbon peaks (Figure 6D). Furthermore, the odd-carbon predominance of short chains was not obvious (CPIL = 0.99 ± 0.04), while the TAR (0.41 ± 0.32) was significantly lower compared to Phase I and Phase II (0.81 ± 0.33 and 0.55 ± 0.18, respectively). Conversely, and L/H (2.27 ± 1.07) was significantly higher than in Phase I and II (1.17 ± 0.37, 1.19 ± 0.50, respectively) (Figure 5). These findings suggest that the n-alkanes in the sediment are primarily derived from marine phytoplankton and bacteria after approximately 8 ka BP (Song et al., 2019; Xiu et al., 2017). As discussed in section 5.2.1, the ice shelves had receded to near Ross Island around 8 ka BP, establishing a seasonal sea-ice environment similar to present conditions, characterized by high productivity and a predominant contribution from marine sources.
6 Conclusion
The overall sorting of surface sediments in the Ross Sea was poor, indicating a low-energy and hydrodynamically stable sedimentary environment. TOC was mainly derived from upper ocean phytoplankton, with a distribution trend showing higher concentrations in the west and lower in the east. This variation was related to higher sedimentation rates and longer periods of primary productivity accumulation in the west. Significant regional differences in the sources of n-alkanes in modern surface sediments were identified, with the Western region mainly derived from phytoplankton and bacteria, the Southwest region from a mixture of phytoplankton and terrestrial mosses, and the Eastern region from a combination of phytoplankton, terrestrial soil/low-latitude higher plant leaf waxes. The n-alkane characteristics in the Western Ross Sea core were basically consistent with the history of ice shelf dynamics, showing a high terrestrial input signal before 21.0 ka BP during the ice shelf expansion. From 21.0 to 11.7 ka BP, while the ice shelf retreated, the JB03 site remained beneath the ice shelf, resulting in very low sedimentation rates. From 11.7 to 8.2 ka BP, as temperatures rose and glaciers continued to retreat, n-alkanes exhibited characteristics of mixed terrestrial and marine source inputs. Since 8.2 ka BP, as the glaciers retreated to Ross Island, marine-derived n-alkanes have dominated in the sediment. This study provides insights into the changes in organic matter properties resulting from the accelerated melting of the Antarctic ice shelf.
Data availability statement
The original contributions presented in the study are included in the article/Supplementary Material. Further inquiries can be directed to the corresponding authors.
Author contributions
DY: Data curation, Formal analysis, Investigation, Methodology, Writing – original draft, Writing – review & editing. WC: Data curation, Investigation, Methodology, Software, Writing – original draft, Writing – review & editing. WH: Data curation, Formal analysis, Methodology, Writing – original draft, Writing – review & editing. HZ: Conceptualization, Funding acquisition, Project administration, Resources, Supervision, Writing – review & editing. ZH: Data curation, Software, Writing – original draft. BL: Conceptualization, Validation, Writing – review & editing. JZ: Conceptualization, Funding acquisition, Project administration, Supervision, Writing – original draft, Writing – review & editing.
Funding
The author(s) declare financial support was received for the research, authorship, and/or publication of this article. This work was supported by the National Natural Science Foundation of China (Grant Nos. 42076243, 41976228 and 41976227), the National Key Research and Development Program of China (Grant No. 2022YFE0136500) and National Polar Special Program “Impact and Response of Antarctic Seas to Climate Change” (Grant Nos. IRASCC 01-01-02A and 02-02).
Acknowledgments
Appreciation goes to the personnel who participated in CHINARE-31 and -32 and the crew of R/V Xuelong for their hard work in collecting sediment samples. We would like to express our sincere thanks to the Polar Specimen Museum of the Polar Research Institute of China for providing sediment samples.
Conflict of interest
The authors declare that the research was conducted in the absence of any commercial or financial relationships that could be construed as a potential conflict of interest.
Publisher’s note
All claims expressed in this article are solely those of the authors and do not necessarily represent those of their affiliated organizations, or those of the publisher, the editors and the reviewers. Any product that may be evaluated in this article, or claim that may be made by its manufacturer, is not guaranteed or endorsed by the publisher.
Supplementary material
The Supplementary Material for this article can be found online at: https://www.frontiersin.org/articles/10.3389/fmars.2024.1474189/full#supplementary-material
Abbreviations
OC, organic carbon; TOC, total organic carbon; TN, total nitrogen; δ13C, δ15N, stable isotopes of carbon and nitrogen; Δ14C, radiocarbon isotope; L/H, low/high molecular-weight n-alkanes; CPI, carbon preference index; CPIL, CPI of short-chain (or low molecular-weight) n-alkanes; CPIH, CPI of long-chain (or high molecular-weight) n-alkanes; TAR, terrestrial/aquatic ratio; LGM, last glacial maximum; BP, before present; RSP, Ross Sea Polynya; MSP, McMurdo Sound Polynya; TNBP, Terra Nova Bay Polynya; MZ, mean particle size; σ, sorting coefficient; SK, skewness; KG, kurtosis; CHINARE, Chinese National Antarctic Research Expedition.
References
Anderson J. B., Conway H., Bart P. J., Witus A. E., Greenwood S. L., McKay R. M., et al. (2014). Ross Sea paleo-ice sheet drainage and deglacial history during and since the LGM. Quat. Sci. Rev. 100, 31–54. doi: 10.1016/j.quascirev.2013.08.020
Andrews J. T., Domack E. W., Cunningham W. L., Leventer A., Licht K. J., Timothy Jull A. J., et al. (1999). Problems and possible solutions concerning radiocarbon dating of surface marine sediments, Ross Sea, Antarctica. Quat. Res. 52, 206–216. doi: 10.1006/qres.1999.2047
Andrews J. T., LeMasurier W. (2021). Resolving the argument about volcanic bedrock under the West Antarctic Ice Sheet and implications for ice sheet stability and sea level change. Earth Planet. Sci. Lett. 568, 117035. doi: 10.1016/j.epsl.2021.117035
Arrigo K. R., Van Dijken G., Long M. (2008a). Coastal Southern Ocean: A strong anthropogenic CO2 sink. Geophys. Res. Lett. 35, L21602. doi: 10.1029/2008gl035624
Arrigo K. R., Van Dijken G. L., Bushinsky S. (2008b). Primary production in the Southern Ocean 1997-2006. J. Geophys. Res.-Oceans 113, C08004. doi: 10.1029/2007jc004551
Baas M., Pancost R., Geel B., Sinninghe-Damste J. (2000). A comparative study of lipids in Sphagnum species. Org. Geochem. 31, 535–541. doi: 10.1016/S0146-6380(00)00037-1
Bendle J., Kawamura K., Yamazaki K., Niwai T. (2007). Latitudinal distribution of terrestrial lipid biomarkers and n-alkane compound-specific stable carbon isotope ratios in the atmosphere over the western Pacific and Southern Ocean. Geochim. Cosmochim. Acta 71, 5934–5955. doi: 10.1016/j.gca.2007.09.029
Bianchi T., Canuel E. (2011). Chemical Biomarkers in Aquatic Ecosystems (Princeton, New Jersey: Princeton University Press), 396pp. doi: 10.1515/9781400839100
Bianchi T., Schreiner K., Smith R., Burdige D., Woodard S., Conley D. (2016). Redox effects on organic matter storage in coastal sediments during the holocene: A biomarker/proxy perspective. Annu. Rev. Earth Planet. Sci. 44, 295–319. doi: 10.1146/annurev-earth-060614-105417
Bingham E., Mcclymont E., Väliranta M., Mauquoy D., Roberts Z., Chambers F., et al. (2010). Conservative composition of n-alkane biomarkers in Sphagnum species: Implications for palaeoclimate reconstruction in ombrotrophic peat bogs. Org. Geochem. 41, 214–220. doi: 10.1016/j.orggeochem.2009.06.010
Blumer M., Guillard R. R. L., Chase T. (1971). Hydrocarbons of marine phytoplankton. Mar. Biol. 8, 183–189. doi: 10.1007/BF00355214
Bray E. E., Evans E. D. (1961). Distribution of n-paraffins as clue to recognision of source beds. Geochim. Cosmochim. Acta 22, 2–15. doi: 10.1016/0016-7037(61)90069-2
Burdige D. J. (2007). Preservation of organic matter in marine sediments: Controls, mechanisms, and an imbalance in sediment organic carbon budgets? Chem. Rev. 107, 467–485. doi: 10.1021/cr050347q
Chen W., Yu P., Han X., Zhao J., Pan J. (2019b). Contents and distribution of GDGTs in surface sediments of Ross Sea, Antarctic and their environmental significances (in Chinese with English abstract). J. Mar. Sci. 37, 30–39. doi: 10.3969/j.issn.1001-909X.201
Chen X. (2020). Carbon and hydrogen istope of n-alkyl lipids in lacustrine and ocean sediments from Ross Sea, Antarctica and paleoclimatic implications (in Chinese with English abstract) (Doctor, Hefei: University of Science and Technology of China).
Chen X., Liu X., Jia H., Jin J., Kong W., Huang Y. (2021). Inverse hydrogen isotope fractionation indicates heterotrophic microbial production of long-chain n-alkyl lipids in desolate Antarctic ponds. Geobiology 19, 394–404. doi: 10.1111/gbi.12441
Chen X., Liu X., Wei Y., Huang Y. (2019a). Production of long-chain n-alkyl lipids by heterotrophic microbes: New evidence from Antarctic lakes. Org. Geochem. 138, 103909. doi: 10.1016/j.orggeochem.2019.103909
Coffin R., Cifuentes L. A. (1993). Handbook of methods in aquatic microbial ecology. Eds. Kemp P. F., Sherr B. F., Sherr E. B., Cole J. J. (Boca Raton, Florida, USA: Lweis), 663–675.
Cranwell P. A., Eglinton G., Robinson N. (1987). Lipids of aquatic organisms as potential contributors to lacustrine sediments—II. Org. Geochem. 11, 513–527. doi: 10.1016/0146-6380(87)90007-6
Cui C., Tang Z., Rebesco M., De Santis L., Li Z., Wang X., et al. (2021). Sedimentary records of enhanced deep ventilation during the last deglaciation in the Ross Sea, Southern Ocean (in Chinese with English abstract). Quat. Sci. 41, 678–690. doi: 10.11928/j.issn.1001-7410.2021.03.05
Das S., Routh J., Roychoudhury A., Klump J. (2007). Elemental (C, N, H and P) and stable isotope (δ15N and δ13C) signatures in sediments from Zeekoevlei, South Africa: A record of human intervention in the lake. J. Paleolimnol. 39, 349–360. doi: 10.1007/s10933-007-9110-5
DeMaster D. J. (1992). Cycling and accumulation of biogenic silica and organic matter in high-latitude environments: the Ross Sea. Oceanography 5, 146–153. doi: 10.5670/oceanog.1992.03
DeMaster D. J., Ragueneau O., Nittrouer C. A. (1996). Preservation effciencies and accumulation rates for biogenic silica and organic C, N, and P in high-latitude sediments: The Ross Sea. J. Geophys. Res.-Oceans 101, 18501–18518. doi: 10.1029/96JC01634
Didyk B. M., Simoneit B. R. T., Brassell S. C., Eglinton G. (1978). Organic geochemical indicators of palaeoenvironmental conditions of sedimentation. Nature 272, 216–222. doi: 10.1038/272216a0
Dinniman M., Klinck J., Smith W. (2003). Cross-shelf exchange in a model of Ross Sea circulation and biogeochemistry. Deep Sea Res. II Top. Stud. Oceanogr. 50, 3103–3120. doi: 10.1016/j.dsr2.2003.07.011
Dittmar T., Stubbins A. (2014). “Dissolved organic matter in aquatic systems,” in Treatise on Geochemistry, 2nd ed., vol. 12 . Eds. Holland H. D., Turekian K. K. (Amsterdam, Netherlands: Elsevier), 125–156. doi: 10.1016/B978-0-08-095975-7.01010-X
Duncan B., Mckay R., Bendle J., Naish T., Inglis G. N., Moossen H., et al. (2019). Lipid biomarker distributions in Oligocene and Miocene sediments from the Ross Sea region, Antarctica: Implications for use of biomarker proxies in glacially influenced settings. Palaeogeogr. Palaeoclimatol. Palaeoecol. 516, 71–89. doi: 10.1016/j.palaeo.2018.11.028
Eglinton G., Calvin M. (1967). Chemical fossils. Sci. Am. 216, 32–43. doi: 10.1038/scientificamerican0167-32
Eglinton T., Eglinton G. (2008). Molecular proxies for paleoclimatology. Earth Planet. Sci. Lett. 275, 1–16. doi: 10.1016/j.epsl.2008.07.012
Eusterhues K., Rumpel C., Kleber M., Kögel-Knabner I. (2003). Stabilisation of soil organic matter by interactions with minerals as revealed by mineral dissolution and oxidative degradation. Org. Geochem. 34, 1591–1600. doi: 10.1016/j.orggeochem.2003.08.007
Fabiano M., Povero P., Danovaro R. (1993). Distribution and composition of particulate organic matter in the Ross Sea (Antarctica). Polar Biol. 13, 525–533. doi: 10.1007/BF00236394
Fan J., Wang R., Ding X., Wu L. (2021). Benthic foraminifera assemblages and their response to ice shelf changes in the Joides trough of the Ross Sea, Antarctica since the last glacial period (in Chinese with English abstract). Acta Microbiol. Sin. 38, 93–111. doi: 10.16087/j.cnki.1000-0674.2021.01.009
Faust J. C., Tessin A., Fisher B. J., Zindorf M., Papadaki S., Hendry K. R., et al. (2021). Millennial scale persistence of organic carbon bound to iron in Arctic marine sediments. Nat. Commun. 12, 275. doi: 10.1038/s41467-020-20550-0
Finocchiaro F., Langone L., Colizza E., Fontolan G., Giglio F., Tuzzi E. (2005). Record of the early Holocene warming in a laminated sediment core from Cape Hallett Bay (Northern Victoria Land, Antarctica). Glob. Planet. Change 45, 193–206. doi: 10.1016/j.gloplacha.2004.09.003
Folk R. L., Ward W. C. (1957). Brazos river bar: A study in the significance of grain size parameters. J. Sediment. Res. 27, 3–26. doi: 10.1306/74D70646-2B21-11D7-8648000102C1865D
Gal J.-K., Kim B., Joo H., Shim C., Lee B., Kim I.-N., et al. (2022). Spatial distribution and origin of organic matters in an Arctic fjord system based on lipid biomarkers (n-alkanes and sterols). Environ. Res. 205, 112469. doi: 10.1016/j.envres.2021.112469
Gales J., Rebesco M., Santis L. D., Bergamasco A., Colleoni F., Kim S., et al. (2021). Role of dense shelf water in the development of Antarctic submarine canyon morphology. Geomorphol. 372, 107453. doi: 10.1016/j.geomorph.2020.107453
Grimalt J., Albaigés J. (1987). Sources and occurrence of C12-C22 n-alkane distributions with even carbon-number preference in sedimentary environments. Geochim. Cosmochim. Acta 51, 1379–1384. doi: 10.1016/0016-7037(87)90322-X
Gustafsson O., Kruså M., Zencak Z., Sheesley R., Granat L., Engström J., et al. (2009). Brown clouds over south asia: biomass or fossil fuel combustion? Science 323, 495–498. doi: 10.1126/science.1164857
Ha S., Colizza E., Torricella F., Langone L., Giglio F., Kuhn G., et al. (2022). Glaciomarine sediment deposition on the continental slope and rise of the central Ross Sea since the Last Glacial Maximum. Mar. Geol. 445, 106752. doi: 10.1016/j.margeo.2022.106752
Halberstadt A. R. W., Simkins L. M., Greenwood S. L., Anderson J. B. (2016). Past ice-sheet behaviour: Retreat scenarios and changing controls in the Ross Sea, Antarctica. Cryosphere. 10, 1003–1020. doi: 10.5194/tc-10-1003-2016
Hanisch S., Ariztegui D., Püttmann W. (2003). The biomarker record of Lake Albano, central Italy - Implications for Holocene aquatic system response to environmental change. Org. Geochem. 34, 1223–1235. doi: 10.1016/S0146-6380(03)00118-9
Hillenbrand C.-D., Smith J. S., Kuhn G., Esper O., Gersonde R., Larter R. D., et al. (2010). Age assignment of a diatomaceous ooze deposited in the western Amundsen Sea Embayment after the Last Glacial Maximum. J. Quat. Sci. 25, 280–295. doi: 10.1002/jqs.1308
Huang M., Wang R., Xiao W., Wu L., Chen Z. (2016). Retreat process of ross ice shelf and hydrodynamic changes on northwestern Ross continental shelf since the last glacial (in Chinese with English abstract). Mar. Geol. Quat. Geol. 36, 97–108. doi: 10.16562/j.cnki.0256-1492.2016.05.010
Ikehara M., Kawamura K., Ohkouchi N., Murayama M., Nakamura T., Taira A. (2000). Variations of terrestrial input and marine productivity in the Southern Ocean (48°S) during the last two deglaciations. Paleoceanography 15, 170–180. doi: 10.1029/1999PA000425
Jaeschke A., Wengler M., Hefter J., Ronge T., Geibert W., Mollenhauer G., et al. (2017). A biomarker perspective on dust, productivity, and sea surface temperature in the Pacific sector of the Southern Ocean. Geochim. Cosmochim. Acta 204, 120–139. doi: 10.1016/j.gca.2017.01.045
Keil R., Mayer L. M. (2014). “Mineral matrices and organic matter,” in Treatise on Geochemistry, 2nd ed., vol. 12 . Eds. Holland H. D., Turekian K. K. (Amsterdam, Netherlands: Elsevier), 337–359. doi: 10.1016/B978-0-08-095975-7.01024-X
Kim J., La H. S., Kim J.-H., Jo N., Lee J., Kim B., et al. (2023). Spatio-temporal variations in organic carbon composition driven by two different major phytoplankton communities in the Ross Sea, Antarctica. Sci. Total Environ. 891, 164666. doi: 10.1016/j.scitotenv.2023.164666
Kvenvolden K. A., Rapp J. B., Golan-Bac M., Hostettler F. D. (1987). Multiple sources of alkanes in Quaternary oceanic sediment of Antarctica. Org. Geochem. 11, 291–302. doi: 10.1016/0146-6380(87)90040-4
Langone L., Frignani M., Labbrozzi L., Ravaioli M. (1998). Present-day biosiliceous sedimentation in the Northwestern Ross Sea, Antarctica. J. Mar. Syst. 17, 459–470. doi: 10.1016/S0924-7963(98)00058-X
LaRowe D. E., Arndt S., Bradley J. A., Estes E. R., Hoarfrost A., Lang S. Q., et al. (2020). The fate of organic carbon in marine sediments - New insights from recent data and analysis. Earth-Sci. Rev. 204, 103146. doi: 10.1016/j.earscirev.2020.103146
Lee S., Fuhrman J. (1987). Relationships between biovolume and biomass of naturally derived marine bacterioplankton. Appl. Environ. Microbiol. 53, 1298–1303. doi: 10.1128/AEM.53.6.1298-1303.1987
Li L., Wang H., Wang P. (2008). Molecular Organic Geochemical Record of Paleoenvironmental Changes of Core 17937 in Northern South China Sea Since 40 ka (in Chinese with English abstract). Earth Sci.-J. China Univ. Geosci. 33, 793–799.
Licht K. J., Hemming S. R. (2017). Analysis of Antarctic glacigenic sediment provenance through geochemical and petrologic applications. Quat. Sci. Rev. 164, 1–24. doi: 10.1016/j.quascirev.2017.03.009
Lin Y., Moreno C., Marchetti A., Ducklow H., Schofield O., Delage E., et al. (2021). Decline in plankton diversity and carbon flux with reduced sea ice extent along the Western Antarctic Peninsula. Nat. Commun. 12, 4948. doi: 10.1038/s41467-021-25235-w
Liu J., An Z. (2020). Leaf wax n-alkane carbon isotope values vary among major terrestrial plant groups: Different responses to precipitation amount and temperature and implication for paleoenvironmental reconstruction. Earth-Sci. Rev. 202, 103081. doi: 10.1016/j.earscirev.2020.103081
Lomstein B. A., Langerhuus A. T., D'hondt S., Jorgensen B. B., Spivack A. J. (2012). Endospore abundance, microbial growth and necromass turnover in deep sub-seafloor sediment. Nature 484, 101–104. doi: 10.1038/nature10905
Masson-Delmotte V., Vimeux F., Jouzel J., Morgan V., Delmotte M., Ciais P., et al. (2000). Holocene climate variability in Antarctica based on 11 ice-core isotopic records. Quat. Res. 54, 348–358. doi: 10.1006/qres.2000.2172
Matson P., Martz T., Hofmann G. (2011). High-frequency observations of pH under Antarctic sea ice in the southern Ross Sea. Antarct. Sci. 1, 607–613. doi: 10.1017/S0954102011000551
Matsumoto G. I., Akiyama M., Watanuki K., Torii T. (1990a). Unusual distributions of long-chain n-alkanes and n-alkenes in Antarctic soil. Org. Geochem. 15, 403–412. doi: 10.1016/0146-6380(90)90167-X
Matsumoto G. I., Hirai A., Hirota K., Watanuki K. (1990b). Organic geochemistry of the McMurdo Dry Valleys soil, Antarctica. Org. Geochem. 16, 781–791. doi: 10.1016/0146-6380(90)90117-I
Matsumoto G. I., Honda E., Sonoda K., Yamamoto S., Takemura T. (2010). Geochemical features and sources of hydrocarbons and fatty acids in soils from the McMurdo Dry Valleys in the Antarctic. Polar Sci. 4, 187–196. doi: 10.1016/j.polar.2010.04.001
Mayer L. M. (1994). Surface area control of organic carbon accumulation in continental shelf sediments. Geochim. Cosmochim. Acta 58, 1271–1284. doi: 10.1016/0016-7037(94)90381-6
McKay R., Dunbar G., Naish T., Barrett P., Carter L., Harper M. (2008). Retreat history of the Ross Ice Sheet (Shelf) since the Last Glacial Maximum from deep-basin sediment cores around Ross Island. Palaeogeogr. Palaeoclimatol. Palaeoecol. 260, 245–261. doi: 10.1016/j.palaeo.2007.08.015
McKay R., Golledge N. R., Maas S., Naish T., Levy R., Dunbar G., et al. (2016). Antarctic marine ice-sheet retreat in the Ross Sea during the early Holocene. Geology 44, 7–10. doi: 10.1130/G37315.1
McKay R., Naish T., Powell R., Barrett P., Scherer R., Talarico F., et al. (2012). Pleistocene variability of Antarctic Ice Sheet extent in the Ross Embayment. Quat. Sci. Rev. 34, 93–112. doi: 10.1016/j.quascirev.2011.12.012
Meyers P. (1994). Preservation of elemental and isotopic source identification of sedimentary organic matter. Chem. Geol. 144, 289–302. doi: 10.1016/0009-2541(94)90059-0
Meyers P. (1997). Organic geochemical proxies of paleoceanographic, paleolimnologic, and paleoclimatic processes. Org. Geochem. 27, 213–250. doi: 10.1016/S0146-6380(97)00049-1
Meyers P. A. (2003). Applications of organic geochemistry to paleolimnological reconstructions: a summary of examples from the Laurentian Great Lakes. Org. Geochem. 34, 261–289. doi: 10.1016/S0146-6380(02)00168-7
Naafs B. D. A., Inglis G., Blewett J., Mcclymont E., Lauretano V., Xie S., et al. (2019). The potential of biomarker proxies to trace climate, vegetation, and biogeochemical processes in peat: A review. Glob. Planet. Change 179, 57–79. doi: 10.1016/j.gloplacha.2019.05.006
Naughten K. A., Holland P. R., De Rydt J. (2023). Unavoidable future increase in West Antarctic ice-shelf melting over the twenty-first century. Nat. Clim. Change. 13, 1222–1228. doi: 10.1038/s41558-023-01818-x
Orr J., Fabry V., Aumont O., Bopp L., Doney S., Feely R., et al. (2005). Anthropogenic ocean acidification over the twenty-first century and its impact on calcifying organisms. Nature 437, 681–686. doi: 10.1038/nature04095
Orsi A. H., Whitworth T., Nowlin W. D. (1995). On the meridional extent and fronts of the antarctic circumpolar current. Deep Sea Res. I Oceanogr. Res. Pap. 42, 641–673. doi: 10.1016/0967-0637(95)00021-W
Parish T. R., Cassano J. J., Seefeldt M. W. (2006). Characteristics of the Ross Ice Shelf air stream as depicted Antarctic Mesoscale Prediction System simulations. J. Geophys. Res. 111, D12109. doi: 10.1029/2005JD006185
Pillsbury R., Jacobs S. (1985). Preliminary observations from long-term current meter moorings near The Ross Ice Shelf, Antarctica. Antarct. Res. Ser. 43, 87–107. doi: 10.1029/AR043p0087
Pudsey C., Murray J., Appleby P., Evans J. (2006). Ice shelf history from petrographic and foraminiferal evidence, Northeast Antarctic Peninsula. Quat. Sci. Rev. 25, 2357–2379. doi: 10.1016/j.quascirev.2006.01.029
Redfield A. C., Ketchum B. H., Richards F. A. (1963). The influence of organisms on the composition of sea-water. Sea 2, 26–77.
Sampei Y., Matsumoto E. (2001). C/N ratios in a sediment core from Nakaumi Lagoon, southwest Japan - Usefulness as an organic source indicator. Geochem. J. 35, 189–205. doi: 10.2343/geochemj.35.189
Schubert C. J., Nielsen S. B. (2000). Effects of decarbonation treatments on δ13C values in marine sediments. Mar. Chem. 72, 55–59. doi: 10.1016/s0304-4203(00)00066-9
Shao H., He J., Wu L., Wei L. (2022). Elemental and Sr–Nd isotopic compositions of surface clay-size sediments in the front end of major ice shelves around Antarctica and indications for provenance. Deep Sea Res. II Top. Stud. Oceanogr. 195, 105011. doi: 10.1016/j.dsr2.2021.105011
Ship S., Anderson J., Domack E. (1999). Late Pleistocene-Holocene retreat of the West Antarctic Ice-Sheet system in the Ross Sea: Part 1 - Geophysical results. Geol. Soc Am. Bull. 111, 1486–1516. doi: 10.1130/0016-7606(1999)111<1486:LPHROT>2.3.CO;2
Smith W. (2022). Primary productivity measurements in the Ross Sea, Antarctica: a regional synthesis. Earth Syst. Sci. Data 14, 2737–2747. doi: 10.5194/essd-14-2737-2022
Smith R. W., Bianchi T. S., Allison M., Savage C., Galy V. (2015). High rates of organic carbon burial in fjord sediments globally. Nat. Geosci. 8, 450–453. doi: 10.1038/ngeo2421
Smith W., Kaufman D. (2018). Climatological temporal and spatial distributions of nutrients and particulate matter in the ross sea. Prog. Oceanogr. 168, 182–195. doi: 10.1016/j.pocean.2018.10.003
Smith W. O. J., Sedwick P. N., Arrigo K. R., Ainley D. G., Orsi A. H. (2012). The ross sea in a sea of change. Oceanography 25, 90–103. doi: 10.5670/oceanog.2012.80
Song L., Han X., Li J., Gao S., Liu G., Long P. (2019). Western Ross Sea sedimentary environment reconstruction since the Last Glacial Maximum based on organic carbon and biomarker analyses (in Chinese with English abstract). Haiyang Xuebao 41, 52–64. doi: 10.39698/j.issn.0253-4193.2019.09.005
Tamura T., Ohshima K. I., Nihashi S. (2008). Mapping of sea ice production for Antarctic coastal polynyas. Geophys. Res. Lett. 35, L07606. doi: 10.1029/2007GL032903
Tao S. Q., Li Y. H., Tang Z., Ye X., Sun H., Gao Z. Y., et al. (2022). Composition of organic materials and the control factors of suspended particulates in the surface water of the Ross Sea-Amundsen Sea in marginal sea of the southwestern Antarctic in austral summer 2019-2020 (in Chinese with English abstract). Mar. Geol. Quat. Geol. 42, 24–38. doi: 10.16562/j.cnki.0256-1492.2022022101
Ternois Y., Kawamura K., Keigwin L., Ohkouchi N., Nakatsuka T. (2001). A biomarker approach for assessing marine and terrigenous inputs to the sediments of Sea of Okhotsk for the last 27,000 years. Geochim. Cosmochim. Acta 65, 791–802. doi: 10.1016/S0016-7037(00)00598-6
The IMBIE Team (2018). Mass balance of the antarctic ice sheet from 1992 to 2017. Nature 558, 219–222. doi: 10.1038/s41586-018-0179-y
Trinh R., Ducklow H., Steinberg D., Fraser W. (2023). Krill body size drives particulate organic carbon export in West Antarctica. Nature 618, 526–530. doi: 10.1038/s41586-023-06041-4
Venkatesan M. (1988). Organic geochemistry of marine sediments in Antarctic region: Marine lipids in McMurdo Sound. Org. Geochem. 12, 13–27. doi: 10.1016/0146-6380(88)90270-7
Volkman J., Barrett S., Blackburn S., Mansour M., Sikes E., Gelin F. (1998). Microalgal biomarkers: A review of recent research developments. Org. Geochem. 29, 1163–1179. doi: 10.1016/S0146-6380(98)00062-X
Wakeham S., Mcnichol A. (2014). Transfer of organic carbon through marine water columns to sediments - Insights from stable and radiocarbon isotopes of lipid biomarkers. Biogeosciences 11, 6895–6914. doi: 10.5194/bg-11-6895-2014
Wang H., Chen Z., Wang K., Liu H., Tang Z., Huang Y. (2016). Characteristics of heavy minerals and grain size of surface sediments on the continental shelf of Prydz Bay: implications for sediment provenance. Antarct. Sci. 28, 103–114. doi: 10.1017/s0954102015000498
Wang Y., Huang Y., Tian J., Li C., Yu K., Zhang M., et al. (2021). A sediment record of terrestrial organic matter inputs to Dongting Lake and its environmental significance from 1855 to 2019. Ecol. Indic. 130, 108090. doi: 10.1016/j.ecolind.2021.108090
Whitworth T., Orsi A. H. (2006). Antarctic Bottom Water production and export by tides in the Ross Sea. Geophys. Res. Lett. 331, L12609. doi: 10.1029/2006GL026357
Wu L., Li L., Wang R., Shao H., Chen Y., Lin Z., et al. (2024). Grain-size, coarse fraction lithology and clay mineral compositions of surface sediments from Ross Sea, Antarctica: implications for their provenance and delivery mode. Front. Mar. Sci. 10. doi: 10.3389/fmars.2023.1324391
Wu C., Wang G., Li J., Li J., Cao C., Ge S., et al. (2020). The characteristics of atmospheric brown carbon in Xi'an, inland China: sources, size distributions and optical properties. Atmos. Chem. Phys. 20, 2017–2030. doi: 10.5194/acp-20-2017-2020
Xiu C., Huo S., Zhao M., Zhang X., Xing J., Xu M. (2017). GeochemicaI characteristics and source of organic carbon and nitrogen in the coIumn sediments from the Ross Sea, Antarctica (in Chinese with English abstract). Mar. Geol. Quat. Geol. 37, 83–90. doi: 10.16562/j.cnki.0256-1492.2017070201
Xu Q., Yang L., Gao Y., Sun L., Xie Z. (2021). 6,000-year reconstruction of modified circumpolar deep water intrusion and its effects on sea ice and penguin in the ross sea. Geophys. Res. Lett. 48, e2021GL094545. doi: 10.1029/2021GL094545
Yang G., Atkinson A., Pakhomov E., Hill S., Racault M. F. (2022). Massive circumpolar biomass of Southern Ocean zooplankton: Implications for food web structure, carbon export, and marine spatial planning. Limnol. Oceanogr. 67, 1–15. doi: 10.1002/lno.12219
Zhang M., Liu X., Xu F., Li A., Gu Y., Chang X., et al. (2023). Organic carbon deposition on the inner shelf of the East China sea constrained by sea level and climatic changes since the last deglaciation. J. Ocean Univ. China 22, 1300–1312. doi: 10.1007/s11802-023-5476-x
Zhao R., Chen Z., Liu H., Tang Z., Huang Y., Li Y., et al. (2017). Sedimentary record and paleoceanographic implications of the core on the continental shelf off the Ross Sea since 15 ka (in Chinese with English abstract). Haiyang Xuebao 39, 78–88. doi: 10.3969/j.issn.0253-4193.2017.05.008
Zhao M., Sun H., Liu Z., Qian B., Chen B., Yang M., et al. (2022). Organic carbon source tracing and the BCP effect in the Yangtze River and the Yellow River: Insights from hydrochemistry, carbon isotope, and lipid biomarker analyses. Sci. Total Environ. 812, 152429. doi: 10.1016/j.scitotenv.2021.152429
Zhao B., Zhang Y., Huang X., Qiu R., Zhang Z., Meyers P. (2018). Comparison of n -alkane molecular, carbon and hydrogen isotope compositions of different types of plants in the Dajiuhu peatland, central China. Org. Geochem. 124, 1–11. doi: 10.1016/j.orggeochem.2018.07.008
Keywords: Ross Sea, marine sediments, n-alkanes, organic matter, environment change
Citation: Yang D, Chen W, Huang W, Zhang H, Han Z, Lu B and Zhao J (2024) Spatial and historical patterns of sedimentary organic matter sources and environmental changes in the Ross Sea, Antarctic: implication from bulk and n-alkane proxies. Front. Mar. Sci. 11:1474189. doi: 10.3389/fmars.2024.1474189
Received: 01 August 2024; Accepted: 17 September 2024;
Published: 07 October 2024.
Edited by:
Khan M. G. Mostofa, Tianjin University, ChinaReviewed by:
Rui Bao, Ocean University of China, ChinaShuting Liu, Kean University, United States
Xiting Liu, Ocean University of China, China
Copyright © 2024 Yang, Chen, Huang, Zhang, Han, Lu and Zhao. This is an open-access article distributed under the terms of the Creative Commons Attribution License (CC BY). The use, distribution or reproduction in other forums is permitted, provided the original author(s) and the copyright owner(s) are credited and that the original publication in this journal is cited, in accordance with accepted academic practice. No use, distribution or reproduction is permitted which does not comply with these terms.
*Correspondence: Haisheng Zhang, emhhbmdzb2FAc2lvLm9yZy5jbg==; Jun Zhao, anpoYW9Ac2lvLm9yZy5jbg==
†These authors have contributed equally to this work