 Yanchu Zhao1
 Chaofeng Wang2*
 Xiaoyu Wang3Weicheng Wang2Tiancheng Zhang2Jianwu He1Wenhui Shi1Yafeng Shi1Zihang Hu1
 Xushen Zhou1
- 1Center of Eco-environmental Monitoring and Scientific Research, Administration of Ecology and Environment of Haihe River Basin and Beihai Sea Area, Ministry of Ecology and Environment of People’s Republic of China, Tianjin, China
- 2State Key Laboratory of Mariculture Breeding, Key Laboratory of Marine Biotechnology of Fujian Province, Institute of Oceanology, College of Marine Sciences, Fujian Agriculture and Forestry University, Fuzhou, China
- 3Frontiers Science Center for Deep Ocean Multispheres and Earth System, Key Laboratory of Physical Oceanography, Ocean University of China, Qingdao, China
Plankton play an indispensable role in the biogeochemical processes of marine ecosystem. However, unraveling the intricate interactions among biodiversity, trophic linkages, and biotic-abiotic interplay between phytoplankton-zooplankton remains a significant challenge. Here, we conducted field studies in the neritic area of the Bohai Sea during autumn 2023 and spring 2024 to explore seasonal variations of both phytoplankton and zooplankton through microscope. Our analysis revealed a sharp decline in trophic interactions across phytoplankton and zooplankton, with an abundance ratio in autumn 2023 being 5.5 times higher than in spring 2024. Additionally, dominant plankton species (Y ≥ 0.02) exhibited obvious differences between the two seasons, with higher species diversity observed in autumn. Moreover, each dominant zooplankton species had distinct preferred food items in both seasons, with Rhizosolenia setigera being favored by Noctiluca scintillans and Acartia pacifica. Furthermore, a multivariate biota-environment analysis indicated that each dominant plankton species had unique correlation with specific environmental parameters, highlighting how plankton can fully exploit external environmental conditions to survive in seasonal variations. Ultimately, our findings emphasize significant seasonal dynamics and provide a solid foundation for assessing the potential impacts of environmental changes on plankton in coastal marine realm.
Introduction
Compared to terrestrial ecosystems, oceans exhibit highly complicated environmental conditions over temporal scales, making them particularly vulnerable to both variable currents and intense anthropogenic disturbances, especially in the temperate sea for which experience four distinct seasons (Zhang et al., 2024). These fluctuating environmental conditions can significantly influence the structure of plankton communities and the associated biotic-abiotic interactions (Chapin III et al., 1997; Murphy et al., 2020; Anderson et al., 2021; Benedetti et al., 2021; Heneghan et al., 2023; Chust et al., 2024). For instance, the prolonged summer periods in the Arctic Ocean, driven by the global warming, have already shifted plankton communities toward ecosystems dominated by smaller species (e.g., Daufresne et al., 2009; Verberk et al., 2021; Wang et al., 2024a). Therein, the plankton community, encompassing phytoplankton and zooplankton, is deeply constrained by alien environment, especially for distinct seasonal marine areas.
In the marine realm, plankton form the foundation of the food web, showcasing immense species diversity and unique genetic variations that provide essential ecological functions and services (De Vargas et al., 2015; Cordier et al., 2022; Omstedt, 2024). As highlighted previously, phytoplankton play a crucial role by taking up CO2 and releasing O2 through photosynthesis, supporting heterotrophic organisms, while zooplankton serve as the basis for higher trophic levels, such as fish, through predator-prey relationships (Blanchard et al., 2017; Eddy et al., 2021; Baricevic et al., 2024). Plankton are irreplaceable in nutrient cycling and energy flow processes within marine ecosystems (Yi et al., 2024). Albeit a myriad of prevailing studies emphasizing ecological importance of plankton biodiversity and biogeography in disentangling marine biogeochemical cycles, substantial researches tends to focus separately on the ecological roles of phytoplankton and zooplankton (e.g., Oziel et al., 2020; Wang et al., 2020; Darnis et al., 2022; Segaran et al., 2023; Tagliabue et al., 2023). To date, there is a lack of comprehensive representations of trophic linkages between phytoplankton and zooplankton based on data-driven statistical analyses from field surveys.
Regarding biotic-abiotic interplay, a prevailing viewpoint suggested that physiological constraints dictate the range of suitable environmental conditions for each plankton species (Chust et al., 2024). Over recent decades, escalating global climate change has imposed significant impacts on marine ecosystems, challenging holopelagic species to develop relevant adaptive strategies (Stabeno et al., 2012; Yasumiishi et al., 2020; Carvalho et al., 2021; Atkinson et al., 2024). For example, warming and acidification can directly affect metabolic processes, leading to changes in plankton physiology and behavior, such as growth, body size, reproduction, and survival (McFeeters and Frost, 2011; Weydmann et al., 2012; Cripps et al., 2015; Garzke et al., 2015; Murphy et al., 2020; Wang et al., 2023a, 2023b). In this sense, albeit continuous attempts to explore the environment-plankton interaction for uncovering the ecological importance of various outer parameters (temperature, salinity, pH, dissolved oxygen, nutrient, etc.) on the plankton physiological condition (Serreze et al., 2009; Screen and Simmonds, 2010; Mandal et al., 2024; Noh et al., 2024), our understanding of their environmental affinities in seasonal temperate coastal seas remains insufficient.
Hence, focusing on the diversity of eukaryotic plankton species, trophic linkages, and biotic-abiotic interactions in a finer scale of the neritic seas across different seasons could enhance our understanding of plankton responses to complex seasonal environmental changes. The Bohai Sea, also known as Bohai Gulf, is the innermost gulf of the Yellow Sea along the coast of Northeast and North China, characterized by distinct seasonal variations, making it an ideal location for studying plankton responses to seasonal environmental shifts. Here, we hypothesize that plankton, including both phytoplankton and zooplankton, will exhibit significant seasonal community structure variations driven by differing environmental factors. Through synthesizing observational seasonal plankton data and employing available methodologies, the objective of this study is to: 1) disclose variations in biodiversity; 2) uncover trophic linkages between phytoplankton and zooplankton; and 3) assess biotic-abiotic interplay. Ultimately, our findings will provide a crucial baseline for evaluating the dynamics and functional roles of both phytoplankton and zooplankton in future biogeochemical cycles in coastal seas.
Materials and methods
Field sampling and analysis
Plankton samples, including both phytoplankton and zooplankton, were collected in an inner bay of the Bohai Sea (Figure 1) aboard the fishing boat “Jintangyu02066” on November 14, 2023 (autumn), and April 17, 2024 (spring), respectively. The offshore distances of all stations range from 2.34 Km (station 7) to 15.39 Km (station 4). The seafloor of all stations located at neritic area of the Bohai Sea were shallower than 5.0 m. Phytoplankton samples were gathered using a standard net III (diameter 37.0 cm, mesh size 76 μm), trawled from a depth of 0.5 m off the bottom to the surface at each site, and preserved in acid Lugol’s solution (1.5% final concentration). Zooplankton samples were collected using a standard net II (diameter 31.6 cm, mesh size 160 μm), also trawled from bottom to surface. After each tow, zooplankton specimens were fixed in a formaldehyde solution (2% final concentration) for subsequent analyses. Collectively, a total of 48 samples were collected and preserved in darkness at 4°C. In the laboratory, both phytoplankton and zooplankton samples were identified to the lowest taxonomic level using a binocular dissecting microscope (Olympus SZX16), referencing Guo (2004); Sun et al. (2015); Wang and Song (2017), and Zhang et al. (2019).
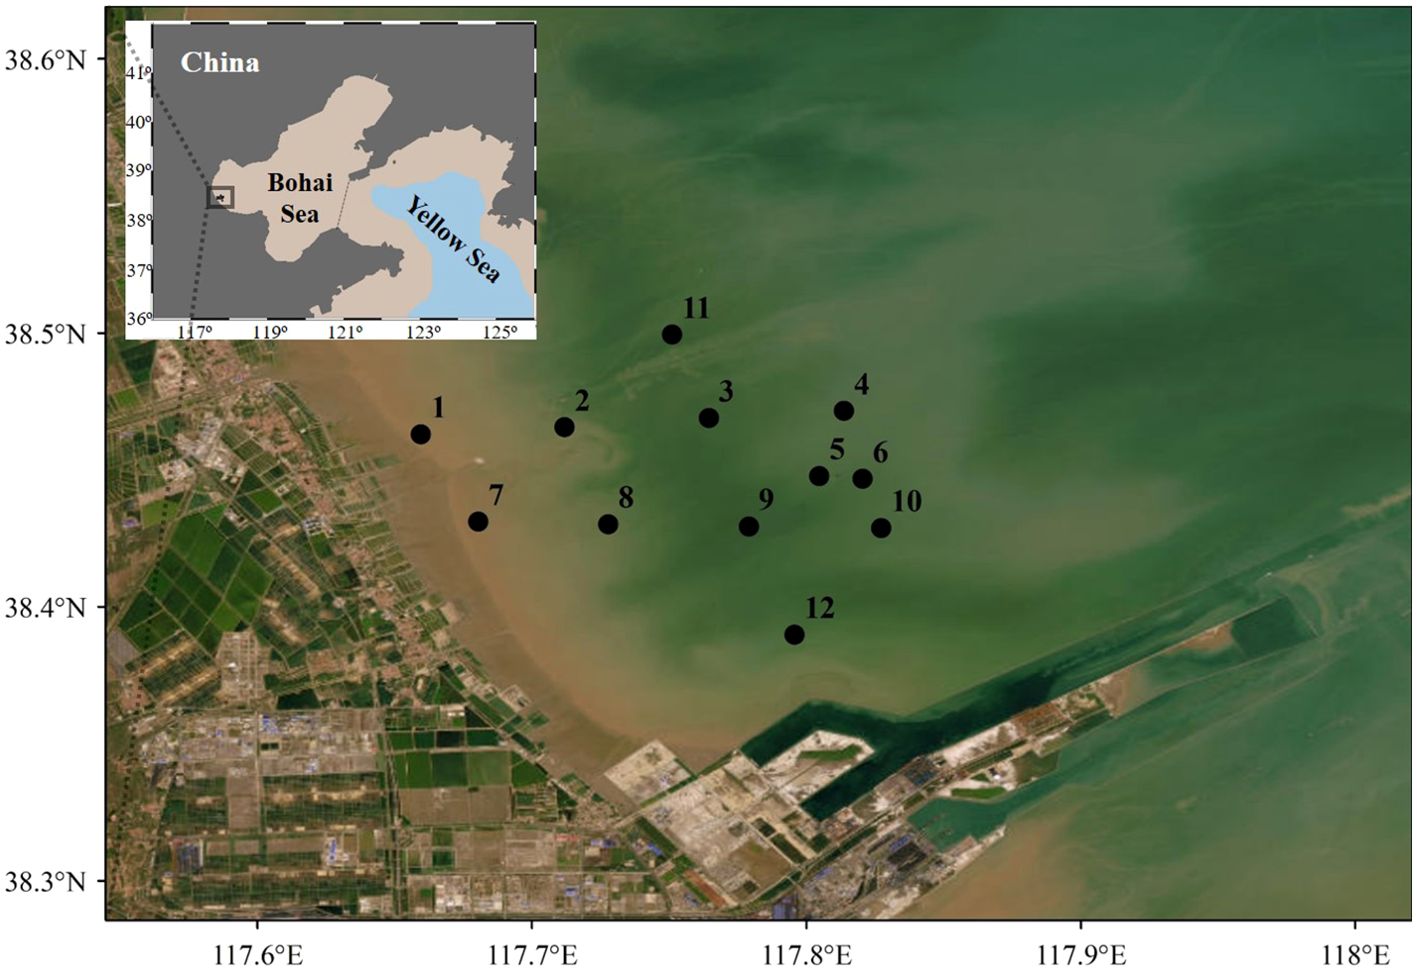
Figure 1. Survey stations in the neritic area of the Bohai Sea at both autumn 2023 and spring 2024.
Seawater temperature (°C) and salinity were measured using a WTW Cond 3210 SET 1 portable water quality analyzer (Xylem, Munich, Germany). Chlorophyll a (Chl a) concentration was determined by filtering 1 L of seawater through a Whatman GF/F glass fiber filter and stored at -20°C. Plankton retained on the filter was extracted in 90% (vv−1) acetone, and fluorescence was measured following the JGOFS protocol (Knap et al., 1996) using a Turner Trilogy fluorometer Model 10 (Turner Designs, US). A PHSJ-3F pH analyzer was used for the pH measurement. For dissolved oxygen (DO), samples were collected in an iodine flask, treated with alkaline potassium iodide and manganese sulfate, and titrated with a standard sodium thiosulfate solution. Additionally, 100 mL water samples for nutrient analysis (ammonium-NH4+, nitrate-NO3−, nitrite-NO2− and phosphate-PO43−) were filtered through a Whatman GF/F glass fiber membrane (0.7 μm), fixed with chloroform, and stored at -20°C. Nutrient concentrations were analyzed using a SEAL QuAAtro nutrient analyzer (Germany) (Ma et al., 2019, 2023). Zinc ions (Zn2+) were measured by inductively coupled plasma mass spectrometry, with concentrations determined using an atomic absorption spectrophotometer (SpectrAA FS220, Australia).
Data processing
The dominance index (Y) of species in plankton (including phytoplankton or zooplankton) was calculated using the following formula (Xu and Chen, 1989):
where ni is the number of individuals of species i in all samples, fiis the occurrence frequency of species i in all samples and N is the total number of all taxa. Species with Y ≥ 0.02 represented as the dominant species in plankton assemblage. Furthermore, all stations located at neritic area of the Bohai Sea with seafloor shallower than 5.0 m, thus we treat all environmental variables obtained from surface layer (1 m) can represent whole water column in our results for environment-plankton analysis. Moreover, the average value of each parameter was represented as mean ± SD in the following text.
Distributional data, including sampling maps, phytoplankton, zooplankton, and environmental variables, were visualized using ODV (Ocean Data View, Version 4.7), Surfer (Version 13.0), Grapher (Version 12.0), and OriginPro 2021 (Version 9.6). In addition, the Biota-Environment analysis was conducted based on Spearman’s correlation between log-transformed abiotic parameters and square root-transformed abundance data (t-test), utilizing both PRIMER (Version 5.0) and OriginPro 2021 (Version 9.6). Furthermore, the slope of the phytoplankton-zooplankton (ΔK) was carried out to quantize their ecological interaction.
Results
Seasonal environmental features, plankton abundance and trophic interaction
Most environmental parameters, except for NO2− and PO43−, exhibited distinct seasonal variations in the neritic area of the Bohai Sea (Figure 2). In spring 2024, average values for temperature (16.6 ± 1.0°C), pH (8.1 ± 0.1) and NO3− (0.2 ± 0.1 mg/L) were higher by 7.3°C, 0.2, and 0.1 mg/L, respectively, compared to autumn 2023. Additionally, Chl a concentrations were significantly higher at stations 1−5 in spring 2024 than in autumn 2023, while they were nearly equal at other stations (Figure 2). Furthermore, salinity (average 28.4 ± 0.2), DO (average 10.2 ± 0.2 mg/L), NH4+ (average 0.1 ± 0.0 mg/L), and Zn2+ (average 17.8 ± 7.3 μg/L) were lower in most stations during spring 2024 compared to autumn 2023, where values were 27.9 ± 0.2, 8.0 ± 0.2 mg/L, 0.0 ± 0.0 mg/L, and 9.6 ± 4.5 μg/L, respectively (Figure 2).
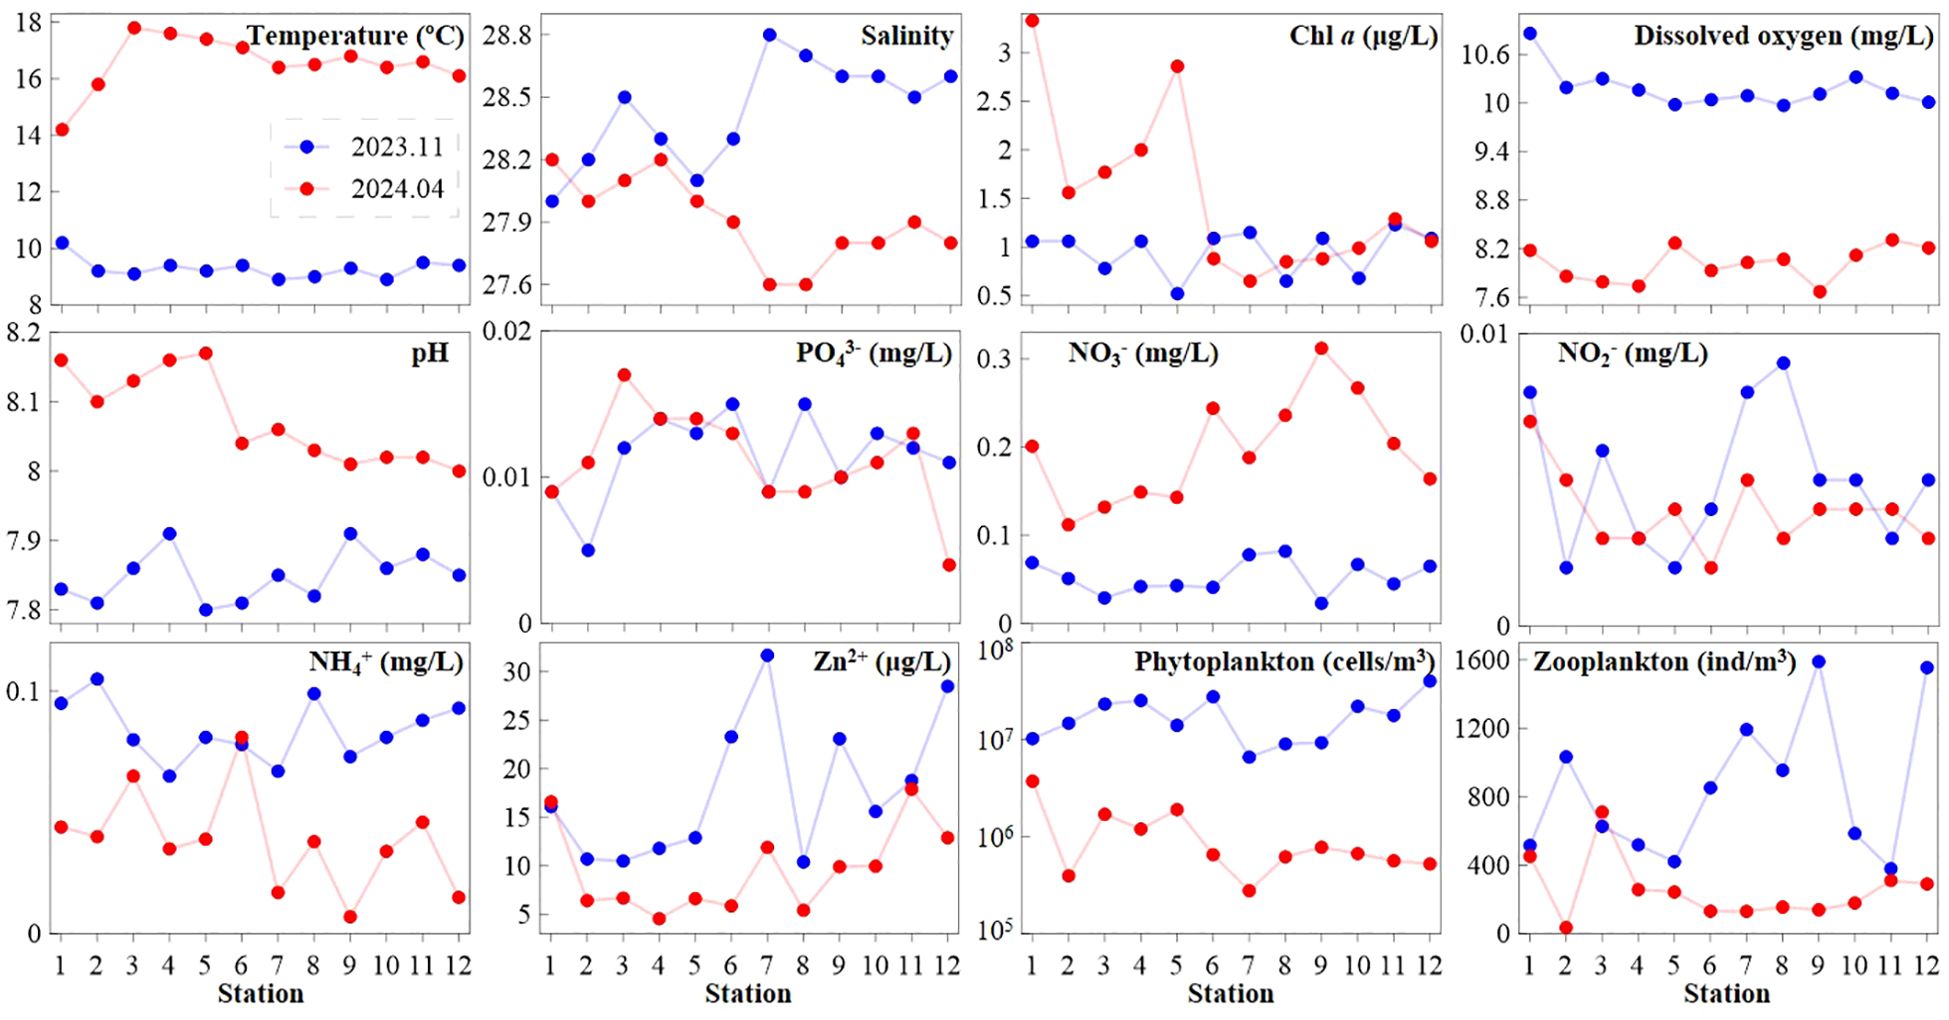
Figure 2. Seasonal variations in environmental variables and plankton (including phytoplankton and zooplankton) total abundance.
Total phytoplankton abundance at each station ranged from 6.6 to 40.2 × 10⁶ cells/m3 (average 18.4 ± 9.8 × 10⁶ cells/m3) in autumn 2023, compared to 0.3–3.0 × 10⁶ cells/m3 (average 1.0 ± 0.8 × 10⁶ cells/m3) in spring 2024, indicating an average value 18.4 times higher in autumn. Similarly, zooplankton showed higher abundance in autumn 2023, with average value (852.1 ± 421.1 ind/m3) being 3.4 folds higher than that in spring 2024 (253.4 ± 180.5 ind/m3) (Figure 2). The trend of increased plankton abundance in autumn 2023 coincided with variations in salinity, dissolved oxygen, NH4+, and Zn²+ (Figure 2). In terms of trophic interactions, average abundance ratio of phytoplankton: zooplankton was 2.2× 10⁴: 1 and 0.4× 10⁴: 1 in autumn 2023 and spring 2024, respectively (Figure 3). Additionally, the phytoplankton-zooplankton slope in autumn 2023 (ΔK = -9.96) was steeper than in spring 2024 (ΔK = -8.27) (Figure 3).
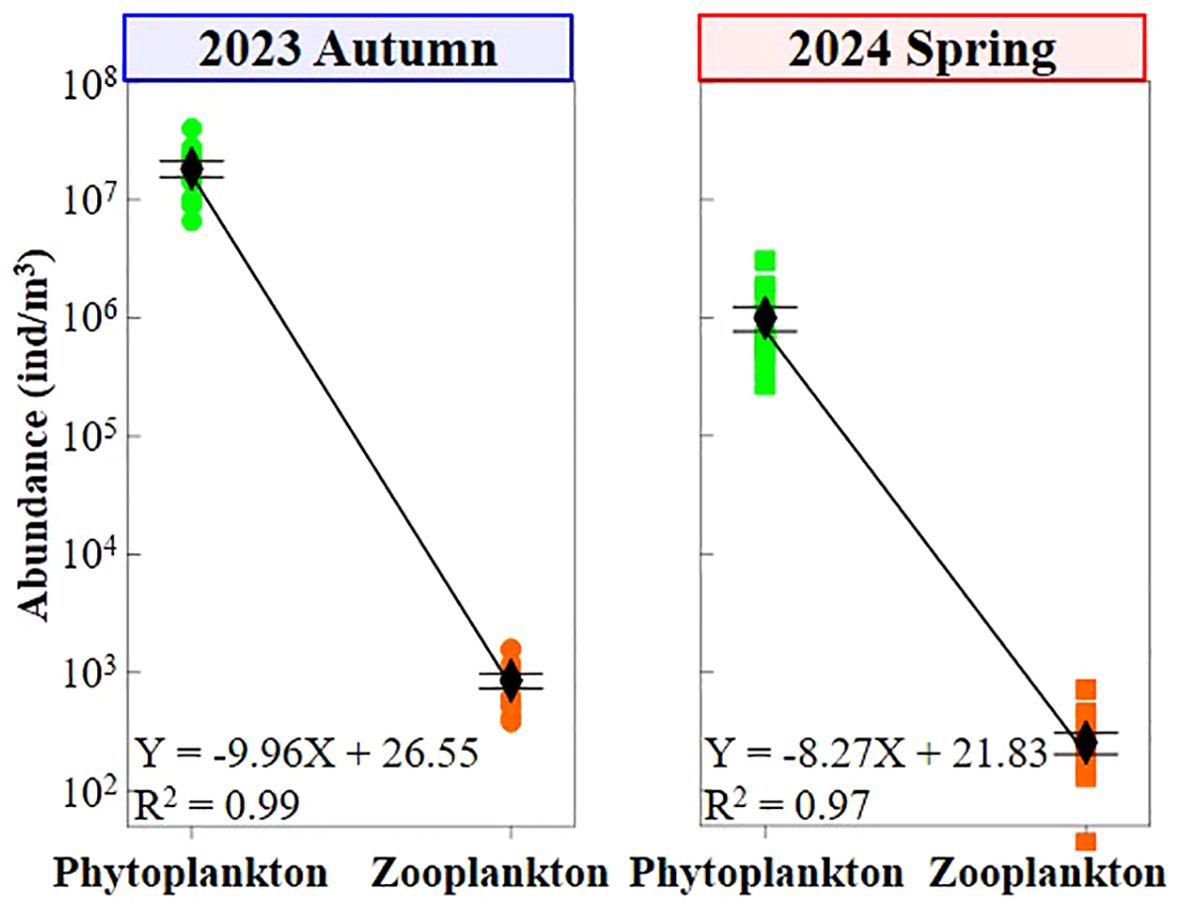
Figure 3. Variations in both abundance ratio and trophic linkage between phytoplankton and zooplankton at different seasons.
Notable seasonal variations for dominant plankton composition
Overall, a total of 64 phytoplankton species (32 genera) from 3 phyla, and 26 zooplankton species (20 genera) from 7 phyla were recorded in the neritic area of the Bohai Sea during autumn 2023 and spring 2024 (Tables 1, 2). Among them, phytoplankton species richness was higher in autumn 2023 (57 species) compared to spring 2024 (33 species) (Table 1), while zooplankton showed little variation between the two seasons (Table 2). Besides, in autumn 2023, there were 49 species in the phylum Bacillariophyta (86.0%), 1 species in Chrysophyta (1.8%), and 7 species in Pyrrophyta (12.2%), whereas spring 2024 featured only Bacillariophyta species (Table 2). Based on the dominance index (Y ≥ 0.02), phytoplankton species and 7 zooplankton species were identified in both seasons (Figure 4; Tables 1, 2), with 9 phytoplankton species noted in autumn 2023 and 4 phytoplankton species in spring 2024 (Table 1). For zooplankton, 6 species were dominant species in autumn 2023 and 5 in spring 2024, respectively (Table 2).
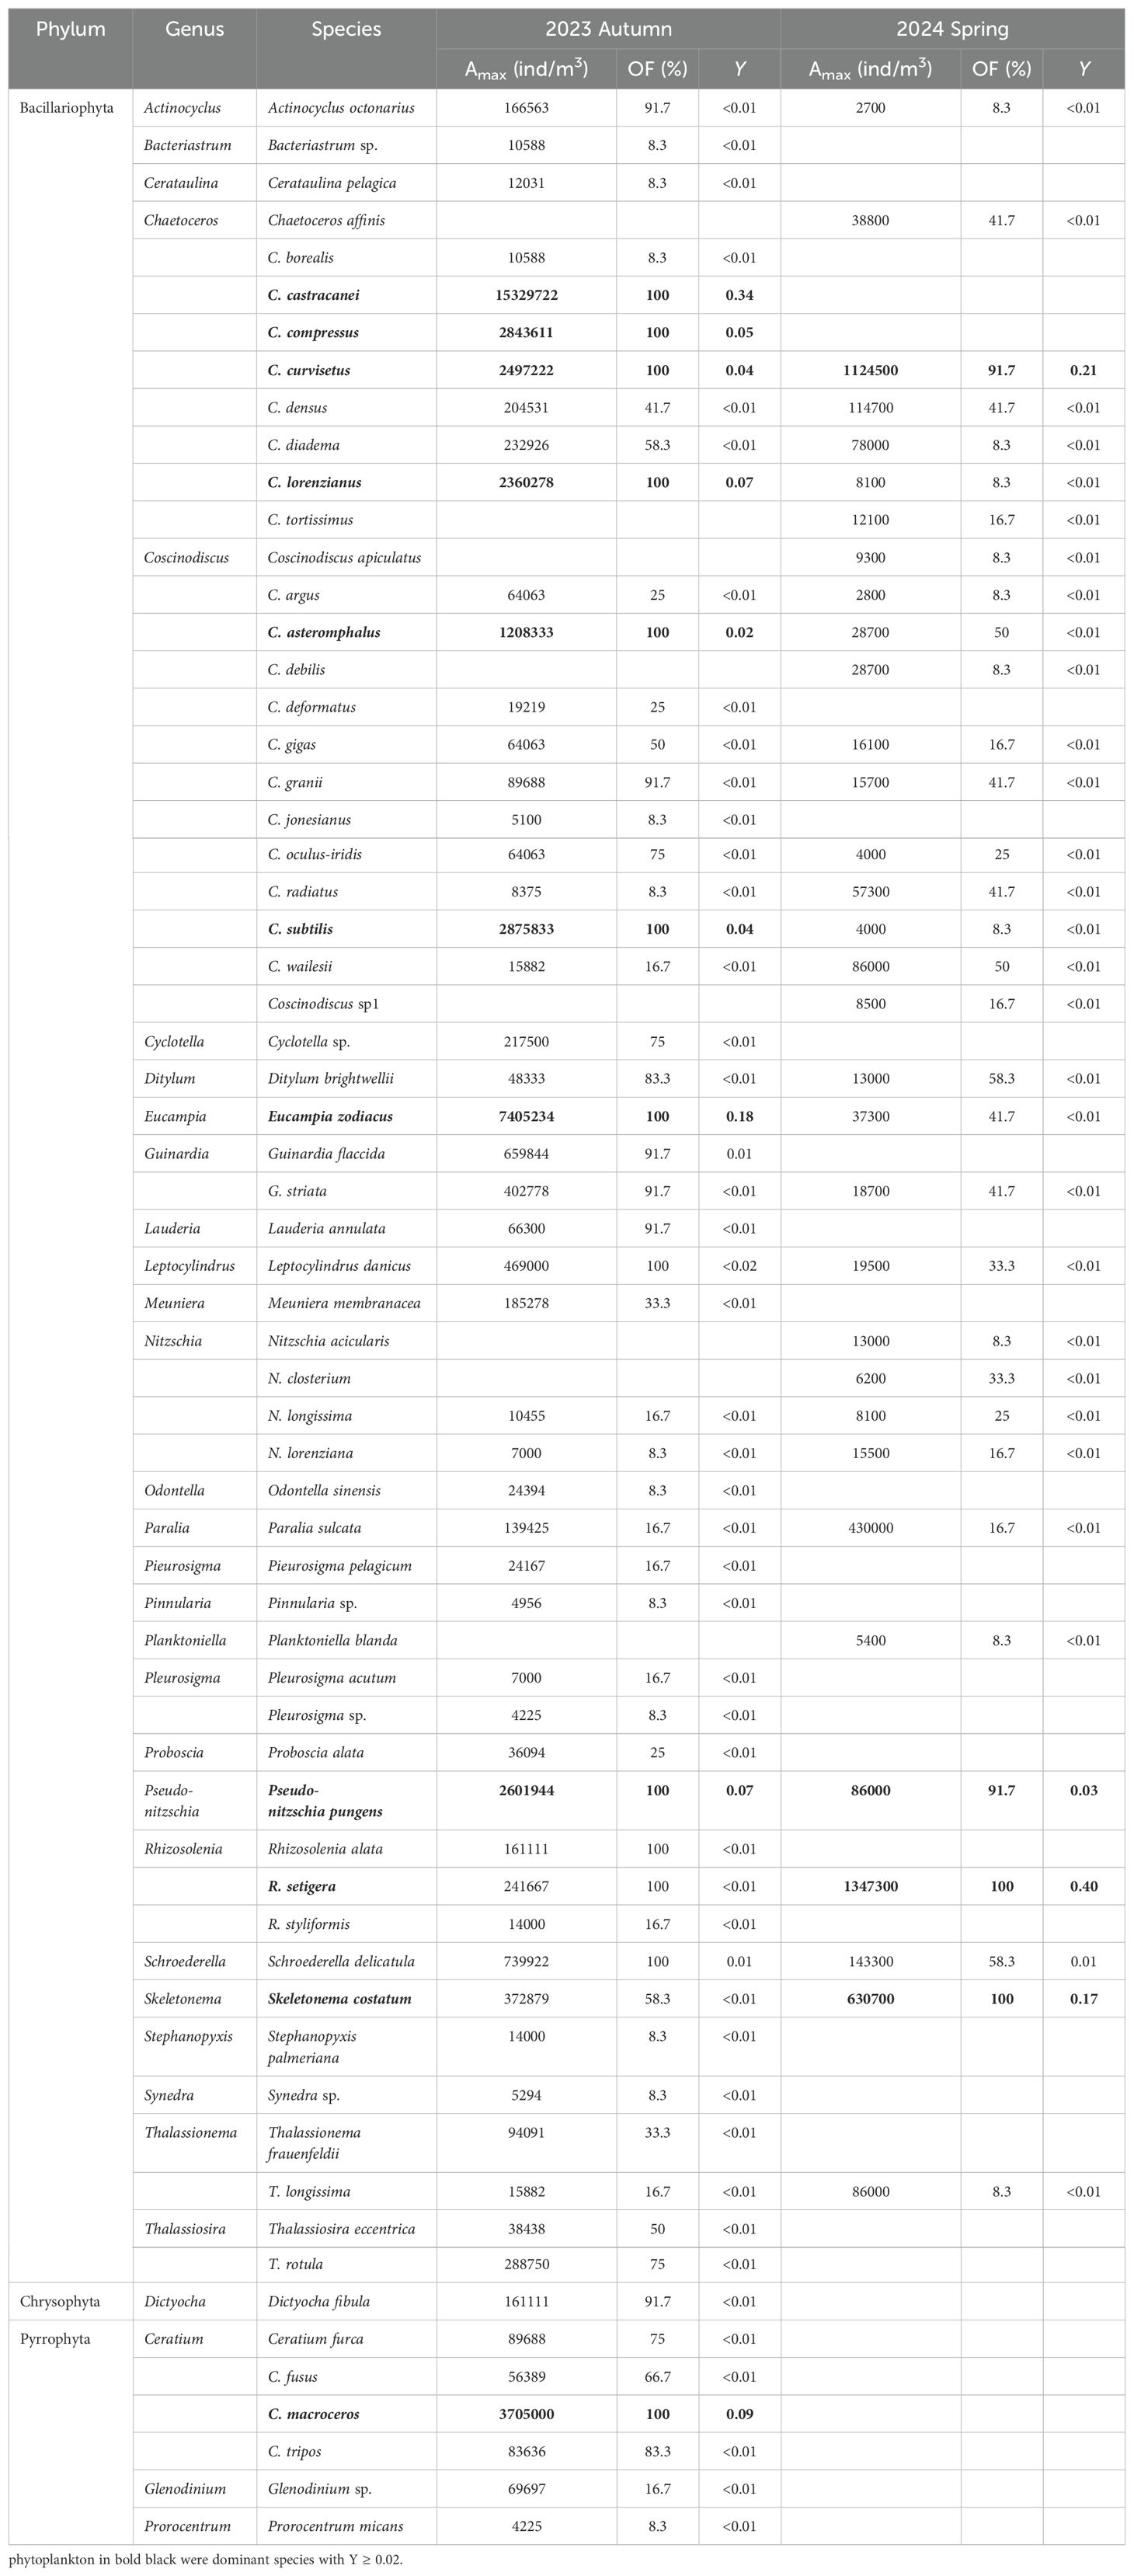
Table 1. List of phytoplankton composition, maximum abundance (Amax), occurrence frequency (OF) and its dominance index (Y) in study area at both autumn 2023 and spring 2024.
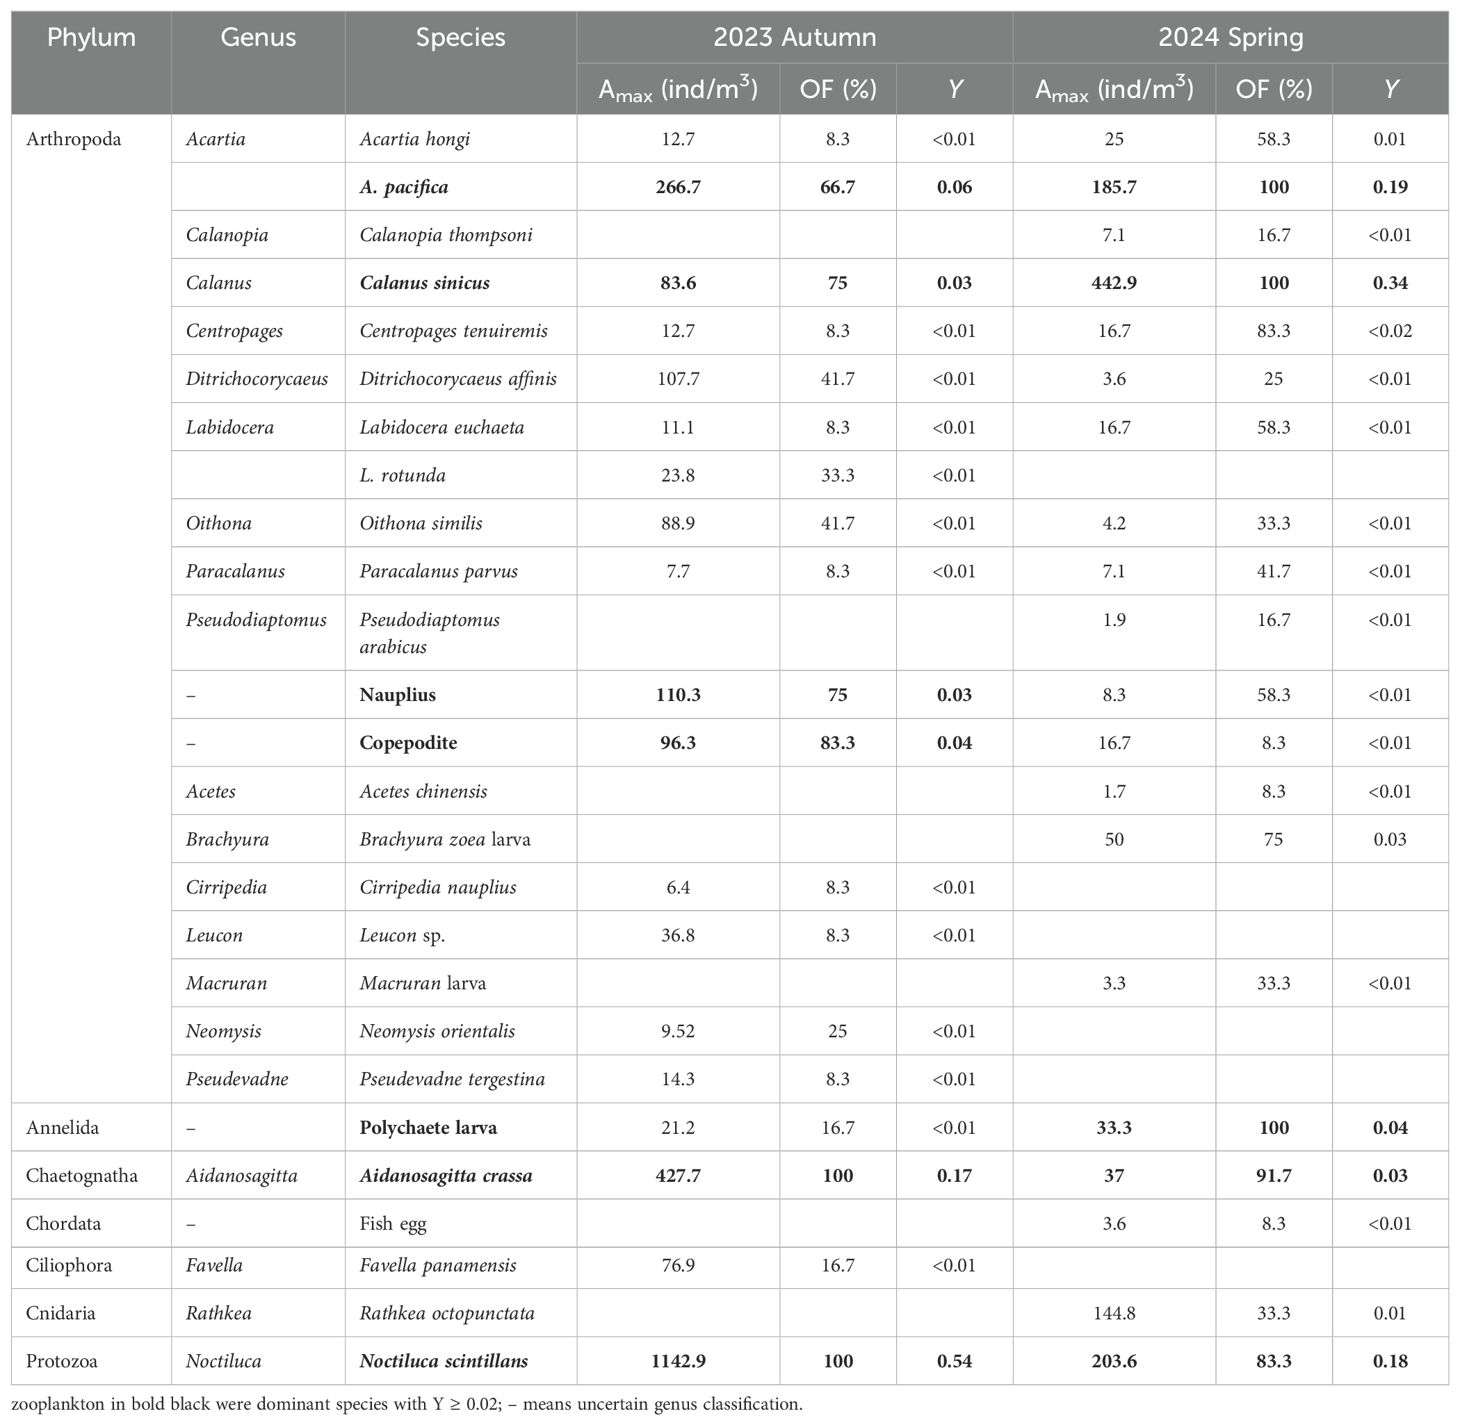
Table 2. List of zooplankton species composition, maximum abundance (Amax), occurrence frequency (OF) and its dominance index (Y) in study area at both autumn 2023 and spring 2024.
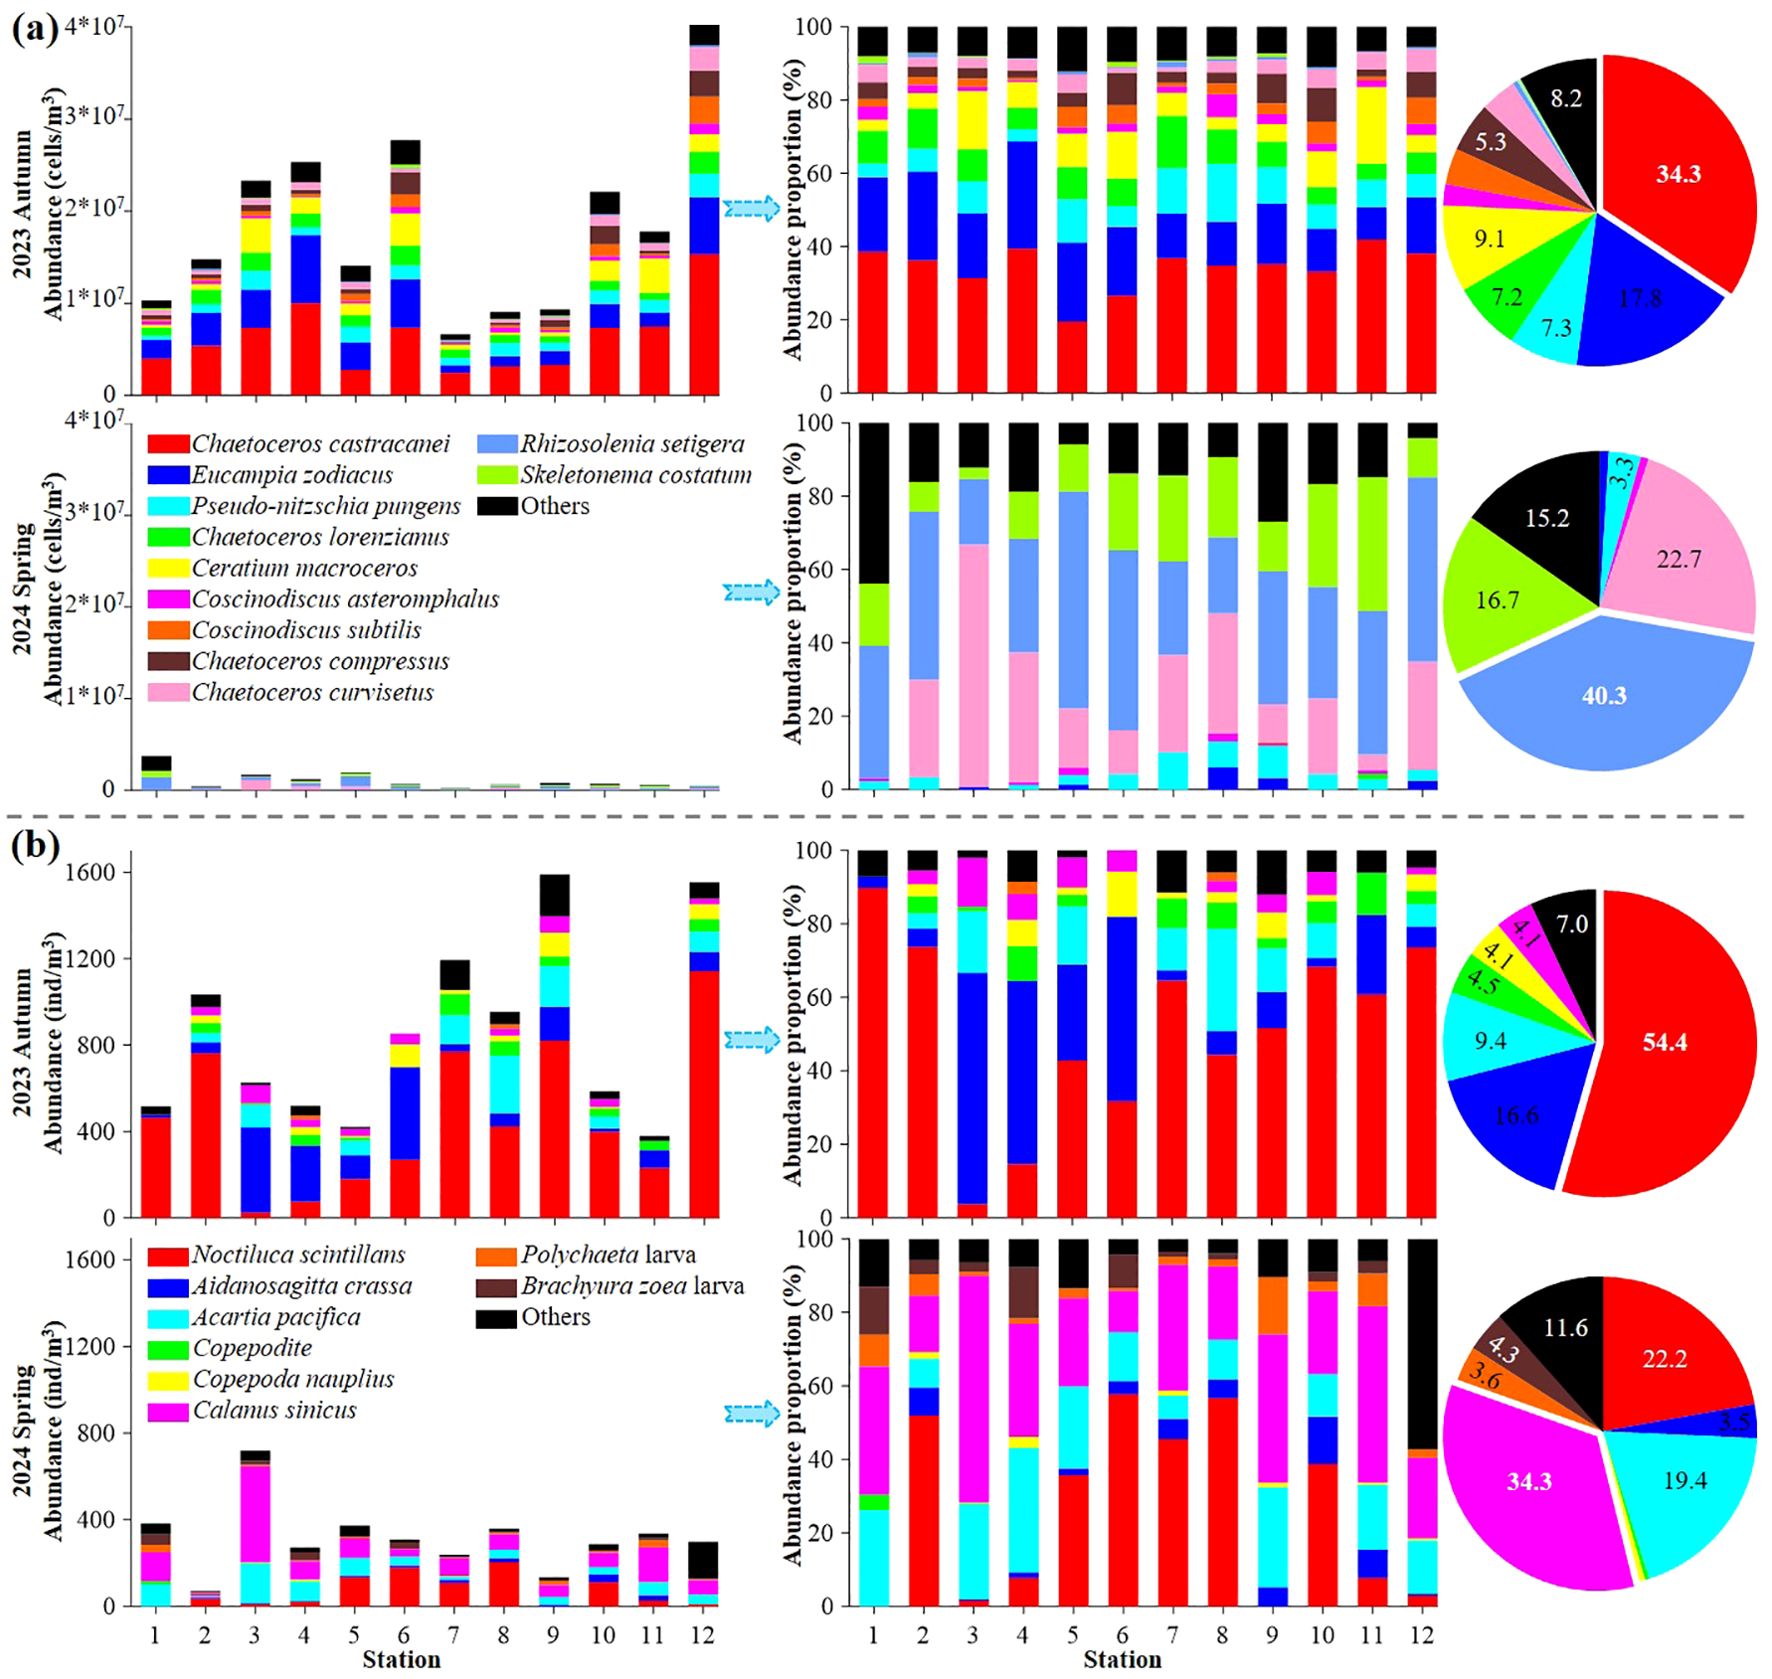
Figure 4. Seasonal variations in both abundance and abundance proportion of dominant phytoplankton (A) and zooplankton (B) species. Each color indicated one dominant phytoplankton or zooplankton species.
Dominant species of both phytoplankton and zooplankton exhibited clear seasonal variation (Figure 4; Tables 1, 2). Among the targeted co-occurring phytoplankton, only Chaetoceros curvisetus and Pseudo-nitzschia pungens were dominant in both seasons. In autumn 2023, dominant species included Eucampia zodiacus (Y = 0.18), C. lorenzianus (Y = 0.07), Coscinodiscus subtilis (Y = 0.04) and C. asteromphalus (Y = 0.02), while Rhizosolenia setigera (Y = 0.40) and Skeletonema costatum (Y = 0.17) were dominant species at spring 2024 (Figure 4; Table 1). For zooplankton, four species (Acartia pacifica, Calanus sinicus, Aidanosagitta crassa, and Noctiluca scintillans) were identified in both seasons (Table 2). Copepodite (Y = 0.04) and Nauplius (Y = 0.03) were the dominant species in autumn 2023, whereas Polychaete larva (Y = 0.04) was the dominant taxon in spring 2024 (Figure 4; Table 1).
Additionally, the abundance proportions (AP) of all dominant phytoplankton were ≥ 87.8% (average 91.6 ± 1.9%) in autumn 2023 and ≥ 56.2% (average 83.6 ± 10.5%) in spring 2024, respectively. Similarly, dominant zooplankton species exhibited AP values of ≥ 87.9% (average 94.0 ± 3.6%) and ≥ 42.8% (average 88.3 ± 14.7%) during these seasons (Figure 4). In autumn 2023, the top three dominant phytoplankton species were C. castracanei (AP = 34.3%), E. zodiacus (AP = 17.8%) and Ceratium macroceros (AP = 9.1%). In contrast, those species shift to R. setigena (AP = 40.3%), C. curvisetus (AP = 22.7%) and S. costatum (AP = 16.7%) in spring 2024 (Figure 4A). Similarly, the dominant zooplankton species in autumn 2023 were Noctiluca scintillans (AP = 54.4%) and A. crassa (AP = 16.6%), which changed to C. sinicus (AP = 34.3%) and N. scintillans (AP = 22.2%) in spring 2024 (Figure 4B. Overall, compared to phytoplankton, zooplankton exhibited less variation in dominant species across seasons, indicating a stronger community stability (Figure 4; Tables 1, 2).
Seasonal dynamics in both interspecific and trophic level relationships
Dominant phytoplankton and zooplankton species showed varying correlations in both interspecific and trophic level relationships during autumn 2023 and spring 2024 (Figure 5). In terms of interspecific relationships, most dominant phytoplankton species displayed significant positive correlations, indicating mutually beneficial coexistence, except for S. costatum-C. curvisetus, which exhibited a significant negative correlation, indicating competitive interactions in autumn 2023 (Figure 5A). In spring 2024, significant positive correlations were observed among C. asteromphalus-P. pungens, C. curvisetus-E. zoodiacus, S. costatum- P. pungens/R. setigena/C. asteromphalus, suggesting mutually beneficial coexistence (Figure 5B). Targeted zooplankton, only A. crassa-C. sinicus showed a significant positive correlation, indicating mutual coexistence in autumn 2023 (Figure 5A). However, in spring 2024, the interspecific relationships among C. sinicus/Brachyura zoea larva-A. pacifica, A. crassa-N. scintillans, Polychaeta larva-C. sinicus were mutually beneficial, all exhibiting significant positive correlations. Conversely, the relationship between A. crassa-A. pacifica was competitive, showing a significant negative correlation (Figure 5B).
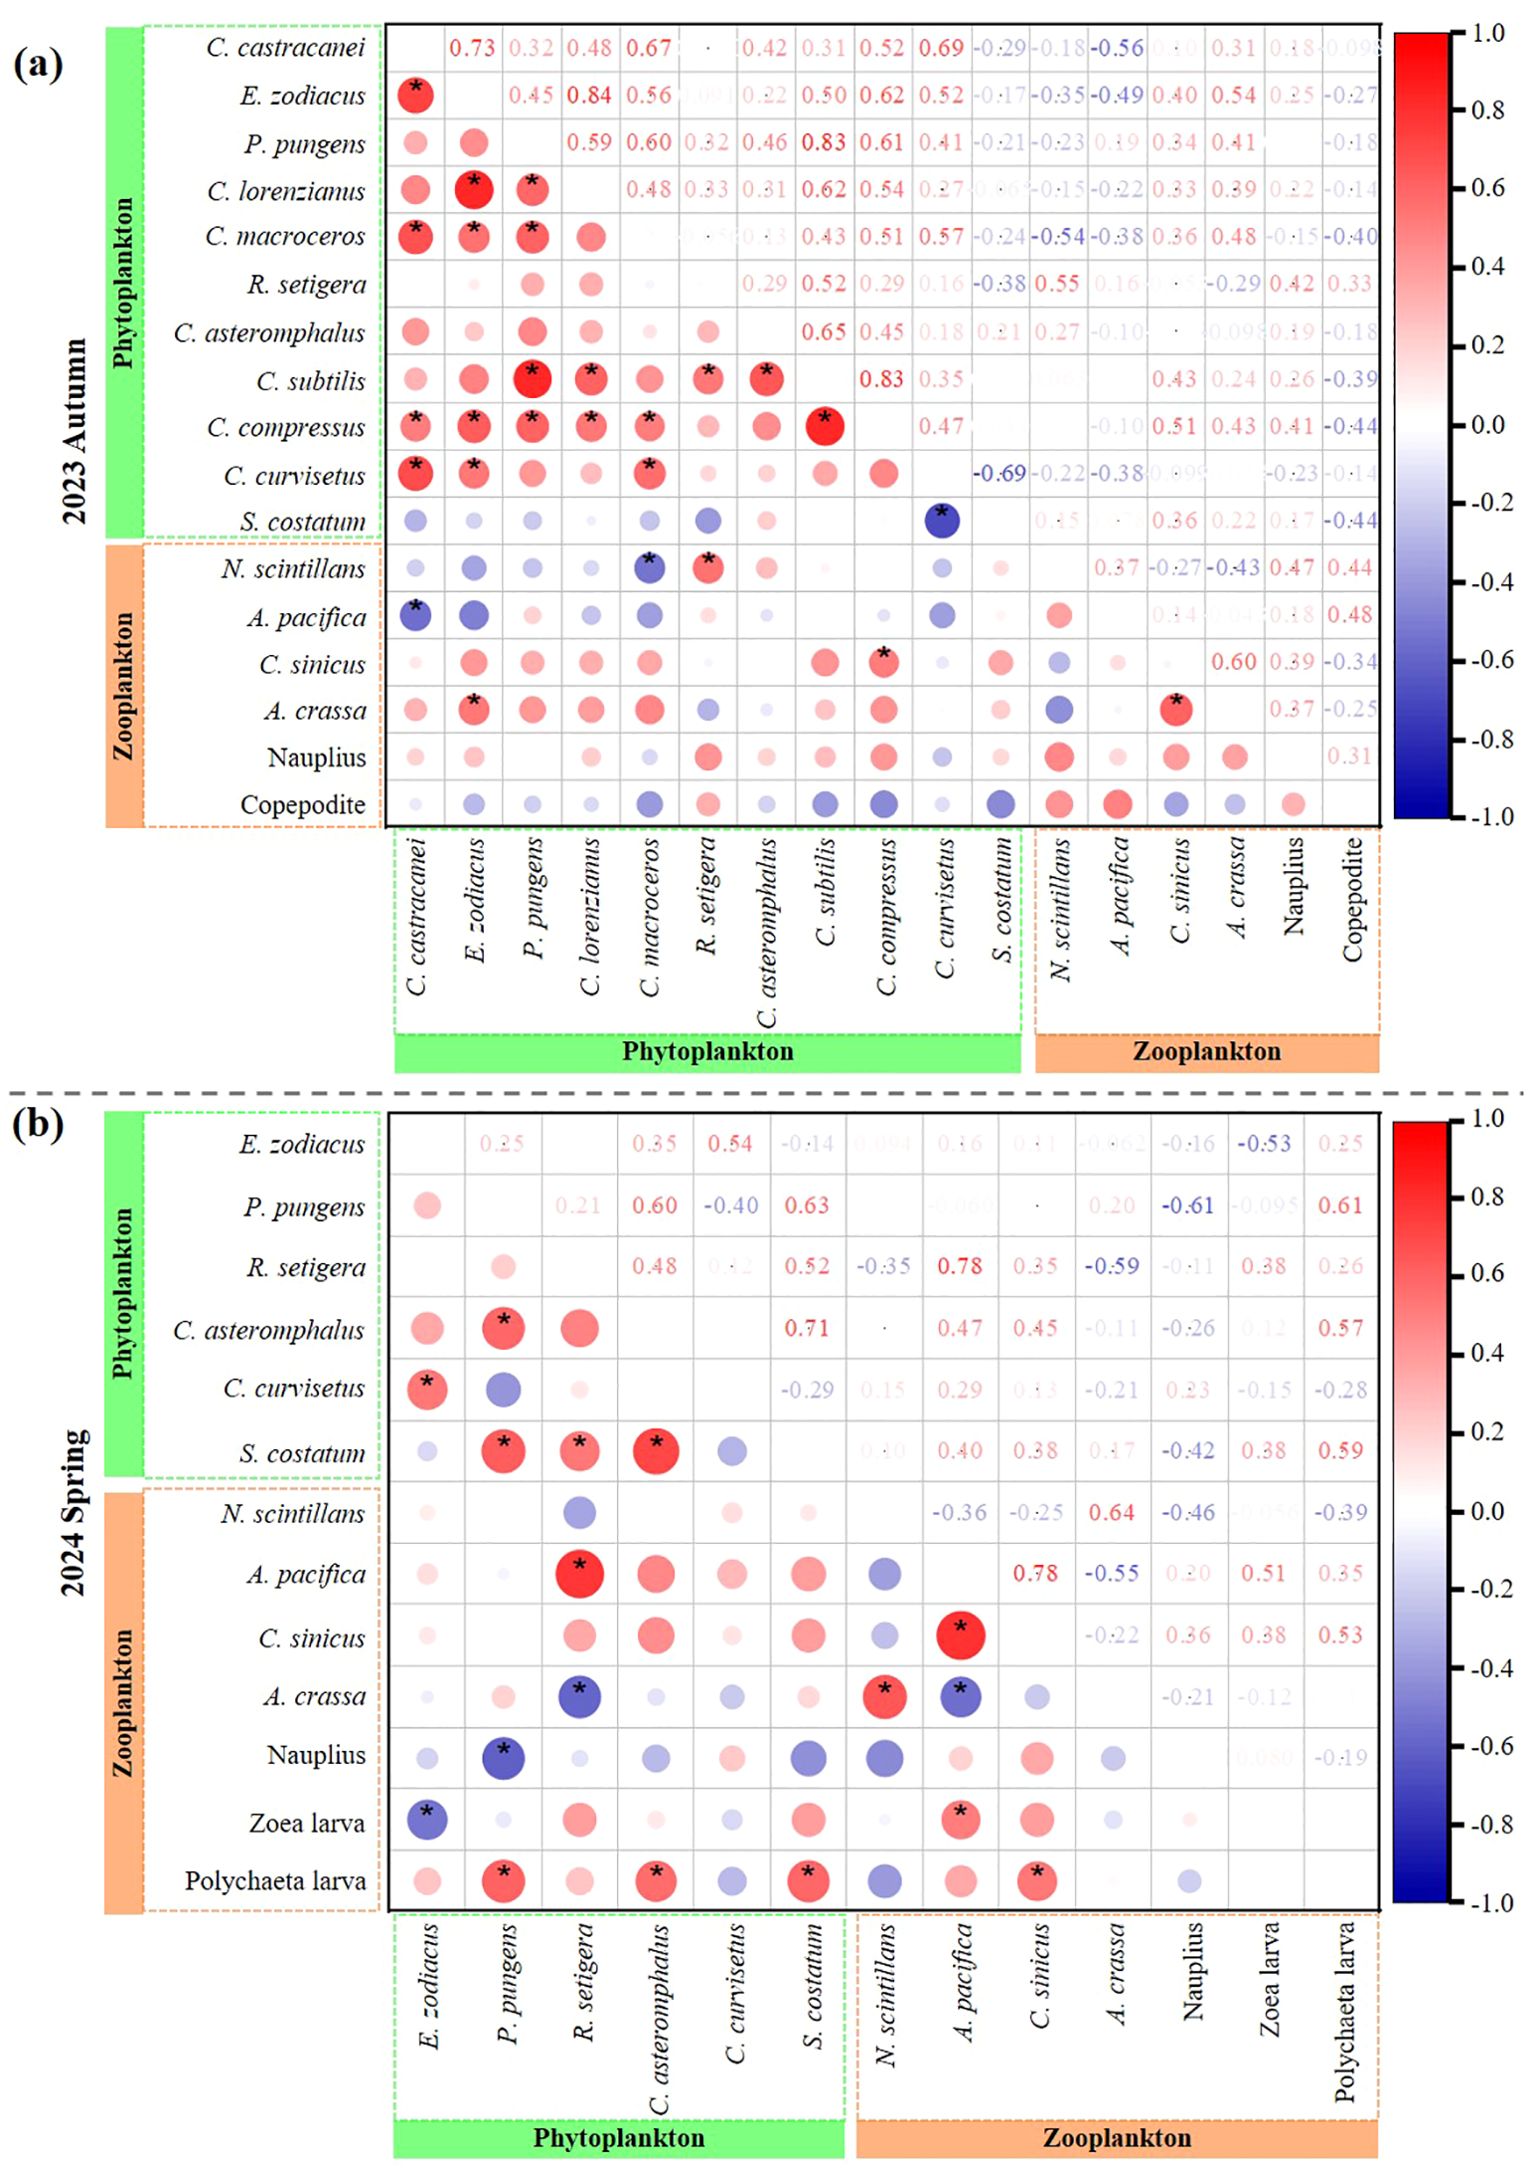
Figure 5. Spearman’s rank correlation between dominant phytoplankton and zooplankton species in autumn 2023 (A) and spring 2024 (B). *: p < 0.05, t-test.
As for trophic level relationships in phytoplankton (prey)-zooplankton (predator), Spearman’s rank correlation indicated significant positive correlations for R. setigera-N. scintillans, C. compressus-C. sinicus, E. zodiacus-A. crassa in autumn 2023, while C. macroceros-N. scintillans, C. castracanei-A. pacifica exhibited negative correlations (Figure 5A). In spring 2024, significant positive correlations were observed between R. setigena and A. pacifica, as well as P. pungens/C. asteromphalus/S. costatum with Polychaeta larvae, while R. setigena-A. crassa, P. pungens-Nauplius, E. zoodiacus-Brachyura zoea larva exhibited negative correlations (Figure 5B). Specifically, these patterns suggest that each zooplankton species has unique preferred food items in both autumn 2023 and spring 2024, with R. setigera being a favored food source for both N. scintillans and A. pacifica.
Biotic-abiotic interplay and its seasonal variations
Plankton dominant species displayed varied responses to environmental parameters during autumn 2023 and spring 2024 (Figures 6, 7; Tables 3, 4). Regarding phytoplankton-abiotic interactions, only E. zoodiacus, P. pungens and C. asteromphalus exhibited similar trends with environmental variables, suggesting they may prefer overlapping niches and face strong competition (Figure 6; Tables 3). Additionally, C. castracanei, R. setigena, C. compressus and S. costatum thrived in high-temperature and high-pH conditions, contrasting with E. zoodiacus, P. pungens, C. lorenzianus, C. asteromphalus, C. subtilis, and C. curvisetus (Figure 6). Meanwhile, each species exhibited distinct trends in response to nutrient availability, reflecting their varying utilization efficiencies. Notably, all species, except R. setigena and S. costatum, showed an increasing trend with Zn²+ (Figure 6).
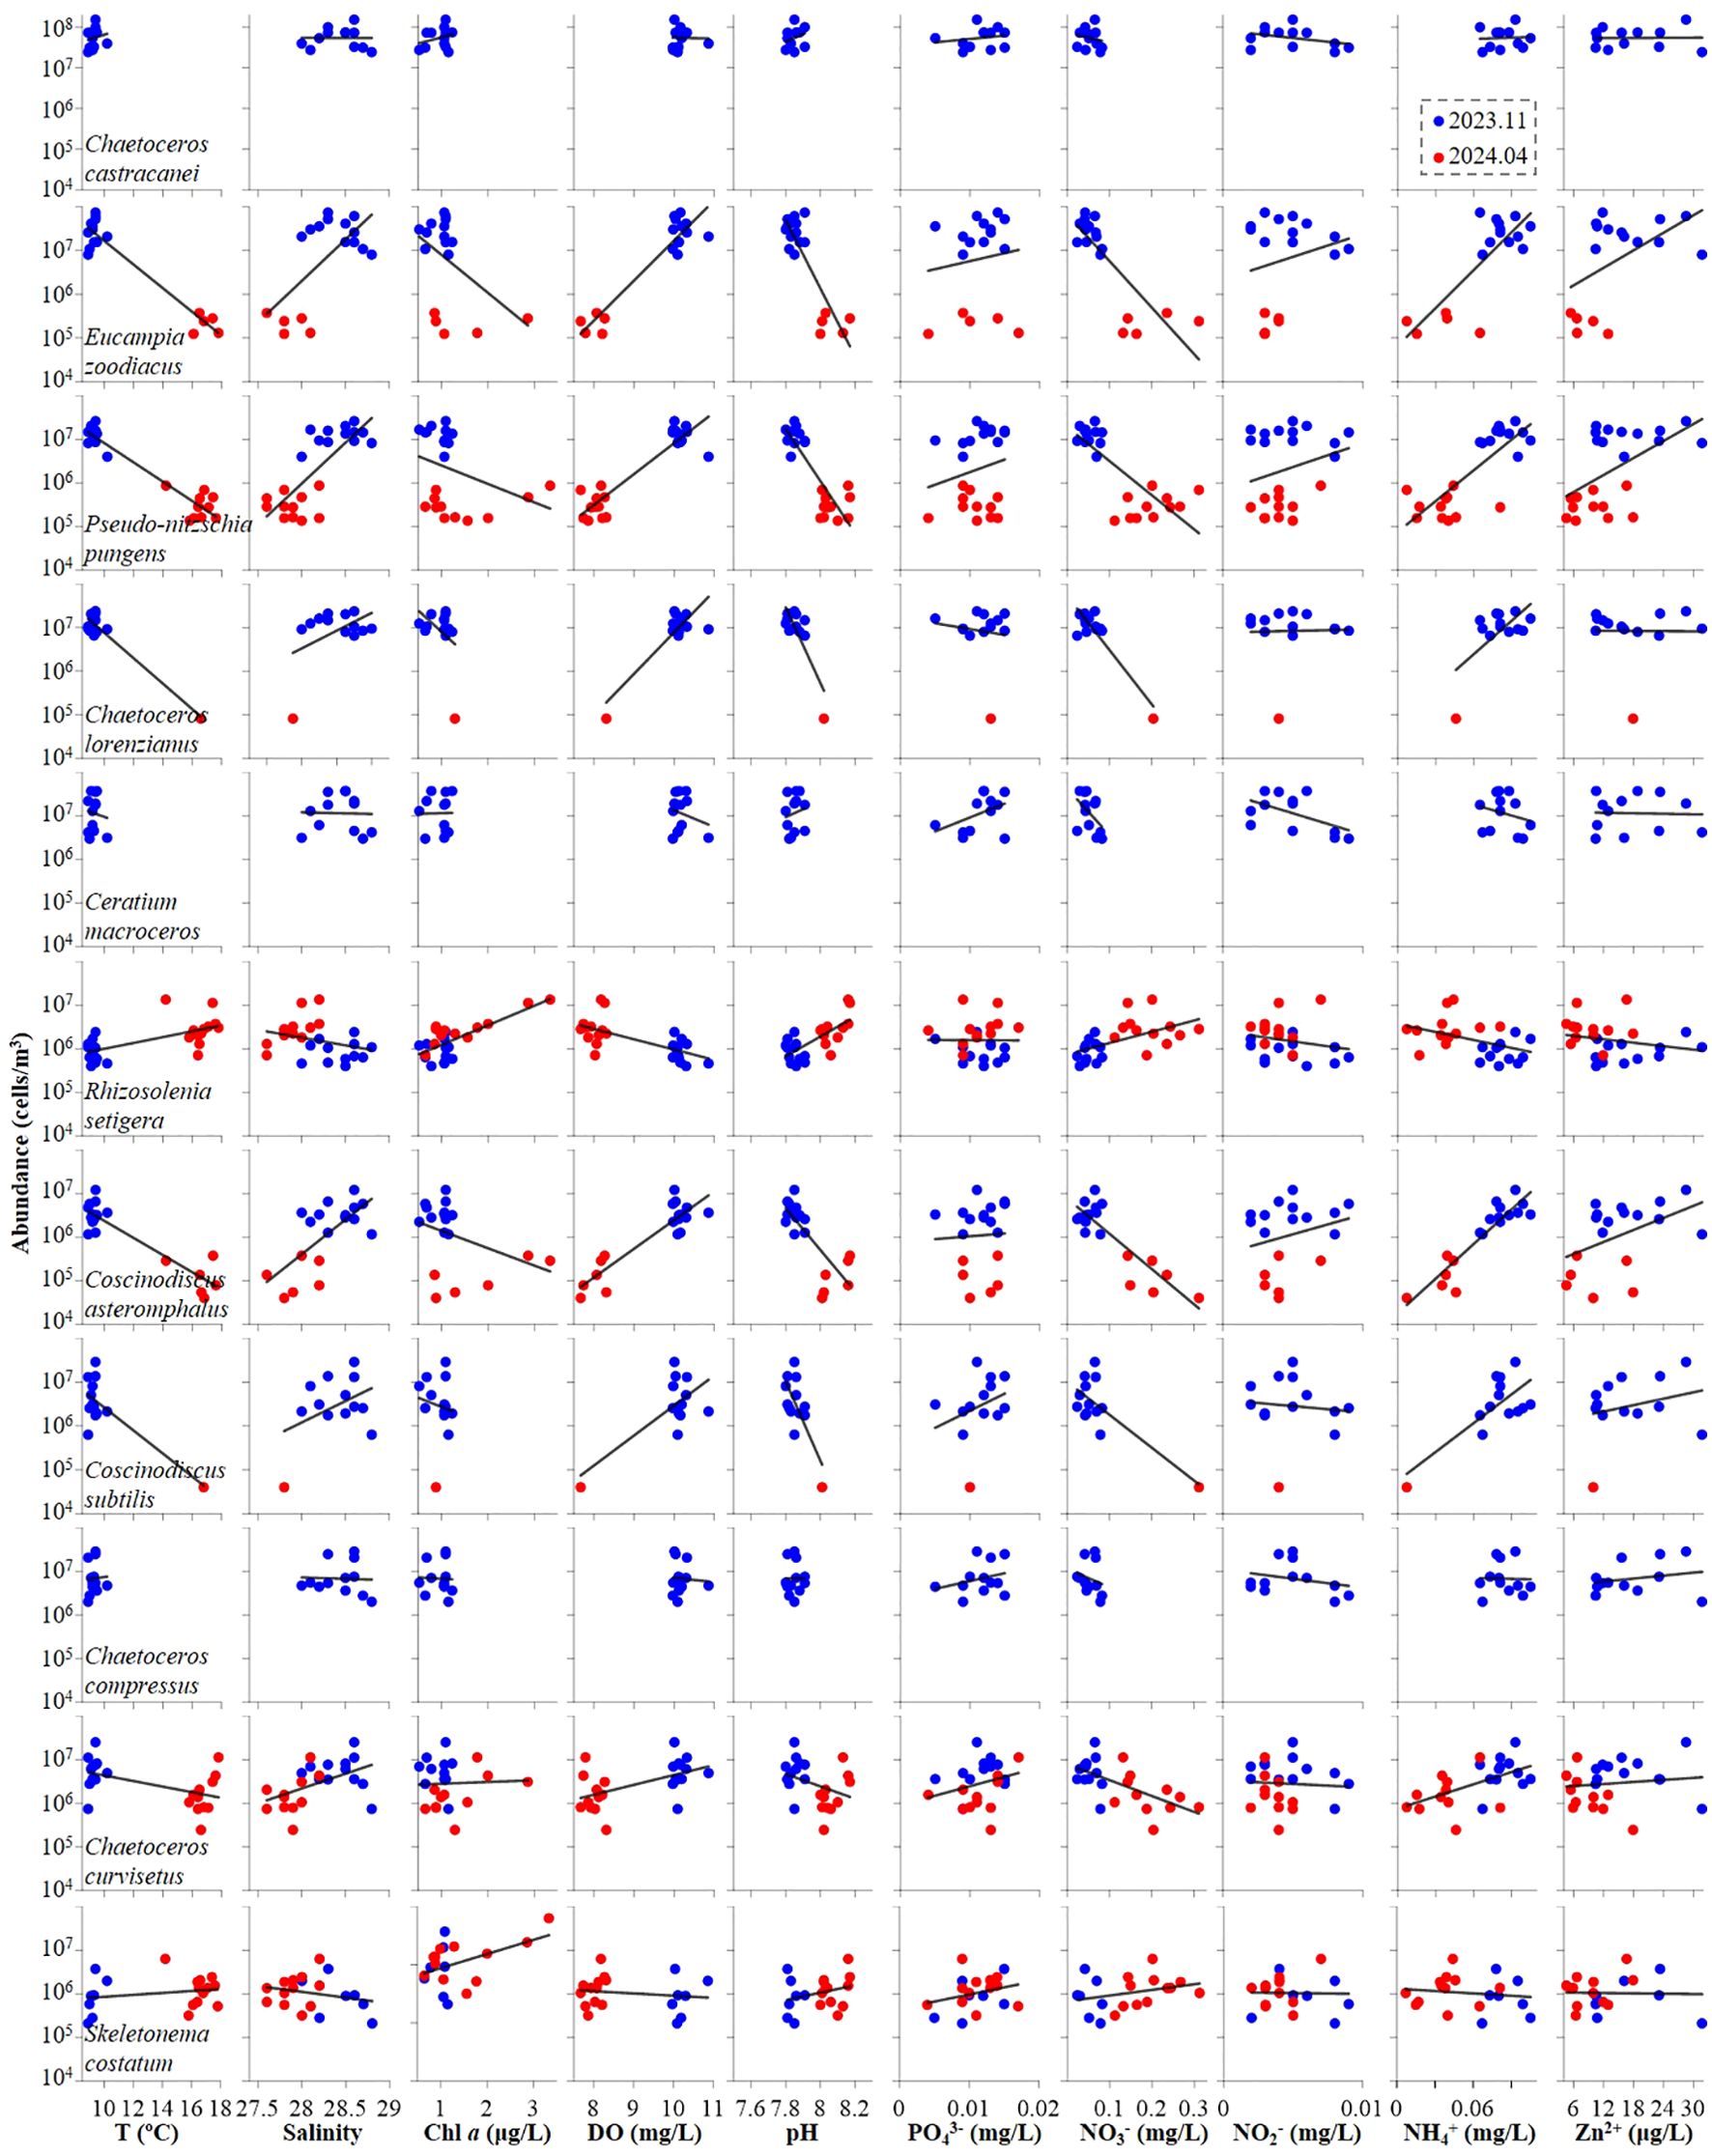
Figure 6. Correlation between environmental variables and dominant phytoplankton species at both autumn 2023 and spring 2024.
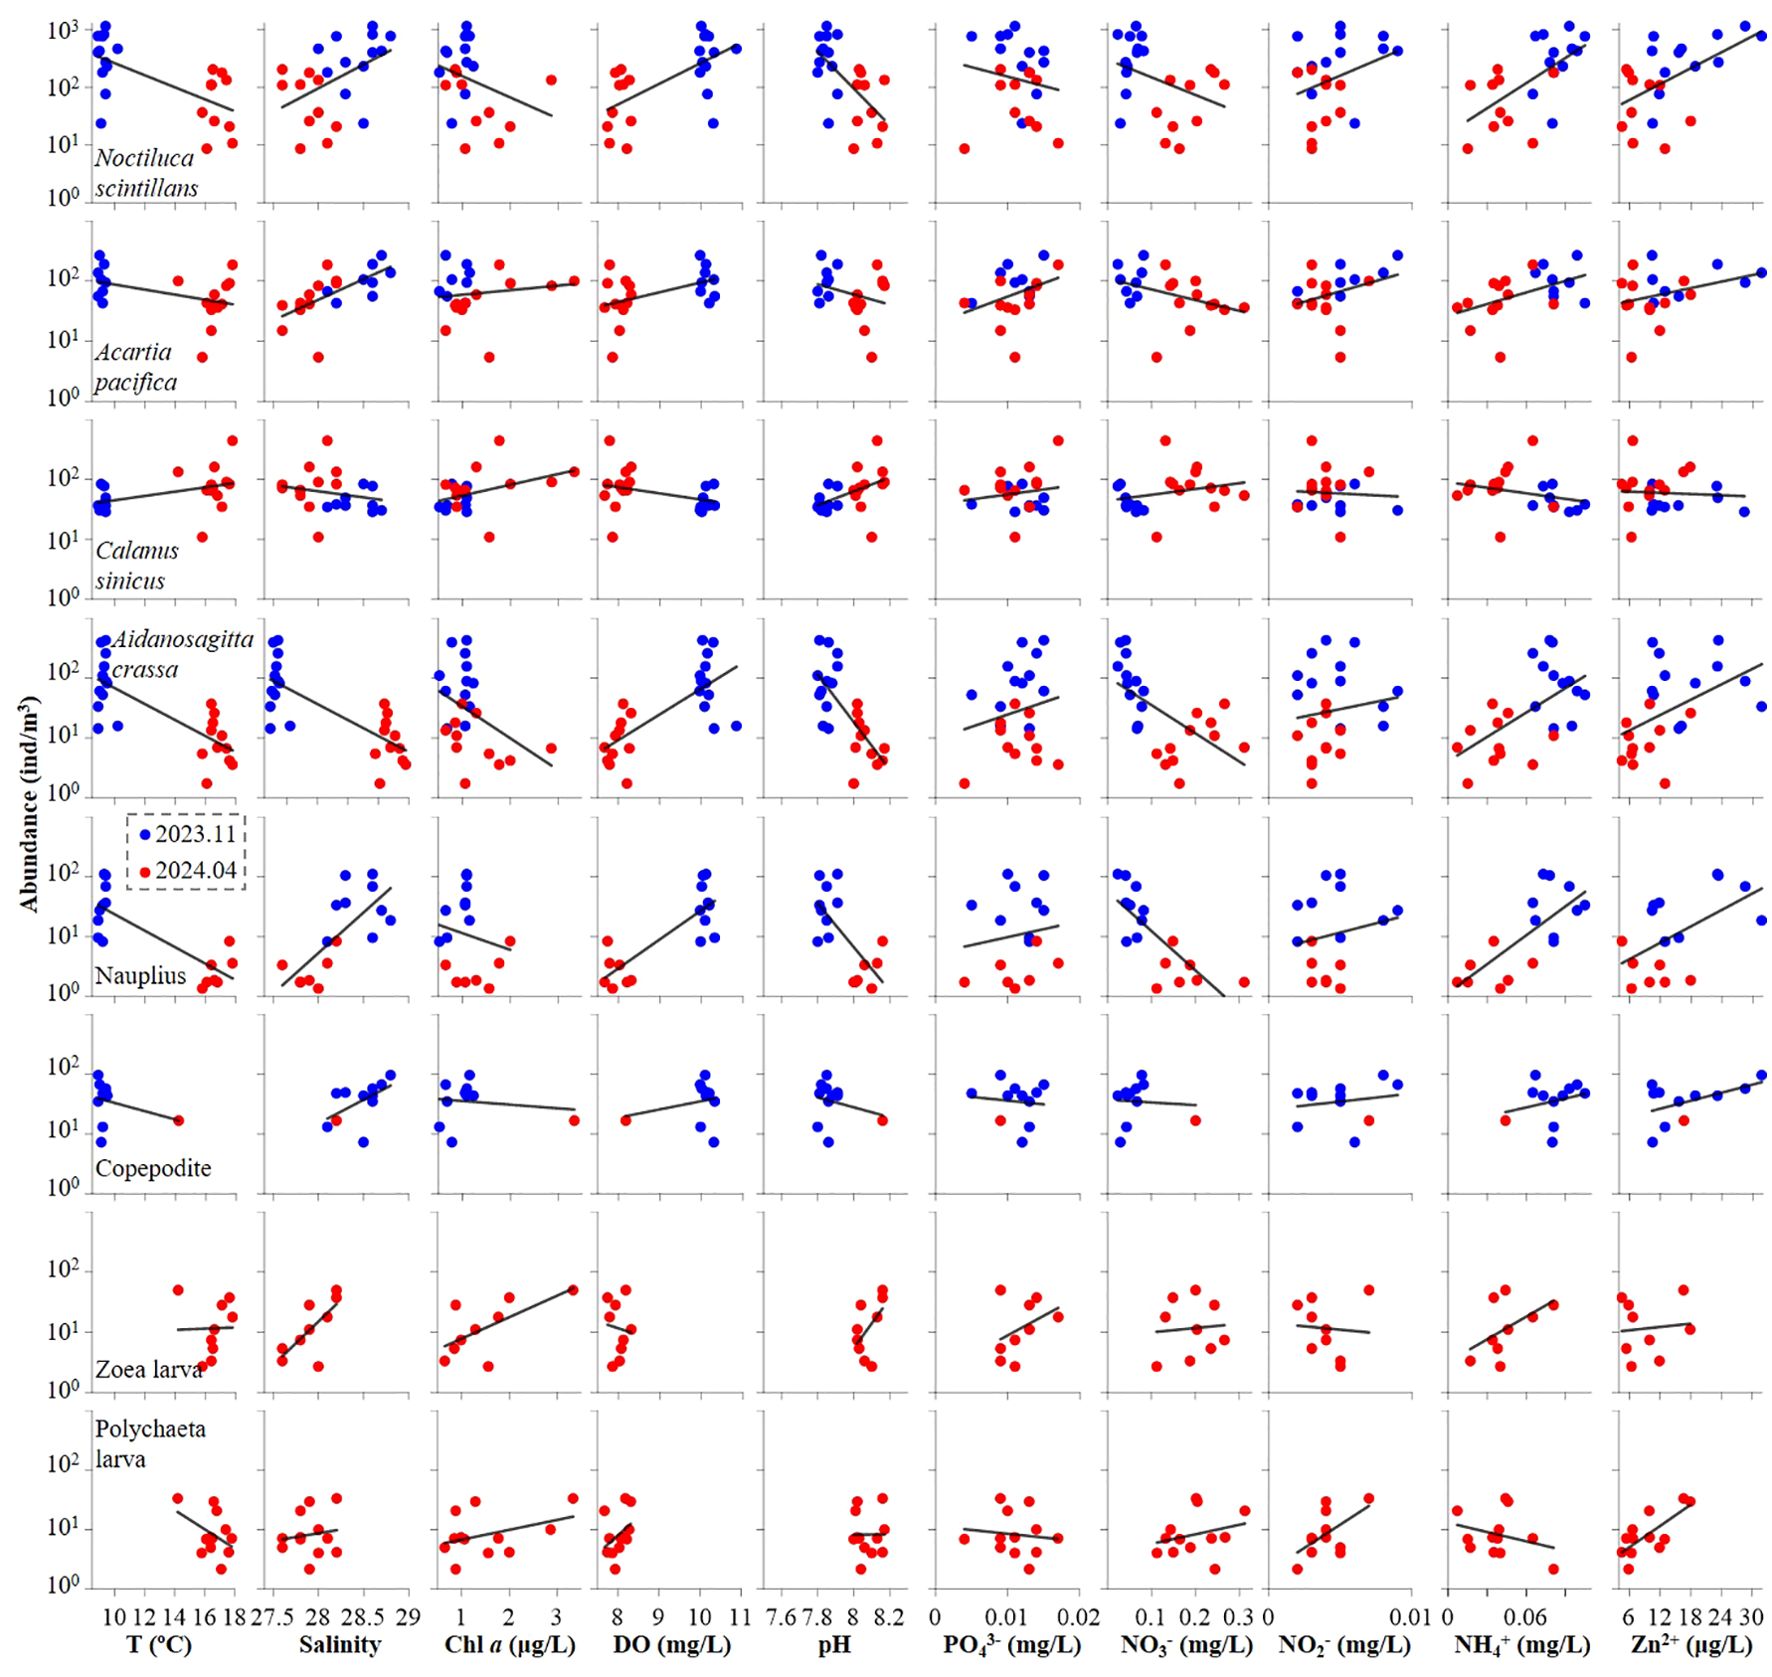
Figure 7. Correlation between environmental variables and dominant zooplankton species at both autumn 2023 and spring 2024.
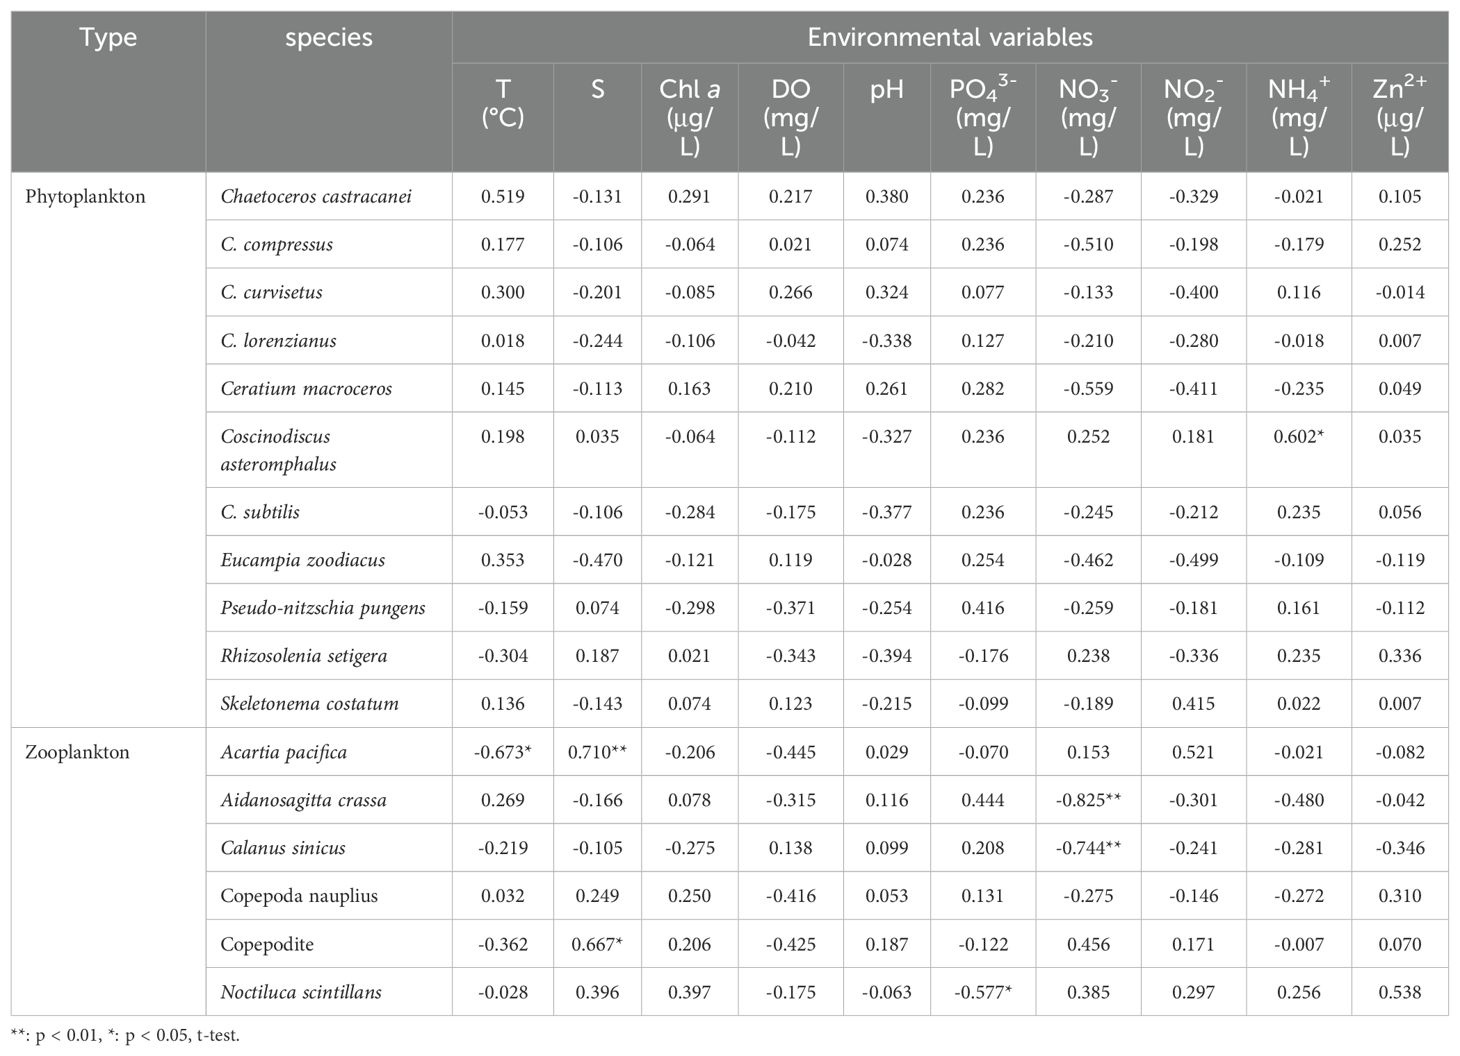
Table 3. Spearman’s rank correlation between dominant plankton (including phytoplankton and zooplankton) species and environmental parameters (T, S, Chl a, DO, pH, PO43-, NO3-, NO2-, NH4+, Zn2+) in autumn 2023.
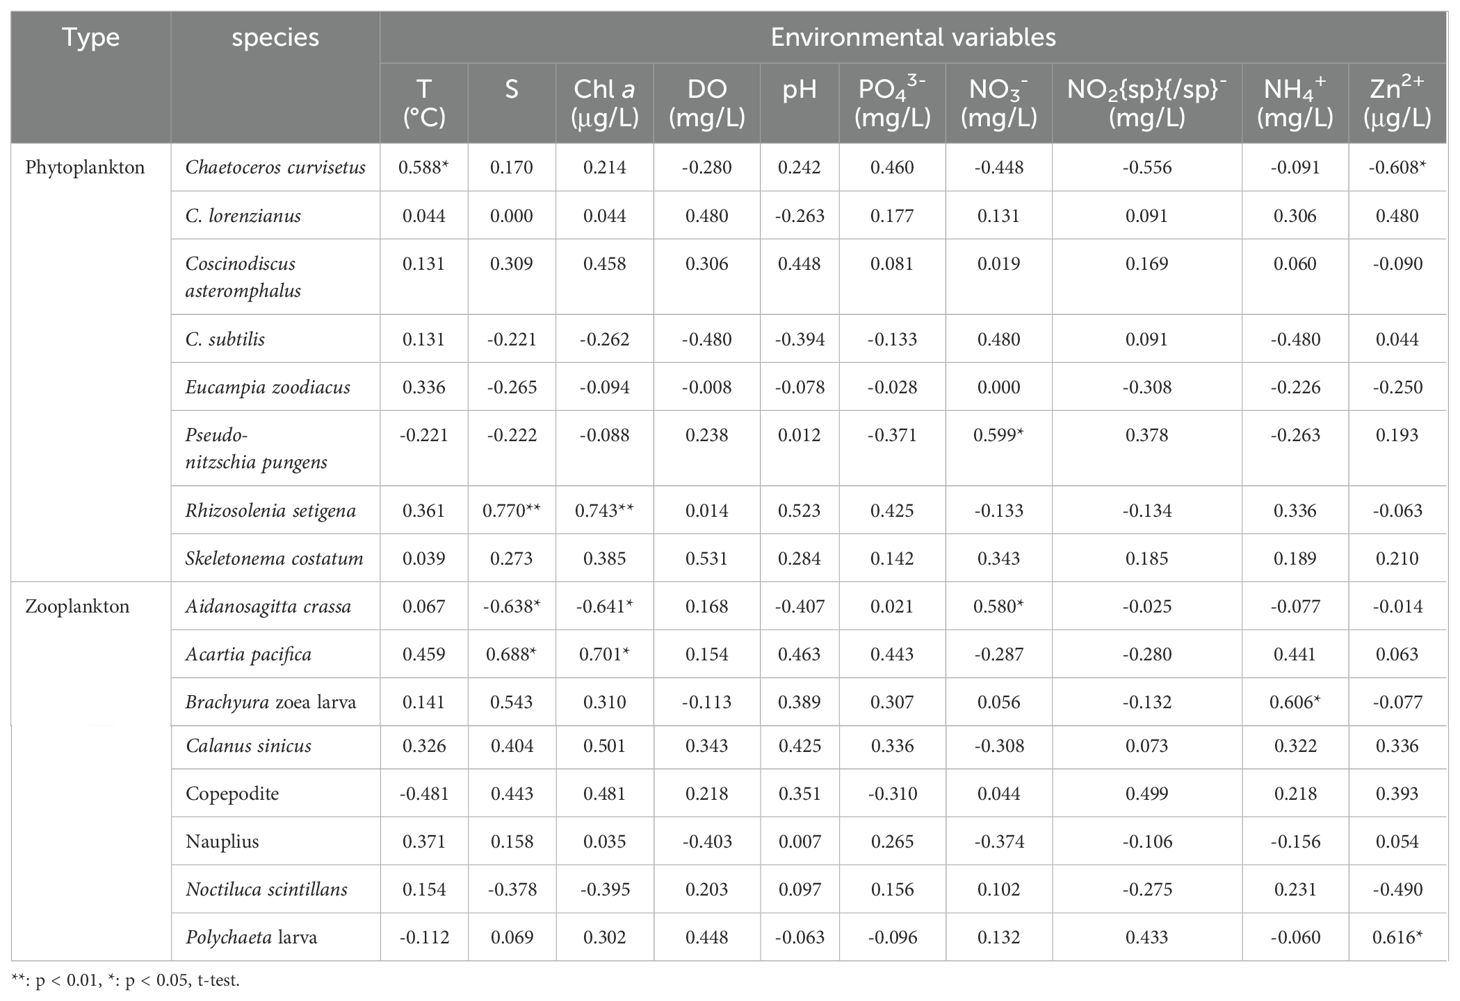
Table 4. Spearman’s rank correlation between dominant plankton (including phytoplankton and zooplankton) species and environmental parameters (T, S, Chl a, DO, pH, PO43-, NO3-, NO2-, NH4+, Zn2+) in spring 2024.
Regarding zooplankton-abiotic interplay, our results revealed that N. scintillans, Nauplius and Copepodite exhibited similar trends in response to the complex environmental variables of temperature, salinity, Chl a, dissolved oxygen (DO), and pH, indicating strong competition among these species (Figure 7). Except above-mentioned three species, A. crassa, A. pacifica and Polychaete larva also benefited from low temperature and high DO conditions. Notably, only C. sinicus and Brachyura zoea larva displayed an increasing trend with rising temperature (Figure 7; Tables 4). Furthermore, with the exception of A. pacifica, A. crassa, and Nauplius, other species displayed unique responses to nutrient variables (Figure 7; Table 4). Specifically, all species, except C. sinicus, demonstrated an increasing trend with Zn²+ (Figure 7).
To further quantify the physical-biological interplay in the neritic area of the Bohai Sea during autumn 2023 and spring 2024, we conducted principal component analysis (PCA) using abundance of phytoplankton, zooplankton and their dominant species to assess abiotic influences (Figure 8). The PCA revealed that two principal components effectively distinguished the environmental conditions across the two seasons, accounting for a substantial proportion of biotic variation ≥ 71.0% in autumn 2023 and ≥ 71.1% in spring 2024 (Figure 8). Furthermore, each dominant species (both phytoplankton and zooplankton) exhibited unique correlations with specific environmental parameters throughout the seasonal variations (Figure 8). For instance, A. crassa showed a significant positive correlation with PO43-. However, at spring 2024, its significant positive correlation shifted to with both temperature and DO (Figure 8). This phenomenon demonstrates that plankton can effectively leverage external environmental factors to survive seasonal changes.
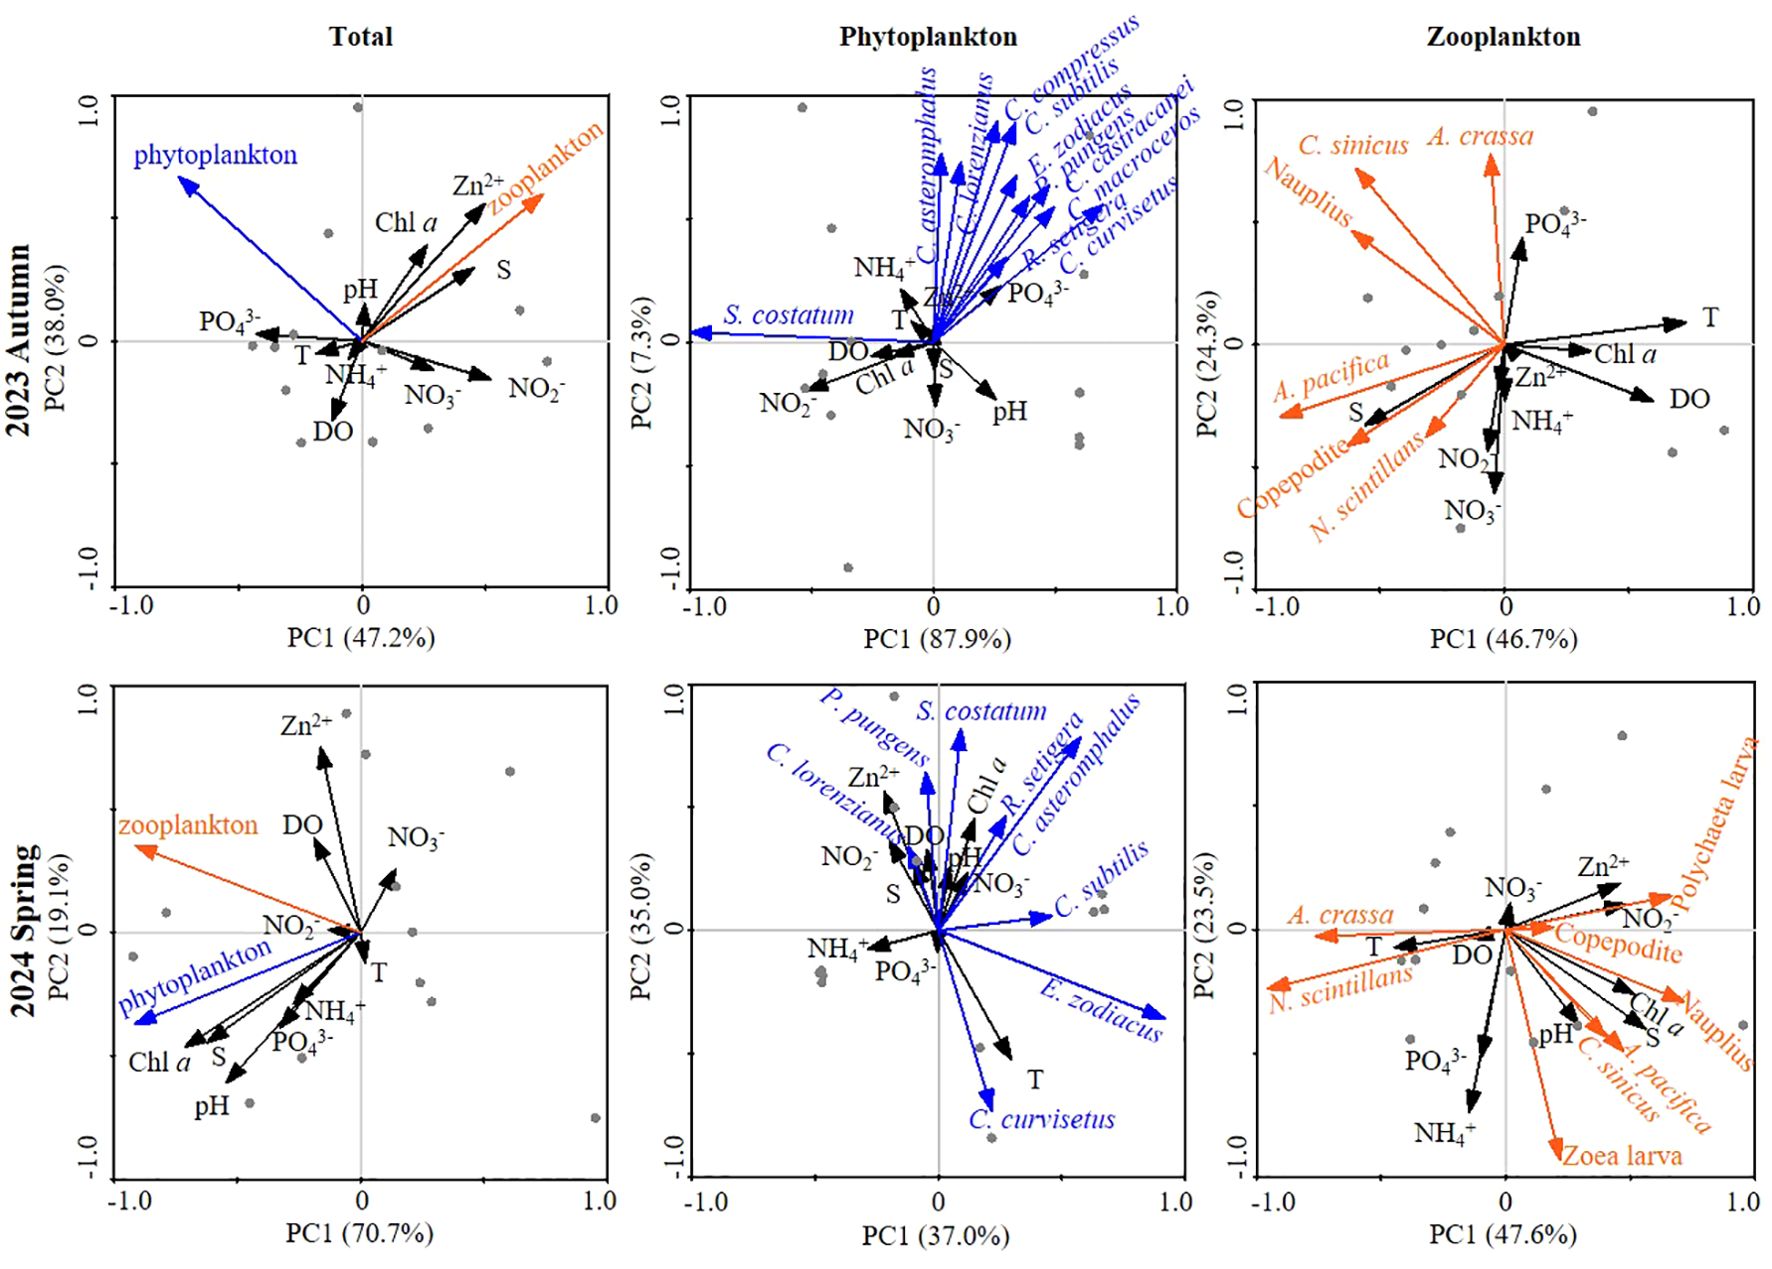
Figure 8. Variations in principal component analysis (PCA) between environmental parameters and plankton (including phytoplankton, zooplankton, and dominant species) at both autumn 2023 and spring 2024. The x-axis is the first PCA axis, and the y-axis is the second PCA axis. Environmental variables and ciliates are indicated by black and green (phytoplankton)/orange (zooplankton) lines, respectively. Grey dots are sampling points.
Discussion
This study provides a holistic paradigm and epitome of field-based significant divergences in both phytoplankton and zooplankton communities and its interplay with environmental factors during autumn 2023 and spring 2024 spanning a finer scale located at neritic area of the Bohai Sea. Unlike existing global models for plankton, which often rely on predefined parameters (Spalding et al., 2012; Anderson et al., 2021; Benedetti et al., 2021; Heneghan et al., 2023; Tagliabue et al., 2023; Atkinson et al., 2024), the seasonal dynamics of plankton traits observed through ship-borne field surveys are shaped by a dynamic feedback loop between microbes and their environment, influenced by unique physicochemical conditions, as hypothesized. However, it is important to note that our study area may not fully represent the diverse adaptive strategies of plankton seasonal variations across temperate coastal regions.
Remarkable seasonal divergences in plankton trophic interaction and composition
Marine eukaryotic plankton, including both phytoplankton and zooplankton, represents a vast diversity of organisms that serve as essential food sources for commercial fish through fundamental trophic level transfers (prey-predator interactions) (Cordier et al., 2022; Omstedt, 2024). Consequently, the bioindex reflecting the abundance ratio of phytoplankton to zooplankton is crucial for exploring and understanding plankton trophic interactions. Previous studies reported abundance ratios in pico-, nano-, and microplankton of approximately 106: 103: 1 in the Mediterranean Sea (Tanaka and Rassoulzadegan, 2002) and the Tropical North/West Pacific Ocean (Sohrin et al., 2010; Wang et al., 2023c), forming a pyramid shape from low to high trophic levels (Trebilco et al., 2013). Our findings regarding the phytoplankton-to-zooplankton ratio align with this pattern. Furthermore, the abundance ratio in autumn 2023 was 5.5 times higher than in spring 2024 (Figure 3), and the steeper phytoplankton-zooplankton slope collectively indicates that the plankton community in the former season experienced lower feeding pressure on zooplankton and stronger environmental resistance than in the latter season (De Vargas et al., 2015; Cordier et al., 2022).
Plankton species diversity plays a vital role in regulating ecosystem processes and resource utilization efficiency, thereby influencing marine ecosystem functioning and biogeochemical cycling (Chapin III et al., 1997). Similarly, a higher diversity of functionally similar species enhances the stability of resistance and resilience in marine ecosystem processes (Ibarbalz et al., 2019; Benedetti et al., 2021; Chust et al., 2024). Consistent with observational studies using both optical microscopy (Marić et al., 2012; Godrijan et al., 2013) and metabarcoding (Piredda et al., 2017; Armeli et al., 2019), species diversity of both phytoplankton and zooplankton was higher in autumn 2023 compared to spring 2024 (Table 2), showing clear seasonal variations. Furthermore, considering the significantly higher plankton abundance (Figure 3), it can be logically concluded that the plankton community in autumn 2023 exhibited greater resistance and resilience to harsh environmental conditions than in spring 2024.
As for prey-predator interactions, the fatty acid composition of phytoplankton is recognized as a crucial factor influencing food quality for higher trophic levels (Becker and Boersma, 2003; Boersma et al., 2009; Chen et al., 2010; Peng et al., 2024). Among various phytoplankton species, diatoms are particularly noted for their high levels of unsaturated fatty acids, which are essential for the cell differentiation, growth, reproduction, immune function, and other biological processes of zooplankton (Wichard et al., 2008; Yeung et al., 2020; Peng et al., 2024). Thus, it is reasonable to suggest that higher diatom abundance contributes to increased zooplankton populations, as observed in autumn 2023 (Figure 3). Additionally, our findings indicate that all phytoplankton species in spring 2024 belonged to the phylum Bacillariophyta (Table 2), aligning with Murphy et al. (2020), which found that warming significantly enhances the ecological importance of diatoms. Moreover, the minimal variation in both total and dominant zooplankton species between autumn 2023 and spring 2024 (Figure 3; Table 2) may be attributed to their strong selective feeding abilities (Serandour et al., 2023).
Ecological role of environmental parameters played in seasonal plankton variations
Physicochemical factors, e.g., temperature, salinity, Chl a, nutrients, pH, dissolved oxygen, heavy metal, are crucial in reshaping complex plankton compositions through bottom-up control (resource limitation) (Power, 1992; Pörtner and Farrell, 2008; Wang et al., 2023c, 2024b; Lennartz et al., 2024). Specifically, temperature enhances species biodiversity by modulating temperature-dependent metabolic processes (Vázquez-Domínguez et al., 2007; Archibald et al., 2022). However, our results indicate that only a few phytoplankton and zooplankton species showed a positive correlation with temperature (Figure 8). We speculate that in specific locations, the surrounding environmental conditions may exceed the temperature thresholds for these species (Holding et al., 2013; Stuart-Smith et al., 2015), potentially explaining the observed loss of both biodiversity and abundance in spring 2024. Moreover, previous studies suggest that higher trophic levels are generally more vulnerable to elevated temperatures, as the metabolic demands of consumers are more sensitive to warming, leading to decreased consumer fitness (Lopez-Urrutia et al., 2006; Rall et al., 2010). However, our findings do not align with aforementioned viewpoint, as both species composition and total abundance of zooplankton showed little variation between autumn 2023 and spring 2024 (Figure 3), despite an average temperature increase of 7.3°C from autumn 2023 to spring 2024 (Figure 2).
Nutritional availability is crucial for influencing phytoplankton concentrations, as it is closely linked to increased primary productivity in terms of both quantity (abundance) and quality (lipid unsaturation) (Premakumari et al., 2024). This productivity then transfers to higher trophic levels through essential prey-predator interactions (Šolić et al., 2010; Våge and Thingstad, 2015; Holm et al., 2022). Our results indicate that dominant phytoplankton species exhibited distinctly different trends in response to nutrients in autumn 2023 and spring 2024 (Figure 6). This variability can be explained by two factors: 1) each species has a unique nutrient affinity (Strom and Fredrickson, 2008), and 2) avoid harmful competition (Sommer, 1989; Litchman et al., 2004; Kenitz et al., 2013). Regarding zooplankton, DO is a vital limiting factor for survival and growth, as heterotrophs must oxidize large compounds from their environment to release energy for biological processes (Fenchel, 2014; Qian et al., 2023). Our findings support this perspective (Figure 7).
In recent decades, anthropogenic CO2 emissions have induced global warming, triggering unprecedented and lasting impacts on marine ecosystems worldwide (Yasumiishi et al., 2020; Carvalho et al., 2021; Wang and Wu, 2022). This poses threats to biodiversity and ecological functions, particularly through poleward dispersal (Ershova et al., 2015; Hastings et al., 2020; Møller and Nielsen, 2020; Wang et al., 2022), changes in phenology and adaptation (Poloczanska et al., 2013; Atkinson et al., 2015), and mean body size miniaturization (Li et al., 2009; Daufresne et al., 2009; Qian et al., 2023). For surface-dwelling species in large marine environments, poleward dispersal is a prominent aspect of plankton’s response to global warming (Hastings et al., 2020). Whereas at a specific location, plankton face two options: 1) enhance their temperature tolerance through long-term adaptive evolution (Ward et al., 2019) or 2) extirpation. In this perspective, our study on plankton seasonal variations provides a fundamental benchmark for understanding the adaptive strategies of phytoplankton and zooplankton to rapid warming. Meanwhile, our results indicate that several dominant plankton species exhibited a positive correlation with temperature during the warmer spring of 2024 (Figures 6, 8). Thus, we deduce that these “winner” plankton species, with strong adaptation abilities (Casoli et al., 2020; Boutin et al., 2023), are likely to dominate the neritic area of the Bohai Sea in the future.
Conclusions
This study provides a comprehensive assessment of plankton seasonal dynamics in the neritic area of the Bohai Sea, put emphasis on biodiversity, trophic linkages and the biotic-abiotic interplay between phytoplankton and zooplankton. Regarding trophic interactions, abundance ratio of phytoplankton to zooplankton was approximately 104: 1 in autumn 2023 and spring 2024, with the former season showing a value 5.5 times higher than the latter, indicating lower feeding pressure on zooplankton in autumn 2023. Incorporate aforementioned higher plankton species richness, a logical conclusion is that the community exhibited greater resistance and resilience to harsh environmental conditions compared to spring 2024. Additionally, both total and dominant zooplankton species showed minimal variation between two seasons, likely due to their strong selective feeding abilities. Each dominant phytoplankton species demonstrated distinct trends in response to nutrients, attributed to their unique nutrient affinities and avoidance of vicious competition. Regarding zooplankton, their close relationship with DO is essential for crucial intracellular metabolic processes. Moreover, several dominant plankton species exhibited significant positive correlations with temperature during the warmer spring of 2024, suggesting that these species may become increasingly dominant in the plankton community under the global warming. To summarize, our results lay a solid foundation for assessing and predicting future changes in plankton seasonal dynamics and their potential responses to rapid climate change.
Data availability statement
The original contributions presented in the study are included in the article/supplementary material. Further inquiries can be directed to the corresponding author.
Author contributions
YZ: Conceptualization, Formal analysis, Writing – original draft, Investigation, Methodology. CW: Conceptualization, Formal analysis, Writing – original draft, Funding acquisition, Project administration, Supervision, Writing – review & editing. XW: Formal analysis, Methodology, Visualization, Writing – original draft. WW: Formal analysis, Visualization, Writing – original draft. TZ: Formal analysis, Writing – original draft. JH: Formal analysis, Investigation, Writing – original draft. WS: Formal analysis, Investigation, Writing – original draft. YS: Formal analysis, Investigation, Writing – original draft. ZH: Formal analysis, Writing – original draft. XZ: Funding acquisition, Project administration, Supervision, Writing – review & editing.
Funding
The author(s) declare that financial support was received for the research, authorship, and/or publication of this article. This research was funded by the Shandong Provincial Natural Science Foundation (Grant Number ZR2022QD022) and the National Natural Science Foundation of China (Grant Number 42206258; 41906084).
Acknowledgments
Special thanks to captain and crews of the fishing-boat “Jintangyu02066” for their great help in sampling periods during the cruises. Meanwhile, we greatly appreciate the constructive comments by two reviewers for dramatically improving the quality of the manuscript.
Conflict of interest
The authors declare that the research was conducted in the absence of any commercial or financial relationships that could be construed as a potential conflict of interest.
Generative AI statement
The author(s) declare that no Generative AI was used in the creation of this manuscript.
Publisher’s note
All claims expressed in this article are solely those of the authors and do not necessarily represent those of their affiliated organizations, or those of the publisher, the editors and the reviewers. Any product that may be evaluated in this article, or claim that may be made by its manufacturer, is not guaranteed or endorsed by the publisher.
References
Anderson S. I., Barton A., Clayton S., Dutkiewicz S., Rynearson T. (2021). Marine phytoplankton functional types exhibit diverse responses to thermal change. Nat. Commun. 12, 6413. doi: 10.1038/s41467-021-26651-8
Archibald K. M., Dutkiewicz S., Laufkötter C., Moeller H. V. (2022). Thermal responses in global marine planktonic food webs are mediated by temperature effects on metabolism. J. Geophys. Res-Oceans. 127, e2022JC018932. doi: 10.1029/2022JC018932
Armeli Minicante S., Piredda R., Quero G. M., Finotto S., Bernardi Aubry F., Bastianini M., et al. (2019). Habitat heterogeneity and connectivity: effects on the planktonic protist community structure at two adjacent coastal sites (the lagoon and the gulf of venice, northern adriatic sea, Italy) revealed by metabarcoding. Front. Microbiol. 10. doi: 10.3389/fmicb.2019.02736
Atkinson A., Harmer R., Widdicombe C., McEvoy A., Smyth T., Cummings D., et al. (2015). Questioning the role of phenology shifts and trophic mismatching in a planktonic food web. Prog. Oceanogr. 137, 498–512. doi: 10.1016/j.pocean.2015.04.023
Atkinson A., Rossberg A. G., Gaedke U., Sprules G., Heneghan R., Batziakas S., et al. (2024). Steeper size spectra with decreasing phytoplankton biomass indicate strong trophic amplification and future fish declines. Nat. Commun. 15, 381. doi: 10.1038/s41467-023-44406-5
Baricevic A., Kogovsek T., Smodlaka Tankovic M., Grizancic L., Knjaz M., Vlasicek I., et al. (2024). Coastal eukaryotic plankton diversity of the Southern Adriatic as revealed by metabarcoding. Diversity 16, 293. doi: 10.3390/d16050293
Becker C., Boersma M. (2003). Resource quality effects on life histories of Daphnia. Limnol. Oceanogr. 48, 700–706. doi: 10.4319/lo.2003.48.2.0700
Benedetti F., Vogt M., Elizondo U., Righetti D., Zimmermann N. E., Gruber N. (2021). Major restructuring of marine plankton assemblages under global warming. Nat. Commun. 12, 5226. doi: 10.1038/s41467-021-25385-x
Blanchard J. L., Heneghan R. F., Everett J. D., Trebilco R., Richardson A. J. (2017). From bacteria to whales: Using functional size spectra to model marine ecosystems. Trends Ecol. Evol. 32, 174–186. doi: 10.1016/j.tree.2016.12.003
Boersma M., Becker C., Malzahn A., Vernooij S. (2009). Food chain effects of nutrient limitation in primary producers. Mar. Freshw. Res. 60, 983–989. doi: 10.1071/MF08240
Boutin K., Gaudron S. M., Denis J., Lasram F. B. R. (2023). Potential marine benthic colonisers of offshore wind farms in the English Channel: a functional trait-based approach. Mar. Environ. Res. 190, 106061. doi: 10.1016/j.marenvres.2023.106061
Carvalho K. S., Smith T. E., Wang S. (2021). Bering Sea marine heatwaves: Patterns, trends and connections with the Arctic. J. Hydrol. 600, 126462. doi: 10.1016/j.jhydrol.2021.126462
Casoli E., Mancini G., Ventura D., Pace D. S., Belluscio A., Ardizzone G. D. (2020). Reteporella spp. success in the re-colonization of bare coralligenous reefs impacted by Costa Concordia shipwreck: the pioneer species you did not expect. Mar. pollut. Bull. 161, 111808. doi: 10.1016/j.marpolbul.2020.111808
Chapin F. S. III, Walker B. H., Hobbs R. J., Hooper D. U., Lawton J. H., Sala O. E., et al. (1997). Biotic control over the functioning of ecosystems. Science 277, 500–503. doi: 10.1126/science.277.5325.500
Chen B. Z., Liu H. B., Lau M. T. S. (2010). Grazing and growth responses of a marine oligotrichous ciliate fed with two nanoplankton: does food quality matter for micrograzers? Aquat. Ecol. 44, 113–119. doi: 10.1007/s10452-009-9264-5
Chust G., Villarino E., McLean M., Mieszkowska N., Benedetti-Cecchi L., Bulleri F., et al. (2024). Cross-basin and cross-taxa patterns of marine community tropicalization and deborealization in warming European seas. Nat. Commun. 15, 2126. doi: 10.1038/s41467-024-46526-y
Cordier T., Angeles I. B., Henry N., Lejzerowicz F., Berney C., Morard R., et al. (2022). Patterns of eukaryotic diversity from the surface to the deep-ocean sediment. Sci. Adv. 8, eabj9309. doi: 10.1126/sciadv.abj9309
Cripps G., Lindeque P., Flynn K. J. (2015). Have we been underestimating the effects of ocean acidification in zooplankton? Global Change Biol. 20, 3377–3385. doi: 10.1111/gcb.12582
Darnis G., Geoffroy M., Dezutter T., Aubry C., Massicotte P., Brown T., et al. (2022). Zooplankton assemblages along the North American Arctic: Ecological connectivity shaped by ocean circulation and bathymetry from the Chukchi Sea to Labrador Sea. Elem Sci. Anth. 10, 1. doi: 10.1525/elementa.2022.00053
Daufresne M., Lengfellner K., Sommer U. (2009). Global warming benefits the small in aquatic ecosystems. P. Natl. Acad. Sci. U.S.A. 106, 12788–12793. doi: 10.1073/pnas.0902080106
De Vargas C., Audic S., Henry N., Decelle J., Mahé F., Logares R., et al. (2015). Eukaryotic plankton diversity in the sunlit ocean. Science 348, 1261605. doi: 10.1126/science.1261605
Eddy T. D., Bernhardt J. R., Blanchard J. L., Cheung W. W. L., Colléter M., Pontavice H., et al. (2021). Energy flow through marine ecosystems: confronting transfer efficiency. Trends Ecol. Evol. 36, 76–86. doi: 10.1016/j.tree.2020.09.006
Ershova E. A., Hopcroft R., Kosobokova K., Matsuno K., Nelson R., Yamaguchi A., et al. (2015). Long-term changes in summer zooplankton communities of the western Chukchi Sea 1945–2012. Oceanography 28, 100–115. doi: 10.5670/oceanog.2015.60
Fenchel T. (2014). Protozoa and oxygen. Acta Protozool. 53, 3–12. doi: 10.4467/16890027AP.13.0020.1117
Garzke J., Ismar S. M. H., Sommer U. (2015). Climate change affects low trophic level marine consumers: Warming decreases copepod size and abundance. Oecologia 177, 849–860. doi: 10.1007/s00442-014-3130-4
Godrijan J., Marić D., Tomažić I., Precali R., Pfannkuchen M. (2013). Seasonal phytoplankton dynamics in the coastal waters of the North-Eastern Adriatic Sea. J. Sea Res. 77, 32–44. doi: 10.1016/j.seares.2012.09.009
Guo H. (2004). Illustrations of Planktons Responsible for the Blooms in Chinese Coastal Waters (Beijing: China Ocean Press).
Hastings R. A., Rutterford L. A., Freer J. J., Collins R. A., Simpson S. D., Genner M. J. (2020). Climate change drives poleward increases and equatorward declines in marine species. Curr. Biol. 30, 1572–1577. doi: 10.1016/j.cub.2020.02.043
Heneghan R. F., Everett J. D., Blanchard J. L., Sykes P., Richardson A. J. (2023). Climate-driven zooplankton shifts cause large-scale declines in food quality for fish. Nat. Clim. Change 13, 470–477. doi: 10.1038/s41558-023-01630-7
Holding J. M., Duarte C. M., Arrieta J. M., Vaquer-Sunyer R., Coello-Camba A., Wassmann P., et al. (2013). Experimentally determined temperature thresholds for Arctic plankton community metabolism. Biogeosciences 10, 357–370. doi: 10.5194/bg-10-357-2013
Holm H. C., Fredricks H. F., Bent S. M., Lowenstein D. P., Ossolinski J. E., Becker K. W., et al. (2022). Global Ocean lipidomes show a universal relationship between temperature and lipid unsaturation. Science 376, 1487–1491. doi: 10.1126/science.abn7455
Ibarbalz F., Henry N., Brandão M., Martini S., Busseni G., Byrne H., et al. (2019). Global trends in marine plankton diversity across kingdoms of life. Cell 179, 1084–1097. doi: 10.1016/j.cell.2019.10.008
Kenitz K., Williams R., Sharples J., Selsil O., Biktashev V. (2013). The paradox of the plankton: Species competition and nutrient feedback sustain phytoplankton diversity. Mar. Ecol. Prog. Ser. 490, 107–119. doi: 10.3354/meps10452
Knap A. H., Michaels A., Close A. R., Ducklow H., Dickson A. G. (1996). Protocols for the joint global ocean flux study (JGOFS) core measurements. JGOFS Rep. 19, 155–162.
Lennartz S. T., Keller D. P., Oschlies A., Blasius B., Dittmar T. (2024). Mechanisms underpinning the net removal rates of dissolved organic carbon in the global ocean. Global Biogeochem. Cy. 38, e2023GB007912. doi: 10.1029/2023GB007912
Li W., Mclaughlin F. A., Lovejoy C., Carmack E. C. (2009). Smallest algae thrive as the Arctic Ocean freshens. Science 326, 539–539. doi: 10.1126/science.1179798
Litchman E., Klausmeier C. A., Bossard P. (2004). Phytoplankton nutrient competition under dynamic light regimes. Limnol. Oceanogr. 49, 1457–1462. doi: 10.4319/lo.2004.49.4_part_2.1457
Lopez-Urrutia A., San Martin E., Harris R. P., Irigoien X. (2006). Scaling the metabolic balance of the oceans. Proc. Natl. Acad. Sci. U.S.A. 103, 8739–8744. doi: 10.1073/pnas.0601137103
Ma J., Li X., Song J., Wang Q., Wen L., Xu K., et al. (2023). Relationship and stratification of multiple marine ecological indicators: A case study in the M2 seamount area of the Western Pacific Ocean. Ecol. Indic. 146, 109804. doi: 10.1016/j.ecolind.2022.109804
Ma J., Song J., Li X., Yuan H., Li N., Duan L., et al. (2019). Environmental characteristics in three seamount areas of the Western Pacific Ocean: Focusing on nutrients. Mar. pollut. Bull. 143, 163–174. doi: 10.1016/j.marpolbul.2019.04.045
Mandal A., Sk N., Biswas S. (2024). Nutrient enrichment and phytoplankton toxicity influence a diversity of complex dynamics in a fear-induced plankton-fish model. J. Theor. Biol. 578, 111698. doi: 10.1016/j.jtbi.2023.111698
Marić D., Kraus R., Godrijan J., Supić N., Djakovac T., Precali R. (2012). Phytoplankton response to climatic and anthropogenic influences in the north-eastern Adriatic during the last four decades. Estuar. Coast. Shelf. S. 115, 98–112. doi: 10.1016/j.ecss.2012.02.003
McFeeters B. J., Frost P. C. (2011). Temperature and the effects of elemental food quality on Daphnia. Freshw. Biol. 56, 1447–1455. doi: 10.1111/j.1365-2427.2011.02586.x
Møller E. F., Nielsen T. G. (2020). Borealization of Arctic zooplankton–smaller and less fat zooplankton species in Disko Bay, Western Greenland. Limnol. Oceanogr. 65, 1175–1188. doi: 10.1002/lno.11380
Murphy G. E., Romanuk T. N., Worm B. (2020). Cascading effects of climate change on plankton community structure. Ecol. Evol. 4, 2170–2181 doi: 10.1002/ece3.6055
Noh K. M., Oh J. H., Lim H. G., Song H., Kug J. S. (2024). Role of Atlantification in enhanced primary productivity in the Barents Sea. Earths. Future. 12, e2023EF003709. doi: 10.1029/2023EF003709
Omstedt A. (2024). “Plankton and Courage,” in A Philosophical View of the Ocean and Humanity (Springer, Cham). doi: 10.1007/978-3-031-64326-2_20
Oziel L., Baudena A., Ardyna M., Massicotte P., Randelhoff A., Sallée J. B., et al. (2020). Faster Atlantic currents drive poleward expansion of temperate phytoplankton in the Arctic Ocean. Nat. Commun. 11, 1–8. doi: 10.1038/s41467-020-15485-5
Peng M., Lin S., Shen Y., Peng R., Li S., Jiang X., et al. (2024). Effects of light quality on the growth, productivity, fucoxanthin accumulation, and fatty acid composition of Thalassiosira pseudonana. J. Appl. Phycol. 36, 1667–1678. doi: 10.1007/s10811-024-03245-7
Piredda R., Tomasino M. P., D’Erchia A. M., Manzari C., Pesole G., Montresor M., et al. (2017). Diversity and temporal patterns of planktonic protist assemblages at a Mediterranean Long Term Ecological Research site. FEMS Microbiol. Ecol. 93, fiw200. doi: 10.1093/femsec/fiw200
Poloczanska E., Brown C., Sydeman W., Kiessling W., Schoeman D., Moore P., et al. (2013). Global imprint of climate change on marine life. Nat. Clim. Change. 3, 919–925. doi: 10.1038/nclimate1958
Pörtner H. O., Farrell A. P. (2008). Physiology and climate change. Science 322, 690–692. doi: 10.1126/science.1163156
Power M. E. (1992). Top-down and bottom-up forces in food webs: do plants have primacy. Ecology 73, 733–746. doi: 10.2307/1940153
Premakumari R. N., Baishya C., Samei M. E., Naik M. K. (2024). A novel optimal control strategy for nutrient–phytoplankton–zooplankton model with viral infection in plankton. Commun. Nonlinear Sci. Numer Simul. 137, 108157. doi: 10.1016/j.cnsns.2024.108157
Qian C., Liu K. L., Pang M. W., Xu Z. M., Deng L. X., Liu H. B. (2023). Hypoxia and warming take sides with small marine protists: an integrated laboratory and field study. Sci. Total Environ. 882, 163568. doi: 10.1016/j.scitotenv.2023.163568
Rall B. C., Vucic-pestic O., Ehnes R. B., Emmerson M., Brose U. (2010). Temperature, predator-prey interaction strength and population stability. Global Change Biol. 16, 2145–2157. doi: 10.1111/j.1365-2486.2009.02124.x
Screen J. A., Simmonds I. (2010). The central role of diminishing sea ice in recent Arctic temperature amplification. Nature 464, 1334–1337. doi: 10.1038/nature09051
Segaran T. C., Azra M., Lananan F., Wang Y. (2023). Microbe, climate change and marine environment: Linking trends and research hotspots. Mar. Environ. Res. 189, 106015. doi: 10.1016/j.marenvres.2023.106015
Serandour B., Jan K., Novotny A., Winder M. (2023). Opportunistic vs selective feeding strategies of zooplankton under changing environmental conditions. J. Plankton Res. 45, 389–403. doi: 10.1093/plankt/fbad007
Serreze M., Barrett A., Stroeve J., Kindig D., Holland M. (2009). The emergence of surface-based Arctic amplification. Cryosphere 3, 11–19. doi: 10.5194/tc-3-11-2009
Sohrin R., Imazawa M., Fukuda H., Suzuki Y. (2010). Full-depth profiles of prokaryotes, heterotrophic nanoflagellates, and ciliates along a transect from the equatorial to the subarctic central Pacific Ocean. Deep-Sea Res. II. 57, 1537–1550. doi: 10.1016/j.dsr2.2010.02.020
Šolić M., Krstulović N., Kuspilić G., Gladan N., Bojanić N., Sestanovic S., et al. (2010). Changes in microbial food web structure in response to changed environmental trophic status: A case study of the Vranjic Basin (Adriatic Sea). Mar. Environ. Res. 70, 239–249. doi: 10.1016/j.marenvres.2010.05.007
Sommer U. (1989). Nutrient status and nutrient competition of phytoplankton in a shallow, hypertrophic lake. Limnol. Oceanogr. 34, 1162–1173. doi: 10.4319/lo.1989.34.7.1162
Spalding M., Agostini V., Rice J., Grant S. (2012). Pelagic provinces of the world: A biogeographic classification of the world’s surface pelagic waters. Ocean Coast. Manage. 60, 19–30. doi: 10.1016/j.ocecoaman.2011.12.016
Stabeno P. J., Farley-Jr E., Kachel N., Moore S., Mordy C., Napp J., et al. (2012). A comparison of the physics of the northern and southern shelves of the eastern Bering Sea and some implications for the ecosystem. Deep-Sea Res. II. 65–70, 14–30. doi: 10.1016/j.dsr2.2012.02.019
Strom S. L., Fredrickson K. A. (2008). Intense stratification leads to phytoplankton nutrient limitation and reduced microzooplankton grazing in the Southeastern Bering Sea. Deep-Sea Res. II. 55, 1761–1774. doi: 10.1016/j.dsr2.2008.04.008
Stuart-Smith R. D., Edgar G., Barrett N., Kininmonth S., Bates A. (2015). Thermal biases and vulnerability to warming in the world’s marine fauna. Nature 528, 88–92. doi: 10.1038/nature16144
Sun S., Li C. L., Cheng F. P., Jin X., Yang B. (2015). Atlas of Common Zooplankton of the Chinese Coastal Seas (Beijing: China Ocean Press).
Tagliabue A., Twining B., Barrier N., Maury O., Berger M., Bopp L. (2023). Ocean iron fertilization may amplify climate change pressures on marine animal biomass for limited climate benefit. Global Change Biol. 29, 5250–5260. doi: 10.1111/gcb.16854
Tanaka T., Rassoulzadegan F. (2002). Full-depth profile (0–2000 m) of bacteria, heterotrophic nanoflagellates and ciliates in the NW Mediterranean Sea: vertical partitioning of microbial trophic structures. Deep-Sea Res. II. 49, 2093–2107. doi: 10.1016/S0967-0645(02)00029-2
Trebilco R., Baum J. K., Salomon A. K., Dulvy N. K. (2013). Ecosystem ecology: size-based constraints on the pyramids of life. Trends Ecol. Evol. 28, 423–431. doi: 10.1016/j.tree.2013.03.008
Våge S., Thingstad T. F. (2015). Fractal hypothesis of the pelagic microbial ecosystem –can simple ecological principles lead to self-similar complexity in the pelagic microbial food web? Front. Microbiol. 6. doi: 10.3389/fmicb.2015.01357
Vázquez-Domínguez E., Vaqué D., Gasol J. M. (2007). Ocean warming enhances respiration and carbon demand of coastal microbial plankton. Global Change Biol. 13, 1327–1334. doi: 10.1111/j.1365-2486.2007.01377.x
Verberk W., Atkinson D., Hoefnagel K., Hirst A., Horne C., Siepel H. (2021). Shrinking body sizes in response to warming: explanations for the temperature–size rule with special emphasis on the role of oxygen. Biol. Rev. 96, 247–268. doi: 10.1111/brv.12653
Wang C., Li H., Xu Z., Zheng S., Hao Q., Dong Y., et al. (2020). Difference of planktonic ciliate communities of the tropical West Pacific, the Bering Sea and the Arctic Ocean. Acta Oceanol. Sin. 39, 9–17. doi: 10.1007/s13131-020-1541-0
Wang M. J., Song X. K. (2017). Atlas of biodiversity of Marine protected areas in Bohai surrounding Shandong Province: Common Plankton (Beijing: China Ocean Press).
Wang C., Wang X., Wei Y., Guo G., Li H., Wan A., et al. (2023b). Pelagic ciliate (Ciliophora) communities in the Southern Ocean: bioindicator to water mass, habitat suitability classification and potential response to global warming. Prog. Oceanogr. 216, 103081. doi: 10.1016/j.pocean.2023.103081
Wang C., Wang X., Xu Z., Luo G., Chen C., Li H., et al. (2023a). Full-depth vertical distribution of planktonic ciliates (Ciliophora) and a novel bio-index for indicating habitat suitability of tintinnid in the Arctic Ocean. Mar. Environ. Res. 186, 105924. doi: 10.1016/j.marenvres.2023.105924
Wang Y., Wu C. (2022). Rapid surface warming of the Pacific Asian Marginal Seas since the late 1990s. J. Geophys. Res-Oceans. 127, c2022JC018744. doi: 10.1029/2022JC018744
Wang C., Xu Z., Wan A., Wang X., Luo G., Bian W., et al. (2024a). Diatom bloom trigger notable variations in microzooplanktonic ciliate composition, body-size spectrum and biotic-abiotic interaction in the Arctic Ocean. Environ. Res. 252, 118821. doi: 10.1016/j.envres.2024.118821
Wang C., Yang M., He Y., Xu Z., Zhao Y., Zhang W., et al. (2022). Hydrographic feature variation caused pronounced differences of planktonic ciliate community in the Pacific Arctic Region in summer 2016 and 2019. Front. Microbiol. 13. doi: 10.3389/fmicb.2022.881048
Wang C., Zhao L., Wei Y., Xu Z., Zhao Y., Zhao Y., et al. (2023c). Insights into the structure of the pelagic microbial food web in the oligotrophic tropical Western Pacific: Examining trophic interactions and relationship with abiotic variables. Mar. pollut. Bull. 197, 115772. doi: 10.1016/j.marpolbul.2023.115772
Wang C., Zhao C., Zhou B., Xu Z., Ma J., Li H., et al. (2024b). Latitudinal pronounced variations in tintinnid (Ciliophora) community at surface waters from the South China Sea to the Yellow Sea: Oceanic-to-neritic species shift, biotic-abiotic interaction and future prediction. Sci. Total Environ. 912, 169354. doi: 10.1016/j.scitotenv.2023.169354
Ward B., Collins S., Dutkiewicz S., Gibbs S., Bown P., Ridgwell A., et al. (2019). Considering the role of adaptive evolution in models of the ocean and climate system. J. Adv. Model. Earth Syst. 11, 3343–3361. doi: 10.1029/2018MS001452
Weydmann A., Søreide J. E., Kwasniewski S., Widdicombe S. (2012). Influence of CO2-induced acidification on the reproduction of a key Arctic copepod Calanus glacialis. J. Exp. Mar. Biol. Ecol. 428, 39–42. doi: 10.1016/j.jembe.2012.06.002
Wichard T., Poulet S. A., Boulesteix A. L., Ledoux J. B., Lebreton B., Marchetti J., et al. (2008). Influence of diatoms on copepod reproduction. II. Uncorrelated effects of diatom-derived α,β,γ,δ-unsaturated aldehydes and polyunsaturated fatty acids on Calanus helgolandicus in the field. Prog. Oceanogr. 77, 30–44. doi: 10.1016/j.pocean.2008.03.002
Xu Z. L., Chen Y. Q. (1989). Aggregated intensity of dominant species of zooplankton in autumn in the East China Sea. J. Ecol. 8, 13–15.
Yasumiishi E. M., Cieciel K., Andrews A., Murphy J., Dimond J. (2020). Climate-related changes in the biomass and distribution of small pelagic fishes in the eastern Bering Sea during late summer 2002–2018. Deep-Sea Res. II. 181–182, 104907. doi: 10.1016/j.dsr2.2020.104907
Yeung K. W. Y., Zhou G. J., Hilscherová K., Giesy J. P., Leung K. M. Y. (2020). Current understanding of potential ecological risks of retinoic acids and their metabolites in aquatic environments. Environ. Int. 136, 105464. doi: 10.1016/j.envint.2020.105464
Yi M. L., Li L. Q., Li H. R., Liu C., Deng Y., Wu Z., et al. (2024). Spatiotemporal variations of plankton communities in different water bodies of the Yellow River: Structural characteristics, biogeographic patterns, environmental responses, and community assembly. J. Hydrol. 640, 131702. doi: 10.1016/j.jhydrol.2024.131702
Zhang W. C., Tao Z. C., Zhao Y., Jin X. (2019). An Illustrated Guide to Marine Planktonic Copepods in China Seas, second ed (Beijing: Science Press).
Keywords: plankton, biodiversity, trophic linkage, biotic-abiotic interplay, seasonal variations, environmental change
Citation: Zhao Y, Wang C, Wang X, Wang W, Zhang T, He J, Shi W, Shi Y, Hu Z and Zhou X (2024) Insights into the plankton community seasonal variations in a finer scale of the Bohai Sea: biodiversity, trophic linkage, and biotic-abiotic interplay. Front. Mar. Sci. 11:1498869. doi: 10.3389/fmars.2024.1498869
Received: 19 September 2024; Accepted: 30 September 2024;
Published: 16 October 2024.
Edited by:
Shuping Wang, Chinese Research Academy of Environmental Sciences, ChinaReviewed by:
Weiwei Liu, Chinese Academy of Sciences (CAS), ChinaShujin Guo, Chinese Academy of Sciences (CAS), China
Copyright © 2024 Zhao, Wang, Wang, Wang, Zhang, He, Shi, Shi, Hu and Zhou. This is an open-access article distributed under the terms of the Creative Commons Attribution License (CC BY). The use, distribution or reproduction in other forums is permitted, provided the original author(s) and the copyright owner(s) are credited and that the original publication in this journal is cited, in accordance with accepted academic practice. No use, distribution or reproduction is permitted which does not comply with these terms.
*Correspondence: Chaofeng Wang, d2FuZ2NoYW9mZW5nQGZhZnUuZWR1LmNu