 Yang Dong1,2
 Ren Wang1,2*
 Jinqiang Liang3Yulin He3Jinfeng Ren3Wanzhong Shi1,2Xiaosong Wei1,2Hao Du1,2Xiangyang Xie4Arthur B. Busbey4
- 1Key Laboratory of Tectonics and Petroleum Resources, Ministry of Education, China University of Geosciences, Wuhan, China
- 2School of Earth Resources, China University of Geosciences, Wuhan, China
- 3Guangzhou Marine Geological Survey, China Geological Survey, Guangzhou, China
- 4Department of Geological Sciences, Texas Christian University, Fort Worth, TX, United States
Introduction: Milankovitch theory has extensive application in sequence stratigraphy and the establishment of time scales. However, it is rarely applied to shallow strata rich in hydrates. Cyclostratigraphic analysis of the Quaternary unconsolidated sediments can help identify climate and sea level changes that correspond to orbital cycles and improve our understanding of the dynamic evolution of hydrates.
Methods: Using the natural gamma-ray log data from the deepwater area well W01 in the Qiongdongnan Basin, Milankovitch cycle analysis was conducted to identify the primary astronomical period in W01. Anchored to existing AMS-14 C age from bivalve shell as reference point, an astronomical age scale of W01 was established. Simultaneously, through the analyses of major trace elements and total organic carbon content (TOC) in sediment samples, how astronomical orbital cycles influenced past environmental conditions. Furthermore, employing sedimentary noise models, the relative sea level change of well W01 was reconstructed.
Results: Sedimentary cycles of 27.34 m and 6.73 m were identified in the GR data from well W01, corresponding to orbital periods of 405 kyr and 100 kyr eccentricity, with a duration of approximately 2.5 Myr. The spectral analysis of paleoenvironmental proxies reveals a sedimentary cycle of approximately 27 m, while the sedimentary noise model reconstructs the fluctuating rise in sea level change. An obliquity modulation period of approximately 170 kyr was identified in the TOC data, which may reflect the combined effects of obliquity and other orbital parameters.
Discussion: Spectral analysis of paleoenvironmental indicators showed that long eccentricity cycle had varying degrees of influence on changes in paleoclimate, paleosalinity, and paleoredox conditions. Additionally, a 1.2 Myr cycle was identified as a significant factor influencing sea level changes during the early Pleistocene in the South China Sea (SCS). In addition, it is confirmed that the dominant period of the glacial-interglacial cycle in the SCS from 0.6 Ma to the present is 100 kyr period. Synthesize the above analysis, during phases of low amplitude in the 405 kyr cycle or minimum value of the 100 kyr cycle, which are associated with lower temperature, conditions become more conducive to hydrate accumulation.
1 Introduction
Gas hydrates are considered to be a potential clean and sustainable energy resource. However, their exploitation poses significant challenges due to technical difficulties and environmental concerns. It has been detected in marine regions globally, influencing global climate change, carbon cycling, and contributing large-scale seafloor landslides (Yu et al., 2019; Wei et al., 2022; Zhang et al., 2012; Song et al., 2019). The stability of gas hydrates depends on temperature and water pressure, and their dynamic conversion is driven by these variations (Song, 2003). Increased seawater temperature or the decrease in pressure due to sea-level descent leads to the decomposition of hydrates. Methane formed by the dissociation of gas hydrates, as a greenhouse gas, plays a role in the microbial sulfate reduction (MSR) promoting carbon sequestration, which in turn impacts climate change and the global carbon cycle (Liu X. T. et al., 2024). Research indicates the pivotal role of Milankovitch cycles in the evolution of gas hydrate formation and decomposition (Liu et al., 2016). The sedimentary response of Milankovitch cycles has indicated that paleoclimate and sea level changes are modulated by orbital cycles (Zachos et al., 2001b; Li H. Z. et al., 2023). Majorowicz et al. (2012) conducted a digital simulation of gas hydrate formation and decomposition in the Mackenzie Delta region, focusing on the 41ka and 100ka cycles of paleowater temperature changes since 5.5Ma. Their findings suggested that most gas hydrate accumulation in basins formed simultaneously with in situ accumulation of conventional natural gas converted in situ at the beginning of the 100ka cycle (Majorowicz et al., 2012). This case demonstrated that the changes in upper and lower boundary changes of the gas hydrate demonstrated the cyclicity of 41ka since 3Myr, proving that the dynamic accumulation of gas hydrate is affected by orbital cycles. Thus, studying Milankovitch cycles facilitates the understanding of the dynamic evolution of gas hydrate accumulation.
Milankovitch theory examines the relationship between insolation and Earth’s climate on a global scale and reveals the corresponding relationship between sedimentary cycles and climate change at different scales (Milankovitch, 1948; Lin et al., 2023). Periodic changes in the Earth’s orbital parameters (i.e., eccentricity, obliquity and precession) can induce climatic changes, indirectly affecting accommodation space within basins (Wu et al., 2011). Recognizing the potential of astronomical cycles in stratigraphy research, scholars have conducted studies on strata of different ages and have achieved relatively significant results (Gong et al., 2004; Tian et al., 2005; Wu and Liu, 2015; Shi et al., 2019; Ma et al., 2023). Sun and Mao conducted high-frequency sequence division on the stratigraphy of the Dongying Sag and Qiongdongnan Basin (QDNB), introducing a new and effective method for constructing a correlative framework of high-resolution sequences (Sun et al., 2017; Mao et al., 2012). However, research on cyclostratigraphy records in the shallow layers of the SCS is still lacking, and the environmental response mechanisms remain unclear. Other shallow sea setting also lack adequate stratigraphic records of cycles.
Currently, investigations of gas hydrates in the SCS are still in the regional survey stage. Significant breakthroughs in understanding the mechanisms of hydrate accumulation and patterns of enrichment have not yet occurred. Meanwhile, the scale of mineralization and the distribution characteristics of gas hydrate beds in exploration areas remains unclear (Su et al., 2022). Engaging in studies on Milankovitch cycles and establishing an astronomical time scale (AST), along with utilizing major trace elements to explore the response of paleoclimate and sea level changes to these cycles, can serve as valuable references for predicting the distribution and understanding the dynamic evolution of gas hydrates in shallow sea settings. This study intends to conduct cyclostratigraphic analysis in the QDNB and establish an AST. Following this, based on the analysis of paleoenvironment and sea level changes, the relationship between gas hydrates and orbital cycles will be elucidated.
2 Background and data
Since the late Cretaceous, the Northern SCS continental margin experienced multiple phases of lacunae and the development of several Tertiary basins, including the progression of Beibu Gulf from the west to the east, followed by the Yinggehai Basin, QDNB, Pearl River Mouth Basin (Shi et al., 2017). Among these, the QDNB, located in the northern part of the SCS, is bordered by the Yinggehai Basin to the west and contiguous with the Shenhu Uplift to its eastern side. The basin is linked to the Yongle Uplift in the south and separated from Hainan Island by the sea to the north (Figure 1) (Gan et al., 2019; Wang et al., 2011). The basin consists of four tectonic belts, the Northern Depression, the Central Uplift, the Central Depression and the Southern Uplift (Figure 1) (Li et al., 2013; Ma et al., 2022). Previous exploration data indicate that the QDNB displays a typical ‘rift-sag’ structural configuration, reflecting two main tectonic phases in its evolution: an early rifting stage and a subsequent post-rift thermal subsidence phase (Xu, 2023; Yan et al., 2005). During the rifting stage of QDNB, influenced by the SCS expansion and compression from the Indochina Plate, the basin underwent two phases of extension, the Early Oligocene extension and the Late Oligocene extension. Intense extensional activity resulted in the formation of multiple sets of primary basement faults, controlling sedimentation and establishing the fundamental uplift-depression pattern of QDNB. Around 21 Ma, the expansion of the SCS largely ceased, marking the transition of the QDNB into a sag stage. During the sag stage, the QDNB was largely in a tectonically quiescent period. However, the post-rift phase was influenced by superimposed tectonic events, with relatively active tectonic and magmatic activities occurring in the Late Miocene (Du, 2022; Xu, 2023).
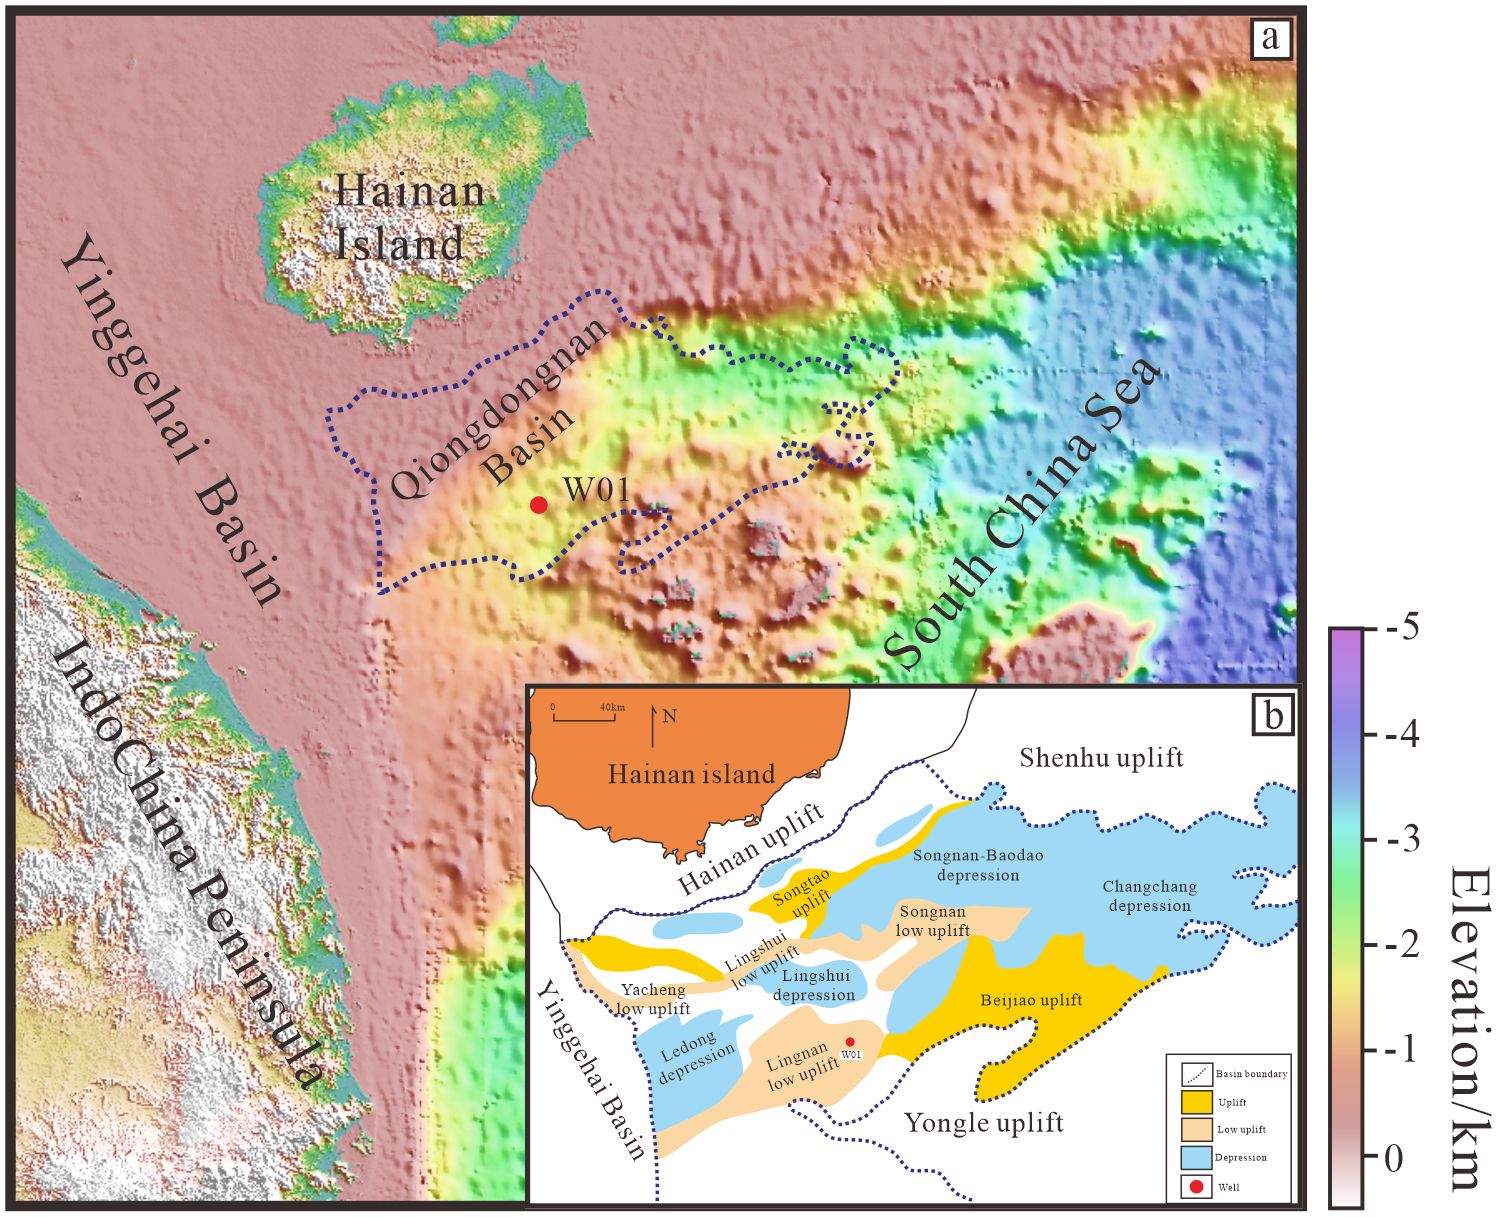
Figure 1. Regional topographic structure map of SCS. (A) The location of the Qiongdongnan Basin in the northern SCS. Qiongdongnan Basin location is marked with blue dotted line. (B) Geographical location and tectonic belts of the Qiongdongnan Basin. Basin structure data from Wang, 2022; Du et al., 2024.
Starting from the Oligocene, the Yacheng, Lingshui, Sanya, Meishan, Huangliu, Yinggehai and Ledong Formation were deposited successively (Figure 2) (Wei et al., 2001; Yuan et al., 2008). Since the Oligocene, the QDNB has progressively transitioned from a meso-deep lacustrine depositional environment to littoral-shallow marine and restricted marine settings, initiating the deposition of marine strata. During the Miocene, marine transgression expanded, leading to the onset of hemipelagic sedimentation. The Ledong Formation of the Quaternary largely exhibits a typical shelf-slope depositional system, predominantly characterized by deep-sea to hemipelagic facies (Zhu et al., 2015; Du et al., 2021). In this study, we mainly focus on the Yinggehai and Ledong Formations. The Yinggehai Formation primarily consists of extensive mudstones deposited in a shallow to moderately deep marine setting. The Ledong Formation is mainly composed of light gray and greenish-gray clay strata, intermingled with thin sandstones and abundant bioclasts, along with unconsolidated rocks, and large number of mass transport deposits (MTDs) were found simultaneously (Wu, 2023; Liang et al., 2019).
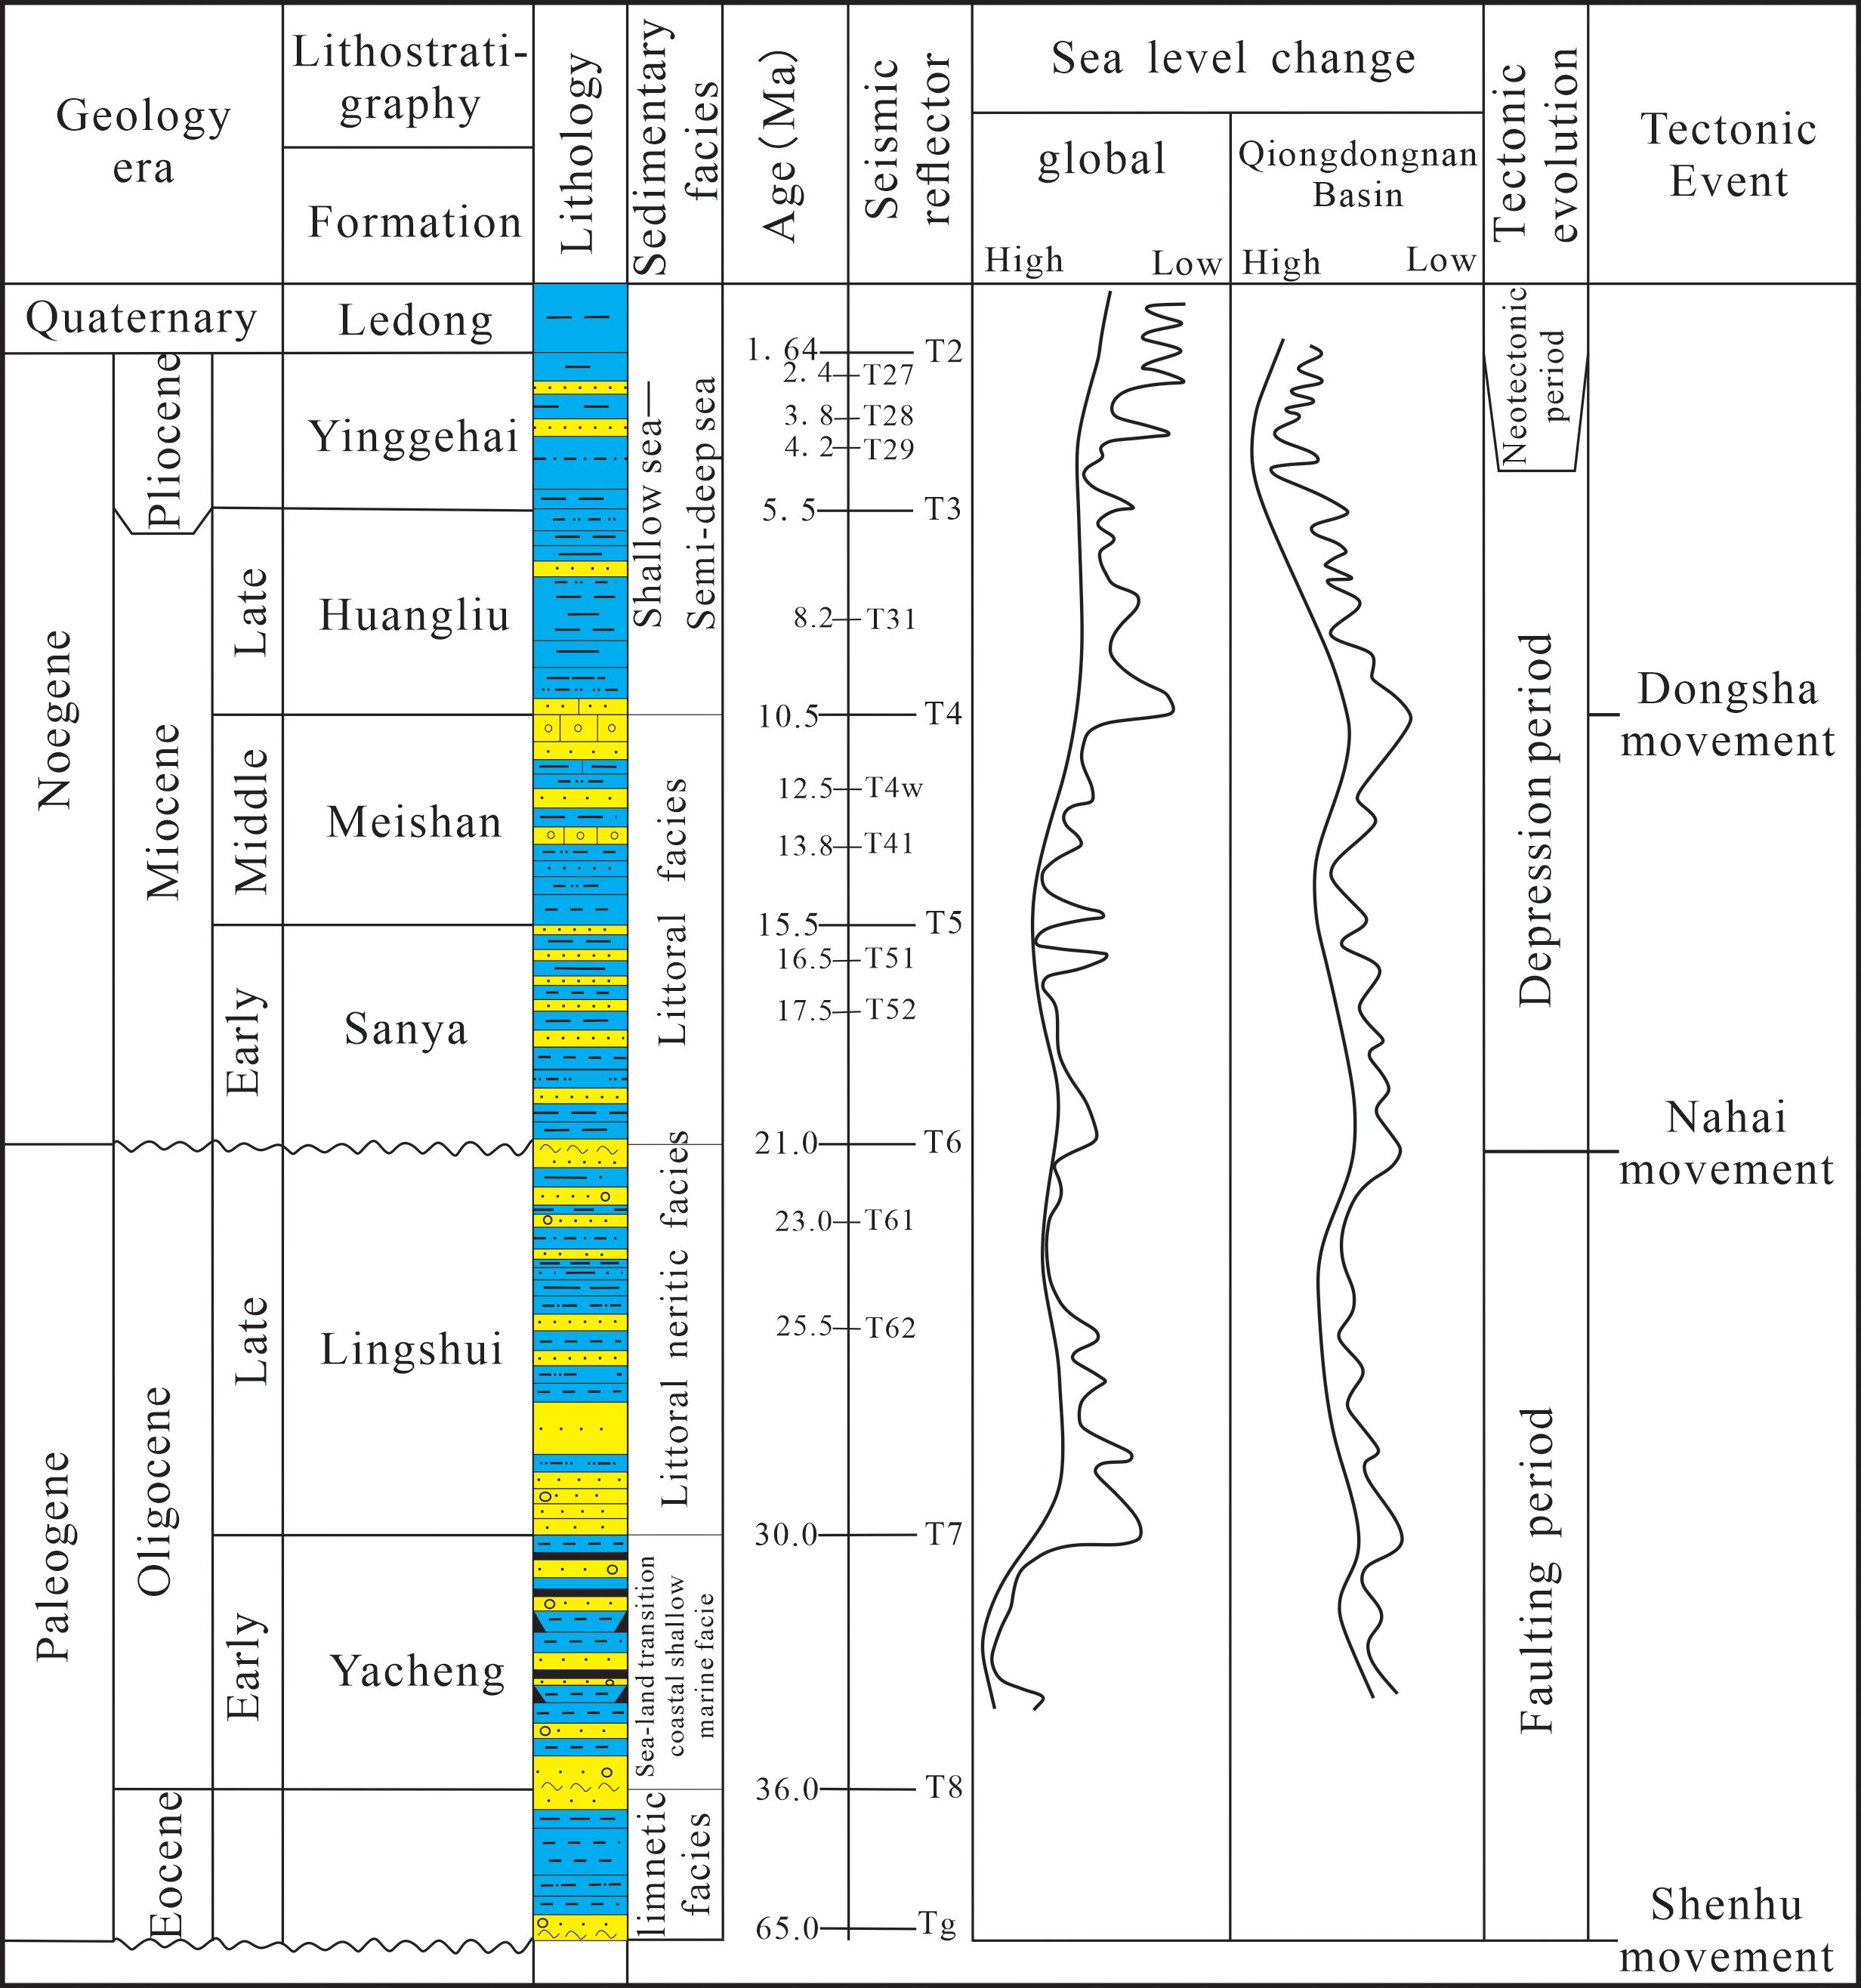
Figure 2. Schematic stratigraphy of the Qiongdongnan Basin, showing the sequence classification, lithologies, depositional environments, relative changes in sea level and tectonic stages in the Cenozoic (modified from Wei et al., 2001; Wu, 2023).
Numerous hydrate drilling expeditions have been conducted in the northern SCS, resulting in the discovery of several significant hydrate deposits (Wu et al., 2013). In the past years, hydrate production tests in QDNB have also achieved substantial breakthroughs (Liang et al., 2019), and the Ledong formation (Quaternary strata) is the main gas hydrate reservoir (Lai et al., 2021; Meng et al., 2021). The majority of the samples obtained from unconsolidated sediments within the stable zone of the seafloor characterized by relatively high porosity and permeability, hydrates reservoirs are primarily composed of clayey loose sediments and interbedded with thin layers of sandy deposits (Xu et al., 2021). There are multiple types of gas hydrates are present, mainly distributed in the silty clay, sandy hydrates have even been found (Liang et al., 2019; Wei et al., 2019). The basin contains multiples sets of source rocks capable of supplying gas for hydrate accumulation, ensuring abundant gas source conditions, gas chimney and numerous faults provide efficient migration pathways for gas (Zhang W. et al., 2017; Zhou et al., 2019; Xu et al., 2021; Zuo et al., 2022). In addition, the potential sandy submarine fan reservoirs and the developed MTDs cap layers in the Ledong Formation also create favorable conditions for the enrichment of hydrates (Fang et al., 2022).
The well W01 is located in the Lingnan low uplift with a water depth exceeding 1500m, thus minimizing the impact of sea surface conditions on the seabed deposition. Log data from well W01 indicate stable mud or silt-bearing mud deposits (Figure 3). Gas hydrates are generally found in sediments within 0-300 meters below the sea floor (mbsf), mainly in the Ledong Formation (Du et al., 2024). From the well logging data of well W01, criteria such as decreased acoustic transit time, increased resistivity, and reduced porosity have been utilized to delineate potential zones of gas hydrates within the studied stratigraphic interval (Ning et al., 2020) (Figure 3). An active cold seep ecosystem was identified by ROV investigations and outcrop observations at the site W01, characterized by abundant cold seep fauna and authigenic carbonates, indicating significant methane leakage activity at this location (Figure 3). The W01 is situated at the top of the gas chimney, through which deeper hydrocarbon gases migrate toward the shallow subsurface (Deng et al., 2023). Methane generated by the dissociations of gas hydrates is transported through leakage pathways to the seafloor, providing the material basis for the cold seep ecosystem (He et al., 2022; Deng et al., 2023). The W01 encountered two sets of hydrate reservoirs, at depth of 5.2-43.2mbsf and 52.2-118.2mbsf, primarily consisting of massive and patchy. A sandy reservoir at 56-64mbsf developed pore-filling hydrates, with a high saturation of up to 80%. The W01 developed multiple MTDs, which effectively block vertical migration, allowing gas to migrate along lateral direction, thus promoting hydrate formation (He et al., 2022; Meng et al., 2021). The thick top authigenic carbonate layer also as a cap rock, sealing the underlying silty hydrate deposits (Luo and Cao, 2023).
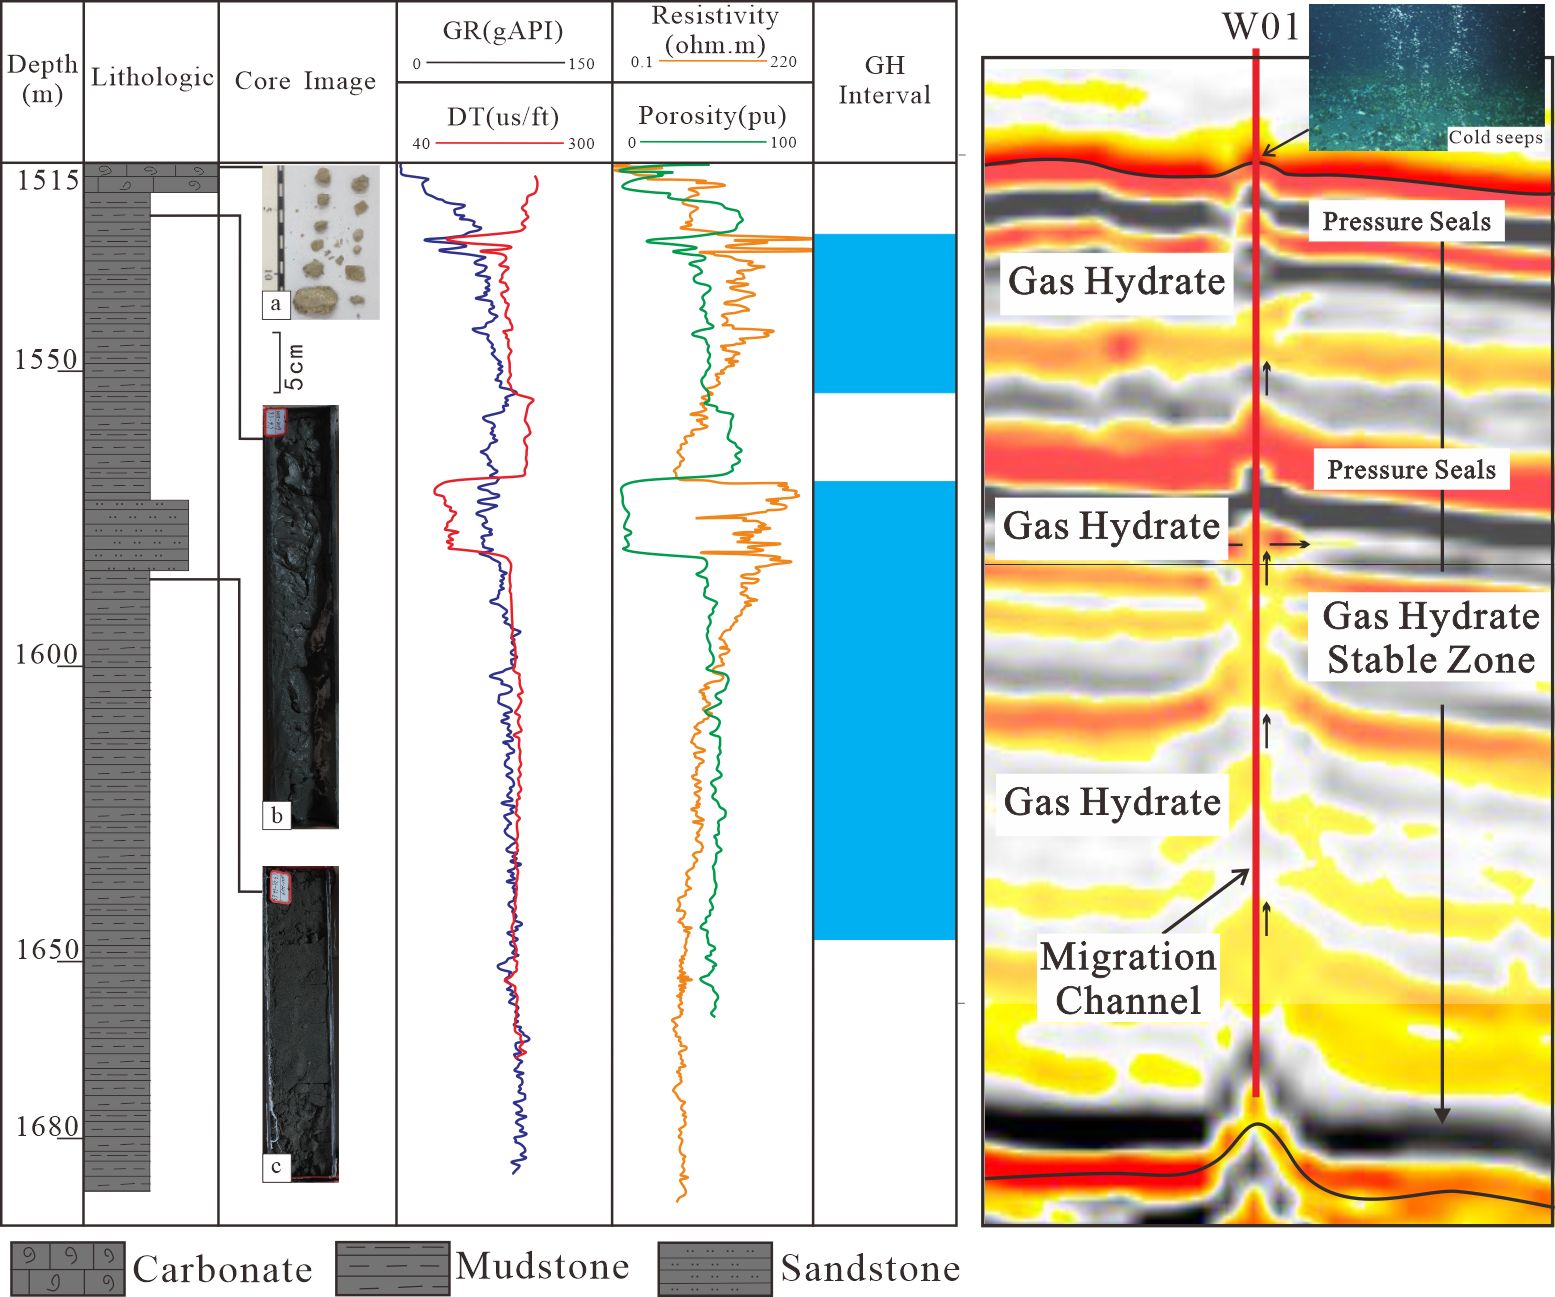
Figure 3. Well 01 Logging Lithology Description. The lithology is predominantly shale, and core images shows carbonate rock, low-saturation gas hydrate shale, and high-saturation gas hydrate shale in sequence. The possible gas hydrate intervals are identified based on logging curves (part of the core images are from Zhang et al., 2023; cold seep image from He et al., 2022).
Natural gamma ray log data are primarily selected for conducting cyclostratigraphic analysis in this study. It is crucial to select various geophysical and geochemical parameters from stratigraphic records that reflect past climate changes as proxy indicators for identifying Milankovitch cycles (Wu et al., 2011). Well log data, characterized by continuous and high-resolution sampling, are often utilized as ideal data for analyzing these cycles due to their advantageous properties. Natural gamma ray logs are particularly sensitive to changes in lithology and facies, such as distinguishing between sedimentary mud and sandstone, effectively reflecting their variations with depth and changes in depositional environments and paleoclimate (Peng et al., 2022; Gao et al., 2022). Consequently, natural gamma ray log data have been extensively employed in reconstructing paleoenvironments and paleoclimates, with broad application in astrochronological research.
3 Methods
3.1 Element test method
3.1.1 Major and trace element
Elemental analyses were conducted on 33 samples from well W01, collected at depths ranging from 1515 to 1675 meters using a non-uniform sampling approach. The samples were obtained from marine geological survey conducted by the Guangzhou Marine Geological Survey Bureau in the QDNB in GMGS6 during the physical drilling and recovery of gas hydrate cores. Major oxides and trace element concentrations were determined using ICP-OES. All samples underwent deorganic matter and decarbonate treatment. The sediment was rinsed three times with deionized water, dried at 80°C, and ground into powder. A hydrofluoric acid-nitric acid-perchloric acid dissolution system was employed to remove fluorine ions, preparing a sample solution with a hydrochloric acid concentration of 2% (volume fraction) and a sample concentration of 1 mg/cm3. Using predetermined measurement conditions, spectra were acquired, developed, and fixed. The net blackness value of each spectral line was measured against standard curves to determine the elemental content (National Bureau of Technical Supervision, 2007). The measurements were conducted at the Guangzhou Marine Geological Survey Bureau, with specific calculated values provided in Appendix Tables 1 and 2.
3.1.2 Total organic carbon
Samples were dried and ground into powder. Approximately 10-20 mg of each sample was weighted to determine TOC data using the CHN elemental analyzer. Subsequently, weighted 50-100mg of each sample and placed in a 20ml glass bottle, and an excess of carbon-free standard HCl was added to the bottles. The acidified samples were shaken for 5 minutes, placed in an ultrasonic water bath and then dried in an oven overnight at 50°C. After removal from the oven, the samples were allowed to equilibrate in ambient air for 24 hours until weight stabilization, and the final mass was recorded. Then, the samples were ground and homogenized, and quantitative samples were weighed. Finally, the organic carbon content was determined using the CHN elemental analyzer.
3.2 Cyclostratigraphic research methods
3.2.1 Spectral analysis
Spectral analysis is crucial for identifying Milankovitch cycles recorded in sediments. This involves enhancing the signal intensity of the time series, transforming it into a function of frequency, and identifying the periodic components (Wu et al., 2011). Initially, natural gamma radiation (GR) data were preprocessed to create a unified series, including interpolation, removal of outliers, and detrending. Then, the 2π Multi-Taper Method (MTM) was employed to analyze the detrended GR series, converting depth domain signals to frequency domain signals and identifying cyclic signals within the data (Thomson, 1982). Compared to the traditional periodogram method, the MTM exhibits less deviation and variance, making it an energy spectral analysis method with low variance and high resolution (Jiang et al., 2001). In addition, evolutionary Fast Fourier Transform (eFFT) was used to delineate the variation in sedimentary cycles with changes in depth and time. This approach can reveal the variation characteristics of different wavelength bands across both depth and frequency domains, as well as changes in sedimentation rates (Huang, 2014). The correlation coefficient (COCO) and evolutionary correlation coefficient (eCOCO) functions was applied to track changes in sedimentation rates (Li et al., 2018a).
3.2.2 Astronomical tuning
Astronomical tuning is a key component in cyclostratigraphy for establishing an astronomical chronology. Through this process, a high-precision, continuous AST can be developed, thus offering a new approach to geochronology (Huang, 2014). This primarily refers to the direct calibration of proxy indicators of ancient climate change onto theoretical target curves representing orbital eccentricity, obliquity, precession, or insolation. Due to variations in sedimentation rates, the thicknesses of these layers may be stretched or condensed. However, the durations they represent should remain constant. Based on this principle, a chronological model can be established, allows the conversion of the data sequence from the depth domain to the time domain. Subsequently, through iterative refinement, a more reasonable AST can be developed. For Cenozoic strata, filtered curves can be directly compared with theoretical target curves derived by Laskar, thus enabling the establishment of an astronomical tuning scale via astronomical tuning (Laskar et al., 2004). However, for Mesozoic or older strata, only a “floating” AST can be established through this method. If absolute ages exist within the studied intervals, they can serve as anchor points to convert the floating astrochronology into a high-precision, continuous absolute timescale (Huang, 2014).
3.2.3 Astronomical parameters
Milankovitch cycles represent rhythmic changes in Sun-Earth orbital parameters, reflecting variations in the astronomical orbital forcing. Consequently, their distribution is isochronous, and the proportion of each period remains relatively stable within a certain geological time interval, reflecting changes in sedimentary structure, tectonic and thickness (Huang, 2014; Zhang T. et al., 2017). Berger and Laskar proposed various methods to calculate Sun-Earth orbital (Berger et al., 1989; Laskar et al., 2004). Among them, Laskar’s scheme accounts for the influencing factors of the Earth-Moon interaction, making it one of the most recognized schemes among scholars. In this study, the scheme devised by Laskar was employed to calculate theoretical variations in eccentricity, obliquity and precession during the 0-10Ma summer solstice at 17° north latitude (Figure 4). The analysis identified five eccentricity periods (405 kyr, 130 kyr, 125 kyr, 100 kyr and 95 kyr), two obliquity periods (53.4 kyr and 41 kyr), and three precession periods (23.6 kyr, 22.3 kyr and 19 kyr), which were used to identify the Milankovitch cycle within the target interval. When the sedimentary cycle thickness extracted from the stratum shows a certain proportional relationship that matches the proportional of the theoretical orbital period, it is considered that the stratum was driven by the astronomical period (Huang, 2014; Wu et al., 2011). However, when determining astronomical cycles based on the proportional relationship, the error between the proportion of thickness and the theoretical period should be controlled within 5% (Jin et al., 1999).
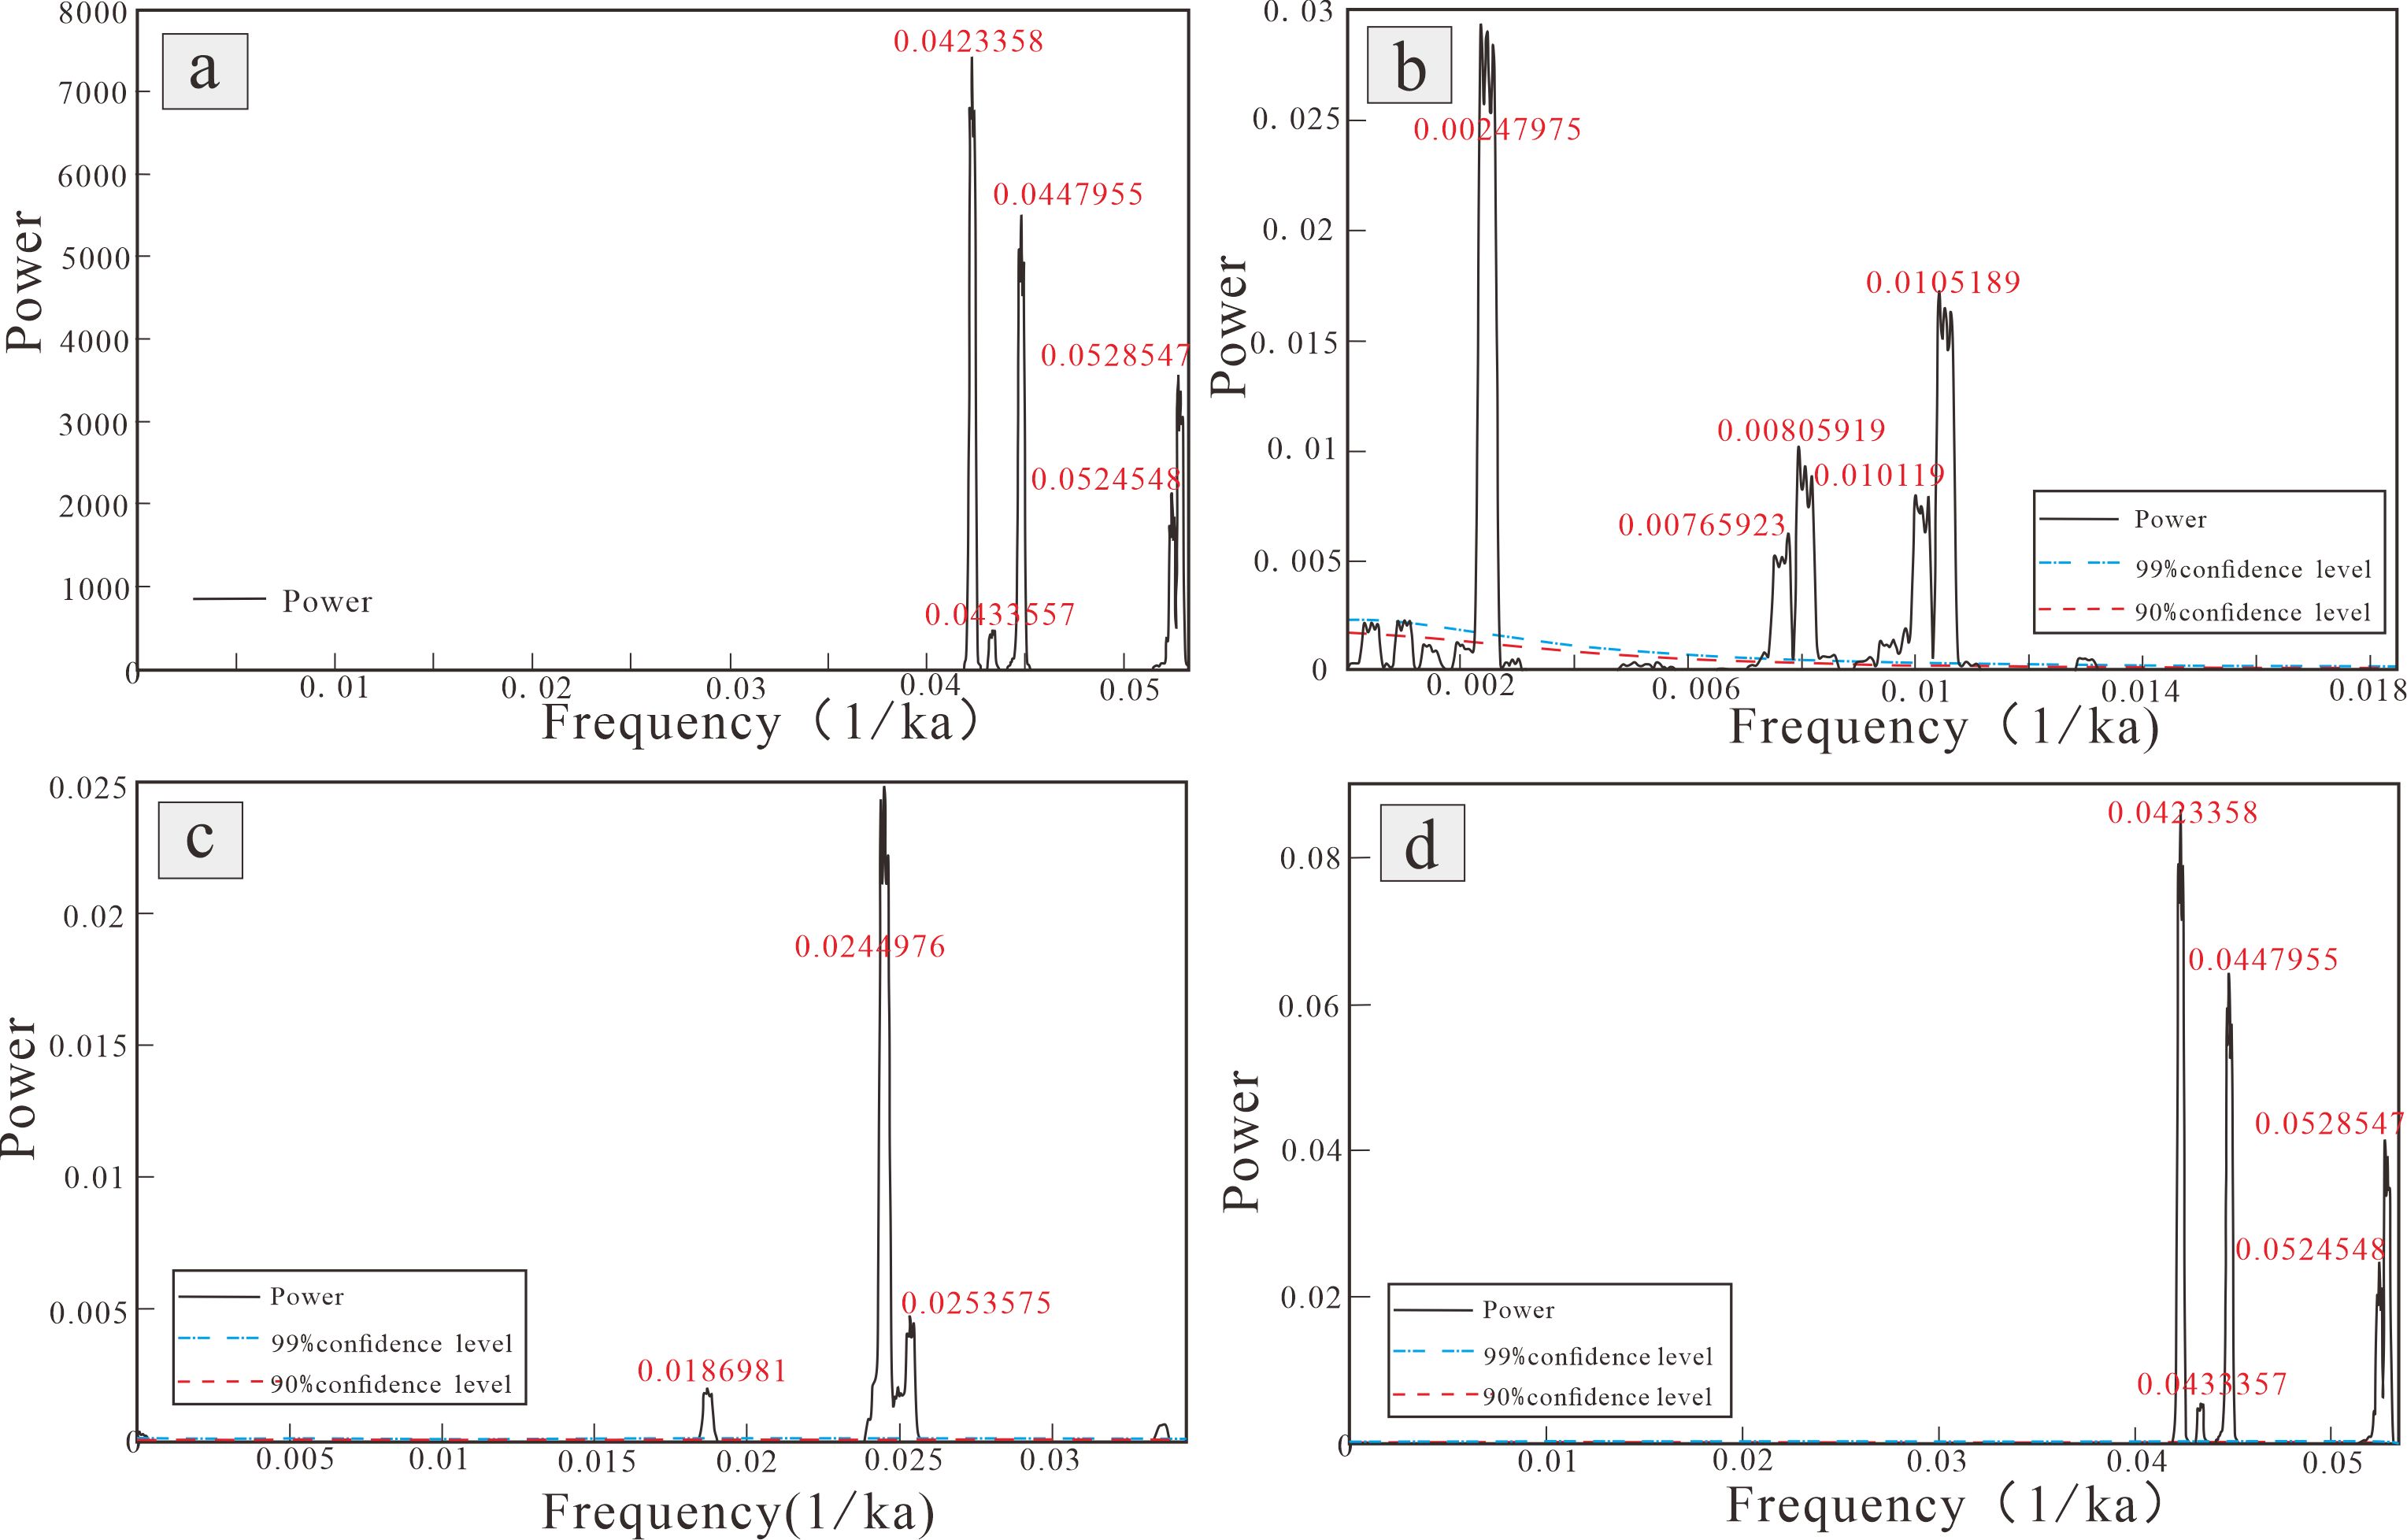
Figure 4. Spectral analysis of theoretical astronomical period parameters in 0-10Ma. (A) Insolation. (B) Eccentricity. (C) Obliquity. (D) precession. The eccentricity period of 405,130, 125, 100, 95kyr, the obliquity period of 53.4 and 41kyr, and the precession period of 23.6, 22.3 and 19kyr are clearly identified.
3.3 Sedimentary noise model
Li proposed sedimentary noise models based on astronomical cycle theory and time series analysis methods, aimed at reconstructing ancient marine and lake levels (Li et al., 2018b). The alternative indicators measured within sedimentary rocks serve as proxies of ancient climate and sea level variations, encompassing both signals and noise. These components account for disturbances from storms, tides, and biological factors, as well as measurement errors and other noise sources, which render the signals more complex and introduce noise related to astronomical orbital forcing (Hinnov, 2013; Mudelsee, 2010). The recorded relative intensity of sedimentary noise in the geological formation exhibits a negative correlation with paleowater depth. As paleowater depth increases, sedimentary noise decreases, and vice versa.
The dynamic noise after orbital tuning (DYNOT) model, based on climate proxy records, is employed to determine sea-level changes driven by astronomical forcings (Li et al., 2018b). DYNOT values are computed as the ratio of the variance of the non-orbit signal to the total variance with a sliding time window of measurement noise, with higher DYNOT values observed during periods of relatively low sea levels. The ρ1 model complements the DYNOT model, serving as the second independent noise indicator for relative sea level change (Li et al., 2018b). Climate change tends to incorporate previous values over a range of timescales, known as autocorrelation or persistence, with the lag-1 autocorrelation coefficient being the most widely used measure (Meyers and Hinnov, 2010; Mudelsee et al., 2014). The increase in noise with decreasing relative sea level leads to a decrease in ρ1 values. Both models were simultaneously applied in this study to reconstruct the sea level change trend of the research interval.
4 Results
4.1 Milankovitch cycle records
MTM spectral analysis results indicate that the primary sedimentary cycle thickness in well W01 are mainly 27.34 m, 6.73 m, 2.90 m, 1.94 m, 1.43 m and 1.29 m, all surpassing the 95% confidence level. Additionally, the eFFT spectral exhibits the wavelength of 27.34m has a relatively strong signal throughout the entire section (Figure 5A). The proportional relationship among 27.34, 6.73, 2.90, 1.29 is 21.32: 5.26: 2.18: 1, similar to the theoretical astronomical orbital period proportion of 405 kyr: 100 kyr:41 kyr: 19 kyr in the 0-10Ma, with proportion errors all less than 5%. The error proportion for the long eccentricity is even less than 0.2%, indicating that the aforementioned astronomical cycles are present within the studied profile.
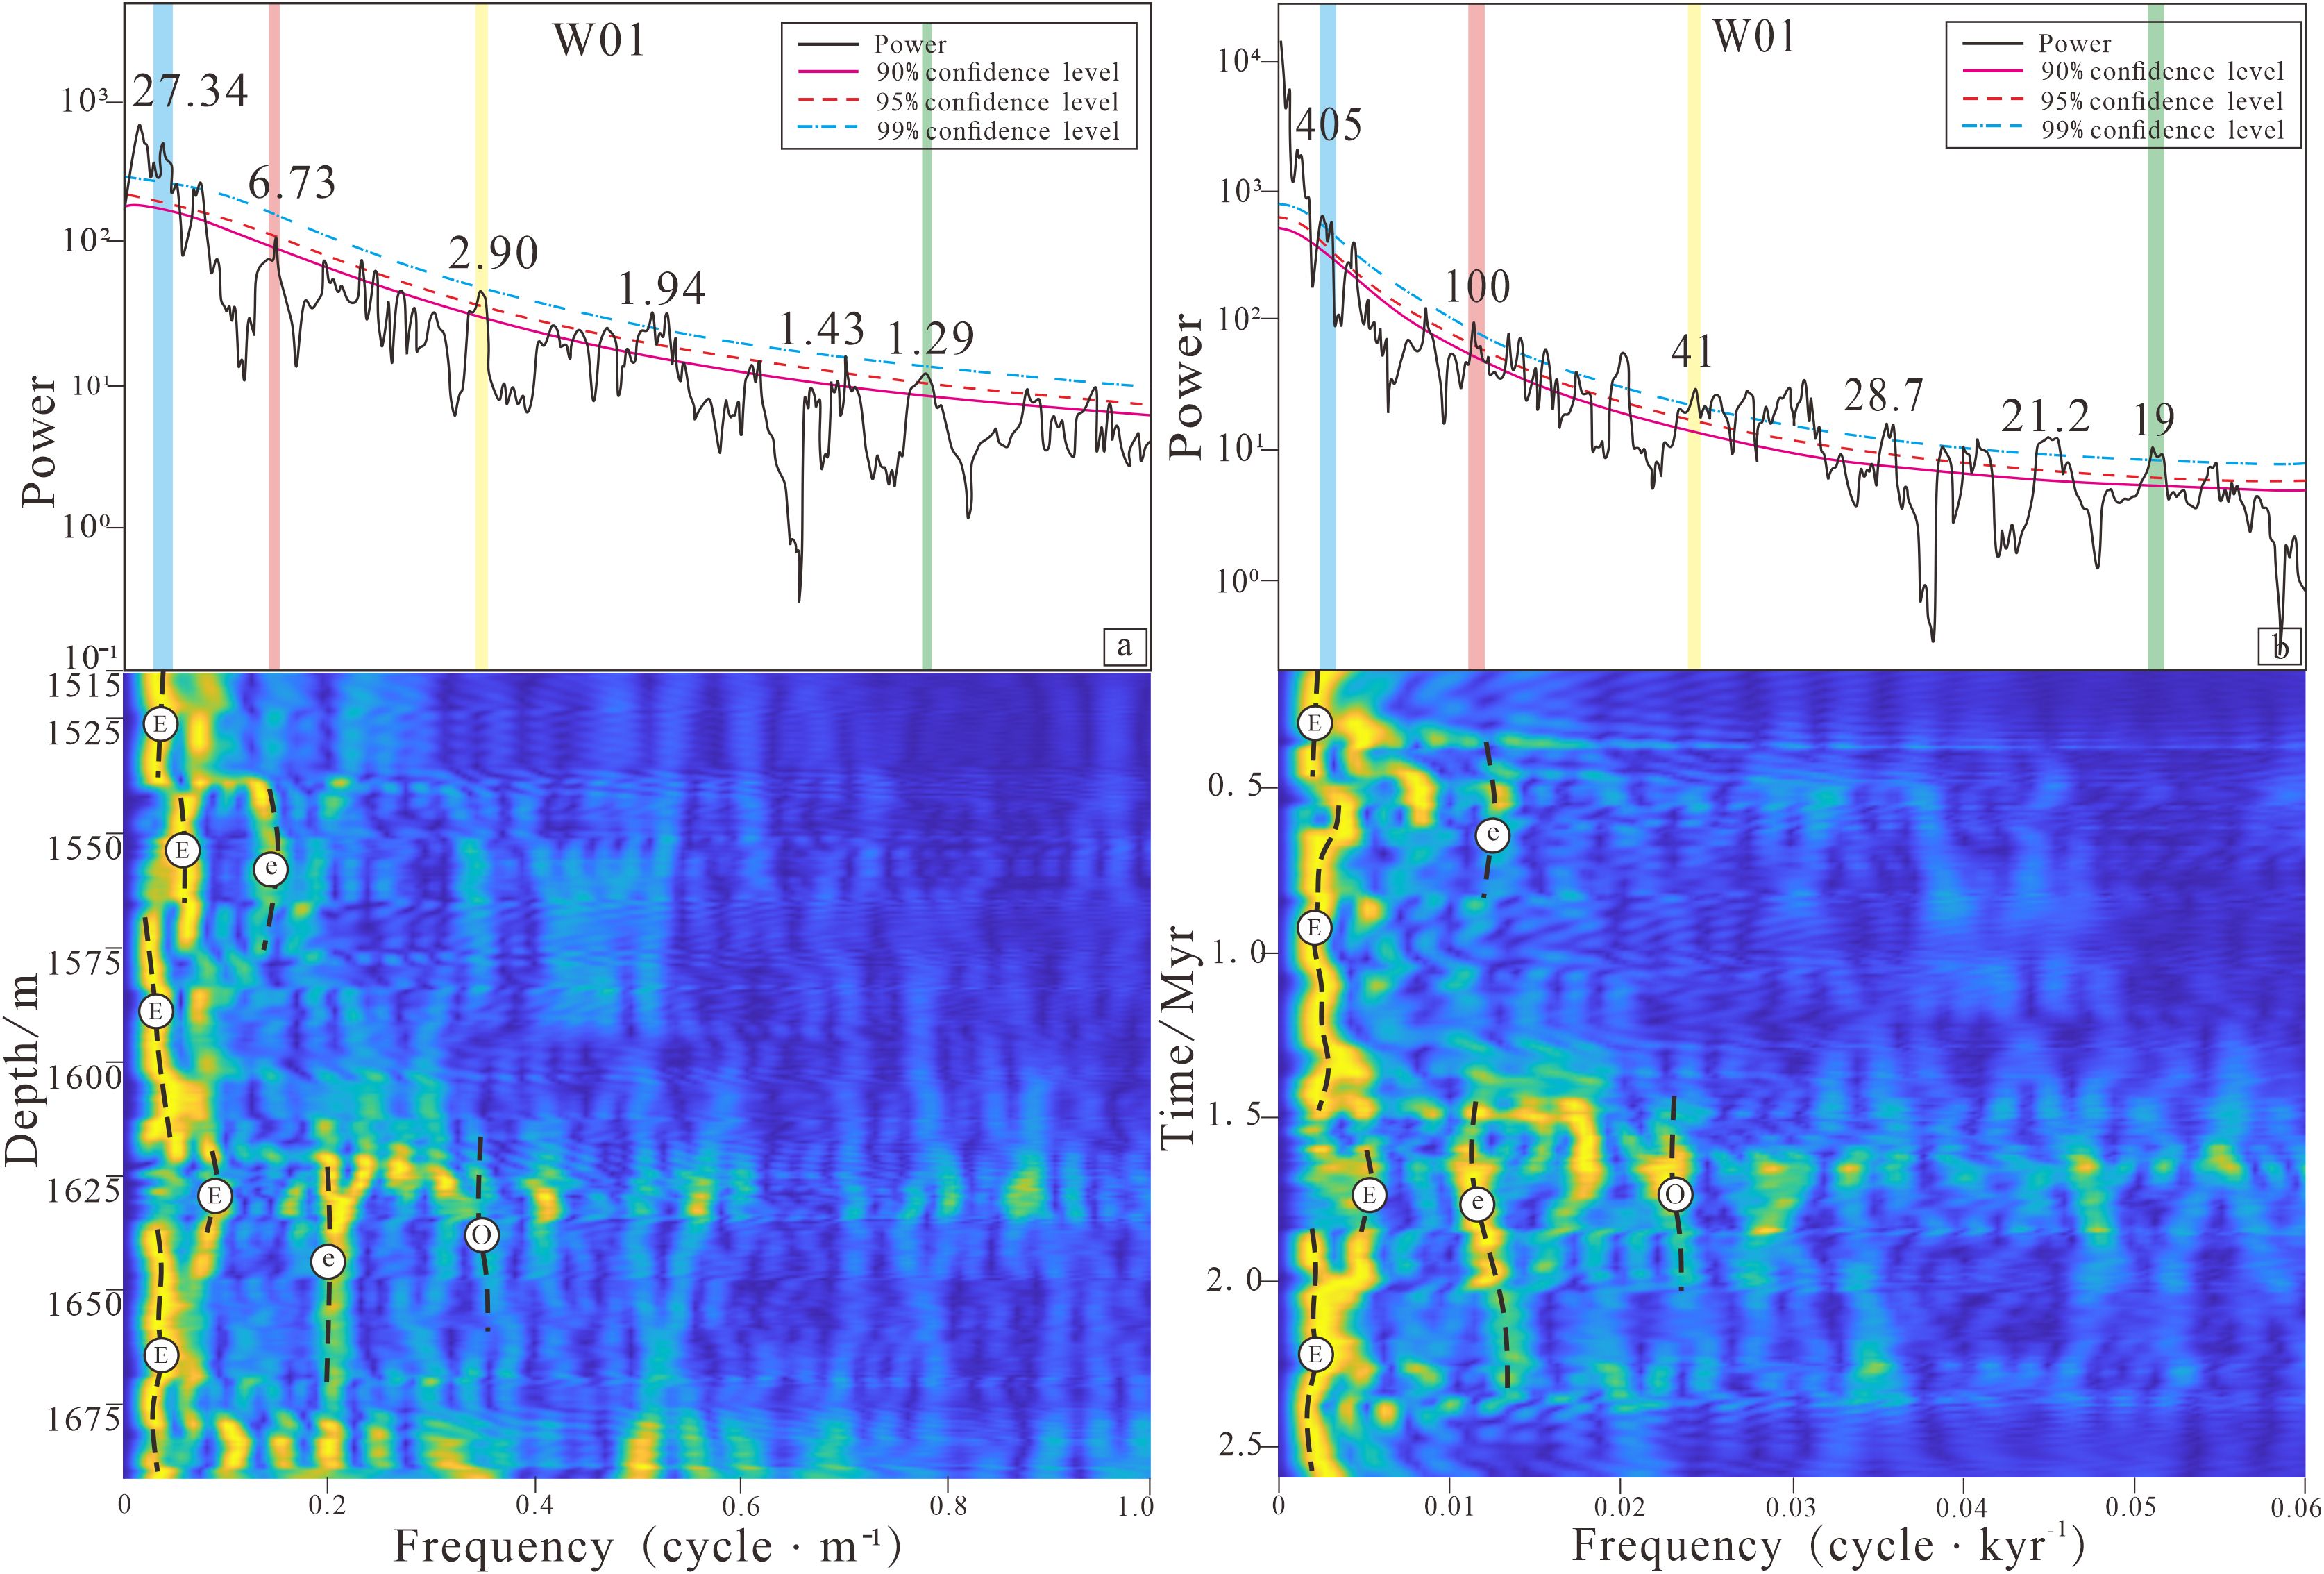
Figure 5. MTM spectral analysis and eFFT of GR data results in well W01. Detrending was performed using the LOWESS method with span length of 60m. (A) Depth domain; using a 40m running window with a 0.1m step; (B) Time domain; showing primary astronomical period of 405 kyr, 100kyr, 41kyr, 28.7kyr,21.2kyr and 19kyr, using a 500 kyr running window with a 4 kyr step.
COCO and eCOCO analyses were conducted on well W01, reveals three optimal sedimentation rates: 3.625, 5.25 and 6.75 cm/kyr. Given that the majority of sedimentation rates in the eCOCO spectra average around 7 cm/kyr, the optimal average sedimentation rate for well W01 is determined to be 6.75 cm/kyr, corresponding to 7 orbital cycles and suggesting a robust preservation of orbital cycle signals in the stratigraphy (Figure 6). The sedimentation rates in the studied section shows little variation, indicating both the provenance input and sedimentary environment remained relatively stable (Figure 6). At this sedimentation rate, the duration of sedimentary cycles measuring 27.34 m, 6.73 m, 2.90 m and 1.29 m correspond approximately to 405 kyr, 99.7 kyr, 42.9 kyr, 19.1kyr. Since the 405 kyr long eccentricity cycle remains stable throughout geological history, the 27.34 m sedimentary cycle in well W01 should represent the 405kyr long eccentricity period. The 6.73 m sedimentary cycles are associated with the 100kyr short eccentricity period, while the 2.90 m and the 1.61 m sedimentary cycles correspond to the 41kyr obliquity period and 19kyr precession period respectively.
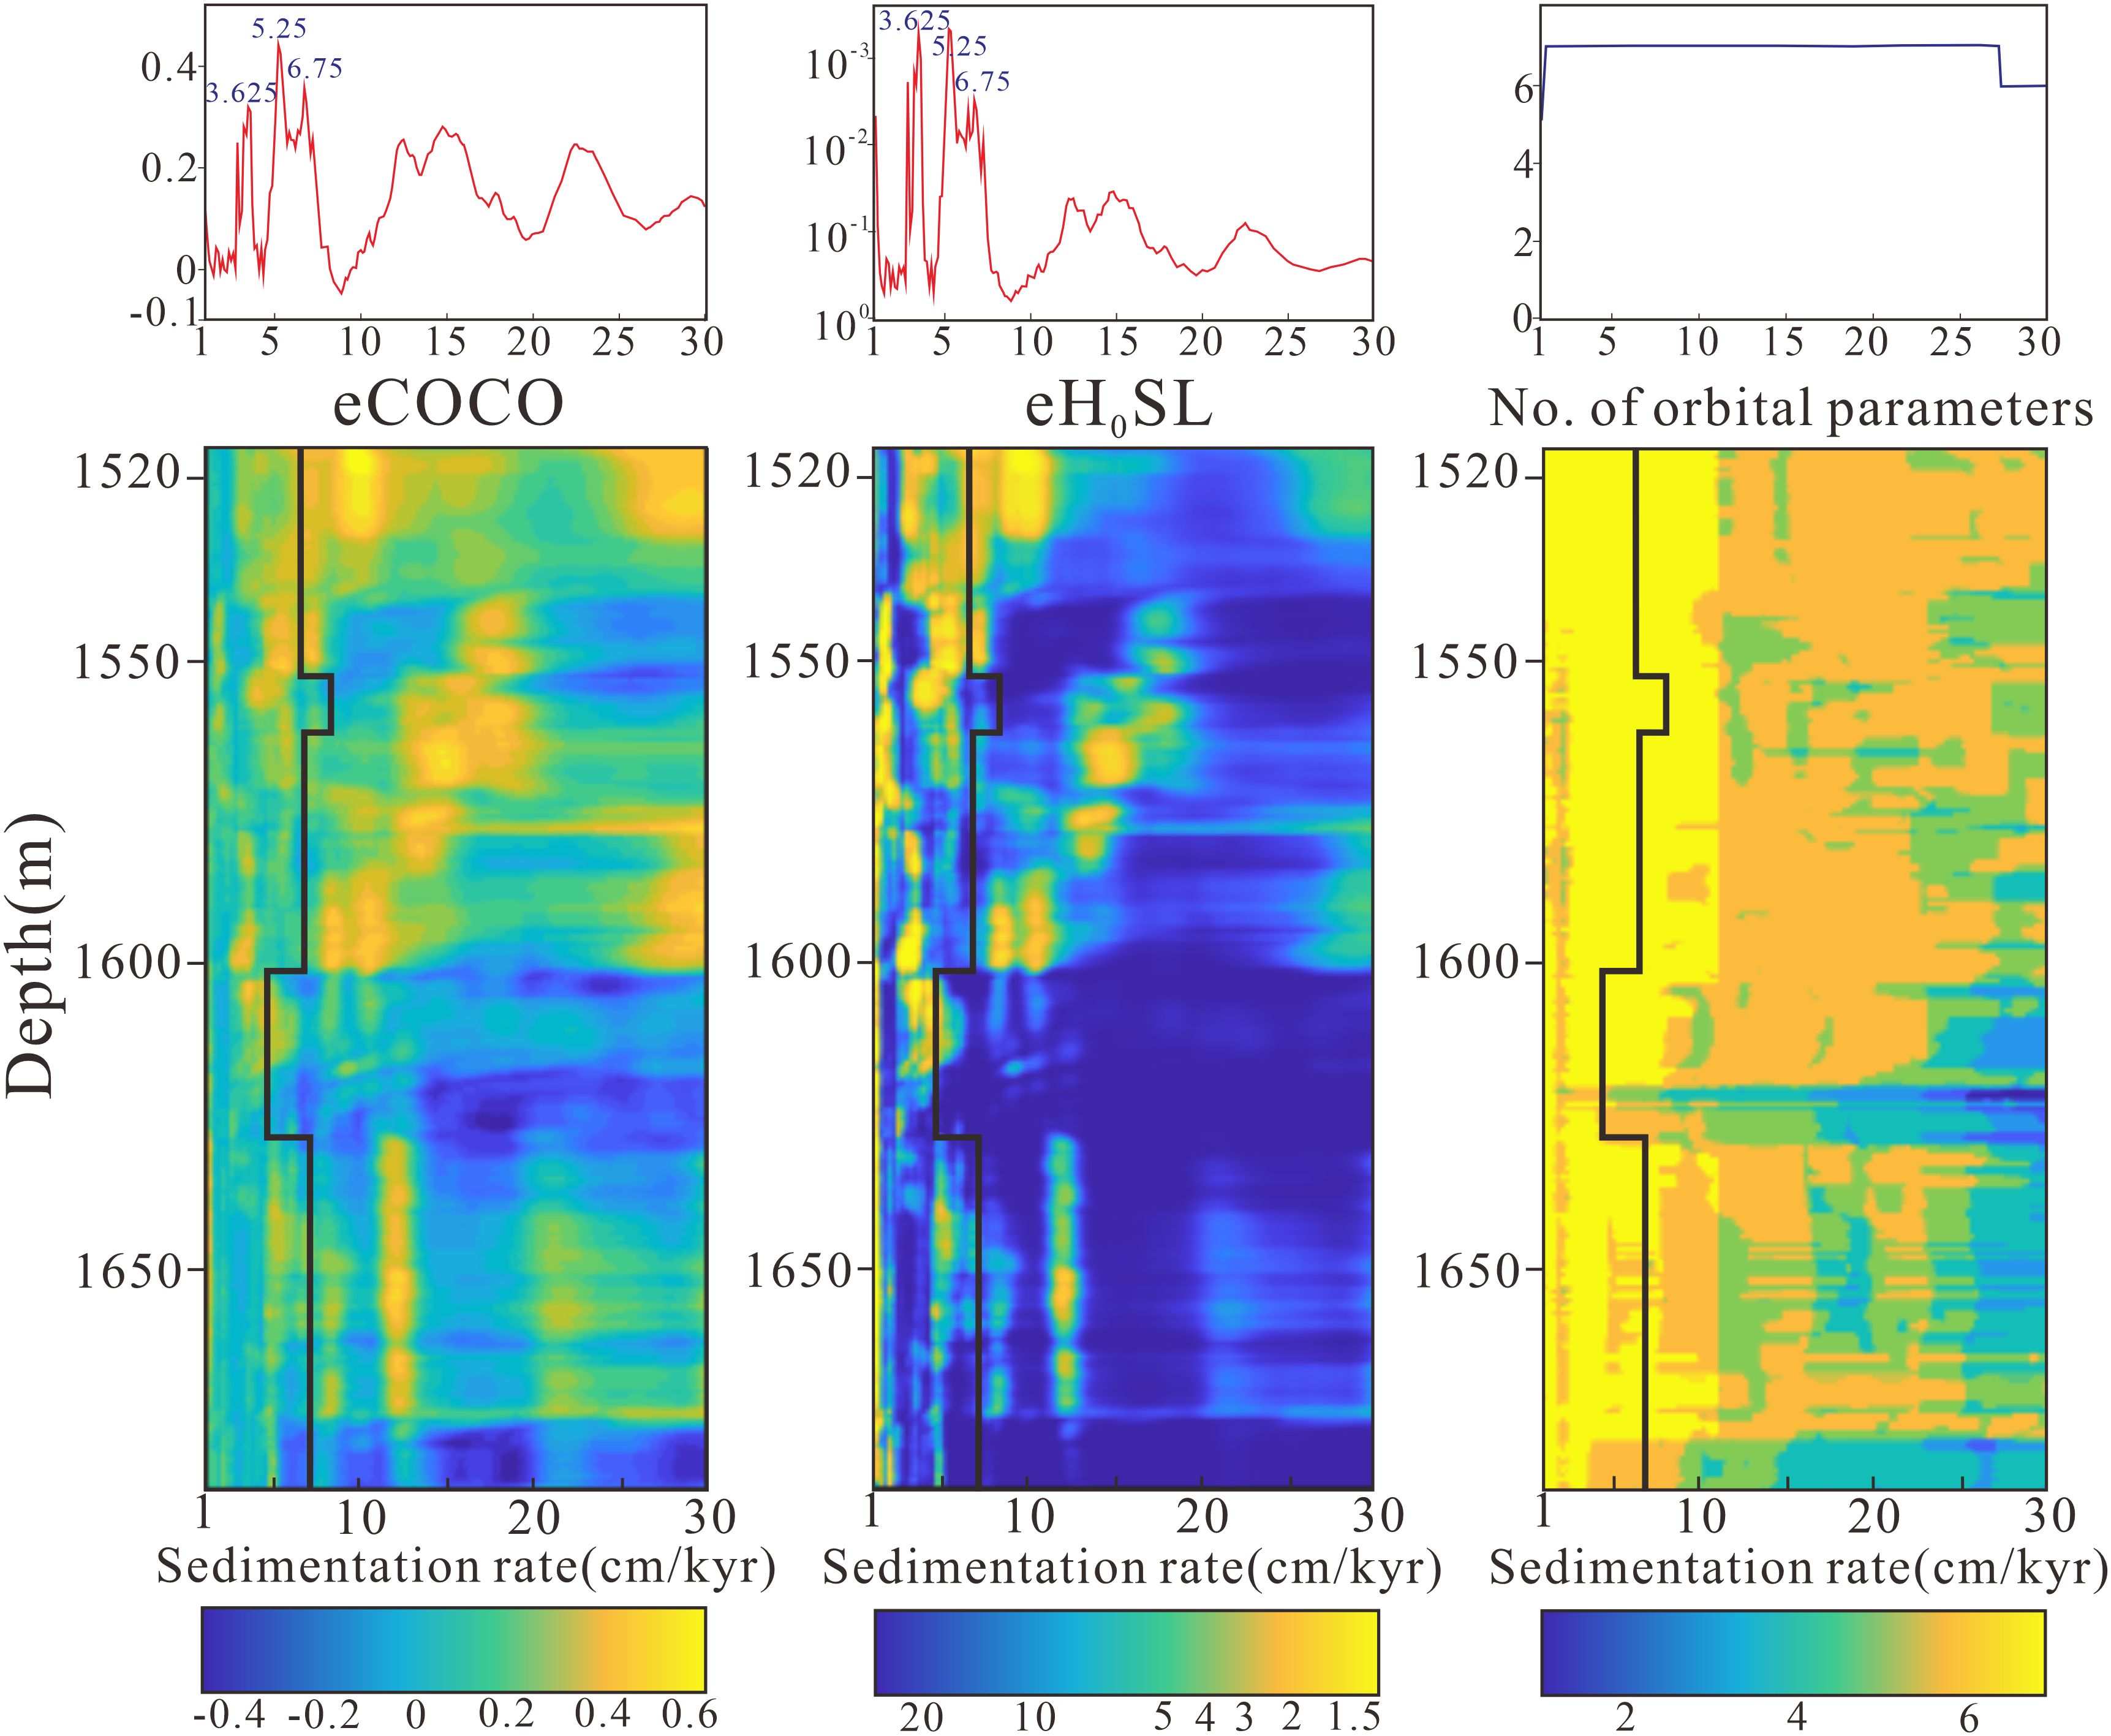
Figure 6. “COCO” and “eCOCO” analysis of the Ledong and Yinggehai Formation for well W01 in the QDNB. The tested sedimentation rates range from 1 cm/kyr to 30 cm/kyr, with a 0.125 cm/kyr step. The number of Monte Carlo simulations was set as 2000. The optimal sedimentation rates are 3.625, 5.25 and 6.75cm/kyr.
By extracting the 405 kyr signal from well W01 using Gaussian filter with a bandwidth of 0.032 ± 0.01cycle/m (Kodama and Hinnov, 2015), an age model is established based on the correspondence of the 27.34 m sedimentary cycle to the 405 kyr eccentricity period. Utilizing this age model, the depth domain sequence was tuned to the time domain. The tuned time domain data were then interpolated and detrended before spectral analysis. The results exhibits prominent 405 kyr, 100 kyr, 41 kyr, and 19 kyr periods in W01, all surpassing the 99% confidence level and closely matching the theoretical periods (Figure 5B). This confirms that the aforementioned filtering result is reliable and the selection of depositional cycles and astronomical periods is correct. Among these, the eFFT spectral for the 405 kyr long eccentricity is the most pronounced and continuous, followed by those for short eccentricity and obliquity (Figure 5B).
4.2 Major and trace elements analysis
Many materials record information about paleoenvironmental changes preserved in strata. Certain chemical elements, particularly specific indicator elements, can provide insights into the evolution of paleoclimate, paleosalinity, and paleodepth. We selected several environmentally significant indicators for paleoenvironmental analysis.
We used Rb/Sr and Sr/Cu ratios as paleoclimate indices. Due to differences in the chemical reactivity of Rb and Sr, Rb is relatively stable during weathering, whereas Sr is prone to leaching. Leaching of Sr is less prevalent under dry and cold climatic conditions (Zhang et al., 2016; Lei et al., 2017). Therefore, the Rb/Sr ratio as well as can be used to elucidate changes in paleoclimatic environments. A lower Rb/Sr ratio indicates drier conditions (Liu H. et al., 2024; Yang et al., 2021). Moreover, Cu is primarily transported into sediments through organic matter, making it an ideal indicator for organic matter flux (Tribovillard et al., 2006). The Sr/Cu ratio ranging from 1.3 to 5.0 indicates a warm and humid climate, while values greater than 5.0 suggest an arid climate (Lerman, 1978). The variation trend of Rb/Sr ranging between 0.279 and 0.747, with an average of 0.478 (Figure 7), indicating a relatively low overall value. The Sr/Cu ratio shows a mirror-image relationship to Rb/Sr. The Sr/Cu ratio of the samples ranged from 8.45 to 298, with an average of 21.71, the highest values at the uppermost section are likely attributed to the lithology being authigenic carbonate rocks.
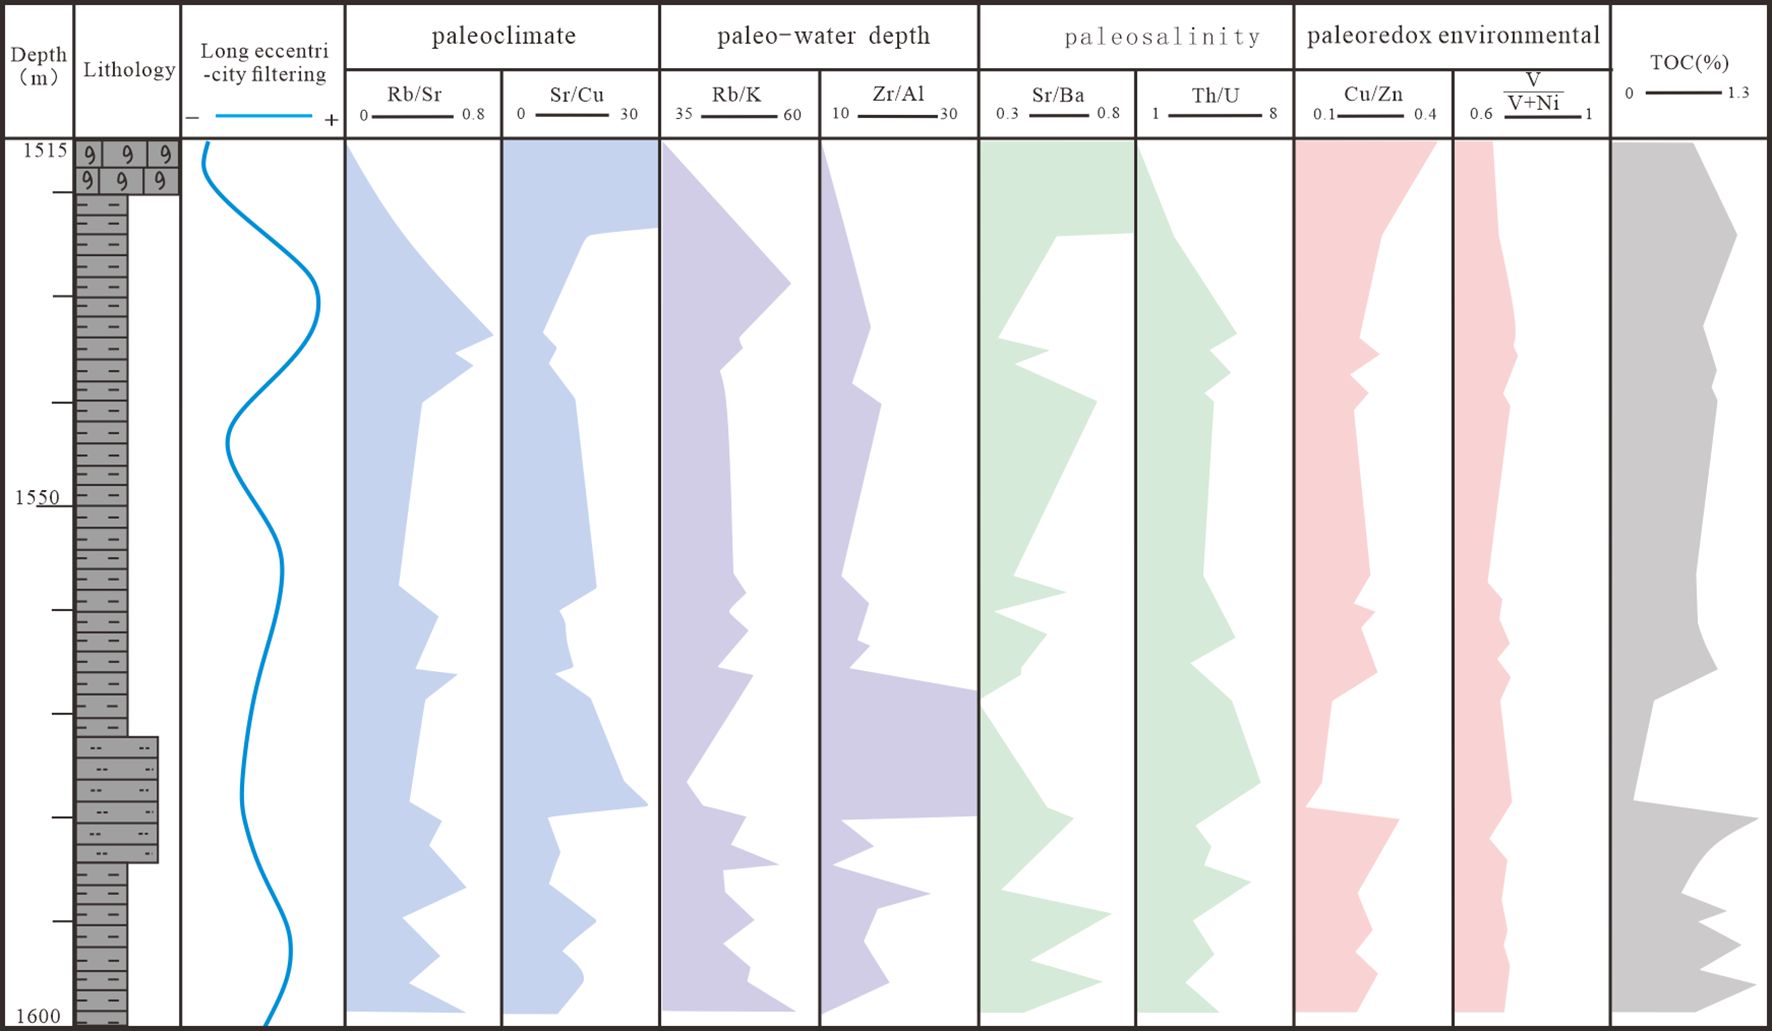
Figure 7. Sedimentary environment evolution of the shallow unconsolidated sedimentary rocks from well W01 in the QDNB deep-sea area (Lithology is carbonate rock, mudstone, siltstone and mudstone successively. The specific data are shown in the attached table.).
The migration and enrichment of Rb and K in water are significantly related to clay materials. Compared to K, Rb is more readily adsorbed by clay. Therefore, a higher Rb/K ratio indicates both a greater distance from land and deeper water (Xiong and Xiao, 2011; Cao et al., 2024). Zr is a typical lithophile element that primarily migrates mechanically and deposits in nearshore areas. However, the distribution of Zr in sedimentary rocks is influenced by the presence of Al. Therefore, the Zr/Al ratio is a better indicator of terrigenous components transported over short distances and changes in water depth (Xi et al., 2004; Cao et al., 2024). Except for a small portion, there are insignificant variations in the Rb/K and Zr/Al ratios. At the depth of 1570-1585m, Rb/K showed a significant decrease and Zr/Al ratio exceeded 40. Throughout the entire profile, Rb/K ratios of samples ranged from 38.61 to 56.46, averaging 46.87. The Zr/Al ratio spanned from 9.43 to 152.69 with an average of 21.81, predominantly concentrating in low values (Figure 7).
In freshwater environments, Sr and Ba exist as dissolved salts. When the water begins to concentrate, Ba precipitates first, followed by Sr. Therefore, a higher Sr/Ba ratio indicates higher salinity levels (Xiong and Xiao, 2011; Liang et al., 2024). Similarly, the Th/U is often used as an indicator for paleosalinity analysis. Th is easily adsorbed by clay minerals, while U is prone to leaching. In marine sediments, Th/U ratios are typically less than 2, whereas in terrestrial environments, they tend to be higher (Tan et al., 2019). The variation in Sr/Ba and Th/U ratios is relatively conspicuous. The Sr/Ba values of the samples range from 0.30 to 0.70, with an average value of 0.49. The Th/U ratio is between 2.71 and 6.50, averaging4.48 (Figure 7). Particularly, at the depth of 1515-1520m, there is a significant increase in Th/U values, presumably due to the carbonate lithology.
The Cu/Zn and V/(V+ Ni) ratios are important indicators to distinguish the redox environment of sedimentary water (Mei, 1988; Xiong and Xiao, 2011; Deng et al., 2020). In the analysis of ancient redox environments, both Cu and Zn are transition metals, and their distribution can vary with changes in oxygen concentration. As oxygen levels decrease, there is a transition from Cu to Zn enrichment, and similarly for V/(V+ Ni). A higher Cu/Zn ratio indicates more oxidizing conditions. The Cu/Zn ratio observed ranged from 0.118 to 0.372, with an average of 0.233. While the V/(V+ Ni) ratio varied from 0.690 to 0.765, with an average value of 0.733 (Figure 7). The trends of these two ratios do not exhibit a high degree of similarity. However, both decline between 1570-1585m.
4.3 Total organic matter content
According to the TOC analysis of the W01 samples (Figure 7), the studied interval exhibits characteristics of high organic matter content. The TOC values of the samples range from a minimum of 0.21% to a maximum of 1.21%, with an average of 0.77%. The lower TOC values appear in the sandstone section, which is typically considered reservoir rock rather than source rock. Hence, low TOC values in this context are reasonable. Conversely, at the depth interval of 1578 to1582m, the TOC values are relatively high, exceeding 1%, indicates that the region may have entered a mature stage and provided gas source for hydrates formation (Lu and Zhang, 2017). The average TOC value of this section is higher than that of the shallow layer in the QDNB, as well as the data from GMGS5-W07 and W09, and is comparable to the average TOC value of the main Miocene source rocks (Sun et al., 2018; Lu Y. H. et al., 2022; Li et al., 2021). The elevated TOC values at this location may be attributed to the methane leakage which triggers MSR, thereby promoting carbon sequestration and increasing the TOC (Coffin et al., 2015; Miao et al., 2022; Liu X. T. et al., 2024).
5 Discussions
5.1 Astronomical time scale
A high-precision astronomical age scale has been established for the depth span from 1515m to 1686m in W01, utilizing the tuned time domain curve. Notably, the 27.34m cycle thickness corresponds to the 405 kyr long eccentricity period, displaying the maximum amplitude, which indicates the pronounced impact of the long eccentricity cycle on the strata. In the W01 profile from 1515 to 1686m, a total of 6.25 long eccentricity cycles, 25.41 short eccentricity cycles,58.97 obliquity cycles and 132.56 precession cycles were identified. The sedimentation times estimated based on the mentioned astronomical periods are 2531.25, 2541, 2417.77, and 2518.6 kyr respectively. The eFFT spectral analyses reveal that the long eccentricity period displays high continuity and stability, while the short eccentricity period and the obliquity period shows lower energy (Figure 5). Therefore, the astronomical scale was established based on the long eccentricity period.
For the Cenozoic formation, a direct comparison was performed between the filtering curve and the theoretical curve, leading to the establishment of an astronomical-geological age scale through astronomical tuning (Laskar et al., 2004; Huang, 2014). The studied section in W01 pertains to the Ledong Formation and the Yinggehai Formation, encompassing an age range of 0-5.5Ma, thus allowing for comparison with the theoretical target curve. Comparing the W01 long eccentricity bandpass filtering with the theoretical astronomical curve produces an estimate of an approximate deposition time of 2500 ka (Figure 8). Investigating the historical methane seepage in the SCS cold seeps, Zhang employed accelerator mass spectrometry to determine the AMS-14C ages of shells. This study drew upon part of data, with locations and lithologies shown in Figures 1, 2. Shells play a pivotal role as evidence in studying the transitions between land and sea. They were abundant along coastal areas and constitute one of the most widely distributed materials suitable for 14C dating. By dating these shells, a temporal scale was established against which to measure the global fluctuations in sea levels that occurred during the post-glacial period, can be established (Chen, 1982). Utilizing the calibrated time of 10.4 ka at a depth of 0.51 mbsf as a control point (Zhang et al., 2023), a reasonable AST was established. And the process of anchoring the floating AST to the dating data was completed according to the anchorTime method under R’s “astrochron” package (Figure 8). Original 14C test ages attached to Appendix Table 3.
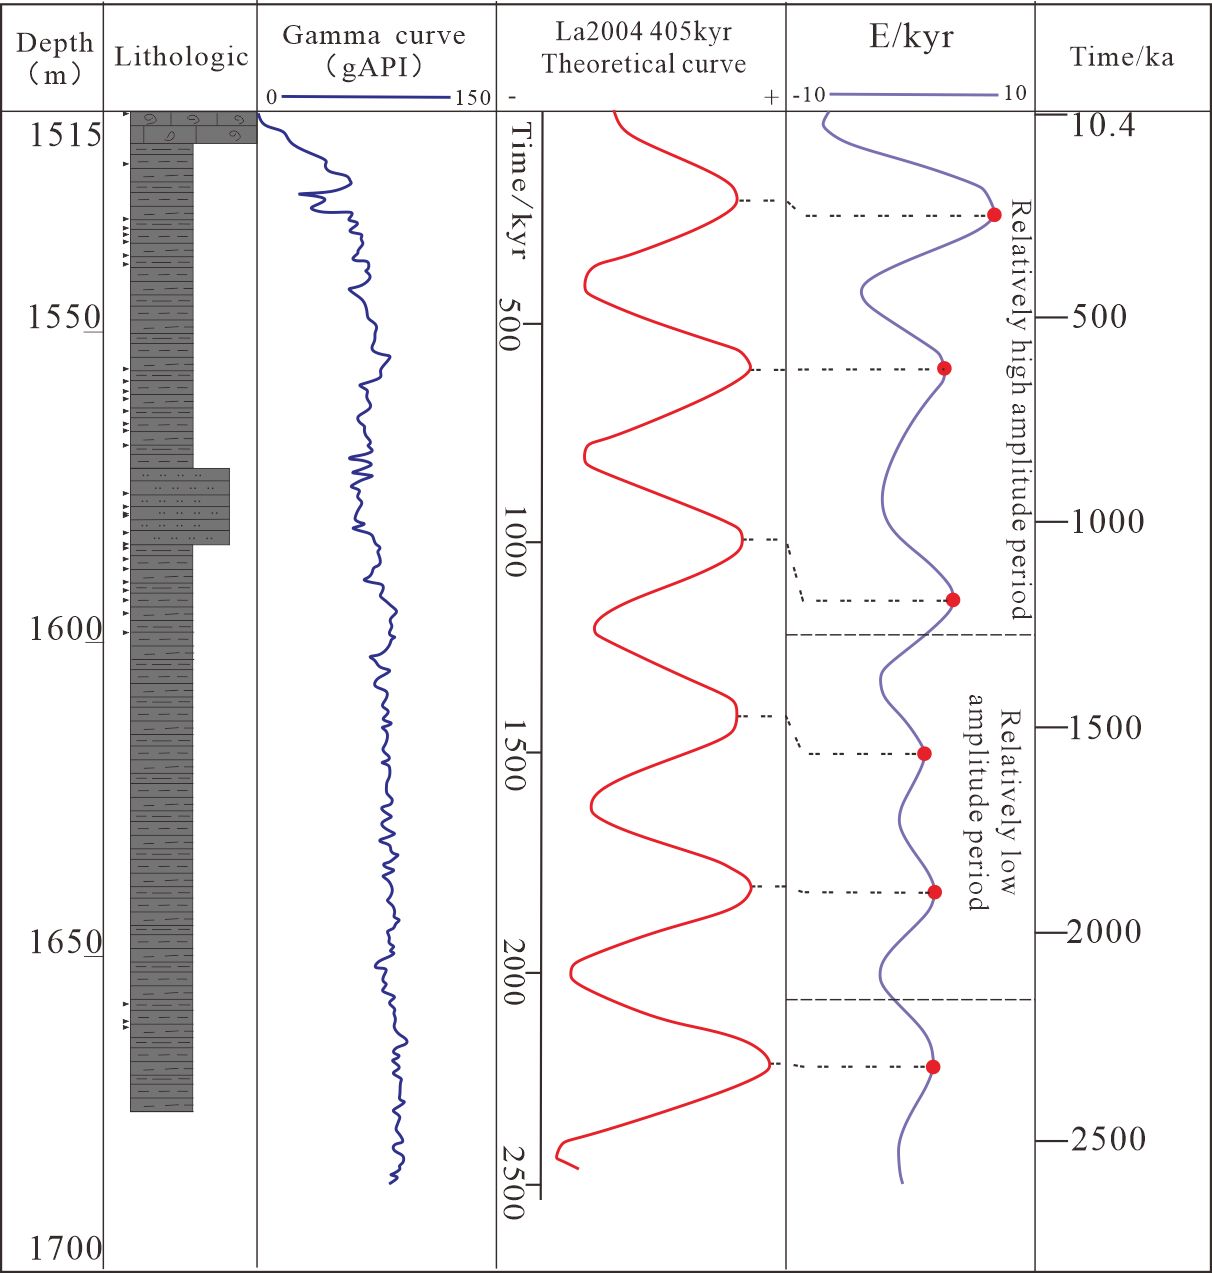
Figure 8. The astronomical time scale is established according to the previous 14C dating data by astronomical tuning with 405kyr period. The black dots represent samples depth. The target 405kyr curve from Laskar et al., 2004; the E curve is filter curve from the detrending GR data, using Gaussian filter with bandwidth of 0.036 ± 0.012cycle/m; the lithological legend is explained in Figure 3.
5.2 Climate changes corresponded to orbital cycles
The previously mentioned paleoenvironmental indicators suggest arid climate environment during the studied interval (Lerman, 1978; Cen et al., 2024), with water depths exceeding 25m (Zheng et al., 2015; Das and Haake, 2003), a continental brackish water environment (Zheng and Liu, 1999; Fu et al., 2018), and reducing conditions (Bostrom et al., 1973; Hatch and Leventhal, 1992).
Variations in Earth’s orbital parameters play a key driving role in solar radiation, resulting in periodic changes in the Earth ‘s climate system at both local and global scales (Hinnov, 2018). Previous research has illustrated that astronomical orbital periods govern climate variations (Hinnov, 2013; Huang, 2014). Zachos investigated the correlation between Milankovitch cycles and climate using deep-sea core samples, demonstrating a positive correlation (Zachos et al., 2001a, 2001b). During warmer climate periods, the amplitude strength of long eccentricity-filtered signals is greater, whereas during colder climate phases, the amplitude strength is reduced, indicating a positive correlation between these factors. At lower latitudes in the Northern Hemisphere, the amount of sunshine received was also controlled by precession, influencing climate change (Shi et al., 2020; Sun et al., 2021). However, we did not find a significant correlation between astronomical orbits and paleoclimate indexes from the data of the study area (Figure 7).
To further explore whether the paleoenvironment was modulated by astronomical periods, spectral analysis was conducted on indexes such as Rb/Sr, Rb/K, Sr/Ba, V/(V+ Ni) (Figures 9A–D). According to the Nyquist frequency, a minimum of two sampled data points can identify a complete cycle, and optimal sampling density requires at least four data points per cycle (Kodama and Hinnov, 2015). Due to the limited data points in the 1600-1680m section, only the sample data points from 1515-1600m were used in this analysis. Uniform interpolation was performed on a limited number of sample points to convert non-equidistant samples into those with a uniform interval of 1.9 m. Spectral analysis of the three indicators revealed a prominent sedimentary cycle thickness close to 27m, reaching a confidence level of 90%, with Rb/Sr even reached 95%. This closely aligns with 27.34m, ensuring high reliability. Consequently, it can be concluded that the 27m cycle thickness in the spectral analysis results of the paleoenvironmental indicators corresponds to the 405 kyr long eccentricity period, demonstrating a certain relationship between the paleoclimate and long eccentricity period. The 405 kyr long eccentricity period may exert a regulatory effect on the paleoclimate, paleosalinity and paleoredox environment.
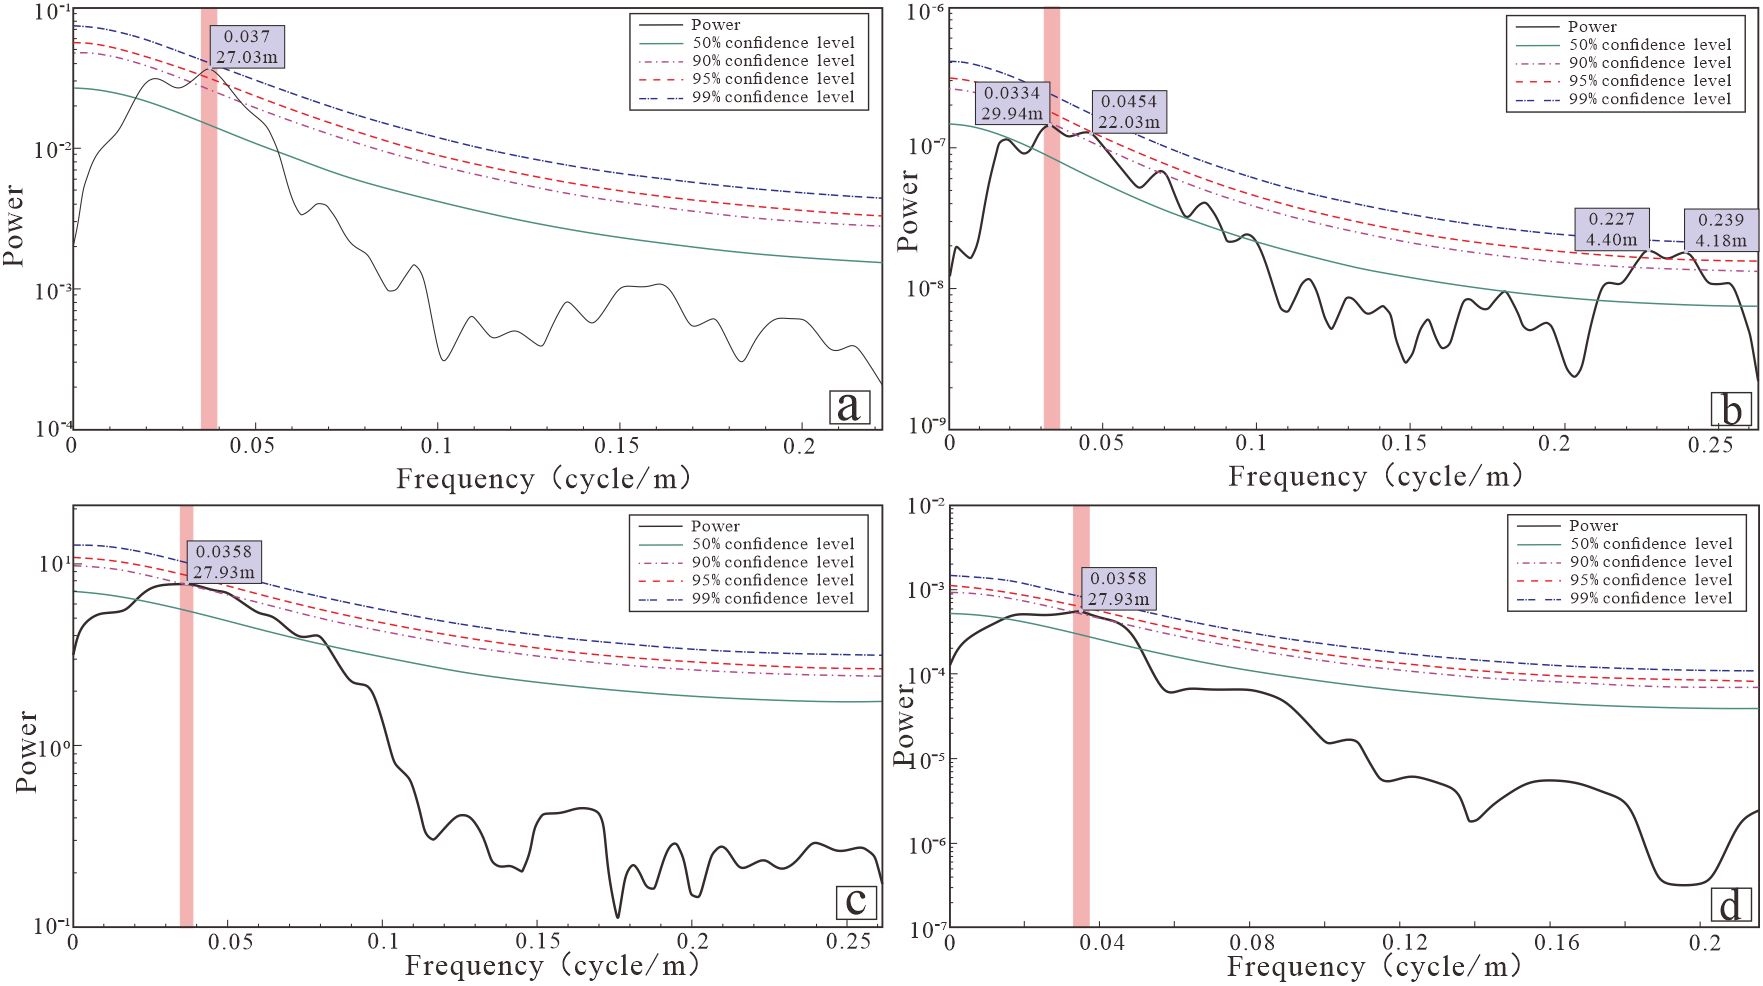
Figure 9. Frequency spectral analysis of W01 geochemical parameter index in depth domain. The data selected 1515-1600 m section, interpolated and the data interval is 1.9 m, detrended using mean method [(A) Rb/Sr、(B) Rb/K、(C) Sr/Ba、(D) V/(V+ Ni)].
5.3 Orbital cycles and sea level fluctuations
Recent research suggests that during the late Miocene to Pliocene, 1.2Myr amplitude modulation was the primary driver of third-order sea-level changes and sequence development in the QDNB, SCS (Cao et al., 2022). Similarly, in the Pearl River Estuary Basin, the 1.2Myr obliquity modulation period was regarded as a principal force for third-order sea-level change and sequence development (Xu et al., 2023). Spectral analysis of the Rb/K index reveals two predominant cycle thicknesses: 29.94m and 22.03m (Figure 9D). However, this outcome does not explicitly establish the relationship between water depth variation and orbital cycles.
To clarify the relationship between sea-level change and the astronomical period in study area, we established the DYNOT model and ρ1 model for W01 (Figure 10). The results indicate that the sea level fluctuations in W01 were modulated by long astronomical periodicity, with orbital periods driving sea level oscillation. Starting from 1686 m, the DYNOT model and ρ1 model capture the trend of sea level oscillations, characterized by a fluctuating pattern of rise-decline-rise-decline-rise-decline followed by stability. Scholars have established a quantitative relationship between the abundance of planktonic foraminifera and water depth in the surface sediments of the SCS (Xie et al., 2012; Zhang, 2020). They constructed a sea level change curve complemented by paleoecology, genesis phases, and characteristics of sedimentary structure, and coastal onlap recognized in seismic reflection profiles. The sea level was compared with the curve reconstructed by sedimentary noise models, and the two curves exhibited consistency, confirming the effectiveness of astronomical scale and the reliability of the reconstructed sea level.
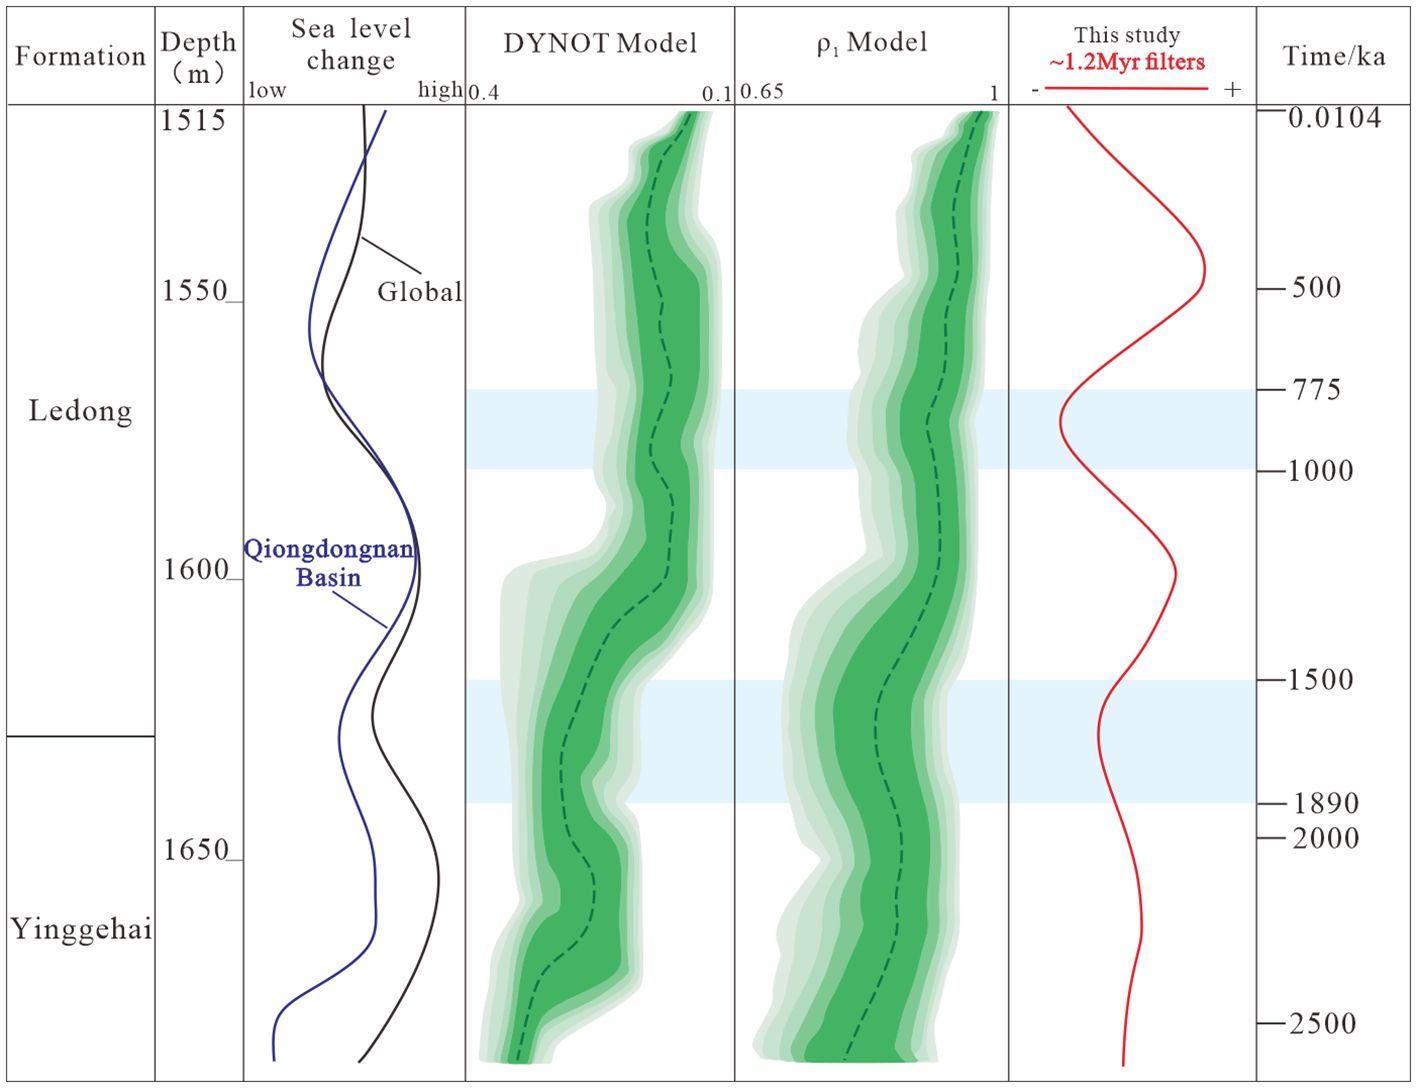
Figure 10. Characteristics of sea level changed driven by astronomical orbital period in Well W01 (Sea level change according to Xie et al., 2012). In DYNOT model, the window was set to 300-500 ka, the time-bandwidth product was chosen to be 2 and the Monte Carlo simulation was run 10,000 times. The target orbital periods were set to 405, 125, 100, 54, 41, 23, and 19 ka, with all other parameters set to their default values. In ρ1 model, monte Carlo simulation was run 10000 times, window range from 300 to 500ka with all other parameters set to their default values. The 1.2 Myr curve using Gaussian filter with bandwidth of 0.015 ± 0.003 cycle/m.
Additionally, theoretical 1.2Myr curves and the 1.2Myr filtering curve of the research profile were obtained. Through observational analysis, a similarity in the trend of sea level changes to the amplitude variations of the 1.2Myr filtering curve was observed between 2.5 and 0.8Ma. Nevertheless, from 0.8Ma to the present, there is no obvious correspondence between the two curves, and there is even an anti-phase relationship (Figure 10). This indicates that the 1.2 Myr cycle was one of the driving factors of sea level change in the QDNB during the early Pleistocene. However, in more recent geological epochs, other major factors may be controlling, such as tectonics or glaciation (Lu Y. T. et al., 2022; Lambeck and Chappell, 2001). When observing sea level fluctuations on a million-year scale, the amplitude changes are often several hundred meters. These fluctuations are primarily caused by basin shape changes due to plate tectonics (Li and Wang, 2014). During the Quaternary period, most sea level changes were due to intense glacial activity, which led to substantial material exchange between glaciers and the oceans (Lambeck and Chappell, 2001).
5.4 Carbon cycle under astronomical period
Periodic climate variations caused by astronomical cycles have the potential to impact changes in depositional settings, thereby governing the enrichment of TOC. More than one scientist has discovered astronomical cycles from TOC data (Melles et al., 2012; Li et al., 2024). TOC reflects the chemical properties of the water, initial productivity, and preservation conditions in sedimentary basins. These factors can indicate the burial of carbon elements, thus reflecting the Earth’s carbon cycle during the deposition process (Li et al., 2024).
Cyclostratigraphic analysis was conducted on TOC data within the 1515-1600m interval, revealing a prominent cycle (Figure 11A). The results from the MTM indicate the presence of two primary sedimentary cycle thicknesses of 16 m and 11.6 m, the eFFT analysis reveals a sedimentary thickness of 12 meters. Comprehensively, the two analyses indicate the presence of a sedimentary cycle with a thickness of approximately 12 m in TOC data, with a confidence level approaching 95%. In comparison to the 27.34m cycle thickness corresponding to the 405 kyr period discussed earlier, the 12 m thickness corresponds to approximately 170 kyr. This cycle represents an unconventional astronomical period and likely associated with a 170 kyr obliquity modulation cycle (Hinnov, 2000). Several scholars have previously discovered the 170 kyr period in stratigraphy (Boulila et al., 2018; Charbonnier et al., 2018; Zhang R. et al., 2022). Huang collected high-resolution TOC curves from various latitudes, all of which revealed a 170 kyr period. Based on this, the “sedimentary threshold” model was proposed, suggesting that this unconventional astronomical cycle influences climate through non-linear sedimentary processes, thereby regulating Earth’s carbon cycle (Huang et al., 2021). The identified cycle thickness from TOC data corresponds to the 170 kyr period and extracted using a filter (Kodama and Hinnov, 2015). Observations indicate a significant resemblance between the fluctuating trend in TOC data within the 1515-1600 m interval and the amplitude variation of the 170 kyr filtered curve, highlighting the significant influence of astronomical periods on carbon cycling in the low latitude study area (Figure 11B). When the 170 kyr value is high, TOC content also increases, suggesting a greater potential gas source for regional hydrate accumulation. Astronomical cycles control the periodic variations in the Earth’s solar insolation (Weedon, 2003; Huang, 2014), which in turn leads to cyclical climate changes, ultimately constraining surface sedimentary processes (Wu et al., 2011). The control of these cycles on sediments is also reflected in the geochemical characteristic and organic matter enrichment factors of the sediments, previous studies have repeatedly demonstrated that the astronomical cycle can effectively explain the environmental features and organic carbon enrichment in sediments (Zhang J. G. et al., 2022; Li G. C. et al., 2023). Paleoclimate indicators are positively correlated with long eccentricity cycles, when eccentricity approaches its maximum, the earth is closer to the Sun, leading to hotter climates and an increasing trend in sedimentation rates, with higher nutrient input (Jin et al., 1996; Feng et al., 2023). As discussed above, both paleoredox and sea level are influenced by astronomical cycles, meanwhile deeper water depth with reducing waters are favorable for organic matter preservation (Diao et al., 2014).
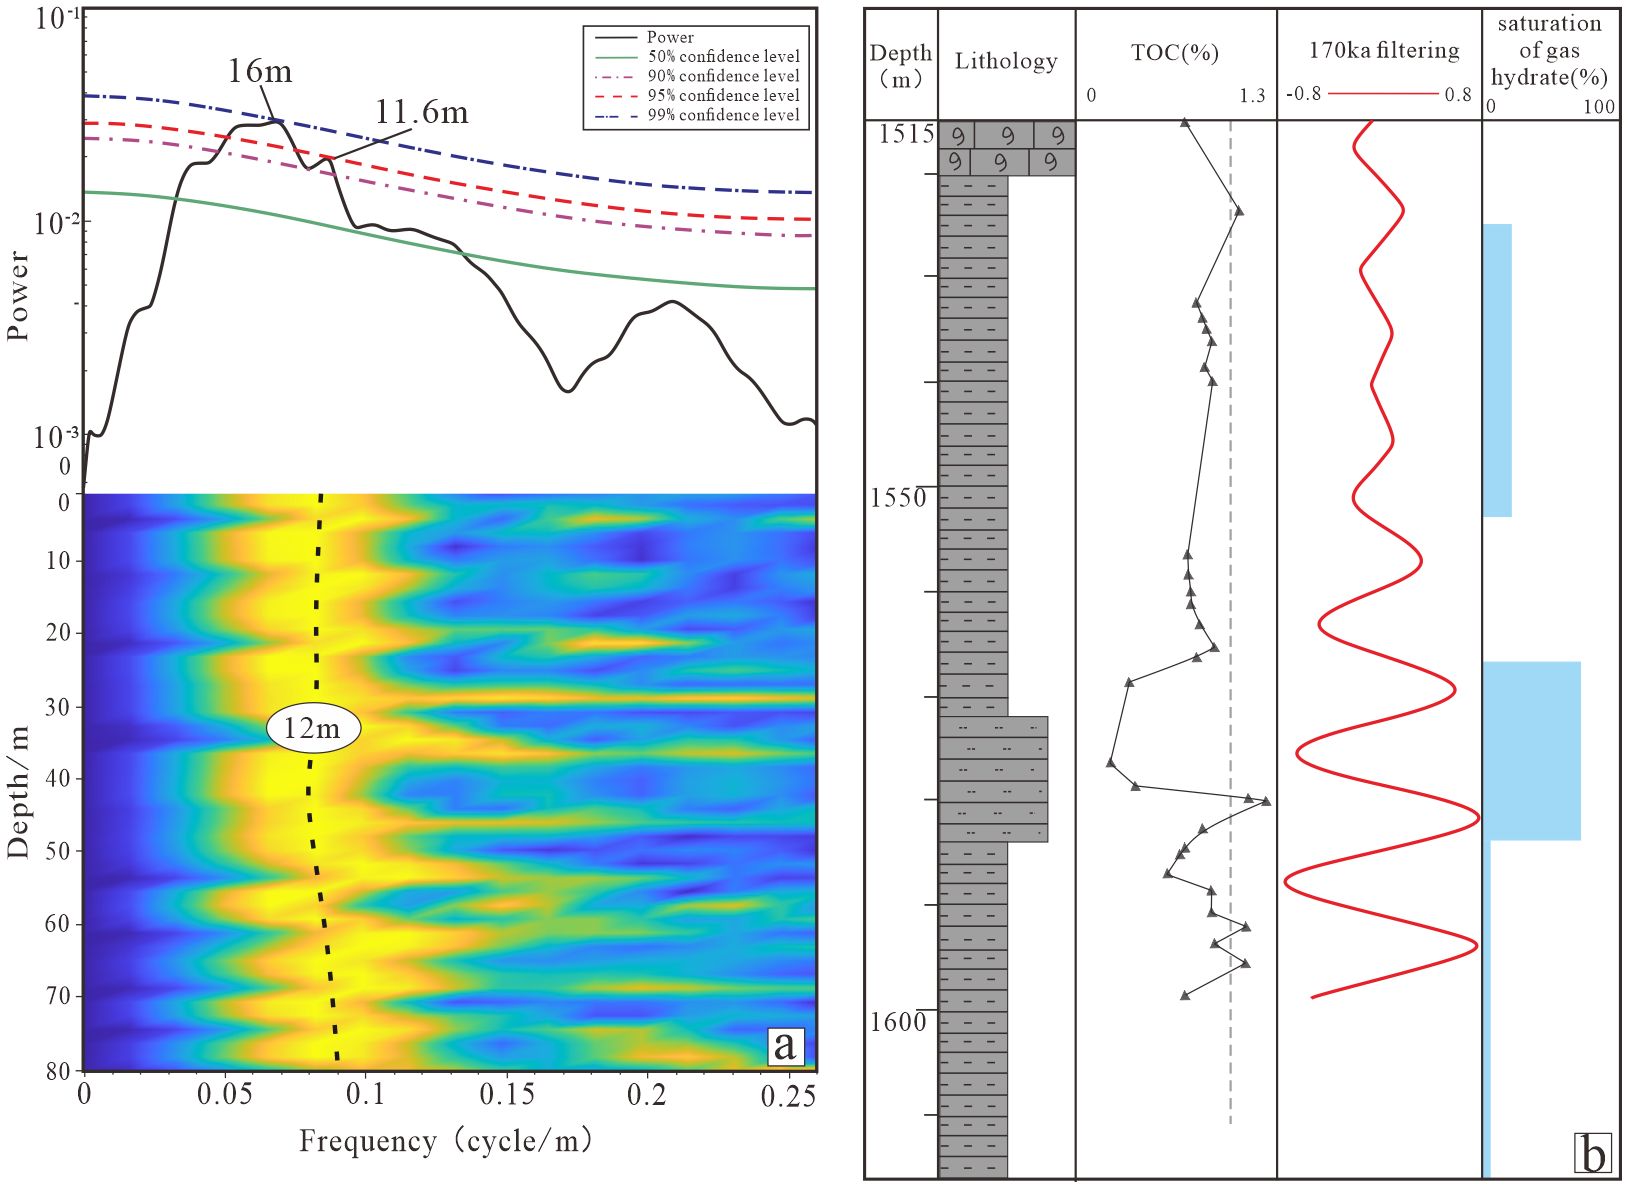
Figure 11. Total organic carbon content analysis of Well W01. (A) 1515-1600mTOC data depth domain spectral analysis, data interpolated and the data interval is 1.9 m, detrended using LOWESS with 30m, eFFT using a 40m running window with a 0.19m step; (B) TOC data compare with filter curve, hydrate saturation data from He et al., 2022.
5.5 Implications for gas hydrate evolution
5.5.1 Effects of environmental factors on hydrates
The gas sources of gas hydrate include microbial gas, thermogenic gas and their mixture, primarily identified through the analysis of gas composition and isotope characteristics of decomposition gas (Wei et al., 2021). Isotopic analysis of the decomposition gases of gas hydrates in the study area indicates a mixed origin, involving contributions from both microbial gas and thermogenic gas (Figure 12). As previously mentioned, in intervals between 1578m and 1582m where the TOC content exceeds 1%, the sediments could serve as a source rock for hydrates. Considering the gas hydrate saturation, the 1567-1584m interval displays relatively high saturation, reaching 82.2%, suggesting that the corresponding sandstone lithology can be a favorable reservoir (Figure 11B). Moreover, the partial overlaps between intervals with high TOC content and those with high hydrate saturation confirm that the high TOC source rock in these intervals indeed provides favorable conditions for hydrate synthesis. The high amplitude of the 170 kyr astronomical cycle reflects elevated TOC content, which contributes to the favorable conditions for hydrate accumulation.
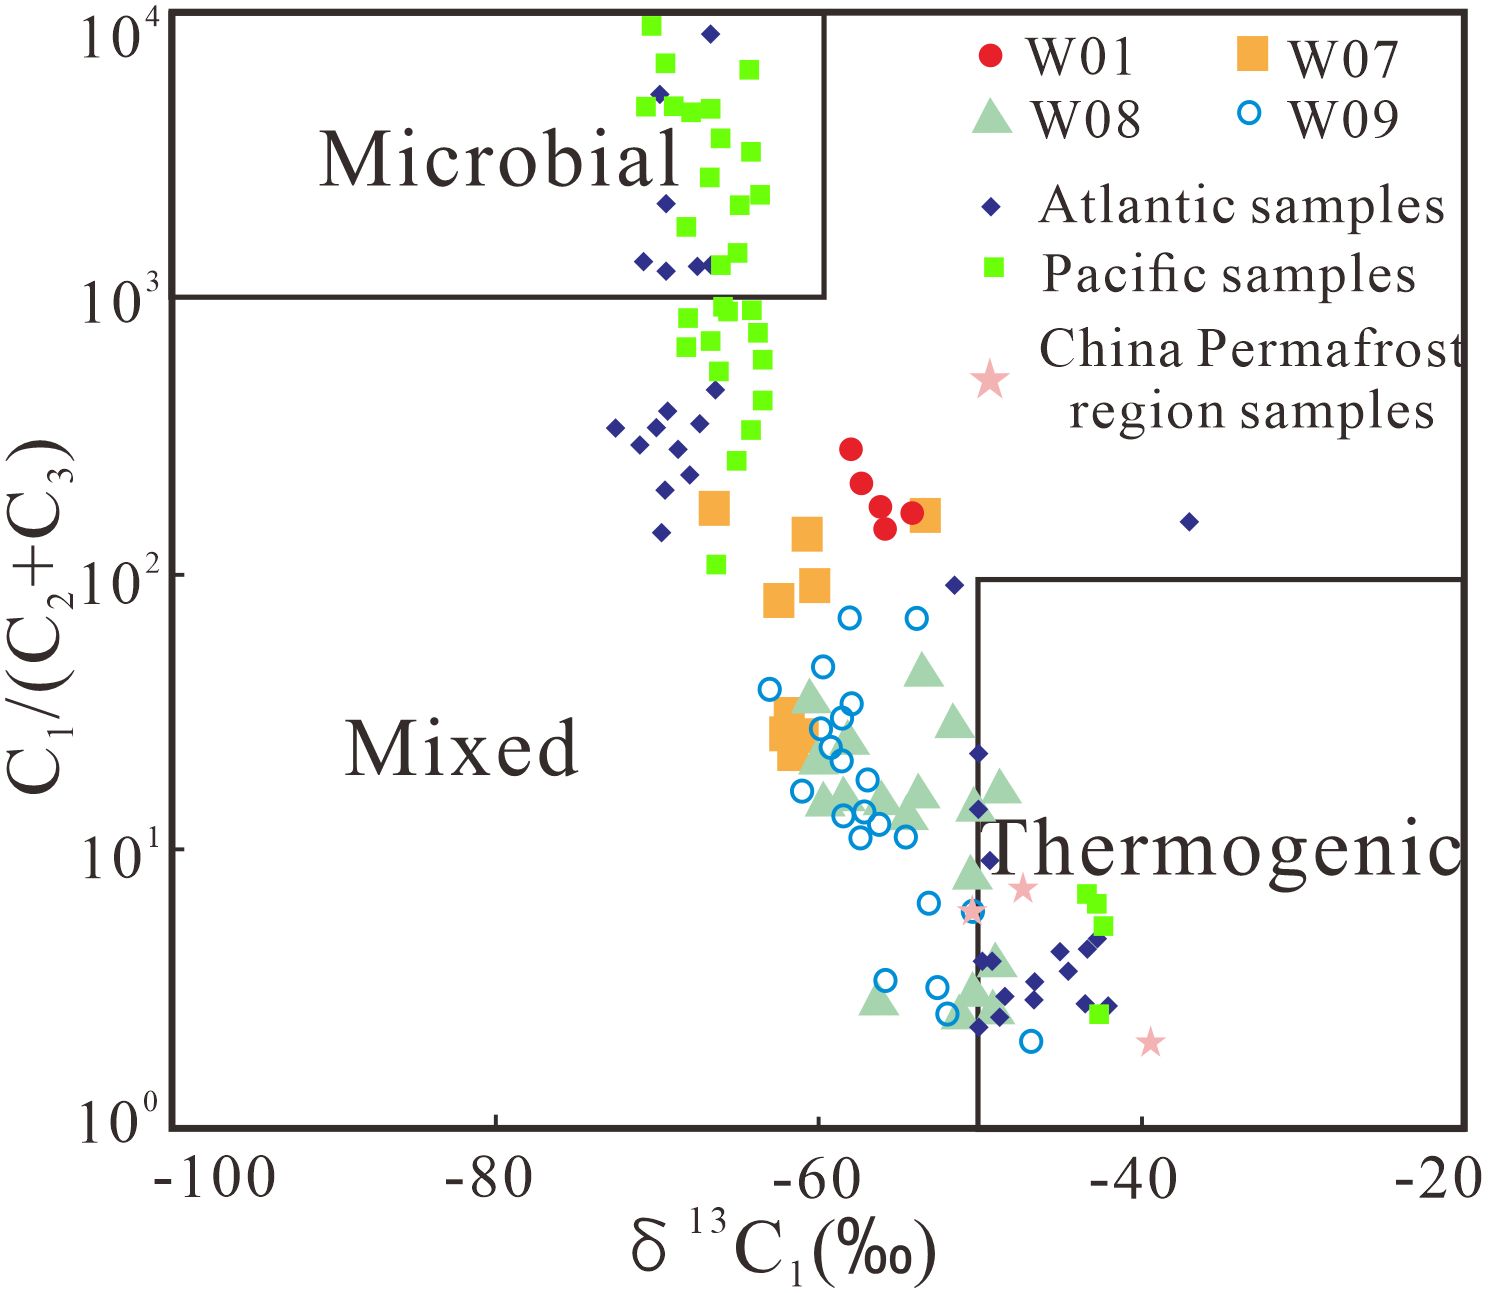
Figure 12. Analysis of the origin of natural gas hydrate gas source in Well W01. (data from He et al., 2022, 2013, classification criteria derived from Wei et al., 2021).
A quasi-equilibrium relationship exists between gas hydrate and its formational environment, predominantly influenced by changes in environmental pressure and temperature. The destabilization of gas hydrates, leading to the release of methane into the atmosphere, can be triggered by sea-level decrease or water temperature rise, thus altering in situ pressure or temperature conditions. Globally, the principal factors causing substantial decomposition of gas hydrate are sea-level lowering and climatic warming (Kvenvolden, 1988, 1993, 1994; Paull et al., 1991; Chen and Zhou, 1997). The response to temperature changes differs between deep-water regions and polar regions. During periods of global warming, hydrates in deep-water regions stabilize, while hydrates in polar regions destabilize, potentially releasing methane into the atmosphere. Conversely, during periods of global cooling, hydrates in deep-water regions become unstable and release methane into the atmosphere, while hydrates in polar regions eventually stabilize. Thus, during global warming and cooling processes, the state of gas hydrates responds to changes in surface pressure and temperature (Figure 13). However, the precise impact of methane released from gas hydrates decomposition on global climate remains uncertain.
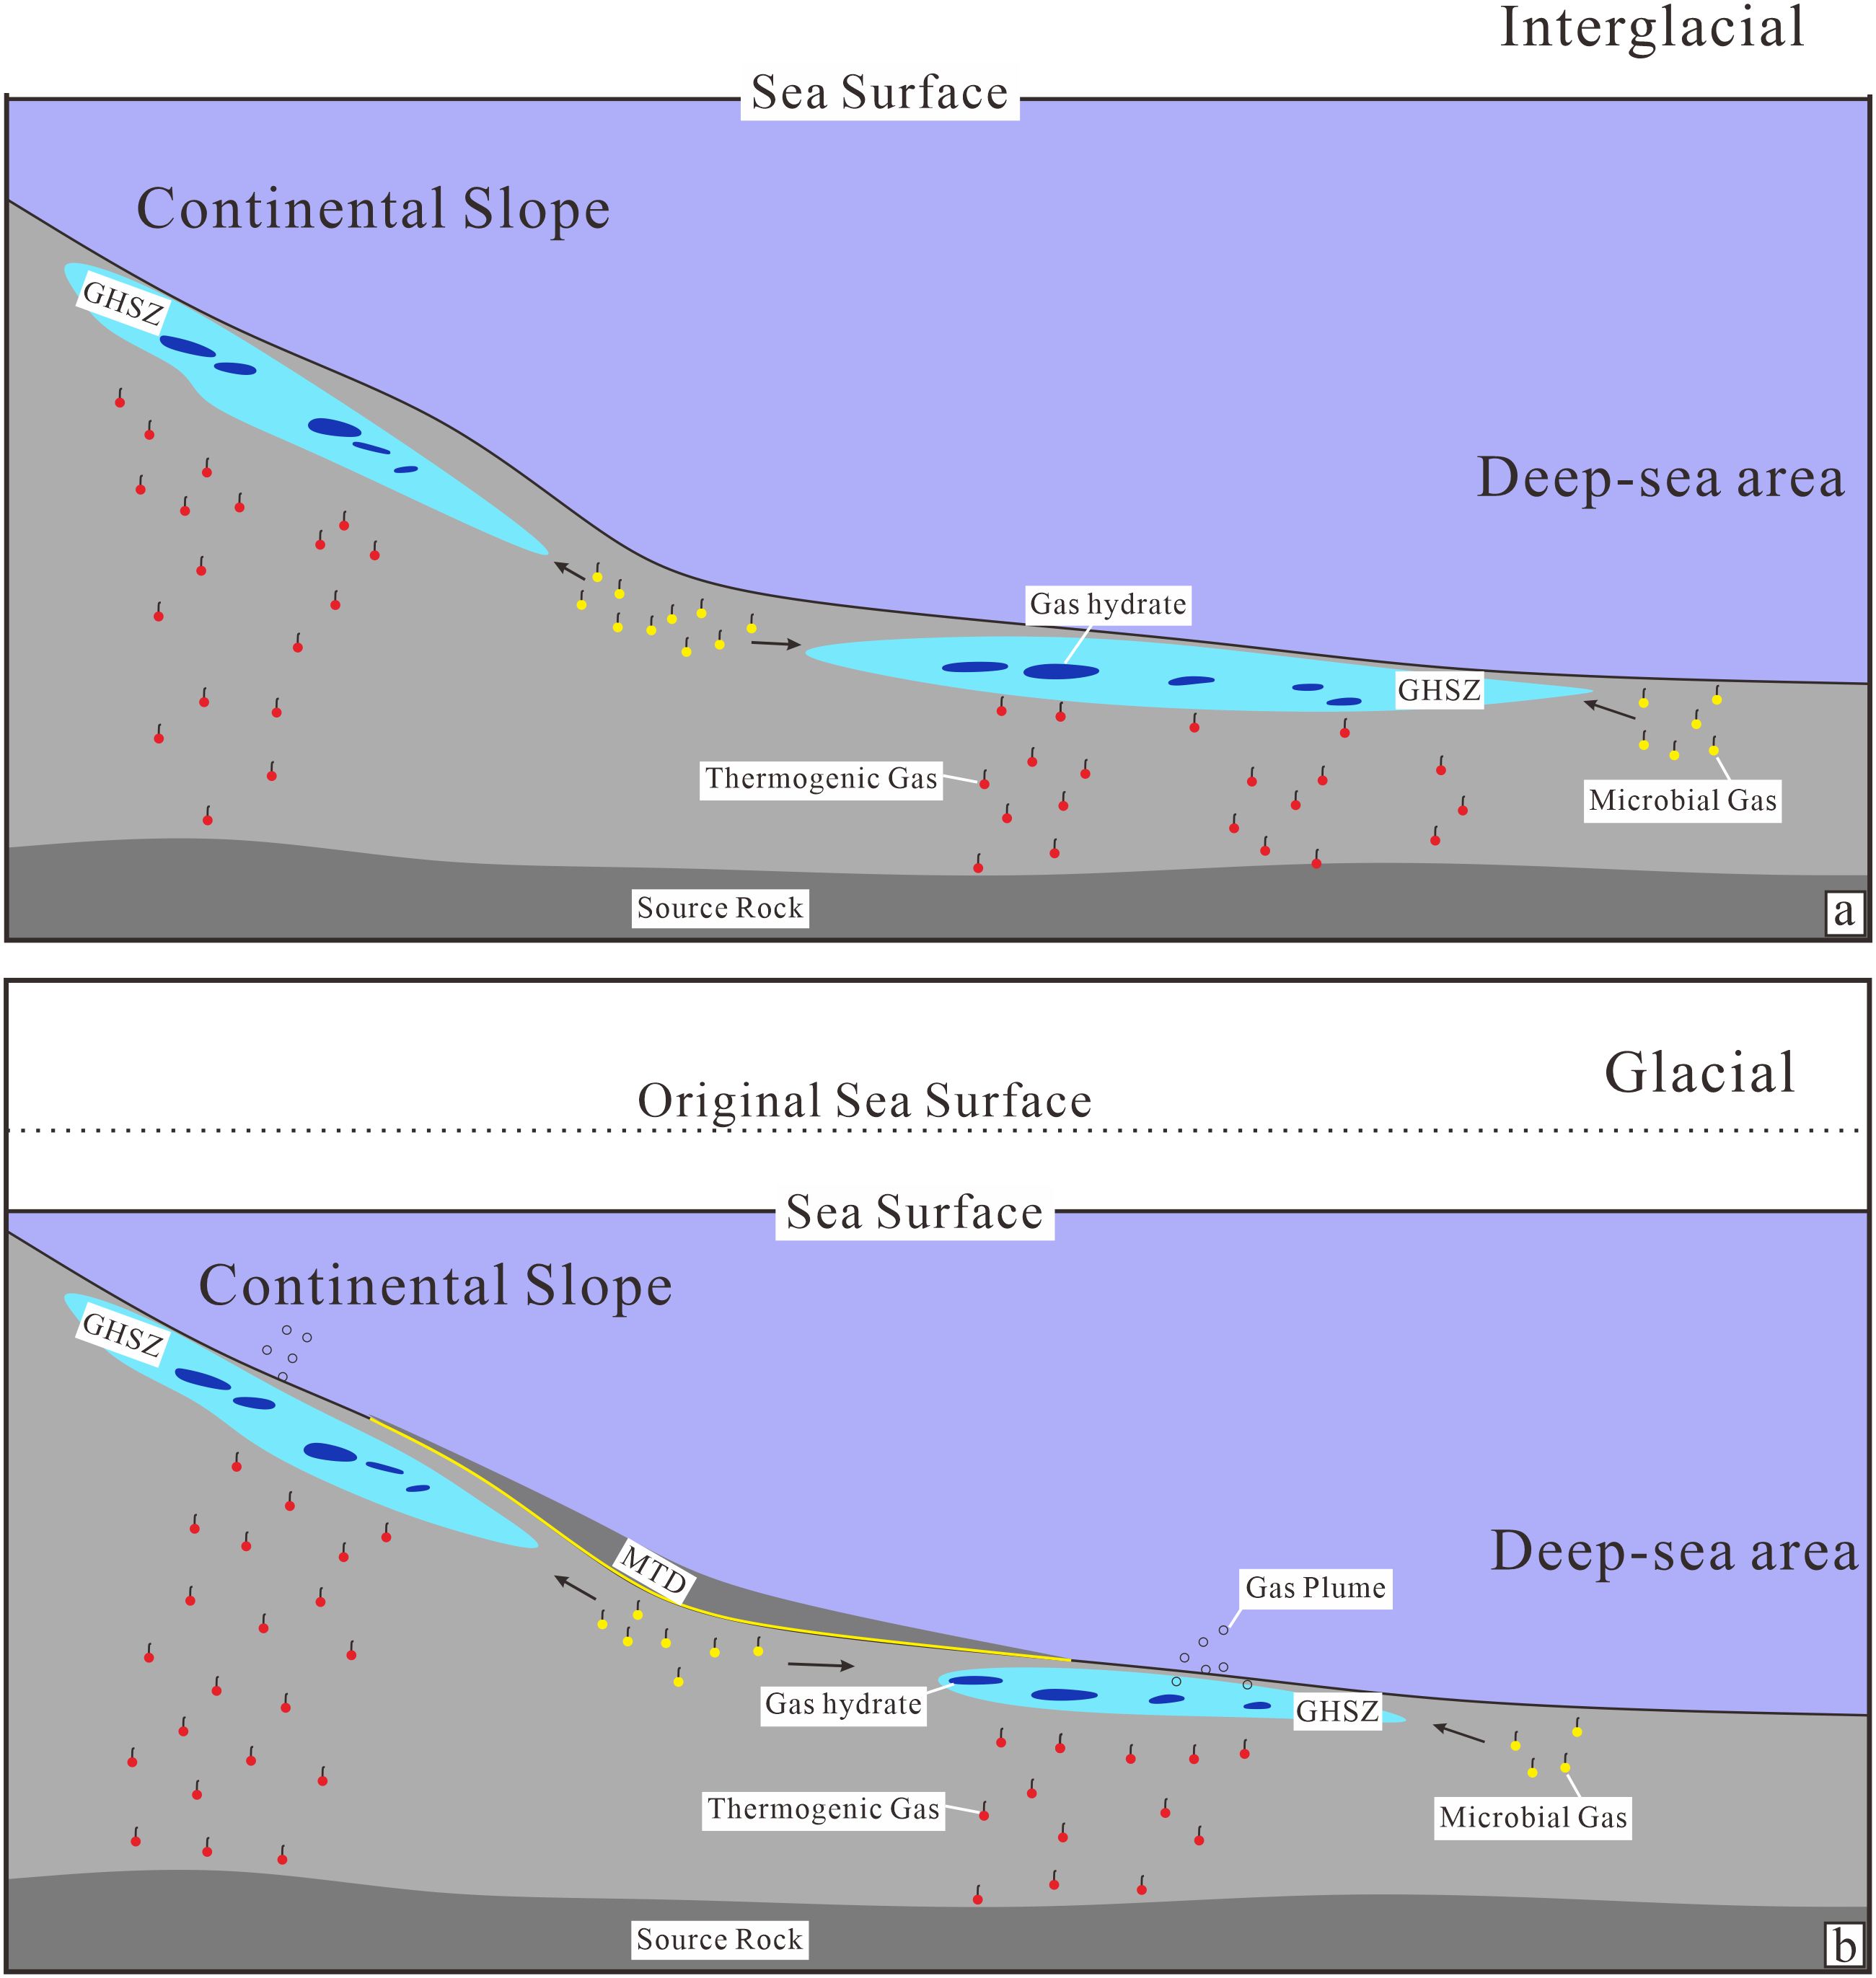
Figure 13. Effects of pressure and temperature on the dynamic evolution of hydrate system. (A) During the interglacial, there were hydrates in the continental slope and deep-sea area. (B) During the Ice Age, with sea level dropped, the pressure on the formation decreased, so hydrate in the continental slope area remained stable, however the hydrate in the deep-sea area was partially decomposed. (modified from Kvenvolden, 1988).
The drilling data on gas hydrates at W01 indicate a geothermal gradient of 78°C/km and seabed temperatures ranging from 2 to 4°C, most hydrate drilling operations reach water depths of 1500-1700 m (Gan et al., 2019; He et al., 2022). Hence, the overall temperature conditions within the W01 research interval are conducive to the formation of gas hydrates. Examining sea-level changes reconstructed by sedimentary noise models, despite the frequent oscillations in sea level, the overall trend was increasing (Figure 10). Consequently, the study section is generally favorable for the accumulation of gas hydrates from the perspective of pressure. Both paleoclimate and sea level changes are regulated by orbital periods, and they are associated with the formation and decomposition of gas hydrates, indicating that hydrates are also influenced by orbital periods. Temperature variation exhibited a positive correlation with the amplitude of the long eccentricity, with lower long eccentricity amplitudes corresponding to lower temperatures, favoring the formation of gas hydrates. Pressure in deepwater areas primarily depends on water depth, and sea-level changes are regulated by orbital periods, thus impacting water pressure. Fluctuations in sea level are associated with the 1.2 Myr obliquity modulation period. As the amplitude increases, water depth increases, and the pressure exerted on the strata increases, thereby favoring the accumulation of gas hydrates.
Methane release from hydrate systems has long been considered a significant mechanism in global carbon cycle perturbations (Fang et al., 2004; Kim and Zhang, 2022). Thermogenic gas that migrated to the bottom of the GHSZ was gradually released into the ocean and atmospheric systems over time (Burton et al., 2020). However, hydrate systems play a crucial regulatory role between the free gas layer and the ocean, hindering methane release into the ocean. Early-formed MTDs, in conjunction with hydrate-bearing sediments, collectively form a free gas sealing system, further sealing the free gas beneath the GHSZ and effectively preventing methane from being released into the ocean and atmosphere (Figure 13B) (Du et al., 2024). The dynamic evolution of hydrate systems also reflects this aspect of the carbon cycle.
5.5.2 Relationship between glacial and orbital cycles
During geological history, several anomalous cold phases have occurred, referred to as glacial, characterized by notably cold temperatures and extensive glaciation, providing favorable conditions for hydrate formation. The major glacial that have been studied are those in the late Cenozoic, late Paleozoic, and late Precambrian (Wei, 1987). Studies of the late Cenozoic glacial have predominantly focused on the Quaternary period between 0 and 0.8 Ma, commencing with the early Pleistocene Xixiabangma glacial (Table 1). Evidence of glaciation in China can be traced back to approximately 0.7 Ma (Cui et al., 2011). The detection of hydrates in the study interval is concentrated between 1.0 Ma and 0.1 Ma, coinciding with an overall cooler climate period. This indicates that the formation of gas hydrates in the deepwater area of the SCS aligns with a broader climatic background (Figures 7, 10B). Li, through the study of authigenic carbonates in the Dongsha area of the SCS, emphasizes that the increase in seawater temperature during interglacial periods is a key driver for the intensified methane seepage, further demonstrating that warming during interglacial periods is unfavorable for the sustained stability of hydrates (Li N. et al., 2023).
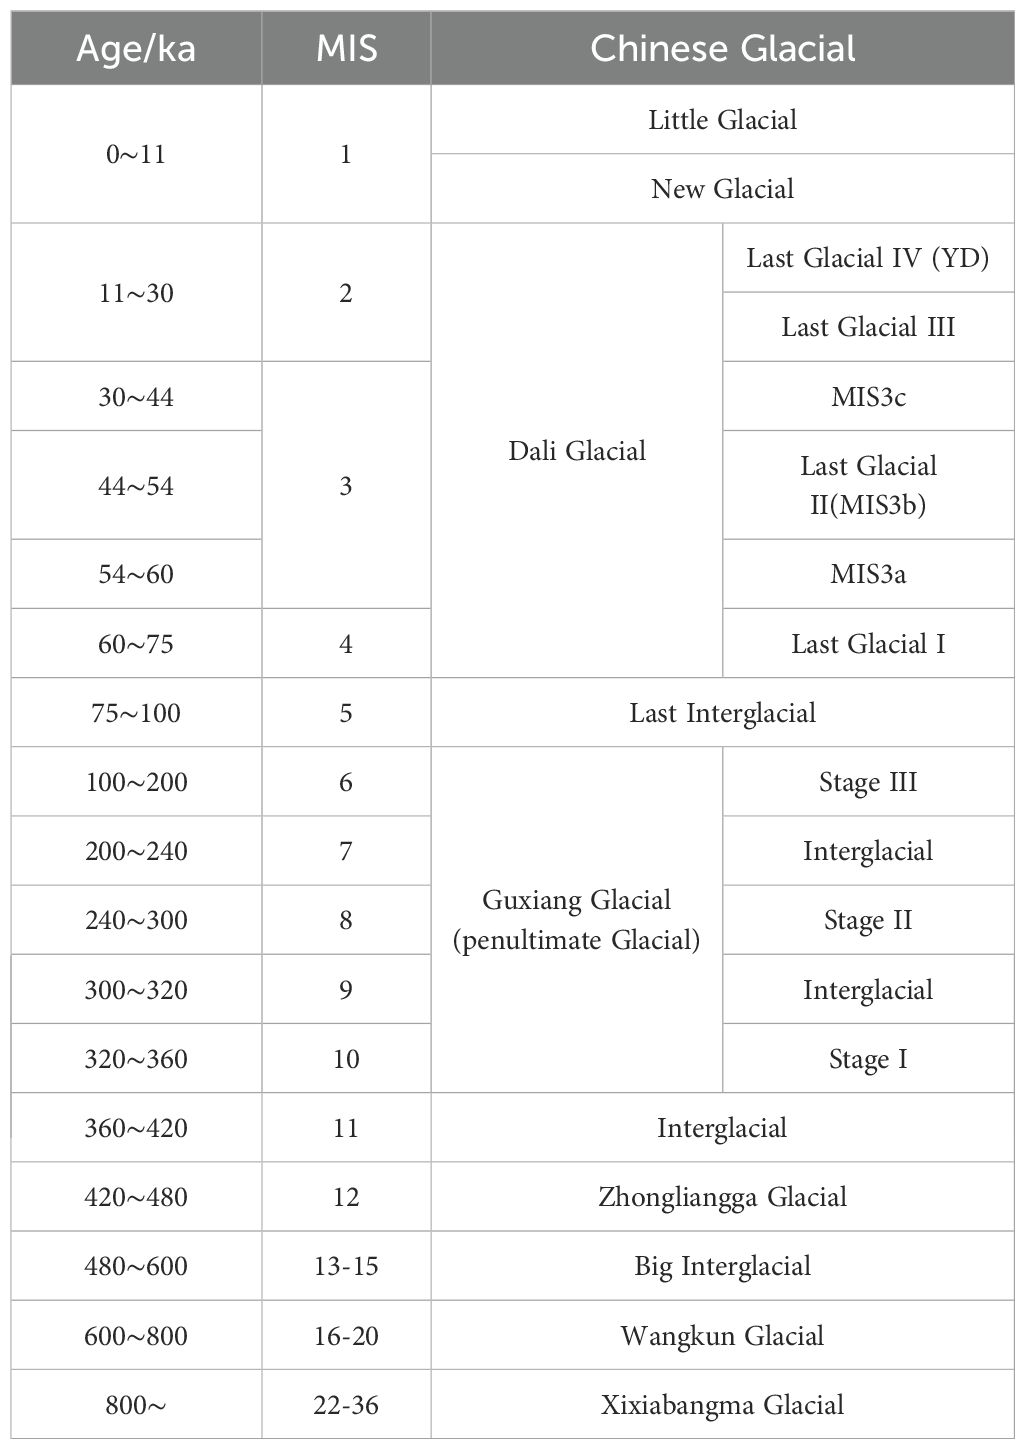
Table 1. A brief table of Quaternary Glaciation division in China (Cui et al., 2011).
Deep-sea sediment analysis of foraminiferal shell δ18O isotopes has widely demonstrated the periodic variations in global ice volume, aligning with Milankovitch cycles. In particular, a series of significant glacial-interglacial events in the Northern Hemisphere since 3 Ma have highlighted a prominent 41 kyr obliquity period (Raymo et al., 1989). However, during the Mid-Pleistocene (0.8 Ma), the dominant period of the glacial cycle shifted to the 100 kyr eccentricity period, while still exhibiting robust obliquity band energy (Hays et al., 1976). Moreover, scholars have noted the compelling correlation between the 20 kyr precession period and the timing of glacier movement (Liautaud et al., 2020). Zech extensively studied the sediment outcrops of the Dyanushka valley in northeast Siberia, determining the duration of several glacial periods in the region and their correlation with minimum insolation and the 41 kyr obliquity period (Zech et al., 2011).
Based on the carbon and oxygen isotope data of foraminifera from Site ODP1146, Wang analyzed the evolution of the upper water column structure in the northern SCS since the Middle Pleistocene (Wang et al., 2019). It was observed that from 0.9 Ma to 0.6 Ma, the dominant glacial cycle shifted gradually from 41 kyr to 100 kyr in the northern SCS, stabilizing at a 100 kyr period after 0.6 Ma. By comparing insolation, the 100 kyr period, and the 41 kyr period with the investigated glacial periods in study area, a clear correlation between glacial periods and the 100 kyr eccentricity period was observed (Figure 14). The results indicate a gradual transition of oxygen isotope cycles reflecting ice volume to a stable 100 kyr period, with a good alignment between high ice volume and low insolation intensity during glacial phases. After 0.6 Ma, the duration of the glacial period essentially corresponded to the minima of the 100 kyr cycle, confirming the dominance of the 100 kyr glacial cycle in this period. Since the Quaternary, periodic changes in the Earth’s orbital parameters have led to cyclic variations in climate and environment, resulting in extensive glacial activity, which has gradually become a main cause of sea level changes (Chen, 2010; Pittet et al., 2014). Li synthesized the global relative sea-level (RSL) records for the past 2 Ma and found an obvious response to the Earth’s orbital parameters, with RSL exhibiting a good negative correlation with δ18OB (Li and Wang, 2016). Comparing the relationship between the mid-to-high latitude sea surface temperatures and the synthetized RSL, a significant correlation was found in eccentricity and obliquity periods, with higher impact during glacial periods. As water temperature rises, sea levels often increase, counteracting the effects of bottom water temperature rises. The sensitivity of GHSZ thickness to temperature and pressure conditions varies at different water depths, leading to different main controlling factors for GHSZ thickness changes at various depths. Liu quantitatively analyzed the influence of temperature and pressure changes on GHSZ thickness and found that since the Last Glacial Maximum (LGM), changes in GHSZ thickness in mid-layer water are mainly influenced by seafloor temperature (Liu et al., 2021). Therefore, for hydrates in shallow sediment layers, the low temperature environment during glacial periods may be more conducive to hydrate stability. In connection with the Milankovitch cycles, during the low amplitude of the 405 kyr period or the minima of the 100 kyr period, characterized by a lower temperature environment, there is a greater likelihood of dynamic hydrate accumulation since the early Pleistocene. The research findings on the Milankovitch cycles could provide new insights for the prediction of gas hydrate.
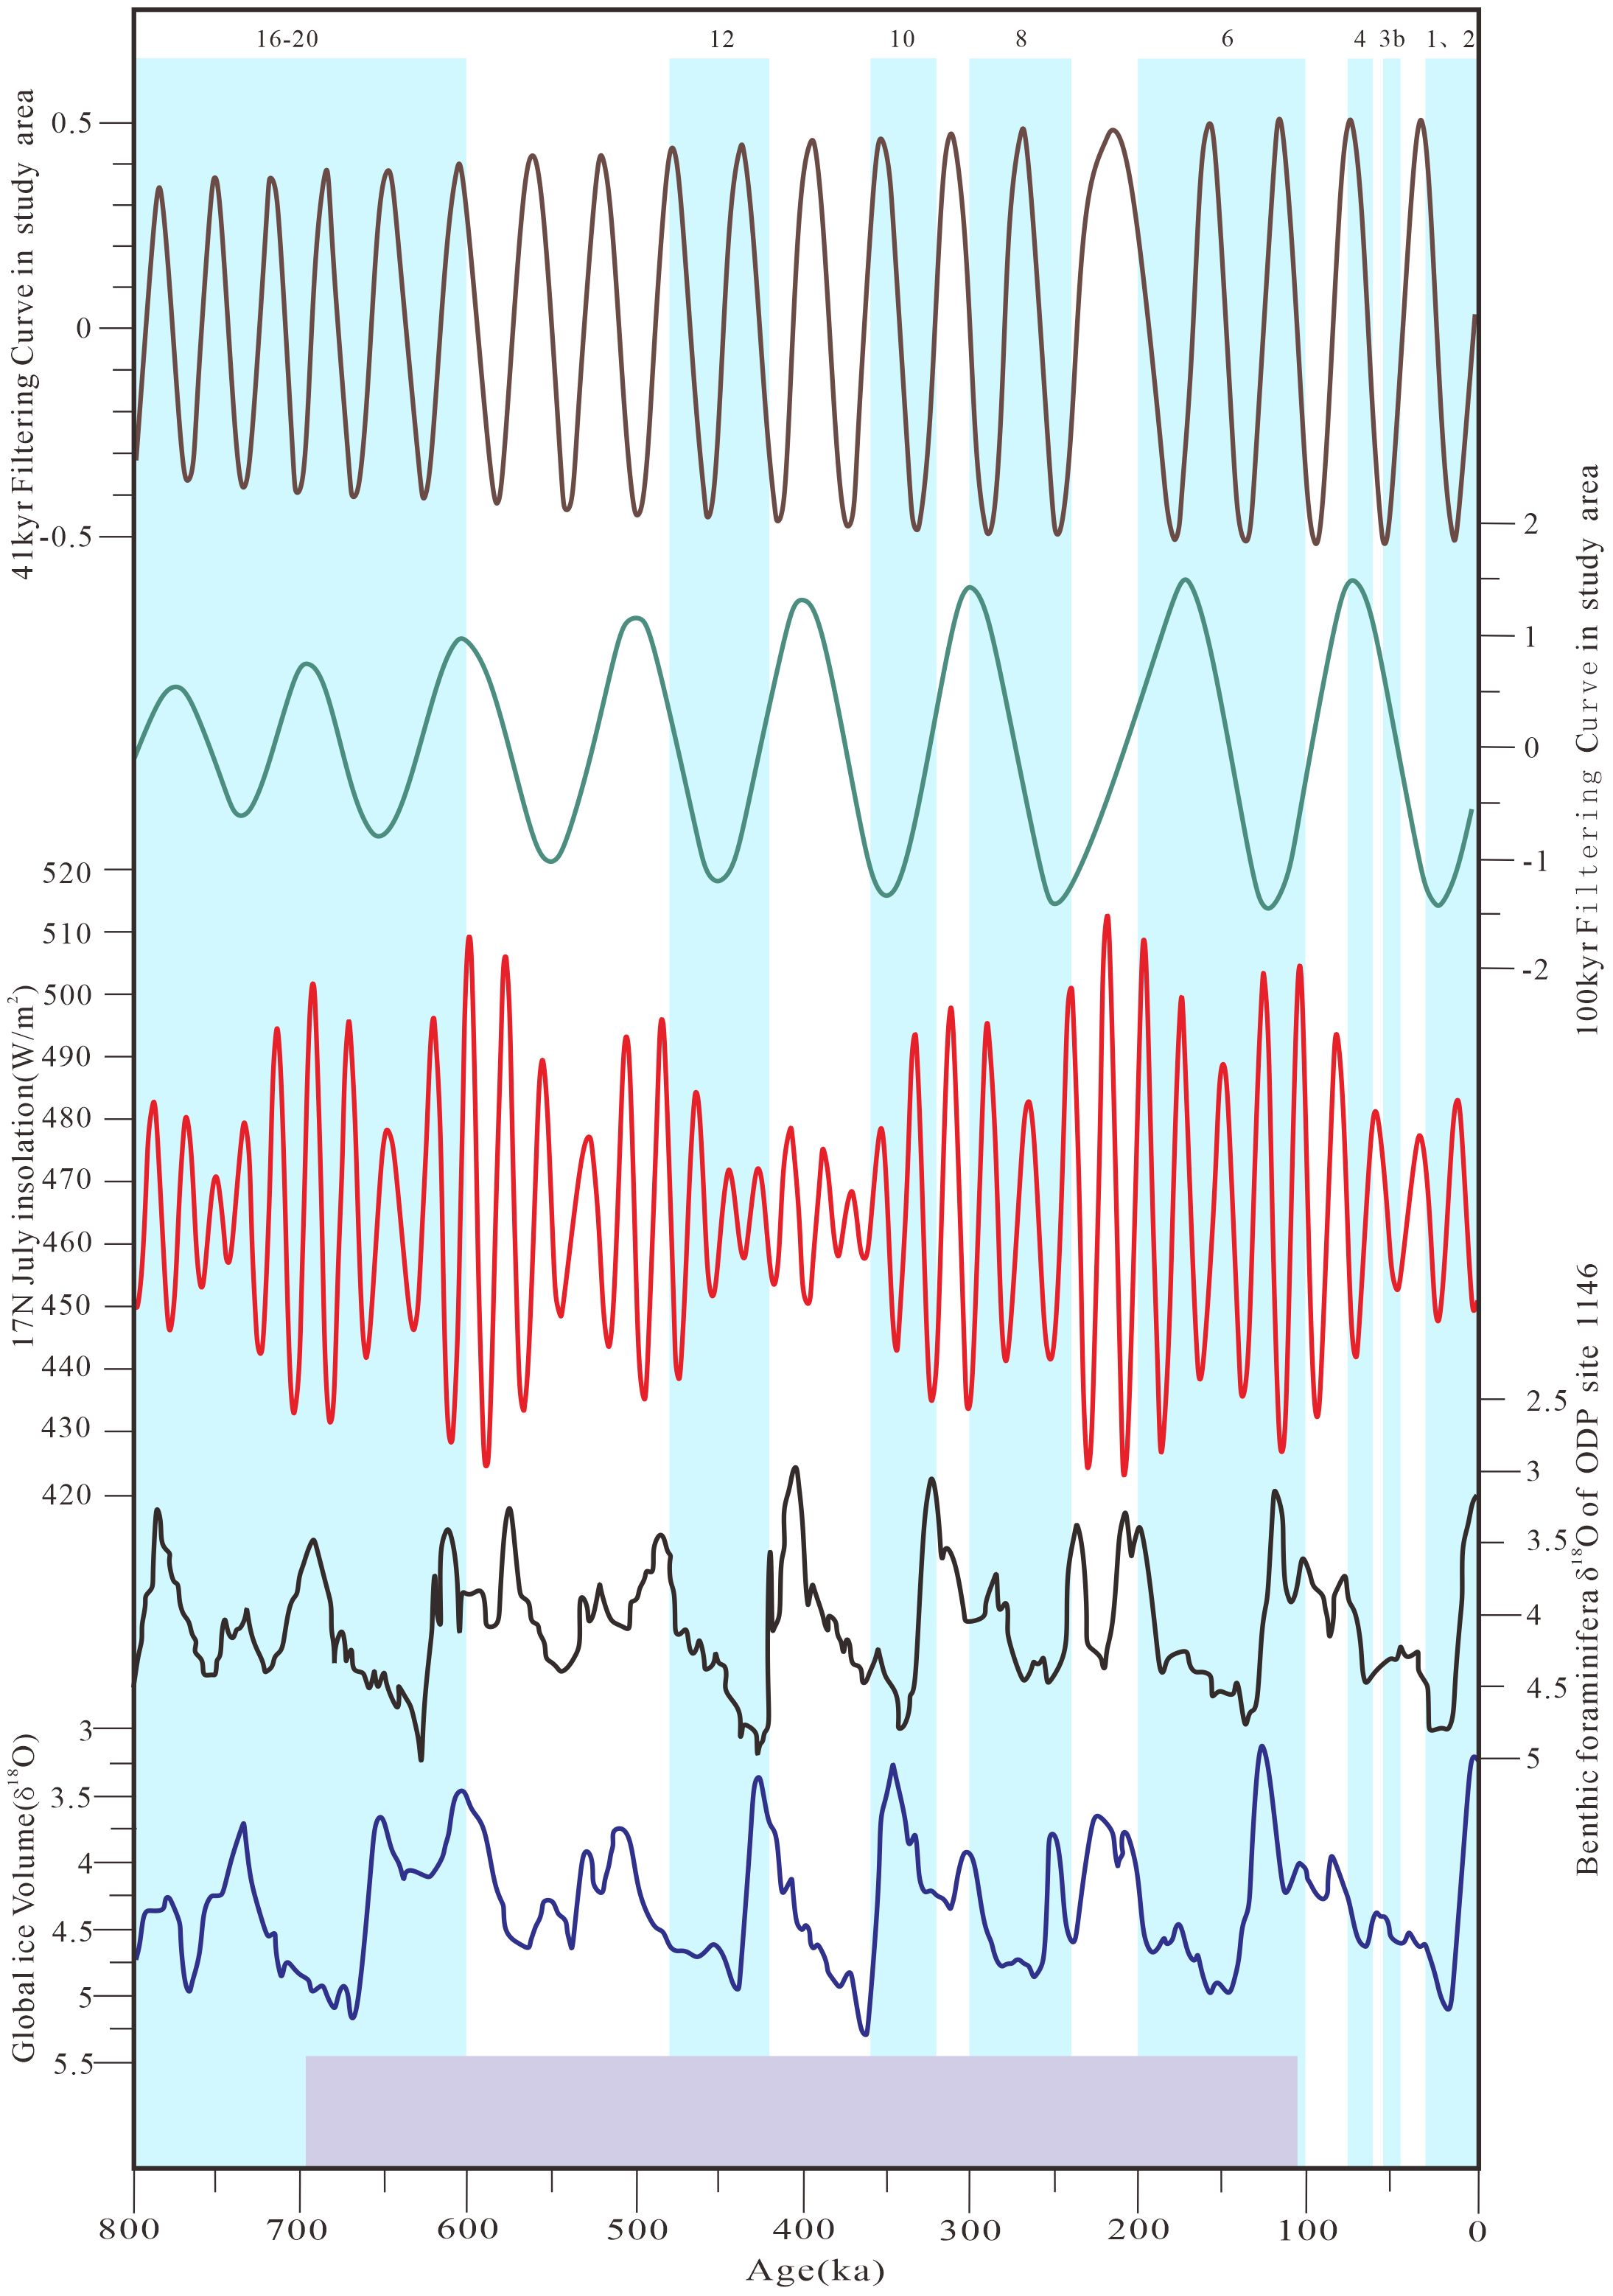
Figure 14. Comparison of glacial and insolation, 100ka obliquity period and 41ka precession period in the study area. Global ice volume data from Lisiecki and Raymo, 2005, and Benthic foraminifera δ18O data from Wang et al., 2019. Blue bars with top numbers (MIS) denote the glacial. Purple bars at the bottom represents hydrate in the first section of the study interval.
6 Conclusions
1. Natural gamma ray data from well W01 indicates the presence of astronomical orbital signals in the stratigraphy, confirming the existence of Milankovitch cycles in the shallow layers of sediments in the deepwater region of the SCS. Based on previous age data, an absolute astronomical time scale for W01 was established.
2. Major trace element indicators reveal variations in paleoclimate, paleosalinity, and paleoredox, all exhibiting a response to astronomical orbital periods. All three indices consistently display a periodic thickness of 27 m, corresponding to a 405 kyr period. This suggest that the 405 kyr long eccentricity period has a certain regulatory effect on the paleoclimate, paleosalinity, and paleoredox environmental conditions.
3. Reconstructed sea level change curve using sedimentary noise models is consistent with the curve derived from paleobiological data, validating the accuracy of the established astronomical scale and the reliability of the reconstructed sea level. Simultaneously, the trend of sea level changes resembles the 1.2 Myr obliquity modulation period during 2.5-0.8 Ma, indicating that the 1.2 Myr period was one of the driving factors of sea level variations in the QDNB during the early Pleistocene.
4. The fluctuating trend in TOC data highly mirrors the amplitude variation in the 170 kyr filtering curve. This similarity, coupled with the stability of the 170 kyr observed in the eFFT analysis, underscores the regulatory influence of astronomical periods on carbon cycling in the low-latitude study area. There is a positive correlation between the two factors, where higher amplitudes in the 170 kyr period signify high TOC content.
5. Moreover, the minimum amplitude of the 100 kyr cycle correspond to glacial periods, providing evidence that the dominant cycle of glacial-interglacial transitions is 100 kyr period in the northern SCS over the past 0.6 Ma. The influence of astronomical orbital periods is evident in paleoclimate, sea level variations, TOC content, and glacial-interglacial transitions. A close connection has been established between Milankovitch cycles and the formation and decomposition of gas hydrates. The correlation between these two factors indicates that for the accumulation of gas hydrate is more favorable during the low-amplitude phase of 405 kyr eccentricity period or the minimum values of the 100 kyr period in the Early Pleistocene.
Data availability statement
The datasets presented in this study can be found in online repositories. The names of the repository/repositories and accession number(s) can be found in the article/Supplementary Material.
Author contributions
YD: Investigation, Methodology, Software, Writing – original draft, Writing – review & editing, Formal analysis. RW: Formal analysis, Funding acquisition, Methodology, Supervision, Writing – review & editing. JL: Supervision, Writing – review & editing. YH: Supervision, Writing – review & editing. JR: Supervision, Writing – review & editing. WS: Formal analysis, Supervision, Writing – review & editing. XW: Writing – review & editing. HD: Writing – review & editing. XX: Writing – review & editing. AB: Writing – review & editing.
Funding
The author(s) declare financial support was received for the research, authorship, and/or publication of this article. This study was financially supported by the National Natural Science Foundation of China (No. 42202121). The data and samples acquired in the research process is primarily collected from Guangzhou Marine Geological Survey, Guangzhou.
Acknowledgments
The software used in the research designed by Mingsong Li of Peking University. Thanks to the editor and reviewers for the suggestions and other assistance in improving this manuscript.
Conflict of interest
The authors declare that the research was conducted in the absence of any commercial or financial relationships that could be construed as a potential conflict of interest.
Generative AI statement
The author(s) declare that no Generative AI was used in the creation of this manuscript.
Publisher’s note
All claims expressed in this article are solely those of the authors and do not necessarily represent those of their affiliated organizations, or those of the publisher, the editors and the reviewers. Any product that may be evaluated in this article, or claim that may be made by its manufacturer, is not guaranteed or endorsed by the publisher.
Supplementary material
The Supplementary Material for this article can be found online at: https://www.frontiersin.org/articles/10.3389/fmars.2024.1525477/full#supplementary-material
References
Berger A., Loutre M., Dehant V. (1989). Pre-quaternary Milankovitch frequencies. Nature 342, 133. doi: 10.1038/342133b0
Bostrom K., Kraemer T., Gartner S. (1973). Provenance and accumulation rates of opaline silica, Al, Ti, Fe, Mn, Cu, Ni and Co in Pacific pelagic sediments. Chem. Geol. 11, 123–148. doi: 10.1016/0009-2541(73)90049-1
Boulila S., Vahlenkamp M., De Vleeschouwer V., Laskar J., Yamamoto Y., Pälike H., et al. (2018). Towards a robust and consistent middle Eocene astronomical timescale. Earth Planet. Sci. Lett. 486, 94–107. doi: 10.1016/j.epsl.2018.01.003
Burton Z. F. M., Kroeger K. F., Hosford Scheirer A., Seol Y., Burgreen-Chan B., Graham S. A. (2020). Tectonic uplift destabilizes subsea gas hydrate: a model example from Hikurangi margin, New Zealand. Geophys. Res. Lett. 47, e2020GL087150. doi: 10.1029/2020GL087150
Cao H., Jin S., Hou M., Chen S., Liu Y., Chen A. (2022). Astronomical cycles calibrated the sea-level sequence durations of Late Miocene to Pliocene in Qiongdongnan Basin, South China Sea. Mar. Petroleum Geol. 143, 105813. doi: 10.1016/j.marpetgeo.2022.105813
Cao T. T., Liu H., Xiao J. Y., Pan A. Y., Deng M. (2024). Paleoenviromental reconstruction and organic matter accumulation mechanism for Youganwo formation oil shale in Maoming Basin. Earth Sci. 49, 1367–1384. doi: 10.3799/dqkx.2022.260
Cen X., Wang R., Shi W. Z., Cheng R. H., Shen Y. J., Hu X. Q., et al. (2024). Lacustrine environment evolution in the Mesozoic North Yellow Sea Basin, eastern China: Insight from the transition of Jurassic grey mudstones to Cretaceous red successions. Palaeogeogr. Palaeoclimatol. Palaeoecol. 649, 112337. doi: 10.1016/j.palaeo.2024.112337
Charbonnier G., Boulila S., Spangenberg J. E., Adatte T., Föllmi K. B., Laskar J. (2018). Obliquity pacing of the hydrological cycle during the Oceanic Anoxic Event 2. Earth Planet. Sci. Lett. 499, 266–277. doi: 10.1016/j.epsl.2018.07.029
Chen C. L. (2010). Long term Trends in global sea level—Analyses and predictions [master’s thesis]. (Shandong: China Ocean University).
Chen H., Zhou T. (1997). Natural gas hydrate and global change. Adv. Earth Sci. 01), 38–43. doi: 10.11867/j.issn.1001-8166.1997.01.0037
Chen Y. J. (1982). Discussion on radiocarbon ages of shells in coastal and shelf deposits and its geological interpretation. Mar. Sci. (04), 15–19.
Coffin R. B., Osburn C. L., Plummer R. E., Smith J. P., Rose P. S., Grabowski K. S. (2015). Deep sediment-sourced methane contribution to shallow sediment organic carbon: Atwater Valley, Texas-Louisiana Shelf, Gulf of Mexico. Energies 8, 1561–1583. doi: 10.3390/en8031561
Cui Z. J., Chen Y., Zhang W., Zhou L. P., Zhang M., Li C. C. (2011). Discussion on the history, characteristics and causes of Quaternary glaciation in China. Quaternary Sci. 31, 749–764. doi: 10.3969/j.issn.10017410.2011.05.01
Das B. K., Haake B. G. (2003). Geochemistry of Rewalsar Lake sediment, Lesser Himalaya, India: implications for source-area weathering, provenance and tectonic setting. Geoscience 7, 299–312. doi: 10.1007/BF02919560
Deng W., Liang J. Q., Kuang Z. G., Xie Y. F., Yan P. (2023). Estimation of gas hydrate saturation regarding the hydrate morphology in hydrate-bearing sands in the Qiongdongnan Basin, South China Sea. Pure Appl. Geophys. 180, 2757–2773. doi: 10.1007/s00024-023-03299-7
Deng X. L., Lin L. B., Yu Y., Wang Y. N., Li Y. C., Guo Y. (2020). Geochemical characteristics and palaeoenvironmental significance of Qixia Formation in Jiange area, Sichuan, China. J. Chengdu Univ. Technol. (Sci. Technol. Ed.) 47, 198–209. doi: 10.3969/j.issn.1671-9727.2020.02.08
Diao F., Zou H. Y., Hao F., Jin F. M., Sun Y. H., Luo Q., et al. (2014). Characteristics and depositional models of source rocks in Langgu Sag, Bohai Bay Basin. Oil Gas Geol. 35, 326–335. doi: 10.11743/ogg20140305
Du H. (2022). Efficient natural gas transportation system and its influence on gas hydrate enrichment in the Qiongdongnan [master’s thesis]. (Wuhan: China University of Geosciences).
Du H., Shi. W. Z., Liang J. Q., Wang R., He Y. L., Xu L. T. (2021). Genesis of mass transport deposits and their effect on gas hydrate accumulation in the Qiongdongnan Basin. Oil Geophys. Prospecting 56, 869–881 + 676. doi: 10.13810/j.cnki.issn.1000-7210.2021.04.020
Du H., Shi. W. Z., Wang R., Maselli V., Liang J. Q., Ren J. F., et al. (2024). Dynamic evolution of gas hydrate systems affected by magmatism and Quaternary mass-transport deposits in the Qiongdongnan Basin, South China Sea, and implications for the global carbon cycle. Mar. Geol. 468, 107209. doi: 10.1016/j.margeo.2023.107209
Fang Y. X., Li M. B., Chu F. Y. (2004). The influence to global climate change of the methane releasing from the marine gas hydrate. Prog. Geophys. 19 (02), 286–290.
Fang X. Y., Yao Z., Liao J., Ge J. W., Zhao X. M., Song P., et al. (2022). Sequence stratigraphic architecture of the Quaternary Ledong Formation in the deep-water area of the Qiongdongnan Basin and its significance to gas hydrate exploration. Mar. Geol. Front. 38, 51–60. doi: 10.16028/j.1009-2722.2021.121
Feng L. Y., Zhang J. G., Jiang Z. X., Li C. S., Bai Y. F. (2023). High-precision sedimentary cycle frame work and organic matter enrichment response of Qingshankou Formation in Songliao Basin. Acta Petrolei Sin. 44, 299–311. doi: 10.7623/syxb202302006
Fu J., Li S., Xu L., Niu X. B. (2018). Paleo-sedimentary environmental restoration and its significance of Chang 7 Member of Triassic Yanchang Formation in Ordos Basin, NW China. Petroleum Explor. Dev. Online 45, 998–1008. doi: 10.1016/S1876-3804(18)30104-6
Gan J., Wu D., Zhang Y., Liu S. W., Guo M. G., Li X. L., et al. (2019). Distribution pattern of present-day formation temperature in the Qiongdongnan Basin: implications for hydrocarbon generation and preservation. Geological J. China Universities 25, 952–960. doi: 10.16108/j.issn1006-7493.2019053
Gao X. Y., Shao L. Y., Wang X. T. (2022). Astronomical forcing in Lopingian coal-bearing cycles: a case study of Bijie area in northwestern Guizhou. J. Min. Sci. Technol. 7, 009. doi: 10.19606/j.cnki.jmst.2022.01.009
Gong Y. M., Xu R., Tang Z. D., Li B. H. (2004). The Upper Devonian orbital cyclostratigraphy and numerical dating conodont zones from Guangxi, South China. Scientia Sin. (Terrae) 34 (7), 635–643. doi: 10.1360/zd2004-34-7-635
Hatch J. R., Leventhal J. S. (1992). Relationship between inferred redox potential of the depositional environment and geochemistry of the Upper Pennsylvanian (Missourian) Stark Shale Member of the Dennis Limestone, Wabaunsee County, Kansas, U.S.A. Chem. Geol. 99, 65–82. doi: 10.1016/0009-2541(92)90031-Y
Hays J. D., Imbrie J., Shackleton N. J. (1976). Variations in the Earth’s Orbit: Pacemaker of the ice ages. Science 194, 1121–1132. doi: 10.1126/science.194.4270.1121
He Y. L., Liang J. Q., Shi. W. Z., Kuang Z. G., Deng W., Wang R., et al. (2022). Influencing factors and accumulation modes of gas hydrate in south low uplift and its surrounding area of Qiongdongnan Basin. J. Earth Sci. 47, 1711–1727. doi: 10.3799/dqkx.2021.207
He J. X., Yan W., Zhu Y. H., Hu Y., Zhang J. R., Gong X. F. (2013). Genetic type of gas hydrate in the world and their main controlling factors. Mar. Geol. & Quaternary Geol. 33, 121–128. doi: 10.3724/SP.J.1140.2013.02121
Hinnov L. A. (2000). New perspectives on orbitally forced stratigraphy. Annu. Rev. Earth Planet. Sci. 28, 419–425. doi: 10.1146/annurev.earth.28.1.419
Hinnov L. A. (2013). Cyclostratigraphy and its revolutionizing applications in the earth and planetary sciences. GSA Bull. 125, 1703–1734. doi: 10.1130/B30934.1
Hinnov L. A. (2018). “Chapter one-Cyclostratigraphy and astrochronology in 2018,” in Stratigraphy & Timescales, vol. 3. Eds. Montenari M. (Academic Press, London), 1–80. doi: 10.1016/bs.sats.2018.08.004
Huang C. J. (2014). The current status of cyclostratigraphy and astrochronology in the Mesozoic. Earth Sci. Front. 21, 48–66. doi: 10.13745/j.esf.2014.02.005
Huang H., Gao Y., Ma C., Jones M. M., Zeeden C., Ibarra D. E., et al. (2021). Organic carbon burial is paced by a ~173-ka obliquity cycle in the middle to high latitudes. Sci. Adv. 7, eabf9489. doi: 10.1126/sciadv.abf9489
Jiang Z. H., Tu Q. P., Shi N. (2001). Multi-Taper Method of spectral analysis and applications in global warming study. Acta Meteorologica Sin. 4), 480–490. doi: 10.11676/qxxb2001.051
Jin Z. J., Zhang Y. W., Liu G. C., Li J. C., Larsen R. S., Shbilman B. I. (1996). Physical analysis method for sedimentary basin-wave analysis. Geological Rev. 42, 170–180.
Kim B., Zhang Y. G. (2022). Methane hydrate dissociation across the Oligocene–Miocene boundary. Nat. Geosci. 15, 203–209. doi: 10.1038/s41561-022-00895-5
Kodama K. P., Hinnov L. A. (2015). Rock Magnetic Cyclostratigraphy. (Wiley-Blackwell), 165 p. doi: 10.1002/9781118561294
Kvenvolden K. A. (1988). Methane hydrates and global climate. Global Biogeochem Cycles 2, 221–229. doi: 10.1029/GB002i003p00221
Kvenvolden K. A. (1993). Gas hydrates—geological perspective and global change. Rev. Geophys. 31, 173–187. doi: 10.1029/93RG00268
Kvenvolden K. A. (1994). Natural gas hydrate occurrence and issues. Ann. New York Acad. Sci. 715, 232–246. doi: 10.1111/j.1749-6632.1994.tb38838.x
Lai H. F., Fang Y. X., Kuang Z. G., Ren J. F., Liang J. Q., Lu J. A., et al. (2021). Geochemistry, origin and accumulation of natural gas hydrates in the Qiongdongnan Basin, South China Sea: Implications from site GMGS5-W08. Mar. Petroleum Geol. 123, 104774. doi: 10.1016/j.marpetgeo.2020.104774
Lambeck K., Chappell J. (2001). Sea level change through the last glacial cycle. Science 292, 679–686. doi: 10.1126/science.1059549
Laskar J., Robutel P., Joutel F., Gastineau M., Correia A. C. M., Levrard B. A. (2004). A long-term numerical solution for the insolation quantities of the earth. Astronomy Astrophysics 428, 261–285. doi: 10.1051/0004-6361:20041335
Lei K. Y., Liu C. Y., Zhang L., Wu B. L., Cun X. N., Sun L. (2017). Element Geochemical Characteristics of the Jurassic Mudstones in the Northern Ordos Basin: implications for tracing sediment sources and paleoenvironment restoration. Acta Sedimentologica Sin. 5, 621–636. doi: 10.14027/j.cnki.cjxb.2017.03.019
Li X., Fairweather L., Wu S. G., Ren J. Y., Zhong H. J., Quan X. Y., et al. (2013). Morphology, sedimentary features and evolution of a large palaeo submarine canyon in Qiongdongnan Basin, Northern South China Sea. J. Asian Earth Sci. 62, 685–696. doi: 10.1016/J.JSEAES.2012.11.019
Li M. S., Hinnov L. A., Huang C. J., Ogg J. G. (2018b). Sedimentary noise and sea levels linked to land-ocean water exchange and obliquity forcing. Nat. Commun. 9, 1004. doi: 10.1038/s41467-018-03454-y
Li Y. Y., Huang H., Gao Y., Cheng H., Hei C. L., Liang S., et al. (2024). The 170-kyr astronomical cycles in the Paleozoic Terrestrial Basin. Acta Sedimentologica Sin. 42, 39–51. doi: 10.14027/j.issn.1000-0550.2022.151
Li M. S., Kump L. R., Hinnov L. A., Mann M. E. (2018a). Tracking variable sedimentation rates and astronomical forcing in Phanerozoic paleoclimate proxy series with evolutionary correlation coefficients and hypothesis testing. Earth Planet. Sci. Lett. 501, 165–179. doi: 10.1016/j.epsl.2018.08.041
Li J. S., Li X. Q., Wang Y., Wang G., Xu X. D., Lin H. Y. (2021). Geochemical characteristics and hydrocarbon generation potential evaluation of source rocks in the deepwater area of Qiongdongnan Basin. J. Min. Sci. Technol. 24, 1–7. doi: 10.19606/j.cnki.jmst.2021.02.004
Li G. C., Shi J. Y., Fan T. L., Hu D. S., You J. J., Li Y. F., et al. (2023). Shale lithofacies association types and development models in Eocene lacustrine facies strata constrained by astronomical cycles: A case study of the Liushagang Formation in the Weixinan sag, Beibuwan Basin. Quaternary Sci. 43, 1614–1629. doi: 10.11928/j.issn.1001-7410.2023.06.09
Li W. B., Wang R. J. (2014). Research of the mechanism of sea level change during the last 100 ma. Mar. Geol. Quaternary Geol. 34, 117–127. doi: 10.3724/SP.J.1140.2014.01117
Li W. B., Wang R. J. (2016). Mechanism of Sea Level Change at the Earth Orbital Parameter Cycles during the Last 2 Ma BP. Earth Science, 41 (05), 742–756. doi: 10.3799/dqkx.2016.063
Li N., Wang X. D., Feng J. X., Chen F., Zhou Y., Wang M. Y., et al. (2023). Intermediate water warming caused methane hydrate instability in South China Sea during past interglacial. GSA Bulletin 136, 917–927. doi: 10.1130/B36859.1
Li H. Z., Zhang T. S., Zhang X., Gao L. B. (2023). Effects of sea level change modulated by astronomical orbital period on organic reefs development: a case study of Late Permian Changxing in Northeast Sichuan. Fault-Block Oil&Gas Field 30, 52–59. doi: 10.6056/dkyqt202301008
Liang J. W., Chang X. B., Tao W. X., Feng Z. W., Li H. L., Zong H., et al. (2024). Taphonomy of lycoptera fossils and its paleoclimate and paleoenvironment significance from cretaceous Liwaxia formation in Liupanshan area. Earth Sci. 49, 189–208. doi: 10.3799/dqkx.2022.194
Liang J. Q., Zhang W., Lu J. A., Wei J. G., Kuang Z. G., He Y. L. (2019). Geological occurrence and accumulation mechanism of natural gas hydrates in the eastern Qiongdongnan Basin of the South China Sea: Insights from site GMGS5-W9-2018. Mar. Geol. 418, 106042. doi: 10.1016/j.margeo.2019.106042
Liautaud P. R., Hodell D. A., Huybers P. J., et al. (2020). Detection of significant climatic precession variability in early Pleistocene glacial cycles. Earth and Planetary Science Letters, 536, 116137. doi: 10.1016/j.epsl.2020.116137
Lin S. S., Shan J. F., Yan J. C., Li X. Y., Liu G. W. (2023). Eocene Milankovitch record and its indicative significance of depositional response in the Northern Nanpu Sag. Sci. Technol. Eng. 23, 8085–8094. doi: 10.12404/j.issn.1671-1815.2023.23.19.08085
Lisiecki L. E., Raymo M. E. (2005). A Pliocene-Pleistocene stack of 57 globally distributed benthic δ18O records. Paleoceanography 20, 1003. doi: 10.1029/2004PA001071
Liu J., Liu L. L., Wu N. Y., Wu D. D., Jin G. R., Yang R. (2021). Evolution of gas hydrate stability zone in the deep water of Dongsha sea area since the Last Glaciation Maximum. Mar. Geology & Quaternary Geol. 41 (2), 146–155. doi: 10.16562/j.cnki.0256-1492.2020061801
Liu H., Qi S. G., Fan J. J., Guo W., Chen A. Z., Zhang S. J. (2024). Geochemical Characteristics and Sedimentary Environment of Paomaping manganese deposit in Changyang, Western Hubei Province. Earth Sci., 1–3. Available online at: http://kns.cnki.net/kcms/detail/42.1874.P.20240408.1409.003.html (Accessed November 09, 2024).
Liu J., Sun M. J., Su M., Yang R. (2016). The Application of Milankovitch High-Frequency Sequence Cycles in the Shenhu Area Hydrate Drilling Zone. The Abstract Collection of the 14th National Symposium on Paleogeography and Sedimentology, 97–98.
Liu X. T., Wang H. J., Liu J. R., Zhuang G. C. (2024). Microbial sulfate reduction and its role in carbon sequestration in marine sediments. J. Earth Sci. 35 (4), 1378–1138. doi: 10.1007/s12583-024-1998-4
Lu Y. H., Yang H. L., Lu H. L., Fang Y. X., Kuang Z. G. (2022). Geochemical implications for gas hydrate occurrence and seepage at Sites GMGS5-W07 and W09 in Qiongdongnan Basin, South China Sea. Front. Earth Sci. 10. doi: 10.3389/feart.2022.1003510
Lu Y. T., Yang T. T., Xu X. Y., Xu N., Liu X. L., Yan C., et al. (2022). Characteristics of Lower Miocene mixed deposits in Kutai Basin, Indonesia. Mar. Geol. & Quaternary Geol. 42, 158–166. doi: 10.16562/j.cnki.0256-1492.2021051403
Luo M., Cao Y. (2023). “Gas hydrates at seeps,” in South China Sea Seeps. Eds. Chen D., Feng D. (Springer, Singapore). doi: 10.1007/978-981-99-1494-4_4
Ma M., Chen G., Zhang G., Rahman M. J. J., Ma X. F. (2022). Geochemistry and provenance of Oligocene to middle Miocene sandstones in the Qiongdongnan Basin, northern South China Sea. Mar. Geol. 447, 106794. doi: 10.1016/j.margeo.2022.106794
Ma D. B., Wang Y., Chen X. Y., Wang S., Yang M., Du D. D. (2023). Quantitative restoration of eroded carbonate strata thickness by Milankovitch cycle: A case study of Ordovician strata in Lunnan Paleo⁃Uplift, Tarim Basin. Earth Sci. 48, 2933–2946. doi: 10.3799/dqkx.2023.057
Majorowicz J., Safanda J., Osadetz K. (2012). Inferred gas hydrate and permafrost stability history models linked to climate change in the Beaufort-Mackenzie Basin, Arctic Canada. Clim. Past 8, 667–682. doi: 10.5194/cp-8-667-2012
Mao K. N., Xie X. N., Xu W., Kang B. (2012). Identification and division of high-frequency cycles based on Milankovitch theory: A case study on Miocene Sanya and Meishan Formations in Qiongdongnan Basin. Petroleum Geol. & Experiment 34, 641–647. doi: 10.11781/sysydz201206641
Mei S. J. (1988). Application of petrochemistry to the study of pre-Sinian sedimentary environment and uranium source in Hunan. Hunan Geol. 03), 25–31.
Melles M., Brigham-Grette J., Minyuk P. S., Nowaczyk N. R., Wennrich V., DeConto R. M., et al. (2012). 2.8Million years of arctic climate change from Lake El’gygytgyn, NE Russia. Science 337, 315–320. doi: 10.1126/science.1222135
Meng M. M., Liang J. Q., Lu J. A., Zhang W., Kuang Z. G., Fang Y. X., et al. (2021). Quaternary deep-water sedimentary characteristics and their relationship with the gas hydrate accumulations in the Qiongdongnan Basin, Northwest South China Sea. Deep Sea Res. Part I: Oceanographic Res. Papers 177, 103628. doi: 10.1016/j.dsr.2021.103628
Meyers S. R., Hinnov L. A. (2010). Northern Hemisphere glaciation and the evolution of Plio-Pleistocene climate noise. Paleoceanogr. Paleoclimatol. 25, PA3207. doi: 10.1029/2009PA001834
Miao X. M., Feng X. L., Hu L. M., Li J. R., Liu X. T., Wang N., et al. (2022). Coupled δ15NTN and δ13CTOC insights into methane seepage activities in bulk marine sediments of the Qiongdongnan Basin, South China Sea. J. Ocean Univ. China 21, 1495–1503. doi: 10.1007/s11802-022-5049-4
Milankovitch M. (1948). Ausbau und gegenwärtiger Stand der astronomischen Theorie der erdgeschichtlichen Klimate. Experientia 4, 413–418. doi: 10.1007/BF02144986
Mudelsee M. (2010). “Climate time series analysis: classical statistical and bootstrap methods,” in Climate Time Series Analysis. (Switzerland: Springer Cham). 454 p.
Mudelsee M., Bickert T., Lear C. H., Lohmann G. (2014). Cenozoic climate changes: A review based on time series analysis of marine benthic δ18O records. Rev. Geophys. 52, 333–374. doi: 10.1002/2013RG000440
National Bureau of Technical Supervision. GB/T 12763.8-2007, Specifications for marine survey Part 8: Marine geological and geophysical survey. General Administration of Quality Supervision, Inspection and Quarantine of the People’s Republic of China, National Standardization Administration.
Ning F. L., Liang J. Q., Wu N. Y., Zhu Y. H., Wu S. G., Liu C. L., et al. (2020). Reservoir characteristics of natural gas hydrates in China. Natural Gas Industy 40, 1–24. doi: 10.3787/j.issn.1000-0976.2020.08.001
Paull C. K., Ussler W., Dillon W. P. (1991). Is the extent of glaciation limited by marine gas-hydrates? Geophys. Res. Lett. 18, 432–443. doi: 10.1029/91GL00351
Peng J., Yu L. D., Xu T. Y., Han H. D., Yang Y. M. (2022). Research procedure of astrostratigraphy and case study of Dongying Sag, Bohai Bay Basin. Oil & Gas Geol. 43, 1292–1308. doi: 10.11743/ogg20220602
Pittet B., Suan G., Lenoir F., Duarte L. V., Mattioli E. (2014). Carbon isotope evidence for sedimentary discontinuities in the lower toarcian of the Lusitanian Basin (Portugal): sea level change at the onset of the oceanic anoxic event. Sedimentary Geol. 303, 1–14. doi: 10.1016/j.sedgeo.2014.01.001
Raymo M. E., Ruddiman W. F., Backman J., Martinson D. G. (1989). Late Pleistocene variation in northern hemisphere ice sheets and North Atlantic deep water Circulation. Paleoceanography 4, 413–446. doi: 10.1029/PA004i004p00413
Shi X., Jiang H., Yang J., Yang X. Q., Xu H. H. (2017). Models of the rapid post-rift subsidencein the eastern Qiongdongnan Basin, South China Sea: implications for the development of the deep thermalanomaly. Basin Res. 29, 340–362. doi: 10.1111/bre.12179
Shi J. Y., Jin Z. J., Liu Q. Y., Huang Z. K., Zhang R. (2019). Quantitative classification of high-frequency sequences in fine-grained lacustrine sedimentary rocks based on Milankovitch theory. Oil&Gas Geol. 40, 1205–1214. doi: 10.11743/ogg20190605
Shi Z. G., Lei J., Zhou P., Ren X. (2020). Numerical simulation researches on orbital-scale Asian climate dynamics: History and perspective. Quaternary Sci. 40, 8–17. doi: 10.11928/j.issn.1001-7410.2020.01.02
Song H. (2003). Researches on dynamic evolution of gas hydrate system (l): Its development in geological history. Prog. Geophys. 02), 188–196.
Song B. J., Cheng Y. F., Yan C. L., Han Z. Y., Ding J. P., Li Y., et al. (2019). Influences of hydrate decomposition on submarine landslide. Landslides 16, 2127–2150. doi: 10.1007/s10346-019-01217-4
Su P. B., Lin L., Lv Y. Y., Liang J. Q., Sun Y. B., Zhang W., et al. (2022). Potential and distribution of natural gas hydrate resources in the South China Sea. J. Mar. Sci. Eng. 10, 1364. doi: 10.3390/jmse10101364
Sun S. Y., Liu H. M., Cao Y. C., Zhang S., Wang Y., Yang W. Q. (2017). Milankovitch cycle of lacustrine deepwater fine-grained sedimentary rocks and its significance to shale oil: A case study of the upper Es4 member of well NY1 in Dongying sag. J. China Univ. Mining&Technol. 46, 846–858.
Sun Y., McManus J. F., Clemens S. C., Vogel H., Hodell D. A., Guo F., et al. (2021). Persistent orbital influence on millennial climate variability through the Pleistocene. Nat. Geosci. 14, 812–818. doi: 10.1038/s41561-021-00794-1
Sun T. T., Wu D. D., Pan M. D., Yang F., Wu N. Y., Cheng X. G., et al. (2018). Geochemical characteristics of surface sediments in the Southern Qiongdongnan Basin of the northern South China Sea and its implication for sedimentary environment. J. Trop. Oceanogr. 37, 70–80. doi: 10.11978/2017091
Tan C., Yuan X. J., Yu B. S., Liu C., Li W., Cui J. W. (2019). Geochemical characteristics and paleoclimatic implications of the Upper Permian and Middle-Lower Triassic strata in Southern Ordos Basin. Geoscience 33, 615–628. doi: 10.19657/j.geoscience.1000-8527.2019.001
Thomson D. J. (1982). Spectrum estimation and harmonic analysis. IEEE 70, 1055–1096. doi: 10.1109/PROC.1982.12433
Tian J., Wang P. X., Cheng X. R., Li Q. Y. (2005). Astronomically tuned time scale 12Ma to 18.3Ma, ODP site 1148, Northern South China Sea. Earth Sci. 05), 513–518.
Tribovillard N., Algeo T. J., Lyons T., Riboulleau A. (2006). Trace metals as paleoredox and paleoproductivity proxies: An update. Chem. Geol. 232, 12–32. doi: 10.1016/j.chemgeo.2006.02.012
Wang K. (2022). Tectonic evolution and Paleogene prototype restoration of Songnan Baodao sag in Qiongdongnan Basin (Beijing: China University of Geology).
Wang H. S., Dang H. W., Jian Z. M. (2019). Variations in the upper water structure of northern South China Sea during the mid-Pleistocene Climate Transition Period: Planktonic foraminifera oxygen isotope records of ODP site 1146. Quaternary Sci. 39, 316–327. doi: 10.1126/science.aay2057
Wang Z. F., Li X. S., Sun Z. P., Huang B. J., Zhu J. T., Yao Z., et al. (2011). Hydrocarbon accumulation conditions and exploration potential in the deep-water region, Qiongdongnan Basin. China Offshore Oil Gas 23, 7–13 + 31.
Weedon G. P. (2003). Time-Series Analysis and Cyclostratigraphy: Examining Stratigraphic Records of Environmental Cycles. Cambridge: Cambridge University Press. 259.
Wei S. J. (1987). Analysis of the Great Ice Age and its causes in geological history. J. Cent. China Normal Univ. (Nat. Sci.) 02), 276–282.
Wei K. S., Cui H. Y., Ye S. F., Li D. L., Liu T. S., Liang J. S., et al. (2001). High-precision sequence stratigraphy in Qiongdongnan Basin. Earth Sci. 01), 59–66.
Wei J. G., Liang J. Q., Lu J. A., Zhang W., He Y. L. (2019). Characteristics and dynamics of gas hydrate systems in the northwestern South China Sea-Results of the fifth gas hydrate drilling expedition. Mar. Petrol. Geol. 110, 287–298. doi: 10.1016/j.marpetgeo.2019.07.028
Wei N., Pei J., Zhao J. Z., Zhang L. H., Zhou S. W., Luo P. Y., et al. (2022). A state-of-the-art review and prospect of gas hydrate reservoir drilling techniques. Front. Earth Sci. 10. doi: 10.3389/feart.2022.997337
Wei J. G., Wu T. T., Zhu L. Q., Fang Y. X., Liang J. Q., Lu H. L., et al. (2021). Mixed gas sources induced co-existence of SI and SII gas hydrates in the Qiongdongnan Basin, South China Sea. Mar. Petroleum Geol. 128, 105024. doi: 10.1016/j.marpetgeo.2021.105024
Wu J. (2023). Study on Cenozoic Sedimentary Evolution of Qiongdongnan Basin, South China Sea (Beijing: China University of Geology).
Wu N. Y., Huang L., Su Z., Yang G., Wang H., Liang J., et al. (2013). A study of geological evaluation indicators for the exploitation potential of marine natural gas hydrates: Theory and methodology. Natural Gas Industry 33, 11–17. doi: 10.3787/j.issn.1000-0976.2013.07.002
Wu S. Y., Liu J. (2015). Characteristics of Milankovitch cycle in eocene formation, eastern depression of the North Yellow Sea basin. Earth Sci. (Journal China Univ. Geosci.) 40, 1933–1944. doi: 10.3799/dqkx.2015.174
Wu H. C., Zhang S. H., Feng Q. L., Fang N. Q., Yang T. S., Li H. Y. (2011). Theoretical basis, research advancement and prospects of cyclostratigraphy. Earth Sci. (Journal China Univ. Geosci.) 36, 409–428. doi: 10.3799/dqkx.2011.045
Xi S. L., Zheng C. B., Li Z. H. (2004). Geochemical characteristics and its sedimentary environment significance of the Ordovician in the western margin of Ordos Basin. J. Palaeogeogr. (Chinese Ed.) 02), 196–206. doi: 10.7605/gdlxb.2004.02.008
Xie J. Y., Zhu Y. H., Li X. H., Mai W., Zhao P. X. (2012). The cenozoic sea-level changes in Yinggehai-Qiongdongnan Basin, Northern South China Sea. Mar. Origin Petroleum Geol. 17, 49–58. doi: 10.3969/j.issn.1672-9854.2012.01.008
Xiong X. H., Xiao J. H. (2011). Geochemical indicators of sedimentary environments-A summary. Earth Environ. 39, 05–414.
Xu L. T. (2023). Tectonic evolution and its influence on gas hydrate accumulation in the deep water area of Qiongdongnan Basin [master’s thesis]. (Wuhan: China University of Geosciences).
Xu L. T., He Y. L., Shi W. Z., Liang J. Q., Wang R., Du H., et al. (2021). Main controlling factors and ptterns of gas hydrate accumulation in the deep water area of Qiongdongnan Basin. Acta Petrolei Sin. 42, 598–610. doi: 10.7623/syxb202105004
Xu K., Ren J. Y., Kemp D. B., Ler C., Zhu H. T., Zheng J. Y., et al. (2023). Astronomical pacing of third-order sea-level sequences during the middle Miocene in the northern south China sea. Mar. Petroleum Geol. 154, 106335. doi: 10.1016/j.marpetgeo.2023.106335
Yan Y., Xia B., Lin G., Liu B. M., Yan P., Li Z. C. (2005). The Sedimentary and tectonic evolution of the basins in the North Margin of the South China Sea and geodynamic setting. Mar. Geology&Quaternary Geol. 02), 53–61. doi: 10.16562/j.cnki.0256-1492.2005.02.009
Yang H. F., Zhao Y., Cui Q. Y., Ren W. H., Li Q. (2021). Paleoclimatic indication of X-ray fluorescence core-scanned Rb/Sr ratios: A case study in the Zoige Basin in the eastern Tibeta-n Plateau. Sci. China Earth Sci. 64, 80–95. doi: 10.1007/s11430-020-9667-7
Yu X. H., Fu C., Hua G. L., Sun L. (2019). Future alternative energy: Challenges and prospects of natural gas hydrate. J. Palaeogeogr. (Chinese Ed.) 21, 107–126. doi: 10.7605/gdlxb.2019.01.006
Yuan Y. S., Yang S. C., Hu S. B., He L. J. (2008). Tectonic subsidence of Qiongdongnan Basin and its main control factors. Chin. J. Geophys. 02), 376–383.
Zachos J., Pagani M., Sloan L., Thomas E., Billups K. (2001a). Trends, rhythms, and aberrations in global climate 65 ma to present. Science 292, 686–693. doi: 10.1126/science.1059412
Zachos J., Shackleton N. J., Revenaugh J. S., Palike H., Flower B. P. (2001b). Climate response to orbital forcing across the oligocene-miocene boundary. Science 292, 274–278. doi: 10.1126/science.1058288
Zech W., Zech R., Zech M., Leiber K., Dippold M., French M., et al. (2011). Obliquity forcing of Quaternary glaciation and environmental changes in NE Siberia. Quaternary Int. 234, 133–145. doi: 10.1016/j.quaint.2010.04.016
Zhang G. L. (2020). Characteristics of Sea Level Change in the South China Sea since 18.5Ma [master’s thesis]. (Chengdu: Chengdu University of Technology).
Zhang G. L., Cao J., Deng Y. N., Lai H. F., Jiang X. X., Fang Y. X., et al. (2023). A 209,000-year-old history of methane seepage activity controlled by multiple factors in the South China Sea. Mar. Petroleum Geol. 151, 106200. doi: 10.1016/j.marpetgeo.2023.106200
Zhang J. G., Jiang Z. X., Liang C., Baars T. F., Wang Y. W., Abels H. A. (2022). Astronomical forcing of meter-scale organic-rich mudstone–limestone cyclicity in the Eocene Dongying sag, China: Implications for shale reservoir exploration. AAPG Bull. 106, 1557–1579. doi: 10.1306/02072220103
Zhang R., Li X. J., Xu Y., Li J. X., Sun L., Yue L. P., et al. (2022). The 173-kyr obliquity cycle pacing the Asian monsoon in the eastern Chinese Loess Plateau from Late Miocene to Pliocene. Geophys. Res. Lett. 49, e2021GL097008. doi: 10.1029/2021GL097008
Zhang W., Liang J. J., He J. X., Cong X. R., Su P. B. (2017). Characteristics of mud diapir and gas chimney and their relationship with reservoir forming for petroleum and natural gas hydrate on northern slope of the South China Sea. Mar. Geol. Front. 33, 11–23. doi: 10.16028/j.1009-2722.2017.07002
Zhang T. F., Sun L. X., Zhang Y., Cheng Y. H., Li Y. F., Ma H. L., et al. (2016). Geochemical characteristics of the Jurassic Yan’an and Zhiluo formations in the northern margin of Ordos basin and their paleoenvironmental implications. Acta Geologica Sin. 90, 3454–3472. doi: 10.3969/j.issn.0001-5717.2016.12.013
Zhang Z. G., Wang Y., Gao L. F., Zhang Y., Liu C. S. (2012). Marine gas hydrates: future energy or environ-mental killer? Energy Proc. 16, 933–938. doi: 10.1016/j.egypro.2012.01.149
Zhang T., Zhang C. M., Qyu J. H., Zhu R., Yuan R. (2017). Identification and comparison of high frequency cycles based on Milankovitch theory: A case study of Baikouquan formation in Mahu depression, Junggar basin. J. Northeast Petroleum Univ. 41, 54–61 + 7. doi: 10.3969/j.issn.2095-4107.2017.05.006
Zheng Y. D., Lei Y. H., Zhang L. Q., Wang X. Z., Zhang L. X., Jiang C. F., et al. (2015). Characteristics of element geochemistry and paleo sedimentary environment evolution of Zhangjiatan shale in the southeast of Ordos basin and its geological significance for oil and gas. Natural Gas Geosci. 26, 1395–1404. doi: 10.11764/j.issn.1672-1926.2015.07.1395
Zheng R. C., Liu M. Q. (1999). Study on palaeosalinity of Chang 6 oil reservoir set in ordos basin. Oil Gas Geol. 20, 20–25.
Zhou J., Yang X. B., Yang J. H., Gan J., Wu H., He X. H., et al. (2019). Structure-sedimentary evolution and gas accumulation of paleogene in Songnan low uplift of the Qiongdongnan Basin. Earth Sci. 44, 2704–2714. doi: 10.3799/dqkx.2019.104
Zhu W. L., Wu J. F., Zhang G. C., Ren J. Y., Zhao Z. G., Wu K. Q., et al. (2015). Discrepancy tectonic evolution and petroleum exploration in China offshore Cenozoic basins. Earth Sci. Front. 22, 88–101. doi: 10.13745/j.esf.2015.01.008
Keywords: Milankovitch cycle, paleoenvironment, sea level change, gas hydrate, carbon cycle, Qiongdongnan Basin
Citation: Dong Y, Wang R, Liang J, He Y, Ren J, Shi W, Wei X, Du H, Xie X and Busbey AB (2025) Orbital cycle records in shallow unconsolidated sediments: implications for global carbon cycle and hydrate system evolution in deep-sea area sediments of the Qiongdongnan Basin. Front. Mar. Sci. 11:1525477. doi: 10.3389/fmars.2024.1525477
Received: 09 November 2024; Accepted: 23 December 2024;
Published: 17 January 2025.
Edited by:
Pengchun Li, Chinese Academy of Sciences (CAS), ChinaReviewed by:
Xiting Liu, Ocean University of China, ChinaKe Cao, Qingdao Institute of Marine Geology (QIMG), China
Copyright © 2025 Dong, Wang, Liang, He, Ren, Shi, Wei, Du, Xie and Busbey. This is an open-access article distributed under the terms of the Creative Commons Attribution License (CC BY). The use, distribution or reproduction in other forums is permitted, provided the original author(s) and the copyright owner(s) are credited and that the original publication in this journal is cited, in accordance with accepted academic practice. No use, distribution or reproduction is permitted which does not comply with these terms.
*Correspondence: Ren Wang, cndhbmdAY3VnLmVkdS5jbg==