 Xiaofei Qi
- School of Management, Qilu University of Technology (Shandong Academy of Sciences), Jinan, Shandong, China
As a complex system involving intra- and interrelevance among multiple economic entities, the core of blue economic development consists of identifying key entities and their relevance structures that play a significant role in resource allocation within the system. The structural adjustment of blue industries, the enrichment of blue product baskets, the management decisions of blue firms, and the export positioning of blue provinces will make the system drive dynamic changes. Therefore, from the perspective of relevance theory, this paper first analyzes the key factors affecting the stability of the national blue economic system based on blue industry relevance, blue product relevance, blue firm relevance, blue province relevance, and cross-agent relevance. Second, the development mechanism of the national blue economic system is qualitatively explored based on the intra-agent relevance at a single level and the interagent relevance at a cross level. Finally, an example from China is used to guide its blue economy in practice. This example can serve as the premise and foundation for a country to achieve blue growth, promote the common development of key agents in the blue economy, and provide a scientific basis for a country to systematically formulate blue economic development policies.
1 Introduction
The blue ocean is considered the “blood” of the blue planet, and the “nutrient resources” in the “blood” are the “cornucopia” of human civilization. As an increasing number of countries regard the ocean as a new source of economic growth, marine economic growth will become a new area of global economic growth (Halpern et al., 2008; Morrissey and O’Donoghue, 2013; Voyer and Leeuwen, 2019; Jouffray et al., 2020; Midlen, 2023). However, In the context of the current global COVID-19 pandemic, sea-level rise and challenges to extreme weather and food security, the ecosystems on which many marine economic activities depend are changing at an unprecedented rate (OECD, 2016; Belton et al., 2020; Xu et al., 2021a, 2021b; Rangel-Buitrago and Gracia, 2024) which have direct and indirect impacts on marine-related industries, such as fisheries, shipping industry and marine minerals (Chen et al., 2021, 2022a, 2022c; Nham et al., 2023), and cause a profound impact on international trade and the development prospects of coastal developing countries (Qi et al., 2020a, 2020b). “To optimize co-benefits for the well-being of people and the planet, it’s vital that we pursue the blue economy in a sustainable manner.” (Amon et al., 2022) The concept of the blue economy aims at promoting economic growth, social inclusion, maintaining or improving human livelihoods, and achieving sustainable development of the marine environment (United Nations, 2015; Voyer and Leeuwen, 2019; Graziano et al., 2022). Its core is to decouple social and economic development from environmental and ecosystem degradation through ocean-related sectors and activities for achieving Goal 14 of the 2030 Agenda for Sustainable Development (UNDESA, 2014; Graziano et al., 2022). For a series of ocean-related economic activities, sustainable development of the blue planet ecosystem and natural assets can be achieved (Butlin, 1976; Bennett et al., 2019; Kim and Yoo, 2020; Chen et al., 2022b; Graziano et al., 2022). However, there are still some challenges for countries in the sustainable use of ocean resources (Yin et al., 2018; Ding et al., 2020; Qi et al., 2020a, 2020b; Melvin et al., 2023). For example, the primary challenge faced by a country’s policy-makers is to choose which blue provinces, blue industries and blue firms to support to better manage the sustainability of the ocean (Qi, 2024). The literature on blue economic policy shows that this selection process usually involves traditional and emerging industries (Klinger et al., 2018; Kontovas et al., 2022), such as fisheries and aquaculture, marine salt industry, marine agroforestry, seabed mining, marine energy, marine chemical industry, shipping and transport, coastal manufacturing, marine tourism, and coastal environmental services. Policy-makers of various countries formulate policies for blue industry and related firms based on monetary economic indicators, such as GDP and GVA (Morrissey and O’Donoghue, 2012; Colgan, 2013; Morrissey, 2014; Graziano et al., 2022), however, “using GDP to measure the ocean economy only captures the annual economic output, but does not account for changes to the underlying natural capital assets in this economy and the future benefit streams that they can provide” (Patil et al., 2016). In addition, “a focus on GDP biases metrics of success toward aggregate economic benefits rather than more holistic measures, such as societal well-being, wealth distribution, or environmental dependence” (Bennett et al., 2022). These policies do not provide reasonable guidance for decision-makers in this process (Dierickx et al., 1991; Qi et al., 2020a, 2020b).
To better address these challenges, the UN Decade of Ocean Science for Sustainable Development (i.e., the Ocean Decade) has an actionable answer: “there needs to be nothing short of a revolution in ocean science” (IOC-UNESCO, 2021). This means that the Ocean Decade will create a paradigm shift in the qualitative and quantitative assessment of blue economic development. That is, “The Decade, both in terms of action and outcomes, needs to move beyond business as usual to a true revolution in ocean science” (IOC-UNESCO, 2021). To achieve the transition from the “ocean we have” to the “ocean we want”, it is necessary to first realize that as a complex system for sustainable development, the blue economy exists in the production activities of developing marine-related resources and activities that directly or indirectly provide related services for the development of marine resources and space (Morrissey et al., 2011, 2014; IOC-UNESCO, 2021; Qi, 2022a, 2022b; Graziano et al., 2022; Karakara and Dasmani, 2022; Melvin et al., 2023). The development level of the blue economy of different countries depends not only on the natural resource endowments that they have but also on the relevance structure between their blue industries, blue products, blue firms and blue provinces (Lin, 2012; Qi, 2024). This relevance structure can be regarded as a structural form that connects the upper-level-related blue firms with blue provinces and other heterogeneous agents based on the association of blue industries and their products (Qi et al., 2020a).
Although these literatures have analyzed the multi-agent resource elements in the blue economy, there is still a lack of in-depth thinking on the following issues: (1) What are the key elements and development mechanisms of the national blue economic system? (2) How do we identify the relevance structures among the multiple agents of the national blue economic system? (3) What does the analysis framework of the national blue economic system mean for each country to inform the development of the blue economy in practice? This paper first uses the relevance theory to study blue economic development in a country, and it attempts to answer the above questions based on the analytical framework of the national blue economic system, and decomposes the problem of blue economic development into the development problem of blue industries, blue products, blue firms and blue provinces. Second, it verifies that the national blue economic system is scientific and effective as an auxiliary analysis tool for macro policy through the application of examples, confirming that it can play an important role in assisting a country in systematically evaluating blue growth.
The contributions of this paper are mainly reflected in the following three aspects. First, this paper clarifies the logical relationship between the multi-agent resource elements in the national blue economic system, that is, the blue industry is the industrial decomposition of a country’s blue economic development, the relevance between blue industries is an important aspect of blue economic activities, and the relevance between blue products under the subdivided blue industry is the core component of the interrelevance of the blue industry, which affects blue firm development activities at the mesolevel and the blue interprovince trade flow at the macrolevel. Blue products are the microlevel entities of blue firm value creation and the key factor in the formation and development of the blue industry. Blue firms are the mesolevel entities that develop blue products, and they are the core elements that affect the economic development of blue provinces. Blue provinces are economic hubs that gather elements such as human flow, logistics, capital flow, and information flow, and they are the macrolevel entities of blue economic activities. Therefore, this relevance structure also determines the efficiency and benefits of blue economic development for countries from the perspective of output and capacity. Second, this paper provides a multi-dimensional data-driven analytical approach to help assess the extent of a country’s blue economic development. Finally, the findings of this paper also provide broader understandings for the formulation of blue economic policies in other countries and regions. For example, in terms of international cooperation, the blue economy often involves the development and management of marine resources across borders, so the legal framework of international cooperation mechanisms is essential to promote the growth of the global blue economy; in terms of regional synergy mechanism, due to the different stages of blue economy in different countries and regions, it is necessary to adopt adaptive development paths to form multi-agent resource elements coordinated development mechanism according to their own characteristics; in terms of market-oriented operation, the interaction between the government and the market plays an important role, especially in promoting the development of the blue economy through firms participation and market-oriented operation, and attracting private firms to enter the blue sectors through the formulation of incentive policies, especially emerging industries such as marine energy and marine equipment.
The structure of this paper is as follows. Section 2 introduces the key elements of the national blue economic system. Section 3 presents the development mechanisms of the national blue economic system. Section 4 takes China as an example of a country to guide its blue economy in practice. Section 5 presents the conclusions and limitations of this study.
2 The key elements of the national blue economic system
The blue economy includes not only a collection of marine-related industries but also a series of environmentally and socially sustainable business activities (e.g., products, services, and investment), which are interdependent and affect the development of marine resources and sea-related areas. However, if the development of these areas uses only macroscale policies to restrict society’s development of marine-related resources to protect the ecological environment (Rangel-Buitrago and Gracia, 2024), this development is neither sustainable nor “blue” (Voyer and Leeuwen, 2019; Qi, 2022a, 2022b; Graziano et al., 2022). In 2015, the “Blue Economy for Business in East Asia” report published by Partnerships in Environmental Management for the Seas of East Asia identified four attributes of blue economic development in terms of coastal and marine economic activities: blue economic development “① protects, restores and sustains healthy coastal and marine ecosystem services; ② generates sustainable, equitable economic benefit and inclusive growth; ③ integrates approaches between multiple industries and government; ④ innovates, informed by the best available science” (Whisnant and Reyes, 2015). However, these elements focus on the environmental protection, industrial policy, and technological innovation of the blue economy only in terms of a single dimension and do not involve an analysis of the key elements and micromechanisms that affect the multiagent system in this complex system. Next, the paper analyzes the five key elements that affect a country’s blue economic system: blue industry relevance, blue product relevance, blue firm relevance, blue province relevance, and cross-agent relevance.
2.1 Blue industry relevance
The linkages between blue industries not only affect the degree of development of a country’s blue economic system but also profoundly affect new patterns of coordinated development between regions (Qi, 2022a, 2022b; Graziano et al., 2022; Karakara and Dasmani, 2022). Blue industry relevance is formed on the basis of the upstream and downstream relationships of the blue industry and its technical and economic linkages (Qi et al., 2020a; Graziano et al., 2022). That is, in the product development process, the upstream blue industry provides the downstream blue industry with raw materials or services based on specific technical standards and processes (Qi, 2024). This represents an important relationship of a country’s economic activities, and it is also the basis for the formation of an orderly structure of the country’s blue economic system. At the same time, the relevance evolution between blue industries is the key to explaining the diversification of blue economic development in different countries and the differentiation of the blue industry structure (Qi, 2022a, 2022b; Karakara and Dasmani, 2022).
2.2 Blue product relevance
The linkages between blue products constitute the most important basic relationships of blue economic activities (Qi, 2022a, 2022b; Karakara and Dasmani, 2022; Qi, 2024). The linkages between blue products generally refer to the relevance between blue products at the level of market supply and demand (Graziano et al., 2022; Karakara and Dasmani, 2022). The linkage at the market supply level denotes that firms need to input similar production factors such as infrastructure, resource endowments, and technological knowledge (Arvanitoyannis and Kassaveti, 2008; Albertos et al., 2019; Melvin et al., 2023). The linkage at the market demand level means that consumers have similar demand preferences, demand structures, and demand volumes for blue products (Magnier et al., 2019; Qi et al., 2020a; Graziano et al., 2022; Karakara and Dasmani, 2022). In other words, if a country exports or imports blue products with similar inputs (e.g., manpower, technology), the linkages between these blue products are relatively strong (Graziano et al., 2022; Karakara and Dasmani, 2022). Moreover, the linkages between blue products of different categories are usually weaker than those between similar blue products (Graziano et al., 2022; Karakara and Dasmani, 2022; Qi, 2024).
2.3 Blue firm relevance
Broadly speaking, the linkages between blue firms can be divided into the supply and demand relationships between upstream and downstream firms as well as the competition and cooperation relevance between homogeneous firms (Qi et al., 2020a; Qi, 2024). The blue firm relevance explored in this paper mainly refers to the coopetition between firms producing and exporting similar blue products due to the scarcity of blue resources. It involves mesolevel relationships between blue firms in blue economic activities (Virdin et al., 2021; Graziano et al., 2022; Karakara and Dasmani, 2022). As the main actors in market value creation, blue firms play a decisive role in the process of market resource allocation (Virdin et al., 2021; Ma and Li, 2021). As a result, blue firms are the most important agents in the national blue economic system, which absorbs various production factors and conducts product development activities more efficiently.
2.4 Blue province relevance
As geographic agglomerations and carriers of industry and firm factors, provinces are macrolevel agents that promote the processes of interprovincial and international trade flows (Qi, 2022b; Karakara and Dasmani, 2022; Qi, 2024). The linkages between blue provinces entail the transfer of various blue economic development factors in geographic space and the optimal allocation of resources across regions (Kong et al., 2021; Graziano et al., 2022). With the in-depth development of economic globalization, the economic ties between countries have become stronger, cooperation has become deeper, the space for development has become broader, and the scale of international trade has continued to expand (Sundaram and Arnim, 2009; Graziano et al., 2022). These trends have caused the flow of factors between provinces to gradually increase, fundamentally changing a country’s previous division of labor or the transition from a production and export method based mainly on production factors within a province to a dynamic flow of production factors between provinces designed to continuously optimize the export structure (Karakara and Dasmani, 2022). This accelerates the flow of elements in the blue industrial clusters between provinces (Kong et al., 2021; Karakara and Dasmani, 2022; Qi, 2024), which in turn promotes the interprovincial flow of marine-related talent, technology, and capital and further promotes the coordinated development of various agents in the national blue economic system (Qi, 2024).
2.5 Cross-agent relevance
As the most important actors involved in the allocation of marine-related resources, blue firms conduct blue product development activities with comparative advantages through the input of production factors (Virdin et al., 2021; Qi, 2022b). Through this process, blue firms in the upstream blue industry provide these manufacturers with the products or services required for production, and these manufacturers act as suppliers who provide products or services to the blue firms in the downstream blue industry (Qi, 2022a, 2022b). Notably, the manufacturers and blue firms in the upstream and downstream blue industries are located in different provinces (Graziano et al., 2022). This kind of multiagent relevance that transcends geographic space has become an effective means of analyzing the flow of factors between the main bodies of the national blue economic system. As a result, a cross-agent relevance structure covering blue industries, blue products, blue firms, and blue provinces has been constructed. This relevance structure determines the level of “blueness” of the national blue economic system (Qi, 2022b, 2024).
From the perspective of the evolutionary theory of comparative advantage, this relevance structure is also contained in the blue industry upgrading process (Qi et al., 2020a, 2020b; Graziano et al., 2022). Specifically, blue firms maximize their profits in the process of making product upgrades. When a blue firm involves a new blue industry, the new industry will have more opportunities for further upgrades in the future. This means that the industrial structure of the blue province where the firm is located may be upgraded to a new structure. In turn, this new structure will promote the upgrading of some relatively low-level blue industries and further promote the upgrading of the product development activities of firms in the blue industry (Qi, 2022b). In general, through this process, the decision-makers of each province need to consider the constraints of actual conditions, and the policies formulated must meet their actual industrial upgrading goals. Otherwise, a “disconnection” risk of industrial upgrading may emerge (Zhang, 2008).
3 The development mechanisms of the national blue economic system
From the analysis provided in the previous section, the key elements of the national blue economic system include blue industry relevance, blue product relevance, blue firm relevance, blue province relevance, and cross-agent relevance. These five factors promote each other and involve an endogenous operating mechanism. This mechanism exists not only within the single-level agent relevance structure but also in the cross-level multiagent relevance structure. The following is an analysis of the development mechanism of single- and cross-level national blue economic systems.
3.1 Single-level development mechanism of the national blue economic system
3.1.1 Development mechanism at the blue industry level
In the national blue economic system, each blue industry undergoes a dynamic adjustment movement through interindustry linkages such that the entire blue industry forms an orderly structure. Of course, there are many positive and negative industrial connections within this structure (Zhang, 2008; Qi, 2022b). For example, in the blue industry subsystem shown in Figure 1, fisheries and aquaculture can benefit from fishing and promote the development of shipping and transport, marine (blue) energy, and coastal manufacturing. Subsequently, the development of these industries will further enhance the development of fisheries and aquaculture. However, if fisheries and aquaculture do not operate in the prescribed areas, they may compete with these blue industries for marine development space, resulting in certain marine environmental problems. It is the interconnections between these blue industries that make the blue industry subsystem a key element of the national blue economic system.
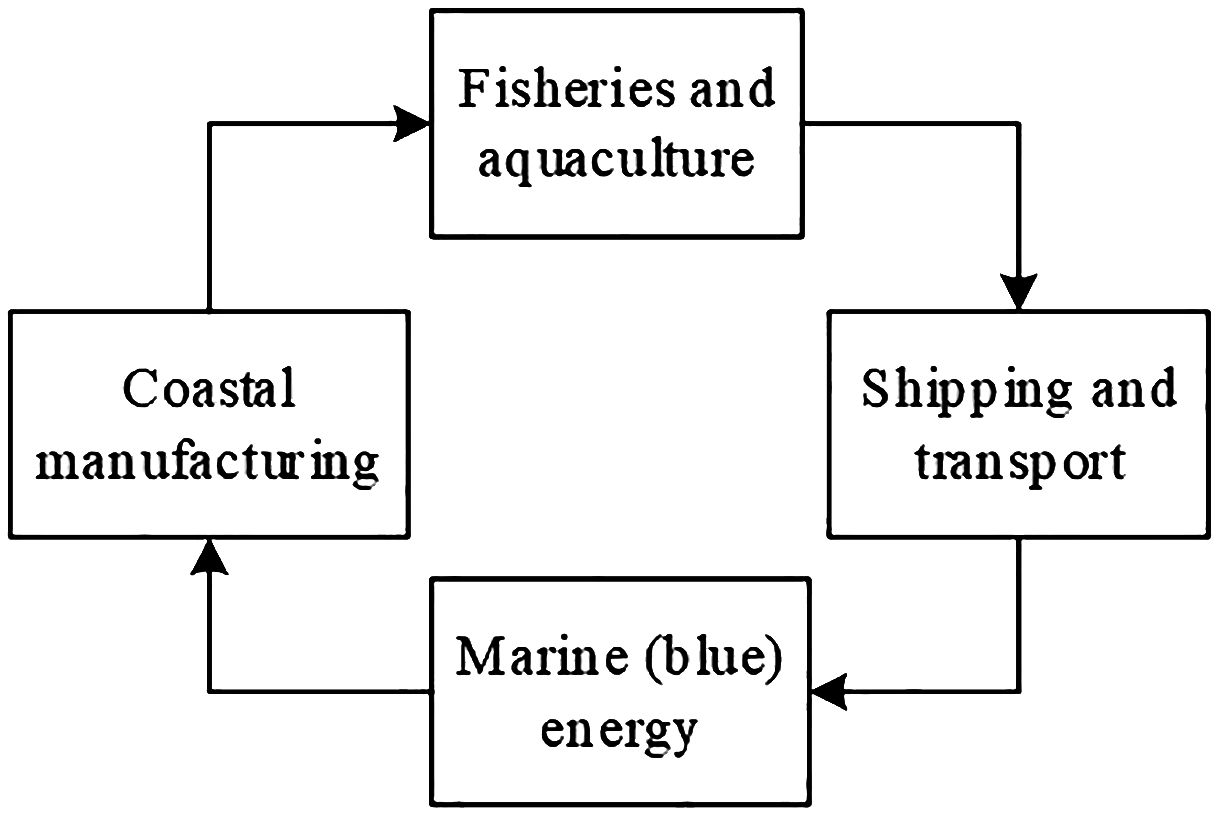
Figure 1. Schematic diagram of the associations of the blue industry subsystem.
3.1.2 Development mechanism at the blue product level
The diversification of blue products is the source of blue growth (Qi et al., 2020a, 2020b; Graziano et al., 2022). Contrary to Aghion and Howitt’s (1992) argument that products are completely independent, blue products are related in part due to the similarities of input elements. This relevance is particularly reflected in the national trade export basket (Qi et al., 2020b). That is, the more a country exports a certain blue product (e.g., frozen fish fillets), the more the export volume of products similar to this blue product (e.g., salted or smoked fish) will also increase (Qi, 2022a). The main reason for this phenomenon is explained in Section 3.1 from the perspective of supply and demand and the associations between blue products. This explanation is based on the “forest and monkey” relationship proposed by Hidalgo et al. (2007): a certain area of forest is likened to a country’s export basket, where each product in the export basket is represented by a tree and monkeys are represented by a series of firms. For geographic reasons, the distribution of trees will include sparse and dense forms. Groups of monkeys often jump to different trees in the forest to forage, and for each monkey, the difficulty of jumping between two trees depends on the distance between the trees and the distribution of the forest around the jumping site. In the context of this paper, if the input elements between the blue products are more similar, trees are positioned closer together, the forest is denser, the monkeys have more paths to jump through, and a country can effectively realize the optimization and upgrading of the blue industry. This judgment can be extended to different countries and regions in the world. Due to the differences in factor endowments, countries have formed different export structures through the development of the blue industry, which also determines the differences in the development of the blue economies in different countries (Qi, 2022b).
3.1.3 Development mechanism at the blue firm level
Blue firms are the main actors in resource allocation and value creation in the national blue economic system. This kind of agent is reflected in the dynamic allocation of economic factors by blue firms in pursuit of profit maximization, cooperation between upstream and downstream blue firms to reduce costs, and competition and cooperation with different blue firms to improve the distribution efficiency of production factors (Graziano et al., 2022; Qi, 2024). Here, the paper continues to use the “forest and monkey” relationship to explain the following: to forage as much and as fast as possible, monkeys form a group. The monkeys in a monkey group work together to find food in the forests of different regions. Monkeys with excellent jumping ability find food from trees located far away, while monkeys with limited jumping ability find food from trees located closer. The monkeys eventually share the food found with the group. In the context of this paper, to achieve their respective profit maximization goals, blue firms will form coopetition relationships and choose products with a suitable distance based on their own resource endowments to jump. There are more jumping paths in dense forests and fewer jumping paths in sparse forests. Therefore, blue firms can realize the diversification and homogenization of blue product development. Here, the diversification and similarity of production capacities mean that the development of the blue industry in different countries will be different (Qi et al., 2020a, 2020b).
3.1.4 Development mechanism at the blue province level
A blue province is the spatial carrier of blue firms in the blue industry and provides tangible and intangible production factors for blue firms in blue product development activities (Qi et al., 2020a, 2020b; Kong et al., 2021; Graziano et al., 2022; Qi, 2024). Every province in the national blue economic system forms a blue province relevance network through the blue industry and blue firm relevance networks. Here, the paper continues to use the “forest and monkey” relationship to explain why a certain area in a forest can be compared to a province. Monkeys look for as much food as possible, or the food in a certain area will run out. The monkeys in a group with excellent jumping ability will look for food in areas that are far away, while those with limited jumping ability can only look for food in the same area or within a relatively close range. In the context of this paper, as resource providers, blue provinces often form province relevance due to the product development activities of the blue firms to which they belong. The strength of the relevance between blue provinces depends on the number of blue firms with strong jumping ability (Qi, 2022b; Graziano et al., 2022). That is, the higher the number of blue firms with strong jumping ability is, the stronger the relevance between blue provinces and the higher the supply efficiency of resource elements. As a result, the blue province subsystem gradually evolves from disorderly to orderly in space, and the strong driving ability of the core provinces with regard to related blue firms and blue industries affects the overall development of the blue province subsystem.
3.2 Cross-level development mechanism of the national blue economic system
Hidalgo et al. (2007) posit that industries are drawn in a single-level product space through different colors of product nodes. That is, products and industries belong to the same level of a network structure. Therefore, the interactions between blue products (blue industries), blue firms, and blue provinces can be refined into logical relationships between layers to explain the development mechanism involved.
3.2.1 Development mechanism at the blue product-blue firm level
As the main actors in blue product development, blue firms determine the form and efficiency of resource allocation (Qi et al., 2020a; Qi, 2024). The development mechanism between the two involves finding the blue products with the most export potential and enabling blue firms to obtain certain economic benefits (Qi et al., 2020a; Qi, 2022b; Graziano et al., 2022). At the same time, the product structure transformation process of blue firms involves switching from simple to complex blue products, and Hidalgo et al. (2007) believe that this process will be affected by the product spatial network structure. To verify the influence of the structure on products, a product density index has been proposed.1 It is believed that firms are more inclined to produce products with high levels of similarity and density (Hidalgo et al., 2007). Therefore, the essence of the development mechanism at the blue product-blue firm level is to find the interlayer relevance between the blue product subsystem and blue firm subsystem while achieving these goals.
3.2.2 Development mechanism at the blue firm-blue province level
As a geographic spatial carrier that provides blue firms with production factors and ecological measures, a blue province improves the efficiency of the flow of natural resources, labor, knowledge and technology among blue firms to a certain extent. In turn, this flow efficiency enhances the economic vitality among blue provinces (Qi, 2024). Admittedly, this kind of mobility may cause blue firms in multiple blue provinces to overlap to different degrees, causing competition and cooperation among blue firms (Gnyawali et al., 2016) This behavior has a certain interaction relevance with the development level of the blue economy in each province. Although it is very important to shape and gain the competitive advantage of provinces, to avoid vicious competition among blue provinces, a country can play an active role in resource integration in the competition among blue provinces (Qi et al., 2020a; Qi, 2022b). Therefore, the development mechanism at the blue firm-blue province level determines the interlayer relevance between the blue firm subsystem and blue province subsystem, which have obvious interactions, have their own economic characteristics, and bring strong factor agglomeration, all revitalizing the economic vitality of related provinces.
3.2.3 Development mechanism at the blue industry-blue province level
As a basic element of the operation of the blue economy in each province, the blue industry is related to the blue product development behavior of blue firms at the mesolevel and the supply behavior of production factors of blue provinces at the macrolevel (Qi, 2022b, 2024). The blue provinces are the regional spatial carriers of blue economic activities in various countries. This kind of province-related structure is also a reflection of the export trade structure of blue industries and their products in different countries at the regional level (Bronnmann et al., 2020; Qi, 2022b; Graziano et al., 2022). Notably, due to the constraints of objective conditions, blue firms are limited in their ability to promote the upgrading of blue industries (Qi et al., 2020a). Specifically, at the industrial level, the policy or market environment may prompt a number of firms to unite to jointly promote industrial upgrading; while at the firm level, a single firm is often subject to its own resources, technology and market constraints, and it is difficult to achieve the upgrading of the entire industry alone. According to the evolutionary theory of comparative advantage, the direction of blue industry upgrading involves a leap from the existing blue industry to the blue industry at the optimal distance (Qi et al., 2020a, 2020b). Therefore, through this process, provincial policy-makers need to formulate realistic blue industry upgrading targets based on objective conditions; otherwise, the “disconnection” risk of industrial upgrading will result. For example, , , and represent the price, cost, profit and extent, respectively, of industrial upgrading from industry i to industry j in Figure 2. If a firm can only jump optimal distance in industry i but the province where the firm is located requires the firm to jump to , a disconnection in industrial upgrading will result (Zhang, 2008).
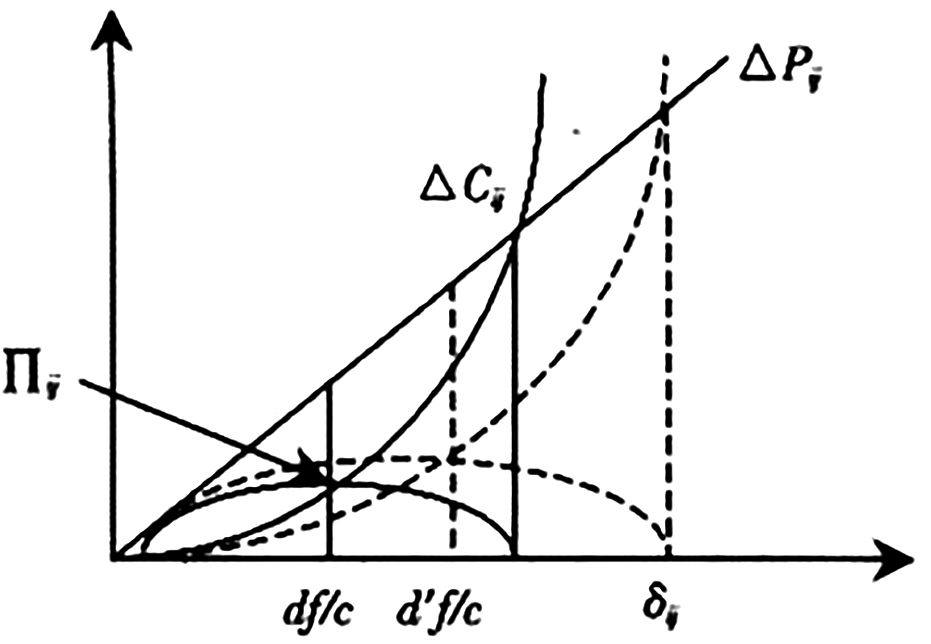
Figure 2. Disconnection in industrial upgrading. Source: Zhang (2008).
4 Informing the development of the blue economy in practice
To make our framework more convincing, the paper takes China as an example. As the world’s second largest economy, with more than 6,500 maritime islands and a coastline of 32,000 kilometers, China shares maritime borders with Japan, South Korea, North Korea, Malaysia, the Philippines, Brunei, Indonesia, and Vietnam (Wang and Wang, 2019). Such a long coastline and advantageous geographic location make it the fastest growing economy in the world with abundant marine resources and vast marine territories (Wang et al., 2018). China attaches great importance to blue economic development. With the continuous improvement in China’s public transportation infrastructure, its blue economic hinterland has gradually expanded, and its influence has expanded to more inland areas, forming a kind of “sea-land synergy” for blue economic development (Ren et al., 2018).
4.1 Single-level practical guidance of China’s blue economic system
4.1.1 Practical guidance at the blue industry level
Figure 3 enables us to conduct an industry-level analysis to identify blue industries with good export potential. Figure 3 shows that from 2001 to 2017, the top three industries with the most blue industry exports in China were coastal manufacturing, shipping and transport, and the marine chemical industry, while the bottom three with the least exports were seabed mining, the marine salt industry, and marine agroforestry. Thus, coastal manufacturing is a pillar industry at the blue industry level in China. Due to the existence of the industry relevance effect, coastal manufacturing invests more production factors in shipping and transport and the marine chemical industry. Additionally, the degree of relevance between the two is high (Abouarghoub and Haider, 2019), which makes the coastal manufacturing of both industries have a strong driving effect, brings more growth space for China’s blue economy, and enables China to formulate blue industrial policies in a targeted manner. However, due to the limitations of resources, technologies and capabilities (Qi et al., 2020a, 2020b), the development of seabed mining, the marine salt industry, and marine agroforestry cannot provide sufficient impetus for the growth of China’s blue economy. In the future, China can formulate policies to adjust the investment in these industries.
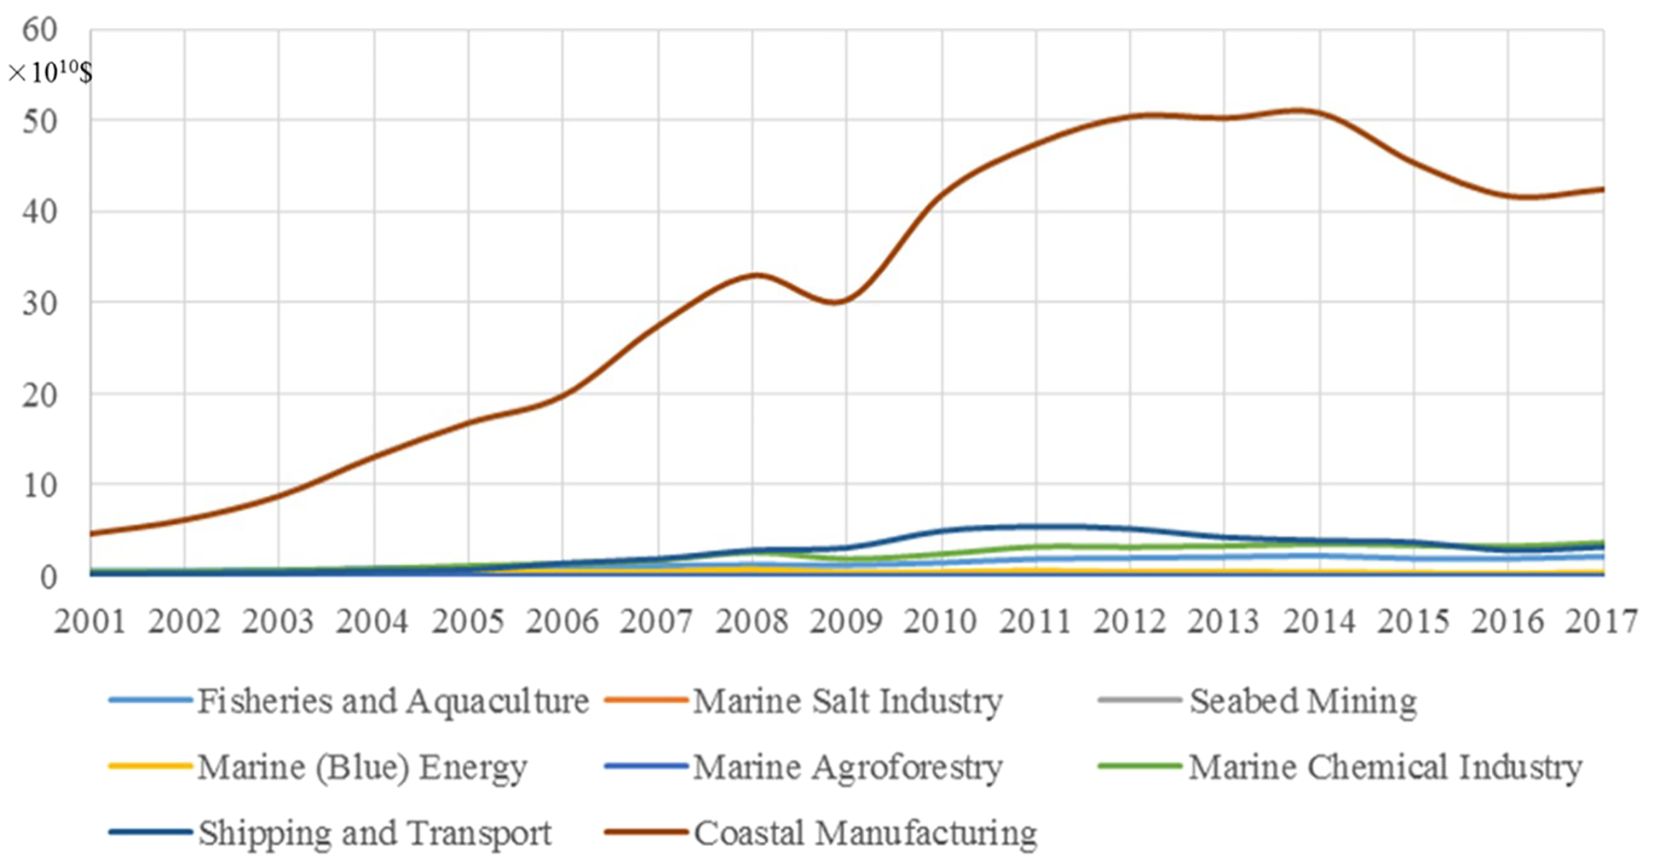
Figure 3. Exports of eight blue industries from 2001 to 2017.
4.1.2 Practical guidance at the blue product level
To better illustrate our point of view, four product categories are selected from fisheries and aquaculture, including “fish, prepared or preserved, nes” (0371), “crustaceans and mollusks, prepared or prepared, nes” (0372), “bones, ivory, horns, coral, shells and similar products” (2919), and “pearls, not mounted, set or strung” (6671). In Figure 4, “fish, prepared or preserved, nes” (0371), “crustaceans and mollusks, prepared or prepared, nes” (0372), and “bones, ivory, horns, coral, shells and similar products” (2919) have always had a comparative advantage in the international market (i.e., the value of revealed comparative advantage (RCA) is above 1),2 while “pearls, not mounted, set or strung” (6671) had a comparative advantage only in the 2004-2012 period. Moreover, as the development trend of blue products, their comparative advantages in the international market are gradually reduced, which indicates that China needs to invest resources to improve the international competitive advantage of some products and enhance their competitiveness and resilience against risks. At the same time, these measures are bound to increase the comparative advantage of related products, including “fish, fresh or chilled, excluding fillet” (0341), “fish, frozen, excluding fillets” (0342), “fish fillets, fresh or chilled” (0343), “fish fillets, frozen” (0344), and “fish, dried, salted or in brine; smoked fish” (0350). However, due to the weak comparative advantage of “pearls, not mounted, set or strung” (6671), China can devote relevant resources to supporting the production and export activities of the other three blue product categories. That is, if Chinese policy-makers and stakeholders formulate reasonable policies to promote the reallocation of these blue product resources and exert technological spillover effects on the industry, it is very possible that the country will realize the transformation and upgrading of fisheries and aquaculture (Qi et al., 2020b).
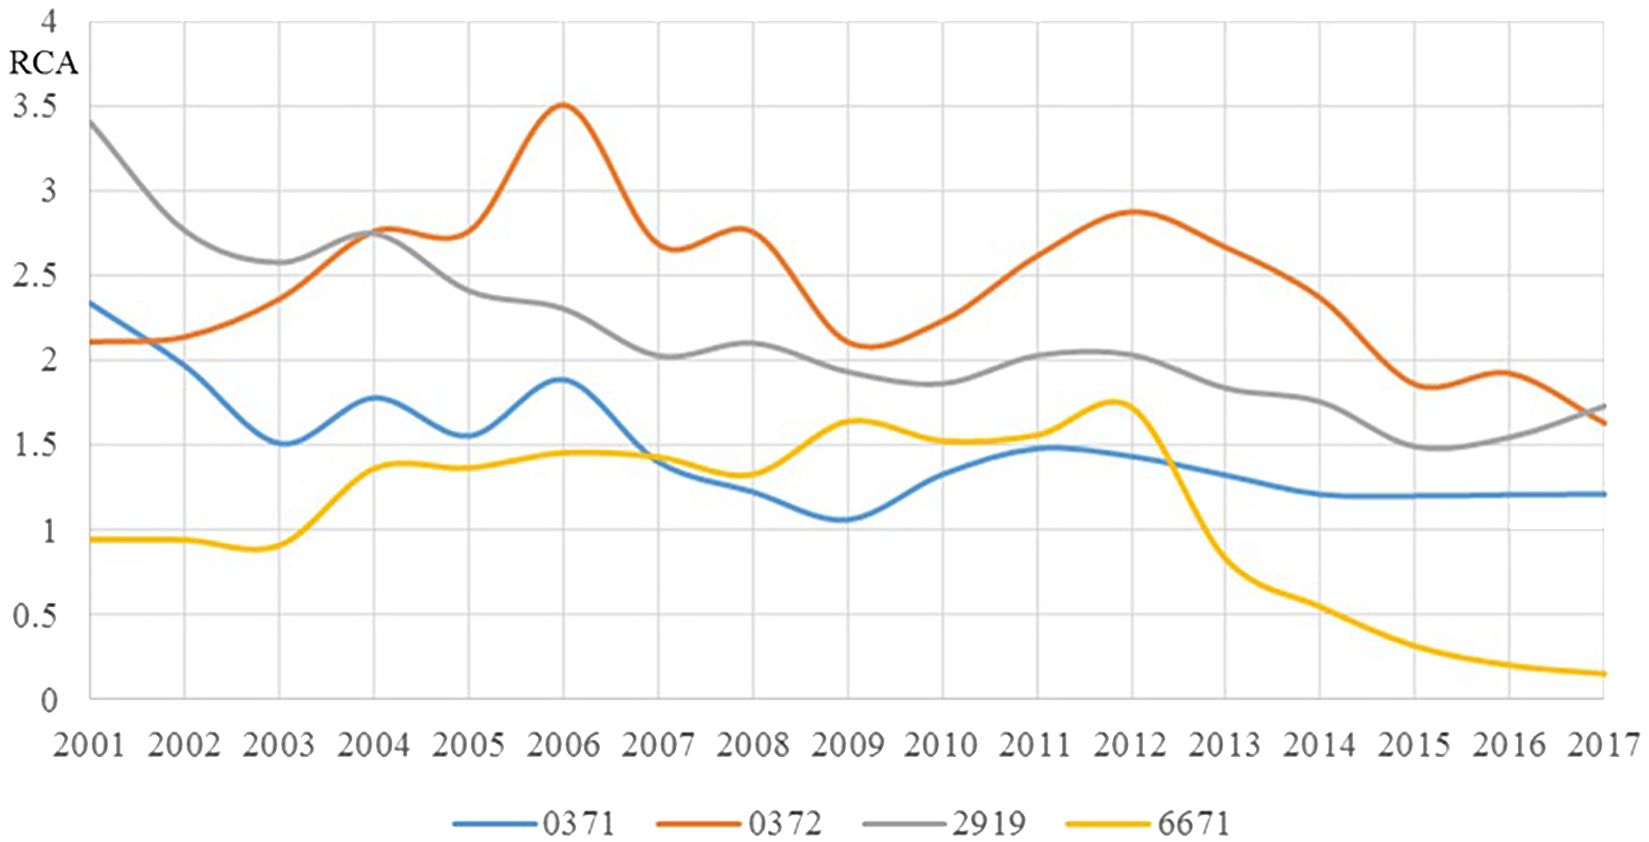
Figure 4. Changes in the RCA of 4 selected blue product categories in China from 2001 to 2017.
4.1.3 Practical guidance at the blue firm level
To illustrate our point of view, based on the 23 firms shown in Table 1, based on the “National Enterprise Credit Information Publicity System of China” and the operation information obtained from some firms’ websites, the affiliation of 116 blue products and these blue firms was determined.3 Then, the paper associated firms that export two or more blue products at the same time to form a network, as shown in Figure 5.4 In this network, “Penglai Huiyang Foodstuff Co., Ltd.” (SD13) is located at the core of the network, the rest of the firms are distributed around it, and there is a strong connection between these blue firms. These firms are located in different provinces, indicating that the same blue product market in a region is large, the blue economy is highly active, and the level of blue resource dependence is high. The relevance between different blue products is connected by a small number of blue firms with diversified operations, which also makes the resources of different blue firms more complementary (Qi, 2024). Chinese policy-makers can appropriately allocate resources to blue firms in fisheries and aquaculture based on this related information to revitalize the business vitality of these firms.
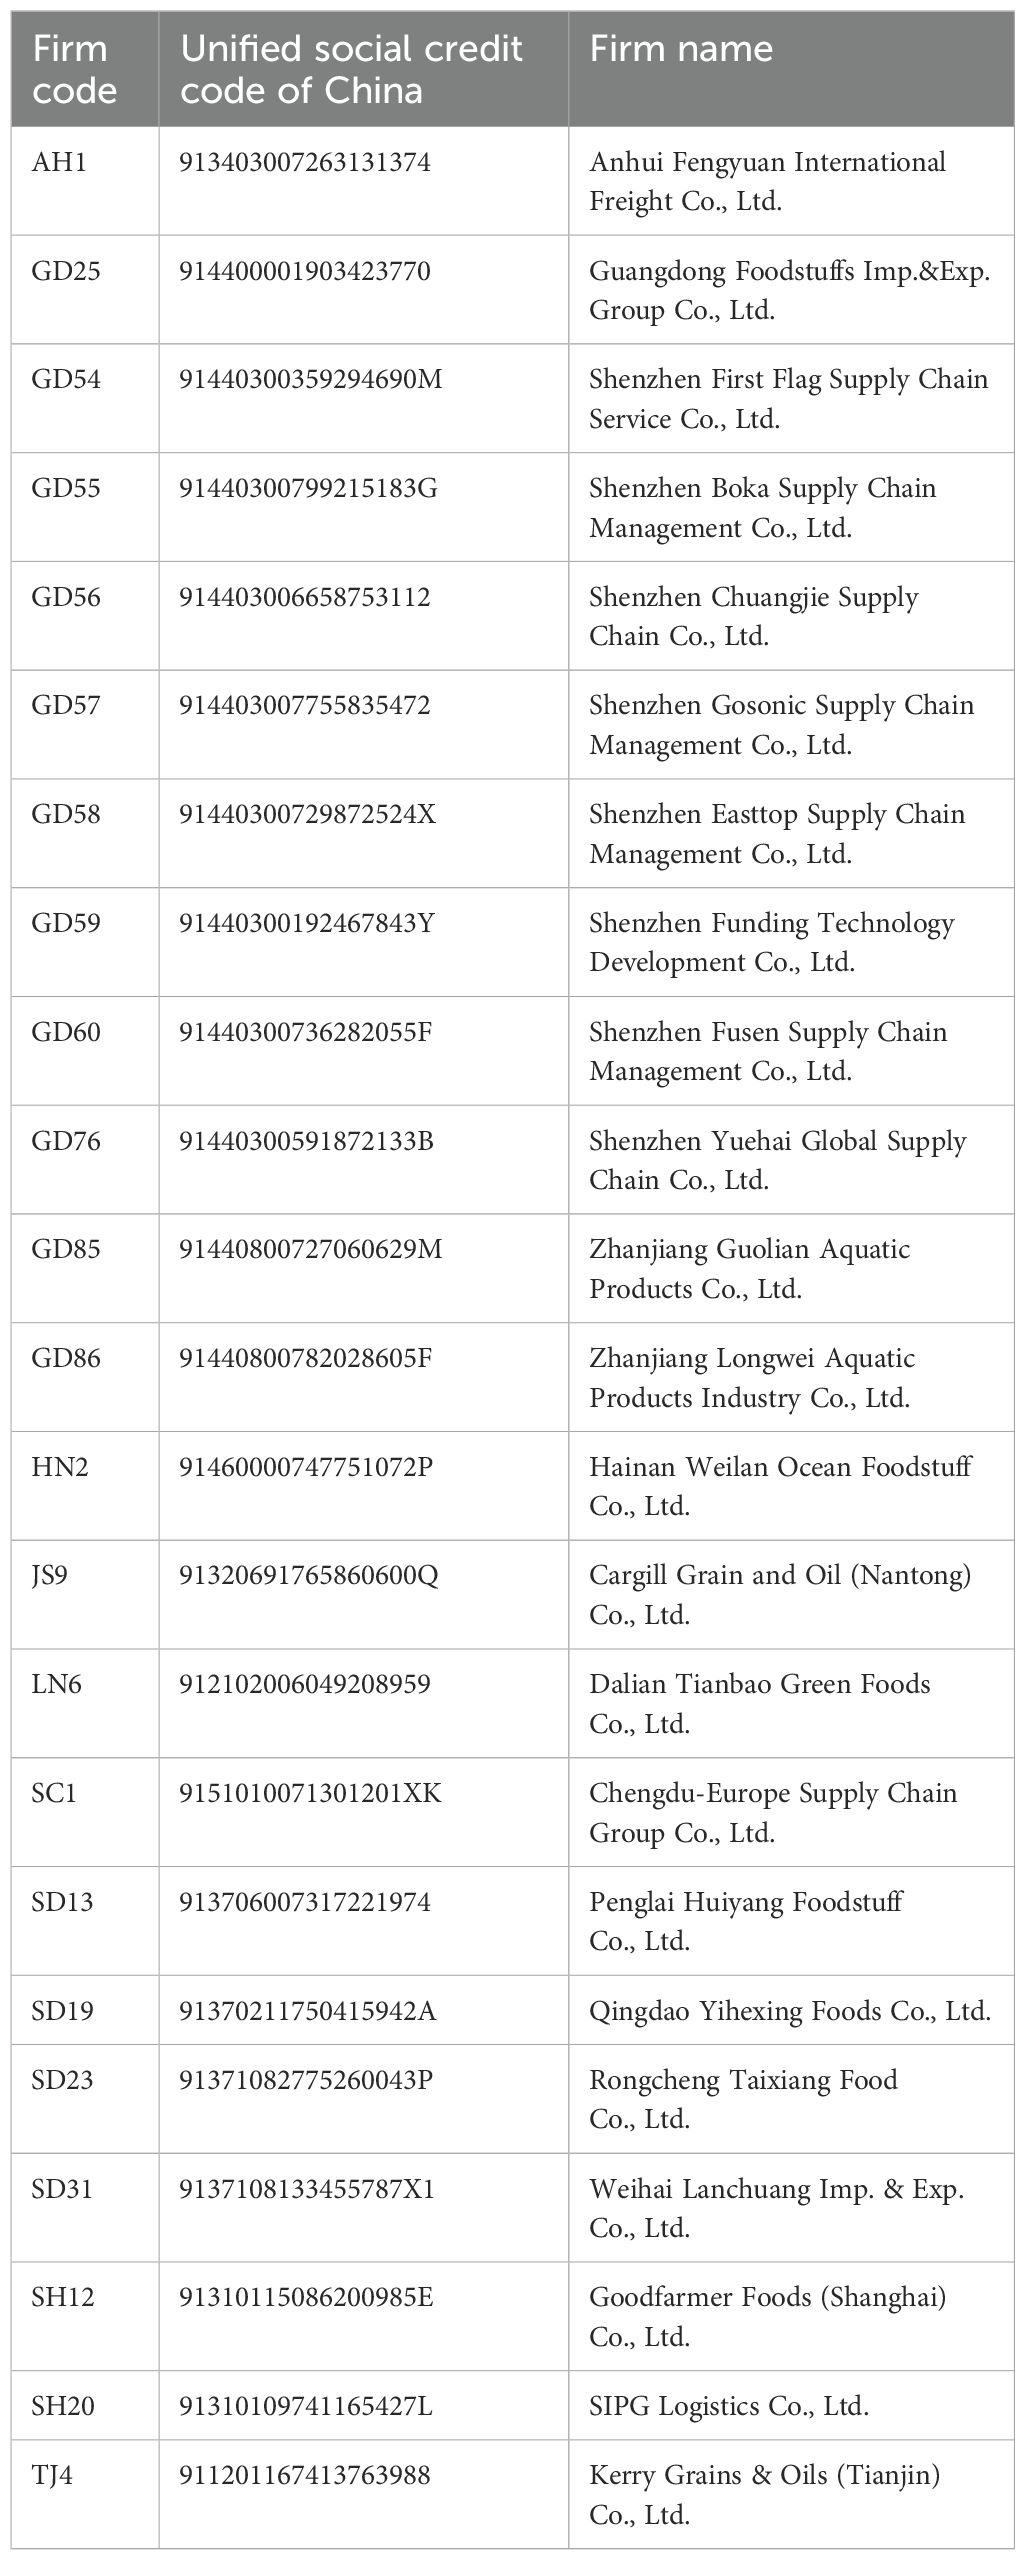
Table 1. The correspondence between firm codes and their details.

Figure 5. The network formed by 23 selected blue firms in China’s fisheries and aquaculture in 2017.
4.1.4 Practical guidance at the blue province level
Figure 6 is the provincial-level network constructed based on Figure 5. It clearly shows that Shandong and Guangdong are at the core of the network and have the strongest ability to drive industries in other provinces, while Shanghai, Liaoning, Jiangsu, Anhui, Tianjin, Hainan, and Sichuan are located around the network and support the development of core nodes. In terms of the spatial structure, this “core-periphery” structure demonstrates China’s “sea-land synergy” development model. That is, most of the coastal provinces are located at the core of the network, and most of the inland provinces are located at the periphery of the network. In terms of geographic space, from the original single-core development model to a multicore joint development structure, the relevant blue provinces and their surrounding blue provinces have risen to become regions with relatively developed blue economies (Liu et al., 2022). In other words, as a result of the network relevance between blue provinces, each provincial node is no longer limited to obtaining resources from a few key provinces. Rather, it can obtain the required resources from all associated nodes in the network as a whole. The complementarity among the nodes in the provincial network enables their related urban agglomerations to avoid the instability of local association (Zhao, 2011).
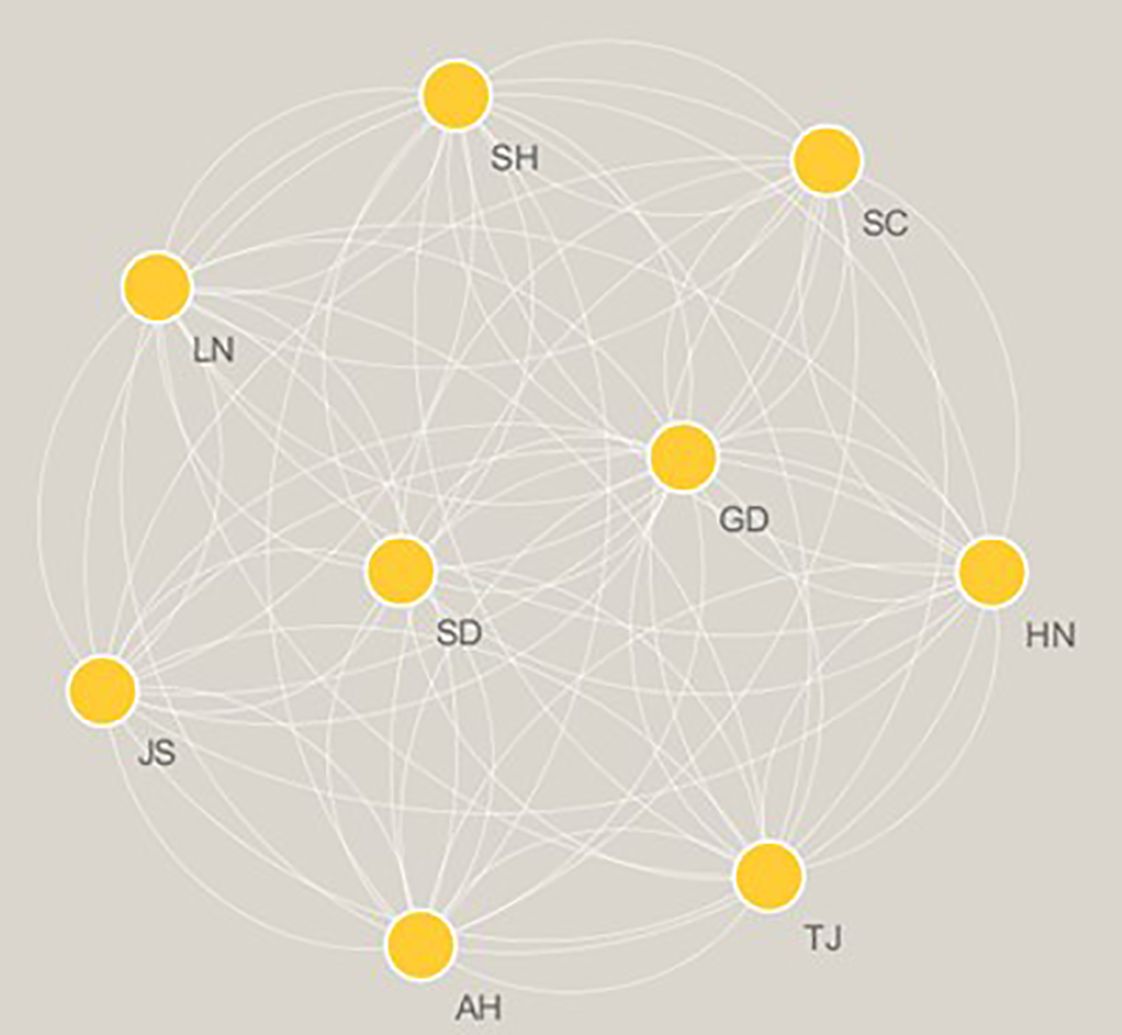
Figure 6. The network of China’s blue provinces in 2017 based on Figure 5.
4.2 Cross-level practical guidance of China’s blue economic system
4.2.1 Practical guidance at the blue product-blue firm level
Figure 7, which was constructed by Qi et al. (2020a), shows that among all blue products exported by a firm, those with the greatest growth potential are those closest to products with RCA>1 in the product space. This finding provides more information for the further analysis of the development of Chinese blue firms, that is, which blue firms have the most advanced production capacity for blue products (Qi et al., 2020a). This improved product space map shows that China has RCAs in the exporting of products from only 84 firms (e.g., “Ningbo Today Food Co., Ltd.”, “Tianjin Products & Energy Resources Development Co., Ltd.”, “China Shipbuilding & Offshore International Co., Ltd.”) and for only 22 blue products (e.g., “fish fillets, frozen”, “lifting, handling, loading machinery, telphers and conveyors”, “ships, boats and other vessels”). China can formulate relevant policies to support these firms in producing and exporting blue products with high similarity. This two-tier network of blue product-blue firms can map the improved blue product space of a country and multiple firms and be used to analyze how to maximize the blue product development diversity of a country and its firms, improve the potential blue product production capacity, and further study the geographic distribution characteristics of blue product development.
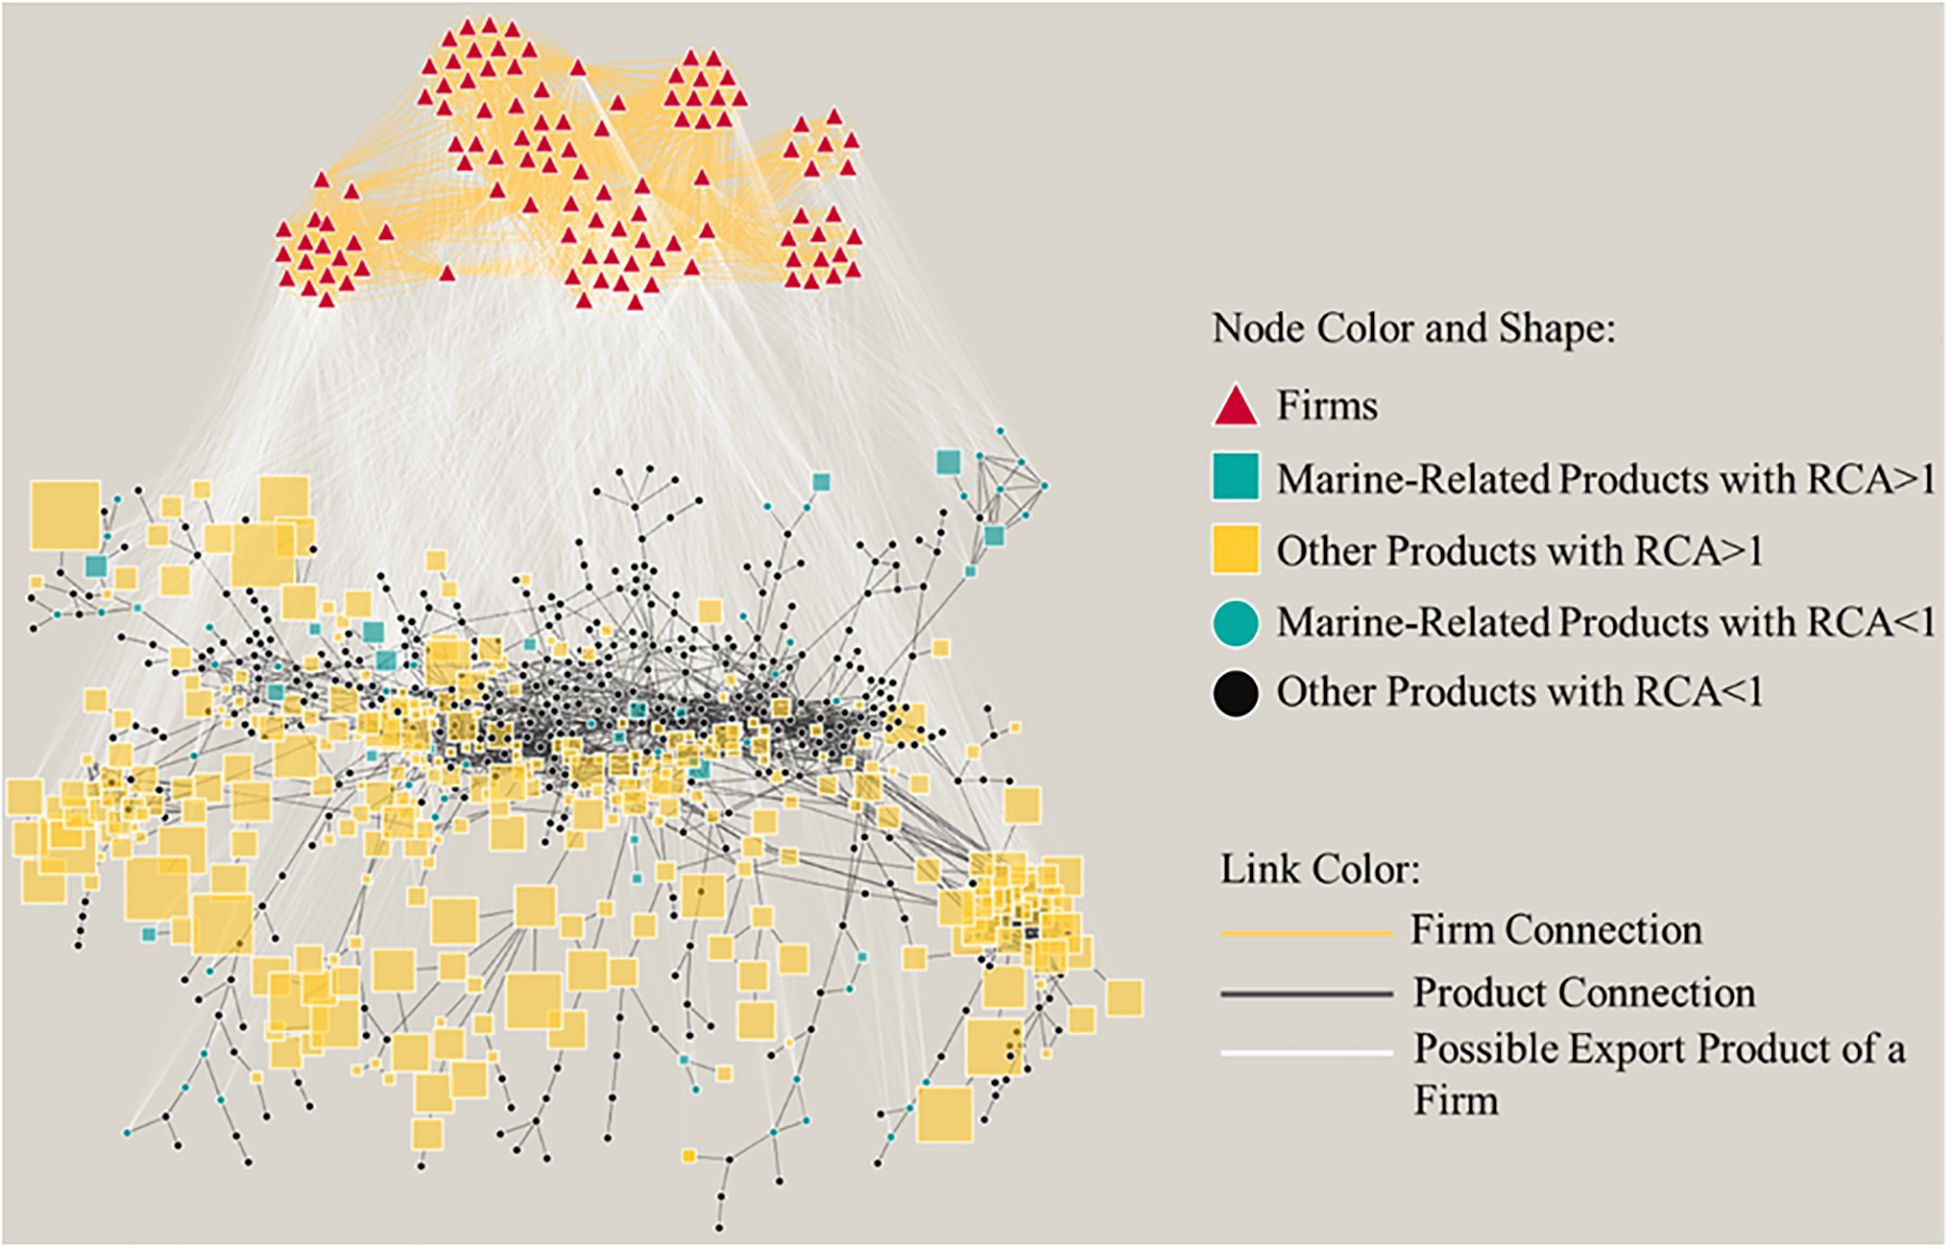
Figure 7. The improved product space map of China and its firms in 2012. Source: Qi et al. (2020a).
4.2.2 Practical guidance at the blue firm-blue province level
Table 2 shows the regional affiliation based on the information of 84 blue firms with competitive advantages in China in 2012 in Figure 7 and further elevates the relevance from the firm level to the provincial level. To further study the relationship between the number of blue firms belonging to blue provinces and their GDP, Figure 8 analyzes the correlation between the GDP of 17 provinces in China and the number of blue firms in 2012. There is a positive correlation between the two, indicating that richer blue provinces in China are more likely to have more blue firms with international competitiveness. This relationship also explains the differences in the development direction of the blue economy among provinces. That is, compared with inland blue provinces, coastal blue provinces have excellent economic development capabilities, and correspondingly, they may have a higher production capacity for complex products. For example, the existing production capacity of coastal provinces with high GDP (e.g., Guangdong, Shandong, Shanghai, Zhejiang) means they are more inclined to develop a complex product export-led economy than other provinces. In contrast, the GDP of inland provinces (e.g., Xinjiang, Chongqing, Yunnan, Qinghai) is highly dependent on the export of raw material processing products, and these provinces are more likely to develop a raw material export-led economy.
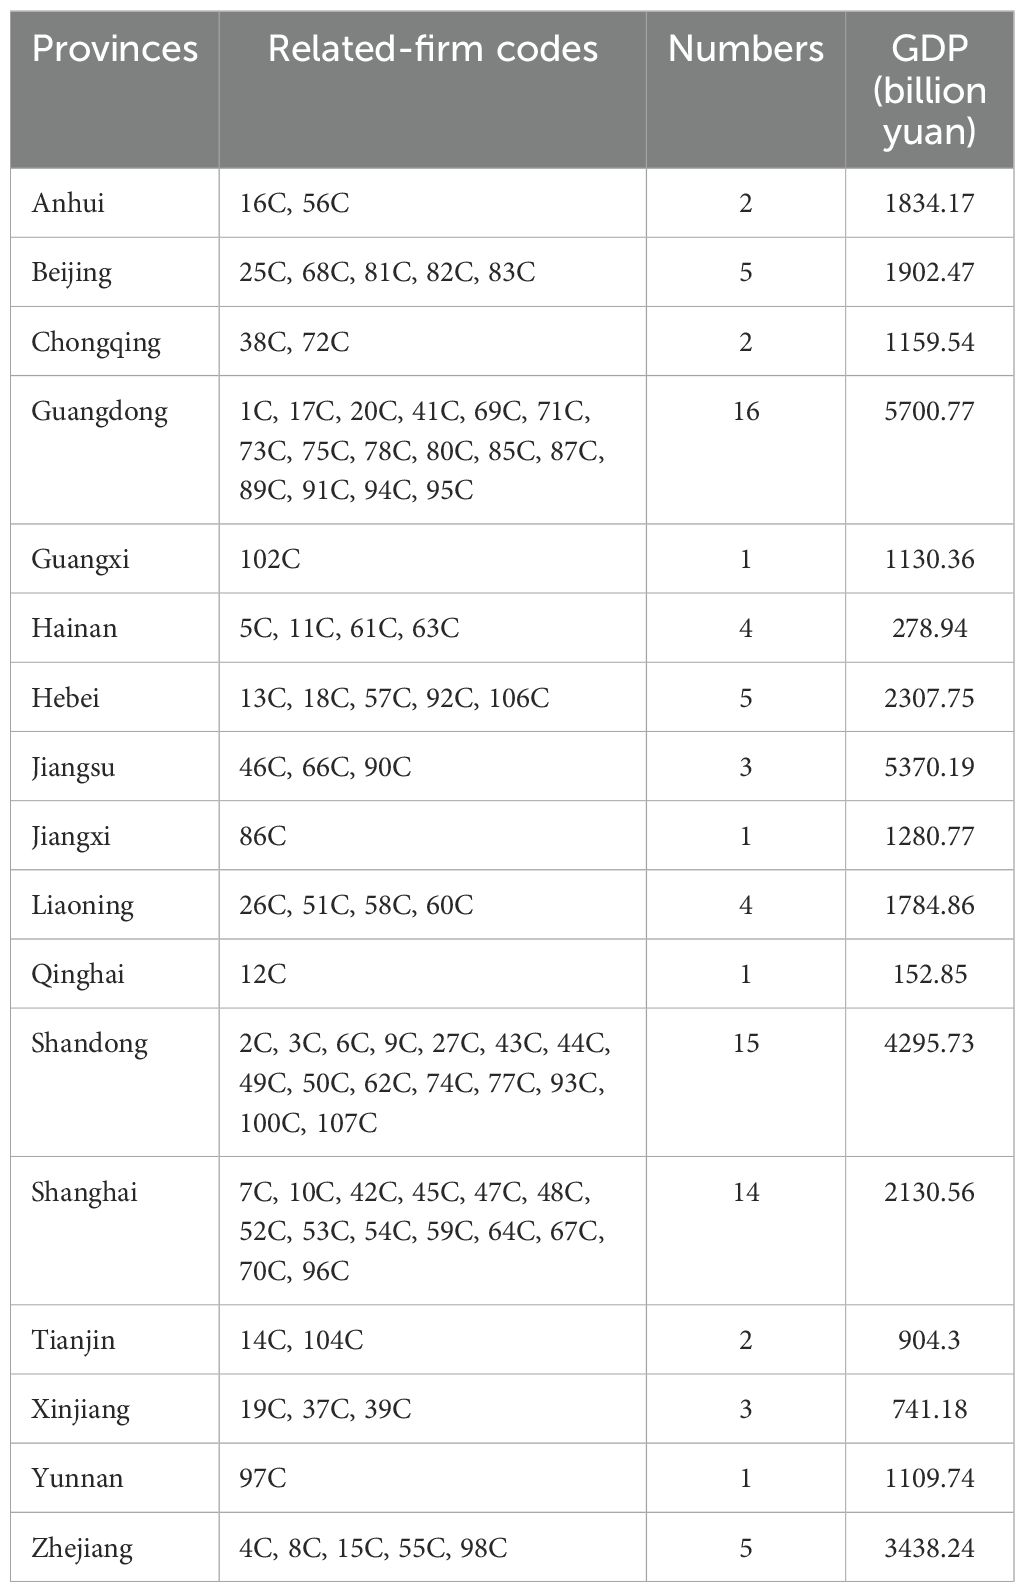
Table 2. Information on 84 firms with comparative advantages.
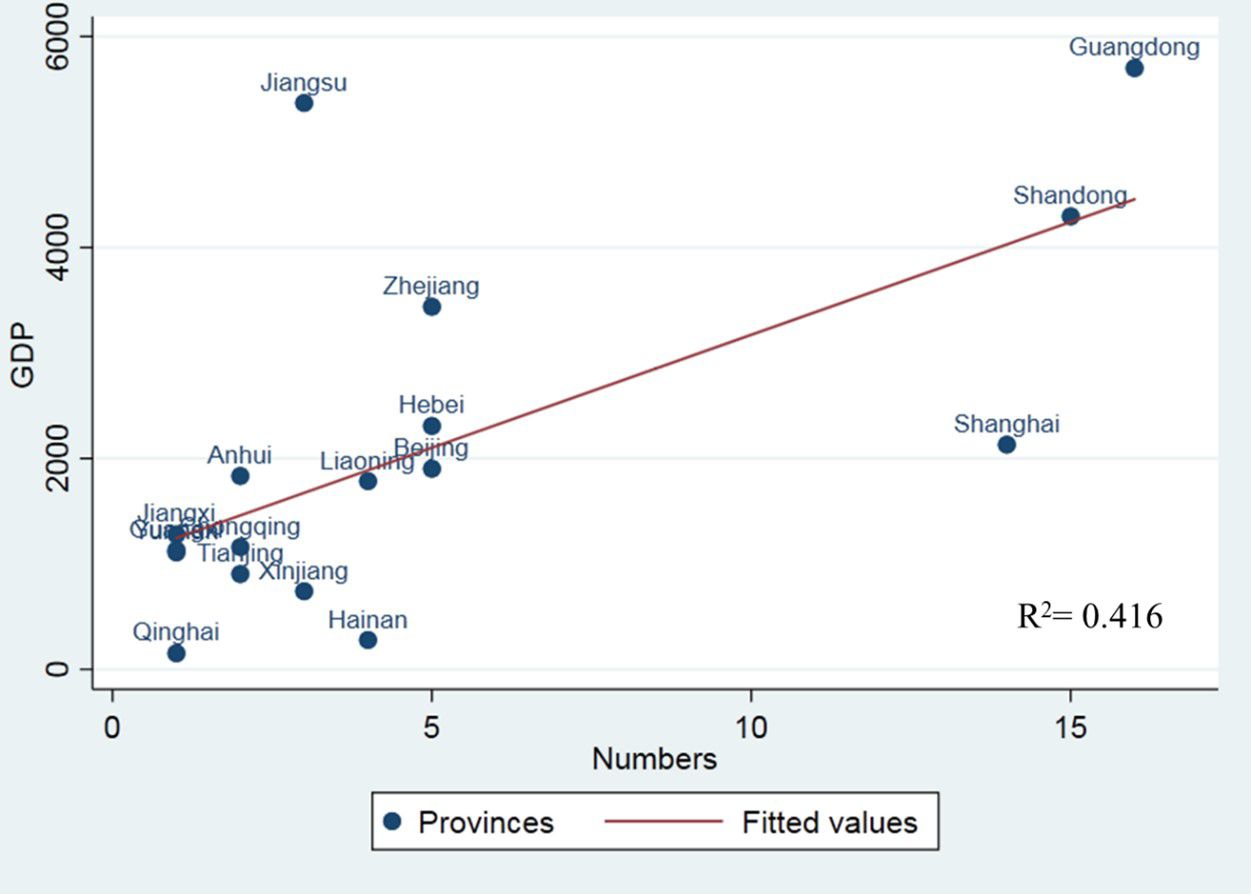
Figure 8. Relationship between provincial GDP and the number of blue firms in 2012. Note: The figure shows that the p value is less than 1%.
4.2.3 Practical guidance at the blue industry-blue province level
Table 3 calculates the average RCA values between the 17 blue provinces and the five major blue industries in China in 2012 on the basis of Table 2, and it further elevates the relevance from the firm level to the industry level. Hainan, Qinghai, Xinjiang, and Yunnan have comparative advantages in the marine chemical industry; Anhui, Guangxi, Jiangsu, Liaoning, and Shanghai have comparative advantages in shipping and transport; and Beijing, Guangxi, Jiangsu, and Jiangxi have comparative advantages in coastal manufacturing. These findings suggest that policy-makers in relevant blue provinces can formulate policies and measures that are conducive to the development of blue industries with comparative advantages. The more complex the blue industry is, the more blue provinces with specific complex capabilities are needed to develop blue products with a certain level of complexity that can be traded in the international market (Qi, 2024). That is, blue industries and their products are usually developed by a few blue provinces with different capacity endowments that can optimize the combination of resources. Additionally, “the higher the technological complexity of interprovincial exports, the more conducive to promoting the industrial structure to evolve toward rationalization and sophistication” (Liu and Chen, 2016). Therefore, Chinese policy-makers can reform the current blue industry structure at the provincial level, further assess the export potential of blue products in the export basket, formulate targeted blue industry policies to guide technology and social investment to support the production and export of relevant blue firms, enhance their competitiveness in the international market and their ability to bear risks, and further realize the transformation and upgrading of the blue industrial structure.
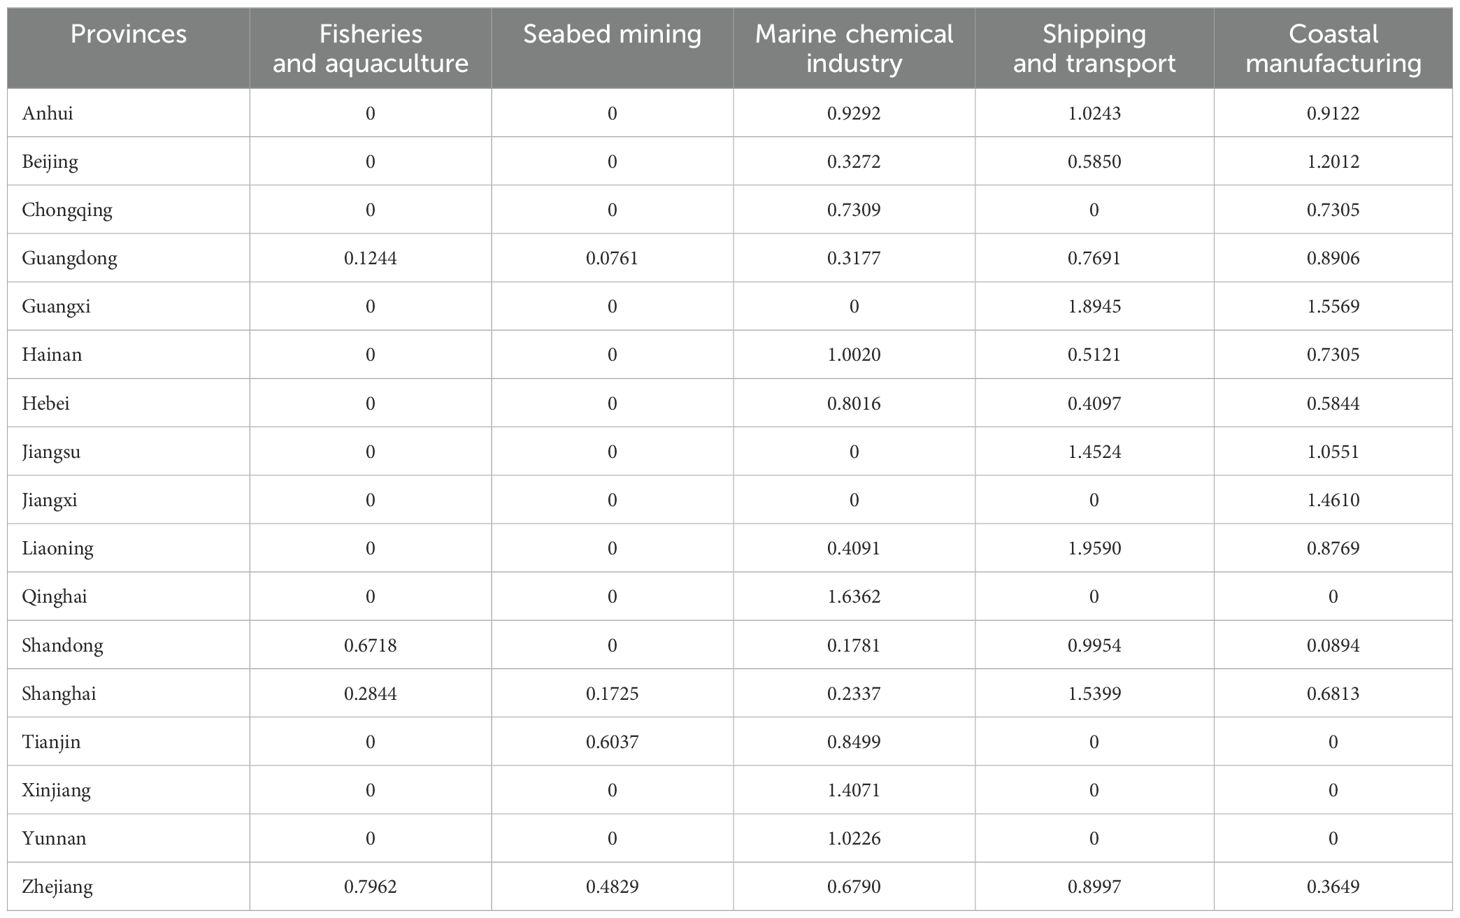
Table 3. Average RCA between the blue provinces and blue industries of China in 2012.
5 Conclusions and limitations
Which blue industries, blue products, blue firms and blue provinces should policy-makers and stakeholders in each country support through polices to actively achieve the goal of “moving from the ocean we have to the ocean we want” (IOC-UNESCO, 2021)? The analytical framework of the national blue economic system seems to be a feasible solution. It places multiple agents within a unified analytical framework for systematic research, which will help policy-makers formulate scientific and rational policy recommendations. That is, the development potential of the blue economy in different countries depends not only on their own related resources and their ability endowments but also on the interagent and cross-agent relevance structures that affect the development of the blue economy (Graziano et al., 2022). This framework enriches the connotation of comparative advantage from the perspective of multiagent relevance and expands the analytical range of current research on the blue economy. The main conclusions of this paper are as follows.
First, the paper analyzes the influence mechanism of the relevance structure between multiattribute agents of the blue economy in the national blue economic system. The national blue economic system is the main carrier of a country’s blue economic development. The blue industries, blue products, blue firms and blue provinces in the system and the relevance structure between them are the key elements that affect the development of the blue economy. The essence of its association is to form different levels of relevance structure on the basis that the blue industry and its products are close to similar industries and its products. The degree of diversification and similarity within an agent and the degree of complexity between agents characterize the allocation of blue resources and the degree of the geographic division of labor (Qi et al., 2020a; Graziano et al., 2022; Qi, 2024). The driving ability between multiple agents affects the efficiency and benefits of blue economic development.
Second, the agents in the national blue economic system will continue to change dynamically over time. Correspondingly, the single-level and cross-level relevance structure constructed by blue industries, blue products, blue firms and blue provinces will also change dynamically. This dynamic evolution is the key to explaining the differences in the achievement of blue growth performance between countries (Graziano et al., 2022). Therefore, studying the evolution of blue products, blue firms, and blue provinces in the national blue economic system and the multilayer structure evolutionary trend of their coupling make it possible to further analyze whether a country’s blue industry has been realizing industrial upgrading over time or encountering a certain “disconnection” risk in the process of industrial upgrading (Zhang, 2008). Whether blue firms maximize their production capacity over time or are limited to their existing capabilities and whether they optimize their export structure over time or are trapped in the existing structure are open questions (Qi et al., 2020a, 2020b; Qi, 2024).
Third, the paper conducts applied research on the development status of China’s blue economy. China is in an important period of building a “dual circulation” development pattern, and it is also in a critical period of realizing the transformation and upgrading of the blue economy. During this period, the high-end blue equipment manufacturing industry was taken as the development direction of industrial transformation and upgrading in the new development pattern of “dual circulation”. Although China currently does not have a comparative advantage in this field, as an important node in the production and manufacturing links of the global value chain, China currently has an excellent window of opportunity for the transformation and upgrading of its blue industry. The evolutionary theory of comparative advantage tells us that policy-makers want to take advantage of this window of opportunity. They must realize that the upgrading range and direction of blue industries are not only affected by the existing blue industrial structure but also limited by the production capacity of blue firms and the resource endowment of blue provinces. As stated by Hidalgo et al. (2007), there is an optimal distance for the industrial upgrading path, which varies from country to country. Therefore, China cannot completely rely on the blue economic development experience of other countries. Policy-makers must find the upgrading distance of the blue industry that is unique to China and determined by the technical distance between blue products in the “dual circulation” development pattern.
Fourth, there are still some limitations in the analytical framework of the national blue economic system based on the perspective of relevance theory. (i) The analytical framework of the national blue economic system is limited to export analysis and does not reflect other information on national imports or domestic production and business activities. (ii) The categories of blue industries and their products are not limited to the classifications used in this paper, and countries can choose industries and their product categories that reflect the development of their blue economy. They can then conduct a relevance analysis based on the methods presented in this paper to evaluate the extent to which selected blue industries and their products contribute to the blue economy. (iii) The network model and its index evaluation system reflecting the national blue economic system have not yet been constructed based on the theories of network science and economic complexity (Hidalgo et al., 2007; Tacchella et al., 2012; Cristelli et al., 2015; Qi, 2022a). (iv) How to capture changes in external conditions beyond products, firms, industries, and provinces through this multi-agent correlation analysis, especially given climate impacts that can alter comparative advantage, is another issue that deserves attention. Future research needs to further quantitatively analyze the diversity and similarity of interagent structures and the complexity of cross-agent structures. These limitations need to be further overcome in future studies.
Data availability statement
The original contributions presented in the study are included in the article/supplementary material. Further inquiries can be directed to Xiaofei Qi, cWl4aWFvZmVpMTk4OEAxNjMuY29t.
Author contributions
XQ: Conceptualization, Data curation, Formal analysis, Funding acquisition, Investigation, Methodology, Project administration, Resources, Software, Supervision, Validation, Visualization, Writing – original draft, Writing – review & editing.
Funding
The author(s) declare financial support was received for the research, authorship, and/or publication of this article. We are grateful to the Key R&D Program (Soft Science Project) of Shandong Province (No. 2024RKY0203), the Youth Innovation Team Program of Institutions of Higher Learning of Shandong Province (No. 2023RW030), the Youth Program of Shandong Provincial Natural Science Foundation (No. ZR2023QG091) and the Talent Research Project of Qilu University of Technology (No. 2023RCKY269) for supporting this study.
Conflict of interest
The author declares that the research was conducted in the absence of any commercial or financial relationships that could be construed as a potential conflict of interest.
Publisher’s note
All claims expressed in this article are solely those of the authors and do not necessarily represent those of their affiliated organizations, or those of the publisher, the editors and the reviewers. Any product that may be evaluated in this article, or claim that may be made by its manufacturer, is not guaranteed or endorsed by the publisher.
Footnotes
- ^ Product density refers to the density of a country’s export products, which reflects the capacity endowment of products that do not yet have obvious comparative advantages. If the product density in a country’s export basket is higher, the country has more paths for product development and industrial upgrading, and the distance taken to leap to more complex products and industries is greater.
- ^ Balassa (1965) defined RCA to evaluate the competitiveness of different products.
- ^ The product and firm classifications of Qi (2024) are used here.
- ^ The situation of the joint export of one blue product between blue firms is not considered here because firms often focus on their own main products and occasionally export such product in reality, so the correlation between blue firms in this case is relatively low.
References
Abouarghoub W., Haider J. (2019). “Shipping economics: status and future prospects,” in Contemporary operations and logistics. Ed. Wells P. (Palgrave Macmillan, Cham).
Aghion P., Howitt P. (1992). A model of growth through creative destruction. Econometrica 60, (2) 323–351. doi: 10.2307/2951599
Albertos I., Martin-Diana A. B., Burón M., Rico D. (2019). Development of functional bio-based seaweed (Himanthalia elongata and Palmaria palmata) edible films for extending the shelflife of fresh fish burgers. Food Packaging Shelf 22, 100382. doi: 10.1016/j.fpsl.2019.100382
Amon D., Metaxas A., Stentiford G., Escovar-Fadul X., Walker T. R., Diana Z., et al. (2022). Blue economy for a sustainable future. One Earth 5, 960–963. doi: 10.1016/j.oneear.2022.08.017
Arvanitoyannis I. S., Kassaveti A. (2008). Fish industry waste: treatments, environmental impacts, current and potential uses. J. Food Sci. Technol. 43, 726–745. doi: 10.1111/j.1365-2621.2006.01513.x
Balassa B. (1965). Trade liberalization and ‘revealed’ comparative advantage. Manch. Sch. Econ. Soc Stud. 33, 99–123. doi: 10.1111/j.1467-9957.1965.tb00050.x
Belton B., Reardon T., Zilberman D. (2020). Sustainable commoditization of seafood. Nat. Sustain. 3, 677–684. doi: 10.1038/s41893-020-0540-7
Bennett N. J., Cisneros-Montemayor A. M., Blythe J., Silver J. J., Singh G., Andrews N., et al. (2019). Towards a sustainable and equitable blue economy. Nat. Sustain. 2, 991–993. doi: 10.1038/s41893-019-0404-1
Bennett N. J., Villasante S., Espinosa-Romero M. J., Lopes P. F. M., Selim S. A., Allison E. H. (2022). Social sustainability and equity in the blue economy. One Earth 5, 964–968. doi: 10.1016/j.oneear.2022.08.004
Bronnmann J., Smith M. D., Abbott J., Hay C. J., Næsje T. F. (2020). Integration of a local fish market in Namibia with the global seafood trade: Implications for fish traders and sustainability. World Dev. 135, 105048. doi: 10.1016/j.worlddev.2020.105048
Butlin J. A. (1976). The political economy of international marine resources management. Resour. Pol. 2, 128–135. doi: 10.1016/0301-4207(76)90007-6
Chen J. H., Xiong W. J., Xu L., Di Z. J. (2021). Evolutionary game analysis on supply side of the implement shore-to-ship electricity. Ocean Coast. Manage. 215, 105926. doi: 10.1016/j.ocecoaman.2021.105926
Chen J. H., Ye J., Zhuang C. L., Qin Q. D., Shu Y. Q. (2022a). Liner shipping alliance management: Overview and future research directions. Ocean Coast. Manage. 219, 106039. doi: 10.1016/j.ocecoaman.2022.106039
Chen J. H., Zhang W. P., Song L., Wang Y. F. (2022b). The coupling effect between economic development and the urban ecological environment in Shanghai port. Sci. Total Environ. 841, 156734. doi: 10.1016/j.scitotenv.2022.156734
Chen J. H., Zhuang C. L., Xu H., Xu L., Ye S. M., Rangel-Buitrago N. (2022c). Collaborative management evaluation of container shipping alliance in maritime logistics industry: CKYHE case analysis. Ocean Coast. Manage. 225, 106176. doi: 10.1016/j.ocecoaman.2022.106176
Colgan C. (2013). The ocean economy of the United States: measurement, distribution and trends. Ocean Coast. Manage. 71, 334–343. doi: 10.1016/j.ocecoaman.2012.08.018
Cristelli M., Tacchella A., Pietronero L. (2015). The heterogeneous dynamics of economic complexity. PloS One 10, e0117174. doi: 10.1371/journal.pone.0117174
Dierickx I., Matutes C., Neven D. (1991). Cost differences and survival in declining industries: a case for “Picking winners? Eur. Economic Rev. 35, 1507–1528. doi: 10.1016/0014-2921(91)90015-B
Ding L. L., Lei L., Wang L., Zhang L. F., Calin A. C. (2020). A novel cooperative game network DEA model for marine circular economy performance evaluation of China. J. Clean. Prod. 253, 120071. doi: 10.1016/j.jclepro.2020.120071
Gnyawali D. R., Madhavan R., He J. Y., Bengtsson M. (2016). The competition–cooperation paradox in inter-firm relationships: A conceptual framework. Ind. Mark. Manage. 53, 7–18. doi: 10.1016/j.indmarman.2015.11.014
Graziano M., Alexander K. A., McGrane S. J., Allan G. J., Lema E. (2022). The many sizes and characters of the Blue Economy. Ecol. Econ. 196, 107419. doi: 10.1016/j.ecolecon.2022.107419
Halpern B. S., Walbridge S., Selkoe K. A., Kappel C. V., Micheli F., D’Agrosa C., et al. (2008). A global map of human impact on marine ecosystems. Science 319, 948–952. doi: 10.1126/science.1149345
Hidalgo C. A., Klinger B., Barabási A. L., Hausmann R. (2007). The product space conditions the development of nations. Science 317, 482–487. doi: 10.1126/science.1144581
(2021). The United Nations Decade of Ocean Science for Sustainable Development (2021-2030) Implementation plan-Summary (Paris: UNESCO).
Jouffray J.B., Blasiak R., Norström A.V., Österblom H., Nyström M. (2020). The blue acceleration: the trajectory of human expansion into the ocean. One Earth 2(1), 43–54. doi: 10.1016/j.oneear.2019.12.016
Karakara A. A. W., Dasmani I. (2022). Social dimension of sustainable development: the missing piece in the blue economy policy discourse. 1–14. doi: 10.2139/ssrn.4199506
Kim J. H., Yoo S. H. (2020). Public perspective on the environmental impacts of sea sand mining: Evidence from a choice experiment in South Korea. Resour. Pol. 69, 101811. doi: 10.1016/j.resourpol.2020.101811
Klinger D. H., Eikeset A. M., Davíðsdóttir B., Winter A. M., Watson J. R. (2018). The mechanics of blue growth: management of oceanic natural resource use with multiple, interacting sectors. Mar. Policy 87, 356–362. doi: 10.1016/j.marpol.2017.09.025
Kong F. Z., Cui W. L., Xi H. H. (2021). Spatial-temporal variation, decoupling effects and prediction of marine fishery based on modified ecological footprint model: Case study of 11 coastal provinces in China. Ecol. Indic. 132, 108271. doi: 10.1016/j.ecolind.2021.108271
Kontovas C., Bras A. A., Chang C. H., Romano A., Poo M. C. P., Wang J., et al. (2022). Fostering innovation in the blue economy within the United Kingdom (UK): A stakeholders’ perspective. Ocean Coast. Manage. 224, 106143. doi: 10.1016/j.ocecoaman.2022.106143
Lin Y. F. (2012). New structural economics-a framework for rethinking development and policy (Washington D.C: World Bank Publications).
Liu H. D., Chen H. (2016). The evolution of China's provincial industrial structure from the perspective of export technology complexity: theory and examples. Inq. into economic Issues 05), 105–113.
Liu C. X., Jiang Q. J., Leibrecht M. (2022). Does an increased synergy in an industry’s subsystems impact on industrial development? Case Fisheries industry China. Mar. Policy 135, 104837. doi: 10.1016/j.marpol.2021.104837
Ma H. D., Li L. X. (2021). Could environmental regulation promote the technological innovation of China's emerging marine enterprises? Based moderating effect government grants Environ. Res. 202, 111682. doi: 10.1016/j.envres.2021.111682
Magnier L., Mugge R., Schoormans J. (2019). Turning ocean garbage into products——consumers’ evaluations of products made of recycled ocean plastic. J. Clean. Prod. 215, 84–98. doi: 10.1016/j.jclepro.2018.12.246
Melvin E. C., Acton L., Campbell L. M. (2023). (Un)claiming rights, resources, and ocean spaces: Marine genetic resources and area-based management tools in high seas governance negotiations. Environ. Plan E-Nat. 6, 1661–1681. doi: 10.1177/25148486221132832
Midlen A. (2023). Enacting the blue economy in the Western Indian Ocean: A ‘collaborative blue economy governmentality’. Environ. Plan E-Nat 0, 1–27. doi: 10.1177/25148486231198010
Morrissey K. (2014). Using secondary data to examine economic trends in a subset of sectors in the English marine economy: 2003-2011. Mar. Policy 50, 135–141. doi: 10.1016/j.marpol.2014.05.018
Morrissey K., O’Donoghue C. (2012). The Irish marine economy and regional development. Mar. Policy 36, 358–364. doi: 10.1016/j.marpol.2011.06.011
Morrissey K., O’Donoghue C. (2013). The role of the marine sector in the Irish national economy: an input-output analysis. Mar. Policy 37, 230–238. doi: 10.1016/j.marpol.2012.05.004
Morrissey K., O’Donoghue C., Farrell N. (2014). The local impact of the marine sector in Ireland: a spatial microsimulation analysis. Spat. Econ. Anal. 9, 31–50. doi: 10.1080/17421772.2013.835439
Morrissey K., O’Donoghue C., Hynes S. (2011). Quantifying the value of multi-sectoral marine commercial activity in Ireland. Mar. Policy 35, 721–727. doi: 10.1016/j.marpol.2011.02.013
Nham N. T. H., Hoa T. T. M., Ha L. T. (2023). Influences of digitalization on sustaining marine minerals: A path toward sustainable blue economy. Ocean Coast. Manage. 239, 106589. doi: 10.1016/j.ocecoaman.2023.106589
Patil P. G., Virdin J., Diez S. M., Roberts J., Singh A. (2016). Toward a blue economy: a promise for sustainable growth in the Caribbean (Washington D.C: World Bank).
Qi X. F. (2022a). Building a bridge between economic complexity and the blue economy. Ocean Coastal Manage 216, 105987. doi: 10.1016/j.ocecoaman.2021.105987
Qi X. F. (2022b). The conceptual framework of the national blue economic system: A multiagent perspective. Mar. Policy 145, 105287. doi: 10.1016/j.marpol.2022.105287
Qi X. F. (2024). Mapping the national blue economic system space: A case study of China. Mar. Policy 160, 105959. doi: 10.1016/j.marpol.2023.105959
Qi X. F., Zhao B. X., Zhang J. H. (2020a). What does the product space mean for firms in the development of marine-related products? Mar. Policy 115, 103822. doi: 10.1016/j.marpol.2020.103822
Qi X. F., Zhao B. X., Zhang J. H., Xiao W. W. (2020b). The drawing of a national blue product space and its evolution. Mar. Policy 112, 103773. doi: 10.1016/j.marpol.2019.103773
Rangel-Buitrago N., Gracia C. A. (2024). Human impact on the scenic quality of coastal dunes: A study of the central Caribbean coast of Colombia. Reg. Stud. Mar. Sci. 79, 103813. doi: 10.1016/j.rsma.2024.103813
Ren W. H., Wang Q., Ji J. Y. (2018). Research on China's marine economic growth pattern: an empirical analysis of China's eleven coastal regions. Mar. Policy 87, 158–166. doi: 10.1016/j.marpol.2017.10.021
Sundaram J. K., Arnim R. V. (2009). Trade liberalization and economic development. Science 323, 211–212. doi: 10.1126/science.1155337
Tacchella A., Cristelli M., Caldarelli G., Gabrielli A., Pietronero L. (2012). A new metrics for countries' fitness and products' complexity. Sci. Rep. 2, 723. doi: 10.1038/srep00723
UNDESA (2014). Blue economy concept paper (New York: United Nations). Available online at: https://sustainabledevelopment.un.org/content/documents/2978BEconcept.pdf
United Nations (2015). Transforming our world: the 2030 agenda for sustainable development (New York: United Nations). Available online at: https://sdgs.un.org/sites/default/files/publications/21252030%20Agenda%20for%20Sustainable%20Development%20web.pdfH
Virdin J., Vegh T., Jouffray J. B., Blasiak R., Mason S., Österblom H., et al. (2021). The Ocean 100: Transnational corporations in the ocean economy. Sci. Adv. 7, eabc8041. doi: 10.1126/sciadv.abc8041
Voyer M., Leeuwen V. J. (2019). [amp]]lsquo;Social license to operate’ in the Blue Economy. Resour. Pol. 62, 102–113. doi: 10.1016/j.resourpol.2019.02.020
Wang Z., Lu H., Han Z. (2018). An analysis of the spatial and temporal differentiation and driving factors of the marine resource curse in China. Ocean Coast. Manage. 155, 60–67. doi: 10.1016/j.ocecoaman.2018.01.015
Wang Y. X., Wang N. (2019). The role of the marine industry in China's national economy: an input-output analysis. Mar. Policy 99, 42–49. doi: 10.1016/j.marpol.2018.10.019
Whisnant R., Reyes A. (2015). Blue economy for business in East Asia: towards an integrated understanding of blue economy. (Quezon City: Partnerships in Environmental Management for the Seas of East Asia). Available online at: https://www.pemsea.org/sites/default/files/2023-12/PEMSEA%20Blue%20Economy%20Report%2011.10.15-2.pdf.
Xu L., Shi J., Chen J. H., Li L. (2021a). Estimating the effect of COVID-19 epidemic on shipping trade: An empirical analysis using panel data. Mar. Policy 133, 104768. doi: 10.1016/j.marpol.2021.104768
Xu L., Yang S. M., Chen J. H., Jia S. (2021b). The effect of COVID-19 pandemic on port performance: Evidence from China. Ocean Coast. Manage. 209, 105660. doi: 10.1016/j.ocecoaman.2021.105660
Yin K. D., Xu Y., Li X. M., Jin X. (2018). Sectoral relationship analysis on China's marine-land economy based on a novel grey periodic relational model. J. Clean. Prod. 197, Part 1815–826. doi: 10.1016/j.jclepro.2018.06.071
Zhang Q. Z. (2008). Evolution of comparative advantage and path of industry upgrading. China Ind. Economics 09), 58–68. doi: 10.19581/j.cnki.ciejournal.2008.09.006
Keywords: blue economic system, ocean resources, development mechanism, complex network, China
Citation: Qi X (2025) Resource elements of the national blue economic system and their development mechanisms: a case study of China. Front. Mar. Sci. 12:1453126. doi: 10.3389/fmars.2025.1453126
Received: 22 June 2024; Accepted: 15 January 2025;
Published: 07 February 2025.
Edited by:
Gerald Gurinder Singh, University of Victoria, CanadaReviewed by:
Alhassan Abdul-Wakeel Karakara, University of Cape Coast, GhanaYulan Kim, University of Washington, United States
Copyright © 2025 Qi. This is an open-access article distributed under the terms of the Creative Commons Attribution License (CC BY). The use, distribution or reproduction in other forums is permitted, provided the original author(s) and the copyright owner(s) are credited and that the original publication in this journal is cited, in accordance with accepted academic practice. No use, distribution or reproduction is permitted which does not comply with these terms.
*Correspondence: Xiaofei Qi, cWl4aWFvZmVpMTk4OEAxNjMuY29t