 Yujuan Li
 Kim Hang Pham Do
 Shamim Shakur
 Xin Sun
- 1Massey University, School of Accountancy, Economics and Finance, Auckland, New Zealand
- 2Yancheng Polytechnic College, Business School, Yancheng, China
Numerous studies have demonstrated that fishery subsidies play a role in income redistribution, potentially contributing to economic inequality. Additionally, since fishermen are highly dependent on the marine environment, there may be a connection between marine pollution and their income levels. This study explores the effects of fishery subsidies and marine environmental pollution on fishermen’s income and income inequality using panel data from 11 coastal provinces and municipalities in China from 2006 to 2020. Applying panel fixed effect model and quantile regression models, the results show that fishery subsidies significantly increase income, but disproportionately benefit higher-income fishermen, thereby exacerbating income inequality. Moreover, the relationship between marine pollution and income is non-linear: moderate pollution is associated with income gains, while severe pollution reduces income. These findings suggest that subsidy policies should be better targeted, and stricter marine environmental regulation is necessary to protect vulnerable fishing communities
1 Introduction
The global sustainable development agenda often highlights three critical issues: eliminating harmful fishery subsidies, eradicating poverty, and conserving marine resources (Teh et al., 2024). In 2022, an agreement was reached to prohibit harmful fishery subsidies, marking a major step toward achieving SDG Target 14.6 (WTO et al., 2022). This agreement provides a global framework to regulate subsidies and promote the sustainable use of fishery resources. However, most fishery subsidies remain environmentally detrimental—two-thirds of the USD 35.4 billion in subsidies in 2018 supported capacity-enhancing activities and encouraged excessive fishing efforts that contributed to overfishing and ecosystem degradation (Sumaila et al., 2019). These subsidies distort market dynamics by allowing fleets to operate at lower costs, thereby increasing fishing effort beyond sustainable limits (Sumaila et al., 2016, 2021). As a result, fishery stocks within biologically sustainable levels fell to 62.3% by 2021 (FAO, 2024). By contributing to overfishing and excessive fleet capacity (Arthur et al., 2019; Carvalho et al., 2011), subsidies accelerate the depletion of marine resources and the erosion of biodiversity over time (Clark et al., 2005; Merayo et al., 2019). Harmful subsidies have thus become a central concern for policymakers seeking to address both environmental and economic sustainability (Florido and Rosa, 2023).
Beyond ecological damage, harmful subsidies also produce negative economic and social effects. They reduce overall fishery profitability Heymans (Heymans et al., 2011) and disproportionately benefit large-scale fisheries, which receive 3.5 times more support than small-scale counterparts (Schuhbauer et al., 2017, 2020), exacerbating income inequality (Harper and Sumaila, 2019). Eliminating such subsidies could generate up to USD 83 billion in additional global fishery benefits annually (World Bank, 2017), curbing overexploitation could increase global fishery benefits by USD53–83 billion annually. Eliminating harmful subsidies to ensure the sustainability of fisheries must address not only environmental sustainability, which most studies focus on, but also the socio-economic impacts (Teh et al., 2020). However, few studies have explored how subsidies affect different socio-economic groups of fishermen, their implications for distribution and equity (Merayo et al., 2019), and the influence of marine pollution on fishermen’s incomes.
Using panel data from 11 coastal provinces and municipalities in China from 2007 to 2019, this study empirically evaluates the short-term effects of fishery subsidies on fishermen’s income in China, with a focus on heterogeneity across income levels and vessel sizes. It further investigates the potential nonlinear relationship between marine environmental quality and fisheries income. This study provides a more precise foundation for policymaking in marine environmental governance while offering new insights into the broader implications of fishery subsidies. The research areas (Figure 1), located around the Bohai Sea, Yellow Sea, East Sea, and South China Sea, are adjacent to or share marine resources with major fishery countries like South Korea, Japan, Vietnam, and Malaysia. As such, the findings of this study on Chinese fishermen’s income, marine pollution, and fishery subsidies hold significant relevance for neighbouring countries.
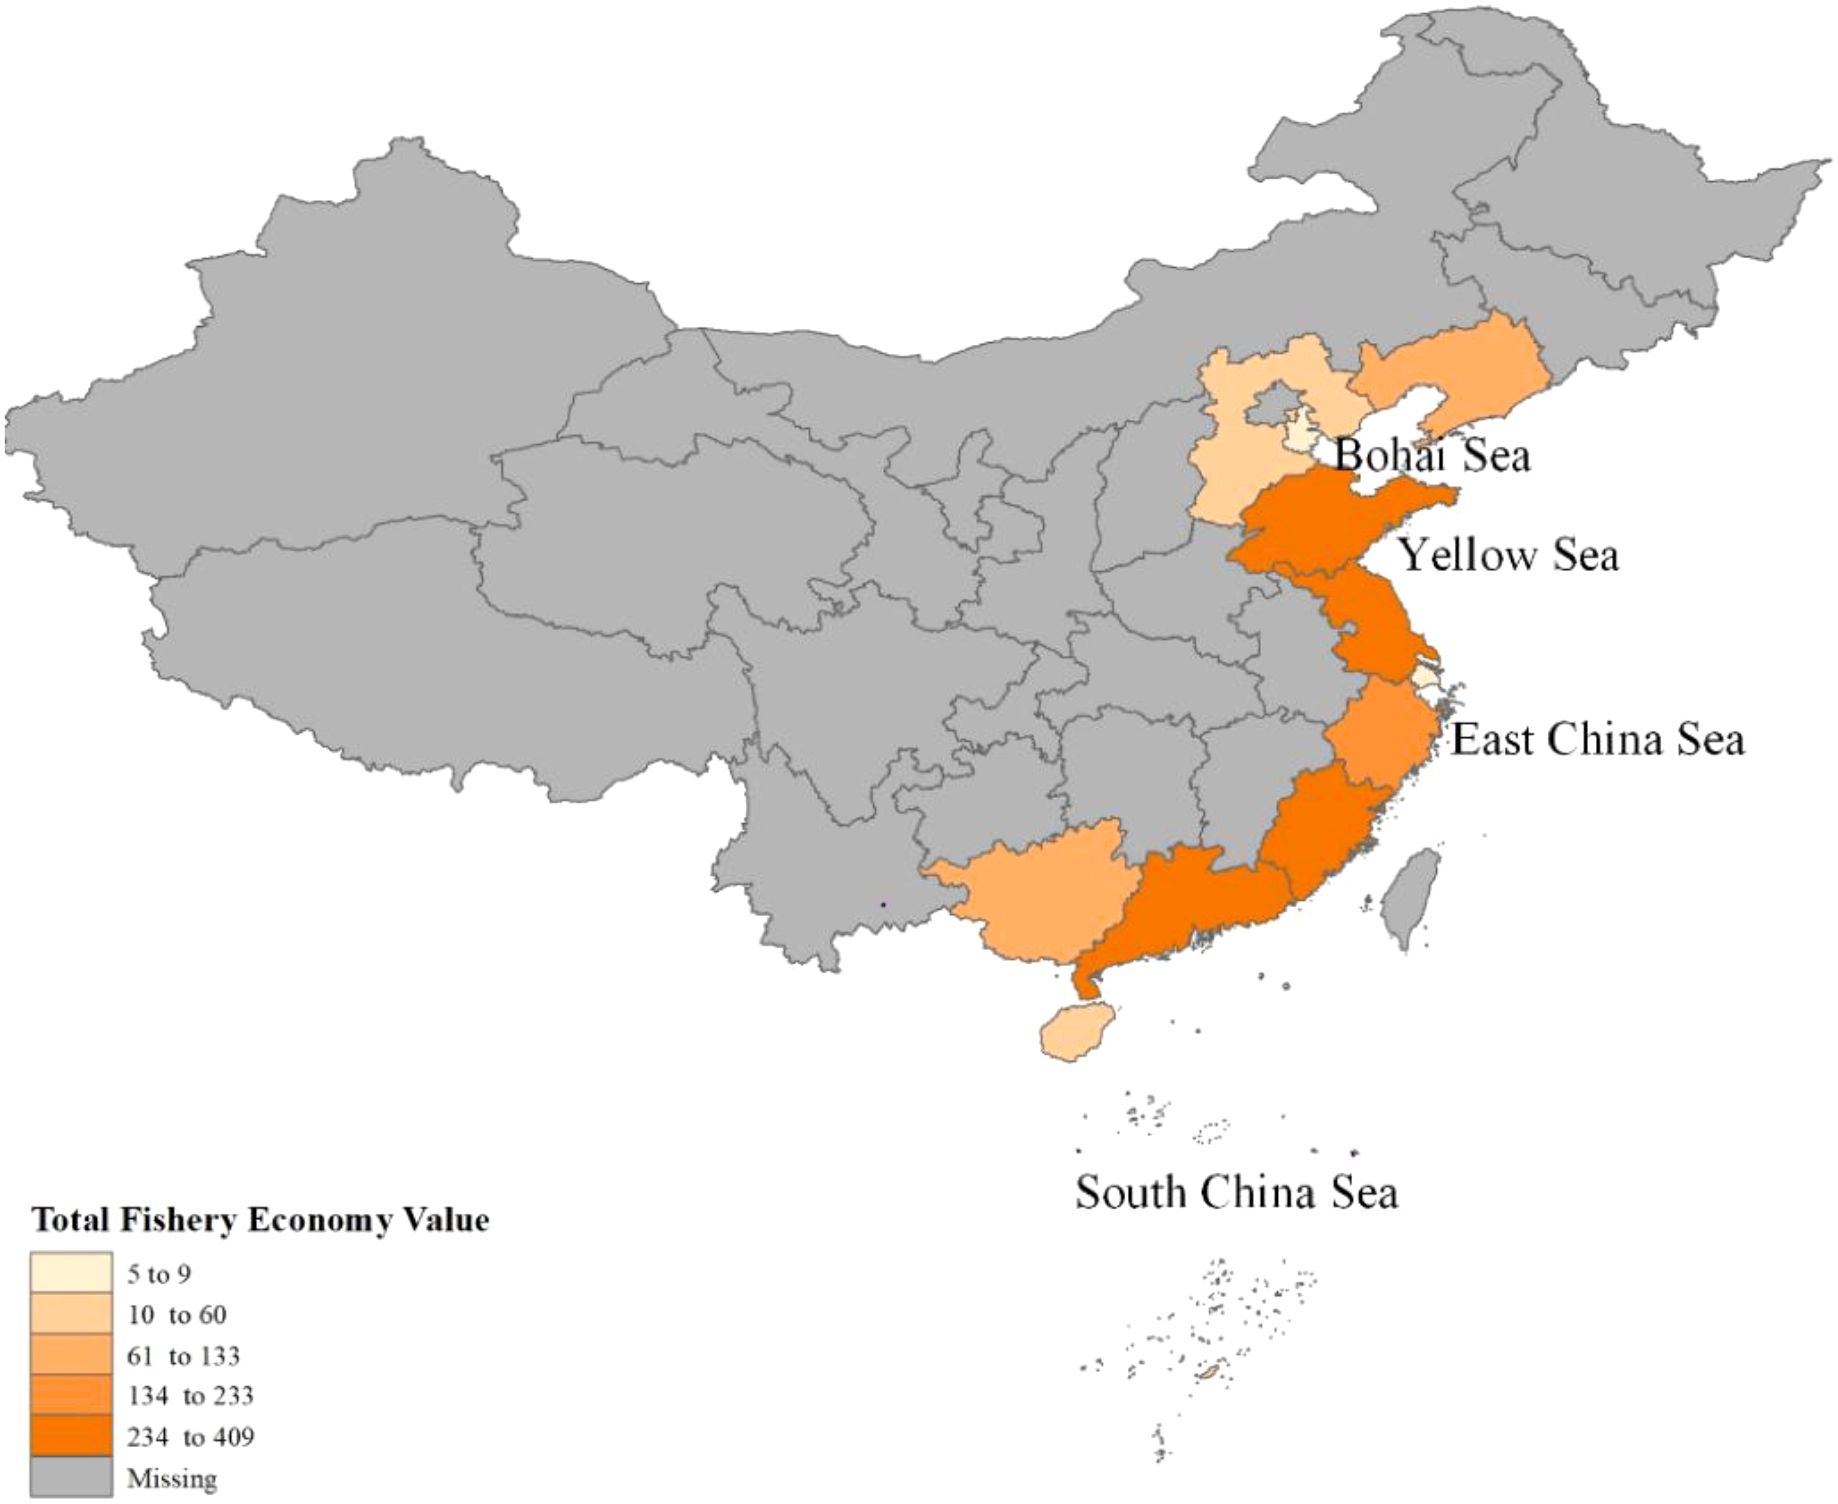
Figure 1. The location of 11 coastal provinces or municipalities and fishery economy value. Source: Adapted from China Fishery Statistical Yearbook.
2 Literature review and hypothesis
Gordon’s classic bioeconomic model (Gordon, 1954) serves as the foundation for this study and is extended to examine how revenues and intra-marginal rent vary when the government allocates fishery subsidies to heterogeneous vessels. The model assumes that vessel fleets are homogeneous and operate in a perfectly competitive market with identical cost structures, where the labour cost per unit of effort remains constant, and both marginal and average costs remain unchanged. It is also assumed that the market price is unaffected by the total amount of landed fish (Gordon, 1954; Sumaila et al., 2008). According to Flaaten (2011), industry marginal cost increases with fishing effort. In an open access fishery, the bioeconomic equilibrium occurs when average revenue (AR) equals marginal cost (MC), at which point no vessel enters or exits the fishery (Flaaten, 2011). Since fishermen are profit-driven, any positive profit attracts new entrants, reducing average revenue until it equals marginal cost (Flaaten, 2011). When average revenue exceeds marginal cost (AR > MC), new vessels enter the fishery; conversely, if average revenue falls below marginal cost (AR< MC), vessels exit the fishery.
China’s fishery subsidy policy has developed in two distinct phases (Wang et al., 2023). The first phase, from 2006 to 2014, began when China removed domestic fuel price controls to align with increasing global prices. Acknowledging that fluctuations in fuel prices could significantly raise fishing production costs, the government introduced a fuel subsidy program to alleviate these effects. This program offered financial support to fishermen and fishing enterprises operating motorized vessels for at least three months per subsidy year, particularly in offshore fishing and aquaculture.
In 2010, the Ministry of Agriculture (MOA, 2010) established a national standard for fuel subsidies:
Annual Subsidy =Annual fuel subsidy amount (tons) × Fuel Price Standard (Yuan/MT)
=Vessel Power× Fuel Subsidy Coefficient × Fuel Price Standard
Where Fuel Subsidy Coefficient (FSC) (MT/KW) = operating days × operating hours per day ×0.000205 (tons/kW/h). The amount of fuel subsidy was determined by a vessel’s engine power, fuel price, annual operating days, and daily operating hours. Under this system, fishery subsidies partially offset fuel consumption costs, with the subsidy amount directly linked to fuel usage. Consequently, during this phase, fishery subsidies functioned as cost-reducing measures by lowering the overall cost of fishing effort.
In the second phase, from 2015 to 2020, the Ministry of Agriculture of the People's Republic of China (2015) implemented a nationwide reform of its fuel subsidy program in response to increasing demands for marine ecosystem protection. This reform aimed to address several challenges that impeded efforts to reduce fishing capacity and conserve resources. The revised subsidy program decoupled payments from fuel costs and introduced the Fuel Subsidy Comprehensive Adjustment Coefficient (FSCAC) to account for the ecological impact of different fishing gear types. The FSCAC incorporated factors such as the fuel subsidy coefficient and ecological restoration considerations. Additionally, subsidies were based on the Average Vessel Power (AVP), which did not correspond to a vessel’s registered engine power. Instead, vessels were classified according to their gear type, engine power, and length, with those in the same category assigned the same AVP.
Annual subsidy = AVP× FSCAC× Fuel Subsidy Reference Standard
Where FSCAC is set by taking into account factors such as fuel subsidy coefficient and ecological restoration; Fuel Subsidy Reference Standard is the fuel price standard in 2014. The fuel subsidies were not based on each vessel’s fuel consumption but were instead allocated as a fixed amount according to vessel classification. Therefore, at this stage, they can be categorized as lump-sum revenue-enhancing subsidies.
According to Gordon’s extended bioeconomic model, bioeconomic equilibrium is achieved at the fishing effort level, E*, before the introduction of subsidies, at which point the marginal rent is R*. However, the total cost curve shifted from TC to TC1 as the cost of each fishing effort fell, after the implementation of cost-reducing subsidies. In the short term, at the original effort level E*, reduced fishing costs increase fishermen’s economic surplus from R* to (R* + S), which, in turn, attracts additional participants to the fishery. Over the long term, the increased fishing effort escalates until a new bioeconomic equilibrium is reached at E1, while the marginal cost curve shifts from MC to MC1. During this transition from E* to E1, average revenue (AR) remains higher than the new marginal cost (MC1), and the resulting extra profit induces further entry into the fishery under open-access conditions. At equilibrium E1, higher fishing effort corresponds with reduced resource stocks.
Similarly, if the subsidies are revenue-enhancing, the total revenue curve shifts upward while total costs remain unchanged, leading to an increase in average revenue. This, too, will attract additional fishing fleets, thereby inflating the overall fishing effort. In this scenario, the average revenue exceeds marginal cost, generating extra profit. Consequently, in the short term, fishermen’s income rises as a result of the subsidies, forming the basis for Hypothesis 1.
2.1 H1: Fishery subsidies promote fishermen’s income increase in the short term
Fishing vessels are typically heterogeneous, varying in gear types, technological capabilities, and fishermen’s skills, among other factors. As a result, some vessels generate profits (resource rent), while others do not (Coglan and Pascoe, 1999). Moreover, due to the existence of sunk costs, assets such as vessels, fishing equipment, and fishermen’s specialized expertise are not easily transferable to other industries or sectors. Consequently, reallocating these production factors to alternative businesses can be both costly and time-consuming (Merayo et al., 2019).
In the short term, the fishermen’s income increases due to subsidies, which leads to a rise in fishing efforts from E* to E1, at which point bioeconomic equilibrium (where MC = AR) is achieved. This attracts more entrants to the fishery, resulting in reduced resource stocks and overcapacity (Sumaila et al., 2019), while some may shift to mariculture, thereby contributing to marine pollution (Yuan et al., 2023). The increased fishing efforts, coupled with resource depletion and mariculture-induced pollution, will cause a decline in catch and a rise in costs. In this context, intra-marginal rent is generated by the most cost-efficient vessels, which earn above-average profits (Nguyen, 2016), while less efficient vessels may only cover their costs or operate at a loss. However, due to sunk costs, these vessels will remain in the fishery in the short term, even if they are operating at a loss.
The primary objective of each vessel is profit-maximization, which occurs when marginal cost equals marginal revenue (MC = MR). In a competitive market, all vessels face the same industry-wide marginal revenue, as individual vessels lack the ability to influence market prices (Coglan and Pascoe, 1999). Some vessels generate economic profits by optimizing their fishing efforts and remain in the fishery, while others earn only normal profits, allowing them to stay in the short term but leading to eventual exit. Meanwhile, vessels that incur losses must leave the fishery in the short run. Subsidies—whether cost-reducing or revenue-enhancing—are partially allocated based on vessel engine power and length, meaning larger vessels typically receive higher subsidies. However, differences in cost structures and revenue composition among vessels lead to an uneven distribution of income and revenue (Nguyen, 2016). For instance, small-scale fishing vessels, with their limited range, generally catch fewer fish and receive lower subsidies than larger commercial vessels. Hence, trawlers—despite receiving comparable subsidies to other gear types—are more efficient but also more harmful to marine ecosystems. As a result, subsidies may exacerbate wealth disparities while contributing to marine resource depletion. Based on this analysis, Hypothesis 2 is proposed.
2.2 H2: The short-term income growth effects of fishery subsidies vary based on fishermen’s income levels and the scale of their fishing vessels
In addition to the impact of fishery subsidies, fishermen’s output is also influenced by marine environmental pollution. This study examines both marine capture and mariculture fisheries, with fishermen’s income encompassing earnings from both sectors. After the implementation of fishery subsidies, a significant influx of fishermen entered the industry, many of whom shifted to aquaculture. Additionally, some fishermen transition from marine capture to mariculture after exiting traditional fishing (Zheng et al., 2021). Consequently, China’s mariculture production has expanded rapidly, increasing from 28.1 million tons in 2005 to 52.9 million tons in 2022. However, this rapid growth has also led to severe environmental consequences. Mariculture generates substantial wastewater, including metabolic by-products, residual feed, and excrement, which are often discharged directly into coastal waters, contributing to offshore water quality degradation (Zheng et al., 2022).
It is assumed that fishermen’s income will initially rise as ocean conditions deteriorate but will eventually decline as marine pollution worsens. The initial increase is driven by fishing subsidies and the rapid expansion of mariculture. However, as more fishermen enter fishery, resource depletion and escalating pollution reduce fish stocks and degrade water quality. Ultimately, this environmental deterioration leads to a decline in fishermen’s income.
On one hand, in marine capture fishery, subsidies increase fishermen’s income, attracting more entrants to compete for limited resources. These subsidies allow inefficient fishing vessels to enter or remain in the sector (Shen and Chen, 2022), contributing to CO2 emissions from fuel combustion, ocean pollution from discarded plastic gear, and biodiversity loss by disturbing seabed sediments and harming vulnerable marine species (Woods and Verones, 2019). On the other hand, in the mariculture sector, subsidies and rising production levels drive income growth. However, the discharge of chemical pollutants, organic waste, and excess nutrients—such as phosphorus and nitrogen—contaminates seawater, leading to eutrophication and the degradation of essential ecosystem services (Streicher et al., 2021). As fishing and aquaculture efforts intensify, marine pollution escalates. Given fishermen’s reliance on the ocean, once pollution surpasses a critical threshold, fishery resources decline sharply, making it increasingly difficult for coastal fishermen to sustain their livelihoods (Gao et al., 2021).
Fishermen’s incomes initially increased due to subsidies and the expansion of mariculture. However, this growth was accompanied by environmental degradation, driven by resource depletion and increased mariculture activities. As marine pollution worsens, declining resource stocks and biodiversity lead to reduced fishery and mariculture output, higher marginal costs, and potentially lower revenues. Figure 2 illustrates the relationship between marine environmental conditions and fishing output, where D represents the level of marine pollution and P denotes fishing output. Accordingly, Hypothesis 3 is proposed as follows.
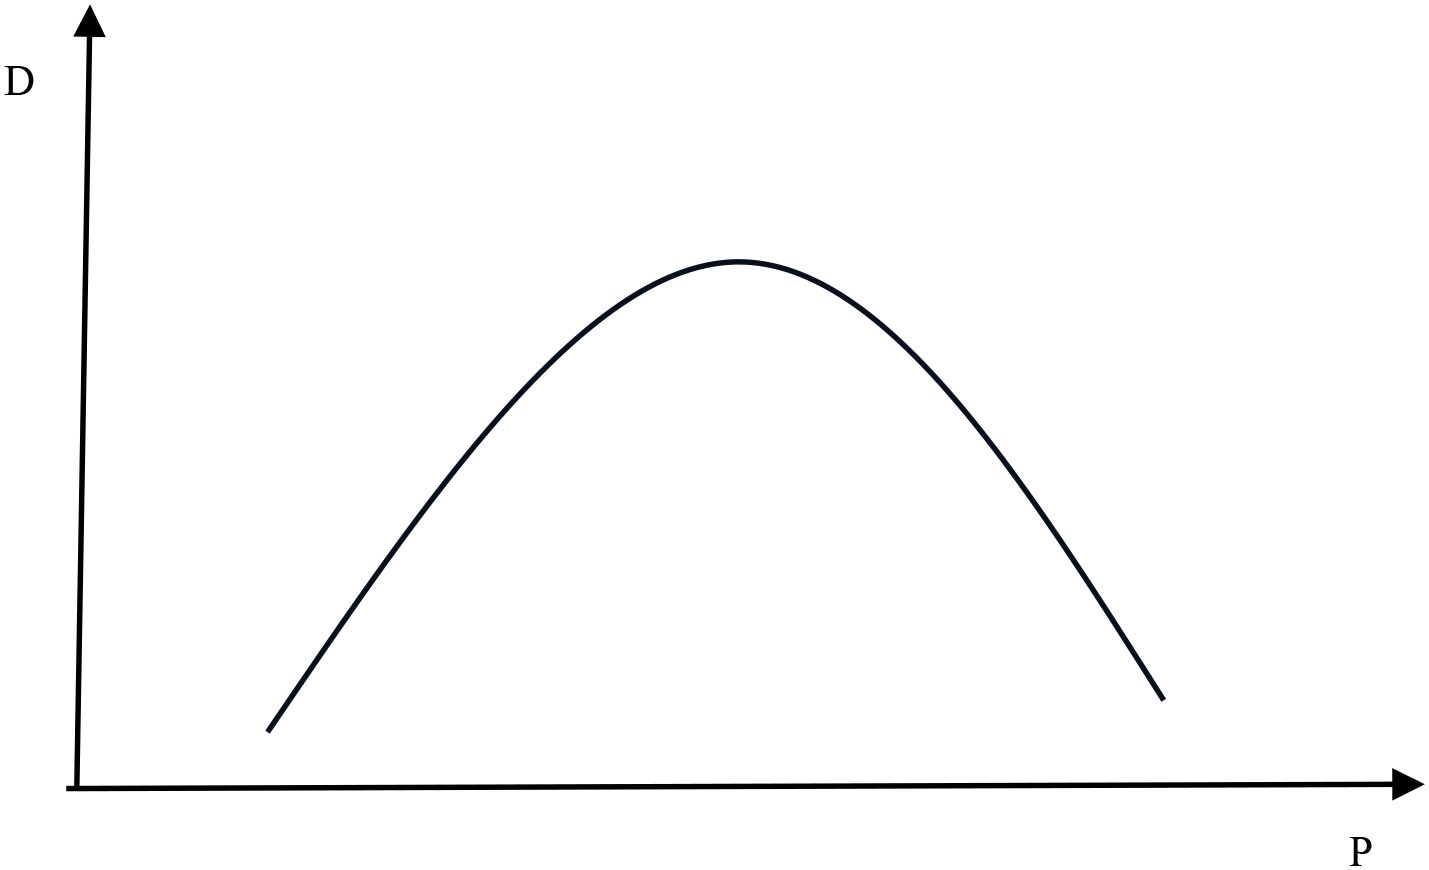
Figure 2. The relationship between marine pollution and fisheries production; Source: self-elaboration. where D represents the level of marine environmental pollution; P represents the fishing output.
2.3 H3: The relation between the marine environment and fishermen’s income (output) shows an inverted U-shaped curve
While Gordon’s model offers a foundational framework for analysing fishery economics, its assumptions—such as fleet homogeneity, perfect competition, and open access—do not fully align with the realities of Chinese fisheries. The model is based on the assumption of homogeneous vessel fleets operating in a perfectly competitive market, with identical cost structures and constant labour costs per unit of effort. In practice, however, fishing units in China differ substantially in scale, engine power, gear types, fishing strategies, and crew capabilities. Labor costs and fishing efficiency vary widely depending on fishermen’s skill levels, target species, and geographic fishing locations. Moreover, the fisheries sector in China is neither fully open-access nor perfectly competitive; it is shaped by localized regulations and fragmented governance structures that result in uneven enforcement and variable access conditions. These deviations may influence both the distributional effects and ecological outcomes of fishery subsidies. These factors introduce significant deviations from the model’s assumptions. As such, while the bioeconomic model provides a useful theoretical baseline, its predictions must be interpreted with caution and supplemented by empirical analysis.
3 Models and variables
3.1 Models and estimation methods
To analyse the impact of fishery subsidies on fishermen’s income, the following empirical model (Equation 1) is established:
where Incit represents the average household income of fishermen in province i and year t; Subit denotes the average fishery subsidies; MPIit represents marine environmental pollution index; ui denotes the province fixed effect; νt denotes the year fixed effect; μit is a random error term; Xit represents a vector of control variables.
Since that the relationship between marine pollution and fishermen’s income may not be linear, the model (Equation 2) includes the squared term of the marine pollution index:
Furthermore, to examine the heterogeneous impacts of fishery subsidies and the marine pollution index on income inequality across different income groups, the following models (Equations 3, 4) are constructed:
where Qτ(Inci|Subi) and Qτ(Inci|MPIi) represent the average family income of fishermen in the τ quantile; Subi and MPIit are independent variables, The coefficients ϑτ and θτ correspond to the parameter estimates for the core independent variables, namely fishery subsidies and the marine pollution index; Zi represents a series of control variables that influence income, while ϵτ denotes the random disturbance term. The value of τ ranges from 0 to 1, with τ=0.5 indicating the median quantile. The regression result at τ=0.5 represents the expected value of the dependent variable at the median quantile. As shown in Equation 5, the estimator βiτ can be formulated as the following minimization problem:
This study examines both the overall impact of fishery subsidies on fishermen’s income and the varying effects of these subsidies and marine pollution across different income levels. To achieve this, quantile regressions are used to assess the marginal effects of subsidies on fishermen’s income within various income groups.
3.2 Data source and variable selection
3.2.1 Data sources
The research data covers China’s eleven coastal provinces and municipalities from 2007 to 2019, encompassing the full duration of fuel subsidy implementation. This program, which is introduced in 2006, was replaced by the marine resource maintenance subsidy in 2020. The study covers the following coastal regions: Liaoning, Hebei, Tianjin, Shandong, Shanghai, Jiangsu, Zhejiang, Fujian, Guangdong, Guangxi, and Hainan. Data was collected from the China Fishery Statistical Yearbook, the China Statistical Yearbook, the Statistical Yearbook of Various Provinces, the China Population and Employment Statistical Yearbook, the Bulletin of Marine Ecological Environment of China and Each Province, and the China Environmental Statistics Yearbook. Missing data were filled using linear interpolation techniques.
3.2.2 Explained variable
3.2.2.1 Fishers’ income
The data on fishermen’s income are sourced from the China Fishery Statistical Yearbook. Given that fishery subsidies influence fishermen’s production activities (Sumaila et al., 2019, 2010), this study uses the average family net income (Inc) from coastal areas for estimation. The average family net income of fishermen is defined as total household earnings minus all expenses, including operating costs, fixed asset depreciation, and taxes.
3.2.3 Explanatory variable
3.2.3.1 Fishery subsidy
The fishery subsidy is represented by the average subsidy per fisherman, as reported in the China Fishery Statistical Yearbook (Chai et al., 2021). In 2013, fuel subsidies comprised the majority of China’s fishery subsidies, accounting for 94% of the total (Shen and Chen, 2022).
3.2.3.2 Marine environment
Marine pollution has a significant impact on fishermen’s income (Gao et al., 2021). As a key explanatory variable in this study, accurately measuring marine environmental conditions is essential. Previous studies have employed various indicators, such as industrial wastewater discharge in coastal areas (Yuan et al., 2021) or the proportion of type-4 and inferior type-4 seawater (Gao et al., 2021). However, the former focuses solely on industrial effluents, while the latter is too broad to capture specific variations in ocean pollution. To address these limitations, this study adopts the marine pollution index (MPI) as a comprehensive measure of marine environmental quality. The MPI is calculated based on the concentrations of key pollutants in coastal waters using the following formula:
where MPI represents the marine pollution index, while IN (Inorganic Nitrogen), AP (Active Phosphate), PE (Petroleum), and COD (Chemical Oxygen Demand) denote the concentrations of four major pollutants in offshore waters. The assigned weights are w1 = 0.6, w2 = 0.3, w3 = 0.07, and w4 = 0.03, following (Xuan et al., 2020). The ocean serves as the foundation for fishery production and is highly susceptible to environmental contamination, especially changes in seawater quality (Gao et al., 2021). Fishery activities themselves can contribute to marine pollution. For example, mariculture can cause eutrophication and chemical pollution (Streicher et al., 2021), while fishing operations can further degrade the marine environment through fuel consumption and the disposal of plastic gear (Woods and Verones, 2019). Conversely, increased seawater pollution also adversely affects both mariculture and marine fishing, leading to further depletion of marine resources. The Marine Pollution Index (MPI) may introduce spatial and temporal biases, as it is typically based on regional or modeled data that do not capture localized pollution in specific fishing grounds or short-term seasonal spikes. This can limit its accuracy in reflecting actual pollution exposure experienced by fishermen.
3.2.4 Control variables
This study incorporates two categories of control variables. The first category relates to the level of fishery development and includes the following: fishery capital input per capita, catch per unit of fishing effort (CPUEf), and catch per unit of mariculture effort. (CPUEc). Fishery capital input per capita, defined as the total vessel power per fisherman (Pow), plays a crucial role in determining fishing productivity and fishermen’s income. CPUEf, the ratio of fishing output to total fishing vessel power, measures the efficiency of fishing effort and the variable input per unit of vessel power (Gibson-Reinemer et al., 2017). CPUEc, the ratio of mariculture output to total farming vessel power, reflects the intensity of mariculture and the efficiency of variable input per unit of vessel power.
The second category relates to regional development levels and includes: education level and Regional economic development. Fishermen’s education level may affect fishermen’s catches (Amir et al., 2022). Since data on fishermen’s education levels are unavailable, the average years of schooling for rural residents (Edu) in different regions is used as a proxy (Sequeira et al., 2017). Education may not accurately. This may introduce measurement bias, as regional averages do not reflect practical knowledge or economic capacity in fisheries. Many fishermen with low formal education may still be highly skilled and productive. Regional economic development is measured by GDP per capita (GDP). Generally, a higher GDP per capita significantly enhances income levels (Diacon and Maha, 2015). Fishermen in economically developed regions tend to earn more due to higher fish prices, stronger consumer demand for aquatic products, and greater opportunities for alternative income sources beyond fishing.
Table 1 presents the variable design and descriptive statistics. The significant disparity in CPUEc values can be explained by rapid growth of mariculture. Over the past decade, national production has doubled, with certain regions emerging as major producers, while others exhibit minimal output. All value-related variables have been adjusted using the 2007 price index to account for inflation.
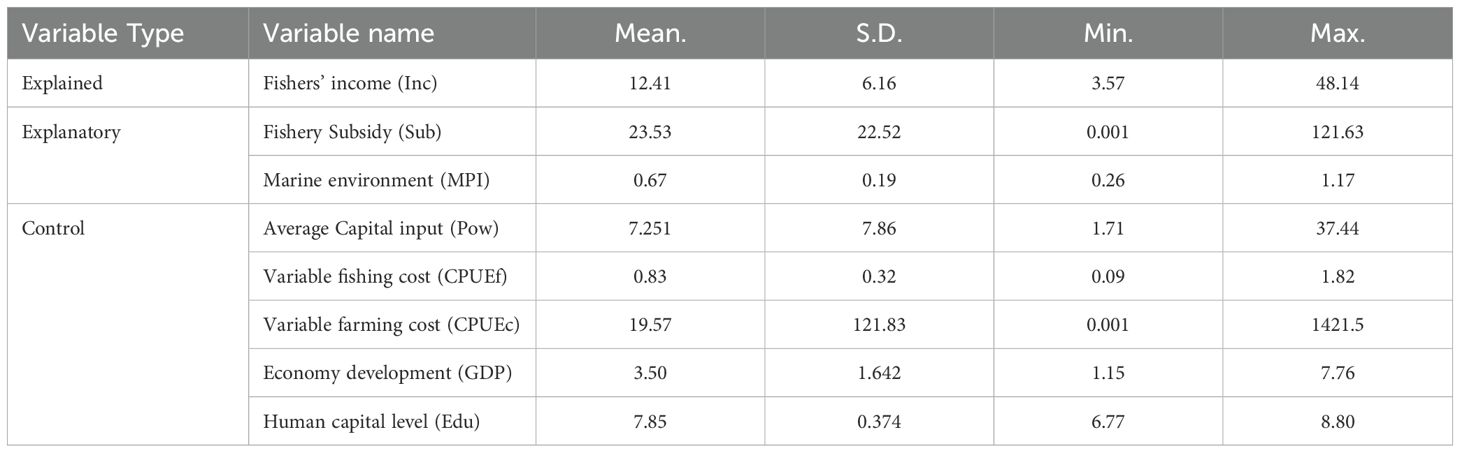
Table 1. Descriptive statistics results.
To ensure the accuracy of the regression model and avoid spurious regression, this study conducts a unit root test for all variables. Two methods, the homogeneous Levin-Lin-Chu (LLC) test and the heterogeneous Im-Pesaran-Shin (IPS) test, are employed to assess data stationarity. The results indicate that all regression variables are stable at the 1% significance level, with no evidence of a unit root, thereby eliminating the risk of spurious regression. To address potential multicollinearity, the variance inflation factor (VIF) is calculated. The findings reveal that the maximum VIF is well below 10, confirming the absence of multicollinearity.
3.3 Empirical result and analysis
3.3.1 The baseline regression
The results evaluate the impact of fishery subsidies on fishermen’s income (Model 1) are presented in Table 2. Columns (1) and (3) display the OLS regression results with and without control variables, respectively, while columns (2) and (4) show the fixed effects regression results under the same conditions. The findings indicate that the coefficients for fishery subsidies are positive and statistically significant at the 1% level, except in column (1), where OLS was estimated without control variables. The coefficient of fixed effect model (0.087) indicates that a one unit increase in fishery subsidies leads to an 8.7% increase in fishermen’s income. This suggests that fishery subsidies significantly increase income supporting Hypothesis H1.
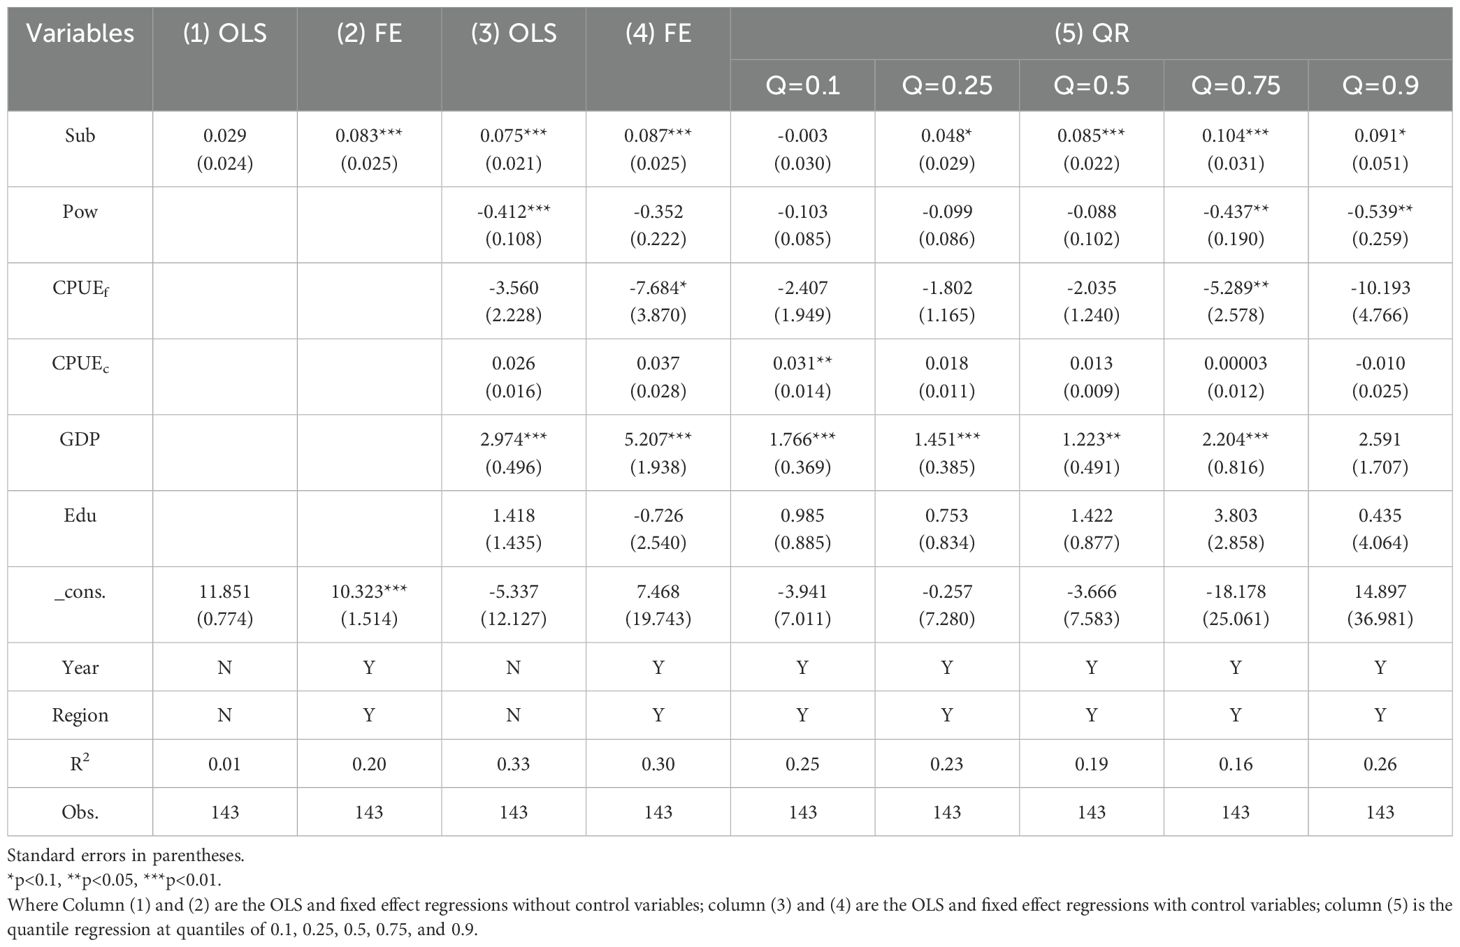
Table 2. Estimation of fishermen’ income affected by fishery subsidies.
Fishery subsidies can artificially boost profitability by lowering fishing costs (Sumaila et al., 2019), and have a positive short-term impact on vessel profitability (Nguyen, 2016). However, in an open-access fishery system, some vessels may achieve economic profits while others incur losses (Coglan and Pascoe, 1999). Table 2 presents the results of how fishery subsidies affect income across different income groups. The results show that the coefficients are statistically significant at the 10% or 1% level for the 0.25, 0.5, 0.75, and 0.9 quantiles, except for the 0.1 quantile. A Wald test rejected the null hypothesis of equal subsidy effects across the 25th, 50th and 75th quantiles (χ² = 3.79, p< 0.05), indicating significant variation in subsidy impacts across the income distribution. Additionally, the subsidy coefficients increase as income quantiles rise, indicating that while subsidies promote income growth, their effect varies across groups. The smallest effect is observed for low-income fishermen, supporting the first part of Hypothesis H2. High-income fishermen benefit most from subsidies, likely due to their larger social networks, greater access to capital, and more business opportunities. They may also possess better fishing skills, education, and more resources to invest in additional ventures. In contrast, low-income fishermen, constrained by limited skills, resources, or access to opportunities, are more reliant on their current activities, resulting in a smaller subsidy effect. This disparity suggests that high-income fishermen derive more substantial benefits, contributing to income inequality and widening the income gap.
Table 3 presents the results of evaluating the impact of ocean pollution on fishermen’s income by estimating model (2). Both the fixed effects model and OLS regressions reveal that the coefficients for the marine pollution index (MPI) and its square are statistically significant at the 5% level, with positive and negative signs, respectively. This suggests an inverted U-shaped relationship between marine pollution and fishermen’s income, providing support for Hypothesis H3. Initially, income increases with worsening environmental conditions, but at a certain threshold, further pollution adversely affects fishermen’s income.
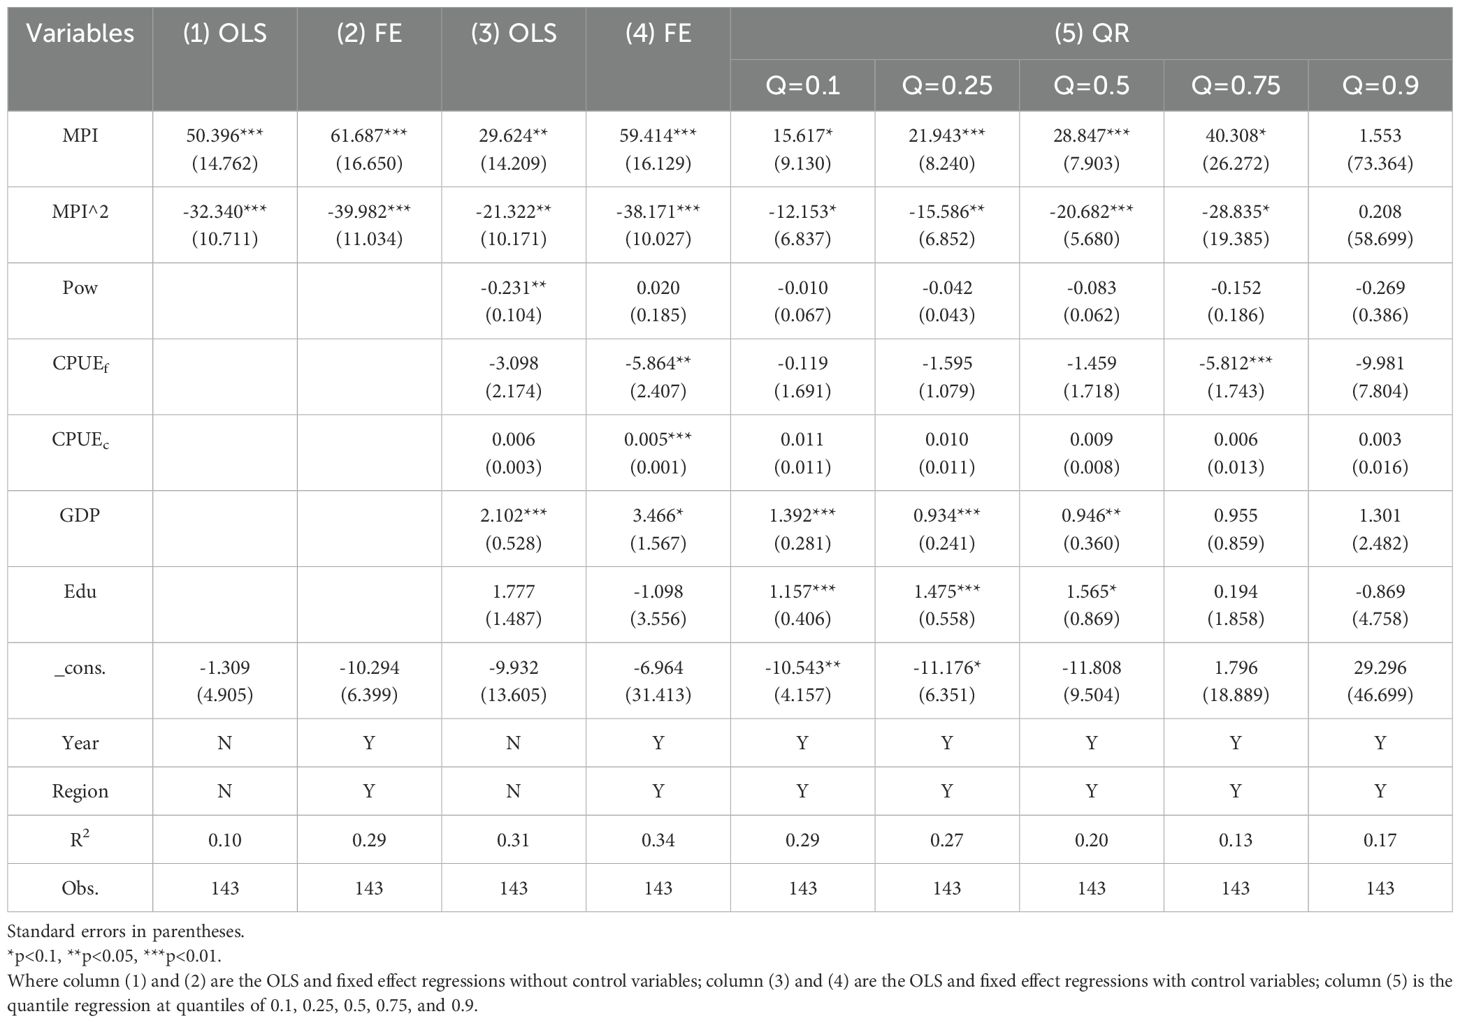
Table 3. Estimation of fishers’ income affected by marine environment.
Changes in the marine environment have a direct impact on fishery production. On one hand, fishing and mariculture can exacerbate marine pollution (Woods and Verones, 2019; Streicher et al., 2021), which in turn harms the fishing industry. Over the past decades, both the quantity and quality of marine products have declined (Cochrane, 2021), with some regions even experiencing a complete lack of fish (Cao et al., 2017). Pollution in offshore areas has risen, leading to the deterioration of marine ecosystems and fishery resources. As a result, fishermen face increasing costs and declining income year after year (Teh et al., 2020), highlights the growing imbalance between inputs and outputs for those reliant on the sea (Cochrane, 2021).
3.3.2 Robustness checks
3.3.2.1 Change dependent variable
Since fishermen’s income is linked related to fishery production, the total value of fishery production per fisherman is used as a proxy for income. Models (1) and (2) were re-estimated, with results presented in Table 4, columns (1) and (2). The findings indicate that the coefficients for fishery subsidies and the MPI are positive, while the coefficient for MPI² is negative, all significant at the 1% level. These results remain consistent with the baseline regression, confirming that fishery subsidies contribute to income growth and that the relationship between marine pollution and fishermen’s income follows an inverted U-shaped pattern.
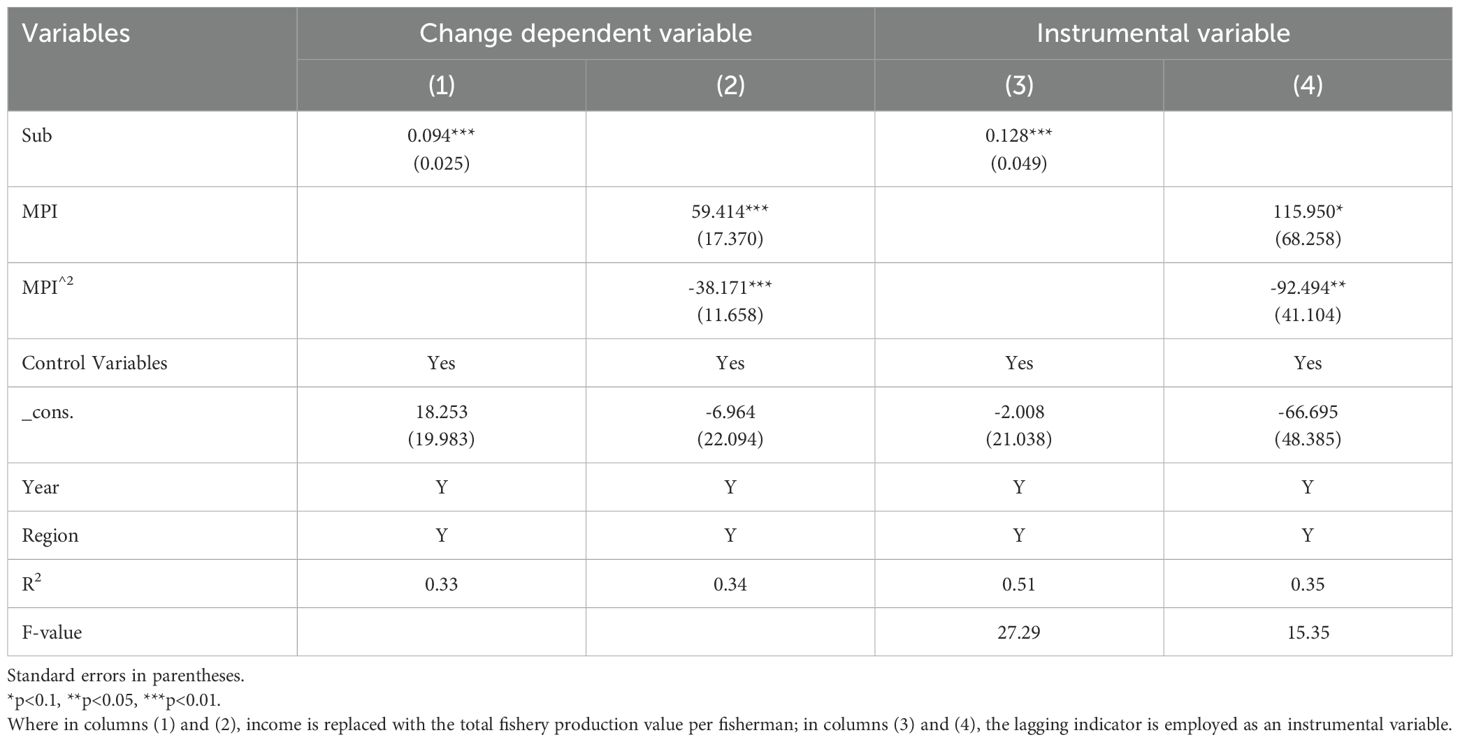
Table 4. The robustness check.
3.3.2.2 Endogeneity treatment
Fishermen’s income is influenced by multiple factors, which could introduce endogeneity due to omitted variables. Additionally, vessel power plays a key role in the allocation of fishery subsidies, as higher-powered vessels receive greater subsidies while also benefiting from expanded fishing ranges and increased income opportunities. This creates a potential reverse causality issue, leading to endogeneity concerns. Similarly, marine pollution affects fishermen’s earnings, while their income levels, in turn, influence marine pollution (Gao et al., 2021). To address these endogeneity concerns, models (1) and (2) are re-estimated using the instrumental variable approach. Based on Hsiao and Taylor’s (1991) research, lagging indicators can be used as instrumental variables in panel data analysis. Accordingly, this study uses the lagging values of fishery subsidies and the MPI as instrumental variables to estimate models (1) and (2). The results, presented in Table 4, columns (3) and (4), indicate that the coefficients for fishery subsidies, marine pollution, and control variables remain consistent with the baseline regression. Furthermore, the F-values exceed 10, indicating that there are no weak instrumental variables. A Hansen J test for overidentification was conducted to examine the validity of the instruments. The test statistic was χ²(df) = 2.758 (p = 0.097), and the null hypothesis was not rejected, indicating that the instruments are valid.
3.3.3 Heterogeneity effect
3.3.3.1 Scale heterogeneity
Teh et al. (2020) found that fishermen engaged in large-scale fishing (LSF) earn approximately 2.2 times more than those in small-scale fishing (SSF). Compared to LSF vessels, SSF ones, with their limited fishing capacity and range, generally produce lower yields and receive fewer fishery subsidies, making income growth more challenging. To assess the influence of vessel size on income, the sample is divided into two groups—large-scale and small-scale vessels—based on the median average engine power per vessel. Model (1) is then re-estimated for each group, with the results presented in Table 5. The coefficients for fishery subsidies are positive and statistically significant at the 1% level in both groups, though the effect is stronger for large-scale vessels. This finding supports the latter half of hypothesis H2, indicating that fishery subsidies contribute more significantly to income growth in LSF vessels. To test the robustness of the main results, a sensitivity analysis was performed by reclassifying fishing vessels into quartiles based on size, using the 25th and 75th percentiles as alternative cutoff points. Regression models were re-estimated for the bottom quartile (Column 3) and top quartile (Column 6) vessel groups. The findings remain qualitatively consistent, suggesting that the estimated subsidy effects are not sensitive to the choice of vessel size classification. This may be attributed to the greater engine power, capacity, and fishing range of large vessels, which typically yield higher output. Moreover, higher subsidies provide these vessels with greater opportunities for investment in advanced fishing gear and equipment, further enhancing their productivity.
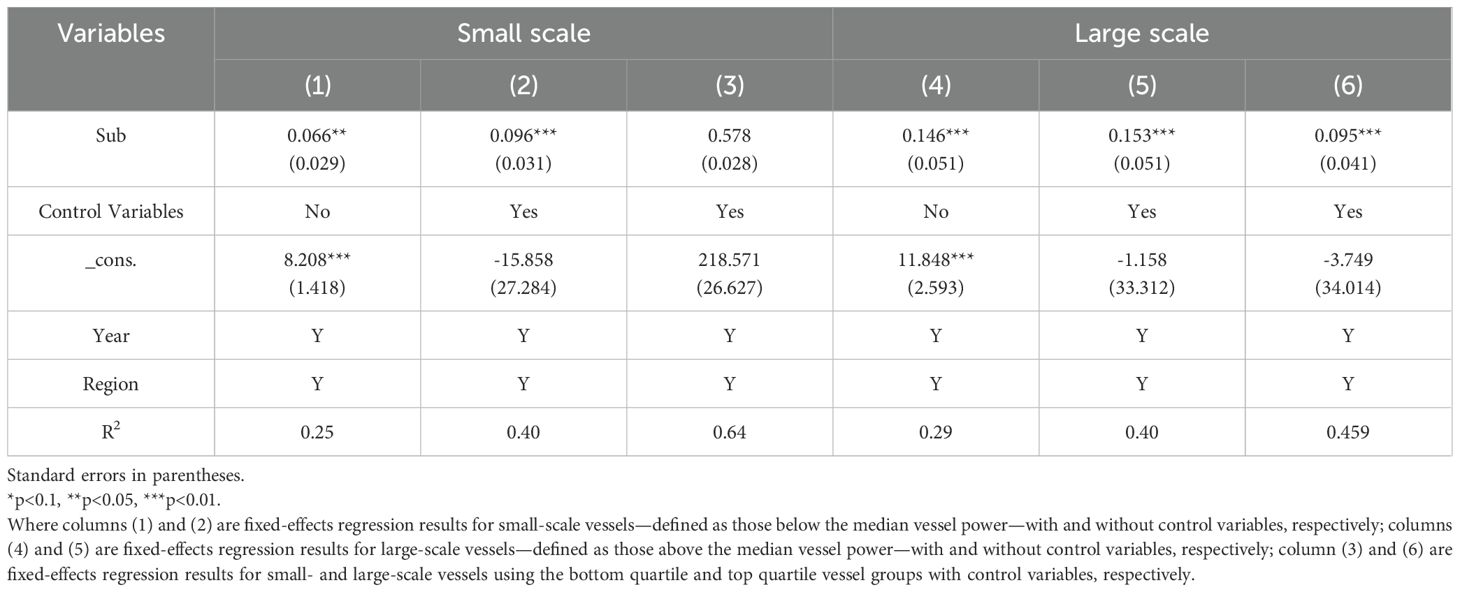
Table 5. The Heterogeneity of vessel scale.
3.3.3.2 Trawler proportion heterogeneity
When compared to other commonly used fishing gear, mobile bottom-contact gear—such as trawlers—is widely recognized as having the most significant ecological impact. Concerns over bycatch, damage to benthic communities, and a high carbon footprint are particularly pronounced (Hilborn et al., 2023). Trawling is among the most destructive fishing methods, accounting for nearly half of all discarded fish and marine animals worldwide (Stiles et al., 2010). Bottom trawling not only reduces marine species diversity but also disrupts benthic habitats, alters the balance of marine ecosystems, and threatens the regenerative capacity of fisheries.
In regions where trawlers constitute a large proportion of the fishing fleet, fishery resources are more severely depleted, leading to lower stock abundance. As a result, fishery subsidies have a limited effect on income growth. To examine this relationship, the sample is divided into two groups based on the median proportion of trawlers, and model (1) is applied separately to each group. The results, presented in Table 6, indicate that the coefficients for fishery subsidies are positive and statistically significant at the 1% or 5% level in both groups. However, the coefficient for the high-trawler-proportion group is lower than that for the low-trawler-proportion group, suggesting that fishery subsidies contribute more to income growth in regions with fewer trawlers. One possible explanation is that in areas with a high concentration of trawling, fishery resource depletion is severe. Only large-powered vessels can operate in distant pelagic waters, while SSF vessels are confined to inshore fishing, where fishery resources are increasingly depleted. Consequently, despite receiving the same level of fishery subsidies, fishermen in high-trawler regions catch fewer fish for the same level of effort (Stiles et al., 2010).
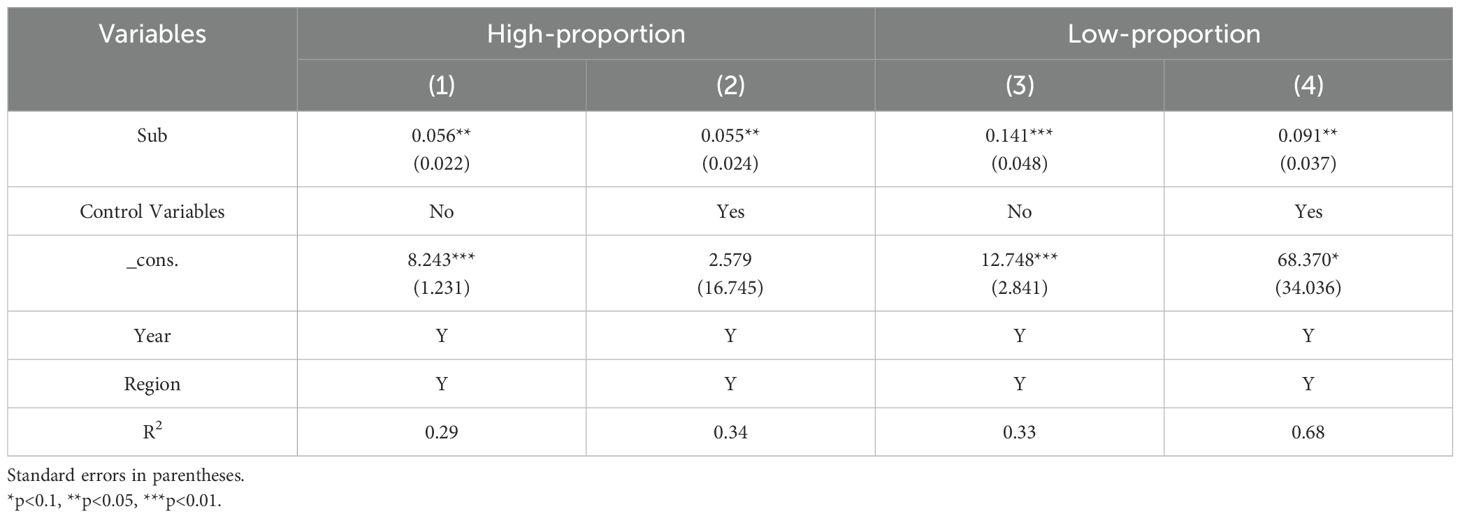
Table 6. The heterogeneity of trawler proportion.
4 Discussion
This study examines the impacts of fishery subsidies and marine environmental changes on fishermen’s income, with a particular focus on income inequality and regional variations. The results demonstrate that fishery subsidies have a significant positive impact on fishermen’s income, but the effect varies across income groups. Higher-income fishermen benefit more from the subsidies, which contribute to income inequality in the sector. The inverted U-shaped relationship between marine pollution and income suggests that moderate levels of pollution can be linked to an increase in fishermen’s income, but excessive pollution severely hampers fishery productivity and, consequently, fishermen’s income. This emphasizes the importance of maintaining environmental sustainability to support long-term income growth for fishermen.
The study also highlights the heterogeneous effects of subsidies based on vessel scale and the ecological impacts of different fishing methods. Regions with a higher proportion of LSF vessels benefit more due to their greater capacity, range, and ability to invest in advanced technologies. However, this leads to income inequality, as small-scale vessels, constrained by limited capacity and local fishing areas, struggle to convert subsidies into income growth. Additionally, the study emphasizes the ecological harm caused by bottom-contact fishing gear, particularly trawlers. In areas with a high proportion of trawlers, fishery resources are more severely depleted, limiting the effectiveness of subsidies in boosting income.
Fishery subsidies provide a crucial economic support for fishermen; however, they have also exacerbated income inequality within the sector. While eliminating these subsidies is often proposed as a measure to promote sustainability, an abrupt removal could lead to significant negative consequences. Because without fishery subsidies, the majority of fishing fleets operating on the high seas would operate at a loss globally (Sumaila et al., 2010), and most fishing fleets would fave negative profits in China (Shen and Chen, 2022). The immediate removal of subsidies would fail to simultaneously address environmental sustainability, economic viability, and social equity. Many unprofitable fishing vessels may continue operating due to sunk costs, while others might intensify fishing efforts to maximize short-term profits, leading to further environmental degradation.
We conjecture that, due to substantial sunk costs, many unprofitable fishing vessels may continue operating rather than exit the sector, while some may increase fishing intensity to maximize short-term gains—both behaviors potentially accelerating environmental degradation.
The impact on low-income fishermen would be particularly severe, as they often possess limited education, constrained resource endowments, and few alternative employment opportunities. The transition away from fisheries would thus be especially challenging for these vulnerable populations.
Over time, unprofitable fishing vessels would be forced to exit the industry. In 2022, more than 11.78 million fishermen were engaged in marine fishing, with 511 thousand fishing vessels constituting approximately one-fourth of the global fishing fleet (Ministry of Agriculture, 2023). The abrupt elimination of subsidies raises critical concerns regarding the fate of these vessels and the economic security of fishermen who depend on them. Without viable alternative livelihoods, many displaced fishermen could face extreme financial hardship, exacerbating social inequalities.
Given these potential challenges, it is imperative to adopt a gradual and well-structured approach to subsidy reform. A transition strategy should include compensatory measures to mitigate adverse socioeconomic impacts, such as redirecting subsidies toward poverty alleviation programs, vocational training, and investments in sustainable resource management. Such an approach would reduce incentives for overfishing while ensuring economic resilience among fishing communities.
5 Conclusion and policy implication
The reform of fishery subsidies is essential for achieving economic equity, environmental sustainability, and long-term sectoral viability. While subsidies have historically provided critical economic support, they have also contributed to income inequality and ecological overexploitation. Abrupt elimination of these subsidies could cause severe short-term hardships, particularly for low-income fishermen lacking alternative livelihoods. Therefore, a phased approach is needed—gradually removing harmful subsidies while safeguarding vulnerable groups through targeted support mechanisms.
In the short term, governments should redirect subsidy funds toward poverty alleviation and social protection measures that stabilize incomes and mitigate transitional risks (Merayo et al., 2019; Sumaila et al., 2022). This includes expanding access to social insurance, pension coverage, and unemployment benefits (Gao et al., 2021), along with providing direct cash transfers or livelihood assistance to the most affected households. Such compensatory interventions can reduce economic vulnerability while also discouraging unsustainable fishing incentives (Ferraro and Simorangkir, 2020; Schuhbauer et al., 2020).
In the long term, ensuring sustainable fisheries requires deeper structural reforms. This includes phasing out subsidies for large-scale, environmentally harmful practices—such as bottom trawling—while supporting small-scale, low-impact fisheries. Investments should target modernizing fleets, improving gear selectivity, and promoting sustainable aquaculture. Additionally, implementing effective fisheries management systems—such as Total Allowable Catch (TAC) limits or Individual Quotas (IQ)—alongside robust stock assessments will be crucial for regulating fishing intensity and maintaining ecological balance.
Finally, the transition toward sustainability must be supported by human capital development. Enhancing training programs and vocational support can help fishermen—especially from traditional sectors—acquire the technological skills needed to adapt to changing conditions or pursue alternative livelihoods (Pomeroy et al., 2016). Given the declining capacity of marine ecosystems to absorb continued fishing pressure, policies that facilitate long-term occupational shifts are not only desirable but necessary.
6 Limitations
First, the income data used in this study represents the average income across various regions rather than the income of individual households. Moreover, it aggregates earnings from both marine capture fisheries and mariculture, making it difficult to isolate the specific impact of fishery subsidies on these two distinct sectors. Regional disparities in fishermen’s income, as well as variations in catch prices influenced by local economic conditions, further complicate the analysis. To account for these variations, GDP per capita for each region is incorporated as a control variable.
Second, China’s fuel subsidies have been in place for only 13 years, and with data available for only 11 coastal provinces, the limited sample size may affect the robustness of the results.
Additionally, the marine environmental variable in this study includes only four primary pollutants in offshore waters. Other significant factors, such as climate change, plastic pollution, fishing regulations, and natural or human-induced disasters, were not included due to data availability constraints and measurement challenges. Future research would collect household-level panel data and track income, subsidies, and adaptation strategies among fishing households. Moreover, integrating dynamic environmental indicators—such as hypoxia zones, chloride concentrations, and seasonal pollution patterns—would enhance the accuracy of pollution exposure measurement and provide deeper insights into the ecological impacts of fishery activities over time.
Data availability statement
The raw data supporting the conclusions of this article will be made available by the authors, without undue reservation.
Ethics statement
Ethical approval was not required for this study because it did not involve human participants, personal data, or animal subjects.
Author contributions
YL: Methodology, Software, Writing – original draft, Writing – review & editing. KP: Conceptualization, Resources, Supervision, Writing – review & editing. SS: Supervision, Visualization, Writing – review & editing. XS: Data curation, Resources, Software, Writing – original draft, Writing – review & editing.
Funding
The author(s) declare that financial support was received for the research and/or publication of this article. This research was supported by the Qinglan Project of Jiangsu Province [2021], funded by the Jiangsu Provincial Department of Education.
Conflict of interest
The authors declare that the research was conducted in the absence of any commercial or financial relationships that could be construed as a potential conflict of interest.
Publisher’s note
All claims expressed in this article are solely those of the authors and do not necessarily represent those of their affiliated organizations, or those of the publisher, the editors and the reviewers. Any product that may be evaluated in this article, or claim that may be made by its manufacturer, is not guaranteed or endorsed by the publisher.
References
Amir, Akhmad, Romadhoni B., and Abidin Z. (2022). Factors affecting household income of traditional fishermen in Galesong district, Takalar regency, Indonesia. Eur. J. Business Manage. Res. 7, 22–25. doi: 10.24018/ejbmr.2022.7.6.1597
Arthur R., Heyworth S., Pearce J., and Sharkey W. (2019). The cost of harmful fishing subsidies (IIED Working Paper). pp. 1–33 Available online at: https://www.iied.org/16654iied (Accessed June 30, 2025).
Cao L., Chen Y., Dong S., Hanson A., Huang B. O., Leadbitter D., et al. (2017). Opportunity for marine fisheries reform in China. Proc. Natl. Acad. Sci. 114 (3), 435–442.
Carvalho N., Rege S., Fortuna M., Isidro E., and Edwards-Jones G. (2011). Estimating the impacts of eliminating fisheries subsidies on the small island economy of the Azores. Ecol. Economics 70, 1822–1830. doi: 10.1016/j.ecolecon.2011.05.013
Chai P., Hu Q., and Wei X. (2021). Influence of fishery subsidies on fishing: empirical test based on China’s provincial panel data. Fishes 6, 40. doi: 10.3390/fishes6030040
Clark C. W., Munro G. R., and Sumaila U. R. (2005). Subsidies, buybacks, and sustainable fisheries. J. Environ. Economics Manage. 50, 47–58. doi: 10.1016/j.jeem.2004.11.002
Cochrane K. L. (2021). Reconciling sustainability, economic efficiency and equity in marine fisheries: has there been progress in the last 20 years? Fish Fisheries 22 (2), 298–323.
Coglan L. and Pascoe S. (1999). Separating resource rents from intra-marginal rents in fisheries’ economic survey data. Agric. Resource Economics Rev. 28, 219–228. doi: 10.1017/S1068280500008212
Diacon P. E. and Maha L. G (2015). The relationship between income, consumption and GDP: A time series, cross-country analysis. Procedia Economics Finance, 23, 1535–1543.
FAO. (2024). The state of world fisheries and aquaculture 2024 blue transformation in action. (Rome: Food and Agriculture Organization). pp. 1–264. doi: 10.4060/cd0683en. (Accessed June 30, 2025).
Ferraro P. J. and Simorangkir R. (2020). Conditional cash transfers to alleviate poverty also reduced deforestation in Indonesia. Sci. Adv. 6, eaaz1298. doi: 10.1126/sciadv.aaz1298
Florido A. R. and Rosa E. P. (2023). Everything comes at a price: The impact of eliminating harmful subsidies in the Spanish marine resources industry. Mar. Policy 153, 105661. doi: 10.1016/j.marpol.2023.105661
Gao Q., Xu H., and Yuan B. (2021). Environmental change and fishermen’s income: is there a poverty trap: Evidence from China’s coastal areas. Environ. Sci. pollut. Res. 28, 60676–60691. doi: 10.1007/s11356-021-14254-1
Gibson-Reinemer D. K., Ickes B. S., and Chick J. H. (2017). Development and assessment of a new method for combining catch per unit effort data from different fish sampling gears: multigear mean standardization (MGMS). Canadian J. Fisheries Aquatic Sci. 74 (1), 8–14.
Gordon H. S. (1954). The economic theory of a common-property resource: the fishery. J. political economy 62, 124–142. doi: 10.1086/257497
Harper S. and Sumaila U. R. (2019). Distributional impacts of fisheries subsidies and their reform: case studies of Senegal and Vietnam. London: IIED Working Paper. IIED, pp. 1–29. Available online at: http://pubs.iied.org/16655IIED (Accessed June 30, 2025).
Heymans J. J., Mackinson S., Sumaila U. R., Dyck A., and Little A. (2011). The impact of subsidies on the ecological sustainability and future profits from North Sea fisheries. PLoS One 6, e20239. doi: 10.1371/journal.pone.0020239
Hilborn R., Amoroso R., Collie J., Hiddink J., Kaiser M., Mazor T., et al. (2023). Evaluating the sustainability and environmental impacts of trawling compared to other food production systems. ICES J. Mar. Sci. 80, 1567–1579. doi: 10.1093/icesjms/fsad115
Hsiao C. and Taylor G. (1991). Some remarks on measurement errors and the identification of panel data models. Statistica Neerlandica 45, 187–194. doi: 10.1111/j.1467-9574.1991.tb01303.x
Merayo E., Porras I., Harper S., Steele P., and Mohammed E. (2019). Subsidy reform and distributive justice in fisheries (IIED Working Paper). pp. 1–31. Available online at: https://www.iied.org/16645iied (Accessed June 30, 2025).
MOA (2010). Notice on the issuance of reference standards for the calculation of the amount fuel subsidy for domestic motor fishing vessels. Available online at: http://www.moa.gov.cn/gk/tzgg_1/tfw/201006/t20100606_1538704.htm. (Accessed June 30, 2025).
Ministry of Agriculture of the People's Republic of China. (2015). Notice on the issuance of the implementation plan for the adjustment of the fuel price subsidy policy for domestic fishery and aquaculture industry. Available online at: https://www.gov.cn/xinwen/2015-07/13/content_2895987.htm. (Accessed June 30, 2025).
Nguyen N. D. (2016). The economics of open-access fisheries: subsidies and performance of Vietnamese fisheries. (Tromsø: Doctoral dissertation, Arctic University of Norway). pp. 1–62. Available online at: https://hdl.handle.net/10037/9416. (Accessed June 30, 2025).
Pomeroy R. S., Ratner B. D., Hall S. J., Pimoljinda J., and Vivekanandan V. (2006). Coping with disaster: rehabilitating coastal livelihoods and communities. Mar. Policy 30 (6), 786–793.
Schuhbauer A., Chuenpagdee R., Cheung W. W., Greer K., and Sumaila U. R. (2017). How subsidies affect the economic viability of small-scale fisheries. Mar. Policy 82, 114–121. doi: 10.1016/j.marpol.2017.05.013
Schuhbauer A., Skerritt D. J., Ebrahim N., Le Manach F., and Sumaila U. R. (2020). The global fisheries subsidies divide between small-and large-scale fisheries. Front. Mar. Sci. 7, 539214. doi: 10.3389/fmars.2020.539214
Sequeira T. N., Santos M., and Ferreira-Lopes A. (2017). Income inequality, TFP, and human capital. Economic Rec. 93, 89–111. doi: 10.1111/1475-4932.12316
Shen C. and Chen T. (2022). Impact of fuel subsidies on bottom trawl fishery operation in China. Mar. Policy 138, 104977. doi: 10.1016/j.marpol.2022.104977
Stiles M. L., Stockbridge J., Lande M., and Hirshfield M. F. (2010). Impacts of bottom trawling (Washington DC: Oceana).
Streicher M. D., Reiss H., and Reiss K. (2021). Impact of aquaculture and agriculture nutrient sources on macroalgae in a bioassay study. Mar. pollut. Bull. 173, 113025. doi: 10.1016/j.marpolbul.2021.113025
Sumaila U. R., Ebrahim N., Schuhbauer A., Skerritt D., Li Y., Kim H. S., et al. (2019). Updated estimates and analysis of global fisheries subsidies. Mar. Policy 109, 103695. doi: 10.1016/j.marpol.2019.103695
Sumaila U. R., Khan A., Teh L., Watson R., Tyedmers P., and Pauly D. (2010). Subsidies to high seas bottom trawl fleets and the sustainability of deep-sea demersal fish stocks. Mar. Policy 34, 495–497. doi: 10.1016/j.marpol.2009.10.004
Sumaila U. R., Lam V., Le Manach F., Swartz W., and Pauly D. (2016). Global fisheries subsidies: An updated estimate. Mar. Policy 69, 189–193. doi: 10.1016/j.marpol.2015.12.026
Sumaila U. R., Skerritt D. J., Schuhbauer A., Villasante S., Cisneros-Montemayor A. M., Sinan H., et al. (2021). WTO must ban harmful fisheries subsidies. Science 374, 544–544. doi: 10.1126/science.abm1680
Sumaila U. R., Teh L., Watson R., Tyedmers P., and Pauly D. (2008). Fuel price increase, subsidies, overcapacity, and resource sustainability. ICES J. Mar. Sci. 65, 832–840. doi: 10.1093/icesjms/fsn070
Sumaila U., Zeng Z., Lam V., and Cheung W. (2022). A rich analysis of the economic, social and environmental effects of harmful fisheries at the ecosystem level (Vancouver, Canada: Institute for the Oceans and Fisheries, University of British Columbia Vancouver).
Teh L. C., Teh L. S., Abe K., Ishimura G., and Roman R. (2020). Small-scale fisheries in developed countries: looking beyond developing country narratives through Japan’s perspective. Mar. Policy 122, 104274. doi: 10.1016/j.marpol.2020.104274
Teh L. C., Ota Y., Cisneros-Montemayor A. M., Harrington L., and Swartz W. (2020). Are fishers poor? Getting to the bottom of marine fisheries income statistics. Fish Fisheries 21 (3), 471–482.
Teh L. S., Teh L. C., Giron-Nava A., and Sumaila U. R. (2024). Poverty line income and fisheries subsidies in developing country fishing communities. NPJ Ocean Sustainability 3, 14. doi: 10.1038/s44183-024-00049-7
Wang K., Reimer M. N., and Wilen J. E. (2023). Fisheries subsidies reform in China. Proc. Natl. Acad. Sci. 120, e2300688120. doi: 10.1073/pnas.2300688120
Woods J. S. and Verones F. (2019). Ecosystem damage from anthropogenic seabed disturbance: a life cycle impact assessment characterisation model. Sci. Total Environment. 649, 1481–1490.
World Bank. (2017). The sunken billions revisited: progress and challenges in global marine fisheries. (Washington, DC: World Bank. Environment and Sustainable Development series). doi: 10.1596/978-1-4648-0919-4
WTO, IMF, OECD, and Bank, W (2022). Subsidies, trade, and international cooperation. Available online at: https://www.wto.org/english/res_e/booksp_e/repintcoosub22_e.pdf (Accessed June 30, 2025).
Xuan Y., Manhong S., Huiming X., and Di W. (2020). The impact and mechanism of coastal urbanization on Marine pollution in China: Based on panel space measurement method. China Environ. Manage. 12, 95–102. doi: 10.16868/j.cnki.1674-6252.2020.06.095
Yuan B., Cui Y., An D., Jia Z., Ding W., Yang L., et al. (2023). Marine environmental pollution and offshore aquaculture structure: evidence from China. Front. Mar. Sci. 9, 979003.
Yuan B., Yue F., Wang X., and Xu H. (2021). The impact of pollution on China marine fishery culture: An econometric analysis of heterogeneous growth. Front. Mar. Sci. 8, 760539.
Zheng L., Liu Q., Liu J., Xiao J., and Xu G. (2022). Pollution control of industrial mariculture wastewater: a mini-review. Water 14, 1390. doi: 10.3390/w14091390
Keywords: fishery subsidies, marine environment, income distribution, inverted U shaped curve, marine fishing
Citation: Li Y, Pham Do KH, Shakur S and Sun X (2025) Can fishery subsidy improve fishermen’s income?——evidence from China’s coastal areas. Front. Mar. Sci. 12:1453132. doi: 10.3389/fmars.2025.1453132
Received: 22 June 2024; Accepted: 17 June 2025;
Published: 09 July 2025.
Edited by:
Jorge Paramo, University of Magdalena, ColombiaReviewed by:
Taner Yildiz, Istanbul University, TürkiyeSahar Fahmy Mehanna, National Institute of Oceanography and Fisheries (NIOF), Egypt
Copyright © 2025 Li, Pham Do, Shakur and Sun. This is an open-access article distributed under the terms of the Creative Commons Attribution License (CC BY). The use, distribution or reproduction in other forums is permitted, provided the original author(s) and the copyright owner(s) are credited and that the original publication in this journal is cited, in accordance with accepted academic practice. No use, distribution or reproduction is permitted which does not comply with these terms.
*Correspondence: Yujuan Li, eXVqdWFuMDIwNkBvdXRsb29rLmNvbQ==