Abstract
Stony coral tissue loss disease (SCTLD) has spread throughout Florida’s Coral Reef, causing extensive mortality of over 30 species of reef-building corals, and has rapidly spread to many other countries and territories throughout the Caribbean. Current treatments for SCTLD, including a proprietary paste mixed with the antibiotic amoxicillin, do not provide protection from future infections and may select for antibiotic-resistant pathogenic bacteria. In contrast, beneficial microorganisms (i.e., probiotics), may directly treat or act as prophylactics for corals exposed to SCTLD. This study investigated the use of the bacterium Pseudoalteromonas sp. McH1-7, previously isolated from a SCTLD-resistant fragment of Montastraea cavernosa, as a potential probiotic treatment for SCTLD-infected M. cavernosa colonies in the wild. We developed and tested two probiotic deployment methods: (1) the injection of a probiotic in seawater suspension into a weighted bag placed over the coral to treat the whole colony; and (2) a sodium alginate-based paste that was applied directly to each disease lesion. After treatment, the disease progression of each colony was routinely monitored using three-dimensional photogrammetry for 2.5 years. Slurries of tissue and mucus samples were taken from healthy and diseased colonies before treatment, two weeks after treatment, and three months after treatment to identify possible shifts in bacterial and archaeal communities. McH1–7 successfully slowed SCTLD lesion progression for 2.5 years following treatments when delivered using the whole-colony treatment technique. Our assessment of the microbiome following treatment showed that McH1–7 was effective without dominating bacterial communities among infected corals. In contrast, corals treated with the probiotic paste lost more tissue than corals treated with the control paste, indicating that the lesion-specific probiotic paste is not effective at stopping SCTLD. Probiotic inoculations via a whole-colony treatment technique may provide a path toward slowing the loss of reef-building corals due to SCTLD.
1 Introduction
Coral diseases have contributed to sweeping declines in coral cover and diversity across many regions in the past, compounding the many stressors coral reefs face today (Aronson and Precht, 2001; Miller et al., 2009; Walton et al., 2018; Alvarez-Filip et al., 2019). No known transmissible disease has contributed to mortality in more coral species than the outbreak of stony coral tissue loss disease (SCTLD). Unlike other coral diseases that are often more species-specific, SCTLD infects over 30 species of reef-building corals in the Atlantic (Kramer et al., 2019; Papke et al., 2024) and has led to functional extinction in some locations (Neely et al., 2021). Long-term monitoring of reef sites in Florida showed that susceptibility to SCTLD varies among species, with those in the families Meandrinidae and Faviidae experiencing the greatest losses (Walton et al., 2018; Sharp et al., 2020). Although the etiological agent(s) responsible for SCTLD remain unknown, bacteria are possible suspects as multiple classes of antibiotics have successfully halted disease progression (Aeby et al., 2019). Bacteria associated with SCTLD across multiple studies include members of the Peptostreptococcales (Clostridia), Rhodobacterales (Alphaproteobacteria), and Vibrionales (Gammaproteobacteria) (Meyer et al., 2019; Rosales et al., 2020; Ushijima et al., 2020), which could also be involved in secondary or co-infections (Ushijima et al., 2020). Infection is understood to spread via direct contact and/or through the water column (Aeby et al., 2019; Muller et al., 2020; Sharp et al., 2020; Meiling et al., 2021). Since the initial report of the disease in 2014 (Precht et al., 2016), SCTLD has spread rapidly throughout Florida’s Coral Reef and 30 other countries and territories of the Caribbean by October 2023 (Kramer et al., 2019).
Typical treatments for SCTLD include an amoxicillin antibiotic paste applied to kill bacteria at the disease lesion (Neely et al., 2020; Shilling et al., 2021; Walker et al., 2021). This antibiotic paste has shown to have a success rate up to 92%, depending on the coral species and metrics used to measure success (Neely et al., 2020; Shilling et al., 2021; Walker et al., 2021) and has therefore been utilized as a treatment in laboratory, aquaria, nursery, and coral reef settings (Neely et al., 2020). Since this treatment has been successful at halting SCTLD for thousands of corals throughout Florida, is relatively cost effective, and easily scalable, antibiotic paste has been utilized in various Caribbean countries and territories (Kramer et al., 2019; Forrester et al., 2022; Lee Hing et al., 2022). However, frequent retreatments are often necessary as antibiotics do not prevent future infections, increasing the time and effort needed to successfully treat disease (Neely et al., 2020; Walker et al., 2021). In addition, the impacts of utilizing antibiotics over large spatial scales are unknown with the risk of promoting antibiotic resistance among bacteria on treated corals and surrounding reef species. In this scenario, antibiotic-resistant pathogens may no longer respond to current antibiotic treatments, making the treatments ineffective.
In contrast to antibiotics, beneficial microorganisms (i.e., probiotics) could be used to treat or reduce the impacts of SCTLD by utilizing microbes from disease-resistant corals. The coral probiotic hypothesis suggests that the composition of coral microbial communities can shift in response to different environmental perturbations, which may result in increased resistance from environmental stressors and pathogens (Reshef et al., 2006). Beneficial microorganisms are hypothesized to benefit their host by producing antioxidants, antimicrobials, and/or vitamins to the coral (Krediet et al., 2013; Robbins et al., 2019). Probiotics have been used to mitigate the effects of bleaching, pollution, and disease by restoring the coral microbiome (Fragoso ados Santos et al., 2015; Rosado et al., 2019; Santoro et al., 2021; Silva et al., 2021; Zhang et al., 2021; Moradi et al., 2023; Ushijima et al., 2023). Probiotics may increase the proportion of beneficial microbes while decreasing groups that include known coral pathogens (e.g., Vibrio), all without altering the surrounding reef environment (Delgadillo-Ordoñez et al., 2024).
The previously identified probiotic Pseudoalteromonas sp. strain McH1–7 is predicted to produce at least four different antibacterial compounds including the korormicins (Ushijima et al., 2023) that are antibiotics against gram-negative bacteria (Yoshikawa et al., 1997). Consequently, McH1–7 can target a broad range of pathogenic species, which makes it a good probiotic candidate for a disease with no identified etiological agent. In culture-based bacterial inhibition assays, McH1–7 inhibited the growth of pathogenic bacteria associated with lesions of SCTLD. Further, McH1–7 arrested or slowed SCTLD progression on 62% of treated corals in aquaria relative to untreated controls and also shows promise as a prophylactic treatment, preventing SCTLD transmission among M. cavernosa fragments within a laboratory setting (Ushijima et al., 2023).
While probiotics offer a promising research and intervention direction for coral disease, there is little evidence of their success and feasibility for field applications. Therefore, this study aimed to investigate the potential for McH1–7 to treat SCTLD by conducting in situ experiments along Florida’s Coral Reef. The therapeutic capabilities of McH1–7 were tested on SCTLD-infected wild coral colonies over a 2.5-year monitoring period using two application methods: a probiotic paste applied directly to the active SCTLD lesion and a probiotic in seawater suspension injected into a bag surrounding the entire colony. The feasibility of field deployment and stability in various storage conditions were also tested to demonstrate the practical utility of McH1–7 probiotic treatments on a coral reef.
2 Materials and methods
2.1 Preparation of McH1–7 for in situ application
Pseudoalteromonas sp. strain McH1–7 cryostocks were maintained at -80°C and preserved in a 20% glycerol (final concentration) solution made with 0.22 µM filtered seawater (FSW) and sterilized by autoclaving before use. Cultures were revived by streaking onto sterile seawater agar (SWA) consisting of 2 g/L yeast extract, 15 g/L of agar, and 4 g/L tryptone mixed with 1 L of FSW (Ushijima et al., 2023), and then incubated at 28°C overnight. Two to three resulting colonies were inoculated into glycerol supplemented seawater broth (GSWB) consisting of 2 g/L yeast extract, 2 mL/L sterile glycerol, and 4 g/L tryptone mixed with 1 L of FSW (Ushijima et al., 2023) and incubated at 28°C while shaking at 150 rpm for approximately 15 h. These cultures were then diluted by a factor of 100 in fresh GSWB and incubated at 28°C while shaking at 150–200 rpm. The cultures were grown until reaching an optical density of 1.5–2.0, measured at 600 nm (OD600nm), representing 1.55 x 10¹⁰ colony-forming units (CFUs) per mL according to plate counts. One-liter aliquots were centrifuged at 8,000 × g for 10 min and the resulting supernatant was decanted. For whole-colony bagging treatments, each pellet was resuspended with 250 mL of previously autoclaved FSW and then divided equally into five 60 mL Luer-Lock syringes, with 50 mL (~3.1 x 10¹² McH1–7 CFUs) in each syringe. A 10 mL sized air bubble was added to each syringe for oxygenation and mixing before capping for transportation.
A paste was created as a vehicle for the lesion-specific treatment of SCTLD consisting of 187.5 g polyvinylpyrrolidone (CAS number 9003-39-8), 11.25 g sodium alginate, 11.25 g sodium chloride, and 375 mL reverse osmosis (RO) water. The sodium alginate allows for the polymerization, or thickening, of the paste when in contact with divalent ions such as Ca2+ or Mg2+ in seawater. The sodium chloride was added to control salinity and avoid osmotic shock of the marine bacteria. The polyvinylpyrrolidone was used to further thicken the paste. All dry ingredients were mixed before adding the RO water. Once added, a hand mixer was immediately used to combine. A pellet of McH1–7 from one liter culture broth (above) was mixed with 15 mL of a sterile 3% NaCl solution made with RO water (used instead of FSW to prevent premature polymerization) before being folded into 600 g of paste with sterile tongue depressors until evenly mixed. The paste was loaded into the back of 60 mL catheter syringes using a silicone piping bag, typically used for icing cakes. Each of the resulting syringes contained ~2.6 x 10¹⁰ CFUs of McH1–7 per g of paste. To allow for a wider band of the paste to be released underwater along the coral disease lesion, the tips of the syringes were cut off leaving 1 cm of the tip remaining before capping for transportation to the reef site.
2.2 McH1–7 viability
Assessing the survival of McH1–7 during transportation to in situ sites is crucial to ensure probiotic treatments are viable for application. Therefore, one liter of McH1–7 culture in GSWB with an OD600nm between 1.5–2 was pelleted and resuspended in 250 mL of FSW. Conical tubes were filled with 50 mL of this bacterial suspension, leaving room for an air bubble, just as the syringes for the field were created. The tubes were capped and stored at 4 or 22°C and sampled at 2, 7, 14, 21, 28, 42, and 56 days (n=3 per temperature and timepoint). Samples were taken from three separate conical tubes at each time point, then serially diluted 10-fold (to 1:108) in FSW before dilutions were spotted on SWA. For each dilution, 10 µL was spotted in 3 technical replicates onto the same SWA plate per conical tube replicate. Serial dilution plates for each time point were incubated for 24 hours at 28°C before colony counts were done and colony forming units (CFUs) per mL were calculated. An additional experiment was conducted using the same methodology to determine the viability of McH1–7 at five different temperatures to evaluate if this strain could survive being frozen (-20°C), refrigerated (4°C), on the countertop in an air-conditioned room (22 ± 4°C), and stable incubation (22°C and 28°C). CFU counts were taken initially, and after 1, 2, 3, and 5 days, the time it would typically take to prepare and distribute the probiotic along a coral reef.
To assess the viability of McH1–7 cultures, the CFUs per mL values were calculated from 10-fold serial dilutions that were spotted onto SWA using the equation:
where is the number of colonies per spot, is the dilution factor, and is the volume spotted in mL. For this experiment, 10 µL (0.01 mL) aliquots were spotted (“volume spotted”) from each dilution, and the colonies per spot were counted (“colonies per spot”). To determine which dilution would be used for the CFU/mL calculation, the standard practice of using only spots from a dilution with easily resolved colonies, containing >5 colonies per spot, and from the least diluted sample (i.e., the lowest dilution) was utilized. The average CFU/mL was determined from at least 3 technical replicates per biological replicate from plates incubated no longer than 24 h.
To analyze the viability of McH1–7 at different temperatures, the average of three technical replicates per sample was used to determine the number of bacteria present within each sample. A repeated measures analysis of variance (ANOVA) followed by Šídák’s multiple comparisons test were performed using GraphPad Prism (version 9.5.1 (733) for Windows, GraphPad Software, San Diego, CA, USA, www.graphpad.com).
2.3 Safety testing of McH1-7
While Pseudoalteromonas sp. McH1–7 was effective at treating SCTLD infected M. cavernosa colonies in aquaria (Ushijima et al., 2023), the reaction of other Caribbean coral species to this strain remained unknown. Therefore, five other Caribbean species, including Colpophyllia natans (n=1), Stephanocoenia intersepta (n=2), Meandrina meandrites (n=2), Siderastrea siderea (n=2), and Orbicella faveolata (n=2), were treated and monitored for their response to ensure no adverse reactions occurred before using McH1–7 in situ. To do so, healthy coral colonies were collected from the field (Supplementary Table S1), transported to the Smithsonian Marine Station in Fort Pierce, FL, held in buckets with 13 L of oxygenated FSW, and trimmed to approximately the same size (3–5 cm) with a masonry saw (Husqvarna MS 360) within 24 h of collection. The corals were held in large recirculating systems indoors until they were utilized for safety testing. For experimentation, each fragment was placed in individual 5 L tanks on top of egg-crate grating with aeration as previously described in Ushijima et al. (2023).
Experimental fragments were inoculated with McH1–7 according to Ushijima et al. (2023). Briefly, GSWB liquid cultures were grown to an OD600nm of 1.0, which correlates to approximately 109 CFUs per mL according to plate counts. Then, 50 mL aliquots of each strain were centrifuged and decanted, leaving the pelleted bacteria for treatment. The bacterial cells were resuspended with 1 mL of seawater from the tank receiving the treatment and then the solution was pipetted over the fragment with the aeration turned off for the following 2 h. The final concentration of the strain was approximately 107 CFU per mL of tank water. Starting 24 h after inoculation, ~50% water changes were conducted tri-weekly with sterilized scoops. The visible health status of the corals was monitored daily over 21 days while photographing from a top-down view every other day to look for discoloration, bleaching, or tissue loss.
2.4 Study site and in situ treatment application
On September 1, 2020, a research site off the coast of Fort Lauderdale, Florida (26°9’2.358”N, 80°5’45.031”W) spanning 100 m of longitude and 40 m of latitude was established in an area of regional SCTLD prevalence (Toth et al., 2024) at a depth of ~9 m of shallow colonized pavement. Forty adult M. cavernosa colonies displaying signs of active SCTLD were tagged and mapped (Figure 1). The establishment of such a small study area reduced the likelihood that variation in colony responses to treatments would be considerably confounded by environmental variation. Tagged colonies were haphazardly divided into five treatment groups: (1) probiotic bag (PB), (2) control bag (CB), (3) probiotic paste (PP), (4) control paste (CP), and (5) background control (BC).
Figure 1
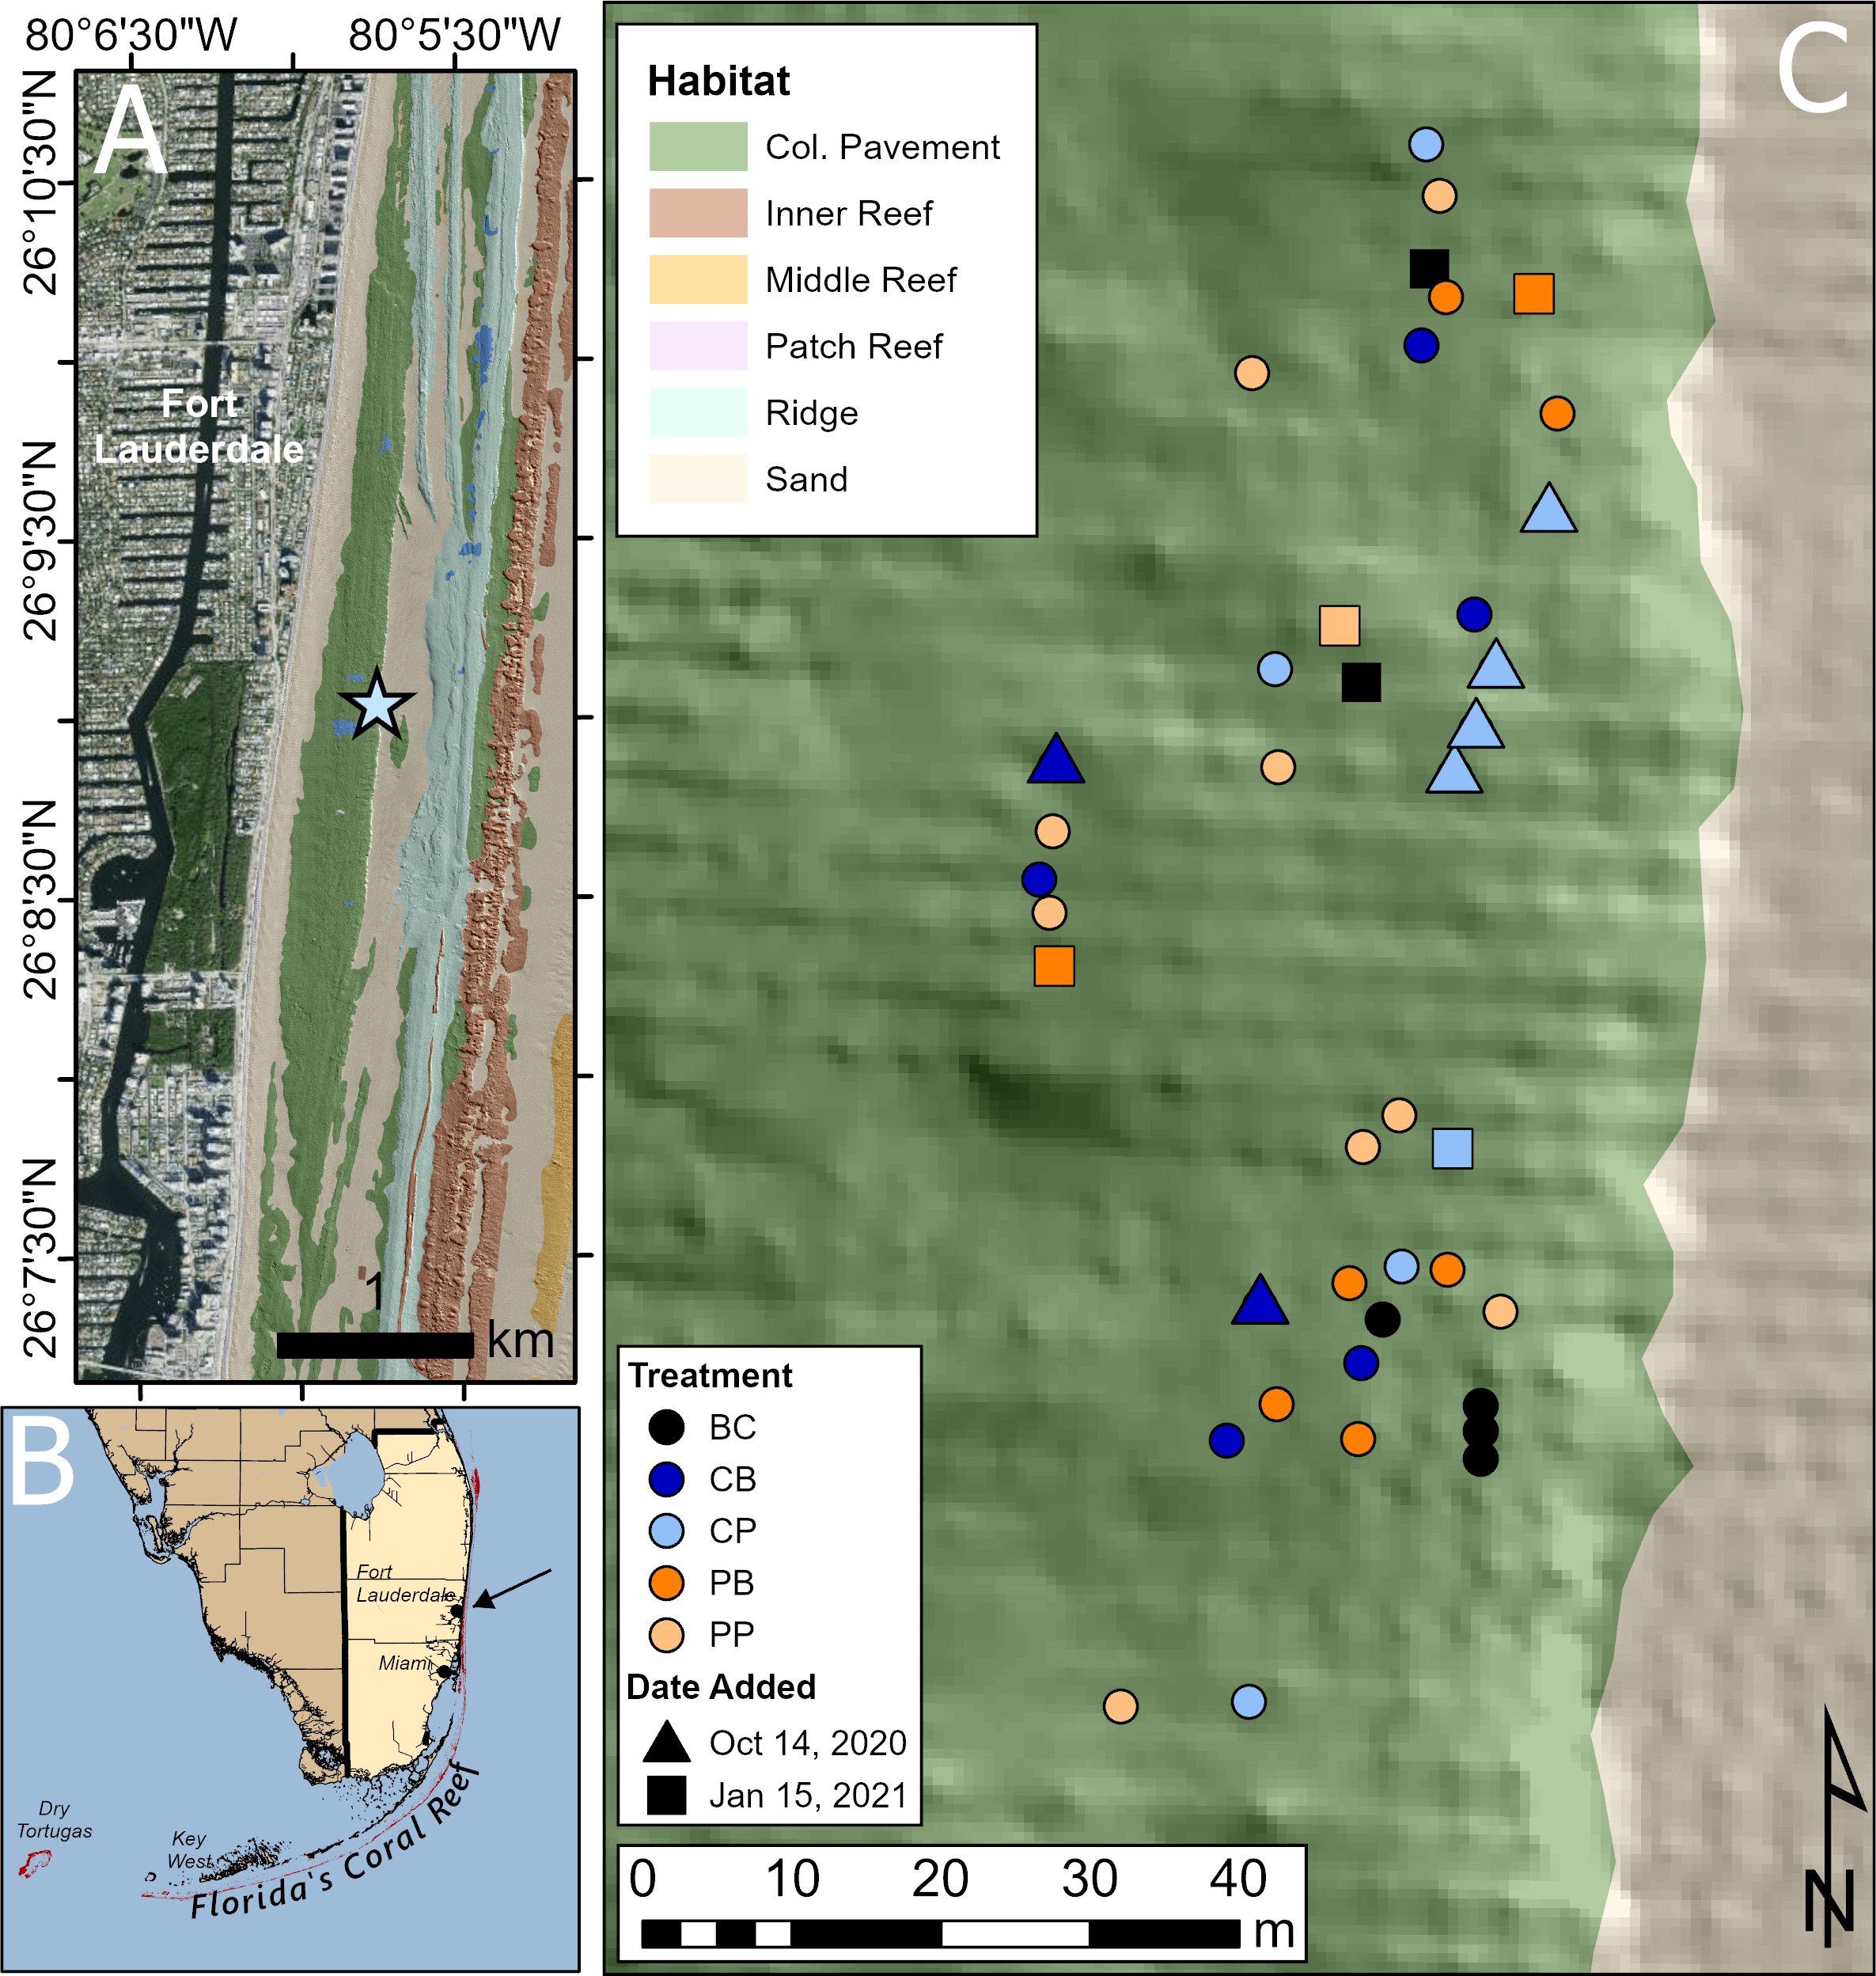
Site map of in situ probiotic applications. (A) The research site (star) off the coast of Fort Lauderdale, Florida with colonized pavement topography explained by Walker et al. (2008). (B) This site (indicated by black arrow) is located off southeast Florida, US. (C) The spatial distribution of Montastraea cavernosa colonies at this site, with different colored circles indicating each treatment. Treatment: BC, background control, black; CB, control bag, dark blue; CP, control paste, light blue; PB, probiotic bag, dark orange; PP, probiotic paste, light orange. Infected coral colonies denoted with a circle were tagged and added to the site at the beginning of experimentation, Sep. 1, 2020. These corals received three treatment applications. Triangles represent newly found diseased corals that were tagged and added to the site on the second treatment date, Oct. 14, 2020. These corals received two of the three total treatment applications. Squares represent newly found diseased corals that were tagged and added to the site on the third treatment date, Jan. 15, 2021. These corals received one of the three treatment applications.
The probiotic bag treatment was conducted by covering the whole colony with a 378.5 L volume plastic bag with a weighted line along the bottom to trap ocean water within. The bag was cinched at the top to allow approximately 8 cm of space between the inside of the bag and the surface of the colony. Aquarium tubing was then used to syringe 50 mL of a McH1–7 suspension (~3.1 x 10¹² CFUs) into the bag (Figures 2A, B). The aim was to achieve a minimum concentration of 107 CFU/mL seawater, which is the concentration that was used in previous aquarium studies (Ushijima et al., 2023). Final concentrations varied depending on the size of the corals and amount of seawater in the bags, but dosages of 107-108 CFU/mL should have been achieved. A locking mechanism between the syringe and the tubing allowed the diver to lock and remove the tubing from the syringe after delivering the probiotic treatment to ensure McH1–7 was not released outside of the bag. The syringe was refilled with 50 mL of ocean water, reattached to the tubing, the locking mechanism was unlocked, and the ocean water was pushed through the tube to clear the bacterial culture from the tube into the bag (Figure 2C). The bag was left for 2 h before carefully removing it from the colony. The control bag treatment was the same as the probiotic bag treatment except the syringe was only filled with ocean water.
Figure 2
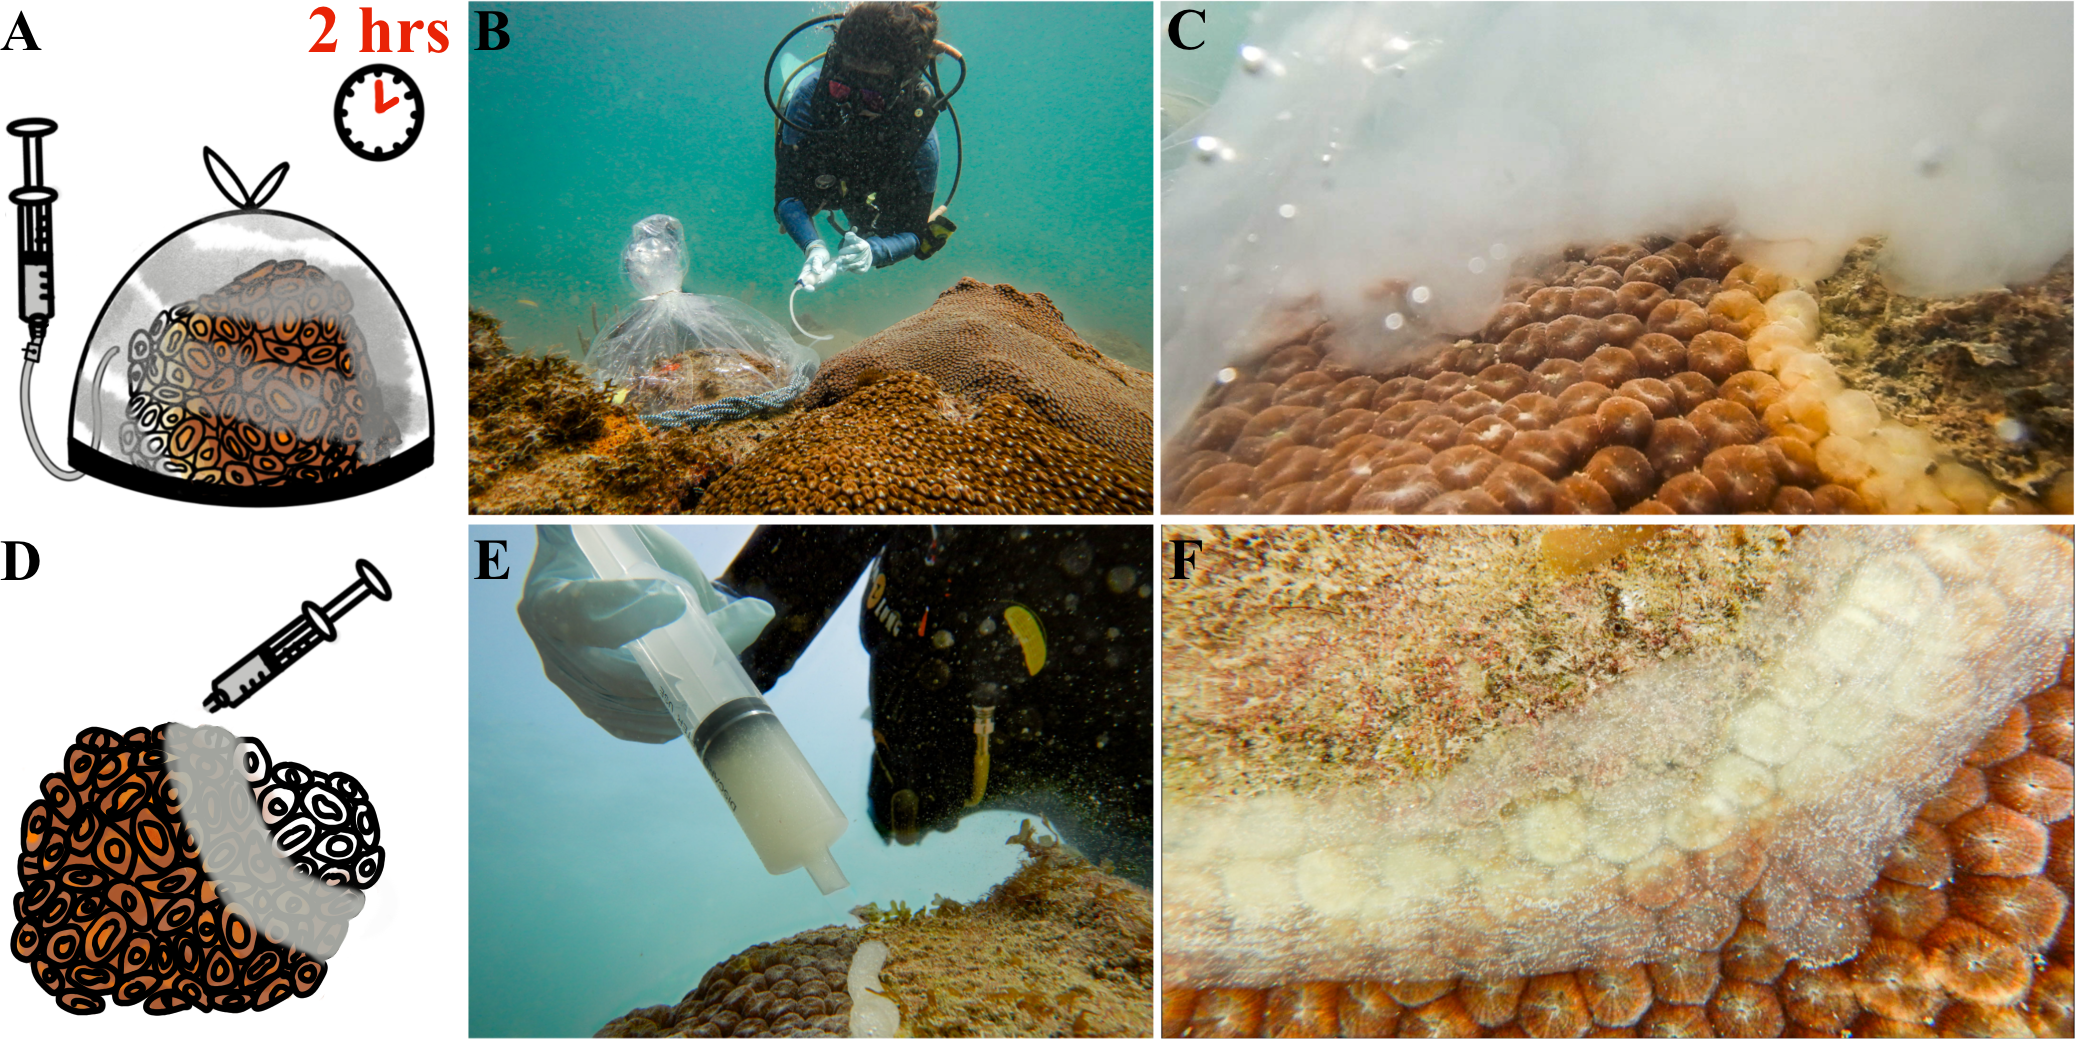
Probiotic treatment of Montastraea cavernosa colonies using two methods, a whole-colony bagging or lesion-specific paste technique. (A) The whole-colony bagging technique involves covering an infected coral with a weighted plastic bag, syringing the probiotic McH1–7 into the bag, and waiting two hours before removing the plastic bag. (B) A diver treating an infected M. cavernosa colony with the whole-colony bagging technique along a coral reef. (C) A cloud of McH1–7 bacteria under the bag, slowly dispersing across the whole coral colony. (D) The lesion-specific paste treatment with McH1–7 involves syringing a sodium alginate-based paste over the active lesion and smoothing it down across apparently infected tissue along the lesion. (E) A diver applying the paste to a diseased colony along the reef. (F) The paste is then smoothed flat with a gloved hand across the active lesion.
The probiotic paste treatment included applying paste filled with McH1–7 directly to the lesion with a 60 mL syringe (Figures 2D, E). A 2 cm wide band of paste was then flattened with a gloved hand along the whole lesion. Bleached or paling tissue around the lesion was also covered in probiotic paste (Figure 2F). The amount of paste used per coral varied with the size of the lesion. Small lesions required much less than one syringe of paste, whereas larger lesions may have used a full syringe or more. The control paste treatment consisted of flattening paste with no added McH1–7 over the disease lesion in the same manner. Finally, background control colonies, all infected with SCTLD, were not treated or handled and were only monitored over time to serve as a baseline for the disease progression at the site.
Nine diseased M. cavernosa colonies were treated with PP, six with PB, four with CP, five with CB, and four were untreated BC on September 1, 2020 (day 0). On October 14, 2020 (day 43), six additional corals were found with SCTLD: two of these colonies were treated with CB and four were treated with CP. All other previously treated colonies were also re-treated with their respective treatments at this time. All colonies were re-treated with their respective treatments again on January 15, 2021 (day 136). Six newly infected colonies were added to the site and treated for the first time that day: one with CP, one with PP, two with PB, and two were BC. The final treatment of 40 corals included eight PB, ten PP, seven CB, and nine CP treated corals, and six BC untreated corals (Table 1). M. cavernosa newly showing signs of SCTLD were added during the first few months of the experiment to increase replication and keep sample sizes similar among treatments. Relative to the duration of the experiment (2.5 years), all colonies were added in the first 4.5 months of the experiment allowing ample time to observe the outcome of the treatment effects.
Table 1
| Date | Day of experiment | Number of infected corals added to the site | Total number of infected colonies treated | Colonies not photographed | All corals sampled for microbiome analysis |
|---|---|---|---|---|---|
| August 19, 2020 | 13 days pre-treatment | 6 PB, 9 PP, 5 CB, 4 CP, 4 BC | All | Yes | |
| September 1, 2020 | 0 | 6 PB, 9 PP, 5 CB, 4 CP, 4 BC | |||
| September 14, 2020 | 13 | 1 PP | |||
| September 29, 2020 | 28 | 1 PP | |||
| October 14, 2020 | 43 | 2 CB, 4 CP | 6 PB, 9 PP, 7 CB, 8 CP, 4 BC | 1 PP, 1 CB | |
| October 30, 2020 | 59 | 1 PP | Yes | ||
| January 15 2021 | 136 | 2 PB, 1 PP, 1 CP, 2 BC | 8 PB, 10 PP, 7 CB, 9 CP, 6 BC | Yes | |
| February 25, 2021 | 177 | ||||
| May 11, 2021 | 252 | 1 PB, 2 PP, 1 BC | |||
| July 23, 2021 | 325 | 1 CP | |||
| March 29, 2022 | 574 | 1 PB | |||
| July 29, 2022 | 696 | 2 PB, 1 PP | |||
| August 24, 2022 | 722 | 1 PB, 1 PP, 1 CB | |||
| October 20, 2022 | 779 | 1 PP, 1 BC | |||
| March 14, 2023 | 924 | 1 CB |
Timeline of events occurring at in situ research site.
All infected colonies added to the site on Aug. 19, 2020 were treated three times total. The six newly infected colonies that were added on Oct. 14, 2020 were treated twice. The additional six newly infected colonies added to the site on Jan. 15, 2021 were treated once. Treatment codes include PB, probiotic bag; PP, probiotic paste; CB, control bag; CP, control paste; BC, background control.
Colonies were photographed each date except as noted.
Each colony was imaged using a Nikon COOLPIX W300 by setting the camera on slow continuous mode taking a photo every second and then slowly circling each colony from approximately 1 meter distance. Once the coral was circled, the photographer swam and photographed over the top of the coral to ensure all sides had been captured. Lastly, while still in slow continuous mode, the photographer swam towards each lesion to approximately 30 cm distance to capture fine detail. Colonies were monitored and photographed 14 times within 2.5 years. A few colonies were not photographed on some monitoring dates due to difficulties relocating them (Table 1).
2.5 Three-Dimensional modeling
Three-dimensional (3D) models of each M. cavernosa colony (Figure 3) were generated using the proprietary software Agisoft Metashape Professional version 1.8.4 (Agisoft LLC) on desktop (Dell Precision 5820, Intel® Xeon® W-2225 central-processing unit @ 4.10 GHz, 32 GB of random-access memory, and an Advanced Micro Devices Radeon Pro W5500 graphics-processing unit) largely following the methods outlined in Meiling et al. (2020). Photos of each colony from each imaging date (e.g., Figure 3A) were imported into Agisoft Metashape Professional and aligned to create a sparse-point cloud of each colony (Figure 3B). Briefly, camera alignment was achieved by using a suite of computer vision, outlier detection, and minimization algorithms to detect identical features in overlapping images (Harris and Stephens, 1988; Lowe, 1999), which are triangulated into 3D coordinates and then used to estimate (Fischler and Bolles, 1981; Haralick et al., 1994; Nistér, 2004) and refine (Levenberg, 1944; Marquardt, 1963) the position and orientation of each camera (Mouragnon et al., 2006). Then, image-depth mapping (Geiger et al., 2011) of the sparse-point cloud created a mesh (Figure 3C) that was texturized from the red-, green-, and blue-channel values from the source imagery (Figure 3D). The mesh face count (i.e., resolution) was set to zero to disable decimation, thereby maximizing the accuracy and precision of the downstream surface area measurements. The mesh vertices color is redundant with the image texture and was therefore disabled to reduce processing time and file size.
Figure 3
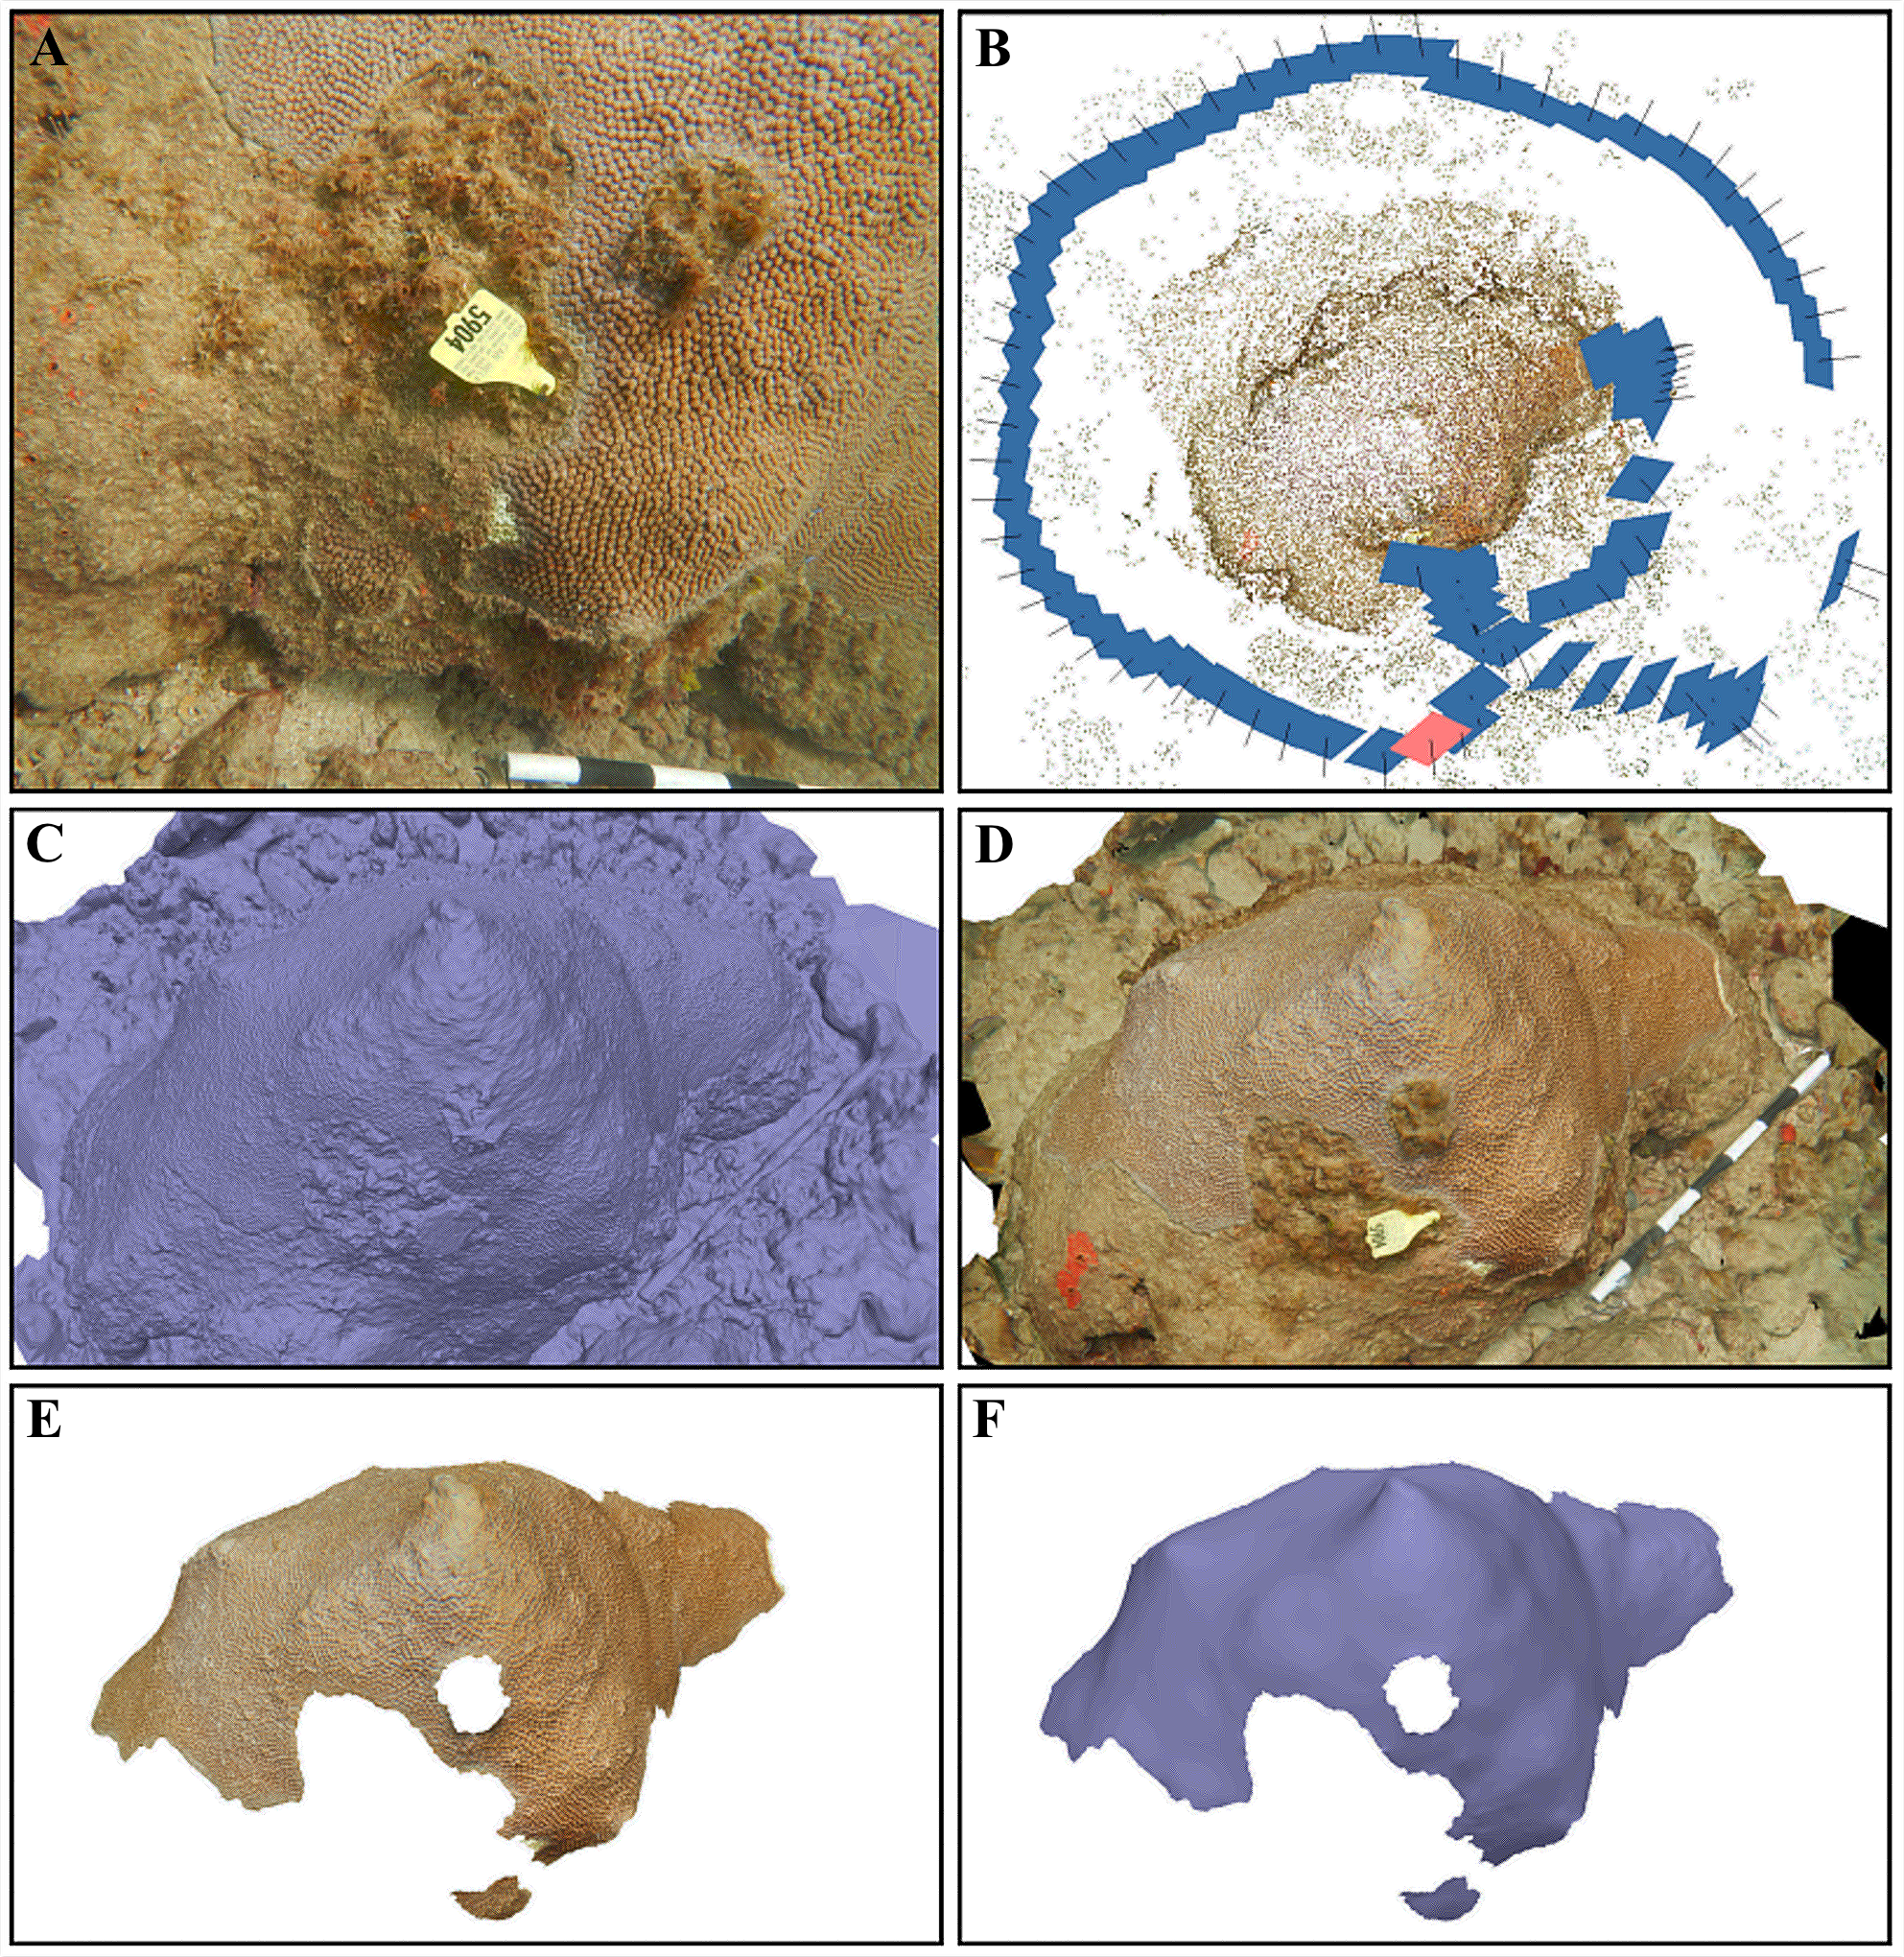
The six notable stages of our three-dimensional modeling process. (A) An example of one of the 87 overlapping images that were captured of a Montastraea cavernosa colony in the probiotic bag treatment group. (B) The sparse-point cloud with the estimated position (blue rectangles) and orientation (black projection lines) of all 87 photographs from the camera-alignment process, where the pink rectangle indicates the camera position that captured the image in (A). (C) The mesh, which was produced by image-depth mapping of the sparse-point cloud, without texture and (D) with texture from the source imagery. (E) The textured mesh that was manually traced to isolate the total tissue surface area and then (F) smoothed to remove fine scale detail that inherently varies between monitoring dates, with the texture toggled off to illustrate changes relative to (C). Each white or black segment on the scale bar in (A, D) is 10 cm.
The texturized models for each colony were scaled using a scale bar and manually aligned to each other in 3D space to easily visualize the extent of disease progression through time (Supplementary Figure S1). Separate meshes representing the total tissue area (i.e., any living tissue present on the colonies, including healthy, pale, or bleached tissue, Figure 3E) and the total skeletal area (i.e., healthy, bleached, and pale tissue, as well as exposed skeleton) were prepared for each colony by duplicating the original mesh and removing the appropriate background mesh depending on the measurement type. Next, each mesh was smoothed to eliminate fine tissue surface details while preserving the underlying skeletal surface topography (Figure 3F). High detailed models required a higher smoothing factor (e.g., ~5000, where allowed values range from 0 to 9999) to eliminate fine scale detail, whereas low detailed models required a lower smoothing factor (e.g., ~500). This step was important to maximize the downstream measurement precision because varying physical conditions (e.g., light, turbidity, wave action), imaging behavior (e.g., swimming speed, camera steadiness), and polyp extension between imaging dates influence the degree of fine surface detail that can be captured by the source imagery and subsequently generated in the mesh. Lastly, 3D surface area measurements of each smoothed mesh were obtained by using the automated mesh measurement tool.
The initial total tissue area of in situ M. cavernosa colonies greatly varied from 5.0 to 6045.7 cm2 so differences in initial sizes among treatments were analyzed with a one-way ANOVA using GraphPad Prism. To account for the difference in sizes among colonies, treatment success was expressed as the proportional change in total tissue area (the total tissue surface area (cm2) of each individual at each time point t > 0 divided by its initial total tissue surface area at time t = 0). A generalized linear mixed effects model to this response was fit to a normal distribution using glmmTMB (Brooks et al., 2017). Maximum likelihood estimation is robust to uneven replication among groups. The following fixed effects were included: the experimental treatment (PB, PP, CB, CP, and BC); the log10-transformed cumulative days since treatment; the log10-transformed initial (t = 0) total tissue area of the colony; and an index of initial condition (proportion of initial total tissue area over the total skeletal area). Additionally, a treatment-by-cumulative days interaction term was modeled to test whether the effect of the treatments varied over the course of the experiment. For the random effect, an observation-level effect of colony was fit, and both the intercept and the slope were allowed to vary over time, as individual colonies varied in their disease-progression trajectories. This random effect should further account for any differences in trajectories of colonies over time depending on how many days had passed since they were treated. Several post-hoc contrasts were conducted: between the paste and bag treatments and their respective controls, and between the two treatment controls and the background control, as implemented in the emmeans R package (Lenth, 2023). An updated model was fit with a fifth covariate, the number of treatments, to test whether the results were affected by how many applications of the treatment each colony received. This covariate was not statistically significant (p = 0.356) and its inclusion did not appreciably increase the likelihood of the model (ΔAIC = 1.159). Further, it did not alter our original inferences, and so we have presented the model lacking this term in the main text. All models were fit in R version 3.4.0 (R_Core_Team, 2024) and evaluated using the DHARMa package (Hartig, 2022). Pseudo-R2 values were computed using the piecewiseSEM package (Lefcheck, 2016). All code and data that are necessary to reproduce analyses can be accessed from online platform Figshare (see Data Availability).
2.6 Microbiome characterization
Slurries of surface mucus and tissue of tagged corals were collected with sterile needle-less syringes for microbiome characterization at three time points (Table 1): 1) on August 19, 2020, which was 13 days before treatment; 2) on October 30, 2020 or day 59, which was 16 days after the second probiotic treatment; and 3) on January 15, 2021 or day 136 which was 93 days after the second probiotic treatment and immediately before the third treatment was applied. Diseased colonies were sampled at apparently healthy tissue (HD) and diseased lesion tissue (DD). Nearby healthy colonies (HH) were completely covered in apparently healthy tissue suggesting they had not been previously infected with SCTLD. Mucus+tissue slurries were frozen at -20°C and shipped on dry ice to the University of Florida for analysis. Samples were thawed and excess seawater was decanted from mucus+tissue slurries after microcentrifugation. Deoxyribonucleic acid (DNA) was extracted from mucus+tissue slurries according to the manufacturer’s instructions with a Qiagen DNeasy PowerSoil extraction kit. Two process control blanks were prepared with the same kits and reagents as field samples, from DNA extraction to amplicon sequencing, without the addition of biomass. The V4 hypervariable region of bacterial and archaeal 16S ribosomal ribonucleic acid (RNA) genes was amplified with the Earth Microbiome Protocol (Caporaso et al., 2012; Parada et al., 2016) using the 515F (Parada et al., 2016) and 806R (Apprill et al., 2015) primers, as previously described (Ushijima et al., 2023). Barcoded amplicon libraries were sequenced at the University of Florida Interdisciplinary Center for Biotechnology Research NextGen DNA Sequencing Core Facility (RRID: SCR_019152) on an Illumina MiSeq with the 2 x 150 base pair (bp) v. 2 cycle format. Raw sequencing reads were deposited in the National Center for Biotechnology Information’s Sequence Read Archive under BioProject PRJNA1143377.
For the microbiome analysis, primers and Illumina adaptors were removed with cutadapt v 3.4 (Martin, 2011) and all downstream analyses were conducted with R v. 4.4.0 in RStudio v. 2024.04.1 + 748 (R_Core_Team, 2024). Briefly, sequencing reads with primers and Illumina adaptors removed were used for quality-filtering, merging of reads, chimera removal, and selection of amplicon sequence variants (ASVs) within each sequencing run using dada2 v. 1.32.0 (Callahan et al., 2016). ASV tables from multiple sequencing runs were merged and taxonomy was assigned with the SILVA small subunit ribosomal RNA database v. 138.1 (Yilmaz et al., 2013). Low abundance ASVs with a mean read count across all samples of less than five were removed from the analysis. Zero counts of sequencing reads were replaced using the count zero multiplicative method with the zCompositions package in R (Palarea-Albaladejo and Martín-Fernández, 2015). Zero-replaced read count data was transformed by centered-log-ratio (CLR) and the Aitchison distance of CLR-transformed data was determined with CoDaSeq v.0.99.7 (Gloor et al., 2017). Analysis of alpha and beta diversity were conducted with functions in phyloseq v. 1.48.0 (McMurdie and Holmes, 2013) and vegan v. 2.6-6 (Dixon, 2003). A Shapiro test was used to determine the normality of alpha diversity measures, and statistical differences in alpha diversity measures were determined by 2-way ANOVA on ranked data. A permutational analysis of variation (PERMANOVA) was conducted with the adonis function in vegan on the Aitchison distance of CLR-transformed data with 999 permutations. A pairwise PERMANOVA was conducted with the R package pairwiseAdonis v. 0.4 (Martinez Arbizu, 2020). Dispersion of the Aitchison distance was calculated with the betadisper function in vegan and fitted to a linear model to test the significance. The differential abundance of taxa by treatment was determined with corncob v. 0.4.1 (Martin et al., 2020). Plots were generated with ggplot2 (Wickham, 2016) and ggbreak (Xu et al., 2021). The full reproducible R script can be accessed from online platform GitHub (see Data Availability).
Droplet digital polymerase chain reaction (ddPCR) was used to quantify gene copies of two biomarkers: one for McH1–7 and one for the putative coral pathogen Vibrio coralliilyticus. The McH1–7 biomarker was a 398-bp section of the Kor23 gene in the korormicin biosynthetic gene cluster (see Data Availability), amplified with primers designated KOR F (5’- ACGTTACCCGCTATCTGTGG-3’) and KOR R (5’- CGCTTTCCTAAAGCACTTGG-3’) (Ushijima et al., 2023). The V. coralliilyticus biomarker, a 197-bp portion of the vibriolysin-like metalloprotease gene (vcpA) (see Data Availability) was amplified with the vibriolysin F primer (5′- GGCGAACCAACTTTACTGGA-3′) and vibriolysin R primer (5′- GGTCAGTCACTGGCGTACCT-3′) (Ushijima et al., 2020). Extracted DNA and primers were sent to the University of Florida Interdisciplinary Center for Biotechnology Research Gene Expression and Genotyping Core (RRID: SCR_019145) for droplet formation, amplification with EvaGreen master mix, and analysis with the BioRad QX200 Droplet Digital PCR system. Both reactions were performed in triplicate with an annealing temperature of 60°C and 2 ng of input DNA per reaction. Negative controls with no added template were also amplified with each assay. Gene copies per ng of DNA were calculated as an average from the triplicate reactions. One-way ANOVA analyses with TukeyHSD post-hoc tests were used to detect significant differences in biomarker gene copies by treatment type, sample month, or health state using R v. 4.4.0 in RStudio v. 2024.04.1 + 748 (R_Core_Team, 2024). The R scripts are also available on GitHub (see Data Availability).
3 Results
3.1 Probiotic treatment development
The survival of McH1–7 under two different temperature conditions, 4°C and 22°C, was investigated over a 56-day period to simulate transportation (Figure 4A). Time (repeated measures ANOVA, p< 0.0001), but not temperature (p = 0.165), had a significant impact on McH1–7 viability (as CFU/mL). The viability at day 7 (Šídák’s Multiple Comparisons test, all comparisons p< 0.0001) and day 14 (all comparisons p< 0.0001) was significantly higher than all later days. Although not significant, a general trend showed treatments incubated at 4°C had the greatest potential for optimal viability conditions, only dropping by one log unit over the first 14 days compared to a 3-log reduction at 22°C. Both time (repeated measures ANOVA, p = 0.061) and temperature (p = 0.115) did not significantly impact McH1–7 viability over five days at five different temperatures (Figure 4B).
Figure 4
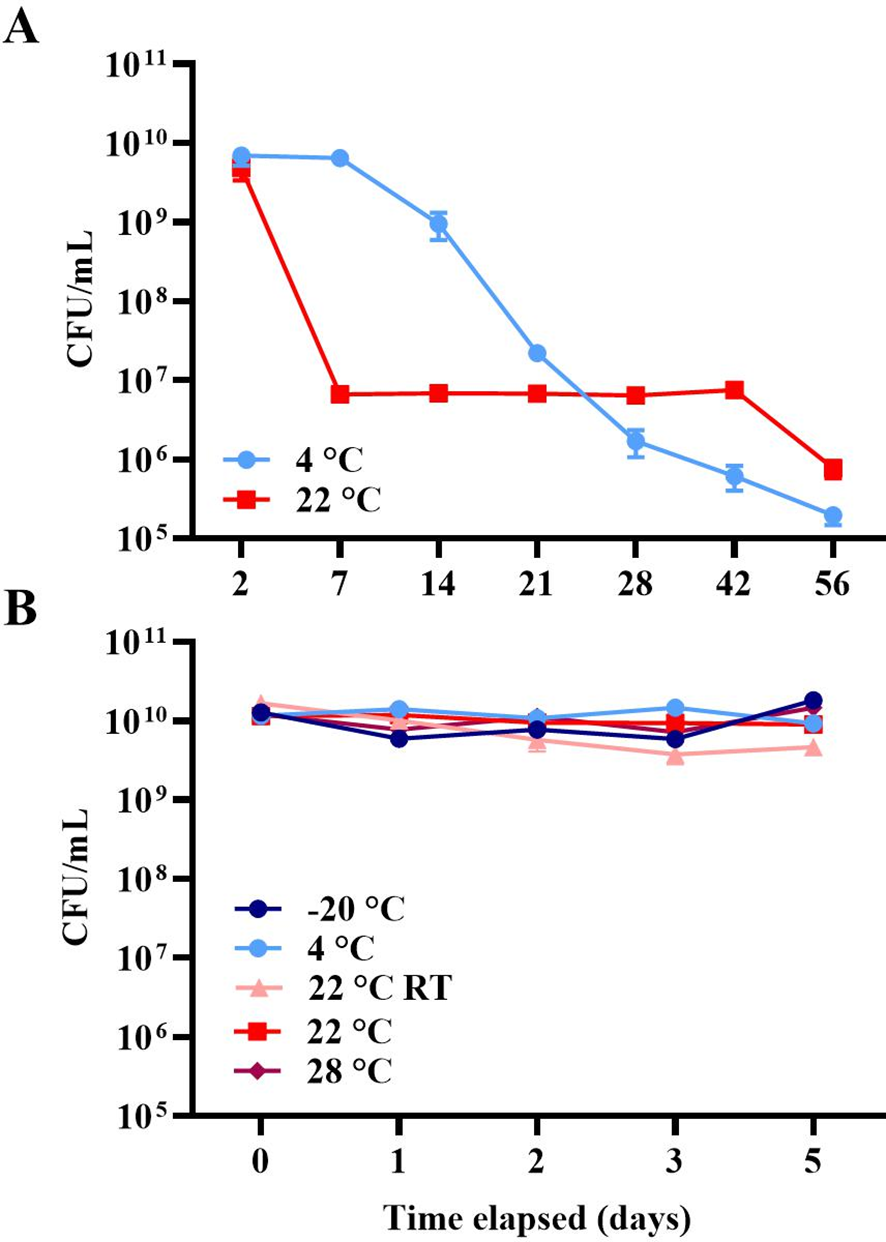
(A) Viability (as mean log CFUs per milliliter (± 1 SEM), n = 3) of McH1–7 at 4°C (light blue) or 22°C (red) over 56 days. (B) Viability (as mean log CFUs per milliliter (± 1 SEM), n = 3) of McH1–7 incubated at -20°C (navy), 4°C (light blue), 22°C (red), and 28°C (maroon) as well as at 22 ± 4°C room temperature (RT, pink) over 5 days.
Before bringing McH1–7 into the ocean to treat M. cavernosa, it was important to investigate if this strain may cause adverse reactions in other Caribbean coral species. Therefore, five coral species (Supplementary Table S1) that are known to be susceptible to SCTLD (Sharp et al., 2020) were inoculated with McH1–7 and their reaction was monitored over 21 days. All ten fragments showed 100% healthy appearing tissue remaining (Supplementary Figure S2), suggesting that McH1–7 does not elicit a visible negative reaction on these fragments of these species.
3.2 In situ treatment with McH1-7
Although highly variable, the initial total tissue area of in situ M. cavernosa colonies was not significantly different among treatments (Figure 5; one-way ANOVA, p = 0.428). All colonies experienced a non-linear loss of the proportion of total tissue area remaining over time (Figure 6A). The severity of these losses varied depending on the experimental treatment (analysis of deviance from generalized linear mixed effects model, treatment-x-time interaction, p = 0.006; Table 2). However, neither initial condition (p = 0.680, Table 2) nor initial total tissue area (p = 0.255, Table 2) significantly influenced the response. Further investigation of the proportion of tissue area remaining, derived from the generalized linear mixed effects model controlling for covariates, revealed that the probiotic bag treated colonies exhibited a lesser decline in this proportion than the other treatments (Figure 7). In total, the model explained 38.2% of the deviance in the proportion of total tissue area remaining based on the fixed effects alone, increasing to 90.1% when including the random effect of colony.
Figure 5
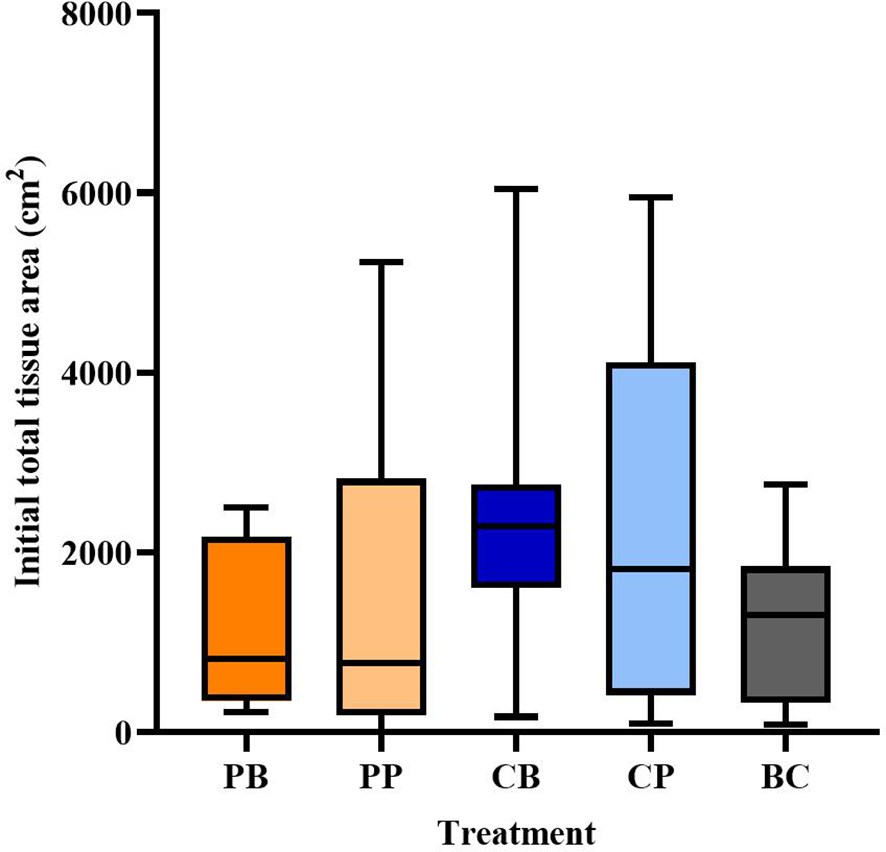
Total tissue area (cm2) of Montastraea cavernosa colonies by treatment when they were first added to the experiment. Boxplot shows the median (horizontal line) and 1st and 3rd quartiles. Whiskers represent minimum to maximum. Treatment codes include probiotic bag (PB, n = 8), probiotic paste (PP, n = 10), control bag (CB, n = 7), control paste (CP, n = 9), and background control (BC, n = 6).
Figure 6
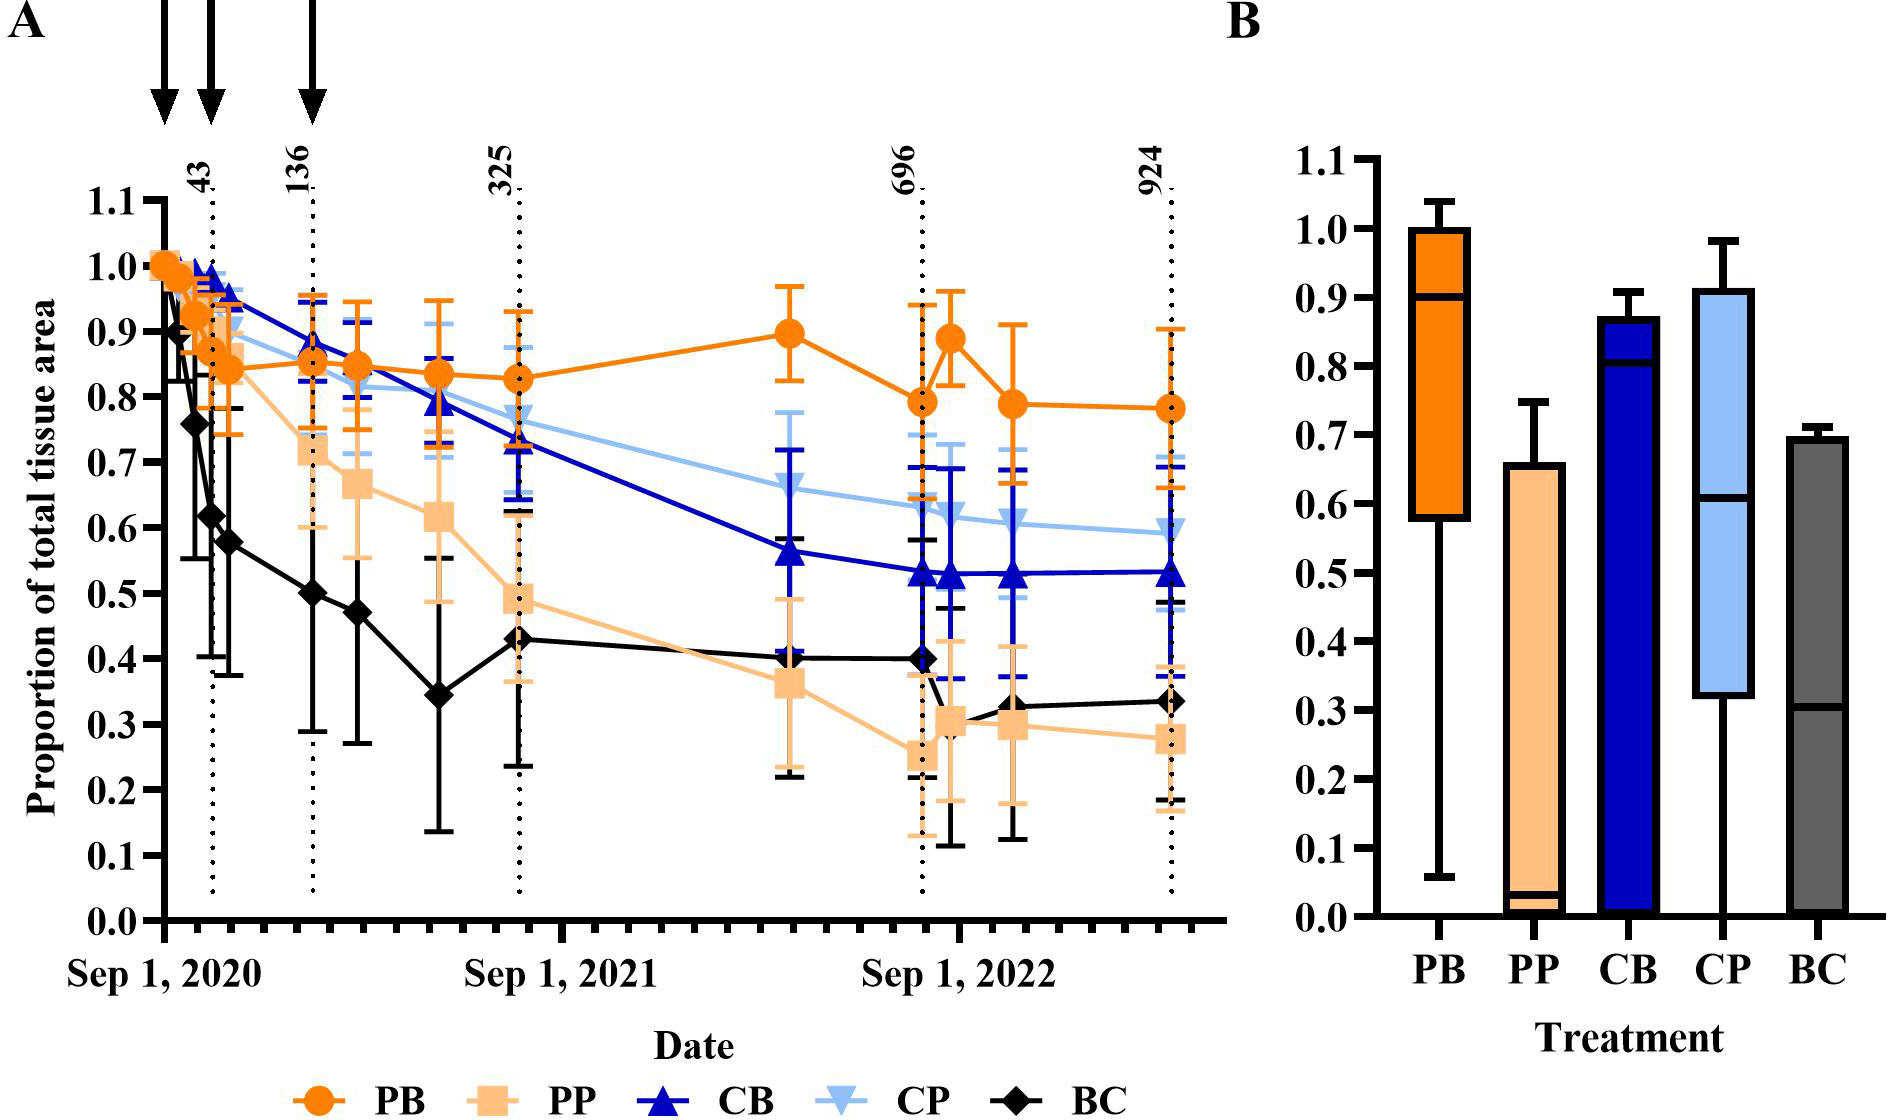
Proportion of total tissue area remaining. (A) Average proportion of total tissue remaining over the duration of the experiment (means ±1 SEM). Black arrows represent the dates on which treatments were applied. Dotted lines represent day 43, 136, 325, 696, and 924 of experimentation. Treatment codes include probiotic bag (PB, dark orange circle), probiotic paste (PP, light orange square), control bag (CB, dark blue up triangle), control paste (CP, light blue down triangle), and background control (BC, black diamond). (B) Proportion of total tissue remaining at the end of experiment after 2.5 years (924 days). Boxplot shows median (horizontal line) and 1st and 3rd quartiles. Whiskers represent minimum to maximum.
Table 2
| Predictor | χ2 | d.f. | p-value |
|---|---|---|---|
| (Intercept) | 17.635 | 1 | < 0.001 |
| Treatment | 15.160 | 4 | 0.004 |
| Log10 (Time) | 9.816 | 1 | 0.002 |
| Initial condition | 0.170 | 1 | 0.680 |
| Initial total tissue surface area | 1.297 | 1 | 0.255 |
| Treatment-x-time | 14.439 | 4 | 0.006 |
Analysis of deviance from a generalized linear mixed effects model conducted to investigate the in situ experiment across all time points.
Figure 7
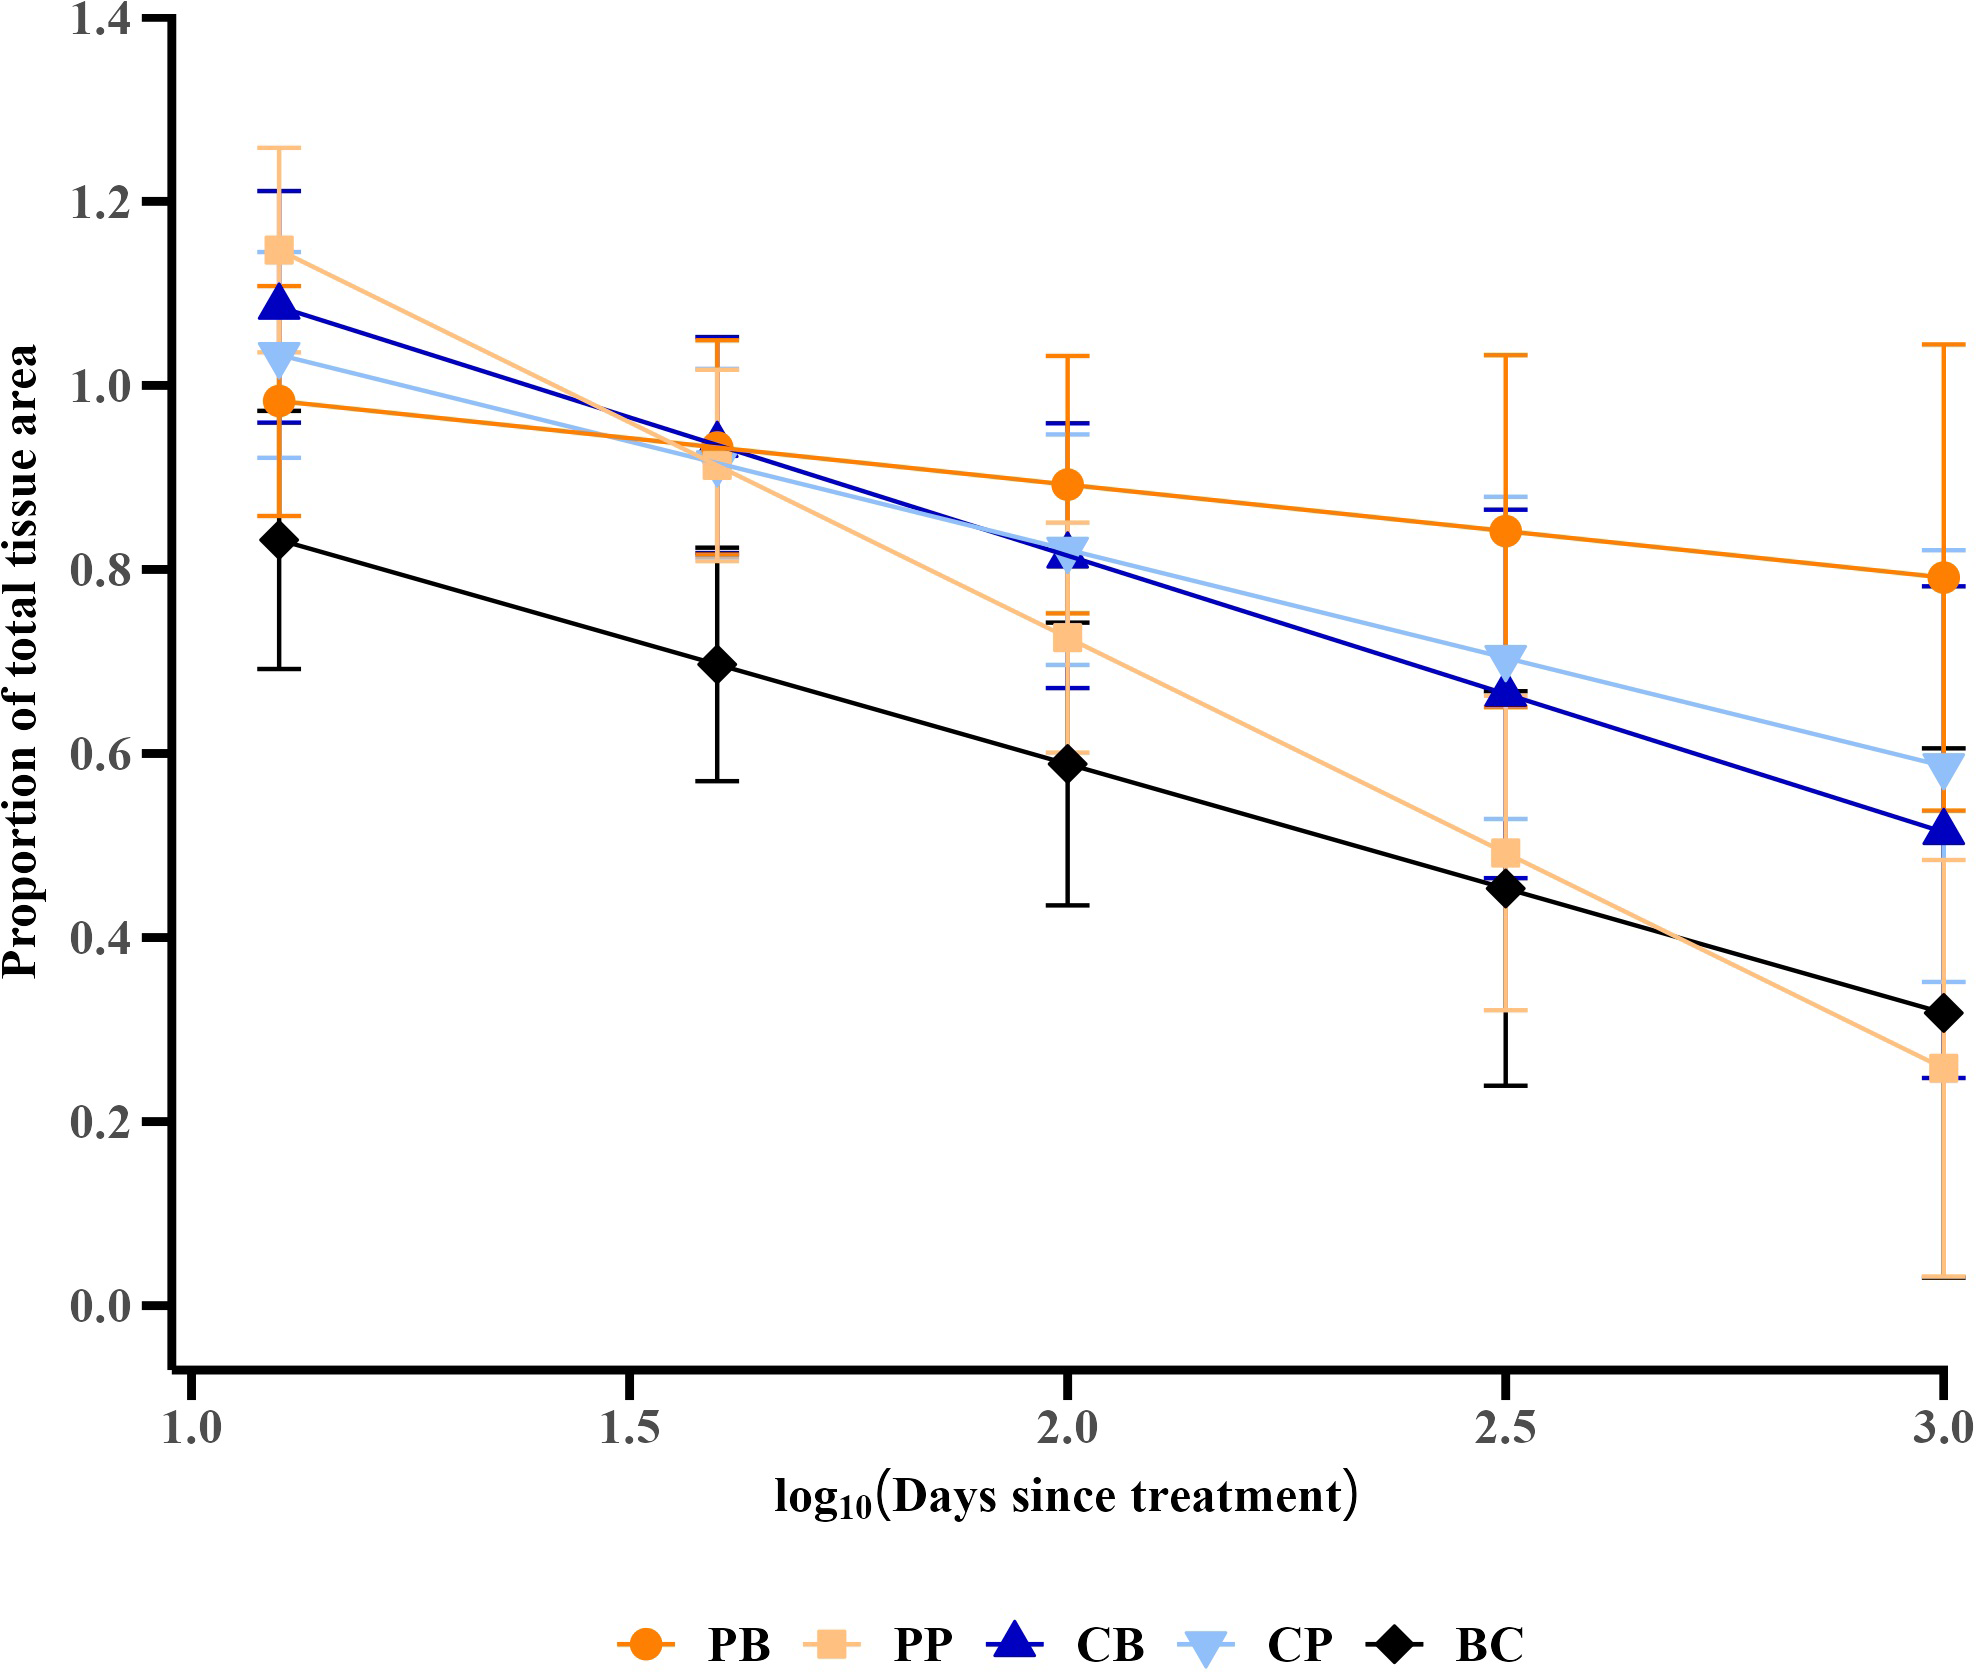
Trends in the proportion of total tissue area remaining, derived from a generalized linear mixed effects model controlling for covariates [initial total tissue area and initial condition (proportion of initial total tissue area over total skeletal area) of the colony]. Values are means ± 95% confidence intervals. Treatment codes include probiotic bag (PB, dark orange circle), probiotic paste (PP, light orange square), control bag (CB, dark blue up triangle), control paste (CP, light blue down triangle), and background control (BC, black diamond).
Considering just the final proportion of total tissue area remaining at the end of the experiment—an indicator of the total cumulative treatment effect over the course of the experiment—the probiotic bag treated corals had the highest average proportion remaining at 0.790 ± 0.124 (mean ± standard error) (Figure 6B). Post-hoc contrasts between the probiotic paste and bag treatments and their respective controls, as well as between the two treatment controls and the background control [as implemented in the emmeans R package (Lenth, 2023)], showed that the average final proportion of total tissue remaining was significantly higher than for those colonies receiving the control bag [based on post-hoc contrasts (p < 0.001)]. The control bag treated colonies only had 0.533 ± 0.160 proportion of final total tissue area remaining at the end of the experiment. Oppositely, the colonies treated with the probiotic paste had a lower proportion of tissue remaining (0.278 ± 0.110) than the control paste treated colonies (0.592 ± 0.117; p < 0.001). Both treatment controls did, however, perform significantly better than the background control, which had only 0.336 ± 0.151 proportion total tissue area remaining by the end of the experiment (p< 0.001 relative to both the bag and paste controls).
3.3 Microbiome composition during early treatment period
Amplicon libraries were successfully sequenced for 194 coral microbiome samples and two process control blanks (Supplementary Table S2). Microbiomes were successfully sequenced from 51 samples before treatment, which included three healthy colonies and 24 paired samples of healthy tissue and disease lesion from diseased colonies. Microbiomes were also successfully sequenced from 80 samples collected sixteen days after the second probiotic treatment (experiment day 59), which included 16 healthy colonies and mostly paired samples of disease lesions (n=33) and healthy tissue (n=31) from diseased colonies. This translated to microbiomes of six to eight coral colonies per treatment, with samples of both healthy and diseased tissue. Likewise, microbiomes were successfully sequenced from 63 samples 93 days after the second probiotic treatment (experiment day 136), which included five healthy colonies and mostly paired samples of disease lesions (n=22) and healthy tissue (n=36) from diseased colonies. This translated to microbiomes of six or seven coral colonies per treatment, with samples of both healthy and diseased tissue. In total, microbiomes from healthy and diseased tissue were successfully characterized from 24 colonies at all three timepoints as well as 16 additional colonies without the full complement of samples spanning three timepoints, five treatments, and two tissue types (Table 1). After quality-filtering, joining reads, and chimera removal, an average of 43,139 sequences per sample were retained for analysis and a total of 20,164 amplicon sequence variants (ASVs) were detected. A total of 76 ASVs were detected in the two process control blanks (Supplementary Table S3). After removal of low-abundance ASVs, 756 ASVs were detected in coral samples and used for further analysis.
Alpha diversity, measured as observed ASVs, Shannon diversity index, and Simpson diversity index, varied by sample collection date (2-way ANOVA, p< 0.001), but not with treatment. All three measures indicated that alpha diversity was lowest two weeks after the second probiotic treatment on experimental day 59 (Supplementary Figure S3) and Tukey multiple comparisons of means showed that alpha diversity was lower on experimental day 59 compared to before treatment (p-adj< 0.001) and compared to three months after treatment on experimental day 136 (p-adj< 0.01).
Analyses of beta diversity revealed that overall, the sample collection date explained more of the variation in microbial community composition (PERMANOVA, R2 = 0.085, p< 0.001) than treatment (PERMANOVA, R2 = 0.042, p< 0.001) or health condition (PERMANOVA, R2 = 0.033, p< 0.001) (Figure 8). However, it is important to note that 84% of the variation between microbial communities was not explained by three factors examined here. After controlling for sample collection date, treatment did not explain microbiome variation. In August, before the start of probiotic treatments, microbiome variation was explained by health condition (PERMANOVA, R2 = 0.076, p = 0.01), where microbiome composition in disease lesions was statistically different from both healthy colonies (pairwise PERMANOVA, R2 = 0.111, p< 0.001) and healthy tissue on diseased colonies (pairwise PERMANOVA, R2 = 0.0648, p = 0.001). On the two sample collection dates after probiotic treatment (16 days and 93 days after the second treatment), health condition continued to explain microbiome variation, but treatment did not. To further explore what drove variation among the M. cavernosa colonies over the early treatment phases, we examined the differential abundance of taxa among treatment types, controlling for sample collection date. A total of five ASVs were differentially abundant by treatment and the applied probiotic strain Pseudoalteromonas sp. McH1–7 was not one of the differentially abundant taxa (Supplementary Figure S4). One ASV classified as Halodesulfovibrio and one classified as Endozoicomonas had lower relative abundances in all treatment types compared to no treatment, while one Photobacterium ASV had higher relative abundance in all treatment types compared to no treatment. One ASV classified as Ilumatobacter was generally low (< 1% relative abundance) and lower in treated corals except for one sample treated with the control bag in which this ASV was at 4% relative abundance. One ASV classified only to family Rhodobacteraceae was detected at 1% relative abundance or less in all samples, but some corals treated with control paste or probiotic paste had higher relative abundances compared to the bag treatments.
Figure 8
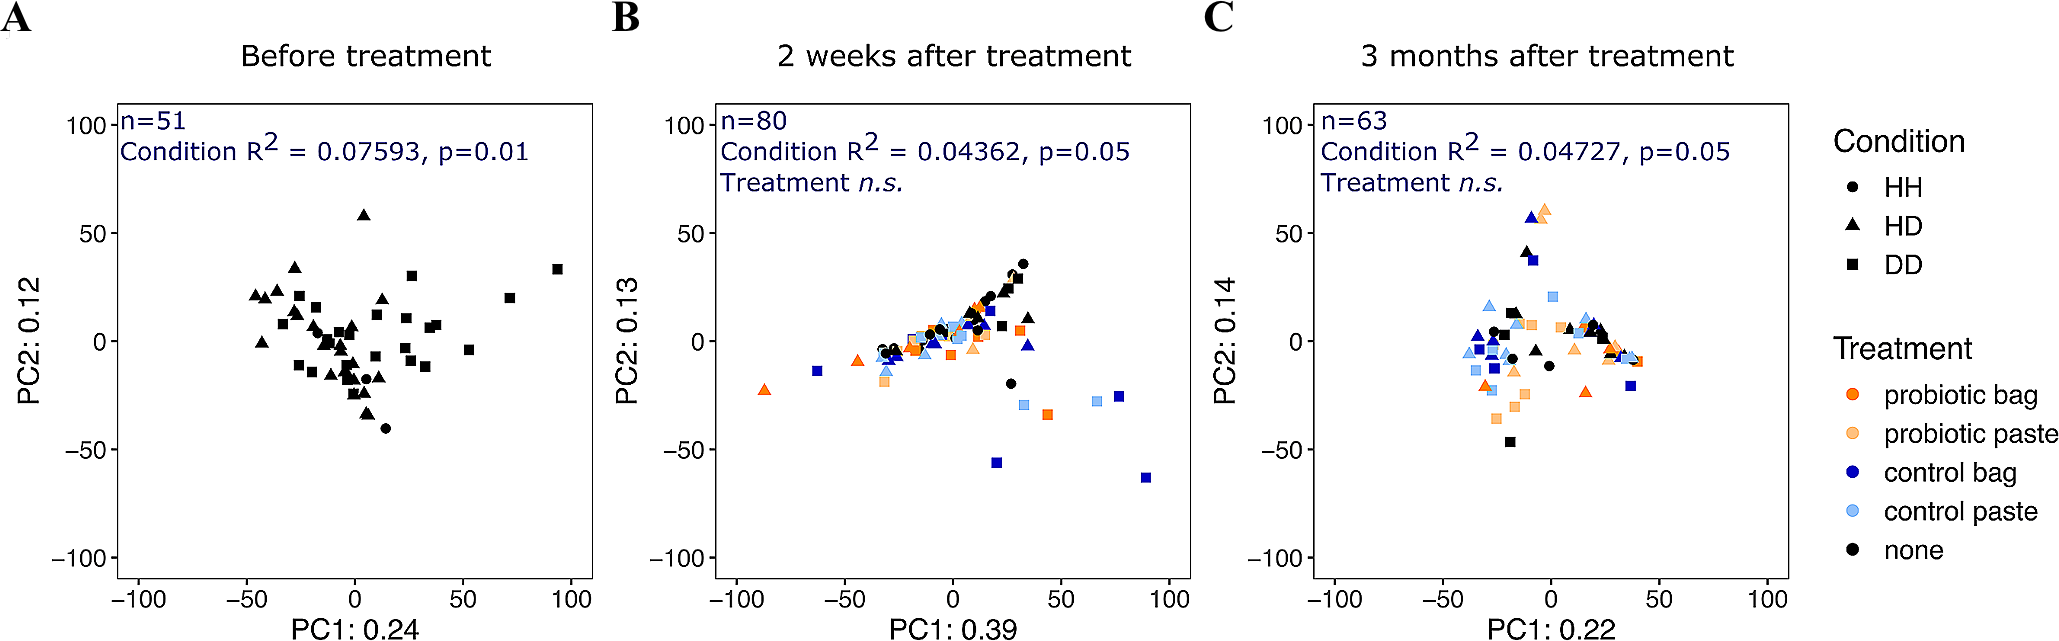
Principal Components Analysis ordination of centered-log-ratio transformed read counts from 194 microbial communities in Montastraea cavernosa corals by collection date. (A) 13 days before probiotic treatments (n=51), (B) ~2 weeks after the second probiotic treatment on experiment day 59 (n=80), and (C) ~3 months after the second probiotic treatment on experiment day 136 (n=63). Each point represents a microbial community from the coral surface, colored by treatment type, with shape designating the health condition (HH, healthy tissue on healthy colony; HD, apparently healthy tissue on diseased colony; DD, diseased tissue). The number of microbial community samples from coral colonies and the results of the PERMANOVA of the Aitchison distance for each collection date are printed in blue. “n.s.”, not significant.
We also examined the twenty most abundant ASVs over time, by treatment and by tissue type (Figure 9). The most abundant taxa included one Actinobacteria (Renibacterium), one Desulfovibrionia (Halodesulfovibrio), three Alphaproteobacteria (Nautella, Ruegeria, Thalassobius), and one Verrucomicrobiae (Roseibacillus). The remaining 14 abundant taxa were Gammaproteobacteria, including multiple ASVs of Pseudoalteromonas, Vibrio, Endozoicomonas, and Halomonas (Figure 9). These twenty predominant ASVs were reflective of the most common bacterial orders. For example, the most predominant bacterial orders across all timepoints and treatments were the gammaproteobacterial orders Enterobacterales and Pseudomonadales as well as the alphaproteobacterial order Rhodobacterales (Supplementary Figure S5). The relative abundance of these predominant taxa changed by sampling period, irrespective of treatment type, likely reflecting the response of the microbial community to seasonal environmental changes. For example, among the Vibrio taxa, Vibrio ASV2, ASV3, and ASV4 were most abundant before treatment in August, Vibrio ASV1 was more abundant 16 days after the second treatment in October, and all four Vibrio taxa were at lower abundance 93 days after the second treatment (January 2021). Similar seasonal fluctuations were also seen in the genus Endozoicomonas, where Endozoicomonas ASV1 was most abundant in August, while Endozoicomonas ASV2 and ASV3 were more abundant in January. Endozoicomonas ASV1 was also detected as enriched in untreated corals in the differential abundance analysis. In addition, both Pseudoalteromonas and Halomonas taxa varied seasonally, with highest abundances in October, lower abundances in January, and lowest abundances in August. Pseudoalteromonas ASV1 is an exact sequence match over 253 nucleotides of the 16S ribosomal RNA gene to McH1–7 that was used in the probiotic treatments. Pseudoalteromonas ASV2 was one nucleotide different from Pseudoalteromonas ASV1. Overall, Pseudoalteromonas taxa were most abundant 16 days after the second probiotic treatment was applied, even in untreated corals (Figure 9).
Figure 9
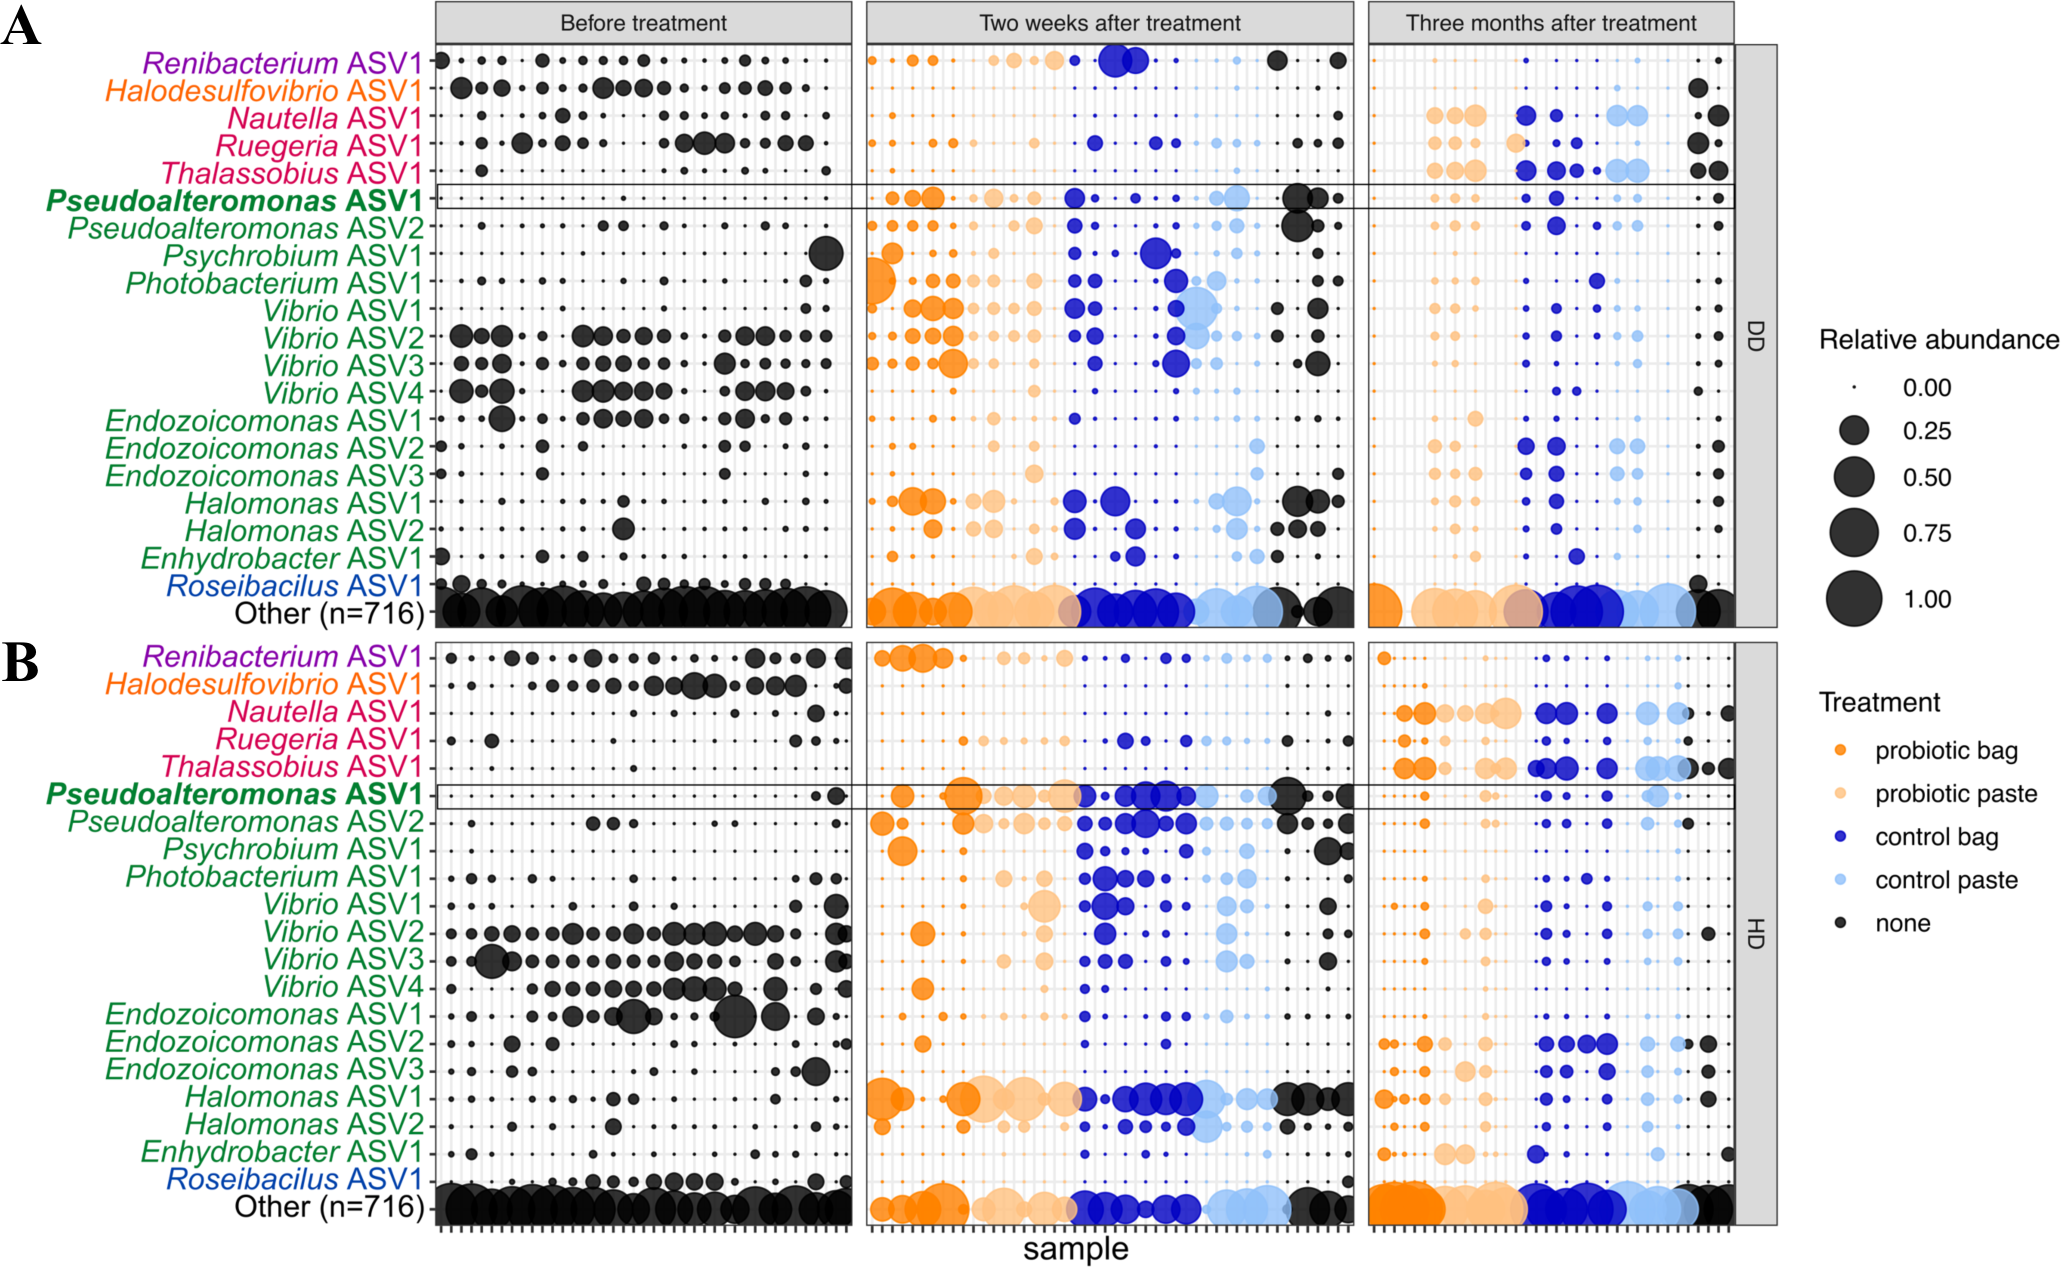
The relative abundance of the twenty most abundant amplicon sequence variants (ASVs) in Montastraea cavernosa corals sampled 13 days before probiotic treatments, ~2 weeks after the second probiotic treatment (experiment day 59), and ~3 months after the second probiotic treatment (experiment day 136). A total of 716 ASVs are included in bubbles labeled “Other”. Points are colored by treatment type. Taxonomic names are colored by Class: Actinobacteria (purple), Desulfovibrionia (orange), Alphaproteobacteria (magenta), Gammaproteobacteria (green), and Verrucomicrobiae (blue). The bolded taxonomic name (Pseudoalteromonas ASV1) matches the Pseudoalteromonas strain McH1–7 that was applied as a probiotic treatment. Microbiomes were sampled from (A) diseased tissue (DD) and (B) apparently healthy tissue (HD) on diseased colonies. Samples are organized such that vertical columns represent the two tissue types for one colony at one time point.
To complement the conserved 16S ribosomal RNA taxonomic marker survey, specific biomarker assays using high-sensitivity ddPCR were conducted to detect functional genes associated with the probiotic strain Pseudoalteromonas sp. McH1–7 or the putative pathogen Vibrio coralliilyticus. These functional gene assays showed low abundances (less than 25 gene copies per ng of DNA) of the biomarkers for both the probiotic and putatively pathogenic strains over the three time points, regardless of treatment type (Figure 10). The McH1–7 biomarker copies varied by treatment, with higher gene copies in the probiotic paste versus untreated corals (p-adj = 0.005). In addition, the McH1–7 biomarker copies were higher in January than in August (p-adj< 0.001) or in October (p-adj< 0.0001), while the 16S rRNA survey showed highest relative abundances of Pseudoalteromonas taxa in October. This indicates that while members of the Pseudoalteromonas genus were most abundant two weeks after the second probiotic treatment, these taxa may not be the strain that was applied since the strain-specific functional gene was generally not detected in the same DNA samples. Gene copies of the vcpA biomarker were also low (less than 10 gene copies per ng of DNA) across the sample months and were not significantly different among treatments, sample month, or tissue type. The predominant Vibrio taxa detected by the conserved 16S ribosomal RNA taxonomic marker survey may not contain the putative virulence factor vcpA from Vibrio coralliilyticus since it was present at very low gene copy numbers.
Figure 10
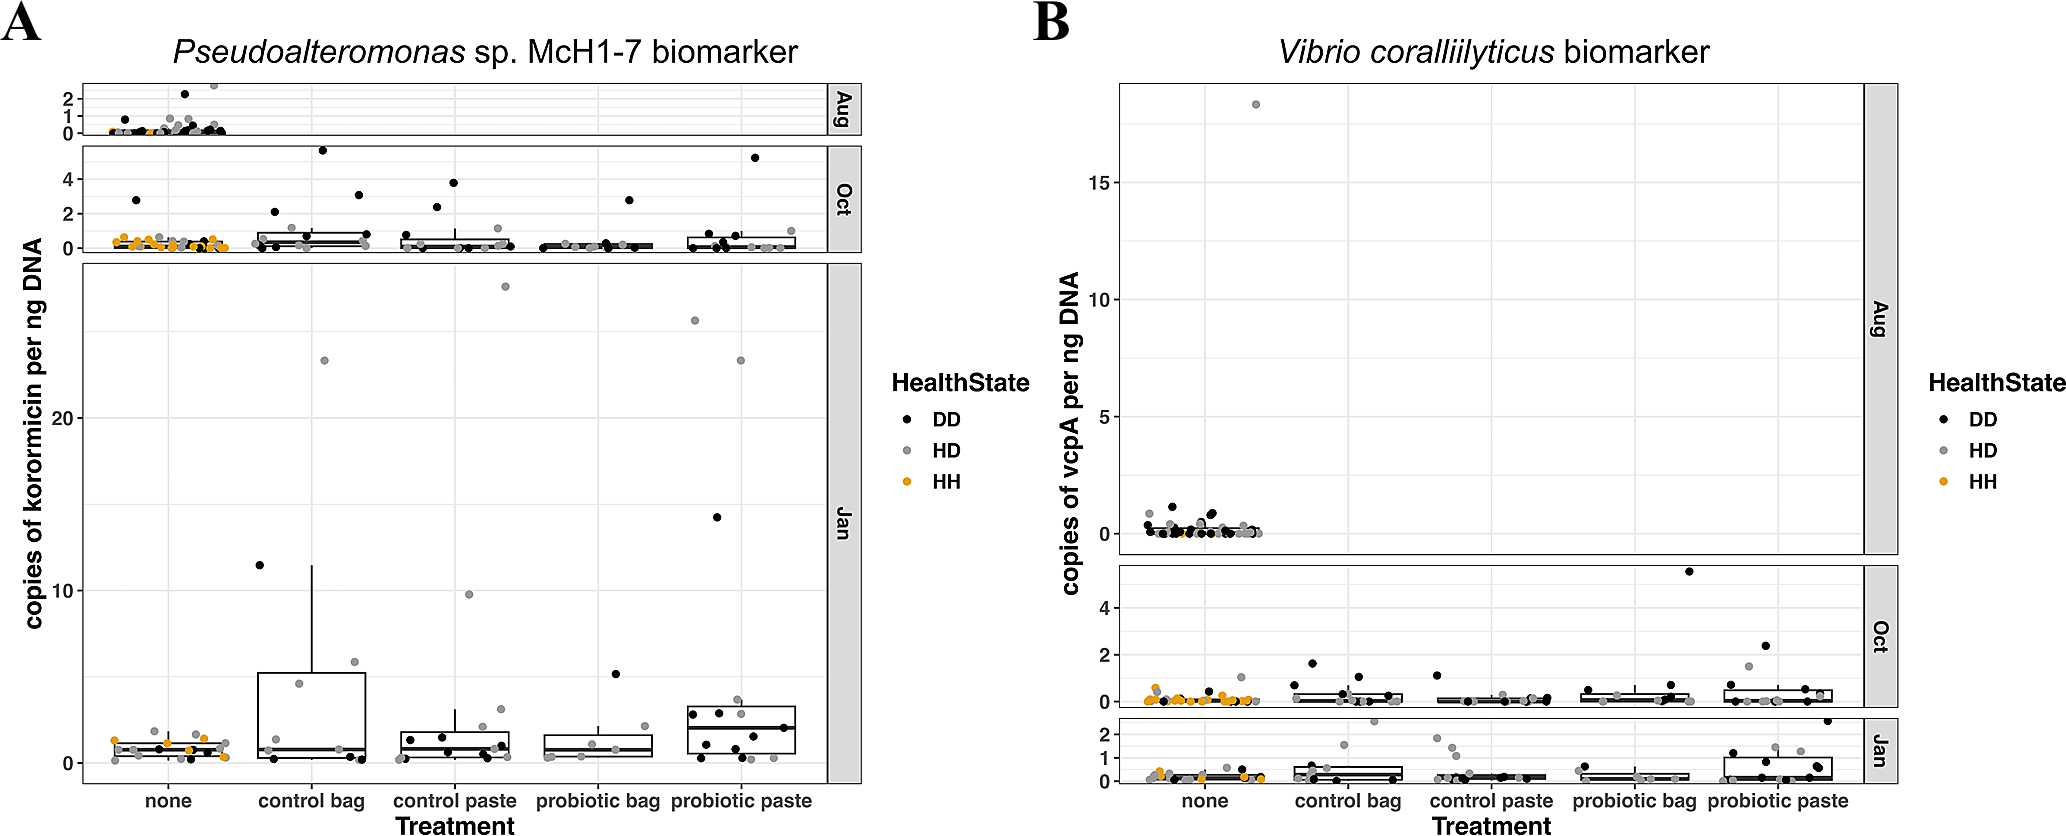
(A) Gene copies per ng DNA of the Pseudoalteromonas sp. strain McH1–7 biomarker (part of the korormicin biosynthetic gene cluster) in Montastraea cavernosa corals sampled 13 days before probiotic treatments, ~2 weeks after the second probiotic treatment (day 59), and ~3 months after the second probiotic treatment (day 136). (B) Gene copies per ng DNA of the Vibrio coralliilyticus biomarker vcpA vibriolysin-like metalloprotease in Montastraea cavernosa corals sampled 13 days before probiotic treatments, ~2 weeks after the second probiotic treatment (day 59), and ~3 months after the second probiotic treatment (day 136). Colors indicate the health condition of the coral tissue where DD, diseased tissue; HD, apparently healthy tissue on diseased colony; HH, healthy tissue on healthy untreated colony.
4 Discussion
Probiotics could offer a supporting intervention option for SCTLD infected corals by providing beneficial microorganisms at the site of infection or as a whole-colony treatment. This study determined that in situ whole-colony treatment with the Pseudoalteromonas sp. strain McH1–7 effectively slows or stops tissue loss without dominating the microbial community on M. cavernosa colonies affected with SCTLD on Florida’s Coral Reef. We did not, however, recover a similar benefit of localized treatment using a probiotic paste. Further, diseased colonies that were treated with the whole-colony bagging technique lost less tissue than colonies of all other treatments over the 2.5 years of monitoring. We also developed an effective probiotic application technique that is feasible to deploy via scuba diving, has a stable shelf-life of up to 2 weeks, and does not appear to elicit any negative reactions in other healthy Caribbean coral species, thus illustrating the promise of this strain as an effective method for SCTLD intervention.
4.1 Successful treatment of SCTLD
The whole-colony, and not the lesion-specific technique, successfully slowed or stopped the progression of SCTLD. In aquaria, McH1–7 slowed or stopped SCTLD progression and transmission among M. cavernosa without dominating the host microbiome (Ushijima et al., 2023), suggesting its ability to assimilate with the microbiome and enhance the coral’s functioning without causing a disruptive imbalance. The colony-wide colonization of McH1–7 in situ may be necessary to produce any significant therapeutic effects. The whole-colony bagging technique was effective at trapping McH1–7 against whole M. cavernosa colonies for a 2-hour duration, which our results suggest is a sufficient time for microbial colonization. Alternatively, the lesion-specific paste treatment may have provided only a localized or otherwise inadequate inoculum, contributing to its ineffectiveness. Interestingly, the probiotic paste treatment contributed to more tissue loss compared to the control paste treatment. The reason for this result remains unclear; however, it is possible that high concentrations of McH1–7 negatively impacted the already stressed tissue at the lesion site. This could be due to localized hypoxia, changes in the microbiomes at the lesion site (McDevitt-Irwin et al., 2017; Zaneveld et al., 2017), or production of antibiotics (Ushijima et al., 2023) or other metabolites by McH1–7 that were harmful at high concentrations. In contrast, the application of the paste control led to less tissue loss, on average, than the untreated colonies. One potential explanation is that the paste is changing the relationship between the coral host and mucus, as mucus is central to the host’s defense mechanism (Brown and Bythell, 2005).
Assessment of the coral microbiome response during early phases of the probiotic treatments in situ demonstrated that the applied probiotic strain McH1–7 did not bloom or drastically alter the resident microbiome, in agreement with previous aquaria trials (Ushijima et al., 2023). Instead, microbiome variation in both treated and untreated corals in this study showed patterns of seasonal changes in composition or differences between SCTLD-impacted corals and visually healthy corals. This suggests that McH1–7 can have a beneficial impact on the host without establishing high relative abundances for extended periods.
From our data and a previous publication (Ushijima et al., 2023), McH1–7 appears to persist on the corals but at low concentrations. In previous tank trials, ddPCR was used to track the genes for production of the antibiotic korormycin. This genetic signal was not detected after ~24 h, but we were able to detect McH1–7 again weeks later. In the current study, we detected McH1–7 at all three time points tested, albeit at low levels. Further, we found that McH1–7 does not dominate and significantly shift the host microbiome. We hypothesize that McH1–7 persists on the coral at levels at or below the detectable limit of ddPCR, and therefore, it may persist on the corals longer than it can be accurately detected. Also, because we have not verified the mechanism through which McH1–7 protects corals, we are currently unable to conclude anything about the long-term protective effects. For example, if it is based on the production of an antimicrobial or immune system-stimulating molecule, we could attempt to determine the concentration needed for a protective effect. Further, if the effect is based upon McH1–7 producing a trans-acting factor (e.g., an antibiotic), then the cellular concentration can be low while the effective concentration of the factor is reached.
While examining the role of seasonality in M. cavernosa microbiomes was not the goal of this study, we observed shifts over time in two predominant genera, Pseudoalteromonas and Vibrio, that may play a role in SCTLD dynamics. First, we saw higher relative abundances of two predominant Pseudoalteromonas ASVs in October and January across all corals, regardless of treatment. This enrichment coincides with the cool and dry season in southeast Florida and the concurrent decline in SCTLD presentation in the region (Walker et al., 2021; Toth et al., 2024). In contrast, multiple Vibrio ASVs were in lower relative abundance in both October and January during the cool/dry season compared to August, the warm/wet season. The decline in the relative abundance of Vibrio ASVs during the cool/dry season and the increase in the relative abundance of Pseudoalteromonas likely reflects seasonal environmental changes that favor one group over the other. However, these patterns may also be impacted by the microbe-microbe interactions that inspired the development of the probiotic treatments described here. Pseudoalteromonas are well known for their genetic capacity to generate diverse antimicrobial products (Paulsen et al., 2019; Eze et al., 2023; Ushijima et al., 2023; Wang et al., 2024) and the probiotic strain McH1–7 has demonstrated inhibition of multiple strains of Vibrio in laboratory studies (Ushijima et al., 2023). Similarly, the low relative abundance of V. coralliilyticus at all sampling time points coincides with the consistent detection of Ruegeria, members of which have demonstrated inhibition of V. coralliilyticus (Miura et al., 2019; Xu et al., 2024). The seasonal variation in the resident microbiome suggests that timing of probiotic treatments during the year has the potential to influence host outcomes, an area that warrants further investigation.
After repeated whole-colony bagging treatments occurring over 4.5 months, the probiotic strain McH1–7 may provide protection from SCTLD for the following 2+ years, as the amount of total tissue area remaining only dropped 7.1% compared to 35.1% on the control bag treated corals over this time. Probiotics used as prophylactic treatments have been found to reduce coral bleaching by preventing the reduction in bacterial diversity, fostering beneficial strains while simultaneously alleviating pathogenic-induced dysbiosis (Xu et al., 2024). Beneficial microorganisms can also mitigate bleaching prophylactically by causing changes to the coral host including lipid maintenance and transcriptional reprogramming of cellular repair and stress protection (Santoro et al., 2021). However, not much is understood about using prophylactic treatments for SCTLD. Since McH1–7 potentially produces at least four types of antibiotic compounds (korormicins, tetrabromopyrrole, marinocine, and pseudoalterins) (Ushijima et al., 2023), it is predicted that this strain reduces pathogenic bacteria on the coral host. The potential to reduce multiple pathogenic strains of bacteria may be instrumental as SCTLD has been found to disrupt the coral microbiome (Meyer et al., 2019; Rosales et al., 2020; Ushijima et al., 2020; Work et al., 2021; Becker et al., 2022; Huntley et al., 2022; Rosales et al., 2022, Rosales et al., 2023). That said, the pathway for the use of McH1–7 prophylactically remains unknown and needs further investigation to maximize the effectiveness of the treatment.
4.2 Probiotic treatment development
The viability of McH1–7 did not significantly differ over the first 120 hours of storage at five different temperatures. However, when investigating viability over 56 days at both 4°C and 22°C, the survival of McH1–7 significantly declined after the first two weeks of storage, regardless of temperature. These results suggest a two-week shelf life of this strain. Although not significant, there was a general trend that colony counts were higher for McH1–7 in the 4°C treatment during this time, suggesting that refrigeration should be utilized if available but is not necessary for McH1–7 survival. These methods allow for the probiotic strain to be grown in a sterile laboratory setting and then dispersed to even remote reefs within 14 days.
All five alternative species of Caribbean corals conveyed no visual negative effects over 21 days after being inoculated with McH1–7 in aquaria, which provides a promising outlook for the safety of McH1–7 treatments in the reef ecosystem. Since McH1–7 was isolated from a local healthy M. cavernosa, did not dominate the host coral microbiome, and did not negatively impact healthy controls when applied in aquaria (Ushijima et al., 2023), it is generally understood that this probiotic does not disadvantage M. cavernosa or, based on our laboratory trials, other common stony corals in the Caribbean reefscape. Further, Delgadillo-Ordoñez et al. (2024) found probiotics were able to successfully alter the host microbiome without changes to the surrounding seawater and sediment environment. Although, higher replication among a greater diversity of reef species is necessary to better understand any wider reaching impacts of McH1–7 on the reef.
We do not believe that limited application of this probiotic would impact the surrounding reef environment for several reasons. First, this probiotic was isolated from Florida corals, so nothing foreign is being introduced (Ushijima et al., 2023). Most bacterial populations are controlled by natural phage populations, so a native bacterium being reintroduced into the same environment would likely be controlled (Batinovic et al., 2019; Chevallereau et al., 2022). Coral microbiomes have been restructured by probiotic applications without microbial shifts in surrounding seawater or sediments (Delgadillo-Ordoñez et al., 2024). It is possible that the probiotic is pathogenic to some other reef organism; however, SCTLD has already significantly shifted the reef ecosystem and McH1–7 is already present on Florida’s coral reef. Nonetheless, the impacts of widespread application of McH1–7 remain unknown. Therefore, the impact of McH1–7 or other probiotics on the surrounding reef setting, especially in larger quantities, should be further characterized to ensure the sustainable application on wild corals. Further investigation is necessary to determine if a single application is sufficient to replicate the benefits we demonstrate in this study.
5 Conclusions
The benefits of probiotic treatments to resist disease and other stressors in the marine environment is poorly understood, with our study being the first to examine in situ probiotic treatments for a widespread and lethal coral disease. Once properly applied to whole Montastraea cavernosa colonies in a reef setting, probiotic strain McH1–7 successfully reduced or halted the progression of stony coral tissue loss disease (SCTLD) without dominating the microbial community. While the whole-colony bagging method does involve more material transport by divers and more time for deployment and retrieval, its performance at treating SCTLD and promoting long-term resistance outweigh these costs and is therefore the recommended application method of those we tested for probiotic treatments such as the McH1–7 strain. Nonetheless, alternative approaches for applying probiotics to whole coral colonies that are lighter to carry and do not require retrieval after application may aid scalability and should be considered in the future. Probiotics represent the potential to use local native microorganisms to cater treatments to each coral species impacted by coral disease. As SCTLD is such a virulent disease with an unknown causative agent(s), it will be beneficial to have numerous treatment options available to employ. As active SCTLD endures in endemic disease zones even eleven years after its initial outbreak in 2014 (Precht et al., 2016) and continues to spread throughout the wider Caribbean to previously naïve reefs (Kramer et al., 2019), the long-term therapeutic potential of probiotic treatments is invaluable.
Statements
Data availability statement
The datasets presented in this study can be found in online repositories. The names of the repository/repositories and accession number(s) can be found in the Supplementary Material. All coral tissue measurement data from 3D models of infected Montastraea cavernosa at our in situ research site, as well as the accompanying R script are publicly available at FigShare (https://doi.org/10.6084/m9.figshare.26662564.v1). The McH1-7 and Vibrio coralliilyticus biomarkers can also be found on the same FigShare repository. Our microbiome analysis data and accompanying R script are available on the online platform GitHub and can be accessed at https://github.com/meyermicrobiolab/McH1-7_field_trials_BS2.
Ethics statement
The manuscript presents research on animals that do not require ethical approval for their study.
Author contributions
KP: Conceptualization, Data curation, Formal analysis, Methodology, Writing – original draft, Writing – review & editing. MS: Data curation, Formal analysis, Methodology, Writing – review & editing. JL: Formal analysis, Writing – original draft, Writing – review & editing. BU: Conceptualization, Methodology, Writing – review & editing, Funding acquisition. ND: Data curation, Methodology, Writing – review & editing. EM: Data curation, Methodology, Writing – review & editing. AM: Data curation, Formal analysis, Writing – review & editing. MDS: Data curation, Formal analysis, Writing – review & editing. JM: Conceptualization, Formal analysis, Writing – original draft, Writing – review & editing, Funding acquisition. KT: Methodology, Writing – review & editing. ZF: Methodology, Writing – review & editing, Writing – original draft. YD: Data curation, Writing – review & editing. TD: Data curation, Writing – review & editing. HN: Data curation, Writing – review & editing. BW: Conceptualization, Writing – review & editing, Funding acquisition. VP: Conceptualization, Methodology, Writing – review & editing, Funding acquisition.
Funding
The author(s) declare that financial support was received for the research and/or publication of this article. Funding for field support was provided by the Florida Department of Environmental Protection (FDEP) Office of Resilience and Coastal Protection- Southeast Region (Award numbers B96DE8, B7B9FF, B7C0F5, C00BAF, B7B6F3, B96800, and C00BAE). The funders had no role in data collection and analysis, decision to publish, or preparation of this manuscript.
Acknowledgments
Field experiments were authorized under the Florida Fish and Wildlife Conservation Commission Special Activity Licenses SAL-19-2201-SRP, SAL-20-2201-SRP, and SAL-22-2201-SRP. Field collections of corals used for safety testing experiment were authorized under Florida Keys National Marine Sanctuary permit numbers FKNMS-2017-128-A2 and FKNMS-2019-160-A1. We would like to thank Samantha Buckley, Zachary Graff, Allie Kozachuk, Reagan Sharkey, Alexandra Wagner, and Amanda Zummo of the GIS and Spatial Ecology Laboratory at Nova Southeastern University for assistance with research site establishment and monitoring. We would also like to thank Smithsonian Marine Station members Woody Lee, Tessa Kelly, and Kylie Zimmerman for technical support with animal husbandry and recirculating tank operations. This is contribution #1238 of the Smithsonian Marine Station.
Conflict of interest
The authors declare that the research was conducted in the absence of any commercial or financial relationships that could be construed as a potential conflict of interest.
Publisher’s note
All claims expressed in this article are solely those of the authors and do not necessarily represent those of their affiliated organizations, or those of the publisher, the editors and the reviewers. Any product that may be evaluated in this article, or claim that may be made by its manufacturer, is not guaranteed or endorsed by the publisher.
Supplementary material
The Supplementary Material for this article can be found online at: https://www.frontiersin.org/articles/10.3389/fmars.2025.1480966/full#supplementary-material
References
1
Aeby G. Ushijima B. Campbell J. E. Jones S. Williams G. Meyer J. L. et al . (2019). Pathogenesis of a tissue loss disease affecting multiple species of corals along the Florida Reef Tract. Front. Marine Sci.6, 678. doi: 10.3389/fmars.2019.00678
2
Alvarez-Filip L. Estrada-Saldívar N. Pérez-Cervantes E. Molina-Hernández A. González-Barrios F. J. (2019). A rapid spread of the stony coral tissue loss disease outbreak in the Mexican Caribbean. PeerJ7, e8069. doi: 10.7717/peerj.8069
3
Apprill A. McNally S. Parsons R. Weber L. (2015). Minor revision to V4 region SSU rRNA 806R gene primer greatly increases detection of SAR11 bacterioplankton. Aquat. Microbial Ecol.75, 129–137. doi: 10.3354/ame01753
4
Aronson R. B. Precht W. F. (2001). White-band disease and the changing face of Caribbean coral reefs. Ecol. etiology newly emerging marine Dis.159, 25–38. doi: 10.1007/978-94-017-3284-0_2
5
Batinovic S. Wassef F. Knowler S. A. Rice D. T. F. Stanton C. R. Rose J. et al . (2019). Bacteriophages in natural and artificial environments. Pathogens8, 100. doi: 10.3390/pathogens8030100
6
Becker C. C. Brandt M. Miller C. A. Apprill A. (2022). Microbial bioindicators of Stony Coral Tissue Loss Disease identified in corals and overlying waters using a rapid field-based sequencing approach. Environ. Microbiol.24, 1166–1182. doi: 10.1111/1462-2920.15718
7
Brooks M. E. Kristensen K. Benthem K. Magnusson A. Berg C. W. Nielsen A. et al . (2017). glmmTMB balances speed and flexibility among packages for zero-inflated generalized linear mixed modeling. R J.9, 378–400. doi: 10.32614/RJ-2017-066
8
Brown B. Bythell J. (2005). Perspectives on mucus secretion in reef corals. Marine Ecol. Prog. Ser.296, 291–309. doi: 10.3354/meps296291
9
Callahan B. J. McMurdie P. J. Rosen M. J. Han A. W. Johnson A. J. A. Holmes S. P. (2016). DADA2: High-resolution sample inference from Illumina amplicon data. Nat. Methods13, 581–583. doi: 10.1038/nmeth.3869
10
Caporaso J. G. Lauber C. L. Walters W. A. Berg-Lyons D. Huntley J. Fierer N. et al . (2012). Ultra-high-throughput microbial community analysis on the Illumina HiSeq and MiSeq platforms. ISME J.6, 1621–1624. doi: 10.1038/ismej.2012.8
11
Chevallereau A. Pons B. J. van Houte S. Westra E. R. (2022). Interactions between bacterial and phage communities in natural environments. Nat. Rev. Microbiol.20, 49–62. doi: 10.1038/s41579-021-00602-y
12
Delgadillo-Ordoñez N. Garcias-Bonet N. Raimundo I. García F. C. Villela H. Osman E. O. et al . (2024). Probiotics reshape the coral microbiome in situ without detectabl e off-target effects in the surrounding environment. Commun. Biol.7, 434. doi: 10.1038/s42003-024-06135-3
13
Dixon P. (2003). VEGAN, a package of R functions for community ecology. J. Vegetation Sci.14, 927–930. doi: 10.1111/j.1654-1103.2003.tb02228.x
14
Eze O. C. Berebon D. P. Emencheta S. C. Evurani S. A. Okorie C. N. Balcão V. M. et al . (2023). Therapeutic potential of marine probiotics: a survey on the anticancer and antibacterial effects of. Pseudoalteromonas Pharmaceuticals16, 1091. doi: 10.3390/ph16081091
15
Fischler M. A. Bolles R. C. (1981). Random sample consensus: a paradigm for model fitting with applications to image analysis and automated cartography. Commun. ACM24, 381–395. doi: 10.1145/358669.358692
16
Forrester G. E. Arton L. Horton A. Nickles K. Forrester L. M. (2022). Antibiotic treatment ameliorates the impact of stony coral tissue loss disease (SCTLD) on coral communities. Front. Marine Sci.9, 859740. doi: 10.3389/fmars.2022.859740
17
Fragoso ados Santos H. Duarte G. A. S. Rachid C. Chaloub R. M. Calderon E. N. Marangoni L. et al . (2015). Impact of oil spills on coral reefs can be reduced by bioremediation using probiotic microbiota. Sci. Rep.5, 18268. doi: 10.1038/srep18268
18
Geiger A. Ziegler J. Stiller C. (2011). Stereoscan: Dense 3d reconstruction in real-time in 2011 IEEE intelligent vehicles symposium (IV), 963–968.
19
Gloor G. B. Macklaim J. M. Pawlowsky-Glahn V. Egozcue J. J. (2017). Microbiome datasets are compositional: and this is not optional. Front. Microbiol.8.224 doi: 10.3389/fmicb.2017.02224
20
Haralick B. M. Lee C.-N. Ottenberg K. Nölle M. (1994). Review and analysis of solutions of the three point perspective pose estimation problem. Int. J. Comput. Vision13, 331–356. doi: 10.1007/BF02028352
21
Harris C. Stephens M. (1988). “A combined corner and edge detector,” in Alvey vision conference (United Kingdom: Plessey Research Roke Manor), 147–151. doi: 10.5244/C.2.23
22
Hartig F. (2022). DHARMa: Residual Diagnostics for Hierarchical (Multi-Level/Mixed) Regression Models_. R package version 0.4.6. Available online at: https://CRAN.R-project.org/package (Accessed July 1, 2024).
23
Huntley N. Brandt M. E. Becker C. C. Miller C. A. Meiling S. S. Correa A. M. et al . (2022). Experimental transmission of stony coral tissue loss disease results in differential microbial responses within coral mucus and tissue. ISME Commun.2, 46. doi: 10.1038/s43705-022-00126-3
24
Kramer P. R. Roth L. Lang J. (2019).Map of stony coral tissue loss disease outbreak in the Caribbean. In: ArcGIS online. Available online at: www.agrra.org (Accessed Aug 2024).
25
Krediet C. J. Ritchie K. B. Paul V. J. Teplitski M. (2013). Coral-associated micro-organisms and their roles in promoting coral health and thwarting diseases. Proc. R. Soc. B: Biol. Sci.280, 20122328. doi: 10.1098/rspb.2012.2328
26
Lee Hing C. Guifarro Z. Dueñas D. Ochoa G. Nunez A. Forman K. et al . (2022). Management responses in Belize and Honduras, as stony coral tissue loss disease expands its prevalence in the Mesoamerican reef. Front. Marine Sci.9, 883062. doi: 10.3389/fmars.2022.883062
27
Lefcheck J. S. (2016). piecewiseSEM: Piecewise structural equation modelling in r for ecology, evolution, and systematics. Methods Ecol. Evol.7, 573–579. doi: 10.1111/mee3.2016.7.issue-5
28
Lenth R. (2023). _emmeans: estimated marginal means, aka least-squares means_. R Package version1.8.9. Available online at: https://CRAN.R-project.org/package.
29
Levenberg K. (1944). A method for the solution of certain non-linear problems in least squares. Q. Appl. mathematics2, 164–168. doi: 10.1090/qam/1944-02-02
30
Lowe D. G. (1999). “Object recognition from local scale-invariant features,” in Proceedings of the seventh IEEE international conference on computer vision. (Ieee). pp. 1150–1157.
31
Marquardt D. W. (1963). An algorithm for least-squares estimation of nonlinear parameters. J. Soc. Industrial Appl. Mathematics11, 431–441. doi: 10.1137/0111030
32
Martin M. (2011). Cutadapt removes adapter sequences from high-throughput sequencing reads. EMBnet. J.17, 10–12. doi: 10.14806/ej.17.1.200
33
Martin B. D. Witten D. Willis A. D. (2020). Modeling microbial abundances and dysbiosis with beta-binomial regression. Ann. Appl. Stat.14, 94–115. doi: 10.1214/19-AOAS1283
34
Martinez Arbizu P. (2020). pairwiseAdonis: Pairwise multilevel comparison using adonis. R package. Version 0.4. Available online at: https://github.com/pmartinezarbizu/pairwiseAdonis (Accessed July 10, 2024).
35
McDevitt-Irwin J. M. Baum J. K. Garren M. Vega Thurber R. L. (2017). Responses of coral-associated bacterial communities to local and global stressors. Front. Marine Sci.4, 286253. doi: 10.3389/fmars.2017.00262
36
McMurdie P. J. Holmes S. (2013). phyloseq: an R package for reproducible interactive analysis and graphics of microbiome census data. PloS One8, e61217. doi: 10.1371/journal.pone.0061217
37
Meiling S. S. Muller E. M. Lasseigne D. Rossin A. Veglia A. J. MacKnight N. et al . (2021). Variable species responses to experimental stony coral tissue loss disease (SCTLD) exposure. Front. Marine Sci.8, 670829. doi: 10.3389/fmars.2021.670829
38
Meiling S. Muller E. M. Smith T. B. Brandt M. E. (2020). 3D photogrammetry reveals dynamics of stony coral tissue loss disease (SCTLD) lesion progression across a thermal stress event. Front. Marine Sci.7, 597643. doi: 10.3389/fmars.2020.597643
39
Meyer J. L. Castellanos-Gell J. Aeby G. S. Häse C. C. Ushijima B. Paul V. J. (2019). Microbial community shifts associated with the ongoing stony coral tissue loss disease outbreak on the Florida Reef Tract. Front. Microbiol.10, 2244. doi: 10.3389/fmicb.2019.02244
40
Miller J. Muller E. Rogers C. Waara R. Atkinson A. Whelan K. et al . (2009). Coral disease following massive bleaching in 2005 causes 60% decline in coral cover on reefs in the US Virgin Islands. Coral Reefs28, 925–937. doi: 10.1007/s00338-009-0531-7
41
Miura N. Motone K. Takagi T. Aburaya S. Watanabe S. Aoki W. et al . (2019). Ruegeria sp. strains isolated from the reef-building coral Galaxea fascicularis inhibit growth of the temperature-dependent pathogen Vibrio coralliilyticus. Marine Biotechnol.21, 1–8. doi: 10.1007/s10126-018-9853-1
42
Moradi M. Magalhaes P. R. Peixoto R. S. Jonck C. C. François D. Bellot A. C. F. et al . (2023). Probiotics mitigate thermal stress-and pathogen-driven impacts on coral skeleton. Front. Marine Sci.10, 1212690. doi: 10.3389/fmars.2023.1212690
43
Mouragnon E. Lhuillier M. Dhome M. Dekeyser F. Sayd P. (2006). “Real time localization and 3d reconstruction,” in 2006 IEEE computer society conference on computer vision and pattern recognition (New York, NY, USA). doi: 10.1109/CVPR.2006.236
44
Muller E. M. Sartor C. Alcaraz N. I. Van Woesik R. (2020). Spatial epidemiology of the stony-coral-tissue-loss disease in Florida. Front. Marine Sci.7, 163. doi: 10.3389/fmars.2020.00163
45
Neely K. L. Lewis C. L. Lunz K. S. Kabay L. (2021). Rapid population decline of the pillar coral Dendrogyra cylindrus along the Florida Reef Tract. Front. Marine Sci.8, 434. doi: 10.3389/fmars.2021.656515
46
Neely K. L. Macaulay K. A. Hower E. K. Dobler M. A. (2020). Effectiveness of topical antibiotics in treating corals affected by Stony Coral Tissue Loss Disease. PeerJ8, e9289. doi: 10.7717/peerj.9289
47
Nistér D. (2004). An efficient solution to the five-point relative pose problem. IEEE Trans. Pattern Anal. Mach. Intell.26, 756–770. doi: 10.1109/TPAMI.2004.17
48
Palarea-Albaladejo J. Martín-Fernández J. A. (2015). zCompositions — R package for multivariate imputation of left-censored data under a compositional approach. Chemometrics Intelligent Lab. Syst.143, 85–96. doi: 10.1016/j.chemolab.2015.02.019
49
Papke E. Carreiro A. Dennison C. Deutsch J. M. Isma L. M. Meiling S. S. et al . (2024). Stony coral tissue loss disease: a review of emergence, impacts, etiology, diagnostics, and intervention. Front. Marine Sci.10, 1321271. doi: 10.3389/fmars.2023.1321271
50
Parada A. E. Needham D. M. Fuhrman J. A. (2016). Every base matters: assessing small subunit rRNA primers for marine microbiomes with mock communities, time series and global field samples. Environ. Microbiol.18, 1403–1414. doi: 10.1111/emi.2016.18.issue-5
51
Paulsen S. S. Strube M. L. Bech P. K. Gram L. Sonnenschein E. C. (2019). Marine chitinolytic Pseudoalteromonas represents an untapped reservoir of bioactive potential. mSystems4, 10.1128/msystems.00060–00019. doi: 10.1128/mSystems.00060-19
52
Precht W. F. Gintert B. E. Robbart M. L. Fura R. van Woesik R. (2016). Unprecedented disease-related coral mortality in Southeastern Florida. Sci. Rep.6, 1–11. doi: 10.1038/srep31374
53
R_Core_Team (2024). “R: A language and environment for statistical computing,” in R foundation for statistical computing(Vienna, Austria). Available at: https://www.R-project.org/ (Accessed July 1, 2024).
54
Reshef L. Koren O. Loya Y. Zilber-Rosenberg I. Rosenberg E. (2006). The coral probiotic hypothesis. Environ. Microbiol.8, 2068–2073. doi: 10.1111/j.1462-2920.2006.01148.x
55
Robbins S. J. Singleton C. M. Chan C. X. Messer L. F. Geers A. U. Ying H. et al . (2019). A genomic view of the reef-building coral Porites lutea and its microbial symbionts. Nat. Microbiol.4, 2090–2100. doi: 10.1038/s41564-019-0532-4
56
Rosado P. M. Leite D. C. Duarte G. A. Chaloub R. M. Jospin G. Nunes da Rocha U. et al . (2019). Marine probiotics: increasing coral resistance to bleaching through microbiome manipulation. ISME J.13, 921–936. doi: 10.1038/s41396-018-0323-6
57
Rosales S. M. Clark A. S. Huebner L. K. Ruzicka R. R. Muller E. M. (2020). Rhodobacterales and Rhizobiales are associated with stony coral tissue loss disease and its suspected sources of transmission. Front. Microbiol.11, 681. doi: 10.3389/fmicb.2020.00681
58
Rosales S. M. Huebner L. K. Clark A. S. McMinds R. Ruzicka R. R. Muller E. M. (2022). Bacterial metabolic potential and micro-eukaryotes enriched in stony coral tissue loss disease lesions. Front. Marine Sci.8, 776859. doi: 10.3389/fmars.2021.776859
59
Rosales S. M. Huebner L. K. Evans J. S. Apprill A. Baker A. C. Becker C. C. et al . (2023). A meta-analysis of the stony coral tissue loss disease microbiome finds key bacteria in unaffected and lesion tissue in diseased colonies. ISME Commun.3, 19. doi: 10.1038/s43705-023-00220-0
60
Santoro E. P. Borges R. M. Espinoza J. L. Freire M. Messias C. S. Villela H. D. et al . (2021). Coral microbiome manipulation elicits metabolic and genetic restructuring to mitigate heat stress and evade mortality. Sci. Adv.7, eabg3088. doi: 10.1126/sciadv.abg3088
61
Sharp W. C. Shea C. P. Maxwell K. E. Muller E. M. Hunt J. H. (2020). Evaluating the small-scale epidemiology of the stony-coral-tissue-loss-disease in the middle Florida Keys. PloS One15, e0241871. doi: 10.1371/journal.pone.0241871
62
Shilling E. N. Combs I. R. Voss J. D. (2021). Assessing the effectiveness of two intervention methods for stony coral tissue loss disease on Montastraea cavernosa. Sci. Rep.11 (1), 8566. doi: 10.1038/s41598-021-86926-4
63
Silva D. P. Villela H. D. Santos H. F. Duarte G. A. Ribeiro J. R. Ghizelini A. M. et al . (2021). Multi-domain probiotic consortium as an alternative to chemical remediation of oil spills at coral reefs and adjacent sites. Microbiome9, 118. doi: 10.1186/s40168-021-01041-w
64
Toth K. A. Buckley S. F. Noren H. Neely K. L. Walker B. K. (2024). Broadscale coral disease interventions elicit efficiencies in endemic disease response. Front. Marine Sci.10, 1302697. doi: 10.3389/fmars.2023.1302697
65
Ushijima B. Gunasekera S. P. Meyer J. L. Tittl J. Pitts K. A. Thompson S. et al . (2023). Chemical and genomic characterization of a potential probiotic treatment for stony coral tissue loss disease. Commun. Biol.6, 248. doi: 10.1038/s42003-023-04590-y
66
Ushijima B. Meyer J. L. Thompson S. Pitts K. Marusich M. F. Tittl J. et al . (2020). Disease diagnostics and potential coinfections by Vibrio coralliilyticus during an ongoing coral disease outbreak in Florida. Front. Microbiol.11, 569354. doi: 10.3389/fmicb.2020.569354
67
Walker B. K. Riegl B. Dodge R. E. (2008). Mapping coral reef habitats in southeast Florida using a combined technique approach. J. Coastal Res.24, 1138–1150. doi: 10.2112/06-0809.1
68
Walker B. K. Turner N. R. Noren H. K. Buckley S. F. Pitts K. A. (2021). Optimizing stony coral tissue loss disease (SCTLD) intervention treatments on Montastraea cavernosa in an endemic zone. Front. Marine Sci.8, 666224. doi: 10.3389/fmars.2021.666224
69
Walton C. J. Hayes N. K. Gilliam D. S. (2018). Impacts of a regional, multi-year, multi-species coral disease outbreak in Southeast Florida. Front. Marine Sci.5, 323. doi: 10.3389/fmars.2018.00323
70
Wang J. Li P. Di X. Lu H. Wei H. Zhi S. et al . (2024). Phylogenomic analysis uncovers an unexpected capacity for the biosynthesis of secondary metabolites in Pseudoalteromonas. Eur. J. Medicinal Chem.279, 116840. doi: 10.1016/j.ejmech.2024.116840
71
Wickham H. (2016). ggplot2: Elegant Graphics for Data Analysis 2nd edn. (Springer, Switzerland). doi: 10.1007/978-3-319-24277-4
72
Work T. M. Weatherby T. M. Landsberg J. H. Kiryu Y. Cook S. M. Peters E. C. (2021). Viral-like particles are associated with endosymbiont pathology in Florida corals affected by stony coral tissue loss disease. Front. Marine Sci.8, 750658. doi: 10.3389/fmars.2021.750658
73
Xu M. Cai Z. Cheng K. Chen G. Zhou J. (2024). Mitigation of Vibrio coralliilyticus -induced coral bleaching through bacterial dysbiosis prevention by Ruegeria profundi. Appl. Environ. Microbiol.90 (4), e0227423. doi: 10.1128/aem.02274-23
74
Xu S. Chen M. Feng T. Zhan L. Zhou L. Yu G. (2021). Use ggbreak to effectively utilize plotting space to deal with large datasets and outliers. Frontiers in Genetics. 12774846. doi: 10.3389/fgene.2021.774846
75
Yilmaz P. Parfrey L. W. Yarza P. Gerken J. Pruesse E. Quast C. et al . (2013). The SILVA and “All-species Living Tree Project (LTP)” taxonomic frameworks. Nucleic Acids Res.42, D643–D648. doi: 10.1093/nar/gkt1209
76
Yoshikawa K. Takadera T. Adachi K. Nishijima M. Sanc H. (1997). Korormicin, a novel antibiotic specifically active against marine gram-negative bacteria, produced by a marine bacterium. J. antibiotics50, 949–953. doi: 10.7164/antibiotics.50.949
77
Zaneveld J. R. McMinds R. Vega Thurber R. (2017). Stress and stability: applying the Anna Karenina principle to animal microbiomes. Nat. Microbiol.2, 1–8. doi: 10.1038/nmicrobiol.2017.121
78
Zhang Y. Yang Q. Ling J. Long L. Huang H. Yin J. et al . (2021). Shifting the microbiome of a coral holobiont and improving host physiology by inoculation with a potentially beneficial bacterial consortium. BMC Microbiol.21, 1–14. doi: 10.1186/s12866-021-02167-5
Summary
Keywords
probiotics, McH1-7, SCTLD, Montastraea cavernosa , coral microbiome
Citation
Pitts KA, Scheuermann M, Lefcheck JS, Ushijima B, Danek N, McDonald EM, Milanese AR, Schul MD, Meyer JL, Toth KA, Ferris Z, De La Flor YT, DeMarco T, Noren HKG, Walker BK and Paul VJ (2025) Evaluating the effectiveness of field-based probiotic treatments for stony coral tissue loss disease in southeast Florida, USA. Front. Mar. Sci. 12:1480966. doi: 10.3389/fmars.2025.1480966
Received
14 August 2024
Accepted
17 April 2025
Published
05 June 2025
Volume
12 - 2025
Edited by
Kshitij Tandon, The University of Melbourne, Australia
Reviewed by
Abigail S. Clark, Boy Scouts of America - Florida Sea Base: Brinton Environmental Center, United States
Ya-fan Chan, Soochow University, Taiwan
Talisa Doering, The University of Melbourne, Australia
Updates
Copyright
© 2025 Pitts, Scheuermann, Lefcheck, Ushijima, Danek, McDonald, Milanese, Schul, Meyer, Toth, Ferris, De La Flor, DeMarco, Noren, Walker and Paul.
This is an open-access article distributed under the terms of the Creative Commons Attribution License (CC BY). The use, distribution or reproduction in other forums is permitted, provided the original author(s) and the copyright owner(s) are credited and that the original publication in this journal is cited, in accordance with accepted academic practice. No use, distribution or reproduction is permitted which does not comply with these terms.
*Correspondence: Kelly A. Pitts, pittsakelly@gmail.com; Valerie J. Paul, paul@si.edu
Disclaimer
All claims expressed in this article are solely those of the authors and do not necessarily represent those of their affiliated organizations, or those of the publisher, the editors and the reviewers. Any product that may be evaluated in this article or claim that may be made by its manufacturer is not guaranteed or endorsed by the publisher.