Abstract
A giant Arctic subsea permafrost reservoir of methane (CH4) in different forms (hydrates, free gas) is leaking, likely at an increasing rate under climate warming. This is causing a massive CH4 release from sediments into the water column and atmosphere. A part of the released CH4 is oxidized in the water column to CO2. In this work we applied a model for analyzing of consequences for the water column carbonate system of excessive production of CO2 during the aerobic oxidation of CH4 in an area of its intensive seeping in the East Siberian Arctic Shelf (ESAS). The model system comprised a 2-Dimensional vertical Benthic Pelagic transport Model 2DBP, principal biogeochemistry and carbonate system modules from the biogeochemical model BROM (Bottom RedOx Model), and a gas bubble fate module that parameterizes bubbles rising and dissolution. The simulations showed that consumption of oxygen and production of carbon dioxide via aerobic oxidation of methane results in spatial anomalies of pH and dissolved oxygen concentration that are consistent with the field observations. We hypothesize that aerobic oxidation of methane in the regions of intensive seeping leads to production of CO2, with associated decrease of pH and lowering of aragonite saturation to less than 1, therefore contributing to the extreme acidification states that are observed on the East Siberian Arctic Shelf.
1 Introduction
The Arctic is warming almost four times faster than the global average (Rantanen et al., 2022). This results in increasing river runoff (Savelieva et al., 2000; Wang et al., 2021), declining sea ice coverage (Notz and Stroeve, 2016), and thawing terrestrial and subsea permafrost, which represents a large vulnerable reservoir of ancient organic carbon (Shakhova et al., 2010b; Vonk et al., 2012b). Increasing river discharge (Peterson et al., 2002; Zhang et al., 2021) and coastal erosion (Vonk et al., 2012b) are also enhancing transport of terrigenous organic carbon from the land to the coastal Arctic waters (Gustafsson et al., 2011; Semiletov et al., 2011, 2012; Wild et al., 2019). This organic carbon (OC) can be buried in the coastal sediments, transported to the deeper Arctic Ocean basins, or degraded (Bröder et al., 2019, 2016; Martens et al., 2022; Semiletov et al., 2016), thereby strongly affecting biogeochemistry of the pelagic-benthic system, first by production of excessive amounts of CO2. Oxidation of freshly eroded OC can cause extreme CO2 oversaturation in nearshore parts of the ESAS, although this effect is decreasing toward the outer shelf (Semiletov and Pipko, 2007).
It has been discovered that the permafrost under the ESAS, long thought to be an impermeable barrier sealing in CH4, is perforated and is starting to leak large amounts of methane into the water column and atmosphere (Shakhova et al., 2010b, c). The amount of methane currently coming out of the East Siberian Arctic Shelf is significantly exceeding the amount coming out of the entire world’s oceans (Shakhova et al., 2015). CH4 release to the water column could result from modern methanogenesis and/or could originate from seabed deposits (that is, accumulations of pre-formed CH4, preserved as free gas and/or hydrates) (Hovland et al., 1993; Judd et al., 2002). CH4 produced within marine sediment and accumulated in the pore water as dissolved CH4 usually does not reach the water column because it is oxidized in the sulfate reduction zone; this does not apply to CH4 released as bubbles, because the biogeochemical filter is only effective on dissolved CH4 (Reeburgh, 2007). Our observations and incubation experiment findings point to other sources than microbial degradation of thawing subsea permafrost as the main drivers of the high CH4 emissions in the study area (Sapart et al., 2017; Shakhova et al., 2010b; Wild et al., 2022).
Methane can be stored in the seabed as methane gas or methane hydrates and then released as subsea permafrost thaws. These releases can be larger and more abrupt than those resulting from the decomposition of old organic carbon. Release of even a fraction of the CH4 methane stored in the shelf could trigger abrupt climate warming (Shakhova et al., 2010a; Whiteman et al., 2013). Because the water column on the ESAS is very shallow (mean depth approx. 50 m), it provides a very short path for bubble-transported CH4 to escape to the atmosphere. However, in deeper waters, a significant fraction of bubbles will dissolve and remain in the water column (Shakhova et al., 2015). The turnover time of dissolved CH4 depends on its oxidation by methanotrophic bacteria and is estimated to range from 1 to 43 days in the waters of the Lena Delta (Osudar et al., 2016) (Osudar et al., 2016), and from 300 to 1000 days in the Laptev Sea region of the ESAS (Shakhova et al., 2015). As the residence time of seawater on the ESAS shelf could be shorter than the turnover time of dissolved CH4, it could be transported laterally to other parts of the Arctic Ocean (AO). Therefore, it is important to elucidate the fate of dissolved CH4 in the ESAS.
The degrading subsea permafrost leads to formation of spots with massive bubbling CH4 release, that can be oxidized in the upper sediments and in the water column to CO2. This process leads to the lowering of pH and can also contribute to the formation of the “extreme” aragonite undersaturation observed in the region with present day (2016) values of significantly less than 1 in the Laptev and East Siberian Seas (Semiletov et al., 2016). This reflects seawater acidity levels much higher than those projected in this region for the end of this century by IPCC (AR5); those estimates are currently based only on atmospheric CO2 and not yet considering inclusion of degradation of terrestrial organic matter and oxidation of seeping methane (Semiletov et al., 2016).
We hypothesize that the observed extreme states of the carbonate system can be explained by an excessive production of carbon dioxide driven by oxidation of eroded terrestrial OC, plus an additional effect of methane oxidation in the areas of intensive seeping. The latter process may play an increasing role on the outer ESAS where massive CH4 ebullition has been observed for many years, and the signal of eroded OC oxidation is weakening (Semiletov and Pipko, 2007; Shakhova et al., 2015).
While the fate of terrestrial organic carbon on the ESAS has been studied since the 1990s (Gustafsson et al., 2011; Semiletov et al., 2016; Semiletov, 1999; Semiletov et al., 2011; Vonk et al., 2012a), the fate of carbon originated from methane oxidation remains under debate (Shakhova et al., 2015). The goal of this study is to apply a model for analyzing of consequences for the water column carbonate system of excessive production of CO2 during the aerobic oxidation of methane (Chan et al., 2019) in an area of intensive seeping. The model results are here also compared with comprehensive measurements from the ESAS. This process-oriented modeling aims to provide in-depth understanding of the transformation of carbon released from methane seeps.
2 Methods
2.1 Biogeochemical model
Here we use biogeochemical modules of the Bottom RedOx Model BROM (Yakushev et al., 2017) coupled with a vertical 2 Dimensional Benthic-Pelagic Model 2DBP (Figure 1), that considers processes occurring in the water column, benthic boundary layer (BBL), and sediments together (Yakushev et al., 2020).
Figure 1
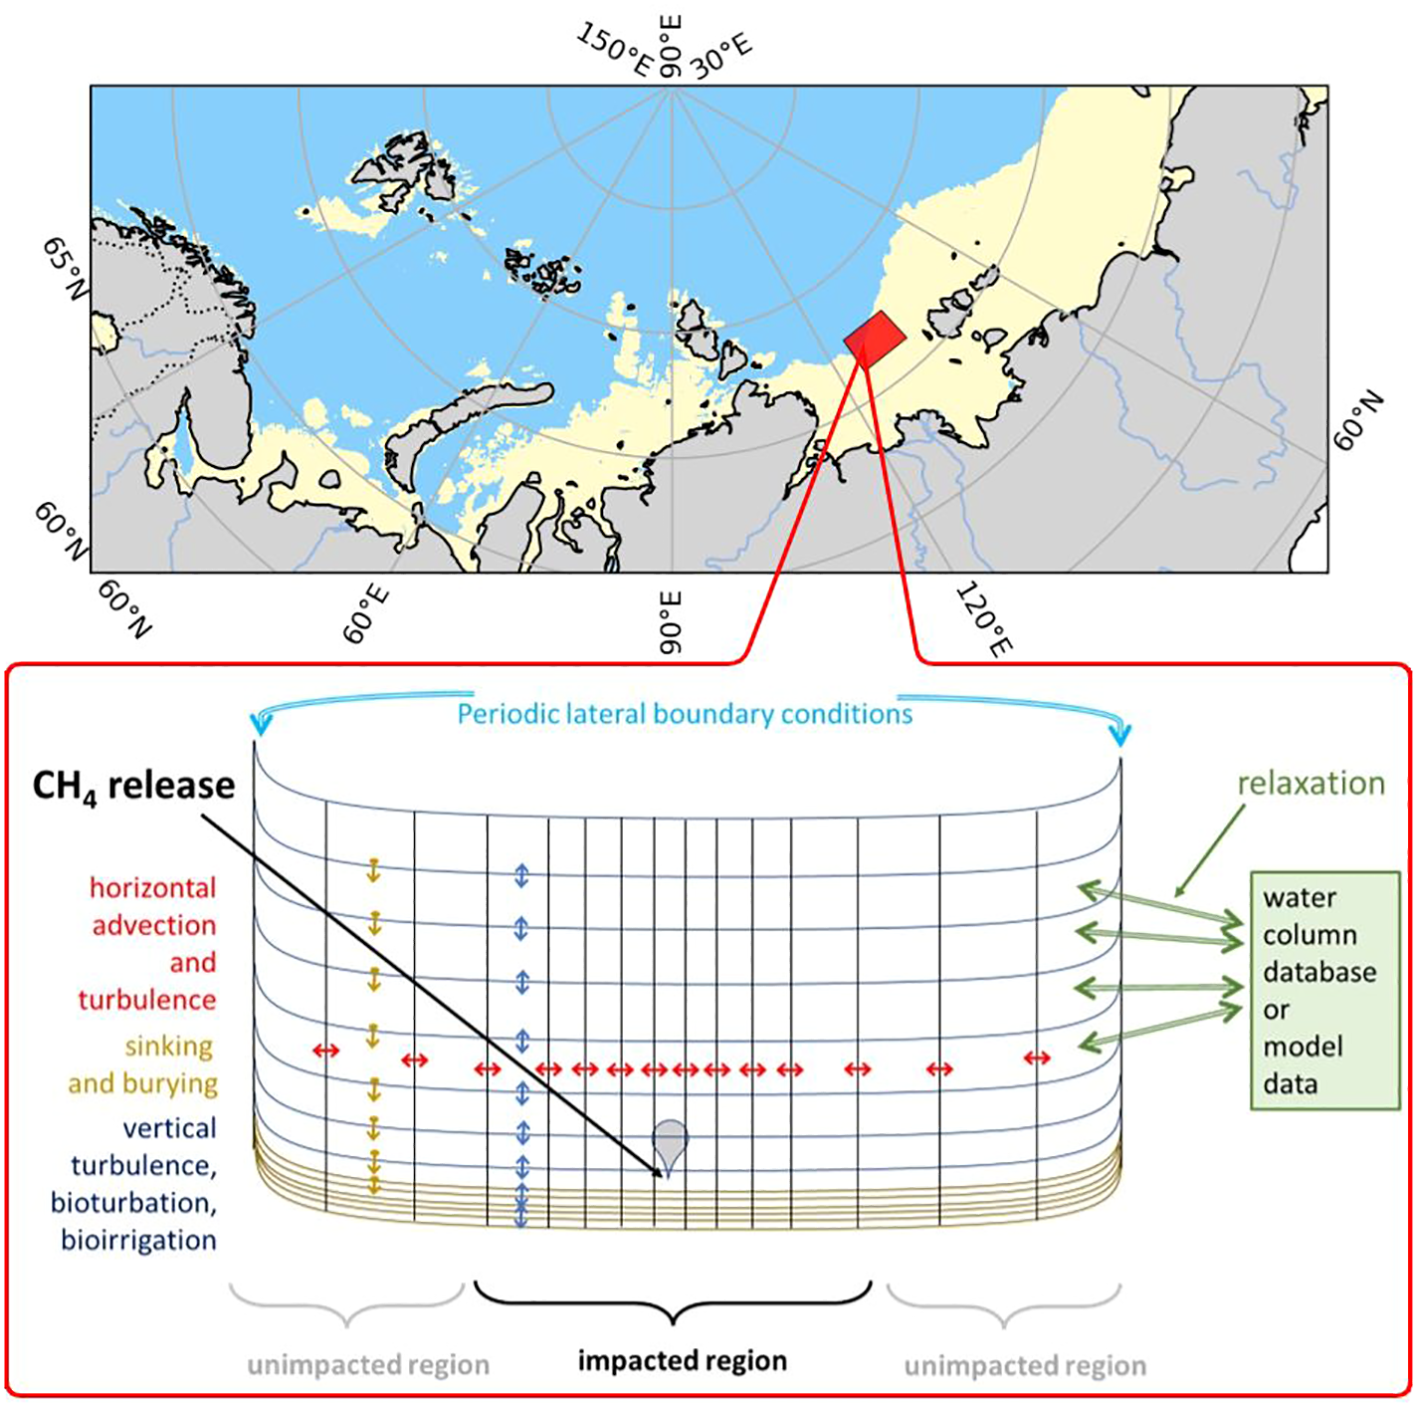
The East Siberian Arctic Shelf (ESAS) region with depths less than 100 m is shown in yellow, and the P1 polygon with methane seeps is marked in red. Bottom: Schematic of the 2-Dimensional Benthic-Pelagic Model (2DBP), with a CH4 seep located at the center of the transect. The lines represent the positions of the model grids, with coarser resolution in the water column and finer resolution in the sediments. The considered transport processes are schematically illustrated with arrows.
The BROM-C module for carbon transformation describes processes in the carbonate system allowing calculation of pH and carbonates saturation states, and rates of formation and dissolution of carbonates (Figure 2). It also parameterizes methanogenesis and both aerobic and anaerobic methane oxidation. The detailed description is given in (Yakushev et al., 2017). To describe the background biogeochemical processes of seasonal formation and decay of organic matter we used the biogeochemical module OxyDep considering transformation of nitrogen between inorganic nitrogen (NUT), phytoplankton (PHY), heterotrophs (HET), dissolved organic matter (DOM), particulate organic matter (POM) and changes in dissolved oxygen content (OXY) (Berezina et al., 2021) (Figure 2). The gas bubble fate module Yakushev et al. (2021) parameterizes bubbles rising and dissolution (see Supporting Material).
Figure 2
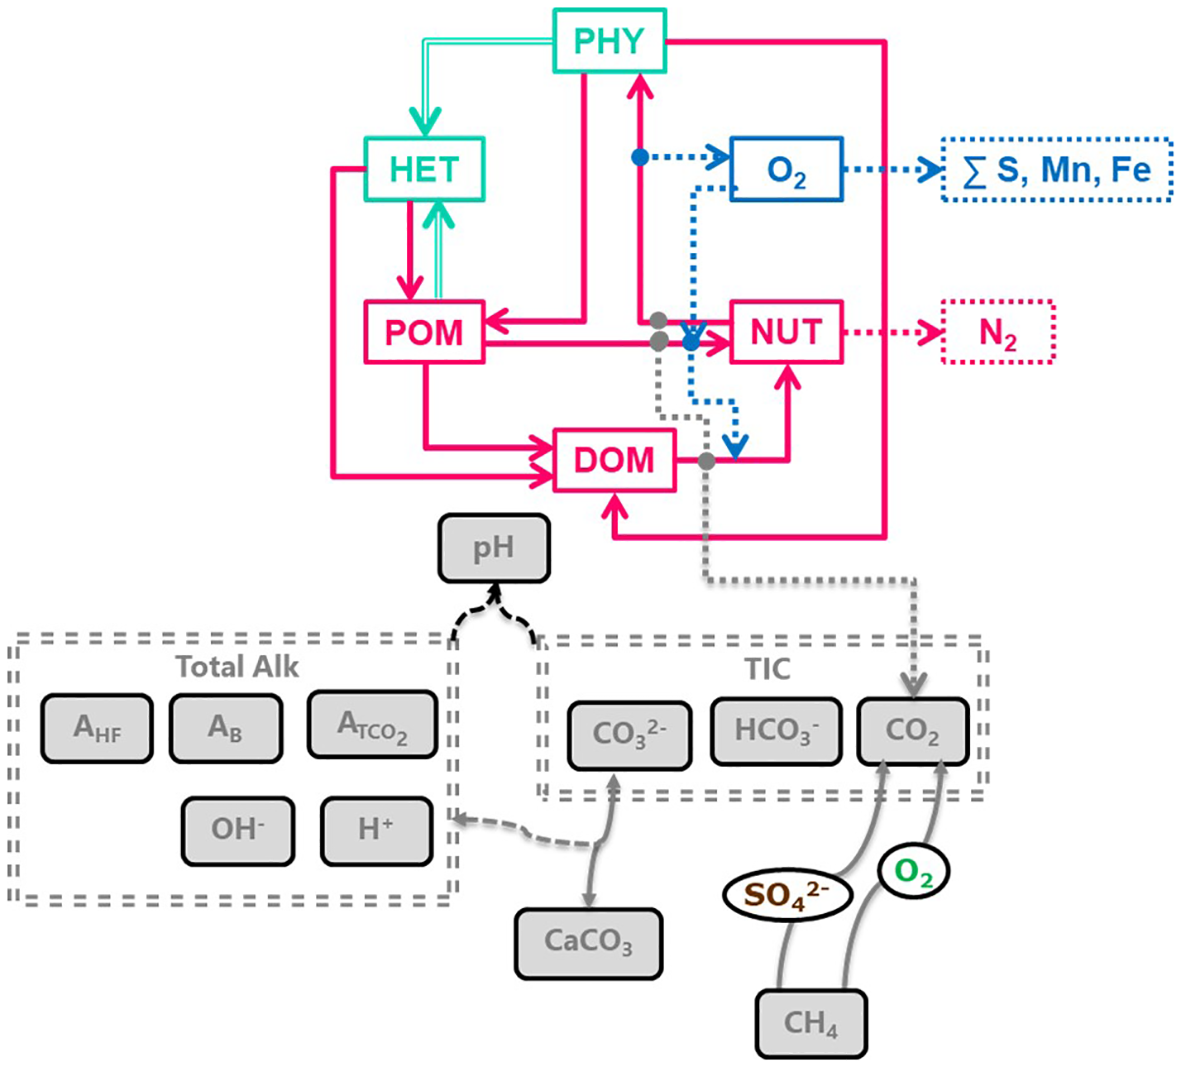
Flow chart of the biogeochemical processes represented in OxyDep, illustrating matter transformation (top), and the BROM-C modeling module used for parameterizing methane oxidation and calculating carbonate system equilibration (bottom).
These modules were integrated into an existing modular platform [Framework for Aquatic Biogeochemical Modelling, FABM; (Bruggeman and Bolding, 2014)], that couples together the transport driver 2DBP, BROM’s biogeochemical blocks, and the bubble fate module.
The superiority of this model lies in its ability to simulate the transport of CH4 in both gaseous and dissolved forms, its dissolution and oxidation, as well as the transformation of carbon-containing compounds through chemical processes (e.g., carbonate system equilibration) and biogeochemical processes (e.g., those related to the synthesis and decay of organic matter).
2.2 Transport model
In our studies, the transport model 2DBP represents a 20 km transect with a seep at the center. The transect is positioned in the central part of the Laptev Sea in a region with seep fields characterized by massive CH4 ebullition [Polygon P1, from (Shakhova et al., 2015)]. 2DBP was forced by model outputs for the seasonal variability of temperature, salinity, ice cover changes, vertical turbulence, irradiance and current velocity from a ROMS-20 km model (Shchepetkin and McWilliams, 2005) applied for the Arctic Ocean (Ommundsen et al., 2008).
The horizontal spatial resolution of 2DBP was 25 m in the center of the transect and increased toward the peripherical parts to 500 m. Vertical resolution of 2DBP was the same as of ROMS (40 grid points for 50 m depth) in the water column and decreased in the limits of 50 cm BBL from 13 to 6 cm and then increased in the upper sediments from 0.5 mm to 2 cm.
2.3 Methane seeping parameterization
After 200 spin-up years with repeated seasonal variations in temperature, salinity, ice cover, vertical turbulence, irradiance, and current velocity, a stable seasonal pattern of biogeochemical characteristics was achieved. This was used as an initial condition for the seeping experiment, with seepage occurring in a 25 m x 25 m area in the center of the transect (Figure 3). Methane release in bubbles was parameterized at 50 cm above the sediment at the upper boundary of the BBL. The flux of methane through the sediment in the release area was not considered, because in reality the bubbles are released through narrow channels but are not “filtered” through the sediment (Sapart et al., 2017; Shakhova et al., 2015; Wild et al., 2022, 2023).
Figure 3
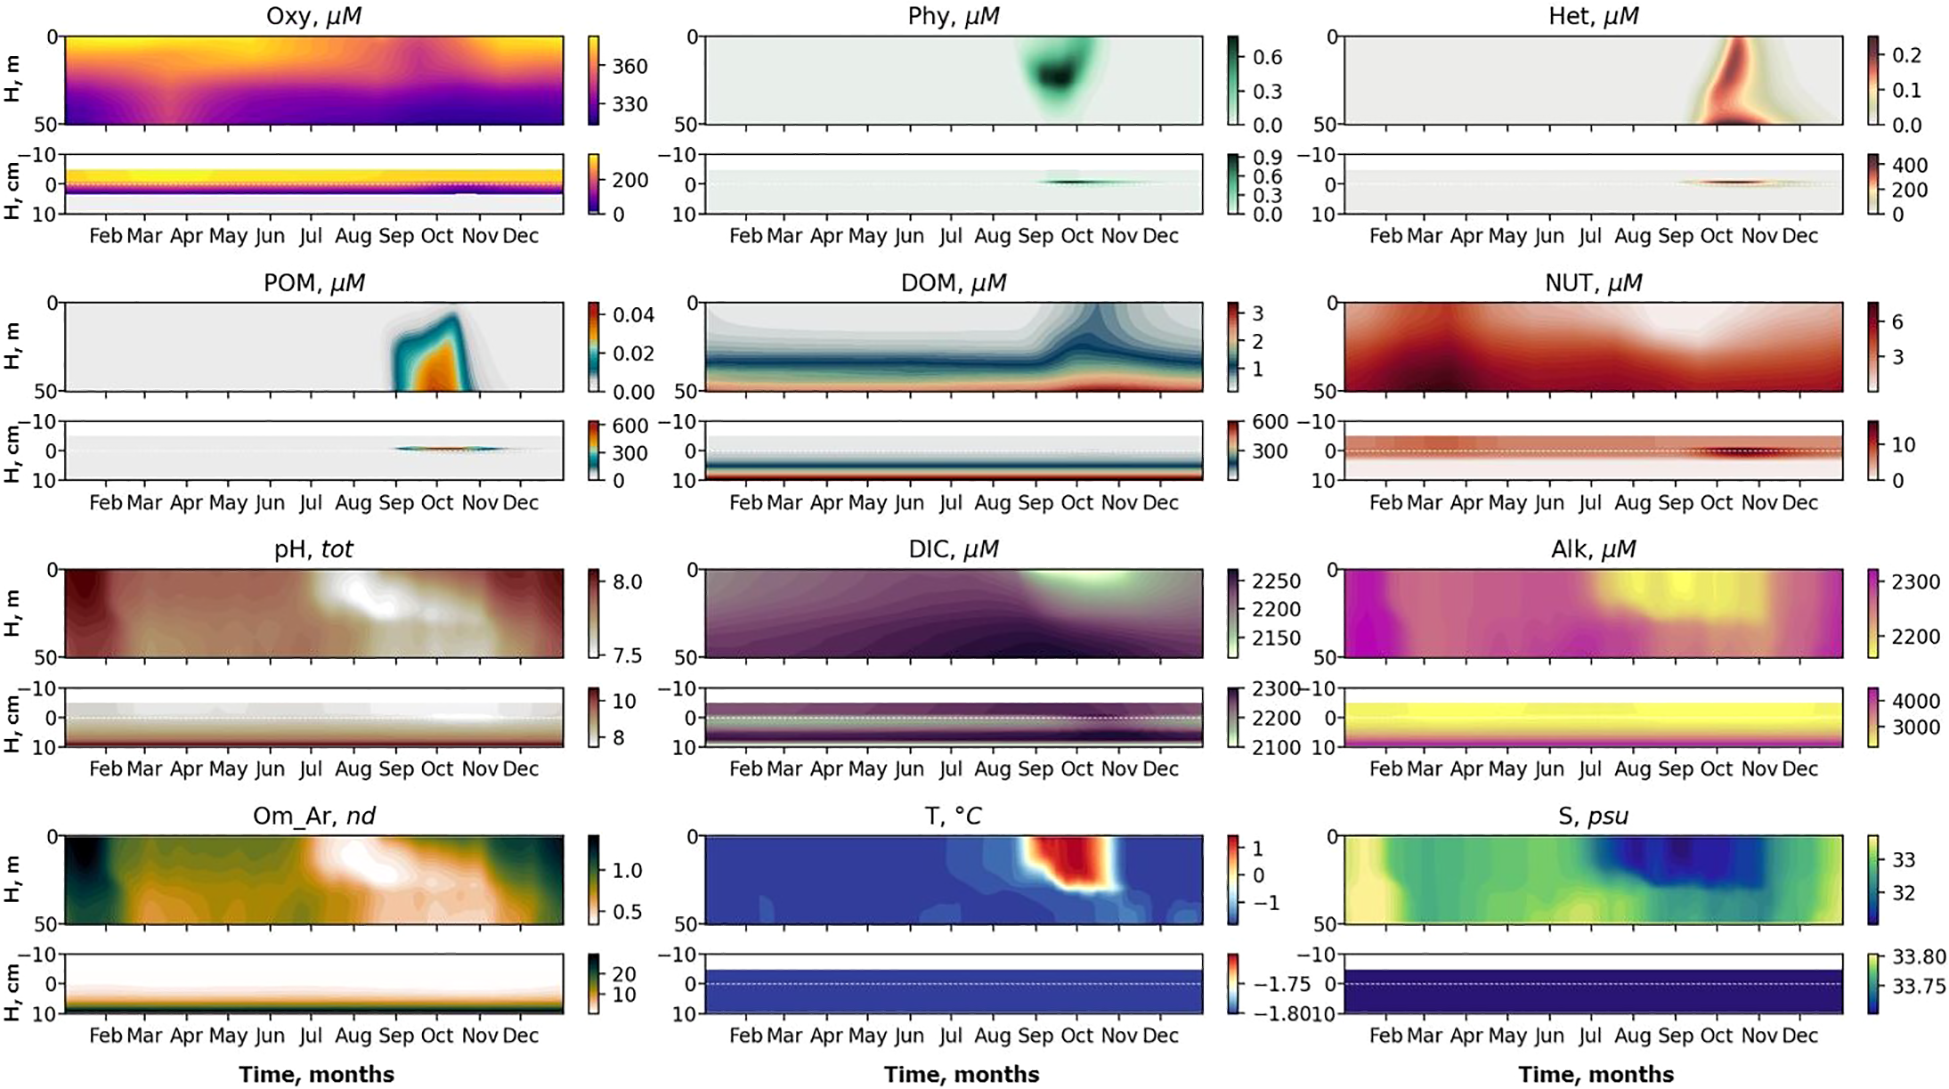
Seasonal variability of basic biogeochemical variables: Dissolved oxygen (Oxy), phytoplankton (Phy), zooplankton (Het), particulate organic matter (POM), dissolved organic matter (DOM) and nutrient (NUT), pH, Dissolved Inorganic Carbon (DIC), Alkalinity (Alk), aragonite saturation state (Om Ar), temperature (T) and salinity (S) in the water column from the surface to 50 m (upper panels) and at the sediment water interface (SWI) from 5 cm above the sediments to 10 cm in the sediments (lower panels). The x-axis shows months and the y-axis shows depth.
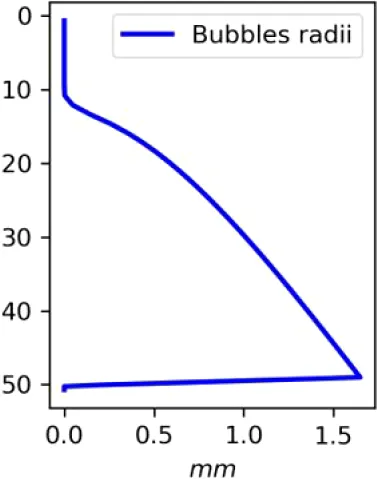
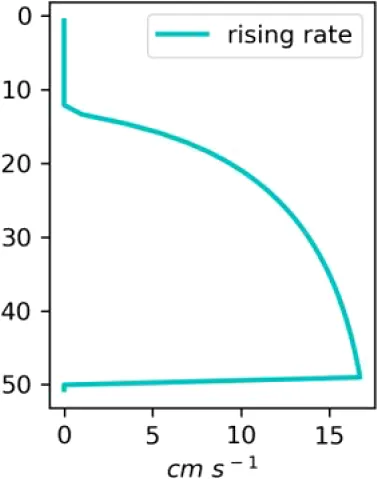
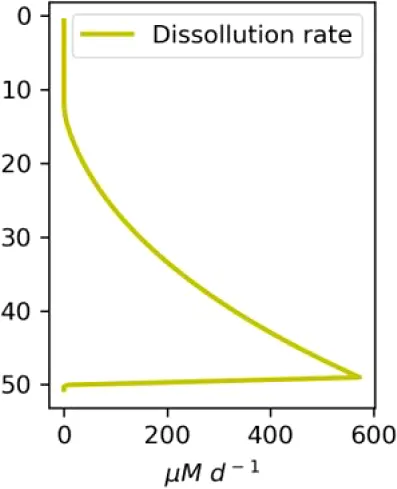
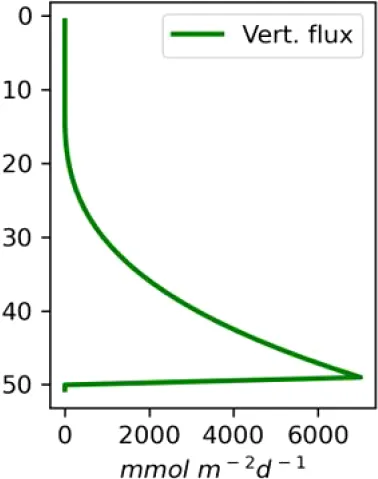
Existing estimates of methane release are in the range 30–170 g m−2d−1 or 2500–15000 mM m−2d−1 (Chernykh et al., 2023; Shakhova et al., 2019, 2015). Here we made numerical experiments for a moderate seeping (MS) scenario of 3600 mM m−2d−1 CH4 and an intensive seeping scenario of 20000 mM m−2d−1 CH4, consistent with predicted (Shakhova et al., 2010a) and observed flux estimates (see also references in Table 1). We assumed that the seepage produces a constant number of bubbles with the same initial diameter, which are transported and dissolved according to the single-bubble dissolution model described in the Supplementary Material.
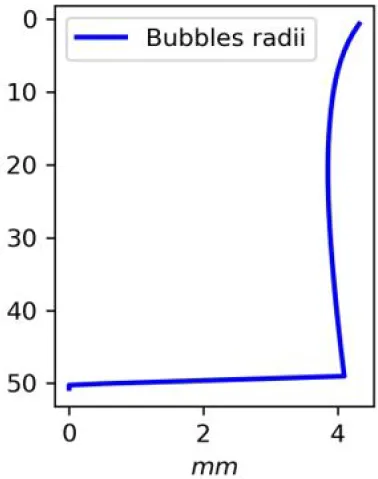
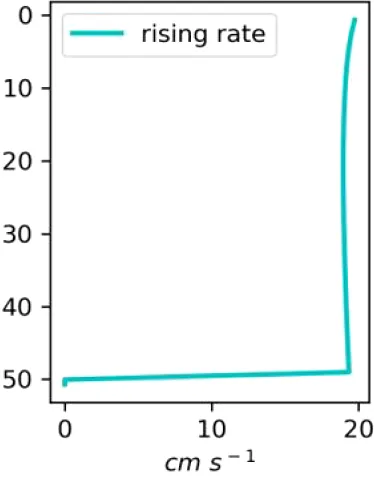
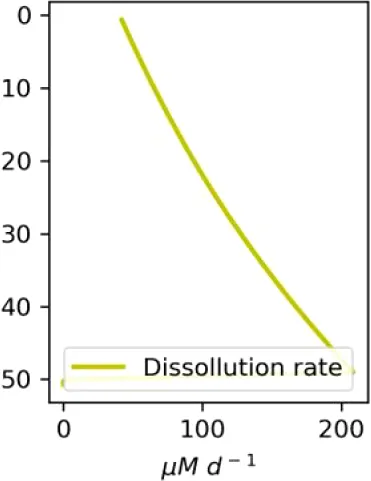
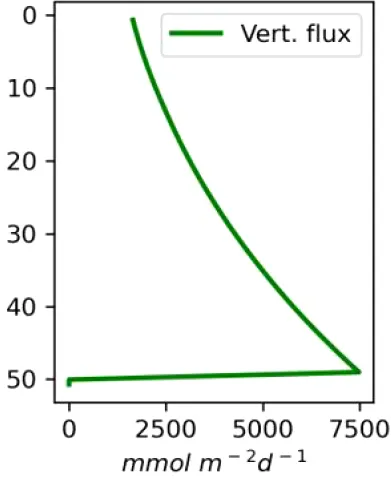
Table 1
| Estimates and Scenarios | Concentration of CH4 in bubbles only | CH4 bubbles radii | Bubbles rising speed | Bubbles dissolution rate | Vertical flux of CH4 | Concentration of CH4 dissolved and in bubbles |
|---|---|---|---|---|---|---|
| Existing estimates | surface: 1.9–651 nM abottom: 500–600 nM a | 2–5 mm b | 10–40 cm/s b | surface: 116–5240 mM m-2d-1a 100 kg m-2d-1dbottom: 2500–15000 mM m-2d-1 (30–176 g CH4 m-2d-1)c | surface: 1.9–651 nM a, 18–26 nM dbottom: 500–600 nM a, 30 µM e | |
| A (MS, medium bubbles) |
|
|
|
|
|
|
| B (IS, large bubbles) |
|
|
|
|
|
|
| C (MS, small bubbles) |
|
|
|
|
|
|
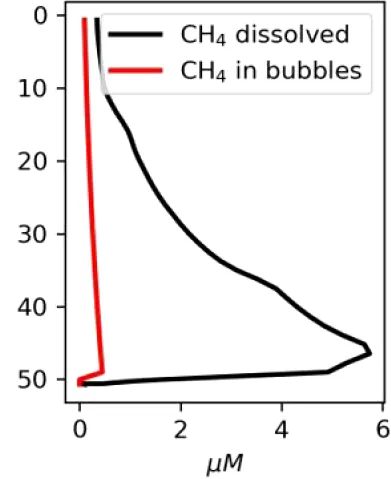
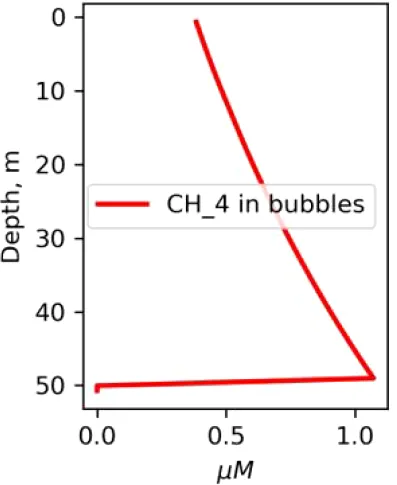
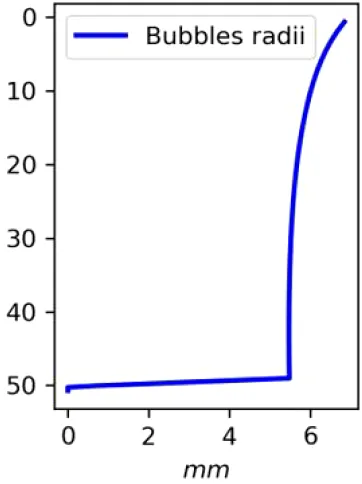
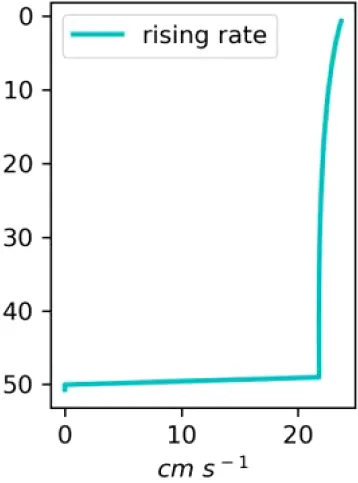
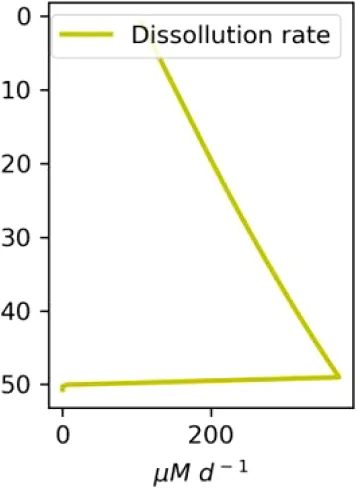
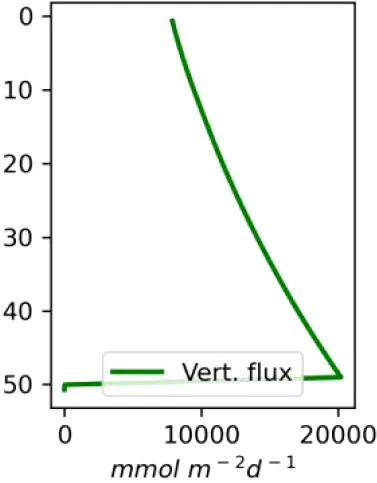
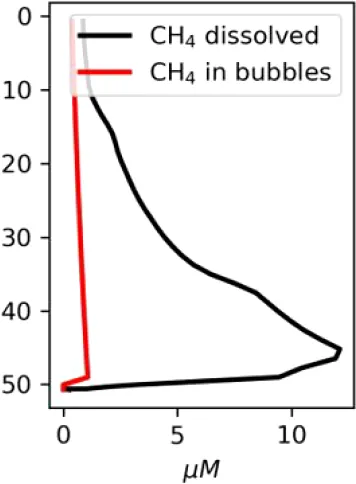
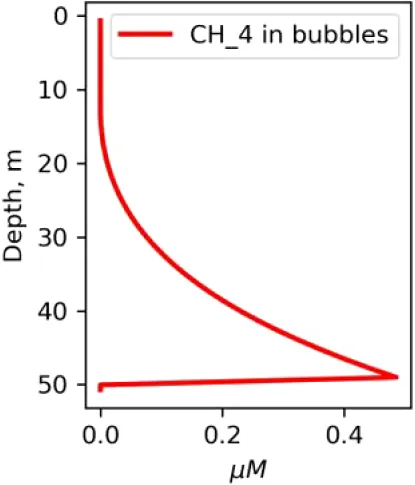
Vertical distributions of methane in bubbles, bubble radii, rising speed, bubble dissolution rate, vertical flux of methane in bubbles, and concentrations of methane in bubbles and dissolved methane for scenarios of methane bubbles ebullition: A — moderate seeping, MS: bottom flux 7200 mM m−2d−1, initial bubble radii 4 mm, B — intensive seeping, IS: bottom flux 20000 mM m−2d−1, initial bubble radii 5.5 mm, C — MS with smaller bubbles, bottom flux 7200 mM m−2d −1, initial bubble radii 1.6 mm.
a (Shakhova et al., 2010c); b(Shakhova et al., 2014); c(Shakhova et al., 2015); d(Semiletov, 2024, pers. comm.).
2.4 Methane oxidation parameterization
In the model we parameterize aerobic methane oxidation, a microbially-mediated process, that is generally described with an equation (Chan et al., 2019):
It is widely assumed that the oxidation of CH4 in the water column follows first-order kinetics (Kitidis et al., 2010; Wåhlström and Meier, 2014), and there exist estimates of the rates of aerobic methane oxidation in the sea water determined using different techniques for different concentrations of methane and for different oceanic regions. Most of the estimated CH4 oxidation rates fall into the range 0.001–10 nM d−1, and CH4 oxidation activity increases in ocean environments with high CH4 concentrations (Mau et al., 2013). The CH4 oxidation fluxes for the outer ESAS regions measured with a C3H4 radiotracer following the procedure of (Sandbeck and Reeburgh, 1989) were low, about 0.1 ± 0.13 nM d−1, corresponding to rates 0.001–0.003 d−1 (Shakhova et al., 2015). Higher rate estimates were obtained by (Mau et al., 2013) for Arctic water in a Spitzbergen fjord: 0.01–0.08 d−1 (using 3H-CH4) and 0.001–0.1 d−1 (using 14C-CH4). Bussmann et al. (2017) found that CH4 oxidation rates varied between riverine (0.011 d−1), mixed (0.006 d−1), and polar (0.028 d−1) waters of the Laptev Sea. Incubation studies in the deep Gulf of Mexico obtained sometimes higher CH4 oxidation rates: 0.2 ± 0.1 d−1 (Chan et al., 2019), 0.0001–0.200 d−1 (Kessler et al., 2011), 0.0001–0.425 d−1 (Crespo-Medina et al., 2014; Weinstein et al., 2016) estimated rates 0.012–0.13 d−1 at different depths of the Hudson Canyon.
In this model, the specific oxidation rate of CH4 by O2 was set to kCH4 =0.01 d−1, which lies in the midrange of estimated oxidation rates. Fluxes through the sea surface for the gases (oxygen, carbon dioxide, methane) were parametrized as bubble-mediated air-sea gas exchange (see Supplementary Material 2). The influence of ice was considered as a restriction on the flux scaling with its fractional coverage of the sea surface.
3 Results
3.1 Baseline biogeochemical seasonal variability
The simulated seasonal variability after 200 years spin-up reflects the basic features of biogeochemical seasonality in the water column in this region (Figure 3). An intensive phytoplankton bloom starts after the ice melts in August followed by zooplankton growth and increasing concentrations of particulate and dissolved organic matter (POM, DOM). Maximum concentrations of phytoplankton (Phy) reach 0.7 µM N at depth 25 m; this suggests a maximum Chl a concentration of ca. 2 mg/m3 (assuming a Redfield molar ratio of C:N = 106/16 and a typical low-light-adapted C:Chl ratio of 30 gC/gChla; (Cloern et al., 1995), which is consistent with observed values of 1–2 mg/m3 for the Laptev Sea in September 2008 (Polyakova et al., 2021). Zooplankton (Het) increases to ∼0.2 µM N, roughly uniform over the 50 m column depth; this corresponds to ∼2 g dw/m2 [assuming Redfield C:N and carbon 42% of dry weight (Beers, 1966)] which is consistent with values 0.1-1.5 g dw/m2 observed on the Laptev Sea shelf during autumn 1993 (Kosobokova et al., 1997). Concentrations of POM and DOM increase after the bloom to 0.1 µM N and 3.5 µM N respectively. Concentrations of NUT (i.e. nitrate and nitrite) are exhausted during the phytoplankton bloom and restored to maximum concentrations of ∼7 µM N in winter. The water column is well oxygenated. Dissolved oxygen has highest concentrations in winter (about 380 µM) and lowest in the bottom layer in summer after the bloom, when oxygen is consumed by decomposition of organic matter (310 µM). These features generally corresponds to the observed changed of the distributions in the Laptev Sea in the ice free period from August to November analyzed in (Xie et al., 2023). Simulated baseline changes of pH (total scale) show reasonable seasonal variability for pH, it varies from 7.9 in January to 7.4 in August. pH decreases during the summer period due to influx of low salinity and low alkalinity riverine water, and increases weakly during the phytoplankton bloom. Aragonite saturation state varies from 2.05 in January to 0.8 in August. DIC is around 2300 µM C during spring and summer and starts to decrease at the end of August to 2100 µM in October, due to phytoplankton uptake, then gradually increases to 2200 µM at the end of November, due to DOM decomposition (Figure 3). Generally, the surface water of this region is strongly affected by river discharge; the surface layer with high salinity and alkalinity is replaced by a low alkalinity plume water during the warm season, and alkalinity increases again in November (Figure 3). Note however that the seepage area modeled in this study lies outside the area of extreme acidification impacted by export of eroded carbon and very strong river influence (Semiletov et al., 2016).
To summarize the statistical characteristics for the intercomparison between the model and the ensemble means values of the observed data collected in 2015–2020 (Xie et al., 2023), we use the cost function based method as described in (Eilola et al., 2011). The cost function C is computed for the model as follows:
Here, the mean bias (M − D) of the model means (M) relative to the mean of observations (D) is normalized by the standard deviation (SD) of the observations. The cost function for the bias of the ensemble mean is calculated similarly. The cost function value is determined separately for each variable (salinity, temperature, oxygen, nutrients, pH and alkalinity) at each station and depth. The following ranges are used for interpreting C: 0 ≤ C < 1 (good), 1 ≤ C < 2 (reasonable), and 2 ≤ C (poor).
Overall, nutrients, alkalinity, and pH are modeled well with good accuracy (NUT = 0.69, Alk = 0.92, pH = 0.51). Oxygen and salinity have reasonable accuracy (Oxy = 1.16, S = 1.86), suggesting some room for improvement in modeling these variables. The poor accuracy of the temperature model (T = 2.68) can be potentially linked to the observations being taken during anomalously warm years 2019 and 2020, in the Laptev Sea. These years were characterized by higher than average temperatures, which might not have been adequately represented in the historical data used to develop the model.
Vertical distributions of the modeled and observed characteristics are shown in Supplementary Figure S2 in Supplementary Material.
3.2 Seeping impacts on methane in the water column
Starting from the model’s date 01.01.2012, bubble methane ebullition was parameterized in the center of the transect with a constant intensity of the mentioned above either 3600 mM CH4 m−2d−1 [moderate seeping (MS) scenario] or 20000 mM CH4 m−2d−1 [intensive seeping (IS) scenario].
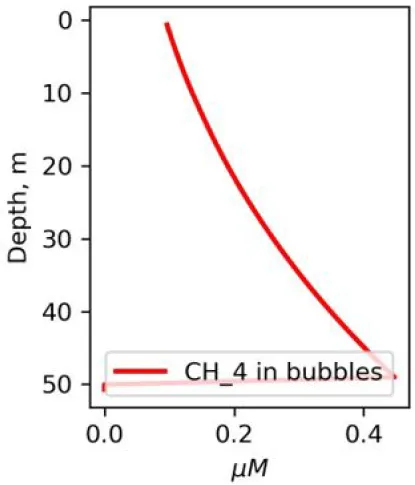
Depending on the initial methane flux and bubble radii, bubble dissolution takes place at different depths with different intensity. Calculated vertical distributions above the seep of methane in bubbles, bubble radii, rising rate, its vertical flux and dissolved methane are shown in Table 1. We see that the shapes of these distributions are sensitive to initial bubble diameter. As bubbles ascend from the bottom, their radii decrease due to dissolution but increase in response to the reduced pressure in the upper layers. The model shows that larger bubbles rise faster and dissolve more slowly, causing their radii to grow as they ascend (Figure 4). Consequently, smaller bubbles can be completely dissolved within the water column (Table 1). Such an effect was also observed in Arctic thermokarst lakes (Semiletov et al., 1996). Note that the modeled dissolved methane concentration is higher in the bottom water that is constantly subjected to intensive bubble dissolution (Table 1, right column). These concentrations are higher than published observations (see references in Table 1), but lower than recent estimates obtained for an intensive seep in the Laptev Sea (Semiletov, 2024, pers. comm.). The methane oxidation rate used here, kCH4 =0.01 −1, is closer to the minimum estimates (see above) and its increase leads to a decrease of the bottom concentration of dissolved methane.
Figure 4
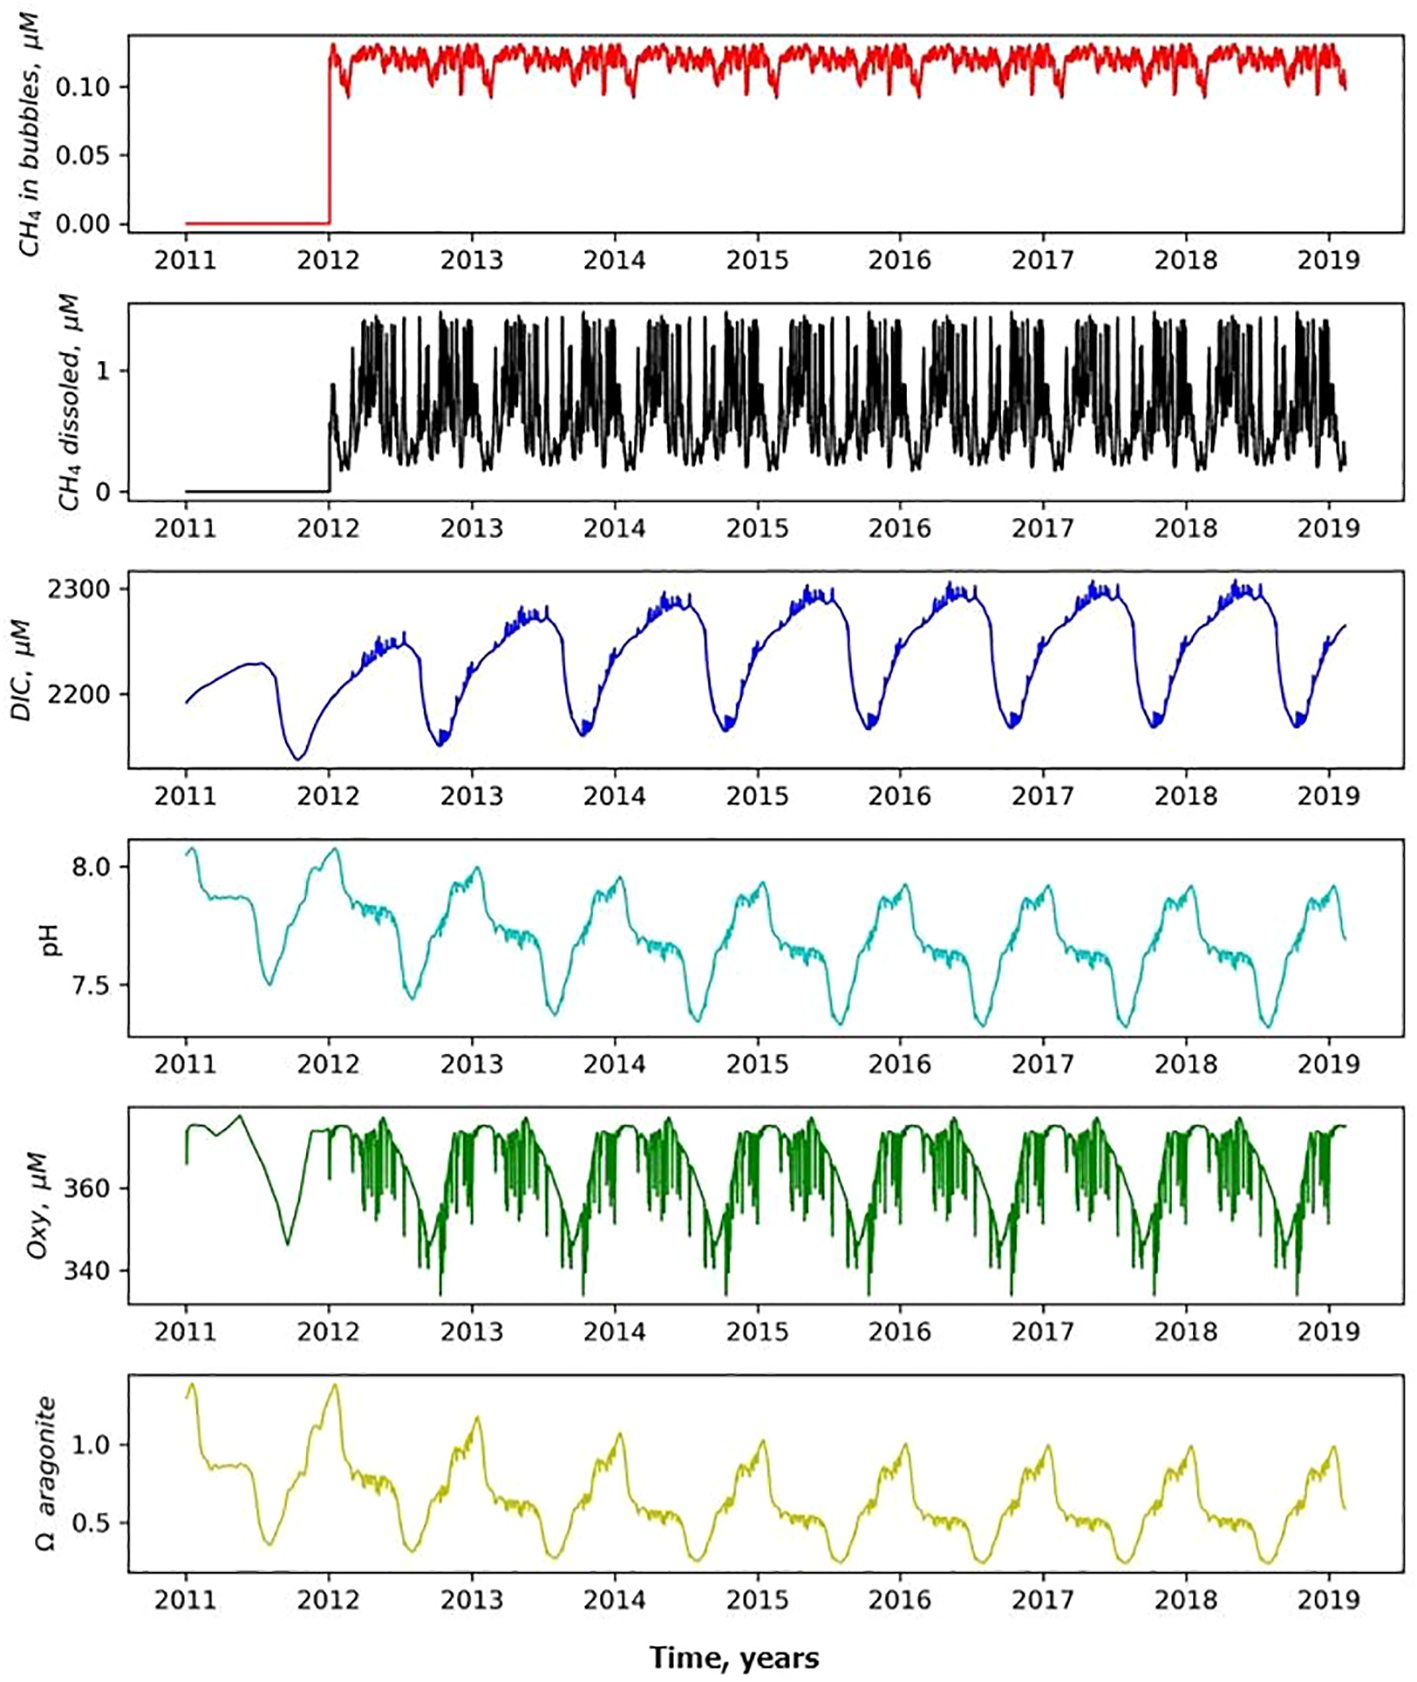
Temporal variability of CH4 in bubbles, CH4 dissolved, DIC, pH, Oxy and ΩAr at 10 m depth above the seep after seeping started 01.01.2012. The x-axis shows calendar years.
3.3 Spatial effect of methane seeping
The modeled ebullition starting 01.01.2012 leads to increased dissolved methane concentrations and changes in the carbonate system (Figures 4, 5). Aerobic oxidation of the dissolved methane causes production of CO2, a corresponding increase of DIC, and decrease in pH and dissolved oxygen (Figures 4, 5).
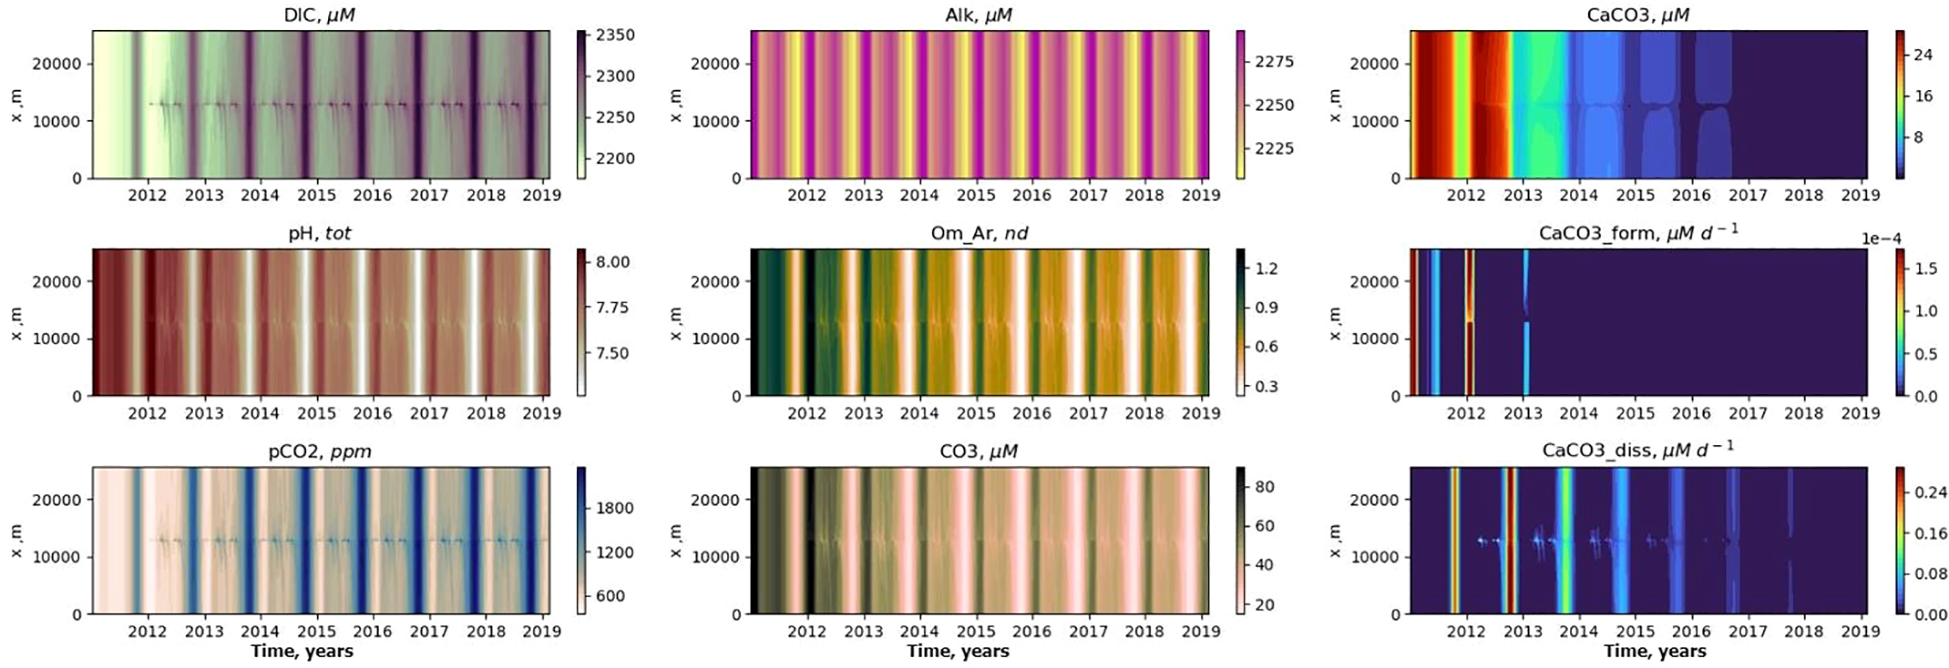
Figure 5
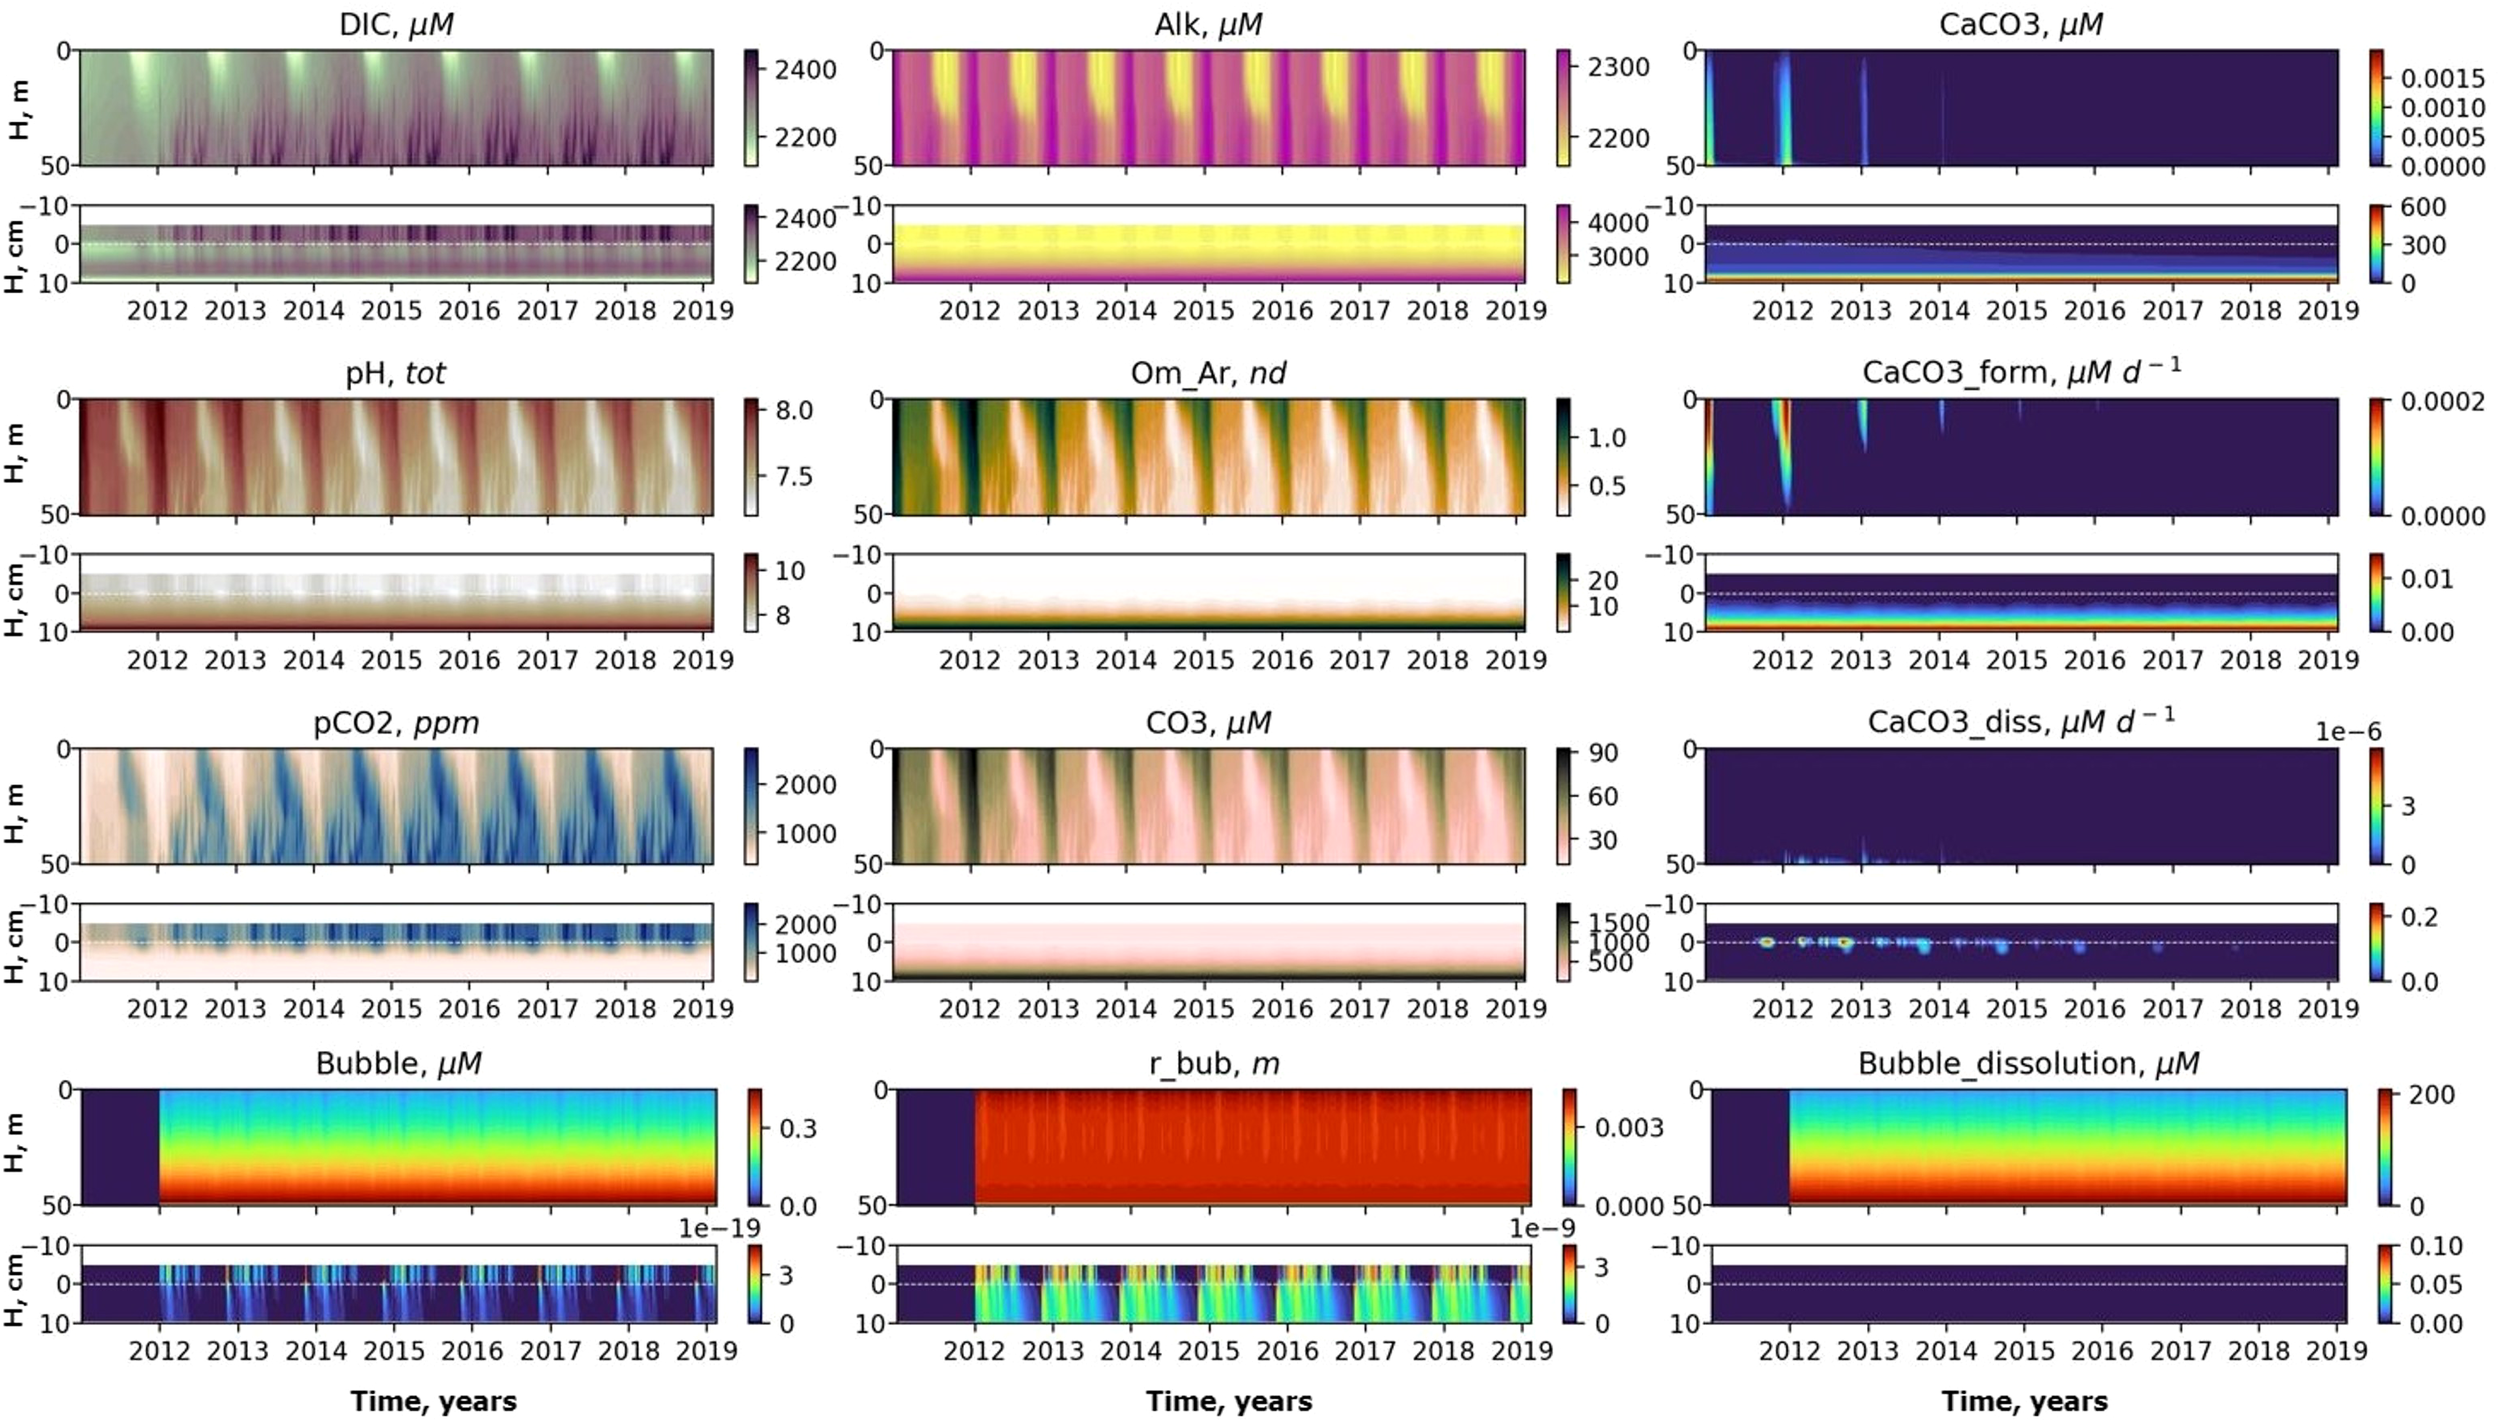
Temporal variability of DIC, pH, CaCO3, pH, aragonite saturation (Om Ar), CaCO3 formation rate (CaCO3 form), pCO2, carbonate ion , CaCO3 dissolution rate (CaCO3 diss), CH4 in bubbles (Bubble), bubble radii (r bub), bubble dissolution rate (Bubble dissolution) at the seep position with seeping started 01.01.2012 for MS scenario. The x-axis shows calendar years and the y-axis shows depth.
Figure 4 shows small-timescale changes of CH4, DIC, pH, OXY and ΩAr above the seeping point, that can be explained by lateral currents parameterized in the model (mainly of tidal scale), that shift water back and forth water in horizontal direction. The processes of methane oxidation take a certain time, so the anomalies in the fields of oxygen, DIC and pH can be displaced horizontally from the point with maximum bubble concentration (Figure 6) resulting in an export of “methane-oxidation effect” to the adjacent waters.
Figure 6
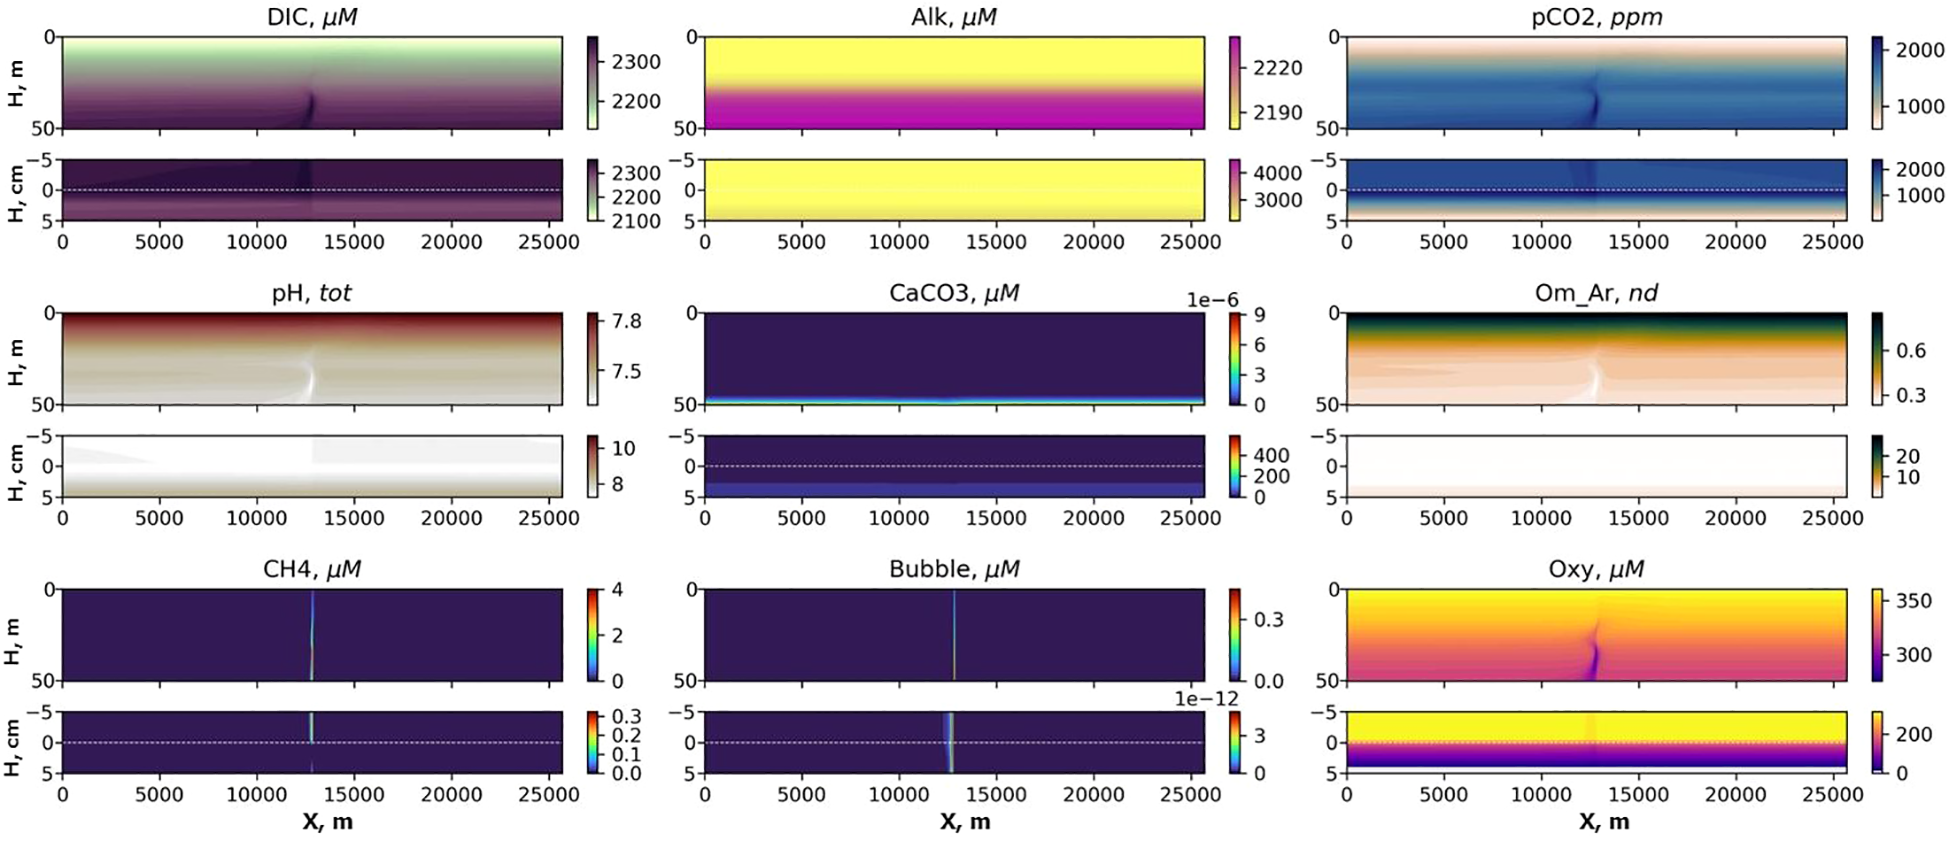
Distributions of DIC, Alk, pCO2, pH, CaCO3, aragonite saturation (Om Ar), CH4, CH4 in bubbles (Bubble) and dissolved oxygen (Oxy) in the transect after 3 years of seeping for MS scenario. The x-axis shows calendar years and the y-axis shows depth.
The region in the vicinity of the seep is in a larger degree affected by seeping and demonstrates long-term changes in the carbonate system. Figure 4 shows that these changes take several years (about 7 years in this MS model assumptions, i.e. intensity of seeping, considered volume of water, bottom depth etc.).
CO2 produced from the oxidizing methane contributes to an increase in DIC, that can diffuse into the sediments in the region near the seep. This increase of DIC (with no change in alkalinity) results in a decrease of aragonite saturation in the bottom boundary layer and in the upper sediments. Therefore, the model predicts dissolution of calcium carbonate (aragonite form) in the upper layer of the sediments (Figures 5, 7). Potential dissolution of calcium carbonate present in the sediments buffers changes in alkalinity in the pore water and therefore in the bottom water that keeps the water column seasonal variability features the same after the start of seeping.
Figure 7
Temporal variability in the bottom layer with seeping started 01.01.2012 for MS scenario. The x-axis shows calendar years.
In the bottom layer, the most intensive changes should be detected at about 1 km distance from the seep (Figures 6, 7), but in the water column the carbonate system parameters can be affected up to 10 km from the seep (Figure 7) with the MS model assumptions.
4 Discussion
Highly calcium carbonate corrosive waters are produced along the bottoms of the ESAS mainly through oxidation of eroded terrestrial organic matter [Semiletov (1999); Semiletov et al. (2007); Anderson et al. (2011)]; We suggested that East Siberian Arctic Shelf waters may become more acidic if thawing permafrost leads to enhanced terrestrial organic carbon and its oxidation to CO2 form [Semiletov et al. (2016)]. This water is exported into the deep Makarov and Canada basins at a depth range of about 50–150 m. The signature of this subsurface water is maintained within the Beaufort Gyre and is exported out to the North Atlantic through eastern Fram Strait, and likely also through the Canadian Arctic Archipelago.
When one compares the conditions of the waters flowing into the Arctic Ocean in the West Spitsbergen Current and the ones flowing out in the East Greenland Current, there are distinct differences. The silicate concentration is at least 2 µM higher in the top 200 m, while the ΩArvalues are in the order 0.2 lower in the top 100 m. This is most likely a result of the addition of freshwater by both river runoff and sea ice melt, but even more important is the decay of organic matter [Anderson et al. (2017); Anderson et al. (2011); Semiletov et al. (2016)]. The effect of freshening can decrease ΩAr by no more than 0.05 under the conditions observed [Anderson et al. (2017)], pointing to the importance of organic matter decay and its oxidation during the circulation of these waters in the Arctic Ocean.
Our study shows that the ΩArin the ESAS varies from 2.05 in January to 0.8 in August. We hypothesizes that a fraction of this change is driven by the oxidation of dissolved CH4 to CO2. Thus the main goal of this work was to develop a model suitable for analyzing the mechanisms of CH4 oxidation as it is released from CH4 bubbles and dissolves in the water column, as well as the consequences of this process for the seawater acidification. Accordingly, the developed CH4 fate model module incorporates the processes of bubble rise and dissolution, the oxidation of dissolved CH4 to CO2, and the baseline biogeochemical model that simulates seasonal variations in CO2, linked to the production and degradation of organic matter. This is a unique approach that allows the study of changes on both short timescales, form seconds to minutes [e.g. applied in Leifer et al. (2000); Leifer and Patro (2002); Dewar et al. (2015)] and longer timescales, from seasonal to interannual [e.g., Malakhova and Golubeva (2022)], while taking baseline biogeochemistry into account—something that has not been done before.
In this work, the CH4 fate module was incorporated into a simplified transport model that accounts for changes along a vertical 2-dimensional transect. This setup allows for the analysis of local variations associated with a single seep but is not applicable for large-scale or pan-Arctic estimates. In other words, it cannot be used to compare the amount of CO2 produced from CH4 oxidation with the CO2 influx from the atmosphere or that generated from riverine organic matter and coastal erosion.
Nevertheless, the application of this version of the model yielded some interesting results.
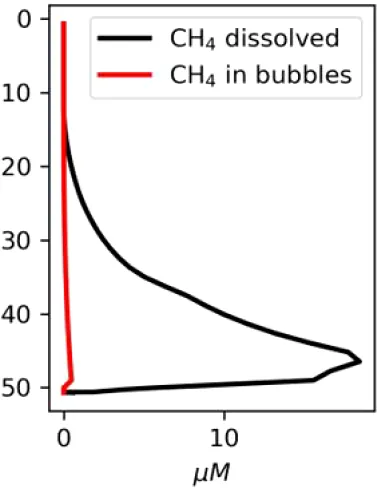
The modeled decrease in pH (−0.002) and dissolved oxygen (up to 4 µM) connected with the MS scenario were more moderate than the decreases observed (−0.01 for pH and −10 µM for dissolved oxygen) near a jet-like seep discovered in the East Siberian Sea in 2019 and 2020, which had ebullition rates up to several hundreds g m2 −1 (Figure 8; Semiletov et al., 2024, pers.comm.). According to the studies in other regions, detectable changes in dissolved oxygen and seawater pH have been previously associated with methane oxidation in the oceanic environment. An oxygen anomaly connected with spilled methane in the Deep Gulf of Mexico was revealed by (Kessler et al., 2011), and a significant influence of aerobic methane oxidation on the carbonate system in the Hudson Canyon was shown by (Garcia-Tigreros and Kessler, 2018).
Figure 8
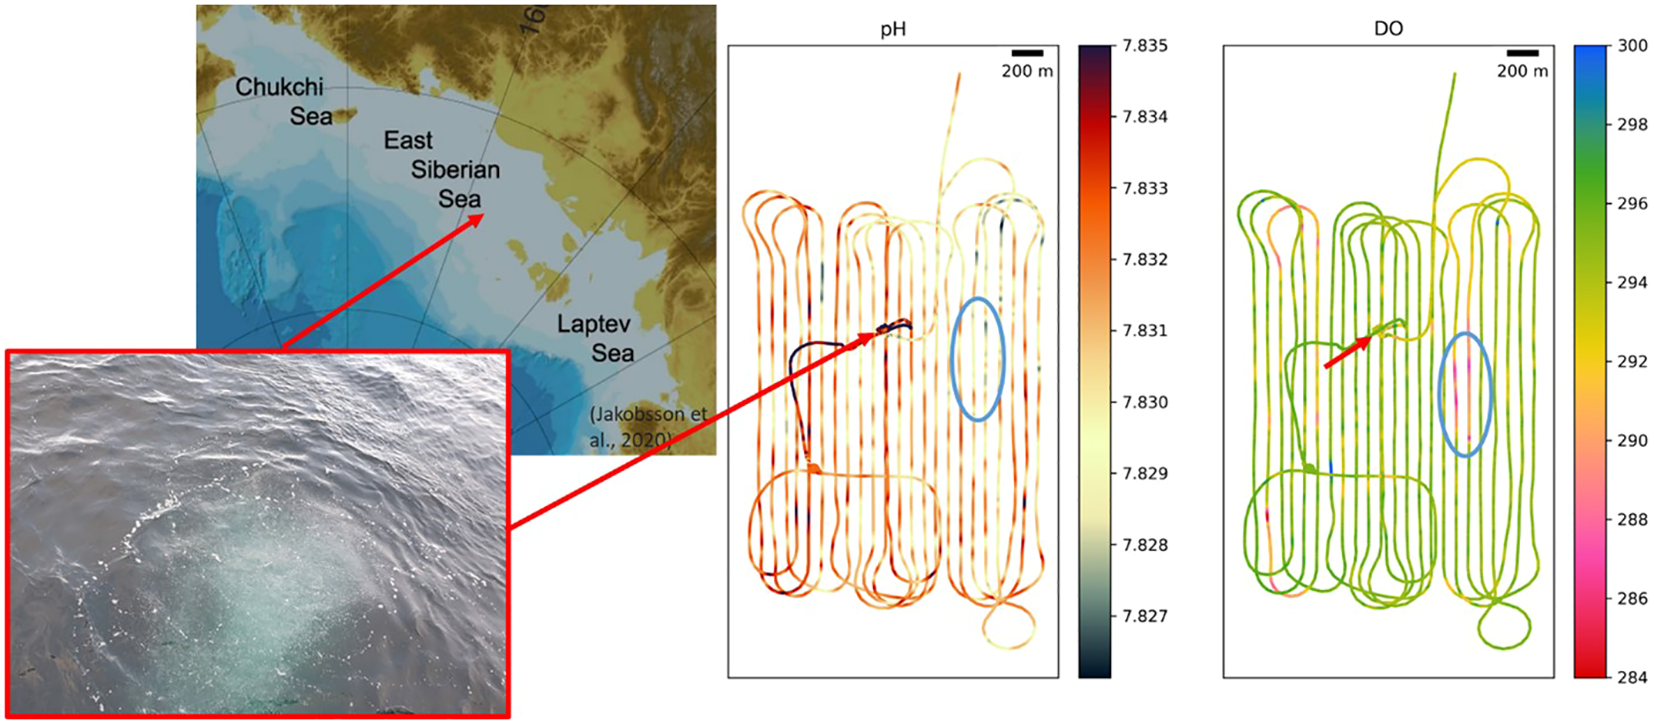
Intensive methane seep in the East Siberian Sea seeing as a “boiling water” 5 m circle and distributions of the surface pH (tot) and DO (µM) measured with PyroScience sensors in 2020. Spots with decreased pH (−0.01) and DO (−10 µM) 1 km east from the bubbles jet could be connected with the seep. The x-axes show calendar years in the left column and distance in m in the right column; the y-axes show depth.
The present model predicts long-term changes in the water column (Figure 1), i.e. increase of average DIC seasonal variability ranges from 2085-2109 µM in model year 2011 to 2094–2122 µM in 2018, that is accompanied by a decrease of ΩArfrom 0.8–2.1 to 0.6–2.0, and lowering of pH from 7.85–8.28 to 7.8–8.25. According to observations (Xie et al., 2023) summertime pH values in this region in 2015–2020 were in the range 7.7–7.95 NBS (about 7.6–7.85 on total scale), slightly lower than our modeled summertime values. Modeled seasonal variability ranges for oxygen remained the same, but there were some sporadic decreases of concentrations by about 4 µM (Figure 4) that agree well with the magnitude of observed anomalies in the surface layer (Figure 8).
Our model results here are for a single seep with moderate seeping rate of 3600 mM m−2d−1, but we show that this nevertheless leads to detectable changes in the local carbonate system state, with lower pH and lower ΩAr. Figure 9 shows a comparison of scenarios MS and IS. More intensive seeping results in complete dissolution of CaCO3 in the sediments in the seep position in several months, and larger size of the bottom affected after 3 years of seeping. In the water column there will be formed more pronounced anomalies of pH (dropping to 7.3 in IS scenario compared with 7.8 in MS scenario), lowing aragonite saturation to values less than one in all transect and decrease of dissolved oxygen to 250 in IS scenario compared to 300 in MS scenario.
Figure 9
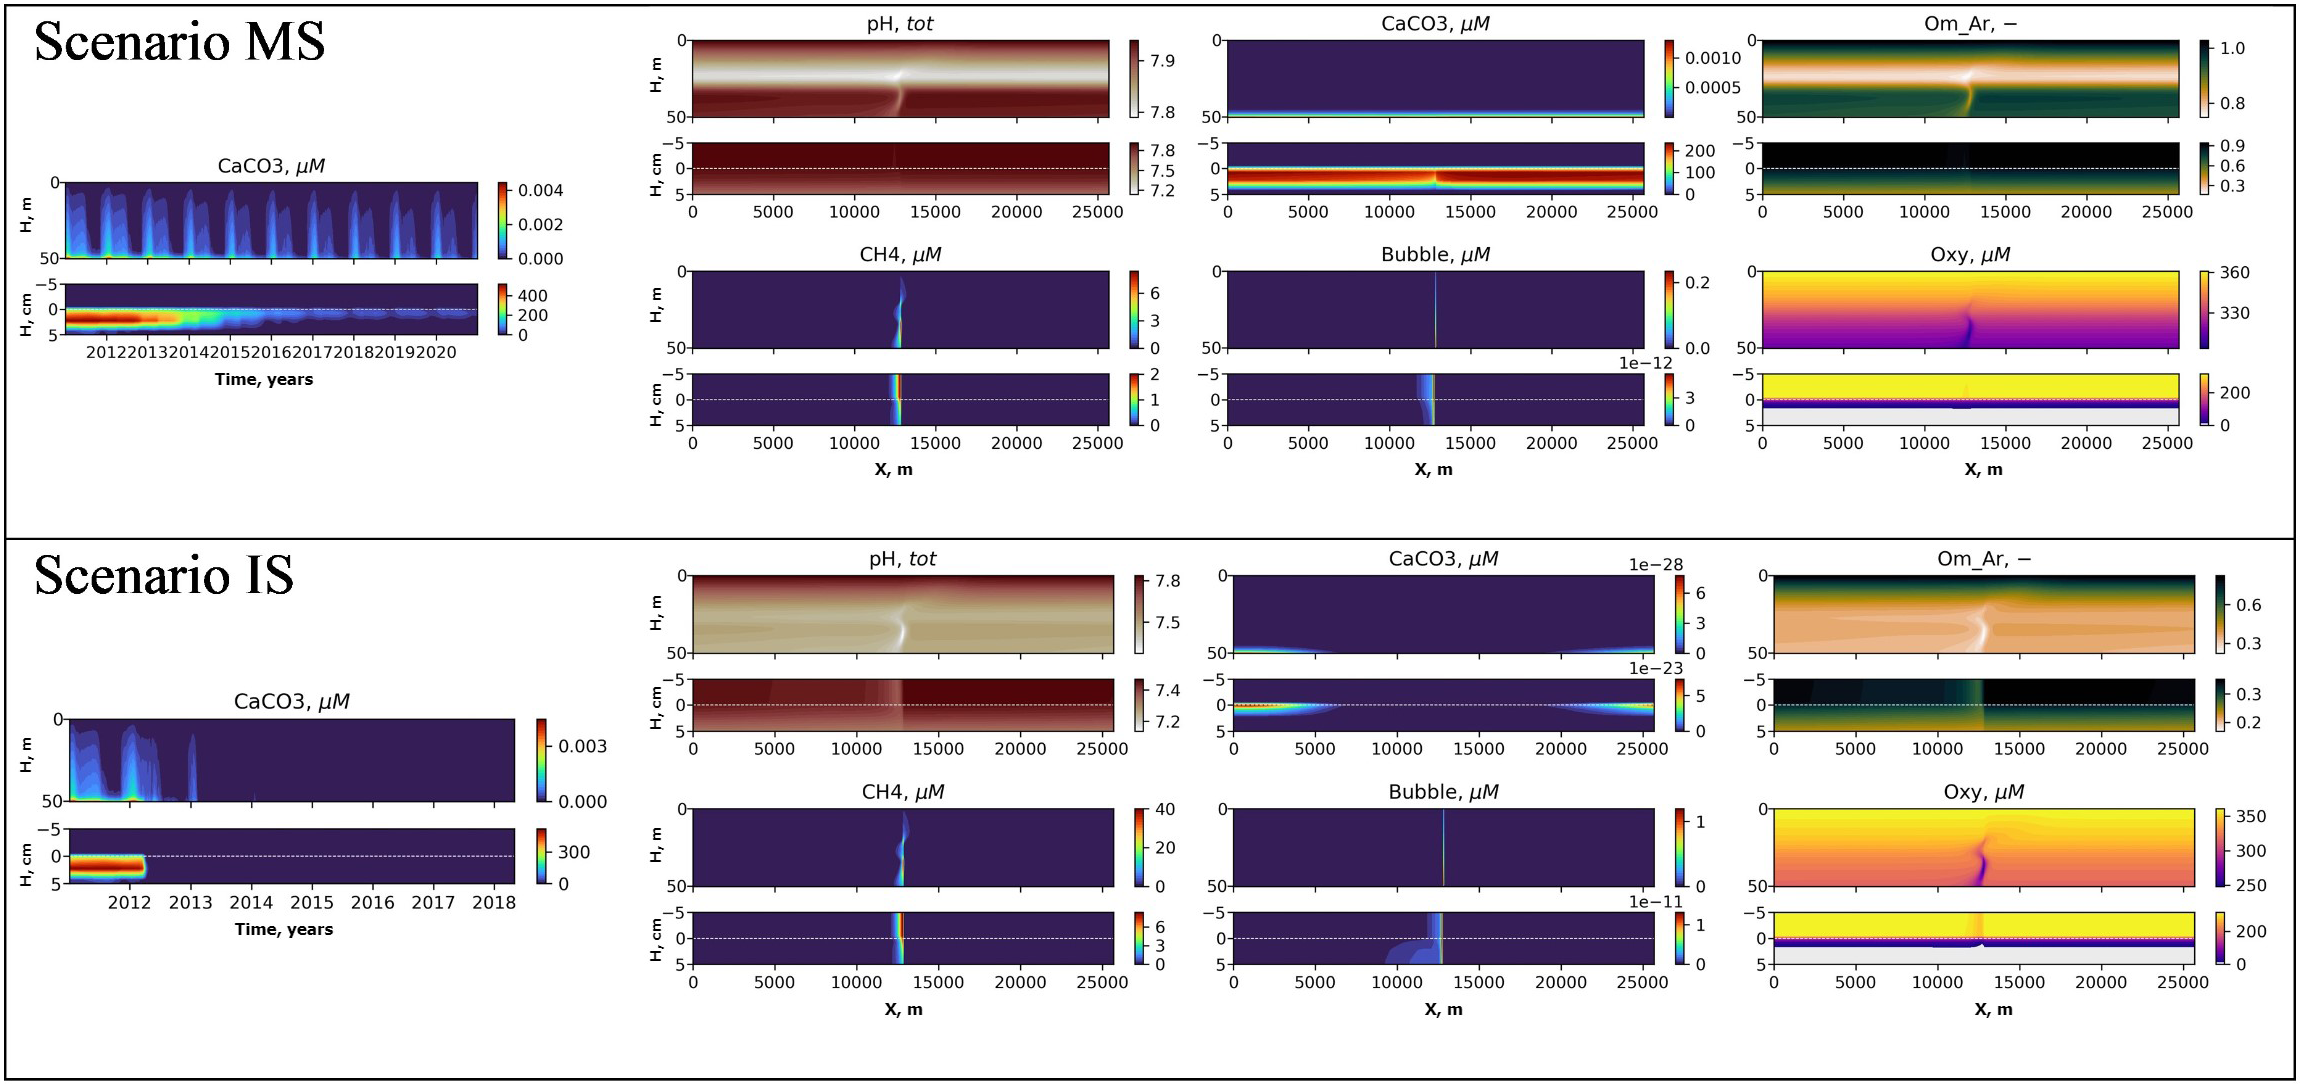
Interannual variability of CaCO3, in the water column and the sediments (left) and distributions of pH, CaCO3, Aragonite saturation (Om Ar), CH4, CH4 in bubbles (Bubble) and dissolved oxygen (Oxy) in the transect after 3 years of seeping (right) under scenarios MS (top) and IS (bottom).
The role of the seep origin methane in the Arctic carbon budget can be very significant. There are estimates for the 3000 km2 area in the southern part of the Laptev Sea (Bussmann et al., 2017), partially affected by seeping, that about 8% of the total methane inventory leaves the aquatic system via diffusion, whereas only 1% is oxidized each day. Since the area of bottom in the Laptev Sea, where CH4 fluxes to the bottom water vary from 30 to 170 g m−2 d−1 (or 2500–15000 mM m−2d−1), is predicted to be several thousands of square kilometers (Shakhova et al., 2015), an importance of CH4 seeping for the carbonate system changes can be very large.
There remains an open question regarding the relative contribution of CO2 produced from CH4 oxidation in the water column and sediments, compared to CO2 originating from the mineralization of organic carbon delivered by rivers, freshly eroded coastal organic matter, or atmospheric influx — at local (e.g., Laptev Sea), regional (ESAS), and pan-Arctic scales.
To address these questions, we plan to couple the methane fate module developed in this study with a three-dimensional pan-Arctic hydrodynamic model. This will allow us to analyze the relative significance of carbon enrichment resulting from CH4 oxidation and to conduct numerical experiments on potential changes driven by Arctic climate change — such as rising temperatures, permafrost thawing, coastal erosion, and increase in river discharge [Savelieva et al. (2000)]. Obtaining new observational data for model validation is also essential for improving accuracy and confidence in the results.
5 Conclusion
We developed a process-oriented model to investigate the influence of methane seeping on acidification state in the East Siberian Arctic Seas. It was demonstrated that:
-
Methane bubbling release leads to acidification in the surrounding water due to CO2 production during “accumulation” of slow aerobic oxidation of constantly released CH4.
-
The local changes in pH and dissolved oxygen associated with intensive CH4 ebullition from a single seep are low, but should be detectable by observation.
-
Currents can advect the “methane-oxidation effect” on dissolved oxygen and pH fields away from the point of seepage.
-
Upper sediments in the seepage areas may become undersaturated for aragonite.
The “Methane-oxidation effect” may intensify in the near future because of subsea permafrost degradation and related CH4 release. This work investigated the mechanisms by which seeping methane bubbles impact the marine carbonate system on a local scale; to investigate impacts on regional or pan-Arctic scales, future work should aim to parameterize these mechanisms in (3D) regional ocean models and eventually Earth System Models.
Statements
Data availability statement
Publicly available datasets were analyzed in this study. This data can be found here: The code of the models used is available for 2DBP at https://github.com/BottomRedoxModel/2DBP/releases/tag/Laptev and for BROM at https://github.com/BottomRedoxModel/BROM/releases/tag/Laptev.
Author contributions
EY: Software, Supervision, Validation, Writing – original draft, Writing – review & editing. AB: Data curation, Software, Validation, Visualization, Writing – review & editing. NS: Writing – review & editing. JB: Software, Writing – review & editing. PW: Writing – review & editing. AS: Writing – review & editing. MN: Software, Validation, Visualization, Writing – review & editing. SY: Software, Validation, Writing – review & editing. AZ: Software, Writing – review & editing. MA: Validation, Writing – review & editing. RB: Writing – review & editing. ÖG: Validation, Writing – review & editing. IS: Conceptualization, Investigation, Validation, Writing – review & editing.
Funding
The author(s) declare financial support was received for the research and/or publication of this article. This work was supported by the Research Council of Norway project 315317 “Bio-essential and toxic elements transformation and transport in the Arctic under pressure of Siberian Continental Shelf permafrost thawing”, BEST-Siberian, the Russian Scientific Foundation (grant 21-77–30001 to POI; grant 22-67–00025 to IGD), and the Ministry of Science and Higher Education of the Russian Federation (grant “Priority -2030” to TSU). The charter of the RV Academician Mstislav Keldysh was funded by grant 121021500057–4 from the Ministry of Science and Higher of the Russian Federation. Production and storage of forcing data from regional model runs used resources from the Norwegian Metacenter for Computational Science and Storage Infrastructure (Notur/Norstore), projects nn8103k, nn9490k, and ns9630k.
Acknowledgments
We acknowledge the contributions of colleagues at NIVA that aided the efforts of the authors.
Conflict of interest
Author AB was employed by Akvaplan-niva AS. Author JB was employed by Bolding & Bruggeman ApS.
The remaining authors declare that the research was conducted in the absence of any commercial or financial relationships that could be construed as a potential conflict of interest.
Publisher’s note
All claims expressed in this article are solely those of the authors and do not necessarily represent those of their affiliated organizations, or those of the publisher, the editors and the reviewers. Any product that may be evaluated in this article, or claim that may be made by its manufacturer, is not guaranteed or endorsed by the publisher.
Supplementary material
The Supplementary Material for this article can be found online at: https://www.frontiersin.org/articles/10.3389/fmars.2025.1497616/full#supplementary-material
References
1
Anderson L. Björk G. Jutterström S. Pipko I. Shakhova N. Semiletov I. et al . (2011). East siberian sea, an arctic region of very high biogeochemical activity. Biogeosciences8, 1745–1754. doi: 10.5194/bg-8-1745-2011
2
Anderson L. G. Ek J. Ericson Y. Humborg C. Semiletov I. Sundbom M. et al . (2017). Export of calcium carbonate corrosive waters from the east siberian sea. Biogeosciences14, 1811–1823. doi: 10.5194/bg-14-1811-2017
3
Beers J. R. (1966). Studies on the chemical composition of the major zooplankton groups in the sargasso sea off Bermuda 1. Limnol Oceanogr11, 520–528. doi: 10.4319/lo.1966.11.4.0520
4
Berezina A. Yakushev E. Savchuk O. Vogelsang C. Staalstrom A. (2021). Modelling the influence from biota and organic matter on the transport dynamics of microplastics in the water column and bottom sediments in the oslo fjord. Water13, 2690. doi: 10.3390/w13192690
5
Bröder L. Andersson A. Tesi T. Semiletov I. Gustafsson Ö. (2019). Quantifying degradative loss of terrigenous organic carbon in surface sediments across the laptev and east siberian sea. Global Biogeochem Cycles33, 85–99. doi: 10.1029/2018GB005967
6
Bröder L. Tesi T. Salvado J. A. Semiletov I. P. Dudarev O. V. Gustafsson Ö. (2016). Fate of terrigenous organic matter across the laptev sea from the mouth of the lena river to the deep sea of the arctic interior. Biogeosciences13, 5003–5019. doi: 10.5194/bg-13-5003-2016
7
Bruggeman J. Bolding K. (2014). A general framework for aquatic biogeochemical models. Environ. Model. Softw61, 249–265. doi: 10.1016/j.envsoft.2014.04.002
8
Bussmann I. Hackbusch S. Schaal P. Wichels A. (2017). Methane distribution and oxidation around the lena delta in summer 2013. Biogeosciences14, 4985–5002. doi: 10.5194/bg-14-4985-2017
9
Chan E. W. Shiller A. M. Joung D. J. Arrington E. C. Valentine D. L. Redmond M. C. et al . (2019). Investigations of aerobic methane oxidation in two marine seep environments: part 2—isotopic kinetics. J. Geophys Res: Oceans124, 8392–8399. doi: 10.1029/2019JC015594
10
Chernykh D. Shakhova N. Yusupov V. Gershelis E. Morgunov B. Semiletov I. (2023). First calibrated methane bubble wintertime observations in the siberian arctic seas: Selected results from the fast ice. Geosciences13, 228. doi: 10.3390/geosciences13080228
11
Cloern J. E. Grenz C. Vidergar-Lucas L. (1995). An empirical model of the phytoplankton chlorophyll: carbon ratio-the conversion factor between productivity and growth rate. Limnol Oceanogr40, 1313–1321. doi: 10.4319/lo.1995.40.7.1313
12
Crespo-Medina M. Meile C. Hunter K. Diercks A. Asper V. Orphan V. et al . (2014). The rise and fall of methanotrophy following a deepwater oil-well blowout. Nat. Geosci.7, 423–427. doi: 10.1038/ngeo2156
13
Dewar M. Sellami N. Chen B. (2015). Dynamics of rising co2 bubble plumes in the qics field experiment: Part 2–modelling. Int. J. Greenhouse Gas Control38, 52–63. doi: 10.1016/j.ijggc.2014.11.003
14
Eilola K. Gustafsson B. G. Kuznetsov I. Meier H. Neumann T. Savchuk O. (2011). Evaluation of biogeochemical cycles in an ensemble of three state-of-the-art numerical models of the baltic sea. J. Mar. Syst.88, 267–284. doi: 10.1016/j.jmarsys.2011.05.004
15
Garcia-Tigreros F. Kessler J. D. (2018). Limited acute influence of aerobic methane oxidation on ocean carbon dioxide and ph in hudson canyon, northern us atlantic margin. J. Geophys Res: Biogeosci123, 2135–2144. doi: 10.1029/2018JG004384
16
Gustafsson Ö. Van Dongen B. Vonk J. Dudarev O. V. Semiletov I. P. (2011). Widespread release of old carbon across the siberian arctic echoed by its large rivers. Biogeosciences8, 1737–1743. doi: 10.5194/bg-8-1737-2011
17
Hovland M. Judd A. G. Burke R. Jr (1993). The global flux of methane from shallow submarine sediments. Chemosphere26, 559–578. doi: 10.1016/0045-6535(93)90442-8
18
Judd A. Hovland M. Dimitrov L. Garcia Gil S. Jukes V. (2002). The geological methane budget at continental margins and its influence on climate change. Geofluids2, 109–126. doi: 10.1046/j.1468-8123.2002.00027.x
19
Kessler J. D. Valentine D. L. Redmond M. C. Du M. Chan E. W. Mendes S. D. et al . (2011). A persistent oxygen anomaly reveals the fate of spilled methane in the deep gulf of Mexico. Science331, 312–315. doi: 10.1126/science.1199697
20
Kitidis V. Upstill-Goddard R. C. Anderson L. G. (2010). Methane and nitrous oxide in surface water along the north-west passage, arctic ocean. Mar. Chem.121, 80–86. doi: 10.1016/j.marchem.2010.03.006
21
Kosobokova K. N. Hanssen H. Hirche H.-J. Knickmeier K. (1997). Composition and distribution of zooplankton in the laptev sea and adjacent nansen basin during summer 1993. Polar Biol.19, 63–76. doi: 10.1007/s003000050216
22
Leifer I. Patro R. K. (2002). The bubble mechanism for methane transport from the shallow sea bed to the surface: A review and sensitivity study. Cont shelf Res.22, 2409–2428. doi: 10.1016/S0278-4343(02)00065-1
23
Leifer I. Patro R. K. Bowyer P. (2000). A study on the temperature variation of rise velocity for large clean bubbles. J. Atmos Oceanic Technol.17, 1392–1402. doi: 10.1175/1520-0426(2000)017<1392:ASOTTV>2.0.CO;2
24
Malakhova V. Golubeva E. (2022). Model study of the effects of climate change on the methane emissions on the arctic shelves. Atmosphere13, 274. doi: 10.3390/atmos13020274
25
Martens J. Wild B. Semiletov I. Dudarev O. V. Gustafsson Ö. (2022). Circum-arctic release of terrestrial carbon varies between regions and sources. Nat. Commun.13, 5858. doi: 10.1038/s41467-022-33541-0
26
Mau S. Blees J. Helmke E. Niemann H. Damm E. (2013). Vertical distribution of methane oxidation and methanotrophic response to elevated methane concentrations in stratified waters of the arctic fjord storfjorden (svalbard, Norway). Biogeosciences10, 6267–6278. doi: 10.5194/bg-10-6267-2013
27
Notz D. Stroeve J. (2016). Observed arctic sea-ice loss directly follows anthropogenic co2 emission. Science354, 747–750. doi: 10.1126/science.aag2345
28
Ommundsen A. Jensen J. K. Midtbø K. H. Engedahl H. (2008). Operational METOC models at Norwegian Meteorological Institute (met.no) (Oslo, Norway: Tech. rep., The Norwegian Meteorological Institute).
29
Osudar R. Liebner S. Alawi M. Yang S. Bussmann I. Wagner D. (2016). Methane turnover and methanotrophic communities in arctic aquatic ecosystems of the lena delta, northeast siberia. FEMS Microbiol. Ecol.92, fiw116. doi: 10.1093/femsec/fiw116
30
Peterson B. J. Holmes R. M. McClelland J. W. Vörösmarty C. J. Lammers R. B. Shiklomanov A. I. et al . (2002). Increasing river discharge to the arctic ocean. science298, 2171–2173. doi: 10.1126/science.1077445
31
Polyakova Y. I. Kryukova I. Martynov F. Novikhin A. Abramova E. Kassens H. et al . (2021). Community structure and spatial distribution of phytoplankton in relation to hydrography in the laptev sea and the east siberian sea (autumn 2008). Polar Biol.44, 1229–1250. doi: 10.1007/s00300-021-02873-w
32
Rantanen M. Karpechko A. Y. Lipponen A. Nordling K. Hyvärinen O. Ruosteenoja K. et al . (2022). The arctic has warmed nearly four times faster than the globe since 1979. Commun. Earth Environ.3, 168. doi: 10.1038/s43247-022-00498-3
33
Reeburgh W. S. (2007). Oceanic methane biogeochemistry. Chem. Rev.107, 486–513. doi: 10.1021/cr050362v
34
Sandbeck K. A. Reeburgh W. S. (1989). Microbiological preparation of 3h-labelled methane. J. Labelled Compounds Radiopharm27, 1285–1291. doi: 10.1002/jlcr.2580271107
35
Sapart C. J. Shakhova N. Semiletov I. Jansen J. Szidat S. Kosmach D. et al . (2017). The origin of methane in the east siberian arctic shelf unraveled with triple isotope analysis. Biogeosciences14, 2283–2292. doi: 10.5194/bg-14-2283-2017
36
Savelieva N. Semiletov I. Vasilevskaya L. Pugach S. (2000). A climate shift in seasonal values of meteorological and hydrological parameters for northeastern asia. Prog. Oceanogr47, 279–297. doi: 10.1016/S0079-6611(00)00039-2
37
Semiletov I. (1999). Destruction of the coastal permafrost as an important factor in biogeochemistry of the arctic shelf waters. in Trans. (Doklady) Russian Acad. Sci.. 368, 679–682.
38
Semiletov I. Pipko I. (2007). “Sinks and sources of carbon dioxide in the arctic ocean: Results of direct instrumental measurements,” in Doklady Earth Sciences., vol. 414. , 642.
39
Semiletov I. Pipko I. Gustafsson Ö. Anderson L. G. Sergienko V. Pugach S. et al . (2016). Acidification of east siberian arctic shelf waters through addition of freshwater and terrestrial carbon. Nat. Geosci.9, 361–365. doi: 10.1038/ngeo2695
40
Semiletov I. Pipko I. Pivovarov N. Y. Popov V. Zimov S. Voropaev Y. V. et al . (1996). Atmospheric carbon emission from north asian lakes: a factor of global significance. Atmos Environ.30, 1657–1671. doi: 10.1016/1352-2310(95)00426-2
41
Semiletov I. P. Pipko I. I. Repina I. Shakhova N. E. (2007). Carbonate chemistry dynamics and carbon dioxide fluxes across the atmosphere–ice–water interfaces in the arctic ocean: Pacific sector of the arctic. J. Mar. Syst.66, 204–226. doi: 10.1016/j.jmarsys.2006.05.012
42
Semiletov I. Pipko I. Shakhova N. Dudarev O. Pugach S. Charkin A. et al . (2011). Carbon transport by the lena river from its headwaters to the arctic ocean, with emphasis on fluvial input of terrestrial particulate organic carbon vs. carbon transport by coastal erosion. Biogeosciences8, 2407–2426. doi: 10.5194/bg-8-2407-2011
43
Semiletov I. P. Shakhova N. E. Sergienko V. I. Pipko I. I. Dudarev O. V. (2012). On carbon transport and fate in the east siberian arctic land–shelf–atmosphere system. Environ. Res. Lett.7, 015201. doi: 10.1088/1748-9326/7/1/015201
44
Shakhova N. Alekseev V. Semiletov I. (2010a). Predicted methane emission on the east siberian shelf. in Doklady Earth Sciences, vol. 430, 190–193.
45
Shakhova N. Semiletov I. Chuvilin E. (2019). Understanding the permafrost–hydrate system and associated methane releases in the east siberian arctic shelf. Geosciences9, 251. doi: 10.3390/geosciences9060251
46
Shakhova N. Semiletov I. Leifer I. Salyuk A. Rekant P. Kosmach D. (2010b). Geochemical and geophysical evidence of methane release over the east siberian arctic shelf. J. Geophys Res: Oceans115, 1–11. doi: 10.1029/2009JC005602
47
Shakhova N. Semiletov I. Leifer I. Sergienko V. Salyuk A. Kosmach D. et al . (2014). Ebullition and storm-induced methane release from the east siberian arctic shelf. Nat. Geosci.7, 64–70. doi: 10.1038/ngeo2007
48
Shakhova N. Semiletov I. Salyuk A. Yusupov V. Kosmach D. Gustafsson Ö. (2010c). Extensive methane venting to the atmosphere from sediments of the east siberian arctic shelf. Science327, 1246–1250. doi: 10.1126/science.1182221
49
Shakhova N. Semiletov I. Sergienko V. Lobkovsky L. Yusupov V. Salyuk A. et al . (2015). The east siberian arctic shelf: towards further assessment of permafrost-related methane fluxes and role of sea ice. Philos. Trans. R. Soc. A373, 20140451. doi: 10.1098/rsta.2014.0451
50
Shchepetkin A. F. McWilliams J. C. (2005). The regional oceanic modeling system (roms): a splitexplicit, free-surface, topography-following-coordinate oceanic model. Ocean Model.9, 347–404. doi: 10.1016/j.ocemod.2004.08.002
51
Vonk J. E. Alling V. Rahm L. Mörth C.-M. Humborg C. Gustafsson Ö. (2012a). A centennial record of fluvial organic matter input from the discontinuous permafrost catchment of lake torneträsk. J. Geophys Res: Biogeosci117, 1–11. doi: 10.1029/2011JG001887
52
Vonk J. E. Sánchez-García L. Van Dongen B. Alling V. Kosmach D. Charkin A. et al . (2012b). Activation of old carbon by erosion of coastal and subsea permafrost in arctic siberia. Nature489, 137–140. doi: 10.1038/nature11392
53
Wåhlström I. Meier H. M. (2014). A model sensitivity study for the sea–air exchange of methane in the laptev sea, arctic ocean. Tellus B: Chem. Phys. Meteorol66, 24174. doi: 10.3402/tellusb.v66.24174
54
Wang Q. Danilov S. Sidorenko D. Wang X. (2021). Circulation pathways and exports of arctic river runoff influenced by atmospheric circulation regimes. Front. Mar. Sci.8, 707593. doi: 10.3389/fmars.2021.707593
55
Weinstein A. Navarrete L. Ruppel C. Weber T. C. Leonte M. Kellermann M. Y. et al . (2016). Determining the flux of methane into h udson c anyon at the edge of methane clathrate hydrate stability. Geochem Geophys Geosyst17, 3882–3892. doi: 10.1002/2016GC006421
56
Whiteman G. Hope C. Wadhams P. (2013). Vast costs of arctic change. Nature499, 401–403. doi: 10.1038/499401a
57
Wild B. Andersson A. Bröder L. Vonk J. Hugelius G. McClelland J. W. et al . (2019). Rivers across the siberian arctic unearth the patterns of carbon release from thawing permafrost. Proc. Natl. Acad. Sci.116, 10280–10285. doi: 10.1073/pnas.1811797116
58
Wild B. Ray N. E. Lett C. Davies A. J. Kirillova E. Holmstrand H. et al . (2023). Nitrous oxide dynamics in the siberian arctic ocean and vulnerability to climate change. J. Geophys Res: Biogeosci128, e2022JG007326. doi: 10.1029/2022JG00732
59
Wild B. Shakhova N. Dudarev O. Ruban A. Kosmach D. Tumskoy V. et al . (2022). Organic matter composition and greenhouse gas production of thawing subsea permafrost in the laptev sea. Nat. Commun.13, 5057. doi: 10.1038/s41467-022-32696-0
60
Xie L. Yakushev E. Semiletov I. Grinko A. Gangnus I. Berezina A. et al . (2023). Biogeochemical structure of the laptev sea in 2015–2020 associated with the river lena plume. Front. Mar. Sci.10, 1180054. doi: 10.3389/fmars.2023.1180054
61
Yakushev E. Blomberg A. E. Eek E. Protsenko E. Totland C. Staalstrøm A. et al . (2021). Modeling of biogeochemical consequences of a co2 leak in the water column with bottom anoxia. Int. J. Greenhouse Gas Control111, 103464. doi: 10.1016/j.ijggc.2021.103464
62
Yakushev E. V. Protsenko E. A. Bruggeman J. Wallhead P. Pakhomova S. V. Yakubov S. K. et al . (2017). Bottom redox model (brom v. 1.1): a coupled benthic–pelagic model for simulation of water and sediment biogeochemistry. Geosci Model. Dev.10, 453–482. doi: 10.5194/gmd-10-453-2017
63
Yakushev E. V. Wallhead P. Renaud P. E. Ilinskaya A. Protsenko E. Yakubov S. et al . (2020). Understanding the biogeochemical impacts of fish farms using a benthic-pelagic model. Water12, 2384. doi: 10.3390/w12092384
64
Zhang S.-M. Mu C.-C. Li Z.-L. Dong W.-W. Wang X.-Y. Streletskaya I. et al . (2021). Export of nutrients and suspended solids from major arctic rivers and their response to permafrost degradation. Adv. Climate Change Res.12, 466–474. doi: 10.1016/j.accre.2021.06.002
Summary
Keywords
Arctic Ocean acidification, carbon cycle, methane seeps, biogeochemical modeling, field observations, aerobic methane oxidation
Citation
Yakushev E, Berezina A, Shakhova N, Bruggeman J, Wallhead P, Staalstrøm A, Novikov M, Yakubov S, Zagovenkova A, Ardelan MV, Bellerby R, Gustafsson Ö and Semiletov I (2025) Model based analysis of the methane seeping influence on the acidification in the East Siberian Arctic Shelf waters. Front. Mar. Sci. 12:1497616. doi: 10.3389/fmars.2025.1497616
Received
17 September 2024
Accepted
23 July 2025
Published
02 September 2025
Volume
12 - 2025
Edited by
Jun Sun, China University of Geosciences, China
Reviewed by
Wangwang Ye, Ministy of Natural Resources, China
Terry Eugene Whitledge, Retired, Fairbanks, United States
Updates
Copyright
© 2025 Yakushev, Berezina, Shakhova, Bruggeman, Wallhead, Staalstrøm, Novikov, Yakubov, Zagovenkova, Ardelan, Bellerby, Gustafsson and Semiletov.
This is an open-access article distributed under the terms of the Creative Commons Attribution License (CC BY). The use, distribution or reproduction in other forums is permitted, provided the original author(s) and the copyright owner(s) are credited and that the original publication in this journal is cited, in accordance with accepted academic practice. No use, distribution or reproduction is permitted which does not comply with these terms.
*Correspondence: Evgeniy Yakushev, evgeniy.yakushev@niva.no
Disclaimer
All claims expressed in this article are solely those of the authors and do not necessarily represent those of their affiliated organizations, or those of the publisher, the editors and the reviewers. Any product that may be evaluated in this article or claim that may be made by its manufacturer is not guaranteed or endorsed by the publisher.