Abstract
Intense and prolonged marine heatwaves (MHWs) have been observed in the Indonesian seas over the past 40 years (1982–2021). The frequency and duration of MHWs have increased, while their maximum intensity has declined, reflecting the impacts of global warming. This study analyzed intense MHWs in six key regions: Western Sumatra, Southern Java, Java Sea, Makassar Strait, Maluku Sea, and Northern Papua. A heat budget analysis revealed that heat advection is the primary driver of sea surface temperature warming and MHW events in Southern Java and Western Sumatra, whereas entrainment played a more significant role in other regions. Cross-correlation and scatter plot analyses further indicated that the El Niño-Southern Oscillation (ENSO) and the Indian Ocean Dipole (IOD) also played a crucial role in MHW formation. Notably, MHW occurrences were more frequent during ENSO phases than IOD phases, suggesting ENSO’s stronger influence. Among all study regions, Southern Java exhibited the highest correlation between MHW intensity and both the Oceanic Niño Index and the Dipole Mode Index, underscoring the significant influence of ENSO and IOD in this area. From June to August 1998 to 2021, upwelling intensity in Southern Java weakened due to acute MHW events, with the strongest suppression occurring in the eastern part of the region compared to its central and western areas. These extreme and persistent oceans warming events pose a growing threat to marine ecosystems and fisheries, underscoring the urgent need for further research and mitigation strategies.
1 Introduction
Over the 33-year period from 1982 to 2014, sea surface temperature (SST) in Indonesian waters exhibited a warming trend of 0.19 ± 0.04°C per decade, surpassing the global average (Iskandar et al., 2020). This rise in SST increases the likelihood of extreme weather events, including tropical cyclones (Kuleshov et al., 2008; Oliver et al., 2017, 2018). Warmer SSTs contribute to more intense tropical cyclone activity (Demaria and Kaplan, 1994), leading to higher air temperatures, increased atmospheric moisture, heavier rainfall, and a heightened risk of flooding (Behrens et al., 2019). Alarmingly, these extreme events are projected to become more frequent and severe due to ongoing global warming (Kuleshov et al., 2008).
Another critical consequence of rising SSTs is the increasing occurrence of marine heatwaves (MHWs), defined as prolonged periods of exceptionally warm water (>90th percentile) lasting for at least five consecutive days (Hobday et al., 2016). Globally, the number of annual MHW days increased by more than 50% from 1925 to 2016 (Oliver et al., 2018). Driven by anthropogenic global warming, MHWs have become more widespread across nearly all ocean basins and are projected to persist and intensify through 2100 (Frölicher et al., 2018).
MHWs significantly alter oceanic and atmospheric dynamics (Behrens et al., 2019; Feng and Shinoda, 2019; Fewings and Brown, 2019; Gawarkiewicz et al., 2019; Heidemann and Ribbe, 2019) and can severely impact marine ecosystems (Fordyce et al., 2019; Kendrick et al., 2019; Smith et al., 2019; Straub et al., 2019; Thomsen et al., 2019) and aquaculture (Oliver et al., 2017). MHWs also intensify storms, with evidence showing their role in strengthening extreme events such as hurricanes (Dzwonkowski et al., 2020) and typhoons (Pun et al., 2023). In terms of ocean dynamics, MHWs exacerbate ocean stressors, particularly stratification. Upper layer warming enhances thermal stratification, stabilizing the water column, and restricting vertical mixing process (Doney, 2006). This process traps essential nutrients, phytoplankton, and zooplankton in deeper layers, disrupting their distribution and potentially harming surface productivity, with serious economic consequences for fisheries (Mills et al., 2013; Caputi et al., 2016). MHWs are also suspected to disrupt upwelling, which brings cold, nutrient-rich waters to the surface. Holbrook et al. (2019) found that MHW events in eastern boundary currents are associated with anomalous poleward flows that suppress upwelling. However, the effects of MHWs on upwelling variability remain poorly understood, particularly in Indonesian waters.
While extensive research on MHWs exists globally, knowledge of their occurrence in Indonesia is still limited. Most studies have focused on specific regions (e.g., Iskandar et al., 2021; Ismail, 2021; Habibullah et al., 2023; Ningsih et al., 2023), with only Beliyana et al. (2023) providing a comprehensive analysis across Indonesian waters. Their findings indicate that several regions, particularly Western Sumatra (WS), Southern Java (SJ), Java Sea (JS), Makassar Strait (MK), Maluku Sea (MS), and Northern Papua (NP), have experienced significant MHWs over the past 40 years (1982–2021), as illustrated in Figure 1. However, the mechanisms driving MHW formation in Indonesian waters remain largely unexplored.
Figure 1
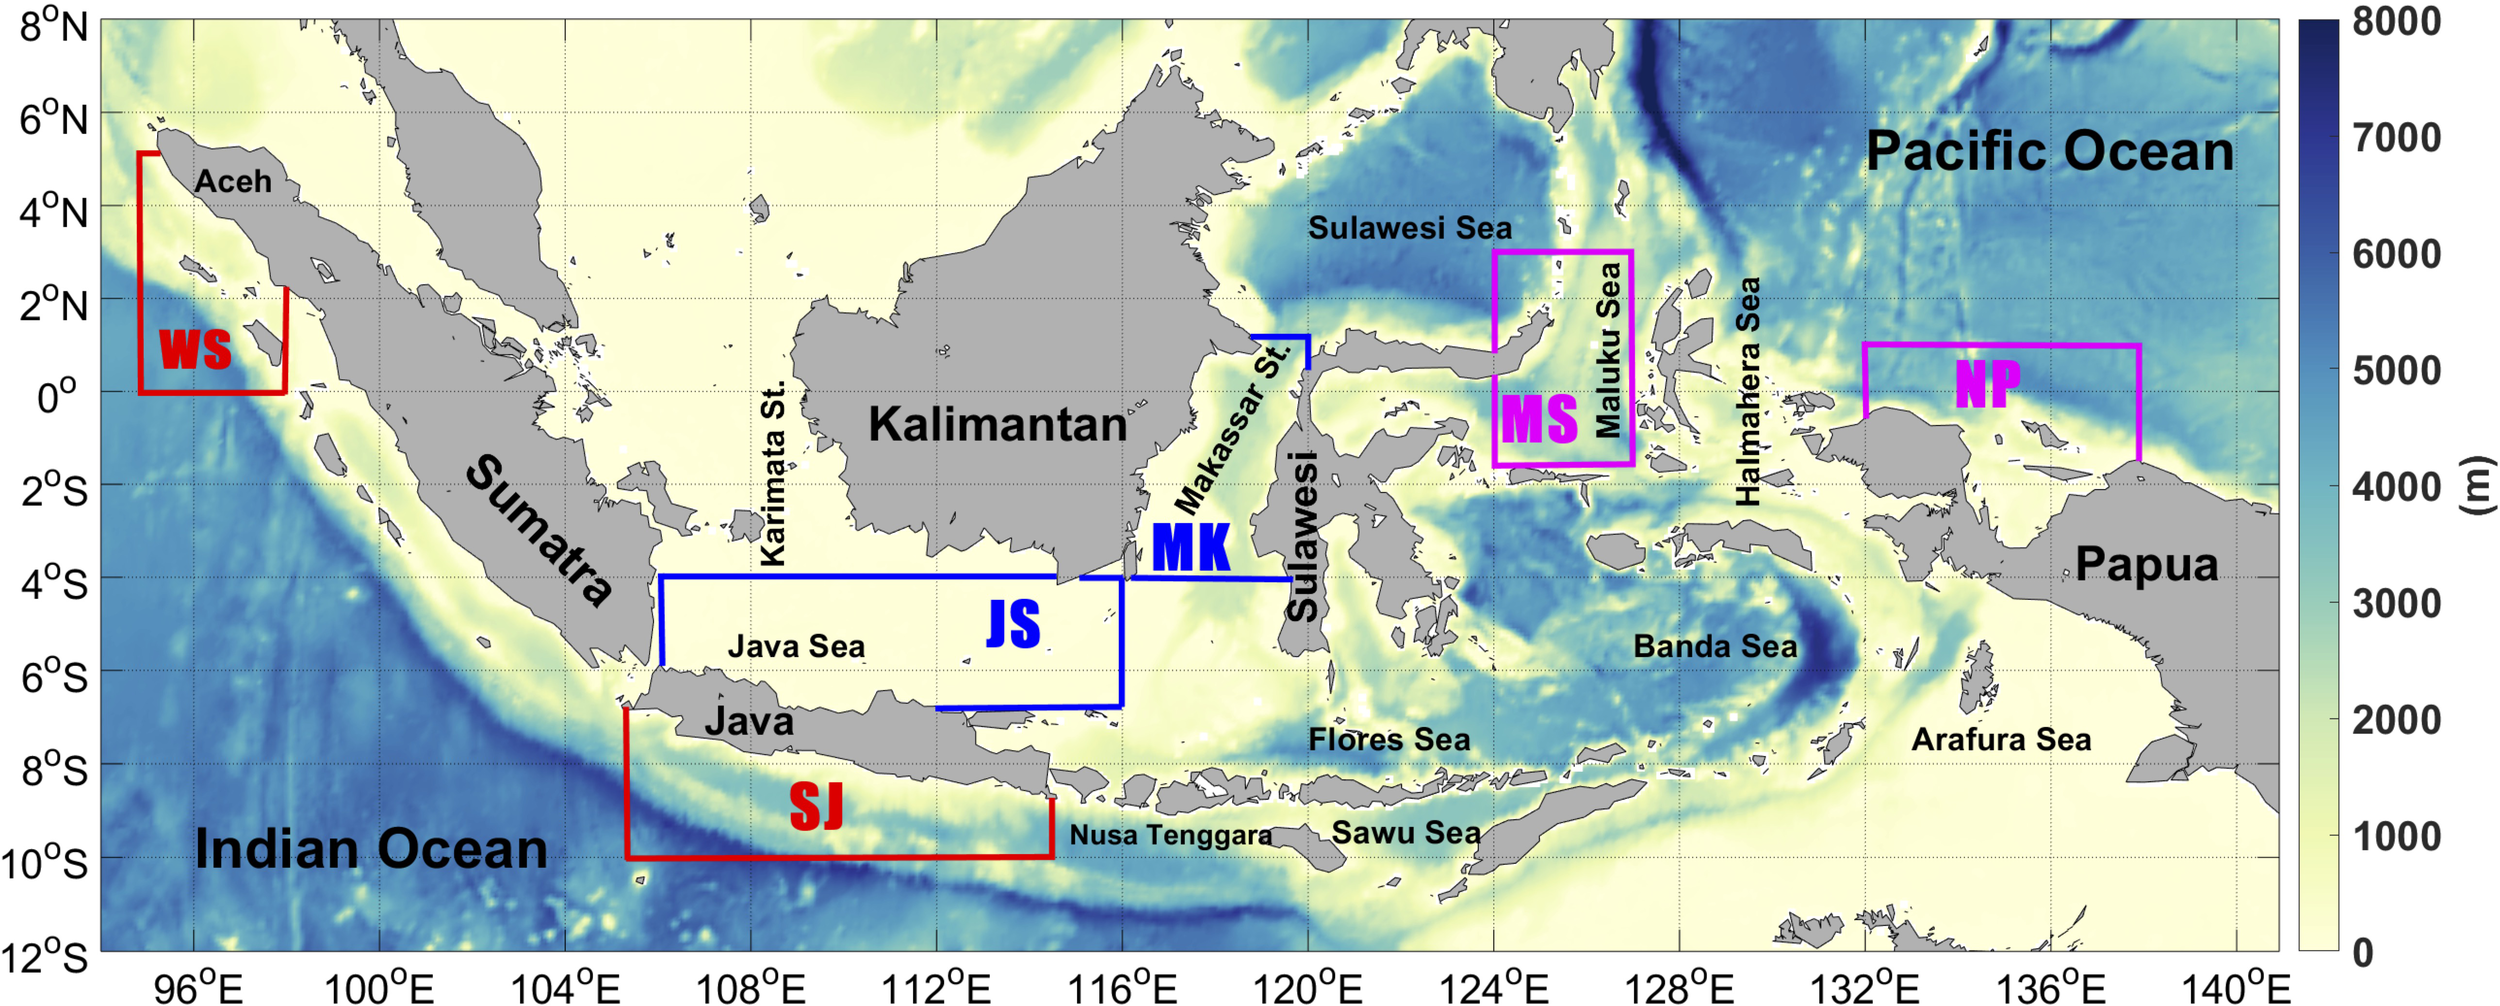
Bathymetry of the Indonesian seas (m), highlighting six areas of interest with colored lines. The red lines indicate Western Sumatra (WS) and Southern Java (SJ), which are part of the western region. The blue lines represent the Java Sea (JS) and Makassar Strait (MK), representing the inner seas. The magenta lines represent the Maluku Sea (MS) and Northern Papua (NP), which belong to the eastern region of the Indonesian seas.
To bridge this knowledge gap, this study aims to investigate the key mechanisms behind MHW formation, considering both local factors (such as heat budget dynamics in the surface mixing layer) and remote influences, including the Indian Ocean Dipole (IOD) and El Niño-Southern Oscillation (ENSO), which strongly modulate MHWs in regions dominated by ENSO-driven sea surface temperature variability (Oliver et al., 2018; Heidemann and Ribbe, 2019). Additionally, this study explores the impact of MHWs on upwelling variability in SJ, a region characterized by frequent MHW events and strong upwelling driven by the southeast monsoon (Susanto et al., 2001; Susanto and Marra, 2005; Susanto et al., 2006; Iskandar et al., 2009; Ningsih et al., 2013; Wirasatriya et al., 2018; Chakraborty et al., 2023).
Given its extensive upwelling, SJ is a highly productive fishing ground for tuna (Syamsuddin et al., 2016). The variability and intensity of upwelling along SJ are influenced by multiple factors, including local, regional, and climatic conditions, such as wind speed and seasonality. Previous studies have highlighted that upwelling intensity in this region is modulated by Kelvin waves (Chen et al., 2015, 2016; Delman et al., 2016; Horii et al., 2018), the Indonesian Throughflow (ITF) (Kuswardani and Qiao, 2014), and large-scale climate phenomena like IOD and ENSO (Susanto et al., 2001; Iskandar et al., 2009; Atmadipoera et al., 2020; Wen et al., 2023). In addition to its well-documented upwelling processes, recent findings by Beliyana et al. (2023) revealed that SJ is susceptible to significant MHWs, particularly in terms of frequency and duration. Given the potential hazards posed by MHWs and the critical ecological and economic benefits of upwelling, it is essential to examine how MHWs impact upwelling processes in SJ.
2 Materials and methods
SST is the primary dataset used in this study to identify MHWs. The detection and analysis of MHW events are based on climatological values and thresholds derived from 40 years of daily SST data (January 1982 to December 2021). These data were sourced from the National Oceanic and Atmospheric Administration (NOAA) Optimum Interpolated Sea Surface Temperature version 2.1 (OISSTv2.1) at a 0.25° (~28 km) resolution (Reynolds et al., 2007). To assess the role of local forcing in MHW formation, zonal (Wx) and meridional (Wy) wind speed data at 10 m above sea level, along with net surface heat flux components, including shortwave radiation (SWR), longwave radiation (LWR), sensible heat flux (SHF), and latent heat flux (LHF), were analyzed using data from the European Center for Medium-Range Weather Forecasts (ECMWF) reanalysis v5 (ERA5) at a 0.25° × 0.25° resolution, covering the same period (1982–2021).
To further support the analysis, zonal (u) and meridional (v) current speed, mixed layer depth (MLD), and density data were utilized in the heat budget analysis to assess the influence of local forcings on MHW formation. These datasets, spanning January 1993 to December 2020, were obtained from the Global Ocean Physics Reanalysis (GLORYS) with a spatial resolution of 1/12°. The study also incorporated Oceanic Niño Index (ONI) and Dipole Mode Index (DMI) data to examine the role of remote forcing on MHW formation. Additionally, chlorophyll-a data from January 1998 to December 2021 were obtained from GLORYS with a spatial resolution of 4 km. The primary method employed in this study is statistical analysis, conducted using Matlab software.
2.1 SST and MHW identification
SST data were used not only to identify MHWs but also to calculate their intensity and SST anomalies (SSTa). As previously stated, an MHW is defined as an anomalously warm water event that exceeds the seasonally varying 90th percentile threshold. It must be a discrete event with a clear start and end date, persisting for at least five consecutive days while maintaining temperatures above the threshold. The seasonally varying climatology and 90th percentile threshold was calculated for each day of the year using an 11-day window centered on that day, based on daily SST data from 1982 to 2021. To ensure smooth climatology and threshold values, a 30-day moving window was applied, following the methodology of Hobday et al. (2016).
MHW intensity was determined as the temperature anomaly during an event, while daily SSTa was calculated by subtracting the climatological mean from the corresponding daily SST. In this study, SST data processing was conducted using the MATLAB implementation developed by Zhao and Marin (2019). Additionally, to analyze the interannual variability of MHWs and their relationship with ENSO and IOD, the long-term trend was removed from the daily SST data.
2.2 Heat budget analysis
To quantify the contributions of the atmosphere and oceanic physical processes to the formation of MHWs in Indonesian waters, a heat budget analysis of the ocean surface mixed layer is conducted as follows (Iskandar et al., 2013; Vijith et al., 2020; Qi et al., 2022):
In Equation 1, the left-hand term represents the rate of temperature change over time (Tt). On the right-hand side, the first term corresponds to the contribution of the net air-sea heat flux to temperature variations (Qnet), the second term accounts for horizontal advection (Advh), the third term represents the contribution of the entrainment process (Ent), and the fourth term is the residual (Res), which includes mixing at the base of the MLD, diffusion, and numerical errors. Additionally, in Equation 1, T denotes temperature, ρ is the mean density of seawater, cp is the specific heat capacity of sea water (assumed constant at 3990 J/kg°C). The variable h represents the MLD, while, u and v are the zonal and meridional current velocity components, respectively. The suffix a indicates a vertically averaged quantity over the MLD, whereas the subscript –h denotes the value at the base of the MLD.
In Equation 2, Qo represents the net surface heat flux at the ocean surface, while Qpen denotes the shortwave radiation that penetrates below the MLD. The parameter α represents the albedo coefficient, which is assumed to be constant at 0.055 (Kumar et al., 2011). The term Qsw corresponds to shortwave radiation (also known as net solar radiation), Qlw represents longwave radiation (or net thermal radiation), Qshf denotes the sensible heat flux, describing heat transfer between the ocean surface and the atmosphere through turbulent motion driven by the temperature gradient between the sea and air, while Qlhf accounts for latent heat flux, which is influenced by the humidity gradient between the sea and air (Iskandar et al., 2020; Pujol et al., 2022). The expression is represented as Qnet, which quantifies the contribution of net air-sea heat flux to temperature changes within the MLD.
Additionally, Equation 3 expresses shortwave radiation penetration (Qpen) as a function of the shortwave radiation received at the sea surface, with the attenuation coefficient value for photosynthetically active radiation (kPAR) assumed to be constant: 0.04 m-1 for SJ (Iskandar et al., 2013), 0.1 m-1 for JS (Son and Wang, 2015), and 0.3 m-1 for WS, MK, MS, and NP waters (Son and Wang, 2015). Certain parameters in the heat flux calculation were assumed constant due to data limitations, but they were selected based on previous studies in tropical regions. The albedo coefficient was set at 0.055, following Kumar et al. (2011), whose study was conducted in a similar tropical setting. Likewise, the kPAR value for SJ was set at 0.04 m-1, based on Iskandar et al. (2013), who analyzed the southeastern Indian Ocean, including SJ. While some studies, such as Vijith et al. (2020), estimated kPAR from direct observation, this approach was not feasible for our study. Therefore, we relied on established values from previous literature.
However, both coefficients vary with time, location, and environmental conditions. Albedo depends on factors such as cloud cover, sun angle, and surface properties, while kPAR is influenced by water turbidity, chlorophyll concentration, and suspended sediments. Assuming these coefficients to be constant in heat flux calculations may introduce several limitations, including inaccurate radiation absorption estimates, oversimplification of feedback mechanisms, and potential errors in the heat budget analysis.
Additionally, the complex topography and strong tidal mixing within the Indonesian seas pose challenges in estimating heat advection from global model outputs, as these models may not accurately capture current speed and SST variability in the region. Given the critical role of current speed and SST in both regional and global climate variability, our study underscores the need for long-term, direct oceanic observations within the Indonesian seas, particularly in the SJ region. However, since direct and long-term observations of current speed, SST, and heat flux parameters in our study area were not feasible, we validated our heat budget analysis through comparisons with previous studies, confirmation of key findings, and recommendations for further investigation.
The residual term () is calculated by subtracting the contributions of net air-sea heat flux (), horizontal advection (Advh), and entrainment (Ent) from the rate of temperature change in the MLD (). All heat budget parameters were computed for the period from January 1993 to December 2020. Positive (negative) values indicate that the ocean is gaining (losing) heat, leading to warming (cooling).
2.3 Oceanic Niño Index and Dipole Mode Index classification
The ONI and DMI were used to analyze the interannual variability of MHW characteristics and their relationship with large-scale climate phenomena, specifically ENSO and IOD. The ONI monitors El Niño and La Niña events, while the DMI tracks positive and negative IOD (pIOD and nIOD) phases. The ONI represents SST anomalies averaged over the Niño 3.4 region (170°W–120°W, 5°S–5°N), whereas the DMI quantifies the SST anomaly gradient between the western (50°E–70°E, 10°S–10°N) and the southeastern (90°E–110°E, 10°S–0°) equatorial Indian Ocean. El Niño and La Niña events are identified when the ONI exceeds 0.50°C or falls below -0.50°C, respectively, while pIOD and nIOD events are defined when the DMI surpasses 0.48°C or drops below -0.48°C (Pant et al., 2015). To assess the influence of regional climate variability on MHW occurrences in Indonesian waters, a cross-correlation analysis was conducted between MHW mean intensity and ONI/DMI.
2.4 Ekman Mass Transport and Ekman Pumping Velocity calculations
To calculate the Ekman Mass Transport (EMT) and Ekman Pumping Velocity (EPV), surface wind data is first converted into wind stress ( ) using the following (Liu et al., 2024):
where ρa is the air density, Cd is the drag coefficient, and represents the wind vector at 10 m above sea level (Equation 4). In oceanographic dynamics, EMT is governed by the interplay between wind stress and the Coriolis effect. This interaction induces convergence and divergence in surface waters, directly influencing EPV. The formulations for EPV and EMT are as follows (Price, 1981; Wang and Tang, 2014):
where ρ is the sea water density, and f is the Coriolis parameter, given by , with as Earth’s angular velocity and θ as the geographical latitude (Equation 5). Meanwhile, and represent zonal and meridional components of EMT, respectively (Equations 6, 7).
3 Results and discussions
The spatial characteristics of MHWs in the Indonesian seas over the last 40 years (1982–2021) have been investigated in previous study (Beliyana et al., 2023). Their findings indicate an increase in both the frequency and duration of MHWs, while the maximum intensity of these events has declined, likely reflecting the influence of global warming. However, the mechanisms driving MHW formation in Indonesian waters remain poorly understood. Given the ongoing warming trend, these extreme events are expected to become more frequent and intense. Therefore, this study examines the potential factors contributing to MHW formation in Indonesian waters, considering both local and remote forcings, and highlights the impact of these extreme warming events on upwelling intensity.
3.1 Local forcing influences on MHW events
To quantify the contributions of atmospheric and oceanic processes to ocean warming and the formation of MHWs in the Indonesian waters, we analyzed the heat budget of the ocean surface mixed layer (Equation 1) across six study areas (WS, SJ, JS, MK, MS, and NP). The heat budget equation includes the rate of temperature change in the MLD (Tt), net air-sea heat flux (Qnet), horizontal advection (Advh, including zonal and meridional components), entrainment velocity (Ent), and residual processes (Res, including mixing, diffusion, and numerical errors). To analyze the factors responsible for the temperature tendency (Tt) associated with MHWs, we performed a multiple linear regression (MLR) analysis to identify the dominant factors in order along with their significance levels. In this case, the analysis focuses solely on the regression coefficients of the independent variables (Qnet, Advh, and Ent). Meanwhile, the residual term, which includes errors, represents unexplained variations in the MLR model. The regression coefficients of the dominant factors for each study area are presented in Table 1.
Table 1
| No. | Heat budget terms |
Coefficient regression in each study area | |||||
|---|---|---|---|---|---|---|---|
| SJ | WS | JS | MK | MS | NP | ||
| 1. | Qnet | 0.39 | 0.24 | 0.53 | 0.32 | 0.24 | 0.25 |
| 2. | Advh | 0.69 | 0.60 | 1.10 | 0.31 | 0.68 | 0.46 |
| 3. | Ent | 0.51 | -0.08 | 1.33 | 1.03 | 1.04 | 0.82 |
Regression coefficients of each heat budget term across six study areas (Figure 1) from January 1993 to December 2020.
The most significant contributors to the temperature tendency during MHWs are highlighted: magenta for the advection term (Advh) and cyan for the entrainment term (Ent).
From 1993 to 2020, the largest contribution to in the SJ and WS regions comes from advection (, magenta shading in Table 1), reaching 0.69 and 0.60, respectively, at the 99% confidence level. In contrast, the dominant influence in the other four regions (JS, MK, MS, and NP) comes from entrainment (, cyan shading in Table 1), peaking at 1.33, 1.03, 1.04, and 0.82, respectively, at the same confidence level. This suggests that the flow of warm water from the Pacific Ocean to the Indian Ocean through Indonesian waters, known as the ITF, plays a crucial role in the heating and formation of MHWs. This influence may occur through advection, where ocean currents transport warm water masses zonally and meridionally, or through current-induced entrainment, where deeper water is drawn upward into the mixed layer due to interactions at the MLD boundary.
Our findings align with previous research, which highlights high entrainment values along the shelf break between the Java and Flores Seas, the northern coast of Nusa Tenggara, and the Makassar Strait as the main ITF pathways (Table 1). Significant entrainment is also observed in eastern Indonesian waters, including the Banda and Arafura Seas (Kida et al., 2019). However, in the WS region, entrainment has the smallest contribution among all study areas, approximately 0.08 at the 99% confidence level. This is likely due to the presence of a thick barrier layer in the WS region, which limits the upward movement of water masses into the mixed layer (Qu et al., 2005). Additionally, although most study areas are near the equator, atmospheric heat flux (Qnet) has the smallest contribution to ocean warming in SJ, JS, MK, MS, and NP. However, in WS, its contribution ranks second (Table 1). This finding is consistent with Iskandar et al. (2020), who reported a significant negative trend in net surface heat flux across the maritime region, suggesting it contributes more to SST cooling than warming.
As previously mentioned, an analysis of MHW characteristics in Indonesian waters over a 40-year period (1982–2021) revealed that the SJ region, known for its strong upwelling, experienced the most intense and prolonged MHWs compared to other regions, with an average frequency of approximately two events per year and a mean duration of around 15 days per event (Beliyana et al., 2023). These extreme warming conditions pose a significant threat to marine ecosystems and require urgent attention from local governments. Understanding these mechanisms is a crucial first step in effectively mitigating the impacts of MHW-related disasters, particularly in upwelling regions. Therefore, the detailed discussion of the heat budget assessment will focus exclusively on the SJ region, while other areas are not included.
A distinct seasonal pattern of SST evolution was observed in the SJ region from January 1, 1993, to December 31, 2020 (Figure 2a). The lowest SST values, or negative SST anomalies, occurred during the southeast (SE) monsoon (July–August; JJA), indicating the upwelling season, which is characterized by the rise of cold, nutrient-rich water from deeper layers to the surface (Figures 2a, b). In contrast, positive SST anomalies were more prominent during the northwest (NW) monsoon (December–February; DJF). Further analysis revealed that MHWs can occur in this region during both the NW and SE monsoons (Figure 2b).
Figure 2
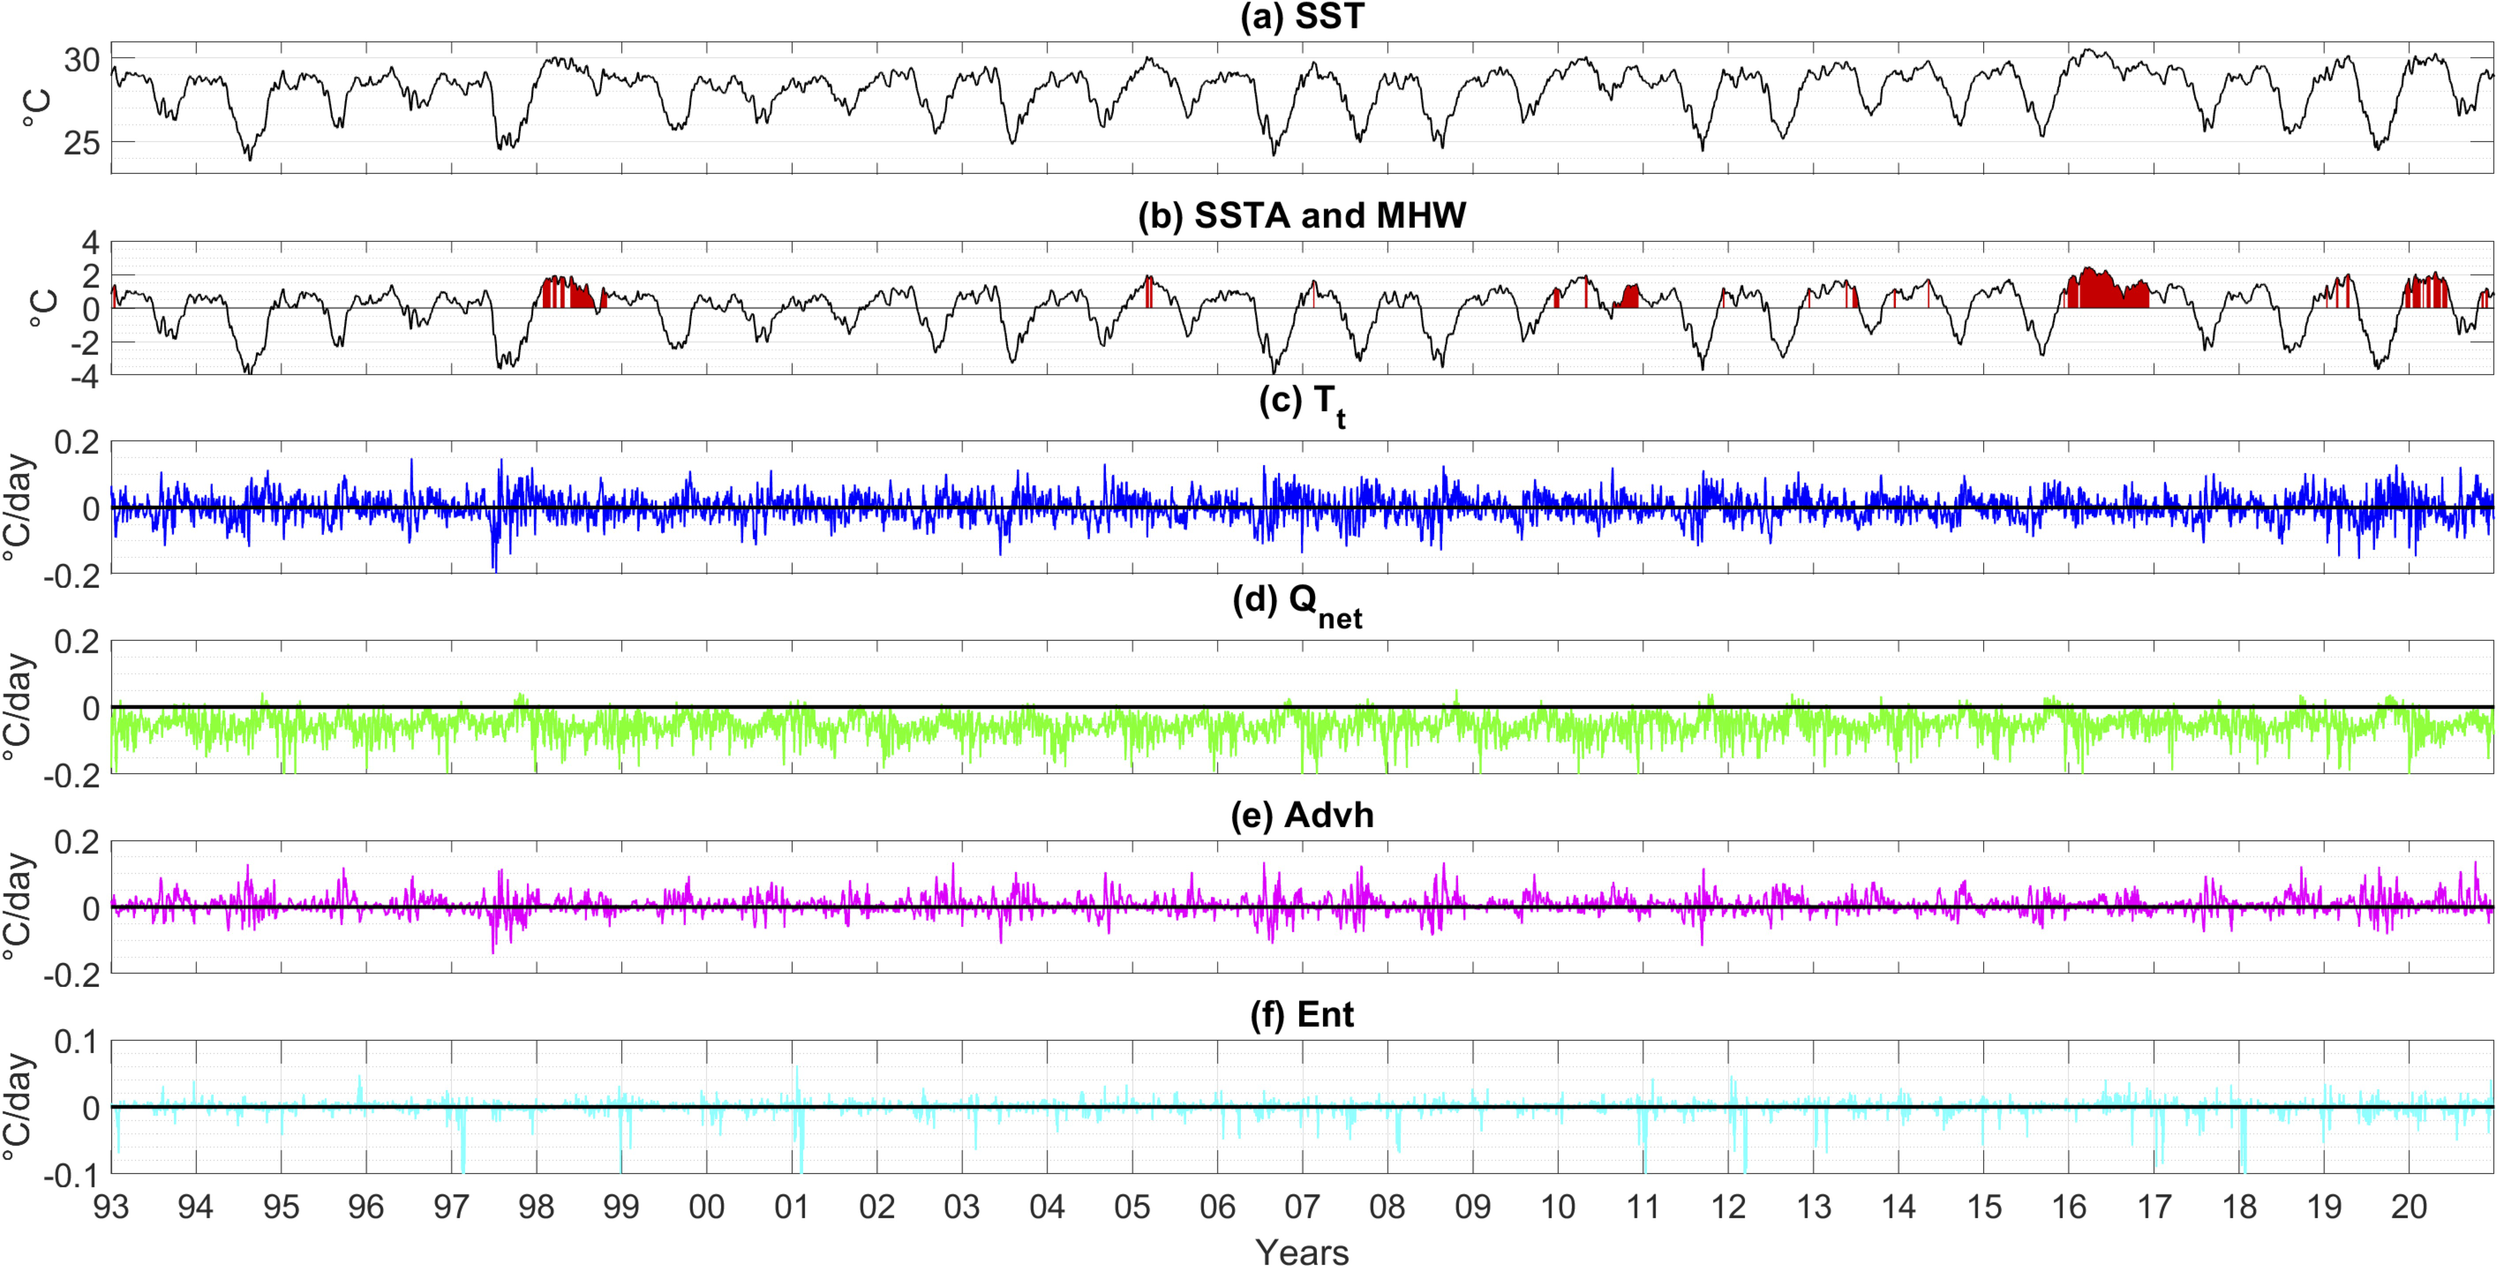
Time series of (a) daily SST (°C) and (b) daily SST anomalies (black line; °C) with the occurrence of MHWs (red shading). Panels (c–f) show the anomalies of heat budget terms (Tt, Qnet, Advh, and Ent) from Equation 1 (°C/day). The blue, green, magenta, and cyan lines represent Tt, Qnet, Advh, and Ent, respectively.
Figure 2e presents the time series of anomalies in advection heat budget term (Advh) for the SJ region. As indicated earlier, advection plays the most significant role in temperature tendency Tt, with a regression coefficient of 0.69 at the 99% confidence level (Table 1). These findings highlight the crucial role of ocean dynamics in driving SST warming and MHW events. A decomposition of the horizontal advection process within the MLD in SJ from 1993 to 2020 reveals that zonal currents (u), flowing from east to west, dominate the advection process (figure not shown). Some studies suggest that a major contributor to heat advection in the Indonesian seas is the ITF, which transfers heat from the Pacific Ocean to the Indian Ocean through the Indonesian archipelago, including the southern Java region (Sprintall et al., 2014; Lee et al., 2015; Hu and Sprintall, 2017; Iskandar et al., 2020; Ningsih et al., 2021). Additionally, the ITF plays a crucial role in the formation of upwelling along the southern coast of East Java, influencing approximately 55–65% of the upwelling system (Kuswardani and Xiao, 2014). However, research by Wirasatriya et al. (2020) suggests that Ekman dynamics, including upwelling and downwelling, also influence SST distribution along the south coast of Java, contributing to fluctuations in sea temperature. Further investigation is needed to determine whether heat advection is primarily driven by Ekman dynamics (upwelling and downwelling) or by the ITF.
The second most dominant local factor influencing the temperature tendency in SJ (Figure 2c) is entrainment (Figure 2f), with a regression coefficient of 0.51 at a 99% confidence level (Table 1). We suspect that the strong influence of advection in these waters amplifies the impact of ocean currents at the MLD boundary, significantly affecting MLD variations. This process destabilizes the water column and contributes to ocean warming. Additionally, our analysis of net air-sea heat flux (Figure 2d) indicates that this local forcing has the smallest contribution to SST warming, with a regression coefficient of 0.39 at a 99% confidence level (Table 1). Overall, the predominantly negative Qnet values suggest a stronger contribution to ocean cooling than warming.
3.2 Remote forcing influences
In this section, we explore the physical mechanisms driving MHWs in Indonesian waters. In addition to local forcing, remote climatic influences, such as ENSO and IOD, likely play an important role in triggering these events. ENSO, the dominant global climate anomaly on an interannual time scales (Neelin et al., 1998; Timmermann et al., 2018), strongly influences MHWs in regions where SST variability is governed by its phases (Oliver et al., 2018; Heidemann and Ribbe, 2019). This phenomenon has widespread ecological consequences, including disruptions to marine ecosystems like the Peruvian upwelling ecosystem (Quispe-Ccalluari et al., 2018).
During El Niño events, weakened trade winds reduce the pressure gradient that drives the ITF, leading to a weakening of ITF transport (Sprintall et al., 2014). This reduced transport alters ocean heat distribution and vertical mixing in Indonesian seas. A weaker ITF reduces the advection of Pacific thermocline water into the region, weakening vertical mixing. Consequently, surface waters warm more easily due to enhanced stratification and reduced oceanic heat exchange. Additionally, decreased cloud cover and precipitation over the western Pacific, increase solar radiation absorption, further amplifying SST anomalies and creating favorable conditions for MHW development.
Meanwhile, during La Niña events, strengthened trade winds intensify the ITF, increasing the advection of Pacific thermocline waters into Indonesian seas (Meyers, 1996; Li et al., 2023). While this process generally promotes surface cooling, in certain regions, weakened surface winds due to atmospheric pressure shifts can suppress surface mixing. This leads to stronger stratification, allowing heat to accumulate in the upper ocean, potentially fostering MHW formation despite the enhanced ITF.
Similarly, the IOD modulates oceanic and atmospheric conditions in the region. During pIOD events, strong easterly winds drive upwelling along the eastern Indian Ocean near Sumatra and Java, cooling surface waters (Li et al., 2023). Conversely, during nIOD events, weakened easterly winds reduce westward heat transport, allowing warm surface waters to accumulate in the eastern Indian Ocean near Indonesia. Additionally, weaker winds reduce surface evaporation and air-sea heat loss, prolonging SST anomalies and creating conditions favorable for MHW development.
Although ENSO and IOD are considered primary remote drivers of MHWs, their impacts vary across different regions of Indonesia and cannot be generalized. To quantify these relationships, we conducted a cross-correlation analysis between the ENSO and IOD indices (ONI and DMI, respectively) and MHW intensity from 1982 to 2021 across six specific study areas, as shown in Figure 3. These areas were selected due to their notable MHW characteristics, making them particularly relevant for investigating potential drivers.
Figure 3
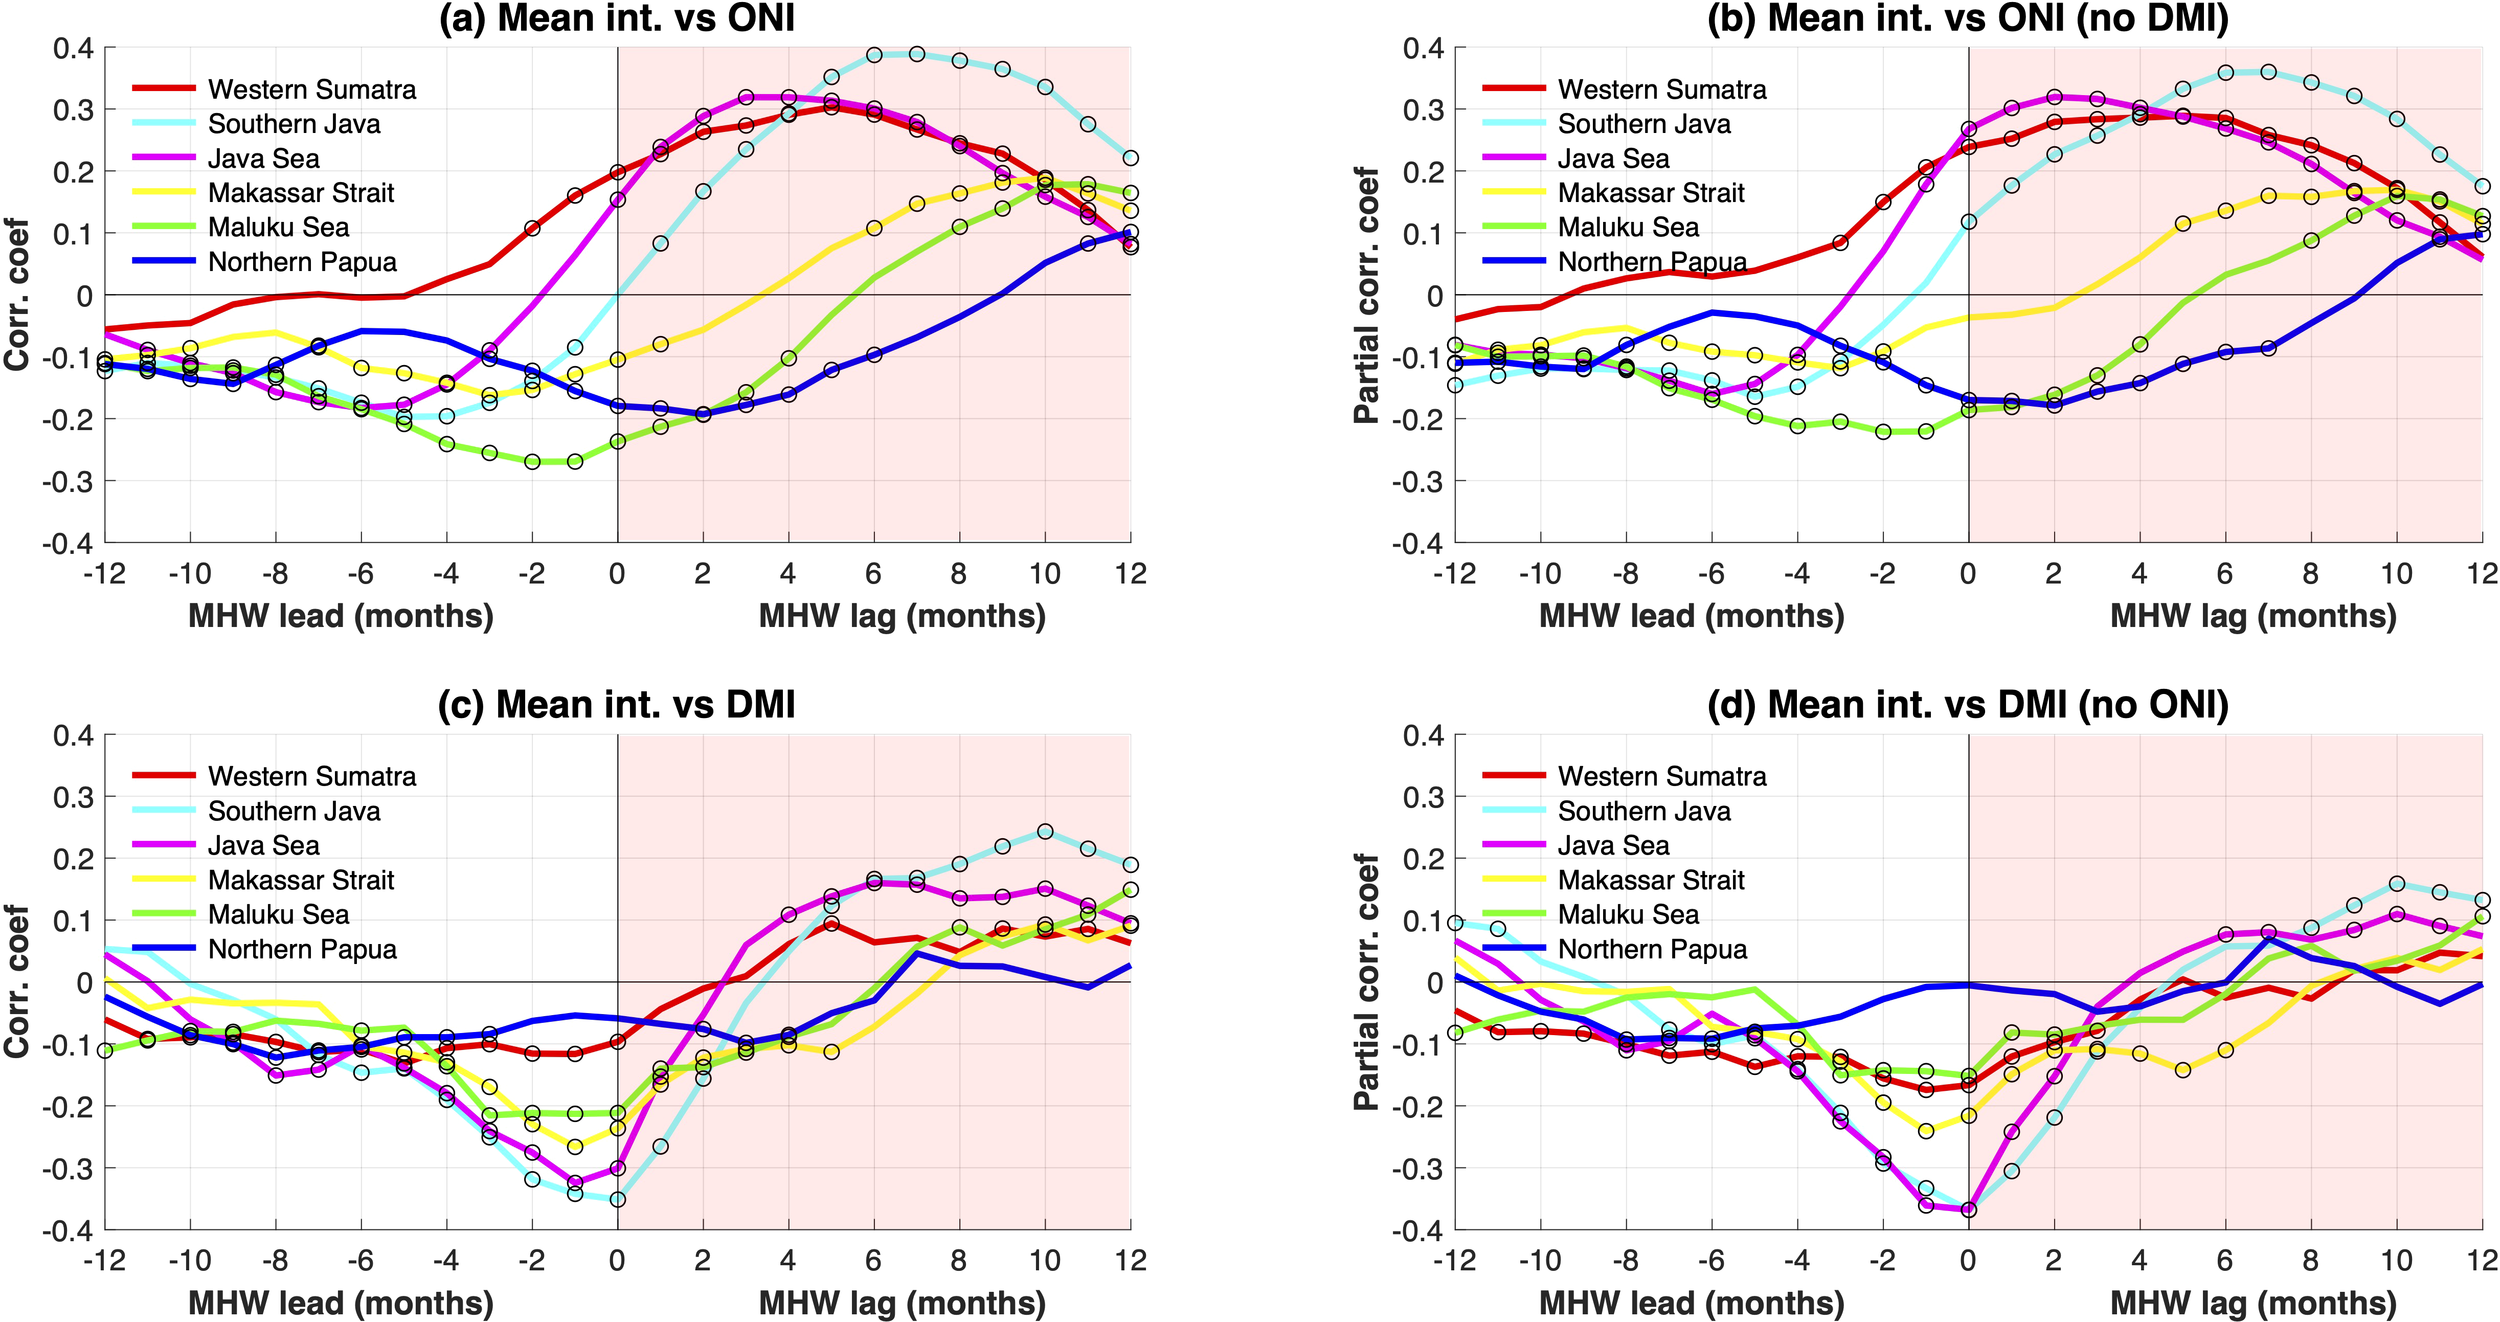
Cross-correlation between MHW intensities and four different indices: (a) ONI, (b) partial ONI, (c) DMI, and (d) partial DMI. The red, cyan, magenta, yellow, green, and blue lines represent the six study regions: WS, SJ, JS, MK, MS, and NP, respectively. Black circles denote statistically significant correlation at the 90% confidence level (p < 0.1).
MHW intensity was selected as the primary metric to reflect the strength of MHWs. Our analysis assumes that ENSO and IOD drive the occurrence of MHWs rather than a reciprocal relationship. Therefore, we focused on the positive x-axis of the cross-correlation results, which represents MHW lags. A shift in time lags indicates that ENSO and IOD events precede MHW development by a few months.
Figure 3a illustrates the cross-correlation between MHW intensity and ONI while accounting for the influence of the IOD. The results reveal significant time-lagged correlations, suggesting that ENSO influences MHWs with a delay of 2–10 months, depending on the region. In the western Indonesian seas (WS, SJ, JS, and MK), El Niño appears as a primary driver of MHWs, showing positive correlations (0.2–0.4) at lags of 3–10 months. This effect is likely attributed to reduced ITF transport and decreased vertical mixing, which facilitate ocean warming. Meanwhile, in the eastern Indonesian seas (MS and NP), La Niña appears to enhance MHW formation, displaying negative correlations (-0.2 to -0.25) with shorter time lags (0–2 months). This pattern is likely linked to increased stratification and suppressed mixing, which allow warm anomalies to persist in the upper ocean. Furthermore, the partial cross-correlation analysis (Figure 3b) reinforces these findings, demonstrating that ENSO significantly influences MHWs even when the effects of the IOD are removed. This suggests that ENSO-driven oceanic heat transport plays a dominant role in shaping Indonesian SST variability.
A significant relationship between MHW intensity and DMI was also identified while accounting for the influence of ENSO (Figure 3c). Across the six study areas (WS, SJ, JS, MK, MS, and NP), a negative correlation ranging from -0.1 to -0.35 was observed, with a time lag of 0–3 months. However, in NP, the lag extended to 2–4 months. This negative correlation suggests that nIOD (pIOD) plays a crucial role in enhancing (suppressing) MHWs in Indonesian waters. During nIOD, the western tropical Indian Ocean experiences anomalous SST cooling, while the southeastern tropical Indian Ocean, near Indonesia, is dominated by positive SST anomalies. This phase can significantly contribute to ocean warming and the formation of MHWs in the region.
Furthermore, we conducted a partial cross-correlation analysis between MHWs and the IOD alone (Figure 3d). The results revealed a higher correlation coefficient, especially in WS, SJ, and JS, compared to Figure 3c. Notably, no significant correlation was found in NP, suggesting that the IOD has little to no impact on MHWs in the eastern Indonesian region, especially in NP (Figure 3d, blue line).
Overall, the ordinary and partial correlation analysis between MHW intensity and DMI (Figures 3c, d) show noticeably different results, in contrast to the cross-correlation between MHW intensity and ONI (Figures 3a, b), which show a more consistent pattern. These findings suggest that the influence of the IOD on MHW formation in Indonesian waters is weaker compared to ENSO. Another important finding is that SJ (represented by cyan line) exhibits the highest correlation coefficient among the six study areas (Figures 3a, d). This indicates that remote forcing associated with ENSO and IOD plays a significant role in driving MHWs is SJ, potentially leading to extreme temperatures and severe impacts on marine ecosystems, such as the weakening of upwelling.
To deepen our understanding of how ENSO and IOD influence MHWs, we further examined their relationship using scatter plots. Based on the cross-correlation analysis in Figure 3, ENSO and IOD events precede MHW formation by an average lag of approximately three months. Therefore, we calculated the annual total days and cumulative intensity of MHWs from January 1 to December 31 of the following year (denoted as +1 year) and aligned these with ENSO and IOD indices from August to December. This period was selected because ENSO and IOD signals were consistently stronger during these months over the past 40 years (Beliyana et al., 2023; Ningsih et al., 2023). As discussed earlier, the cross-correlation analysis (Figure 3) reveals that SJ has the highest correlation coefficient among the six study regions, emphasizing the strong influence of ENSO and IOD on MHWs in this area. To further quantify the impact of remote forcing, we conducted a scatter plot analysis focusing exclusively on SJ, as shown in Figure 4, while scatter plots for the other regions are not presented.
Figure 4
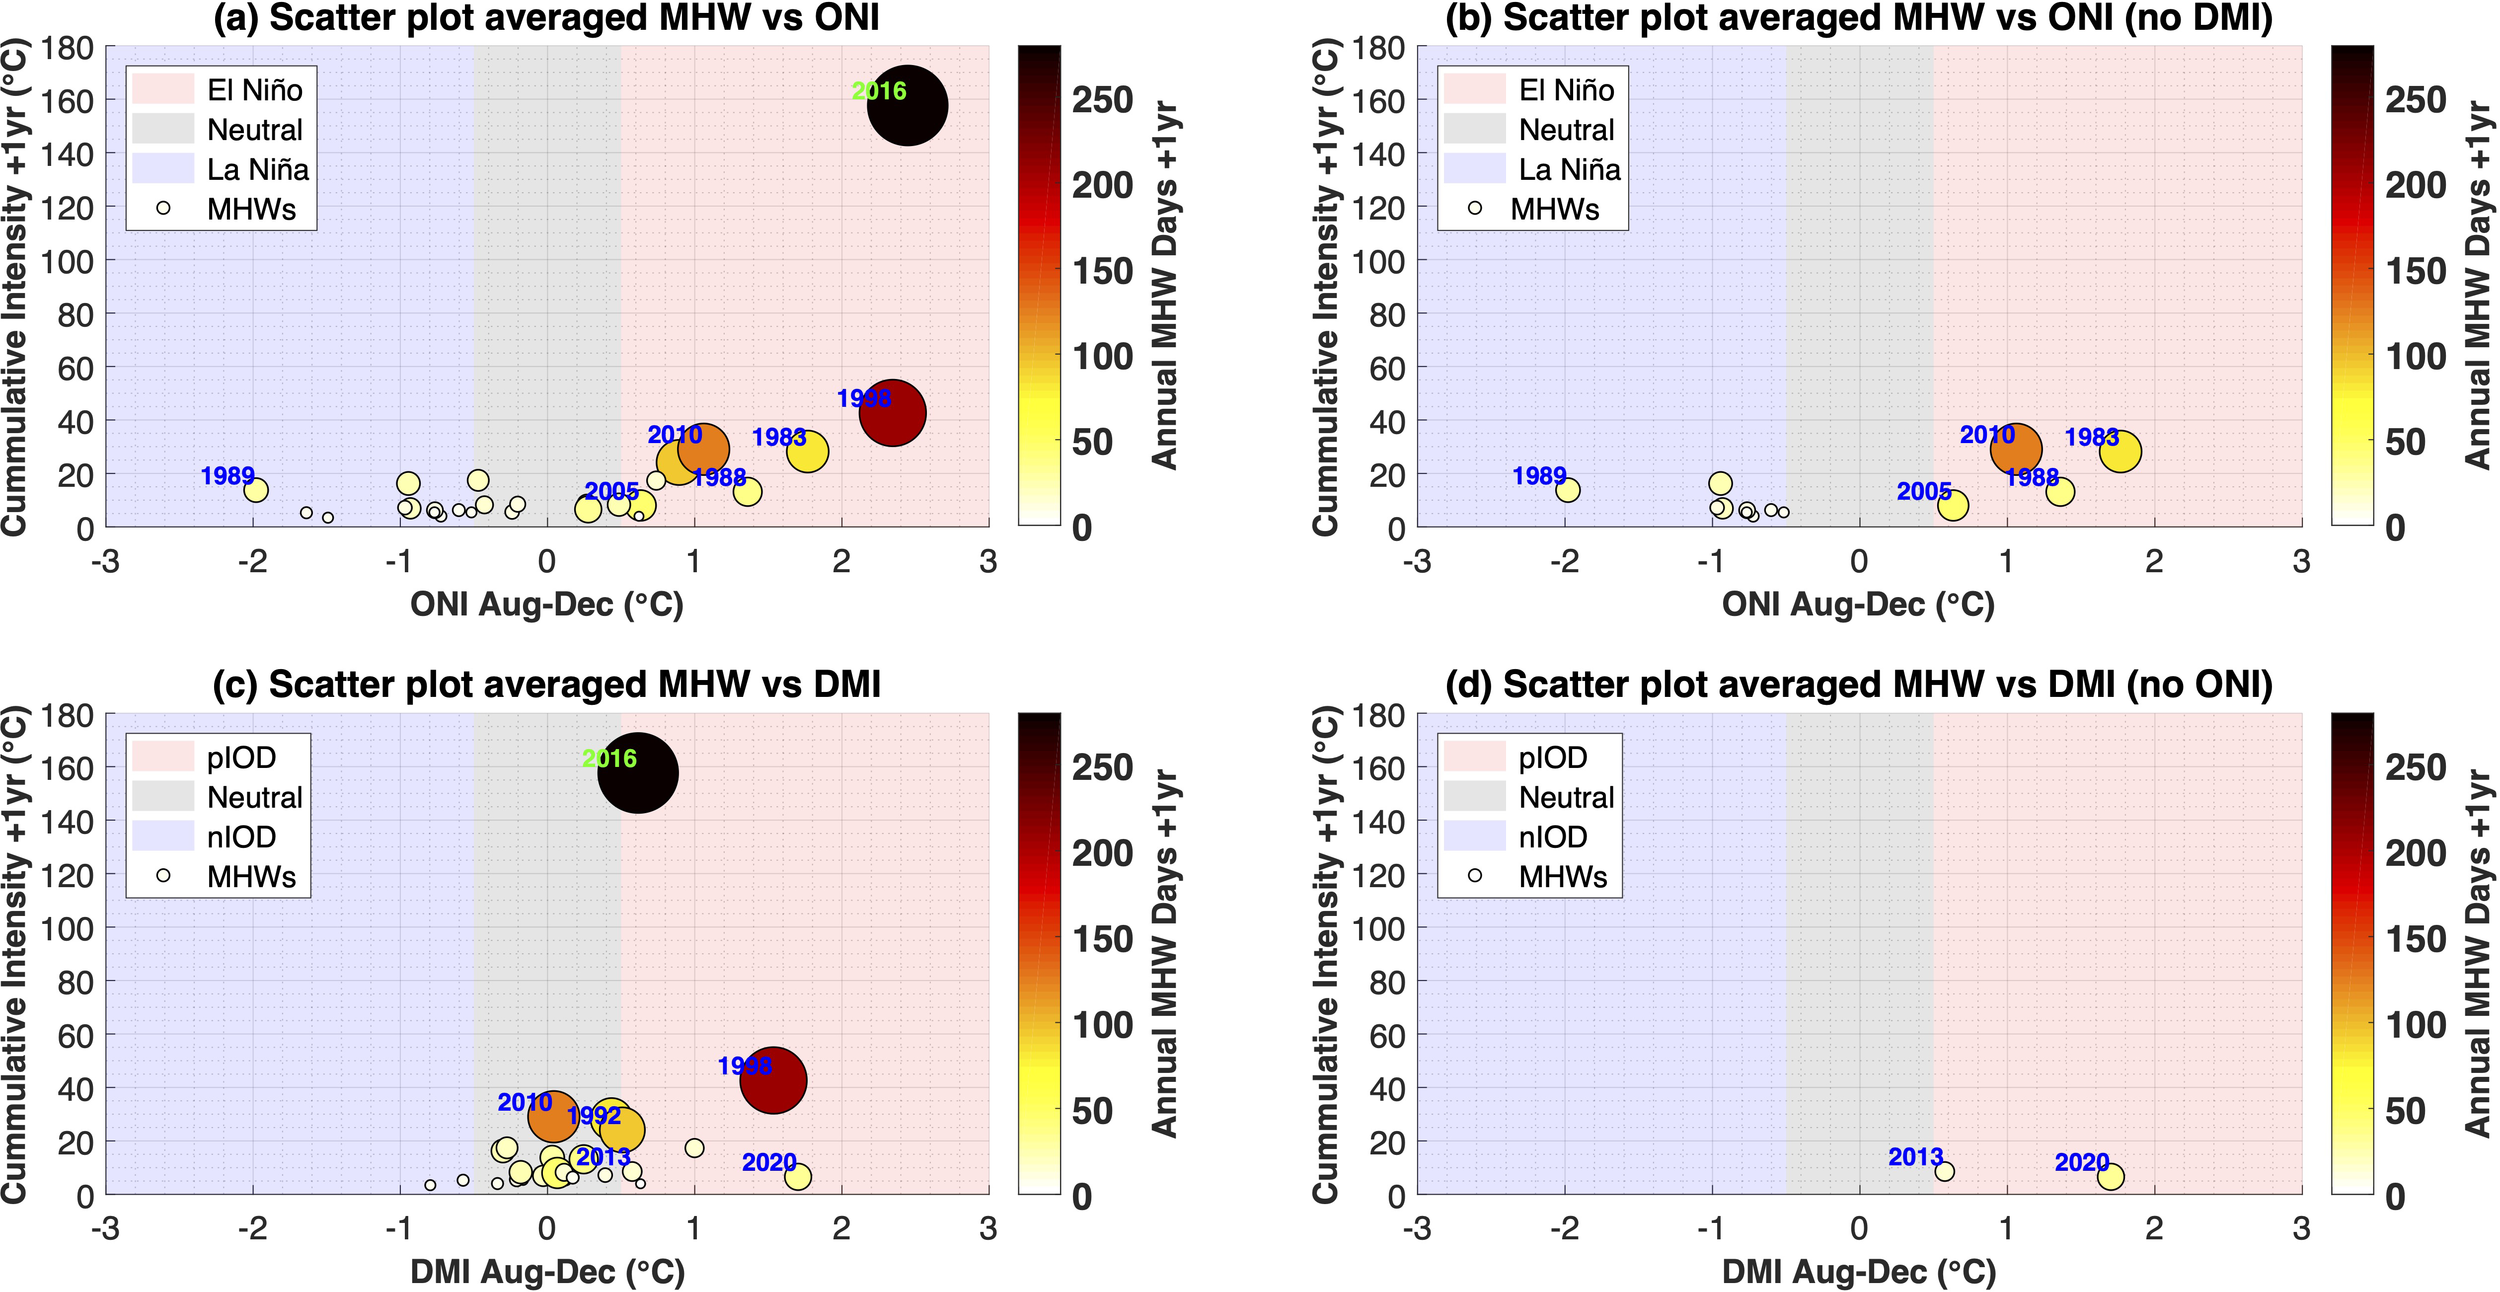
Scatter plots illustrating the relationship between annual MHW events in SJ and four climate indices: (a) ONI, (b) DMI, (c) ONI (excluding DMI influence), and (d) DMI (excluding ONI influence). Blue shades indicate nIOD and La Niña events, red shades represent pIOD and El Niño events, and gray shades correspond to neutral phases.
Figure 4a visualizes the annual distribution of MHW events in SJ during different ENSO phases. A total of 27 MHW events were identified in this region, with 11 occurring during La Niña, 7 during neutral conditions, and 9 during El Niño. Notably, the most intense MHWs occurred in 2016, with a cumulative intensity of 157.63°C and a total duration of 298 days. This extreme event coincided with the transition from a strong El Niño to a La Niña phase (El Niño decay) and stands out as the most severe MHW event in the 40-year record (1982–2021). Given its significant implications for marine ecosystems, including biodiversity loss, this event warrants particular attention.
Similarly, Figure 4c illustrates the occurrence of MHWs during different IOD phases. In total, 26 MHW events were recorded in SJ, with the highest frequency occurring during the neutral IOD phase. The most intense MHWs, observed in 2016 and 1998, occurred when a pIOD phase transitioned into a nIOD phase (pIOD decay). During these periods, positive SST anomalies shifted towards Sumatra, contributing to regional SST warming and significantly influencing MHW formation in Indonesian waters.
To isolate the individual effects of ENSO and IOD, we examined MHW occurrence by removing the influence of IOD from ENSO and vice versa. When considering only the isolated ENSO effects, the number of MHW events in SJ decreased to 13 (Figure 4b), compared to 27 in the combined analysis. In contrast, under the isolated IOD effect over 40-year period, only two MHW events were detected (Figure 4d). A similar pattern was observed across the five other study regions (WS, JS, MK, MS, and NP), where only 1–3 MHW events were recorded under isolated IOD influence (Table 2). These results suggest that the impact of IOD on MHW formation is significantly weaker than that of ENSO. The findings from the annual mapping of MHW events at different ENSO and IOD phases are in line with the previous analysis that the influence of ENSO is more dominant than the influence of IOD on the formation of MHWs in Indonesian waters.
Table 2
| No. | Study area | Number of MHW events | |||
|---|---|---|---|---|---|
| ENSO | ENSO (no IOD) | IOD | IOD (no ENSO) | ||
| 1. | WS | 29 | 13 | 29 | 3 |
| 2. | SJ | 27 | 13 | 26 | 2 |
| 3. | JS | 32 | 13 | 32 | 2 |
| 4. | MK | 31 | 14 | 31 | 3 |
| 5. | MS | 30 | 17 | 30 | 1 |
| 6. | NP | 30 | 15 | 30 | 3 |
Number of MHW events across the six areas of interest under different climate conditions: ENSO, isolated ENSO, IOD, and isolated IOD.
3.3 Impact of MHWs on upwelling intensity (case study: Southern Java)
In recent years, numerous studies have documented MHWs in various regions worldwide, including their underlying physical mechanisms (Heidemann and Ribbe, 2019; Feng and Shinoda, 2019; Fewings and Brown, 2019; Behrens et al., 2019; Qi et al., 2022). Some studies have also examined the relationship between MHWs and upwelling, particularly the role of upwelling in mitigating the impacts of MHWs (Seabra et al., 2019; Varela et al., 2021). However, the effect of MHWs on upwelling has received comparatively less attention (Gruber, 2011; García-Reyes et al., 2015; Sousa et al., 2020), despite the fact that extreme ocean warming events can have severe economic consequences for fisheries (Mills et al., 2013).
Analysis of the spatial characteristics of MHWs in the Indonesian seas over the last 40 years (1982–2021) reveals that SJ region experienced longer-duration and higher-intensity MHWs than other regions, with events lasting over 15 days and reaching temperature anomalies exceeding 2°C (Beliyana et al., 2023). The extreme MHWs are primarily driven by horizontal advection and the strongly influenced by ENSO and IOD, as discussed in Section 3.1 and 3.2. Moreover, SJ is known for its seasonally intense upwelling, which has been extensively studied in previous research (Susanto et al., 2001; Susanto and Marra, 2005; Ningsih et al., 2013; Wirasatriya et al., 2020; Mandal et al., 2022). Given these factors, our analysis focuses on the impact of MHWs on upwelling intensity in this region.
Upwelling in SJ can be categorized into two types: coastal upwelling, characterized by high chlorophyll-a concentrations (0.35–1.15 mg/m3) and SST below 28°C, and non-coastal upwelling, which has lower chlorophyll-a concentrations (0.21–0.49 mg/m3). In this study, upwelling regions in SJ are further classified into coastal and non-coastal zones, with coastal upwelling occurring in southern West Java (WJ1), southern Central Java (CJ1), and southern East Java (EJ1), while non-coastal upwelling is represented by WJ2, CJ2, and EJ2, as illustrated in Figure 5. To evaluate the impact of MHWs on upwelling, we use MHW occurrences in coastal upwelling zones as a reference period for identifying MHWs. Notably, over the past 40 years, coastal upwelling regions have experienced more intense MHWs compared to non-coastal upwelling zones (Beliyana et al., 2023).
Figure 5
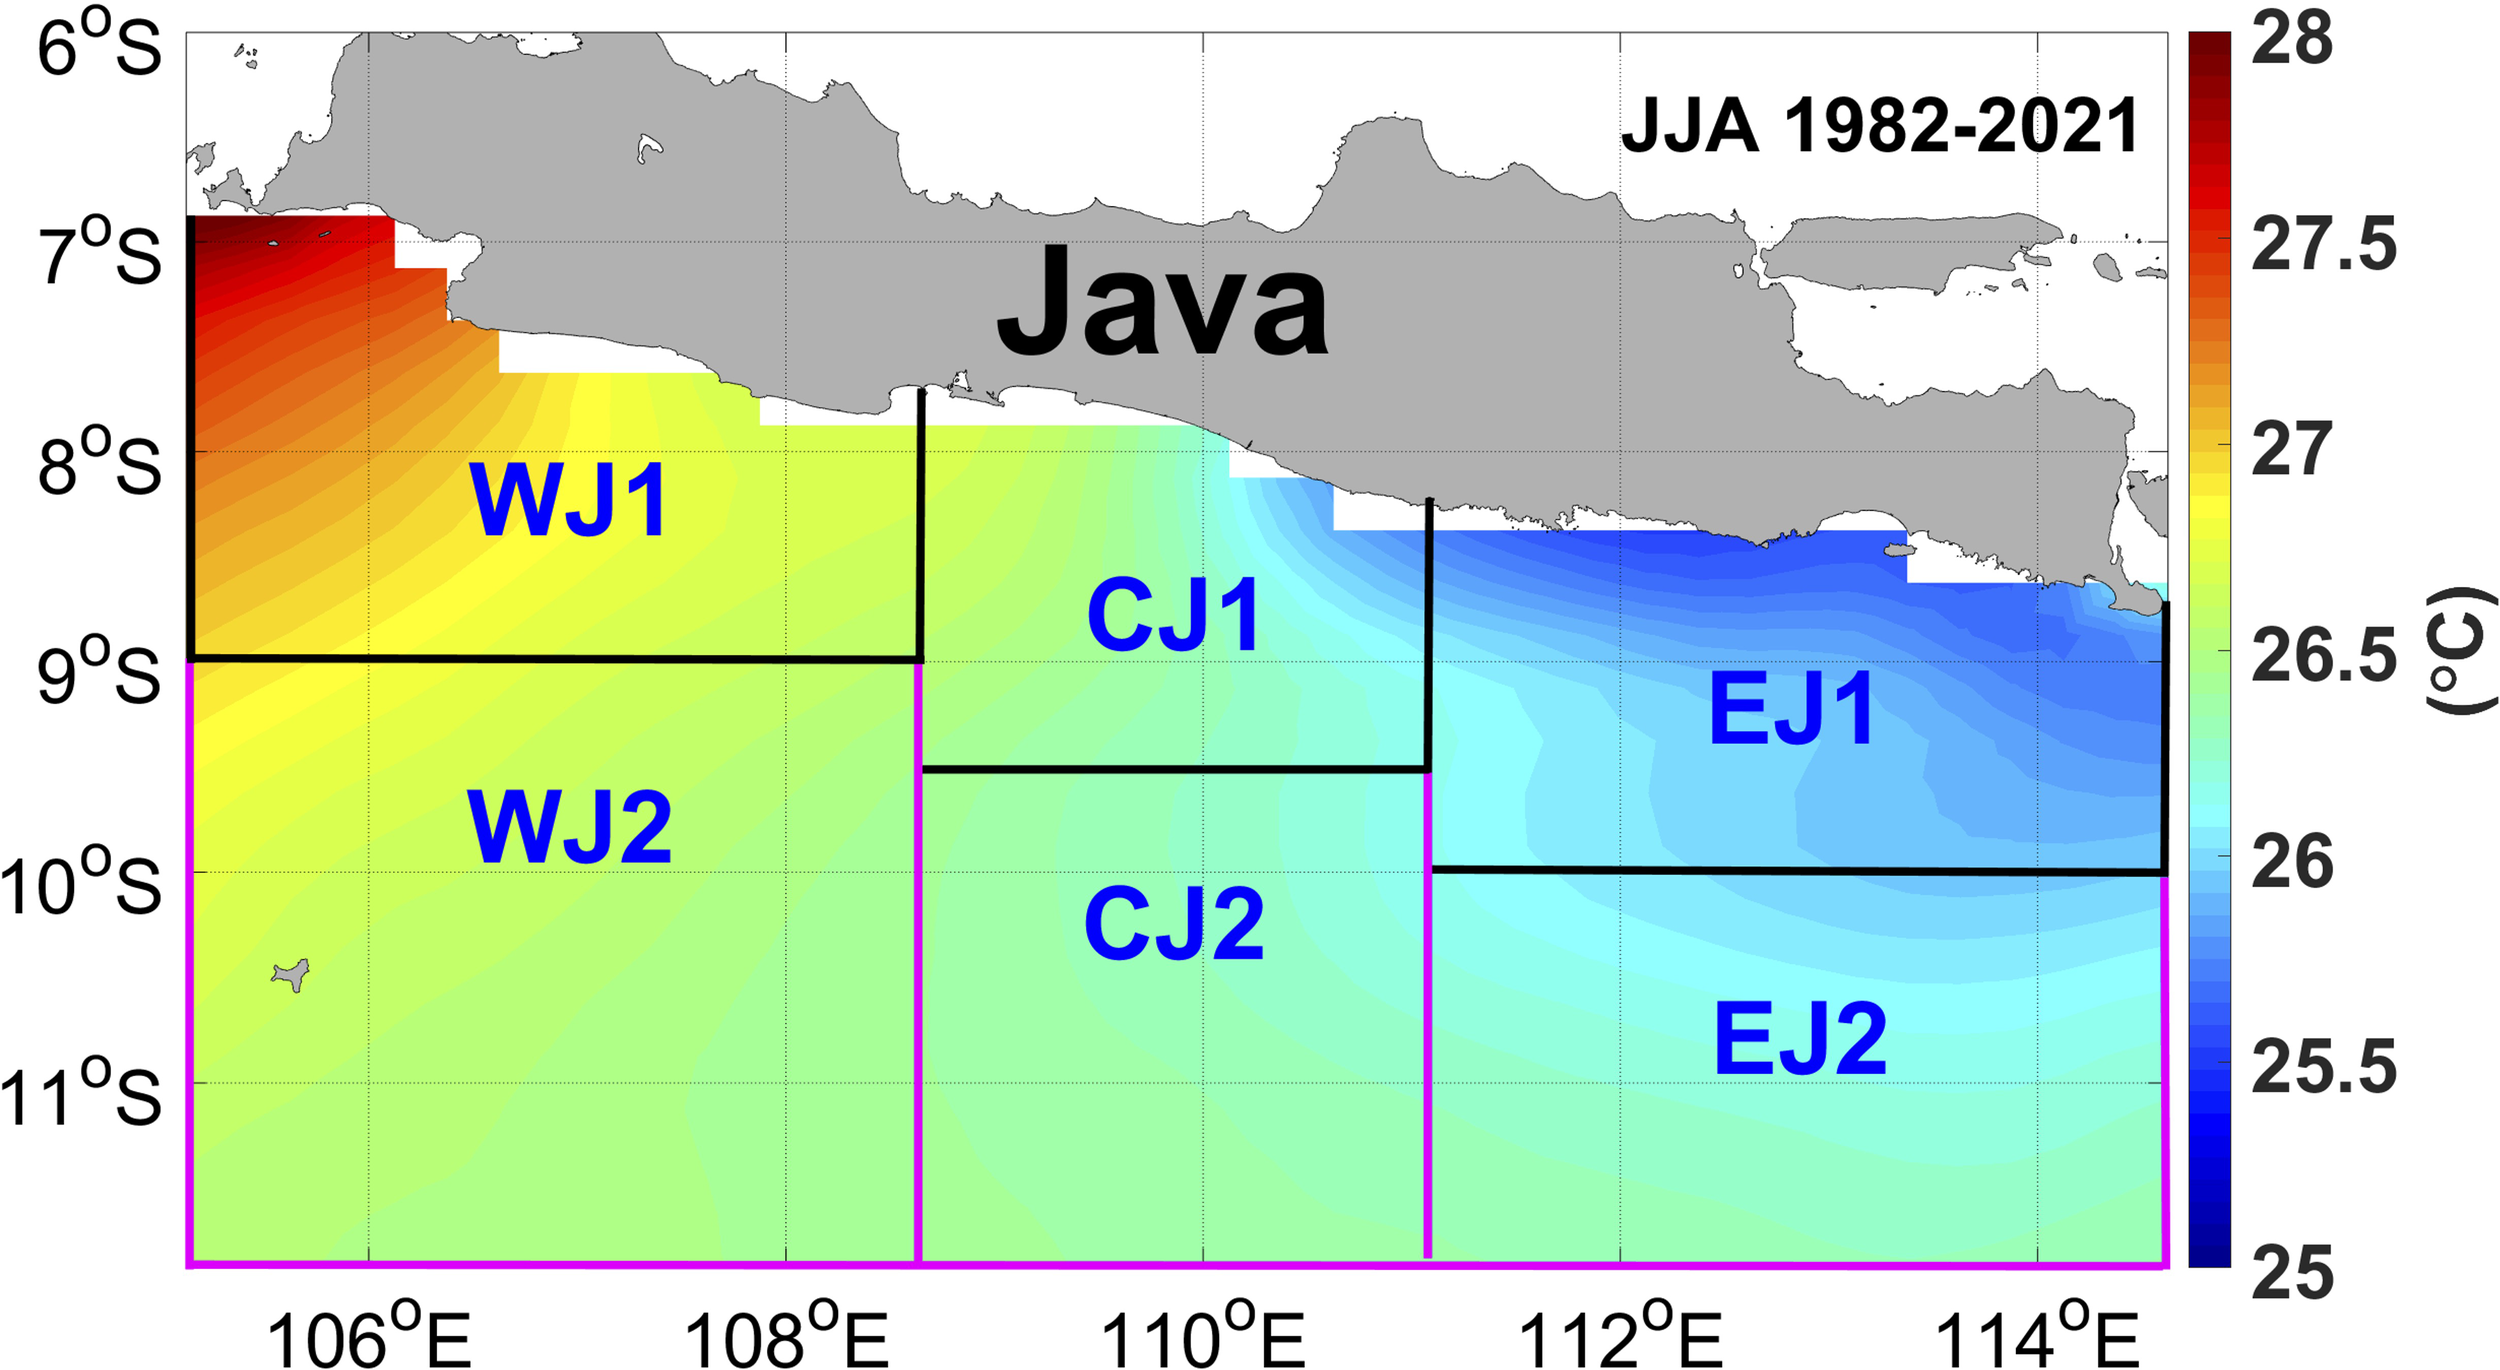
Study area map of SJ. Black lines indicate coastal upwelling regions (WJI, CJ1, and EJ1) while magenta lines mark non-coastal upwelling areas (WJ2, CJ2, and EJ2).
Due to the availability of chlorophyll-a data only from September 1997 onward, our analysis of MHW impacts on upwelling intensity focuses on the period from January 1998 to December 2021. Specifically, we selected the SE monsoon (JJA) from 1998 to 2021 for further analysis, as SST exhibits significant cooling during this period compared to other seasons, reaching as low as 26°C, indicating intense upwelling. During this season, the predominant southeasterly winds drive surface currents that are deflected to the left due to the Coriolis effect, resulting in offshore-directed EMT. This offshore transport creates a mass deficit along the SJ coastline, triggering coastal upwelling, which brings cold, nutrient-rich water from deeper layers to the surface. Our findings are consistent with previous studies, which reported that EMT reaches its peak in August (>2 m2/s), weakens by November, and then reverses direction during the NW monsoon (DJF) as northwesterly winds prevail, leading to coastal-directed EMT and subsequent downwelling (Wirasatriya et al., 2020). In this study, we found that EPV values during the JJA season reached a maximum of approximately 6 × 10⁻⁵ m/s.
3.3.1 Characteristics of upwelling intensity decline across different MHW phases
Between 1998 and 2021, a total of 11, 6, and 4 independent MHW events were observed in WJI, CJ1, and EJ1, respectively during the SE monsoon (JJA). These events occasionally occurred on the same date across different regions. The average duration of MHWs was 15.94 days in WJ1, 18.02 days in CJ1, and 21.81 days in EJ1. The results indicate that WJI experienced the highest frequency of MHWs but with the shortest duration, whereas EJ1 had the lowest frequency but the longest duration, lasting approximately three weeks per event. On average, MHWs in all three regions lasted between two and three weeks.
To better understand the influence of MHWs on upwelling intensity in each study area, we analyzed the spatial distribution of SST anomalies across three phases: pre-MHW, during MHW, and post-MHW. The pre-MHW and post-MHW phases were each defined as a two-week period, spanning days -14 to -1 before MHW onset and days +1 to +14 after the event, respectively. The duration of the MHW phase varied depending on the specific event and location. In this study, we examined anomalies in SST, chlorophyll-a, EPV, and wind speed across these phases.
3.3.1.1 SST anomalies
The spatial distribution of SST anomalies (Figure 6) reveals that during the pre-MHW phase, all three regions exhibited warming conditions (Figures 6a–c), with WJ experiencing lower temperatures than CJ and EJ. However, SST anomalies intensified significantly during MHWs, with maximum anomalies exceeding 1°C (Figures 6d–f). Two weeks after the MHWs, SST anomalies declined in all regions, leading to substantial cooling (Figures 6g–i). WJ exhibited the fastest rate of cooling compared to CJ and EJ. Interestingly, despite the overall cooling trend, positive SST anomalies persisted in CJ during the post-MHW phase (Figure 6h). In contrast, EJ showed pronounced warming before and during MHWs but exhibited notable cooling afterward. These results suggest that intense and prolonged MHWs in EJ were counteracted by stronger upwelling activity compared to WJ and CJ. The findings indicate that upwelling plays a crucial role in mitigating warm water anomalies through cold water intrusion, particularly in EJ (Figure 6i).
Figure 6
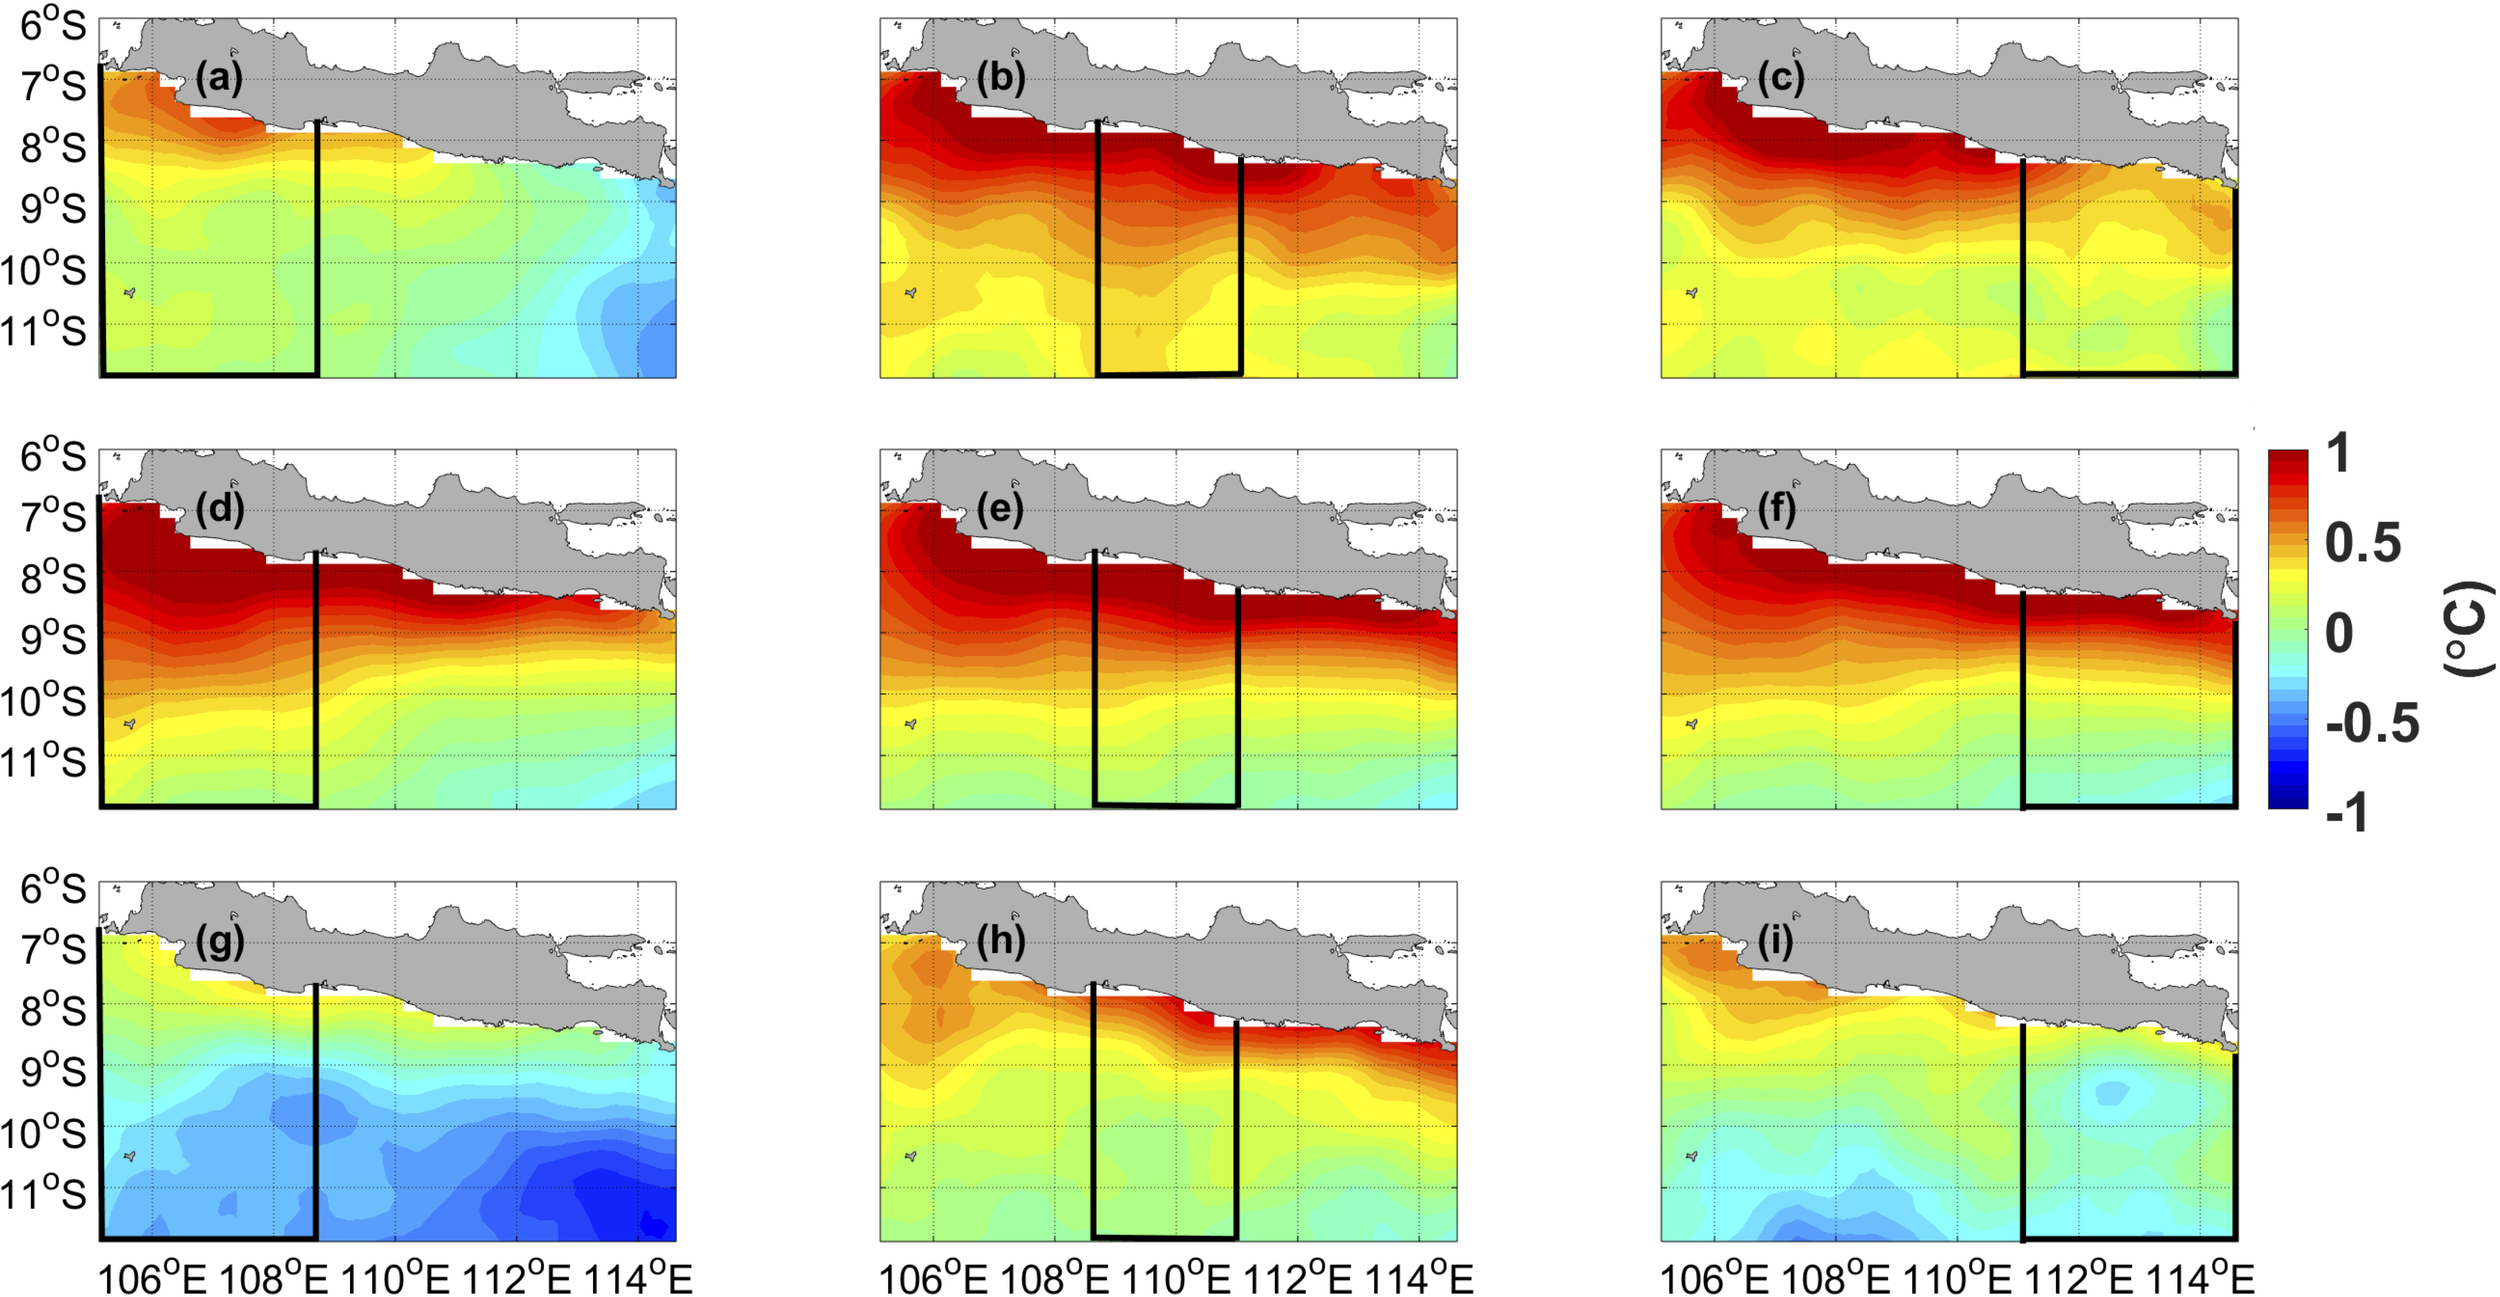
Spatial distribution of SST anomalies in SJ across different MHW phases. (a–c) represent the pre-MHW phase, (d–f) correspond to the MHW period, and (g–i) illustrate the post-MHW phase. Each column indicates a specific region: (a, d, g) for West Java (WJ); (b, e, h) for Central Java (CJ); and (c, f, i) for East Java (EJ).
3.3.1.2 Chlorophyll-a anomalies
The distribution of chlorophyll-a anomalies, a key parameter in upwelling studies, is shown in Figure 7. Ocean warming enhances water column stratification, reducing nutrient mixing and subsequently decreasing chlorophyll-a concentrations (Doney, 2006). This process can have negative implications for fisheries productivity. During the pre-MHW phase, positive SST anomalies (Figures 6a–c) corresponded with negative chlorophyll-a anomalies (Figures 7a–c), particularly in coastal upwelling regions (WJ1, CJ1, and EJ1).
Figure 7
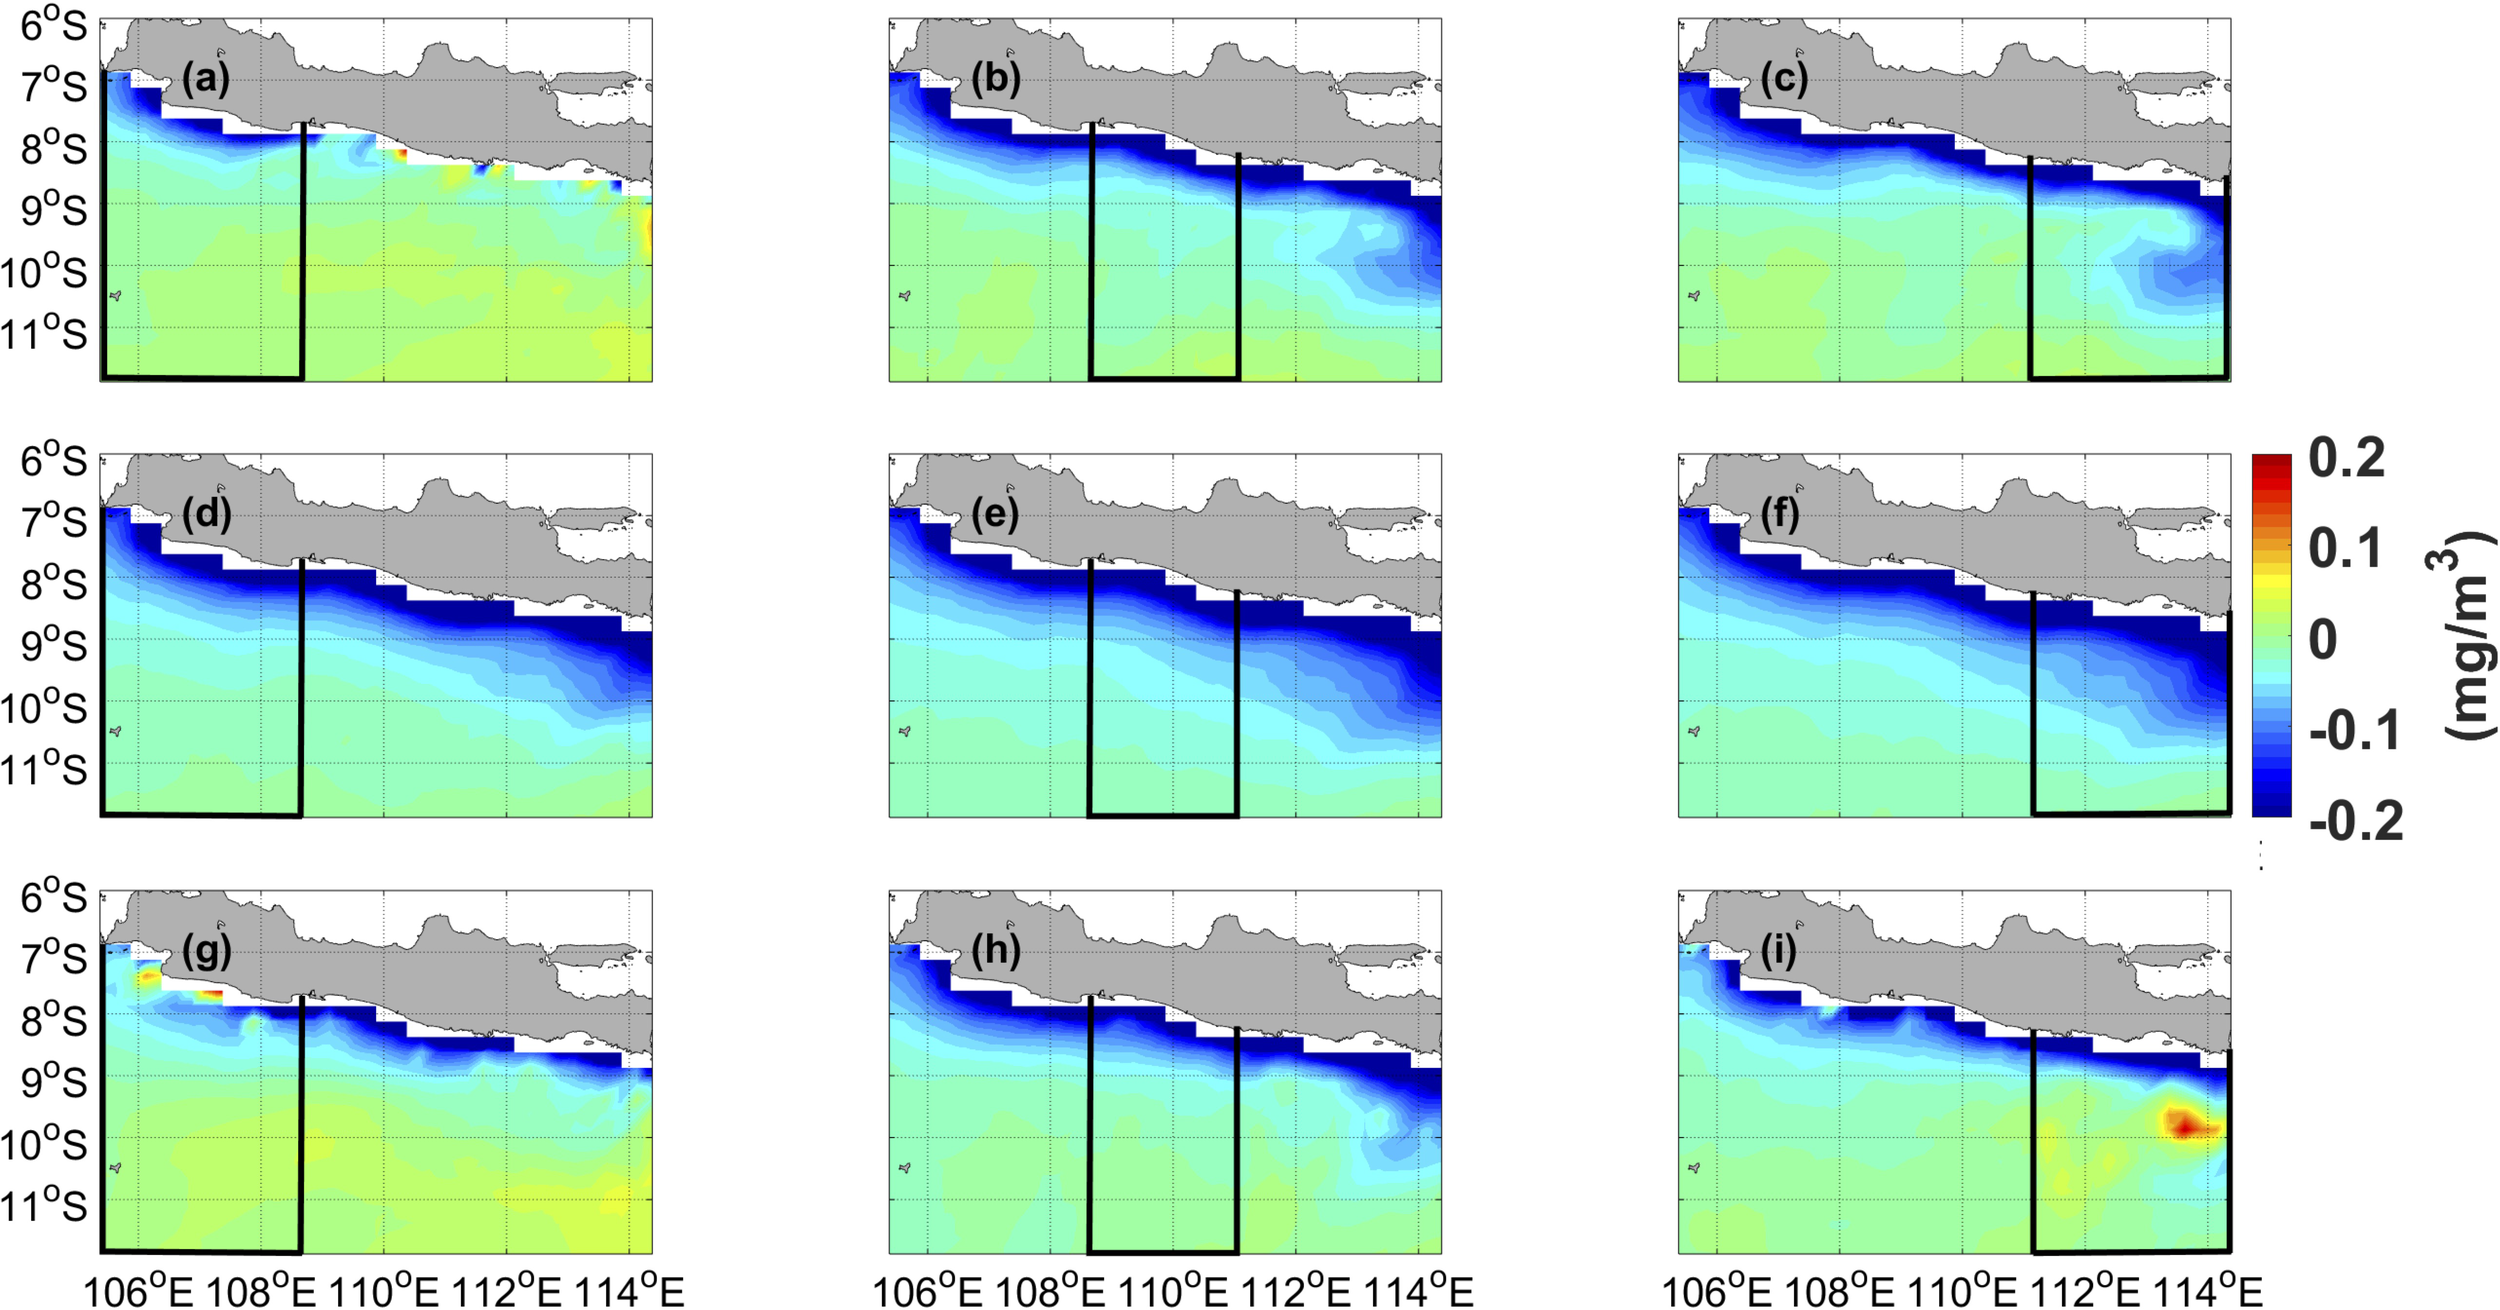
Spatial distribution of chlorophyll-a anomalies in SJ across different MHW phases. Panels (a–c) represent the pre-MHW phase, (d–f) correspond to the MHW period, and (g–i) illustrate the post-MHW phase. Each column indicates a specific region: (a, d, g) for West Java (WJ); (b, e, h) for Central Java (CJ); and (c, f, i) for East Java (EJ).
During the MHW phase, peak temperature anomalies were observed across all upwelling regions (Figures 6d–f), leading to a marked decline in chlorophyll-a concentrations (Figures 7d–f), with reductions exceeding 0.2 mg/m3. In the post-MHW phase, while SST anomalies began to decrease (Figures 6g–i), the decline in chlorophyll-a concentrations were less pronounced compared to the MHW phase (Figures 7g–i). Notably, WJ and EJ exhibited positive chlorophyll-a anomalies, indicating a resurgence of upwelling activity. However, no signs of upwelling recovery were observed in CJ (Figure 7h), suggesting a more prolonged impact of MHWs on productivity in this region.
3.3.1.3 EPV anomalies
To further assess upwelling activity, we analyzed EPV anomalies across different phases (Figure 8). Positive EPV anomalies indicate upward vertical velocity (upwelling), whereas negative anomalies suggest downward movement (downwelling). Across all study regions, positive EPV anomalies were detected throughout the study period, with maximum values reaching approximately 3 × 10⁻⁵ m/s. However, during MHWs (Figures 8d–f), EPV anomalies reached their lowest values, indicating a suppression of upwelling intensity due to MHW-related thermal stratification.
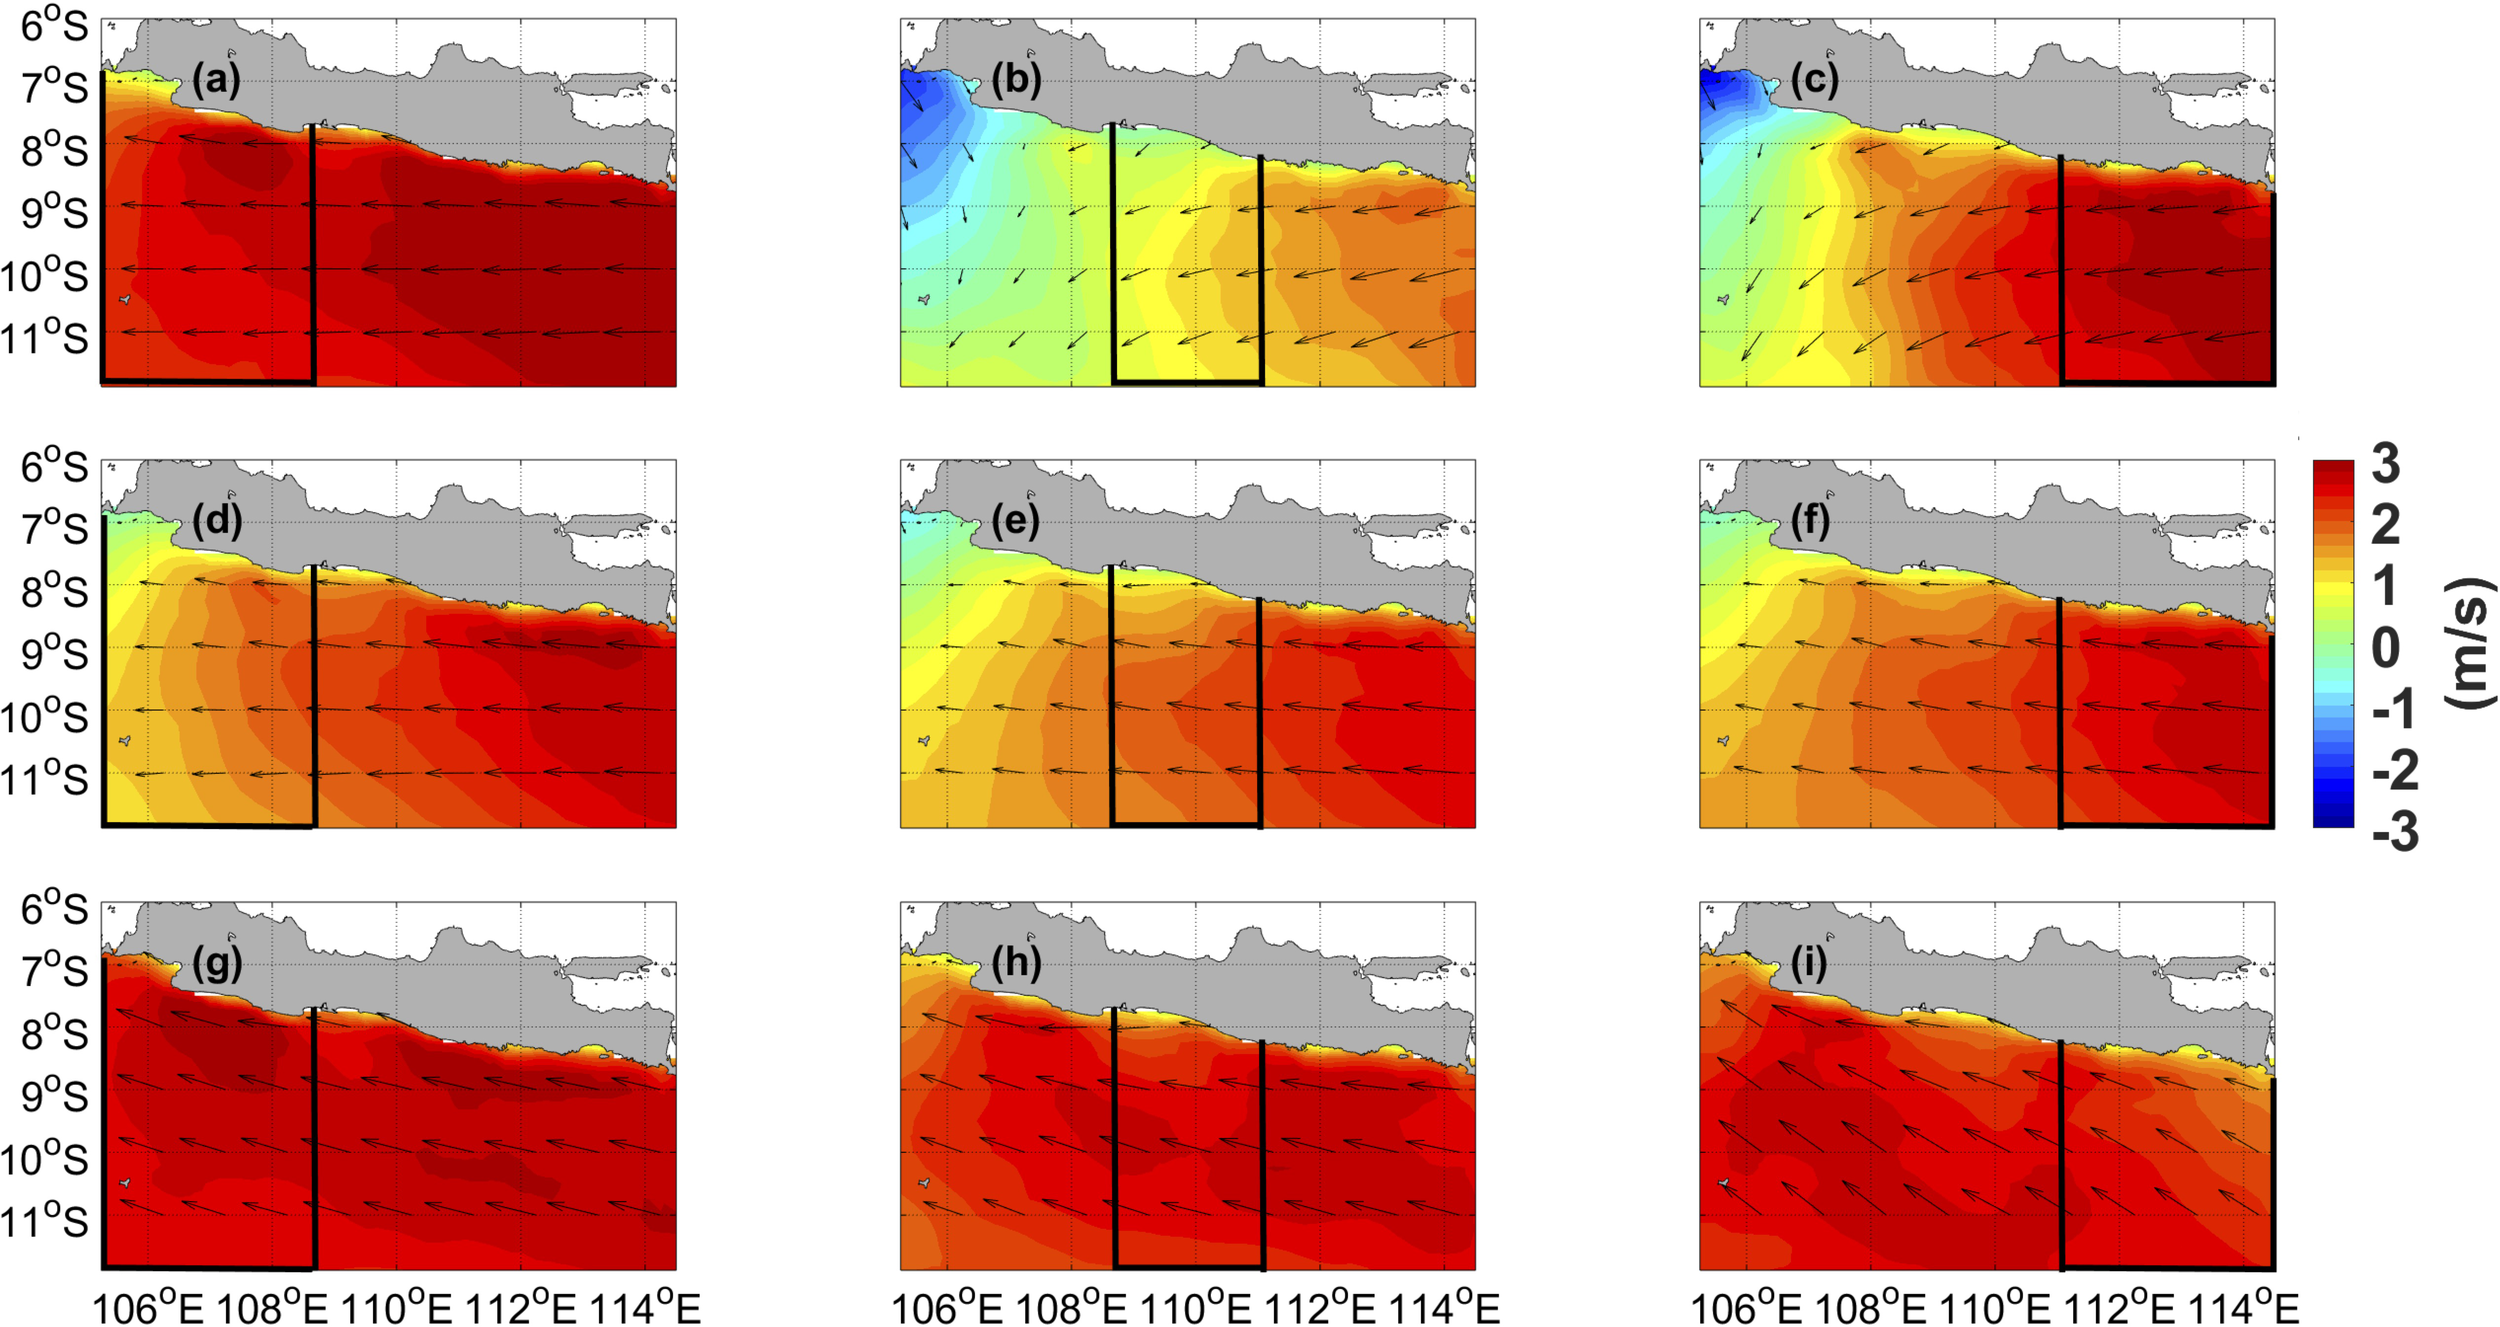
Figure 8
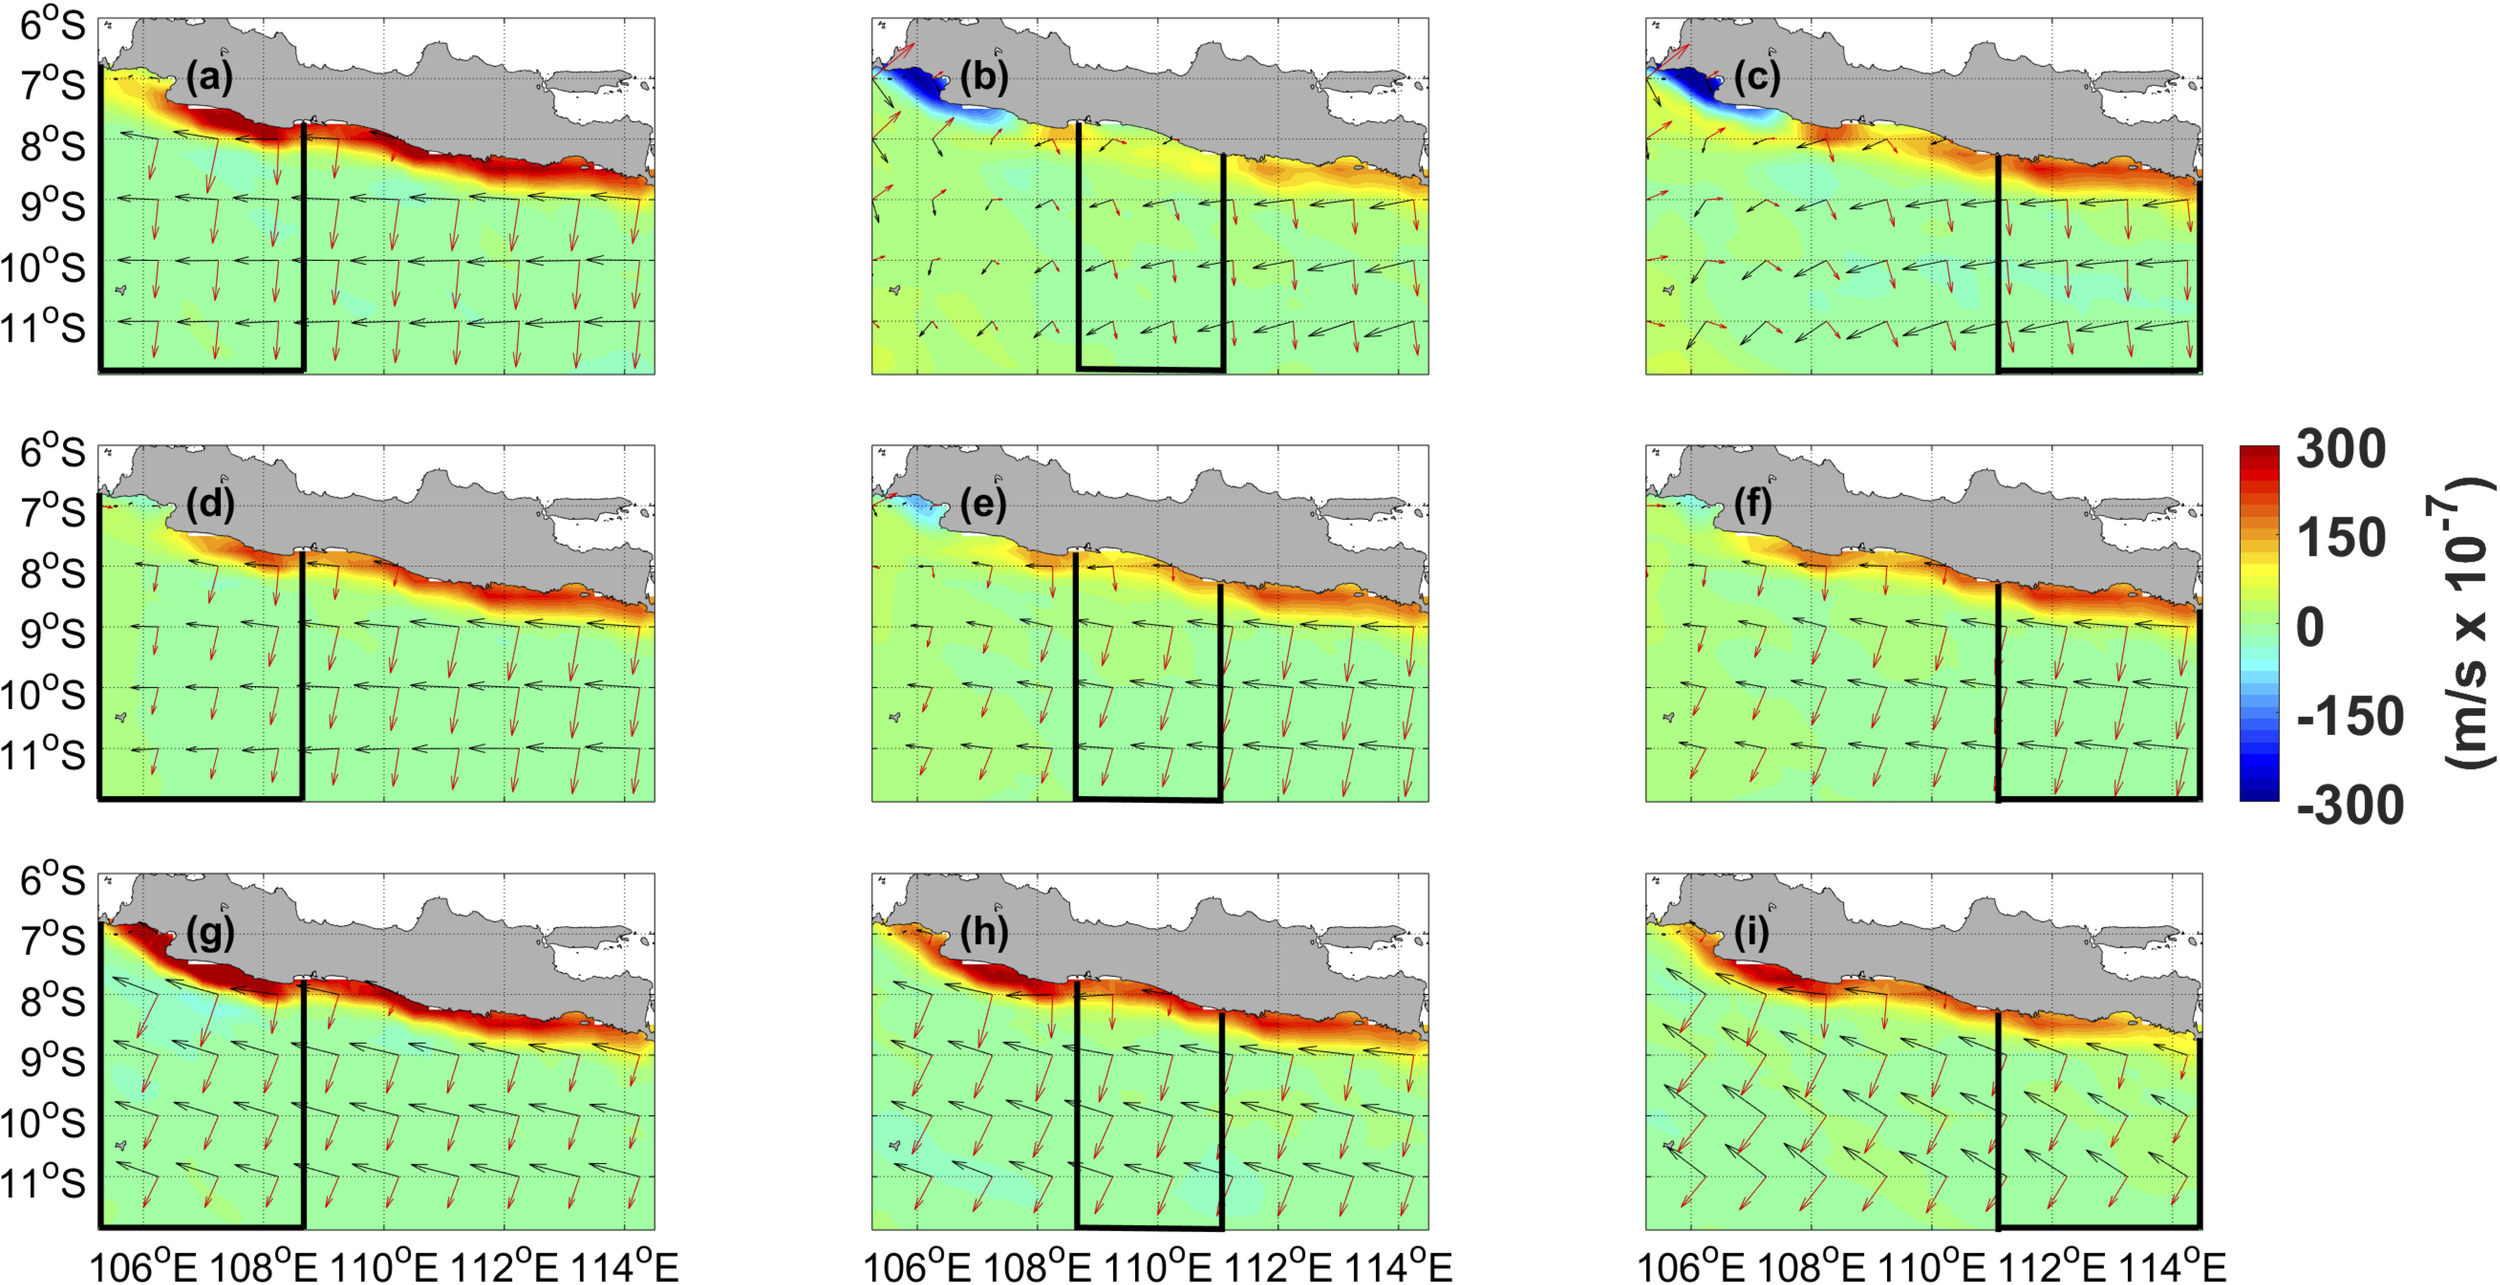
Spatial distribution of EPV anomalies in SJ across different MHW phases. Panels (a–c) represent the pre-MHW phase, (d–f) correspond to the MHW period, and (g–i) illustrate the post-MHW phase. Each column indicates a specific region: (a, d, g) for West Java (WJ); (b, e, h) for Central Java (CJ); and (c, f, i) for East Java (EJ). Black vectors indicate wind direction, while red vectors represent EMT. Positive (negative) velocity indicates upwelling (downwelling).
3.3.1.4 Wind speed anomalies
Wind forcing plays a crucial role in upwelling, as strong winds enhance vertical mixing, bringing cold, nutrient-rich waters to the surface. Figure 9 illustrates wind speed anomalies across different phases. During the pre-MHW phase (Figures 9a–c), wind speeds increased across all study regions, with anomalies reaching up to 3 m/s. However, in CJ, the wind intensification was less pronounced compared to WJ and EJ (Figure 9b).
Figure 9
Spatial distribution of wind speed anomalies in SJ across different MHW phases. Panels (a–c) represent the pre-MHW phase, (d–f) correspond to the MHW period, and (g–i) illustrate the post-MHW phase. Each column indicates a specific region: (a, d, g) for West Java (WJ); (b, e, h) for Central Java (CJ); and (c, f, i) for East Java (EJ). Black vectors indicate wind direction.
During the MHW phase, wind speed weakened in WJ and EJ compared to the pre-MHW phase (Figures 9d, f), whereas CJ experienced even stronger winds. In general, weaker winds reduce vertical mixing and exacerbate chlorophyll-a depletion (Figures 7d–f), particularly in coastal upwelling regions (WJ1, CJ1, and EJ1). However, the primary factor driving chlorophyll-a reduction in CJ remains unclear, as wind speeds in this region strengthened during MHWs compared to the pre-MHW phase, necessitating further investigation.
In the post-MHW phase, wind speeds increased further across all study regions, particularly in coastal upwelling zones, with anomalies exceeding 3 m/s (Figures 9g–i). Consequently, upwelling intensity began to recover, slowing the decline in chlorophyll-a concentrations compared to the MHW phase (Figures 7g–i). Notably, WJ exhibited the fastest wind speed recovery, with anomalies surpassing 3 m/s, suggesting a more rapid restoration of upwelling conditions compared to CJ and EJ.
3.3.2 Characteristics of upwelling intensity decline in coastal and non-coastal regions
To better understand the physical mechanisms and dynamic oceanic and atmospheric factors influencing upwelling intensity during MHW periods, we conducted a composite analysis of anomalous upwelling parameters over the 30 days before and after MHW onset during JJA 1998–2021 (Figures 10, 11). The analyzed parameters include SST, chlorophyll-a concentration, EPV, wind stress, and stratification intensity, with the latter quantified using the Brunt-Väisälä frequency (N). We examined these parameters separately for coastal (Figures 10, 11, left panels) and non-coastal upwelling areas (Figures 10, 11, right panels). Additionally, we summarized the anomalies of upwelling parameters during MHW events in both coastal and non-coastal upwelling regions (Table 3).
Figure 10
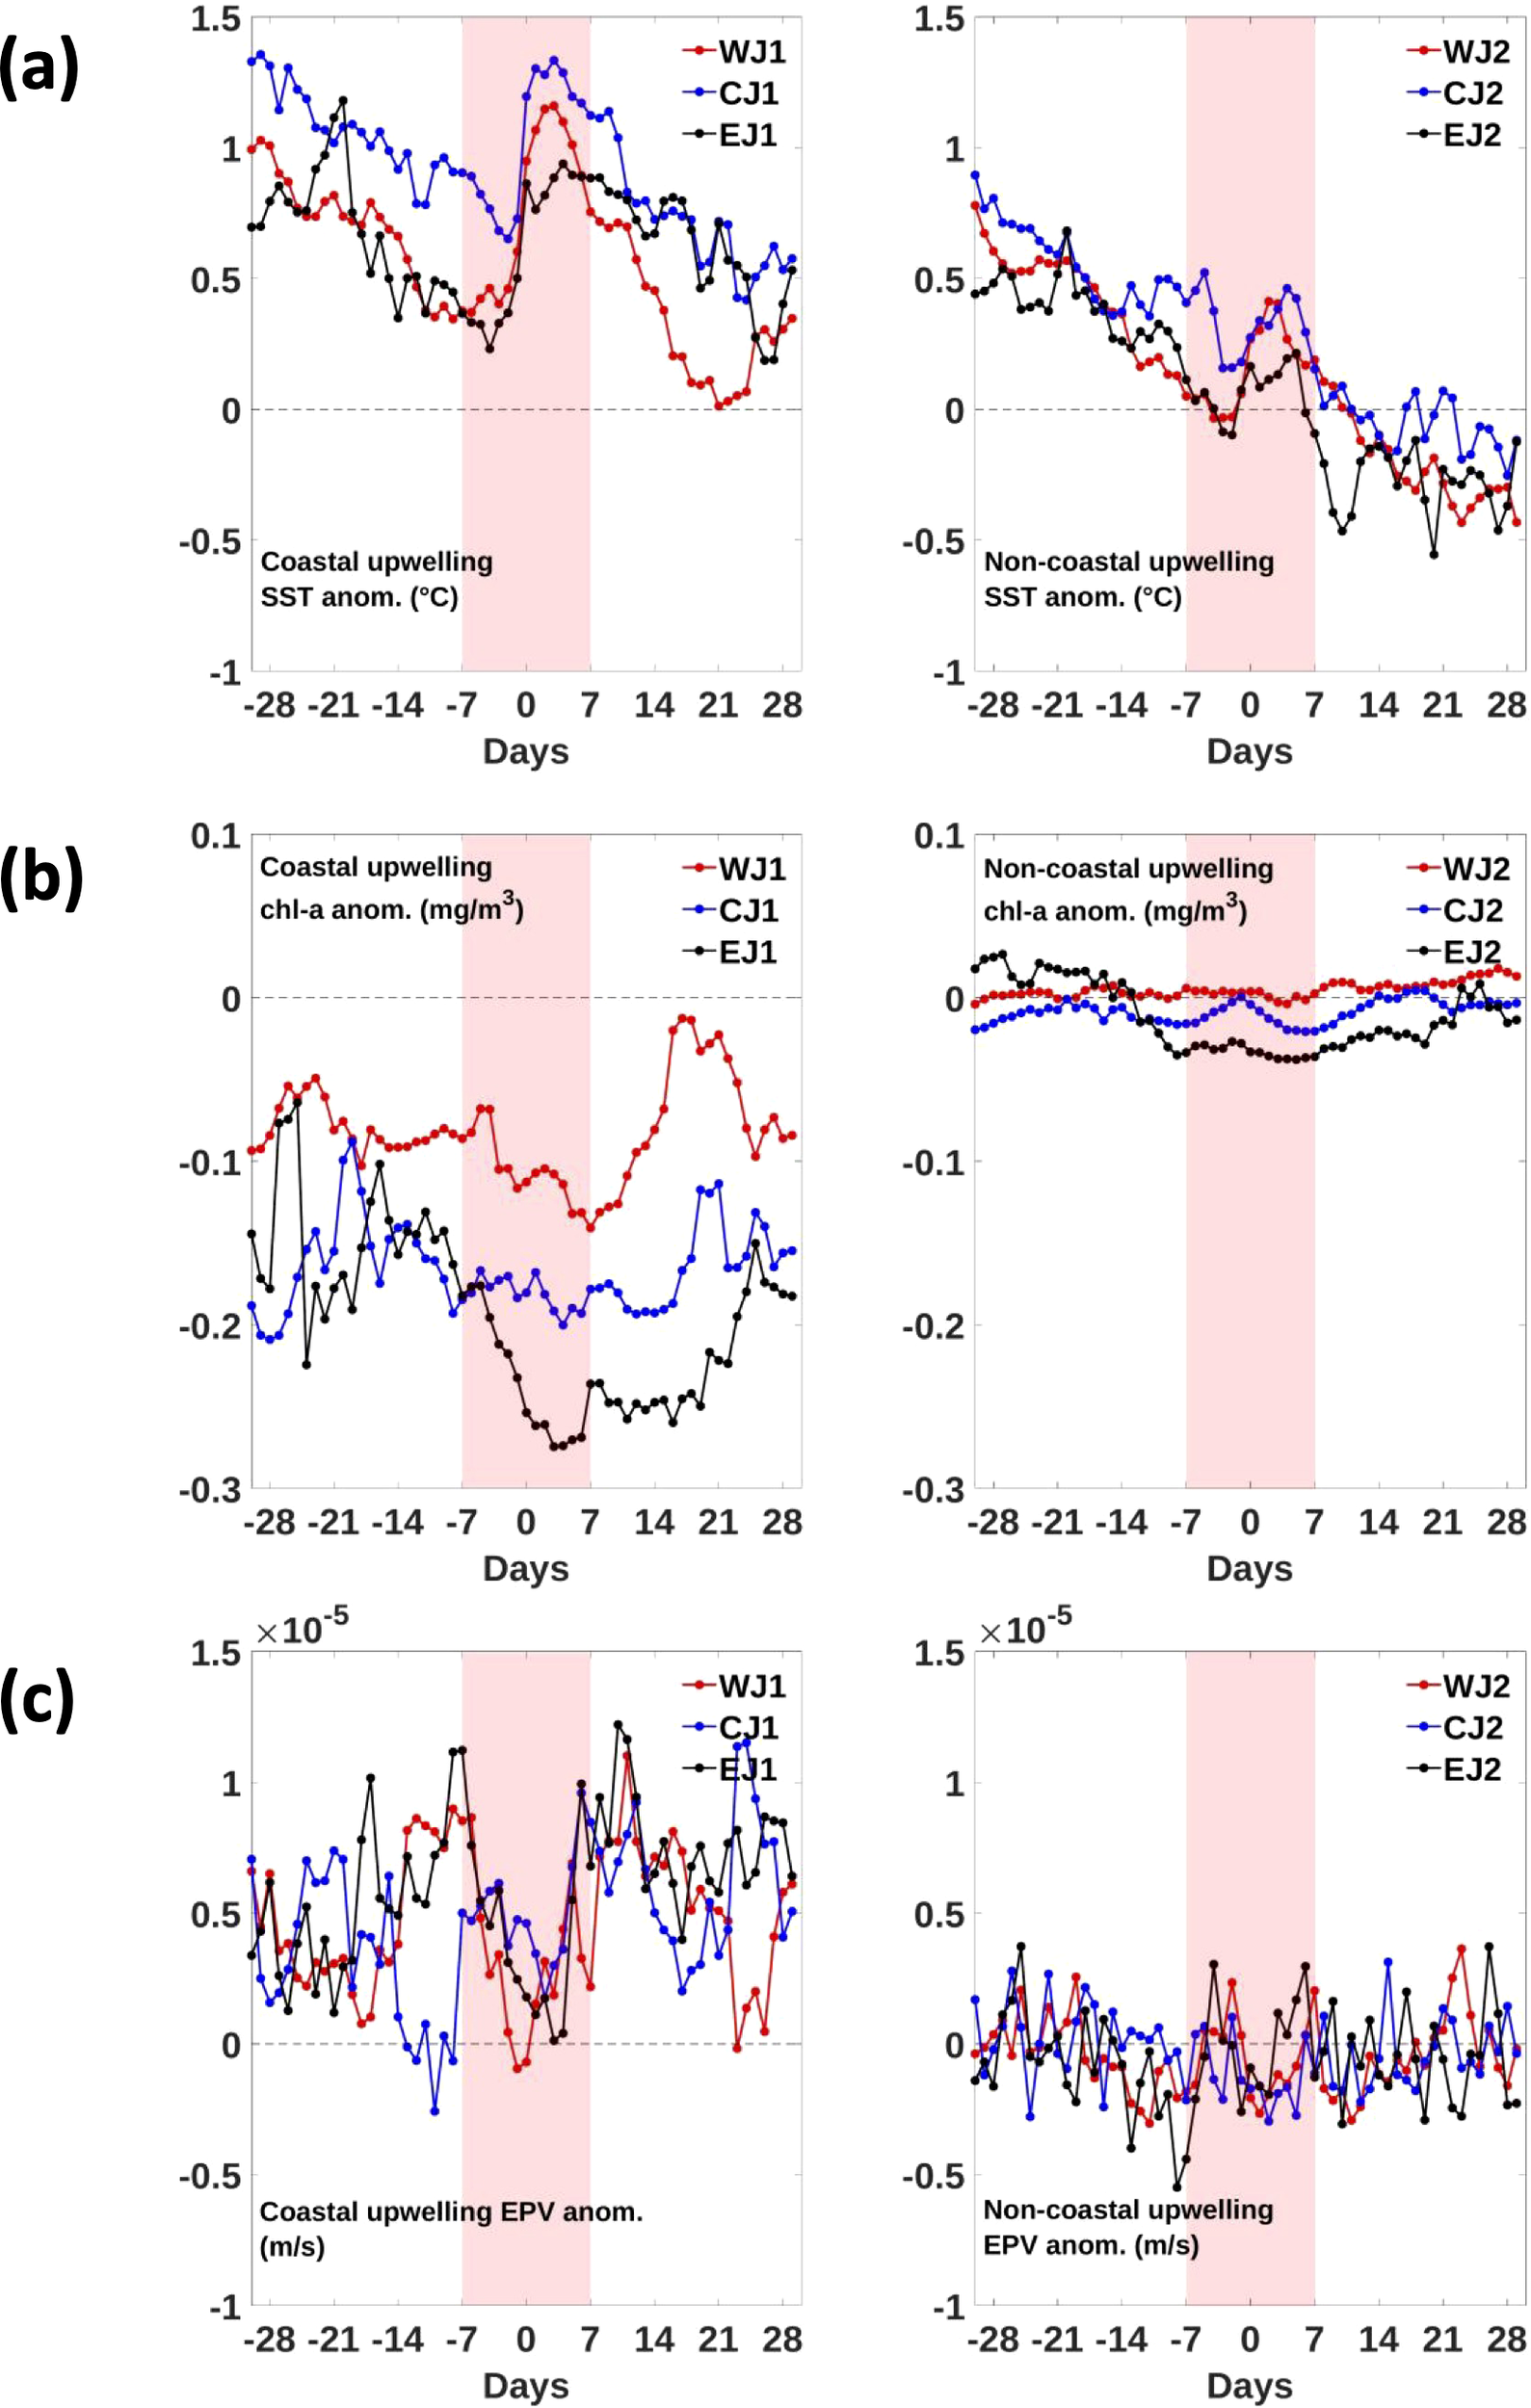
Temporal variation of key parameters: (a) SST anomalies, (b) chlorophyll-a anomalies, and (c) EPV anomalies. The left panels indicate coastal upwelling areas, while the right panels correspond to non-coastal upwelling regions. The red, blue, and black lines represent WJ, CJ, and EJ, respectively, over 30 days before and after MHW events (composite analysis for JJA 1998–2021). Day 0 represents the onset of MHW events. The red shading highlights the one-week period before and after MHW onset.
Figure 11
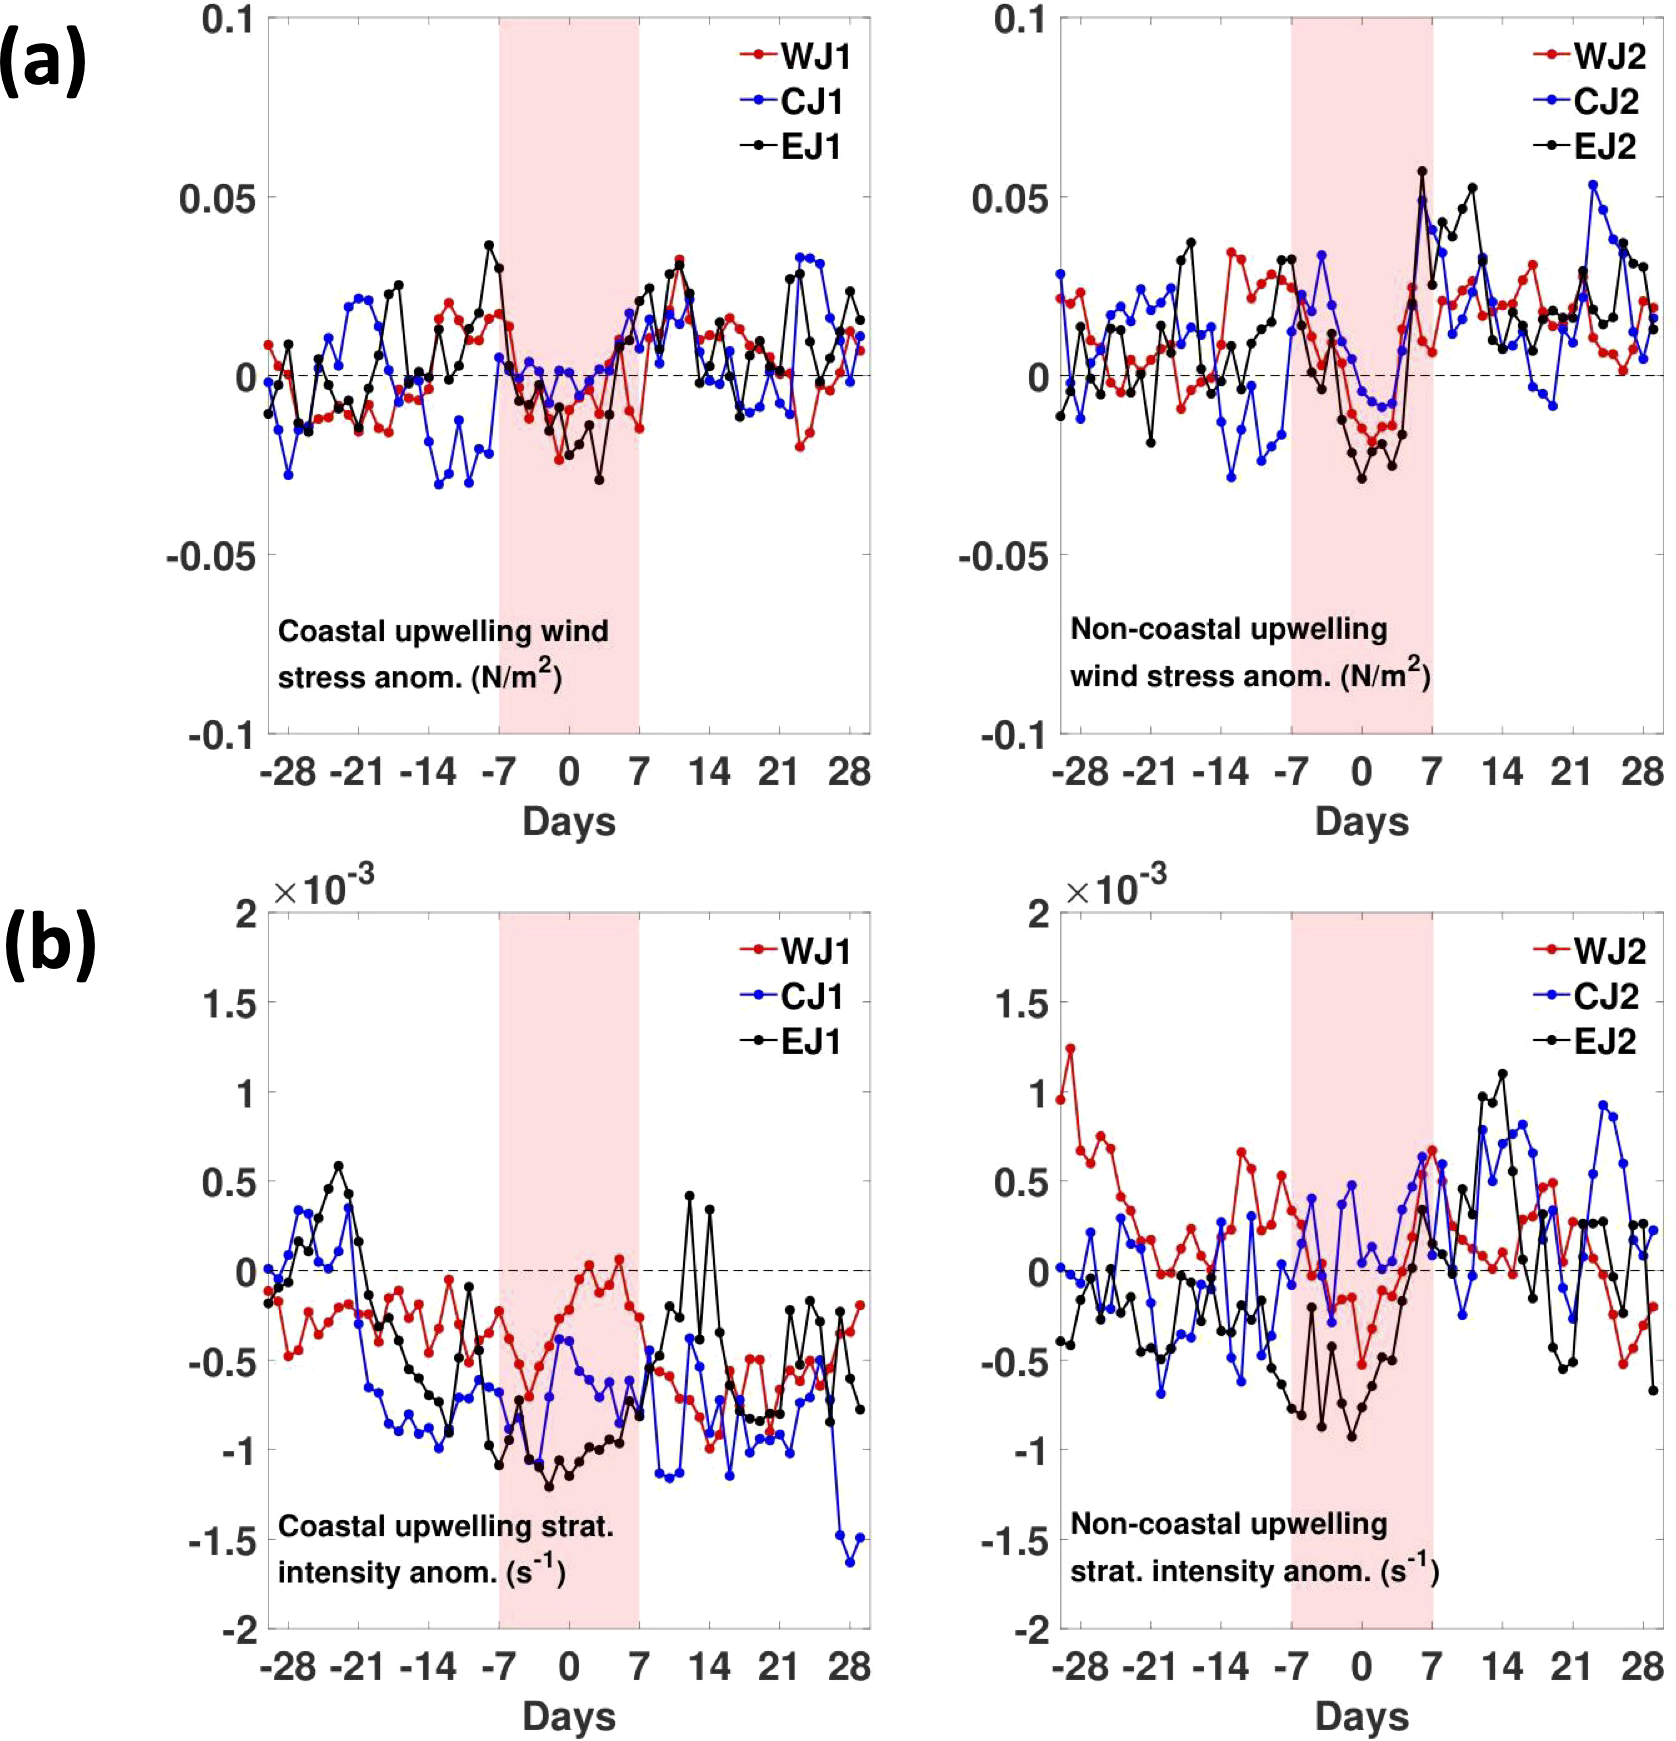
Same as Figure 10, except for (a) wind stress anomalies and (b) stratification intensity anomalies, quantified using the Brunt-Väisälä frequency.
Table 3
| No. | Study area | Anomalies of key upwelling parameters during MHW events | ||||
|---|---|---|---|---|---|---|
| Chl-a (mg/m3) | EPV (10–5 m/s) | Wind stress (N/m2) | Stratification intensity measured using the Brunt-Väisälä frequency (10–3 s-1) | |||
| 1. | Coastal upwelling | WJ1 | -0.14 | 0.332 | 0.02 | -0.493 |
| CJ1 | -0.23 | 0.450 | 0.02 | -0.729 | ||
| EJ1 | -0.25 | 0.594 | 0.03 | -0.944 | ||
| 2. | Non-coastal upwelling | WJ2 | -0.02 | -0.038 | 0.02 | 0.265 |
| CJ2 | -0.03 | -0.050 | 0.03 | 0.051 | ||
| EJ2 | -0.03 | -0.092 | 0.04 | -0.283 | ||
Anomalies of key upwelling parameters during MHW events.
SST anomalies exhibit a downward trend in both coastal and non-coastal upwelling areas (Figure 10a), signaling the onset of cooling driven by SE monsoon-induced upwelling. However, this cooling trend is temporarily interrupted by MHW events, as indicated by a noticeable increase in SST anomalies beginning approximately 2–5 days before MHW onset in coastal areas and around 2 days prior in non-coastal upwelling zones. The negative SST anomaly trend resumes roughly 2–3 days after MHW onset in coastal areas and 3–6 days afterward in non-coastal regions.
Notably, coastal upwelling regions experience more pronounced SST anomalies, peaking at approximately 1.3°C around three days after MHW onset, and exhibit a slower cooling rate compared to non-coastal areas. This pattern suggests that MHWs are more intense and persistent in coastal zones. Among the regions, SST in WJ cools the fastest (Figure 10a), likely due to the fastest wind speed recovery (as previously discussed; Figure 9g). In contrast, cooling in EJ is primarily driven by its strong upwelling processes, which mitigate warm water anomalies through cold water intrusion (Figure 6i).
Chlorophyll-a concentrations decline more sharply in coastal upwelling areas than in non-coastal regions (Figure 10b). In coastal upwelling zones, negative chlorophyll-a anomalies during MHW events range from -0.14 to -0.25 mg/m3 (Table 3), with the most substantial reduction observed at EJ1 (-0.25 mg/m3), indicating the most significant weakening of upwelling at this site, followed by CJ1 and WJ1. The relatively smaller decrease at WJ1 (-0.14 mg/m3) is likely due to its rapid cooling process, driven by the fastest wind speed recovery.
Notably, chlorophyll-a anomalies in the three coastal upwelling areas follow a distinct high-low-high pattern, returning to near-normal levels approximately two to three weeks after MHW onset. In contrast, chlorophyll-a levels in non-upwelling areas (WJ2, CJ2, and EJ2) remain relatively stable throughout the 30 days before and after MHW onset, with only minor decreases of approximately -0.02 to -0.03 mg/m3 during MHW events (Table 3). However, among all regions, EJ experiences the most pronounced chlorophyll-a reduction in both coastal and non-coastal upwelling zones (Figure 10b; Table 3).
Similar to chlorophyll-a anomalies in coastal upwelling areas, EPV anomalies also exhibit a distinct high-low-high pattern from one week before to 10 days after MHW onset (Figure 10c). Positive EPV anomalies (ranging from 0.5 × 10⁻⁵ to 1.2 × 10⁻⁵ m/s) begin to decline about a week before MHW onset, reaching their minimum at the onset, and then gradually recovering to near-initial values (0.8 × 10⁻⁵ to 1.3 × 10⁻⁵ m/s) approximately 10 days later. These results indicate that MHW events contribute to a reduction in upwelling intensity, as reflected by lower EPV values. The decrease in EPV weakens vertical mixing, limiting the transport of nutrient-rich deeper waters to the surface and further suppressing upwelling.
A similar effect is observed in non-coastal upwelling areas (Figure 10c), though with a smaller magnitude. In these regions, EPV anomalies decrease from approximately 0.25 × 10⁻⁵ m/s three days before MHW onset, reaching a minimum of about -0.25 × 10⁻⁵ m/s at the onset, before returning to near-initial values within a week. This EPV anomaly pattern closely aligns with the wind stress anomaly pattern in both coastal and non-coastal regions, particularly during the week before and after MHW onset (Figure 11a). Notably, while wind stress increases compared to its climatological value across all regions of SJ, indicated by positive wind stress anomalies during MHWs (Table 3) and associated with SE monsoon-induced upwelling, the impact of MHWs in moderating this positive anomaly remains evident. This is reflected in the distinct high-low-high pattern of wind stress anomalies observed from one week before to one week after MHW onset (Figure 11a).
Furthermore, stratification intensity exhibits a downward trend in coastal upwelling areas (Figure 11b), indicating favorable conditions for cooling driven by SE monsoon-induced upwelling. However, this cooling trend is temporarily disrupted by MHW events, as evidenced by a noticeable increase in stratification intensity anomalies starting approximately 2–5 days before MHW onset and persisting for about 2–6 days at WJ1, three weeks at CJ1, and two weeks at EJ1 after MHW onset. In non-coastal upwelling regions, the strengthening of stratification intensity due to MHW events is more pronounced and can even result in positive anomaly values (Figure 11b; Table 3).
Based on the analysis of MHWs’ influence on upwelling parameters (chlorophyll-a, EPV, wind stress, and stratification intensity), this study reveals that MHWs generally weaken upwelling intensity (Figures 10, 11; Table 3). For instance, MHW events lead to a reduction in chlorophyll-a concentration across all regions of the SJ, with the decline being more pronounced in coastal areas. The most significant decrease is observed at EJ1 (-0.25 mg/m3), followed by CJ1 (-0.23 mg/m3), while the least impact occurs at WJ1 (-0.14 mg/m3). Chlorophyll-a serves as a key indicator of phytoplankton abundance, playing a crucial role in primary productivity and forming the foundation of marine food webs (Burdett et al., 2019). However, ocean warming weakens vertical mixing and upwelling processes, leading to reduced water productivity, including lower chlorophyll-a concentrations (Doney, 2006; Gawarkiewicz et al., 2019; Liu et al., 2024), ultimately affecting fishery resources.
4 Conclusions
In this study, we investigated the physical mechanisms driving MHWs in Indonesian waters over the past 40 years (1982–2021). To develop a comprehensive understanding of these extreme ocean temperature events, we examined both local and remote forcing mechanisms. Local forcing was analyzed through a heat budget assessment, while remote influences were assessed based on their association with ENSO and IOD.
Our findings suggest that MHW events in SJ and WS are primarily driven by heat advection, as indicated by regression coefficients of 0.69 and 0.60, respectively, at the 99% confidence level. This result aligns with previous research highlighting the crucial role of heat transport in driving SST warming trends in Indonesian waters (Iskandar et al., 2020). However, further investigation is needed to determine whether this heat advection mechanism is primarily influenced by subsurface dynamics or the presence of the ITF. In contrast, MHWs in the other study areas (JS, MK, MS, and NP) were predominantly influenced by entrainment, with regression coefficients of 1.33, 1.03, 1.04, and 0.82, respectively, at the same confidence level.
To assess the role of remote climatic influences (ENSO and IOD) on MHW formation, we conducted cross-correlation and scatter plot analyses for each study areas. Our results indicate that MHWs in Indonesian waters occur more frequently during the ENSO phases than during IOD phases, suggesting that ENSO has a stronger impact on MHW formation. Furthermore, we found varying time lags between ENSO events and MHW occurrences, ranging from 3 to 10 months in the western regions (WS and SJ) and the inner Indonesian seas (JS and MK), while the eastern regions (MS and NP) exhibited shorter time lags of approximately 0 to 2 months.
Notably, the most extreme MHW events in Indonesian waters have been observed in SJ over the past few decades (Beliyana et al., 2023). Our study suggests that heat advection is the primary driver of MHW formation in SJ, exhibiting the highest correlation with ENSO and IOD events. This indicates that these climatic phenomena play a significant role in MHW development in the region. Additionally, SJ is characterized by an intense seasonal upwelling system, particularly during JJA.
In summary, this study highlights that the highest SST anomalies occurred across all three study areas in SJ (WJ, CJ, and EJ), particularly in coastal upwelling regions (WJ1, CJ1, and EJ1), during MHW events. The resulting thermal stratification suppressed nutrient mixing, leading to a decline in chlorophyll-a concentrations and a weakening of upwelling intensity, with significant implications for fisheries productivity. Additionally, a weakening of wind speed was observed during MHWs, further inhibiting upwelling processes. Notably, wind speed anomalies exhibited distinct patterns across the three regions, with WJ showing the strongest positive anomalies and the most rapid recovery in wind conditions during the post-MHW phase compared to CJ and EJ. Further analysis of MHW impacts on upwelling intensity in SJ reveals that the strongest upwelling suppression during JJA 1998–2021 occurred in coastal upwelling areas (WJ1, CJ1, and EJ1) compared to non-coastal upwelling areas (WJ2, CJ2, and EJ2). Among these, EJ1 experienced the most severe reduction in chlorophyll-a concentrations, indicating the strongest inhibition of upwelling intensity due to MHW events, followed by CJ1 and WJ1.
This study provides a more comprehensive understanding of the physical mechanisms driving MHWs in Indonesian waters and their impact on upwelling intensity in SJ. However, further research is needed to fully elucidate the role of wind speed in modulating MHWs and upwelling processes. Additionally, future modeling studies are essential for predicting MHW occurrences in Indonesian waters and mitigating their impacts on marine ecosystems. Understanding these dynamics is particularly crucial for managing upwelling-dependent fisheries and preserving marine biodiversity in the region.
Statements
Data availability statement
The original contributions presented in the study are included in the article/supplementary material. Further inquiries can be directed to the corresponding author.
Author contributions
NN: Conceptualization, Funding acquisition, Supervision, Writing – review & editing. EB: Methodology, Visualization, Writing – original draft. IK: Methodology, Writing – review & editing. AT: Supervision, Writing – review & editing.
Funding
The author(s) declare that financial support was received for the research and/or publication of this article. This research was funded by Institut Teknologi Bandung (ITB) Research Program (Research Grand Contract No. 1929E/IT1.C01.2/KU.03/2024). We sincerely thank ITB for its support.
Acknowledgments
The authors sincerely appreciate the support of the Institut Teknologi Bandung and the Indonesian Ministry of Education, Culture, Research and Technology (Kemendikbudristek). Additionally, the authors would like to express gratitude to NOAA, ECMWF, and GLORYS for providing the data used in this study.
Conflict of interest
The authors declare that this research was conducted without any commercial or financial relationships that could be perceived as a potential conflict of interest.
Generative AI statement
The author(s) declare that no Generative AI was used in the creation of this manuscript.
Publisher’s note
All claims expressed in this article are solely those of the authors and do not necessarily represent those of their affiliated organizations, or those of the publisher, the editors and the reviewers. Any product that may be evaluated in this article, or claim that may be made by its manufacturer, is not guaranteed or endorsed by the publisher.
References
1
Atmadipoera A. S. Jasmine A. S. Purba M. Kuswardani A. R. T. D. (2020). Upwelling characteristics in the Southern Java waters during strong La Niña 2010 and super El Niño 2015. J. Ilmu dan Teknologi Kelautan Tropis12, 257–276. doi: 10.29244/jitkt.v12i1.28977
2
Behrens E. Fernandez D. Sutton P. (2019). Meridional oceanic heat transport influences marine heatwaves in the Tasman Sea on interannual to decadal timescales. Front. Mar. Sci.6. doi: 10.3389/fmars.2019.00228
3
Beliyana E. Ningsih N. S. Gunawan S. R. Tarya A. (2023). Characteristics of marine heatwaves in the Indonesian waters during the PDO, ENSO, and IOD phases and their relationships to net surface heat flux. Atmosphere14, 1035. doi: 10.3390/atmos14061035
4
Burdett H. L. Wright H. Smale D. A. (2019). Photophysiological responses of canopy-forming kelp species to short-term acute warming. Front. Mar. Sci.6. doi: 10.3389/fmars.2019.00516
5
Caputi N. Kangas M. Denham A. Feng M. Pearce A. Hetzel Y. et al . (2016). Management adaptation of invertebrate fisheries to an extreme marine heat wave event at a global warming hot spot. Ecol. Evol.6, 3583–3593. doi: 10.1002/ece3.2137
6
Chakraborty K. Joshi A. P. Ghoshal P. K. Ghosh J. Akhand A. Bhattacharya T. et al . (2023). Mechanisms and drivers controlling spatio-temporal evolution of pCO2 and air-sea CO2 fluxes in the southern Java coastal upwelling system. Estuar. Coast. Shelf Sci.293, 108509. doi: 10.1016/j.ecss.2023.108509
7
Chen G. Han W. Li Y. Wang D. (2016). Interannual variability of equatorial eastern Indian Ocean upwelling: local versus remote forcing. J. Phys. Oceanogr.46, 789–807. doi: 10.1175/JPO-D-15-0117.1
8
Chen G. Han W. Li Y. Wang D. Shinoda T. (2015). Intraseasonal variability of upwelling in the equatorial Eastern Indian Ocean. J. Geophys. Res. Oceans.120, 7598–7615. doi: 10.1002/2015JC011223
9
Delman A. S. Sprintall J. McClean J. L. Talley L. D. (2016). Anomalous Java cooling at the initiation of positive Indian Ocean Dipole events. J. Geophys. Res. Oceans.121, 5805–5824. doi: 10.1002/2016JC011635
10
Demaria M. Kaplan J. (1994). Sea surface temperature and the maximum intensity of Atlantic tropical cyclones. J. Clim.7, 1324–1334. doi: 10.1175/1520-04421994007<1324:SSTATM<2.0.CO;2
11
Doney S. C. (2006). Plankton in warmer world. Nature.444, 695–696. doi: 10.1038/444695a
12
Dzwonkowski B. Coogan J. Fournier S. Lockridge G. Park K. (2020). Compounding impact of severe weather events fuels marine heatwave in the coastal ocean. Nat. Commun.11, 1–10. doi: 10.1038/s41467-020-18339-2
13
Feng X. Shinoda T. (2019). Air-sea heat flux variability in the southeast Indian Ocean and its relation with Ningaloo Niño. Front. Mar. Sci.6. doi: 10.3389/fmars.2019.00266
14
Fewings M. R. Brown K. S. (2019). Regional structure in the marine heat wave of summer 2015 off the western United States. Front. Mar. Sci.6. doi: 10.3389/fmars.2019.00564
15
Fordyce A. J. Ainsworth T. D. Heron S. F. Leggat W. (2019). Marine heatwave hotspots in coral reef environments: physical drivers, ecophysiological outcomes, and impact upon structural complexity. Front. Mar. Sci.6. doi: 10.3389/fmars.2019.00498
16
Frölicher T. L. Fischer E. M. Gruber N. (2018). Marine heatwaves under global warming. Nature.560, 360–364. doi: 10.1038/s41586-018-0383-9
17
García-Reyes M. Sydeman W. J. Schoeman D. S. Rykaczewski R. R. Black B. A. Smit A. J. et al . (2015). Under pressure: climate change, upwelling, and eastern boundary upwelling ecosystems. Front. Mar. Sci.2. doi: 10.3389/fmars.2015.00109
18
Gawarkiewicz G. Chen K. Forsyth J. Bahr F. Mercer A. M. Ellertson A. et al . (2019). Characteristics of an advective marine heatwave in the Middle Atlantic Bight in early 2017. Front. Mar. Sci.6. doi: 10.3389/fmars.2019.00712
19
Gruber N. (2011). Warming up, turning sour, losing breath: ocean biogeochemistry under global change. Phil. Trans. R. Soc A.36, 1980–1996. doi: 10.1098/rsta.2011.0003
20
Habibullah A. D. Tarya A. Ningsih N. S. Putri M. R. (2023). Marine heatwaves in the Indonesian fisheries management areas. J. Mar. Sci. Eng.11, 161. doi: 10.3390/jmse11010161
21
Heidemann H. Ribbe J. (2019). Marine heat waves and the influence of El Niño off Southeast Queensland. Australia. Front. Mar. Sci.6. doi: 10.3389/fmars.2019.00056
22
Hobday A. J. Alexander L. V. Perkins S. E. Smale D. A. Straub S. C. Oliver E. C. J. et al . (2016). A hierarchical approach to defining marine heatwaves. Prog. Oceanogr.141, 227–238. doi: 10.1016/J.POCEAN.2015.12.014
23
Holbrook N. J. Scannell H. A. Gupta A. S. Benthuysen J. A. Feng M. Oliver E. C. J. et al . (2019). A global assessment of marine heatwaves and their drivers. Nat. Commun.10, 1–14. doi: 10.1038/s41467-019-10206-z
24
Horii T. Ueki I. Ando K. (2018). Coastal upwelling events along the southern coast of Java during the 2008 positive Indian Ocean Dipole. J. Oceanogr.74, 499–508. doi: 10.1007/s10872-018-0475-z
25
Hu S. Sprintall J. (2017). Observed strengthening of interbasin exchange via the Indonesian seas due to rainfall intensification. Geophys. Res. Lett.44, 1448–1456. doi: 10.1002/2016GL072494
26
Iskandar I. Irfan M. Saymsuddin F. (2013). Why was the 2008 Indian Ocean Dipole a short-lived event? Ocean Sci.48, 149–160. doi: 10.1007/s12601-013-0012-3
27
Iskandar M. R. Ismail M. F. A. Arifin T. Chandra H. (2021). Marine heatwaves of sea surface temperature off South Java. Heliyon.7, e08618. doi: 10.1016/j.heliyon.2021.e08618
28
Iskandar I. Mardiansyah W. Lestari D. O. Masumoto Y. (2020). What did determine the warming trend in the Indonesian sea? Prog. Earth Planet. Sci.7, 20. doi: 10.1186/s40645-020-00334-2
29
Iskandar I. Rao S. A. Tozuka T. (2009). Chlorophyll-a bloom along the southern coasts of Java and Sumatra during 2006. Int. J. Remote Sens.30, 663–671. doi: 10.1080/01431160802372309
30
Ismail M. F. A. (2021). Characteristics of marine heatwaves off West Sumatra derived from high-resolution satellite data. J. Hunan Univ. Nat. Sci.48, 130–136.
31
Kendrick G. A. Nowicki R. J. Olsen Y. S. Strydom S. Fraser M. W. Sinclair E. A. et al . (2019). A Systematic review of how multiple stressors from an extreme event drove ecosystem-wide loss of resilience in an iconic seagrass community. Front. Mar. Sci.6. doi: 10.3389/fmars.2019.00455
32
Kida S. Richards K. J. Sasaki H. (2019). The fate of surface freshwater entering the Indonesian Seas. J. Geophys. Res.124, 3228–3245. doi: 10.1029/2018JC014707
33
Kuleshov Y. Qi L. Fawcett R. Jones D. (2008). On tropical cyclone activity in the southern hemisphere: trends and the ENSO connection. Geophys. Res. Lett.35, 1–5. doi: 10.1029/2007GL032983
34
Kumar B. P. Vialard J. Lengaigne M. Murty V. S. N. McPhaden M. J. (2011). TropFlux: air-sea fluxes for the global tropical oceans description and evaluation against observations. Clim. Dyn.38, 1521–1543. doi: 10.1007/s00382-011-1115-0
35
Kuswardani R. T. D. Qiao F. (2014). Influence of the Indonesian throughflow on the upwelling off the east coast of South Java. Chin. Sci. Bull.59, 4516–4523. doi: 10.1007/s11434-014-0549-2
36
Lee S.-K. Park W. Baringer M. O. Gordon A. L. Huber B. Liu Y. (2015). Pacific origin of the abrupt increase in Indian Ocean heat content during the warming hiatus. Nat. Geosci.8, 445–449. doi: 10.1038/ngeo2438
37
Li A. Zhang Y. Hong M. Shi J. Wang J. (2023). Relative importance of ENSO and IOD on interannual variability of Indonesian Throughflow transport. Front. Mar. Sci.10. doi: 10.3389/fmars.2023.1182255
38
Liu S. Lao Q. Zhou X. Jin G. Chen C. Chen F. (2024). Impacts of marine heatwave events on three distinct upwelling systems and their implications for marine ecosystems in the Northwestern South China Sea. Remote Sens.16, 131. doi: 10.3390/rs16010131
39
Mandal S. Susanto R. D. Ramakrishnan B. (2022). On investigating the dynamical factors modulating surface chlorophyll-a variability along the South Java coast. Remote Sens.14, 1745. doi: 10.3390/rs14071745
40
Meyers G. (1996). Variation of Indonesian throughflow and the el niño-southern oscillation. J. Geophys. Res. Oceans.101, 12255–12263. doi: 10.1029/95JC03729
41
Mills K. Pershing A. Brown C. Chen Y. Chiang F. S. Holland D. (2013). Fisheries management in a changing climate: lessons from the 2012 ocean heat wave in the Northwest Atlantic. Oceanogr.26, 191–195. doi: 10.5670/oceanog.2013.27
42
Neelin J. D. Battisti D. S. Hirst A. C. Jin F. F. Wakat Y. Yamagat T. et al . (1998). ENSO theory. J. Geophys. Res.103, 14261–14290. doi: 10.1029/97JC03424
43
Ningsih N. S. Gunawan S. R. Beliyana E. Tarya A. (2023). Marine heatwave characteristics in the Makassar Strait and its surrounding waters. Water15, 2645. doi: 10.3390/w15142645
44
Ningsih N. S. Rakhmaputeri N. Harto A. B. (2013). Upwelling variability along the southern coast of Bali and in Nusa Tenggara waters. Ocean Sci. J.48, 49–57. doi: 10.1007/s12601-013-0004-3
45
Ningsih N. S. Sakina S. L. Susanto R. D. Hanifah F. (2021). Simulated zonal current characteristics in the Southeastern Tropical Indian Ocean (SETIO). Ocean Sci.17, 1115–1140. doi: 10.5194/os-17-1115-2021
46
Oliver E. C. J. Benthuysen J. A. Bindoff N. L. Hobday A. J. Holbrook N. J. Mundy C. N. et al . (2017). The unprecedented 2015/16 Tasman Sea marine heatwave. Nat. Commun.8, 16101. doi: 10.1038/ncomms16101
47
Oliver E. C. J. Donat M. G. Burrows M. T. Moore P. J. Smale D. A. Alexander L. V. et al . (2018). Longer and more frequent marine heatwaves over the past century. Nat. Commun.9, 1324. doi: 10.1038/s41467-018-03732-9
48
Pant V. Girishkumar M. S. Bhaskar T. V. S. U. Ravichandran M. Papa F. Thangaprakash V. P. (2015). Observed interannual variability of near surface salinity in the Bay of Bengal. J. Geophys. Res.120, 3315–3329. doi: 10.1002/2014JC010340
49
Price J. F. (1981). Upper ocean response to a hurricane. J. Phys. Oceanogr.11, 153–175. doi: 10.1175/1520-0485(1981)011<0153:UORTAH>2.0.CO;2
50
Pujol C. Pérez-Santos I. Barth A. Alvera-Azcárate A. (2022). Marine heatwaves offshore Central and South Chile: understanding forcing mechanisms during the years 2016–2017. Front. Mar. Sci.9. doi: 10.3389/fmars.2022.800325
51
Pun I. F. Hsu H. H. Moon I. J. Lin I. I. Jeong J. Y. (2023). Marine heatwave as a supercharger for the strongest typhoon in the East China Sea. NPJ Clim. Atmos. Sci.6, 128. doi: 10.1038/s41612-023-00449-5
52
Qi R. Zhang Y. Du Y. Feng M. (2022). Characteristics and drivers of marine heatwaves in the western equatorial Indian Ocean. J. Geophys. Res. Oceans.127, e2022JC018732. doi: 10.1029/2022JC018732
53
Qu T. Du Y. Strachan J. Meyers G. Slingo J. (2005). Sea surface temperature and its variability in the Indonesian region. Oceanogr.18, 50–61. doi: 10.5670/oceanog.2005.05
54
Quispe-Ccalluari C. Tam J. Demarcq H. Chamorro A. Espinoza-Morriberón D. Romero C. et al . (2018). An index of coastal thermal effects of El Niño Southern Oscillation on the Peruvian upwelling ecosystem. Int. J. Climatol.38, 1–11. doi: 10.1002/joc.5493
55
Reynolds R. W. Smith T. M. Liu C. Chelton D. B. Casey K. S. Schlax M. G. (2007). Daily high-resolution-blended analyses for sea surface temperature. J. Clim.20, 5473–5496. doi: 10.1175/2007jcli1824.1
56
Seabra R. Varela R. Santos A. M. Gómez-Gesteira M. Meneghesso C. Wethey D. S. et al . (2019). Reduced nearshore warming associated with eastern boundary upwelling systems. Front. Mar. Sci.6. doi: 10.3389/fmars.2019.00104
57
Smith K. A. Dowling C. E. Brown J. (2019). Simmered then boiled: multi-decadal poleward shift in distribution by a temperate fish accelerates during marine heatwave. Front. Mar. Sci.6. doi: 10.3389/fmars.2019.00407
58
Son S. Wang M. (2015). Diffuse attenuation coefficient of the photosynthetically available radiation Kd(PAR) for global open ocean and coastal waters. Remote Sens. Environ.159, 250–258. doi: 10.1016/j.rse.2014.12.011
59
Sousa M. C. Ribeiro A. Des M. Gomez-Gesteira M. deCastro M. Dias J. M. (2020). NW Iberian Peninsula coastal upwelling future weakening: competition between wind intensification and surface heating. Sci. Total. Environ.703, 134808. doi: 10.1016/j.scitotenv.2019.134808
60
Sprintall J. Gordon A. L. Koch-Larrouy A. Lee T. Potemra J. T. Pujiana K. et al . (2014). The Indonesian seas and their role in the coupled ocean–climate system. Nat. Geosci.7, 487–492. doi: 10.1038/NGEO2188
61
Straub S. C. Wernberg T. Thomsen M. S. Moore P. J. Burrows M. T. Harvey B. P. et al . (2019). Resistance to obliteration; responses of seaweeds to marine heatwaves. Front. Mar. Sci.6. doi: 10.3389/fmars.2019.00763
62
Susanto R. D. Gordon A. L. Zheng Q. (2001). Upwelling along the Coasts of Java and Sumatra and its relation to ENSO. Geophys. Res. Lett.28, 1559–1602. doi: 10.1029/2000GL011844
63
Susanto R. D. Marra J. (2005). Effect of the 1997/98 El Niño on chlorophyll a variability along the southern coasts of Java and Sumatra. Oceanogr.18, 124–127. doi: 10.5670/oceanog.2005.13
64
Susanto R. D. Moore T. S. Marra J. (2006). Ocean color variability in the Indonesian Seas during the SeaWiFS era. Geochem. Geophys. Geosyst.7, Q05021. doi: 10.1029/2005gc001009
65
Syamsuddin M. Saitoh S.-I. Hirawake T. Syamsudin F. Zainuddin M. (2016). Interannual variation of bigeye tuna (Thunnus obesus) hotspots in the eastern Indian Ocean off Java. Int. J. Remote Sens.37, 2087–2100. doi: 10.1080/01431161.2015.1136451
66
Thomsen M. S. Mondardini L. Alestra T. Gerrity S. Tait L. South P. et al . (2019). Local extinction of bull kelp (Durvillaea spp.) due to a marine heatwave. Front. Mar. Sci.6. doi: 10.3389/fmars.2019.00084
67
Timmermann A. An S. I. Kug J. S. Jin F. F. Cai W. Capotondi A. et al . (2018). El niño–southern oscillation complexity. Nature.559, 535–545. doi: 10.1038/s41586-018-0252-6
68
Varela R. Rodríguez-Díaz L. de Castro M. Gómez-Gesteira M. (2021). Influence of eastern upwelling systems on marine heatwaves occurrence. Glob. Planet. Change.196, 103379. doi: 10.1016/j.gloplacha.2020.103379
69
Vijith V. Vinayachandran P. N. Webber B. G. M. Matthews A. J. George J. V. Kannaujia V. K. et al . (2020). Closing the sea surface mixed layer temperature budget from in situ observations alone: operation advection during BoBBLE. Sci. Rep.10, 3–8. doi: 10.1038/s41598-020-63320-0
70
Wang J. J. Tang D. L. (2014). Phytoplankton patchiness during spring intermonsoon in western coast of south China sea. Deep-Sea Res. II.101, 120–128. doi: 10.1016/j.dsr2.2013.09.020
71
Wen C. Wang Z. Wang J. Li H. Shi X. Gao W. et al . (2023). Variation of the coastal upwelling off South Java and their impact on local fishery resources. J. Ocean. Limnol.41, 1389–1404. doi: 10.1007/s00343-022-2031-3
72
Wirasatriya A. Kunarso M. L. Satriadi A. Armanto R. D. (2018). Different responses of chlorophyll-a concentration and sea surface temperature (SST) on southeasterly wind blowing in the Sunda Strait. IOP Conf. Ser.: Earth Environ. Sci.139, 12028. doi: 10.1088/1755-1315/139/1/012028
73
Wirasatriya A. Setiawan J. D. Sugianto D. N. Rosyadi I. ,. A. Haryadi H. Winarso G. et al . (2020). Ekman dynamics variability along the southern coast of Java revealed by satellite data. Int. J. Remote Sens.41, 8475–8496. doi: 10.1080/01431161.2020.1797215
74
Zhao Z. Marin M. (2019). A MATLAB toolbox to detect and analyze marine heatwaves. J. Open Source Software4, 1124. doi: 10.21105/joss.01124
Summary
Keywords
marine heatwaves, local forcing, remote forcing, Indonesian seas, upwelling, Southern Java
Citation
Ningsih NS, Beliyana E, Kamila IH and Tarya A (2025) Long-term characteristics of marine heatwaves (1982–2021) in Indonesian water and their impact on upwelling (case study: Southern Java). Front. Mar. Sci. 12:1504995. doi: 10.3389/fmars.2025.1504995
Received
01 October 2024
Accepted
15 April 2025
Published
08 May 2025
Volume
12 - 2025
Edited by
Donald B. Olson, University of Miami, United States
Reviewed by
Borja Aguiar-González, University of Las Palmas de Gran Canaria, Spain
Samiran Mandal, Indian Institute of Technology Delhi, India
Updates
Copyright
© 2025 Ningsih, Beliyana, Kamila and Tarya.
This is an open-access article distributed under the terms of the Creative Commons Attribution License (CC BY). The use, distribution or reproduction in other forums is permitted, provided the original author(s) and the copyright owner(s) are credited and that the original publication in this journal is cited, in accordance with accepted academic practice. No use, distribution or reproduction is permitted which does not comply with these terms.
*Correspondence: Nining Sari Ningsih, nsningsih@itb.ac.id
Disclaimer
All claims expressed in this article are solely those of the authors and do not necessarily represent those of their affiliated organizations, or those of the publisher, the editors and the reviewers. Any product that may be evaluated in this article or claim that may be made by its manufacturer is not guaranteed or endorsed by the publisher.