 Eric Reyier1*
 Joseph Iafrate2
 Bonnie Ahr1
 Stephanie Watwood2
 Douglas Scheidt1
 Jacob Levenson3Chris Schumann1
- 1Herndon Solutions Group, LLC, NASA Environmental and Medical Contract, Kennedy Space Center, FL, United States
- 2Naval Undersea Warfare Center Division Newport, Newport, RI, United States
- 3Bureau of Ocean Energy Management, Sterling, VA, United States
Ocean gliders equipped with acoustic telemetry receivers offer a promising approach for studying the movement of marine fishes, yet most surveys to date have been brief and rarely include direct comparisons with traditional stationary tracking methods. To evaluate glider-based tracking, a Wave Glider unmanned surface vehicle (USV) was deployed on eight multi-week missions over the east Florida continental shelf. The survey aimed to systematically detect acoustically tagged animals and compare glider performance to a contemporaneous stationary tracking array, with range tests conducted using two receiver types mounted on the glider. Across 190 days and 9,600 km of survey effort, the Wave Glider recorded 331 animal encounters representing 20 species, with blacktip shark (Carcharhinus limbatus), blacknose shark (C. acronotus), and red drum (Sciaenops ocellatus) among the most frequently detected. Detection range trials yielded 50% detection probabilities at distances up to 350 m. Boosted regression tree models indicated that distance between tag and receiver explained 57–71% of the variance in detection probability, with ocean currents, wave height, and solar irradiance also contributing. Compared to a 62-receiver stationary array, the Wave Glider detected, on average, 64% of the species and 40% of the tagged animals, but less than 2% of the detections over identical timeframes. Further, animal encounters with the glider lasted only 14 minutes on average, versus 48 minutes for stationary receivers. Nonetheless, the glider performed comparably on a per-receiver basis, yielding similar numbers of encounters, animals, and species. Moreover, the Wave Glider successfully navigated complex bathymetry surrounding offshore sand shoals, relocated several shed tags, and paired encounters with a variety of oceanographic and meteorological measurements. These results confirm that USVs are suitable for systematic coastal fish tracking. While single gliders cannot replace stationary arrays in most situations, they are realistic solutions for relocating animals in remote locations, monitoring dispersal across discrete habitat patches (e.g., reefs, wind turbines), and providing highly localized habitat context.
Introduction
The accelerating pace of change in marine ecosystems, driven largely by human activities, is increasing demand for oceanographic and biological surveys to understand and mitigate anthropogenic stressors. Ocean gliders, often more specifically classified as autonomous underwater vehicles (AUVs) and unmanned surface vehicles (USVs), are increasingly important to this effort (Whitt et al., 2020). Their endurance and ability to transit long distances in a wide range of sea states affords ocean gliders with cost, logistical, and safety advantages over crewed vessels for certain applications, particularly for mundane and repetitive tasks. Gliders also collect data with high spatial and temporal resolution, often quickly relaying this information via satellites—crucial for timely analyses and decision-making—and have a reduced environmental impact (e.g., carbon footprint, noise pollution) compared to large research vessels (Nicholson and Healey, 2008; Testor et al., 2019; Verfuss et al., 2019; Cauchy et al., 2023).
Long endurance ocean gliders, vehicles that can be deployed for weeks or longer, take on a variety of form factors. AUVs such as the Slocum glider and Seaglider rely on buoyancy changes for thrust, while USVs are typically propelled by harnessing wave energy (Wave Glider, AutoNaut), solar power (SeaTrak), and/or wind (Saildrone) at the ocean surface (Verfuss et al., 2019). While these platforms are most commonly deployed for physical oceanographic surveys (Rudnick, 2016), advances in sensor technology are now allowing gliders to also monitor living resources including zooplankton and pelagic fish biomass (Guihen et al., 2014; Benoit-Bird et al., 2018), benthic communities (Ferrari et al., 2018; Benoist et al., 2019), and sound production of fish and marine mammals (Wall et al., 2017; Aniceto et al., 2020; Luczkovich and Sprague, 2022; Iafrate et al., 2023). Another promising application for ocean gliders is for tracking the movements and habitat associations of marine fishes using passive acoustic telemetry (Eiler et al., 2019; Verfuss et al., 2019; Cypher et al., 2023; Gaskell et al., 2023). The traditional foundation of passive telemetry is an array of stationary acoustic receivers (i.e., tracking stations) that detect the presence of animals carrying surgically implanted or externally attached acoustic transmitters (Hussey et al., 2015). One limitation is that these tagged animals are only detected when they pass within a few hundred meters of a receiver (Kessel et al., 2014), a significant constraint when tracking mobile fish in the open ocean. One advantage of mobile gliders is that they can locate tagged animals in areas not monitored by fixed-station receivers while simultaneously recording a suite of highly localized environmental measurements that help explain why the animal has selected that site (Haulsee et al., 2015; Breece et al., 2016).
Despite their advantages for autonomous animal tracking, most glider-based acoustic tracking studies have consisted of brief deployments, often when animals are concentrated in a small area just after tagging. Further, there have been few opportunities to contrast glider performance to the stationary arrays that are expanding over the open continental shelf in some regions (although see Lembke et al., 2018; Zemeckis et al., 2019). Such comparisons are essential to understanding the relative merits of each approach and to determine the scenarios in which gliders can effectively supplement, or even eventually replace, traditional fixed-station tracking. The overarching purpose of this study was to evaluate the capabilities, limitations, and logistical considerations of glider-based fish tracking surveys during eight multi-week open coastal deployments following a standardized transect path. Of specific interest was to (1) assess the detection range of glider-based acoustic receivers, (2) evaluate the real-world viability of relocating tagged fish in a region hosting multiple acoustic tracking studies, and (3) compare the performance of the glider versus a stationary receiver array deployed to track these same tagged animals.
Materials and methods
Study region
Ocean glider deployments were a central aspect of a broader initiative sponsored by the US Bureau of Ocean Energy Management (BOEM) to characterize the value of offshore sand shoals to fish and sea turtles along the US southeast coast and thus assess the potential impact of sand dredging that supports shoreline restoration projects. Cape Canaveral, Florida, was selected as a primary study area due to the presence of the most expansive sand shoals on the Florida east coast and because it typifies other cape-associated shoals in the region (Figure 1). Prominent features include the shore-connected Southeast Shoal and Chester Shoal, as well as several smaller isolated shoals located farther offshore. Natural limestone reef outcroppings are common a few kilometers to the east (offshore) and north of the shoals. Tidal range averages ~1 m, and salinity remains 35–36 parts per thousand (ppt) year-round. The study area includes one active 5 km2 dredge site that has served as the primary sand source for beach renourishment projects at and south of Cape Canaveral since 2000.
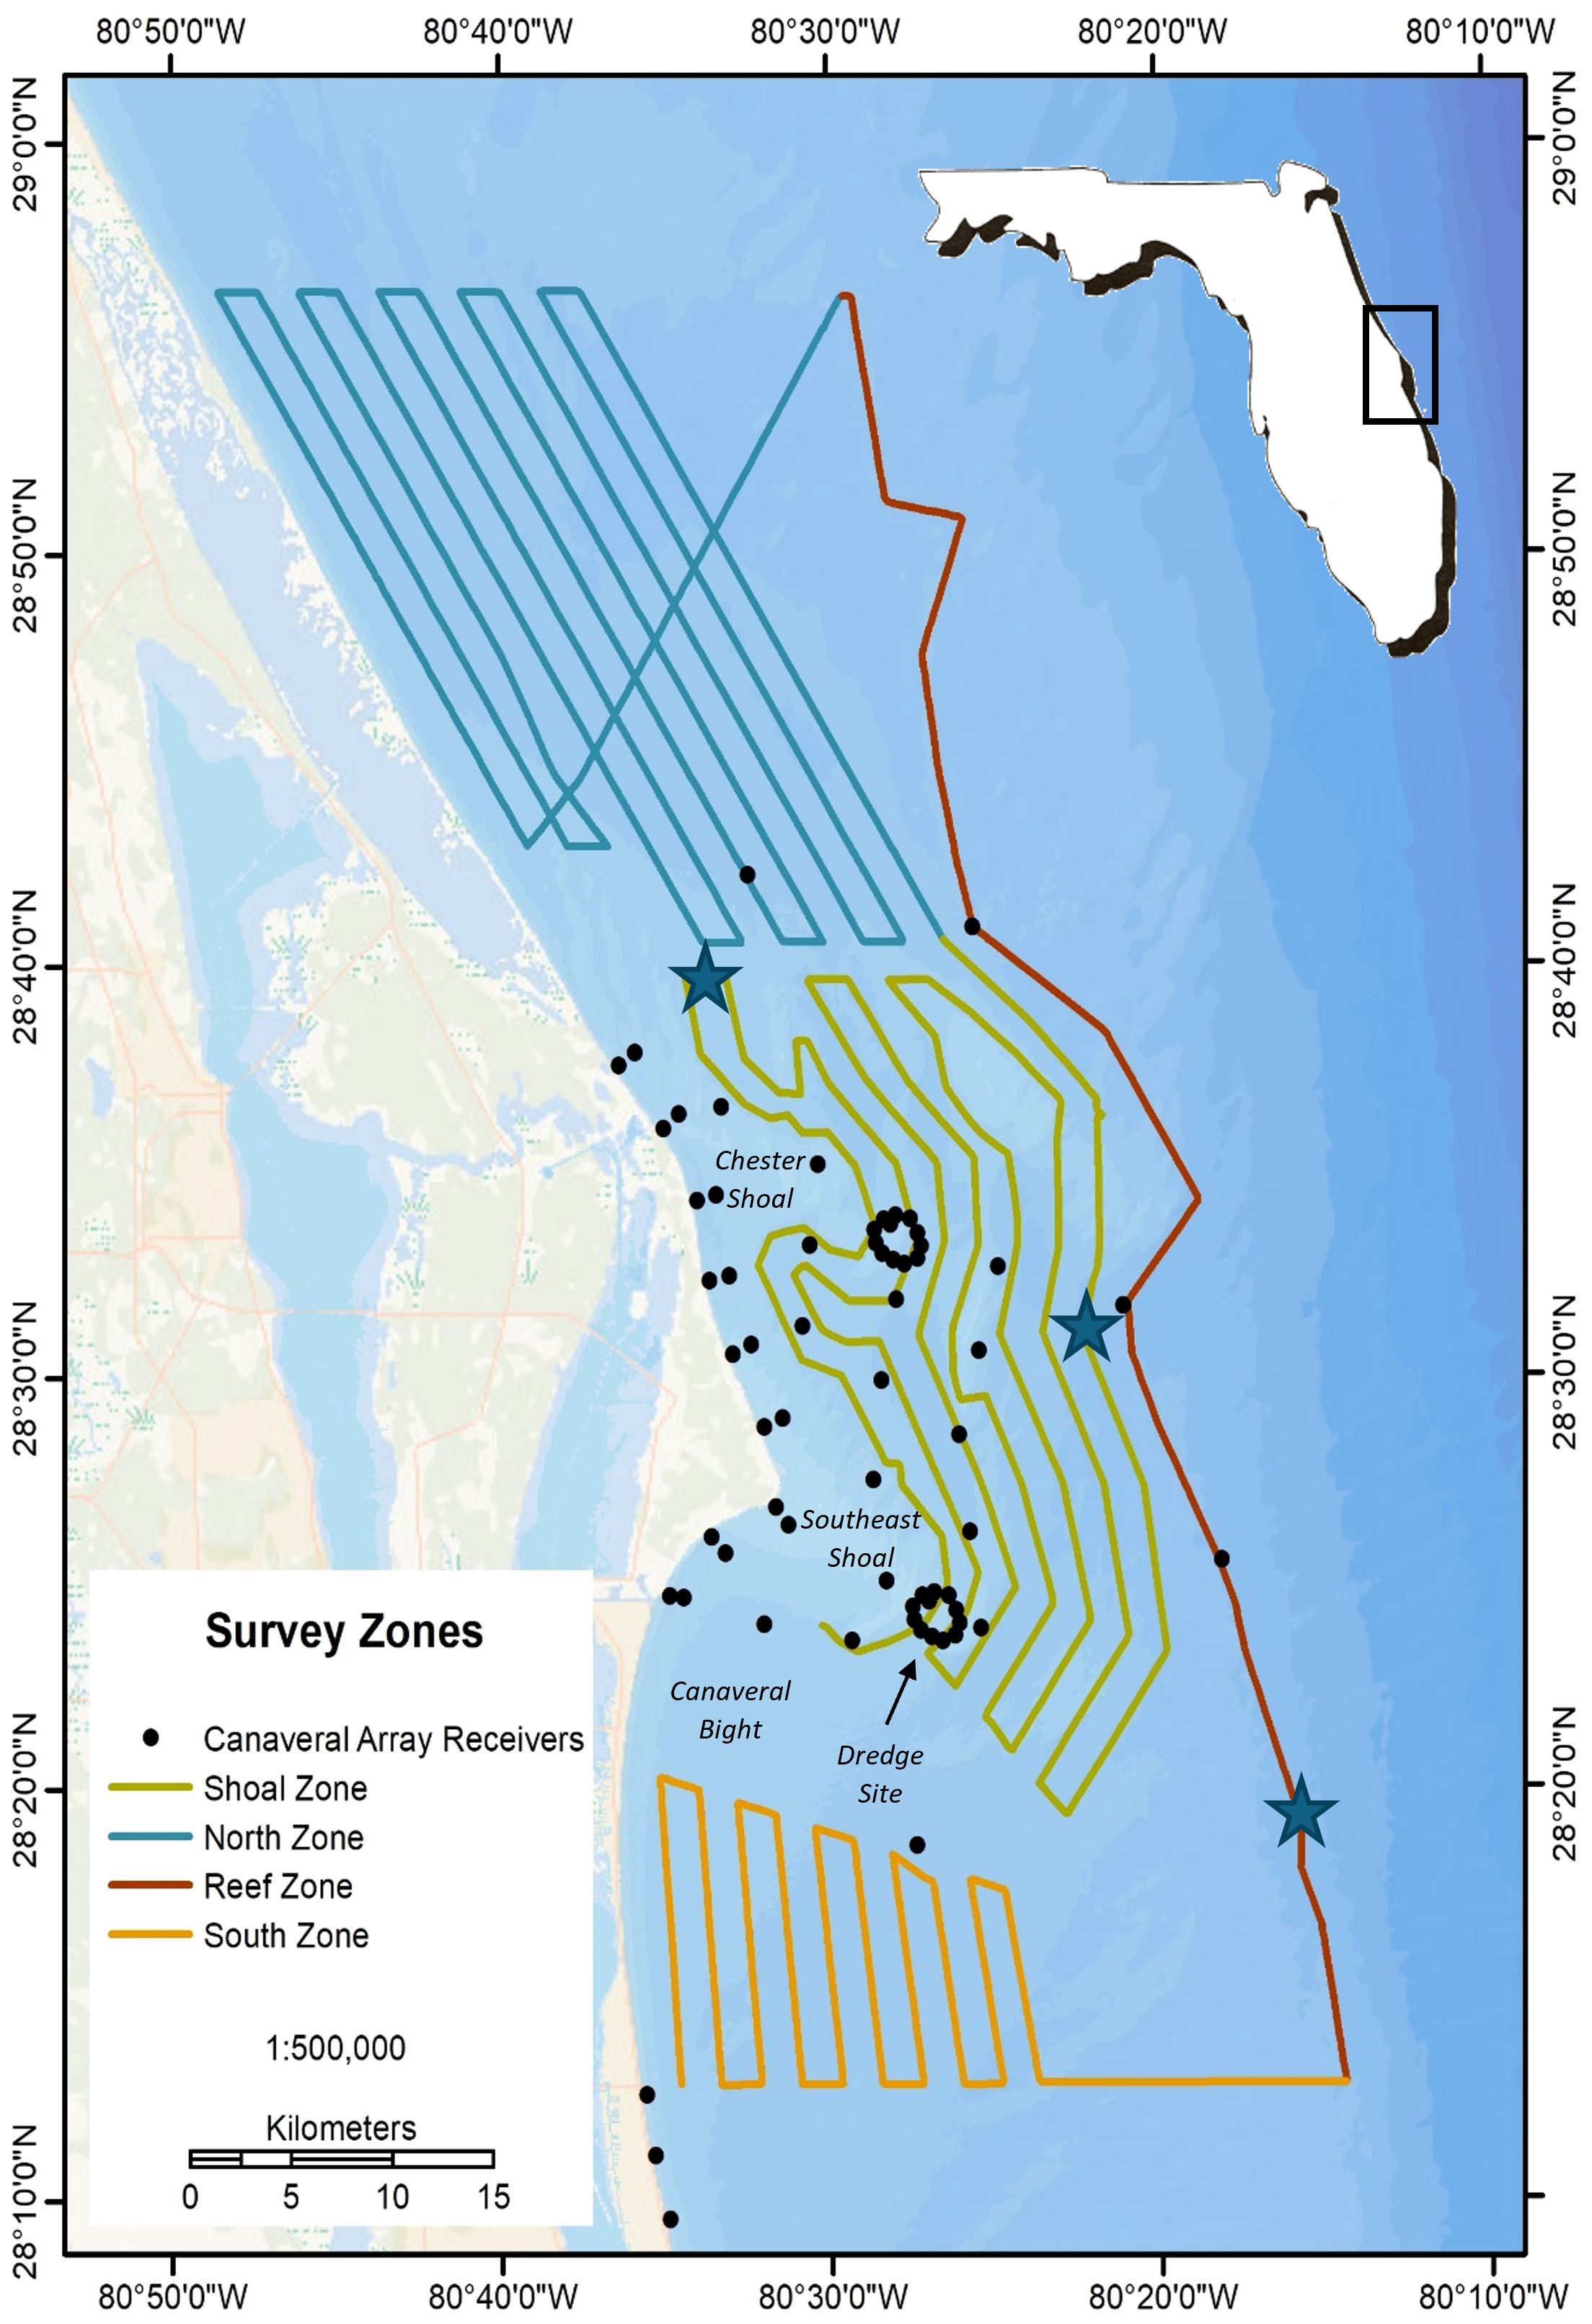
Figure 1. Wave Glider survey zones offshore Cape Canaveral, Florida. Blue stars indicate acoustic telemetry range testing sites. Non-uniform transect spacing in the Shoal Zone is to avoid sand shoals less than 10 m deep.
Glider description
The platform utilized for this study was a Liquid Robotics Wave Glider™ SV3 unmanned surface vehicle1. The Wave Glider consists of a 3.1 m by 0.8 m surface float attached to a submersible (sub) via a 4-m-long high-strength umbilical, resulting in 5 m of total draft (Figure 2). As the float rises on a wave, the sub wings tilt down, providing forward propulsion with a stated average speed of 3.3 km/hr depending on wave height, ocean current, and payload. As the float moves down a wave, the wings tilt up and the sub sinks while also pulling the float forward. During the day, solar panels charge lithium-ion batteries that provide power to the steering rudder, communications equipment, environmental sensors, and to drive a small propeller (thruster, which was used sparingly in this study) when extra speed is desired. A GPS receiver allows the glider to autonomously navigate to preprogrammed waypoints with high accuracy (<10 m), while an Automated Information System (AIS) receiver and collision avoidance software help the glider avoid vessels carrying AIS beacons. Vehicle navigation and environmental sensor data are relayed in near-real-time via Iridium satellite or cellular modems, and pilots can remotely send the glider navigation and sensor commands through custom web-based software.
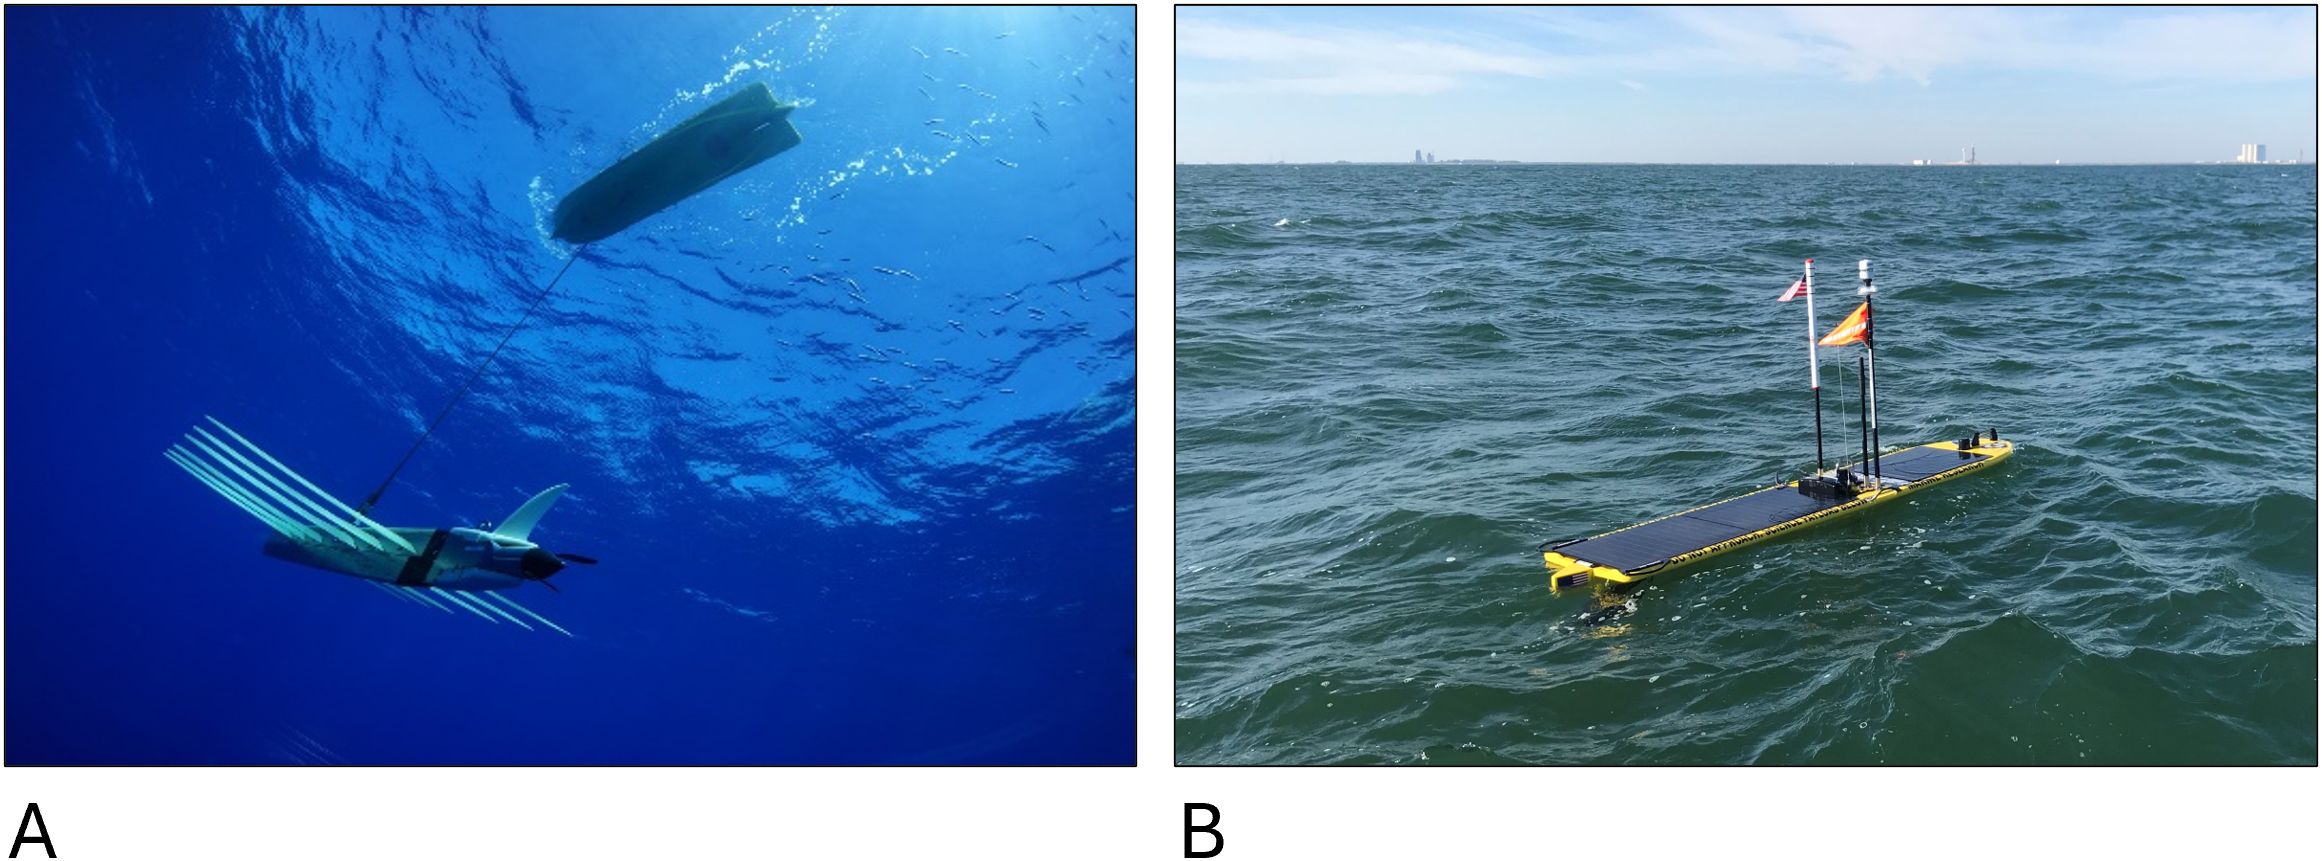
Figure 2. Wave Glider USV (A) as viewed from beneath, and (B) when deployed offshore Cape Canaveral. Photo credits: Liquid Robotics, Inc. (left), Eric Reyier (right).
Two types of acoustic receivers were attached to the Wave Glider to detect tagged animals. The first was a Vemco mini-VR2C cabled acoustic receiver (Innovasea, Nova Scotia, Canada) which draws power from the glider and relays tag detections to shore in real time. The second was a Vemco Mobile Transceiver (VMT), a battery-powered unit often attached to subsurface gliders (e.g., Slocum and REMUS AUVs) that is smaller but requires retrieval before it can be downloaded. The VMT provided redundancy and allowed for a performance comparison between the two receiver styles. Both receivers were mounted on the glider sub with the VR2C facing down, while the VMT was mounted horizontally on the first deployment but facing down on all subsequent missions (Figure 3). Both receivers are omnidirectional, allowing for the detection of animals near the glider but without estimates of range or bearing. The glider also monitored multiple environmental conditions including surface water temperature, chlorophyll, and turbidity via a C3 fluorometer (Turner Designs, San Jose, CA), and dissolved oxygen with a HOBO U26–001 logger (Onset, Bourne, MA), both of which logged at 10-minute intervals. The glider also carried a Remora-ST passive acoustic recorder with a sampling rate of 44.1 kHz (Loggerhead Instruments, Sarasota, Florida) mounted on the sub for monitoring ambient ocean sounds, a CS4500 water speed sensor used to estimate ocean currents, and a PB200 weather station (Airmar, Milford, NH) that measured air temperature, wind speed, and atmospheric pressure. After each deployment, water depth (m) along the transect was estimated at five-minute intervals by querying the etopo180 global relief model (0.017° spatial resolution) from the NOAA GEO-IDE UAF ERDDAP (https://upwell.pfeg.noaa.gov/erddap/index.html) using the rerddapXtracto package in R (Mendelssohn, 2020). A summary of water quality conditions recorded during each deployment is available in Supplementary Table 1.
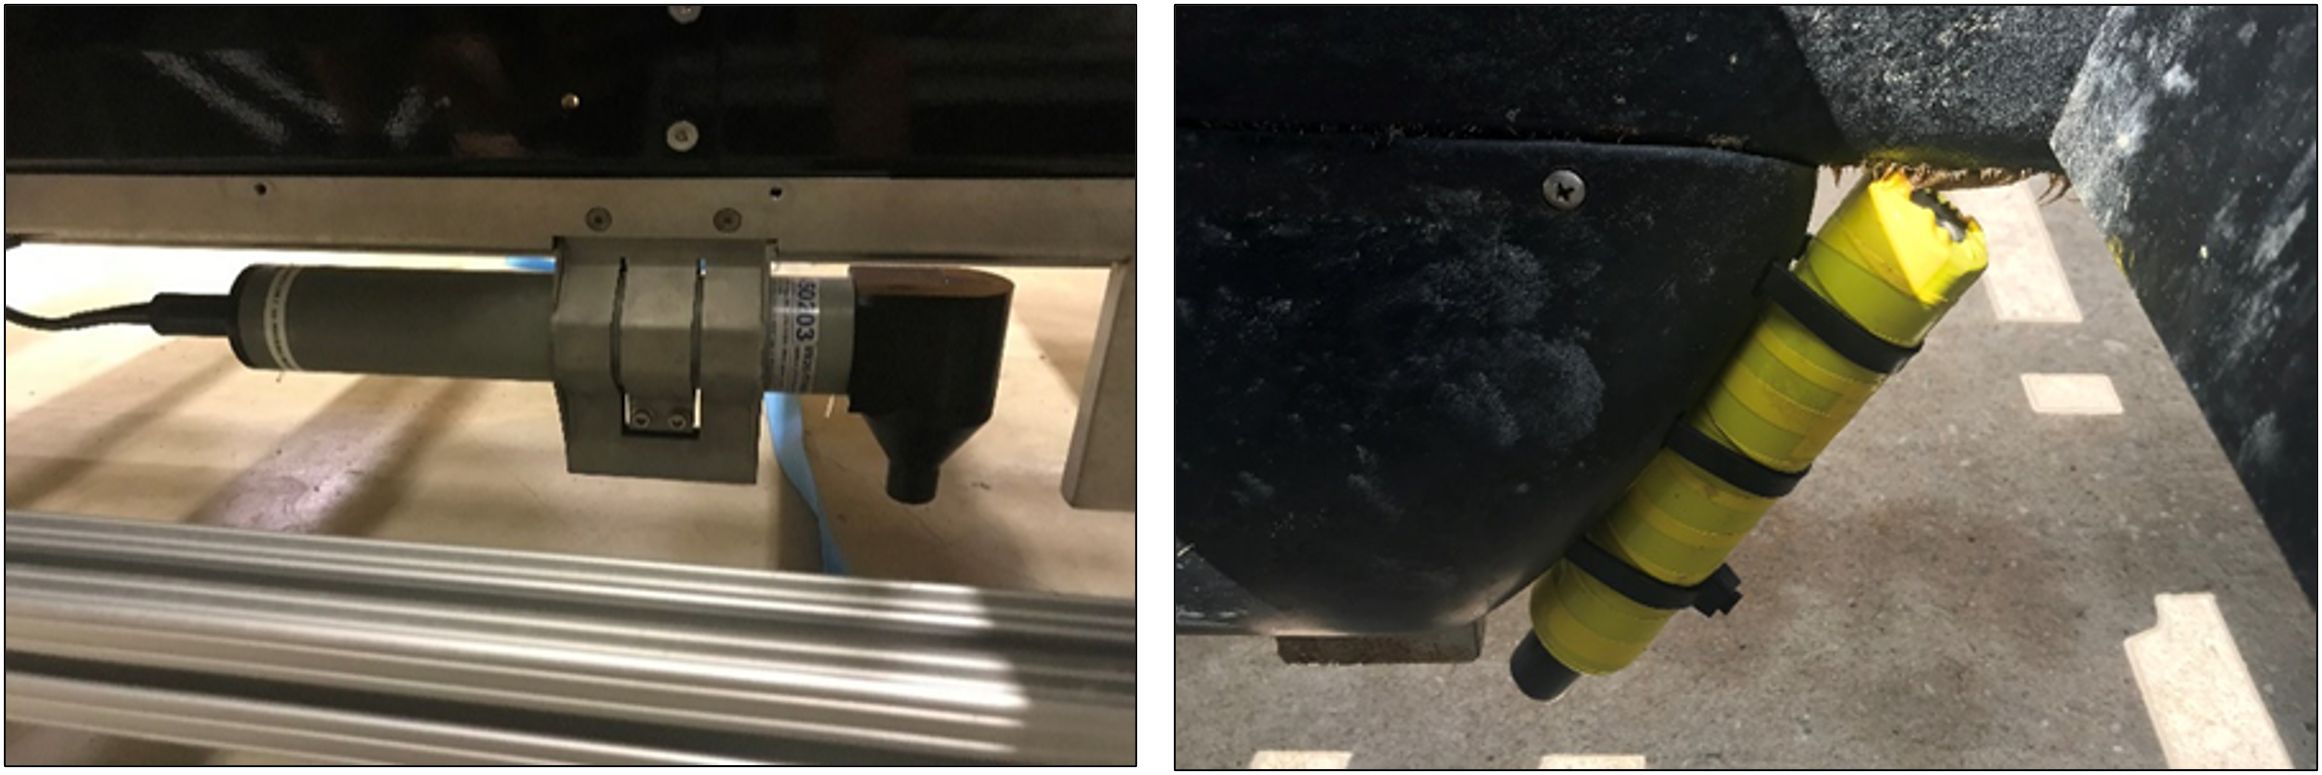
Figure 3. VR2C (left) and VMT (right) acoustic receivers mounted to the Wave Glider sub, which extends 4 m below the ocean surface when deployed.
Glider deployments
Eight glider deployments were performed from November 2017 through August 2019 (one per season), all of which followed the same transect path and included a minimum distance of 930 km defined by 179 preprogrammed waypoints (Figure 1; Animation S1). The transect was divided into four operational zones including, in order of completion, a Shoal Zone (315 linear km), North Zone (376 km), Reef Zone (92 km), and South Zone (146 km). During some deployments when the glider was moving quickly or seas were unfavorable for recovery, the Shoal Zone was surveyed a second time. To avoid the shallowest shoal ridges, the vehicle was constrained to operate in water depths greater than 10 m. The busy shipping lanes in the vicinity of Port Canaveral were also avoided. Before the start of the study, water depth in particularly shallow areas was surveyed in a small boat with an echosounder and the final path was subtly adjusted to avoid areas shallower than depicted on nautical charts. The final transect path was repeated with as much fidelity as possible and generally adopted a “mow the lawn” pattern to maximize the area surveyed. The one exception was the offshore Reef Zone which instead sought to visit multiple known reefs and shipwrecks east of the shoals. The glider was launched and recovered east of Port Canaveral from an 8-m pilothouse skiff, and its status was monitored from shore by project pilots.
Dedicated range test trials were conducted during the first four glider deployments to evaluate tag detection efficiencies of both acoustic receiver types. On these deployments, the glider sequentially orbited three widely spaced range test transmitters (Vemco V16-4H tags, 69 kHz, 158 dB re 1µPa at 1 m, 3 min fixed transmission interval) that were pre-deployed along the transect, one each in 10, 20, and 30 m of water, in areas of sandy bottom with uniform depth (Figure 1). Transmitters of this style were the most common type implanted in large fish at Cape Canaveral and were moored with a horizontal orientation 2 m off the bottom. Upon reaching each range test site, the thruster was turned off if required and the glider circled the transmitter twice at a 250 m horizontal radius, and once each at 500 m, 750 m, and 1000 m (Figure 4), although the glider operated at a variety of distances from range tags as it entered and departed the area and moved between orbits.
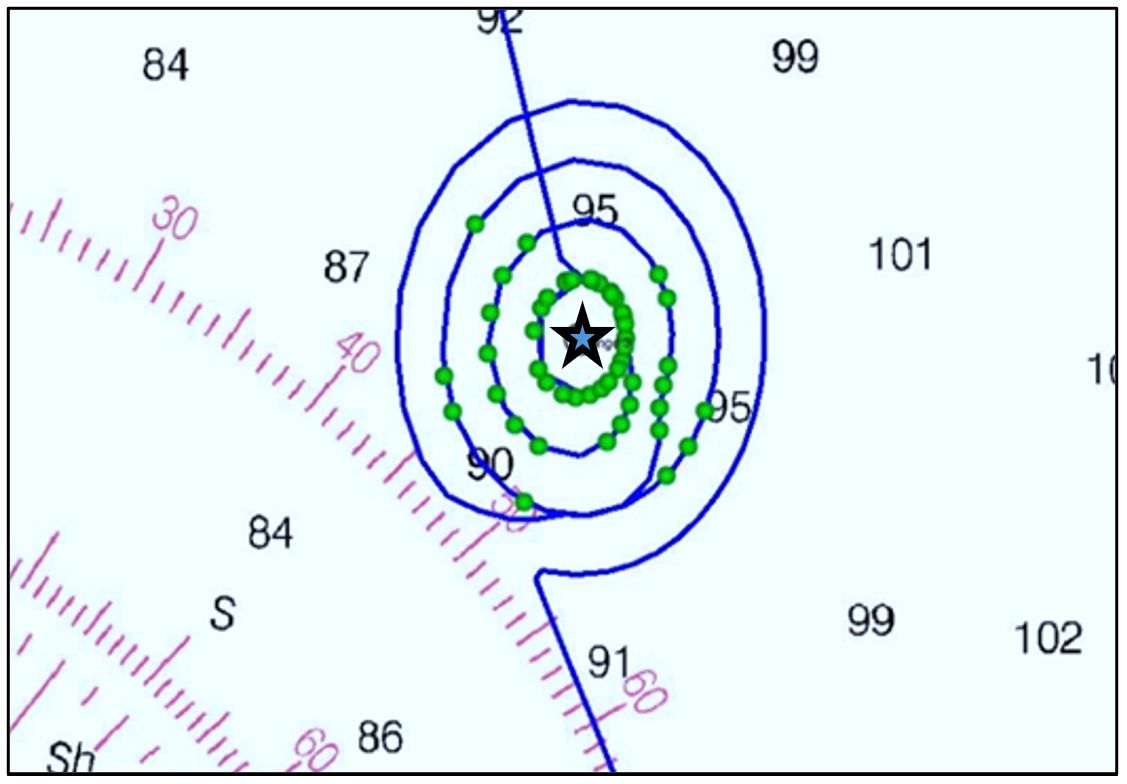
Figure 4. Wave Glider acoustic receiver range testing path (Deployment 1, 30 m site, 12 December 2017, 7.2 hours on station) overlayed on a local nautical chart. Range test trials included orbits at 250, 500, 750, and 1000 m from a pre-deployed range test transmitter (center of orbit). Green dots represent the Wave Glider location when it detected the test transmitter. Depth values are in feet.
Stationary array description
An existing stationary acoustic telemetry array at Cape Canaveral (hereafter the ‘Canaveral Array’) was used to independently assess the distribution of tagged fishes (Figure 1). During this study, this array included 52–62 Vemco VR2W and VR2AR acoustic receiver stations deployed year-round from the shoreline to the offshore reef tract (0.5–22 km offshore, 2–25 m deep; Reyier et al., 2023). All stations were anchored to the seafloor and retrieved twice annually using SCUBA to download animal tag detections. Most stations were arranged in a non-overlapping grid layout although the array also included a 12-station receiver ring surrounding the sand dredge area on the Southeast Shoal and an identical ‘control’ ring at an undisturbed reference site on nearby Chester Shoal. Multiple fish species were tagged locally including blacknose (Carcharhinus acronotus), finetooth (C. isodon), and sharpnose (Rhizoprionodon terraenovae) sharks, red drum (Sciaenops ocellatus), red snapper (Lutjanus campechanus), king and Spanish mackerel (Scomberomorus cavalla and S. maculatus), and cobia (Rachycentron canadum), plus loggerhead (Caretta caretta) and green (Chelonia mydas) sea turtles. Most animals were originally tagged months to years prior to the first glider deployment. Details of Canaveral Array operations and associated tagging are found in Iafrate et al. (2019). Numerous other fish and turtle species tagged elsewhere along the US Atlantic coast and the Bahamas were also seasonally present in the Canaveral Array and were identified to species by consulting tag lists maintained by the FACT (https://secoora.org/fact/) and Atlantic Cooperative Telemetry (ACT; https://www.theactnetwork.com/) animal tracking networks (Bangley et al., 2020b; Young et al., 2020). All glider and Canaveral Array detections were archived in the FACT data node.
Glider range testing analysis
Binary boosted regression tree (BRT) models were used to evaluate the detection efficiency of the Wave Glider’s acoustic receivers as a function of distance from the range tag and several environmental variables using the gbm.auto package (Dedman et al., 2017) in R (v.2023.08.31). BRTs are an emerging machine learning approach in acoustic telemetry because they are often more robust when analyzing data-limited and zero-inflated datasets relative to generalized linear and additive models, can model complex interactions, are less sensitive to outliers, and are less likely to overfit (Elith et al., 2008; Dedman et al., 2017). To date, BRTs have been used to model the distribution, environmental preferences, and migration timing of acoustically tagged sharks, rays, and teleosts (e.g. Bangley et al., 2020a; Harris and Stevens, 2021; Ahr et al., 2025), and for glider-based range testing (Cimino et al., 2018). Since all deployed range test tags had a three-minute fixed transmission interval, the exact time of each transmission was known. The BRT model binary response variable was whether (1) or not (0) each transmission was detected by the glider’s receivers. All range test transmissions occurring when the Wave Glider was within 1000 m of the tag, either during the dedicated range test trials or when on its regularly planned path, were pooled for analysis. Separate models were then constructed for the mini-VR2C and VMT, plus a combined model that grouped both receiver types. Distance (m) between the range tag and glider was calculated using the geosphere package in R (Hijmans et al., 2019). Other potentially influential covariates considered in models were water depth (the 10, 20, and 30 m sites), wind speed (knots), water temperature (°C), ocean current (knots), wave height (m), vehicle speed (km/hr), solar irradiance (global horizontal irradiance in W/m2), and ambient sound (root mean square sound pressure level, SPL-RMS, in dB re 1 µPa). Wind speed, temperature, and ocean current were obtained from the glider’s onboard sensors. Wave heights were obtained from the National Data Buoy Center Buoy 41009 located 18–41 km east of range test sites. Solar irradiance was obtained from the National Renewable Energy Laboratory (https://nsrdb.nrel.gov/), and ambient sound was accounted for by including broadband sound pressure levels recorded by the glider’s sub-mounted Remora-ST acoustic recorder. High collinearity can lead to model instability, reduced interpretability, and model overfitting and was assessed using the variance inflation factor (VIF) in R (car package v.3.1-2; Fox and Weisberg, 2019). Only covariates with a VIF below 3 were retained for the final models, a ‘stringent’ approach according to Zuur et al. (2010).
BRT learning rate (lr; rate at which the model learns and increases complexity), tree complexity (tc; number of tree splits or interactions the model allows for), and bag fraction (bf; proportion of data that is randomly chosen without replacement to train the model with cross validation) were refined in a stepwise manner for final models (Leathwick et al., 2006; Dedman et al., 2017). Model evaluation metrics included cross validation (CV) mean deviance, area under the curve (AUC), true skill statistic, overfitting score (Training AUC – CV AUC), percent deviance explained, and achieving at least 1000 trees.
Animal encounters: glider vs. stationary array analysis
Encounters were discrete events where tagged animals were detected by an acoustic receiver, and were classified as valid, likely valid, or suspect based on the observed movement history of that animal. Valid Wave Glider encounters were those where the animal was confirmed to be moving based on subsequent glider and/or Canaveral Array detections. Likely valid encounters included those where recent prior detections confirmed the animal was alive but no subsequent evidence was available confirming further movement through the end of the study. Suspect encounters were instances where multiple glider detections in subsequent deployments confirmed the tag had not moved, suggesting a mortality. Suspect encounters were removed from all statistical analyses. Encounters typically consisted of multiple detections so their duration (in minutes) was calculated as the time between its first and last detection. When an animal went undetected for longer than 60 minutes, further detections were considered a new encounter.
Animal encounter rates (number per km travelled) along the Wave Glider transect were used to compare across survey zone and season. Since data did not meet normality assumptions even after transformation, non-parametric Kruskal-Wallis tests were performed separately on each factor, with a Dunn’s post-hoc test to identify any pairwise differences. Encounter rate comparisons across deployments were not explored due to the increasing number of animals being tagged by researchers along the US east coast as this study progressed. Animals detected off-transect while transiting to launch and recovery points were not included.
With up to 62 stationary receivers, the Canaveral Array was expected to produce a larger overall tracking dataset than a single mobile receiver. It was less clear, however, how the glider-based receiver would perform relative to stationary receivers on an individual basis. To facilitate this comparison, the number of daily animal encounters, unique transmitters, and species were tallied for each Canaveral Array station on each date the Wave Glider was also deployed. These three metrics were then compared to the number of encounters, transmitters and species detected by the glider, both for the entire Canaveral region, and again just using detection data from the Shoal Zone, the one area where Wave Glider and Canaveral Array monitoring largely overlapped. Days when fixed stations malfunctioned or were lost were excluded, as were dates when the glider was not deployed for a full 24 hours (i.e., launch and recovery days). Mann-Whitney U-tests were used to test across groups since the dataset was zero-inflated and could not be normalized by transformation.
The duration of animal encounters (in minutes) from the Wave Glider and Canaveral Array was compared to assess the relative performance of mobile vs. stationary receivers. This analysis was limited to species detected by both approaches. Detections from both glider receivers were combined to calculate encounter duration since they were always time-synced to within 1–2 seconds. Although animals carried tags with a mix of power and transmission intervals, all tags were equally available to both systems. A generalized additive mixed model (GAMM) was then used to evaluate encounter durations between the Wave Glider and the Canaveral Array while accounting for of water depth. This approach was chosen because the glider and Canaveral Array surveyed modestly different water depths (mean depth of encounter of 16 m vs 9 m, respectively), and because the influence of water depth on acoustic detection is often non-linear. The GAMM included a smooth term for depth (with basis dimension k = 15) and a random intercept for deployment to account for repeated sampling and variation in survey conditions across deployments. Competing model structures were evaluated using Akaike Information Criterion (AIC) including a model with a shared depth smoother and an alternative model allowing for group-specific smoothers. To meet normality and equal variance assumptions, only encounters with > 1 detection duration were included, and duration values were first log transformed. Model assumptions were assessed using partial residual and quantile-quantile plots, which indicated acceptable fit and distributional characteristics. The final model was fit with the mgcv package v.1.9–1 in R (Wood, 2017).
Results
Overview
The Wave Glider successfully completed all eight deployments which lasted on average 24 days, covered 1200 km at a mean speed of 2.1 km/hr, and with a maximum recorded speed of 6.0 km/hr (Table 1). A total of 9600 km was surveyed across the entire two-year study. Deviations from the planned course only occurred during the last day of Deployment 1 when unusually calm seas and a strong longshore current impeded forward progress, and during Deployment 8 when the vehicle was redirected to systematically search for Canaveral Array receivers with internal beacons that were displaced during Hurricane Dorian (September 2019).
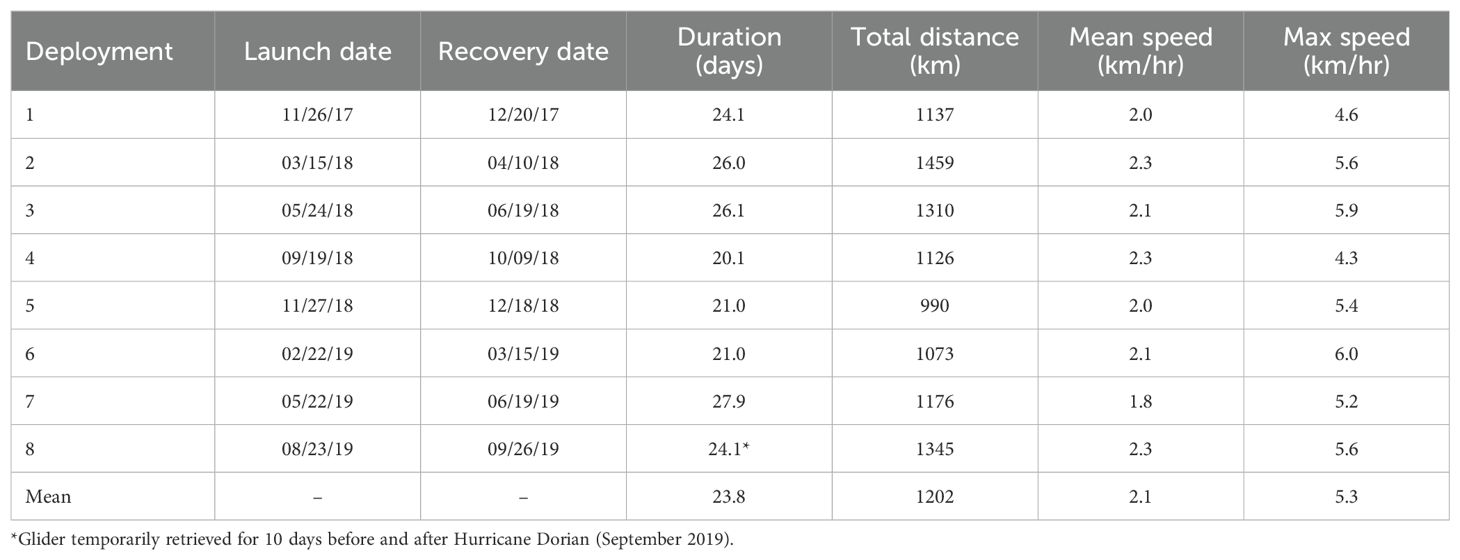
Table 1. Performance summary for all Wave Glider deployments.
Glider range testing
The glider passed within 1000 m of a deployed range test tag 17 times including 13 dedicated trials when it orbited the tag at predefined distances plus 4 instances when following its normal survey path. In total, the glider was range testing for 92 hours. Meteorological conditions at range test sites included wave heights of 0.3–2.0 m, wind speeds of 2–28 kts, and water temperatures of 17–30°C. A total of 3385 test tag transmissions were generated during these trials. Both the mini-VR2C and smaller VMT performed similarly well within the first 100 m of a test tag, after which the mini-VR2C outperformed the VMT (Figure 5). The 50% and 20% detection range (i.e., the distance at which 50% and 20% of all tag transmissions were successfully detected) occurred at roughly 350 m and 500 m for VR2C, and 300 m and 400 m for VMT. The furthest successful detection from the glider was 889 m for the mini-VR2C and 602 m for the VMT.BRT models were used to assess the factors related to Wave Glider acoustic receiver performance with separate models for the VR2C, VMT, and both receivers combined. Depth was dropped as a covariate since it did not improve model diagnostics or deviance explained (Table 2). Model performance was high with AUC scores considered excellent for all models (0.96–0.97), TSS from 0.79 to 0.82, training data correlation from 0.77-0.82, and deviance explained from 58–63%. No models showed overfitting (score 0.03–0.06).
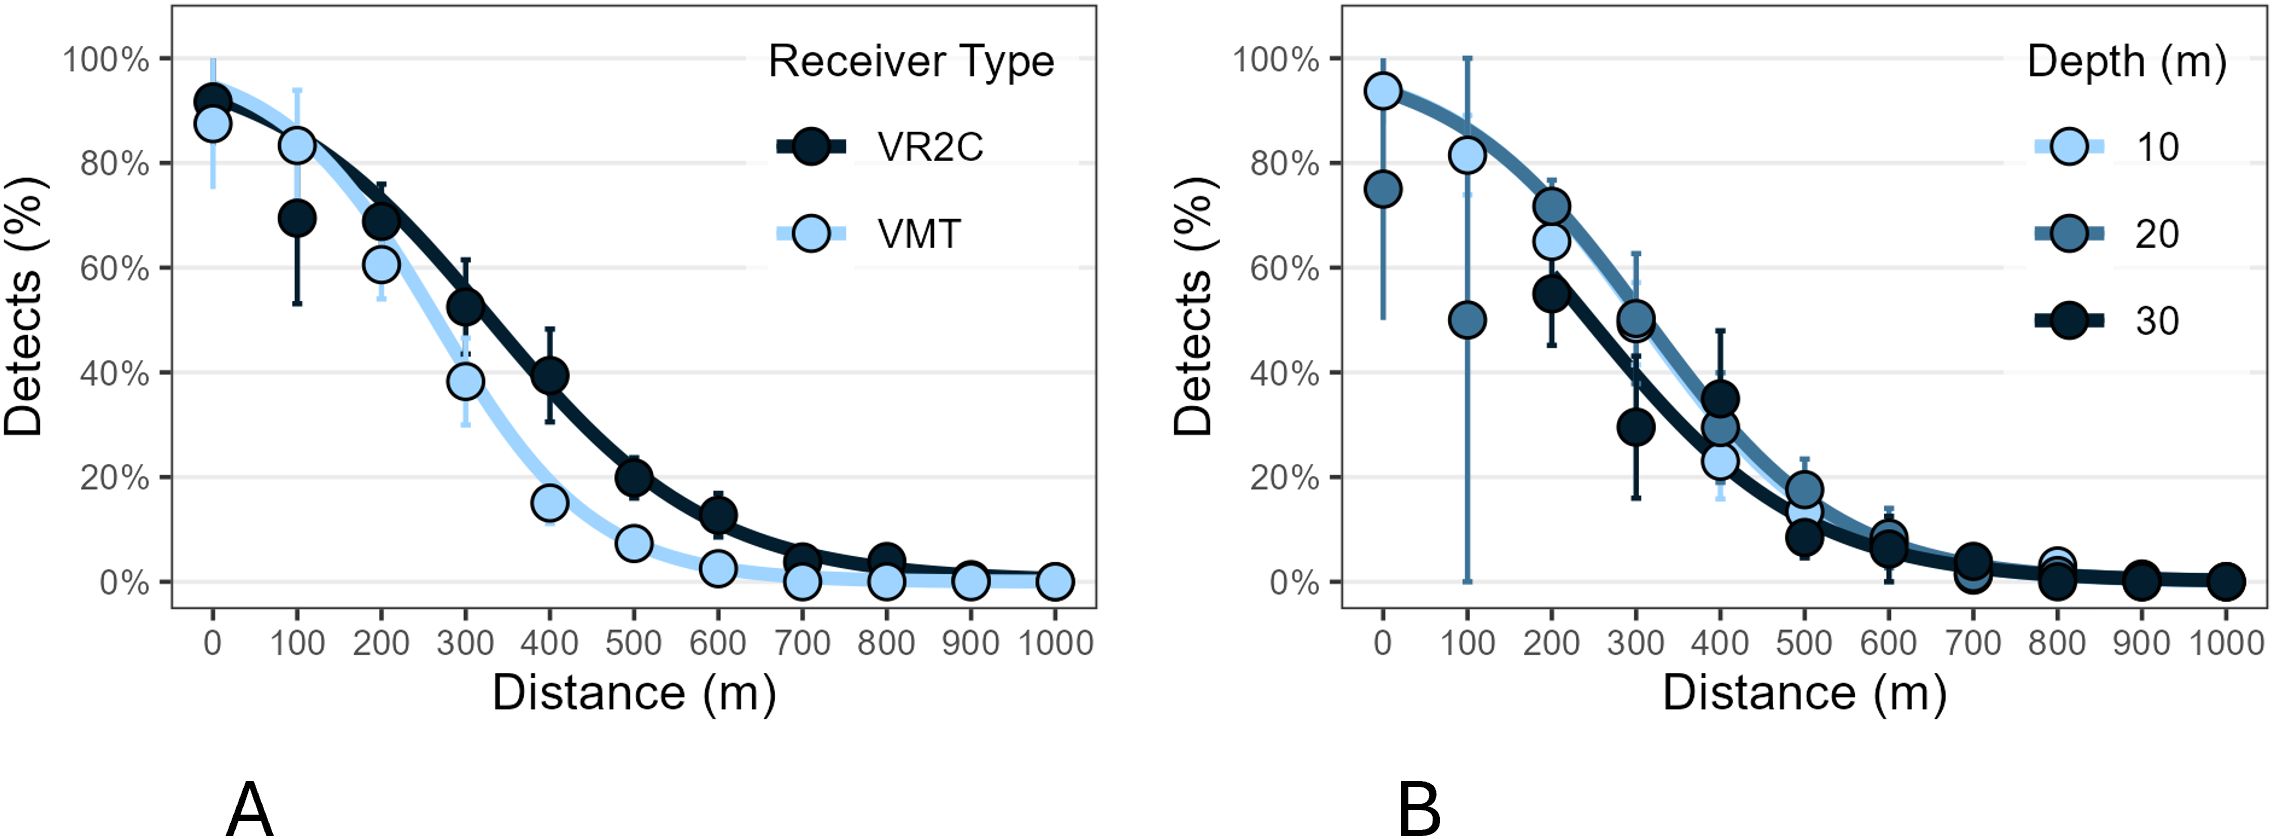
Figure 5. Wave Glider acoustic receiver detection efficiency for V16-4H acoustic tags. Detection efficiency (± 1 SE) by (A) receiver type (all depths combined), and (B) by water depth (both receivers combined). Distance values are binned to the nearest 100 m with lines fitted using logistic regression curves.
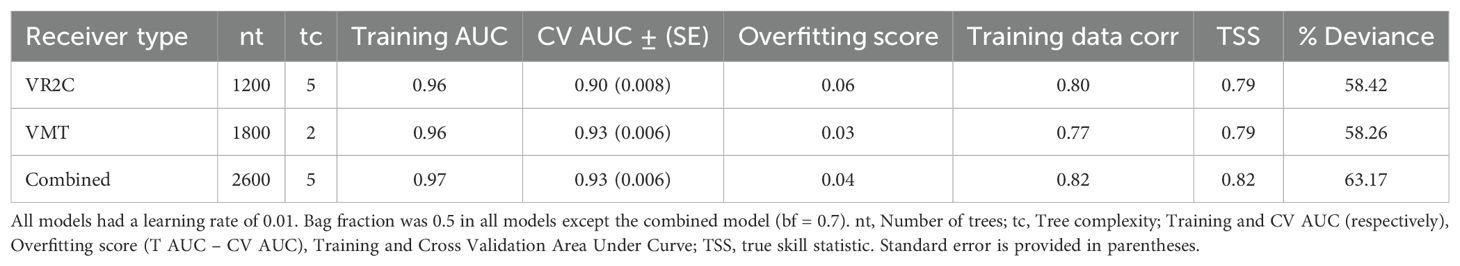
Table 2. Boosted regression tree model parameters and performance.
Distance between the glider and range tag was the most important factor in all models (VR2C – 57%, VMT-71%, and Combined-63% relative influence, respectively, Figure 6) with the likelihood of a detection decreasing with distance. Ocean current speed and vehicle speed were the second most influential covariates in the VR2C and Combined models while solar irradiance and current speed both contributed 6% in the VMT model with wave height and temperature not far behind at 5 and 4%. The likelihood of a range tag detection decreased along with decreased solar irradiance, possibly due to greater nocturnal biological sounds locally (e.g., soniferous fish chorusing; Iafrate et al., 2023). “Due to the stochastic nature of BRTs, minor differences in covariate rankings, specifically when relative influences differ by only 1–2%, should be interpreted with caution, as such rankings may vary slightly between model runs. In contrast, covariates with larger differences in relative influence tend to maintain consistent rankings across runs and did in all three models. Additionally, in the Combined model, receiver type (VR2C or VMT), only made up 3% of the relative influence, suggesting receiver type was not a large contributing factor to detection range of the glider, however some factors varied between the two types. Further details on the relationship between detection range and covariates are found in Supplementary Figures 1–3.
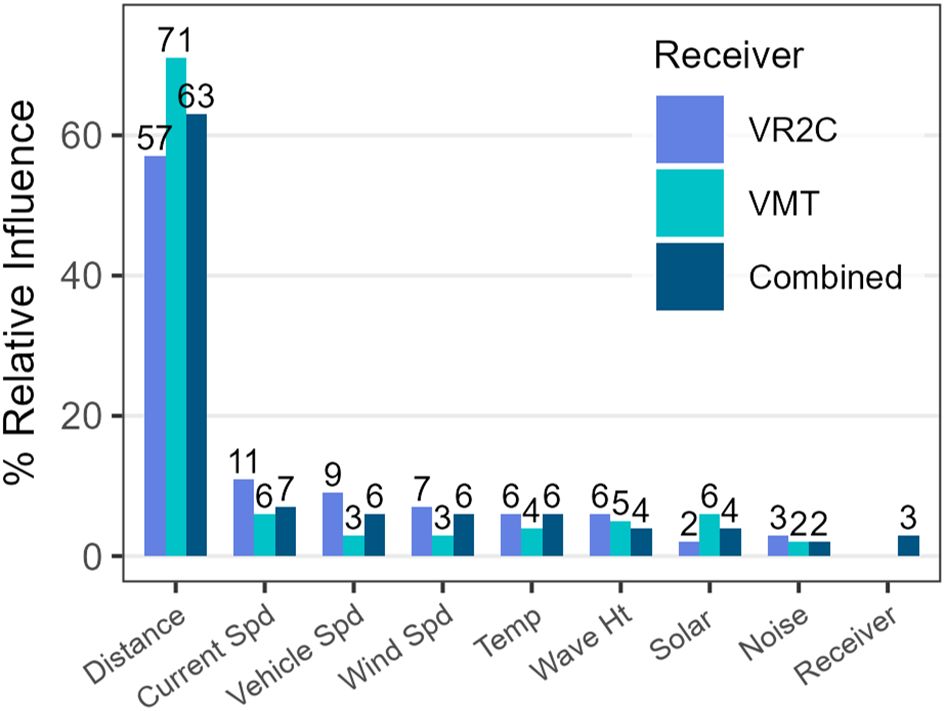
Figure 6. Relative influence (%) of environmental conditions on the tag detection efficiency of Wave Glider acoustic receivers.
Animal encounters: glider vs. stationary array
A total of 167 tagged animals from 20 species (9 sharks, 6 bony fish, 4 rays, 1 loggerhead sea turtle) were detected by the Wave Glider across the eight deployments (Table 3). Blacktip shark (47 individuals), blacknose shark (22), red drum (18), finetooth shark (15), and cobia (14) were the most commonly encountered species. Seventy-nine of these individuals (47%) were tagged locally at Cape Canaveral while the remaining 88 were tagged by 14 other research groups at other locations along the US East Coast, Gulf of Mexico, and Bahamas. For animals tagged at Cape Canaveral which had a known release date, time at liberty (i.e., days between release and Wave Glider detection) averaged 1005 days with a range of 2 to 2296 days. Many animals were relocated multiple times on the same deployment or across deployments, resulting in 331 unique encounters (Figure 7). The integrated VR2C acoustic receiver logged 62% of animal detections while the VMT logged 38% of detections, and only one of the 3735 combined detections logged by both receivers could not be matched to a known tagged animal in the region and was considered a false detection.
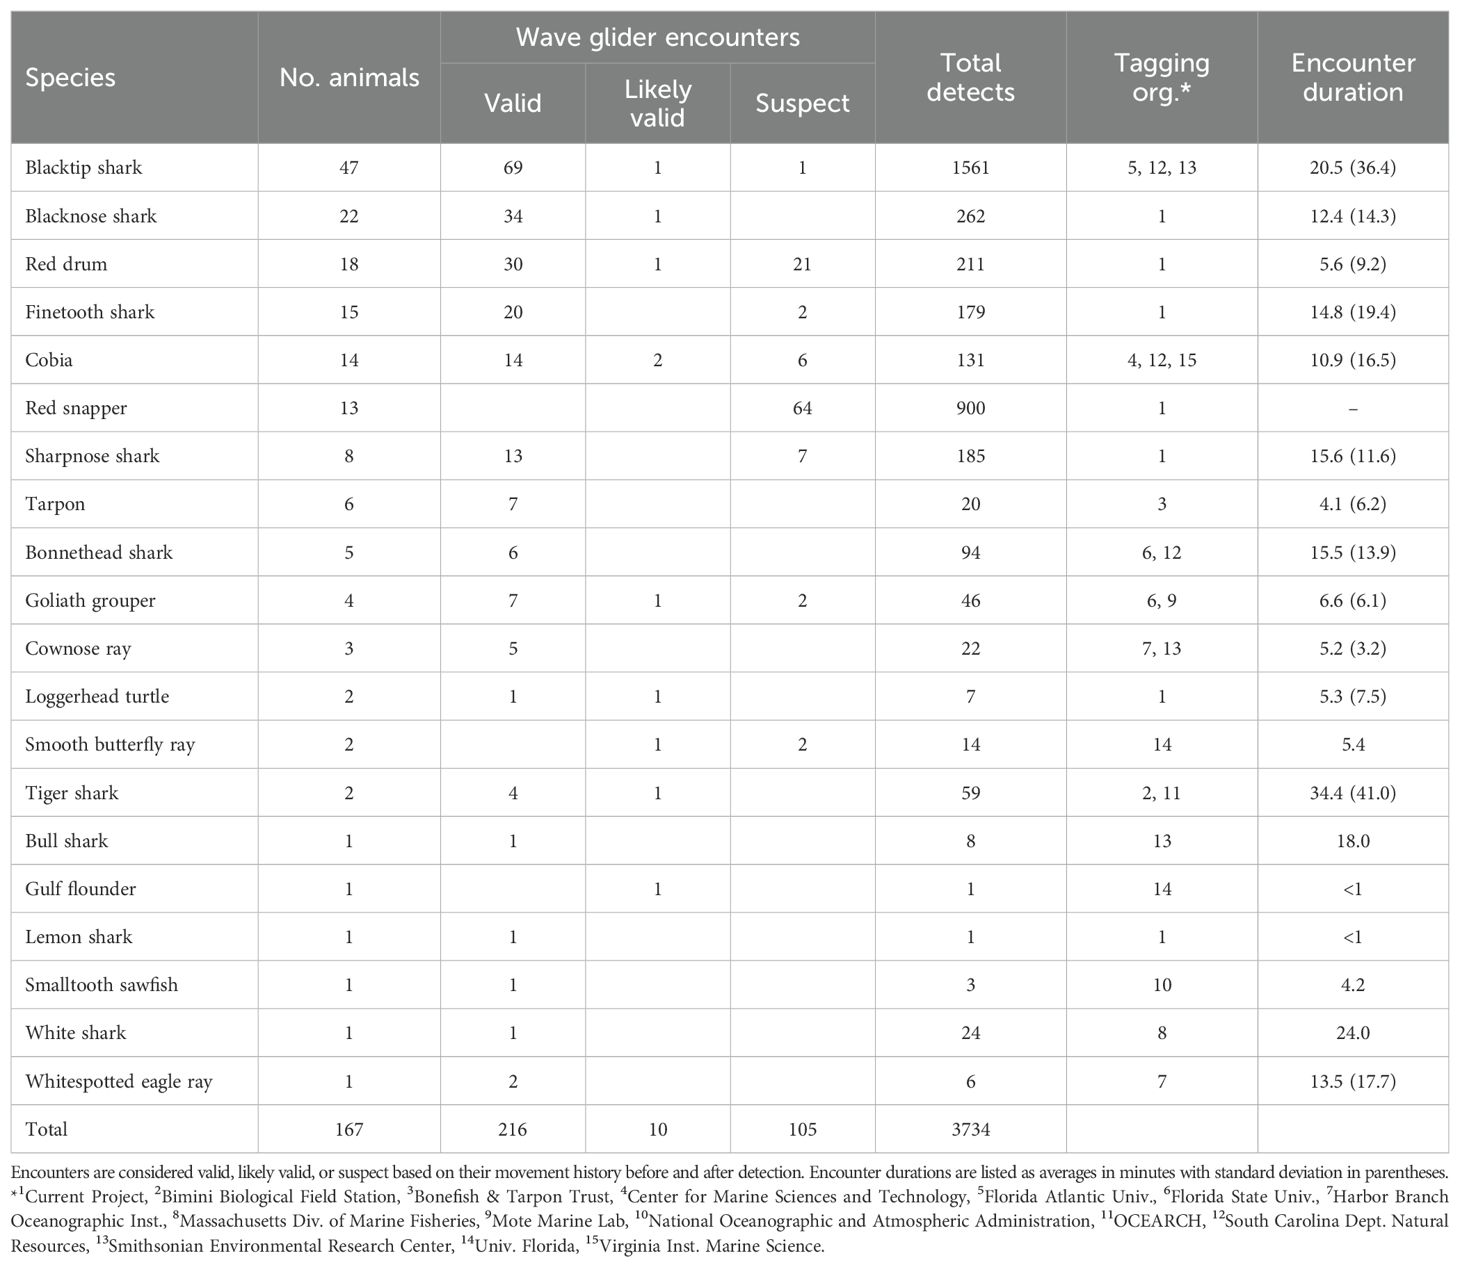
Table 3. Acoustically tagged animals detected by the Wave Glider.
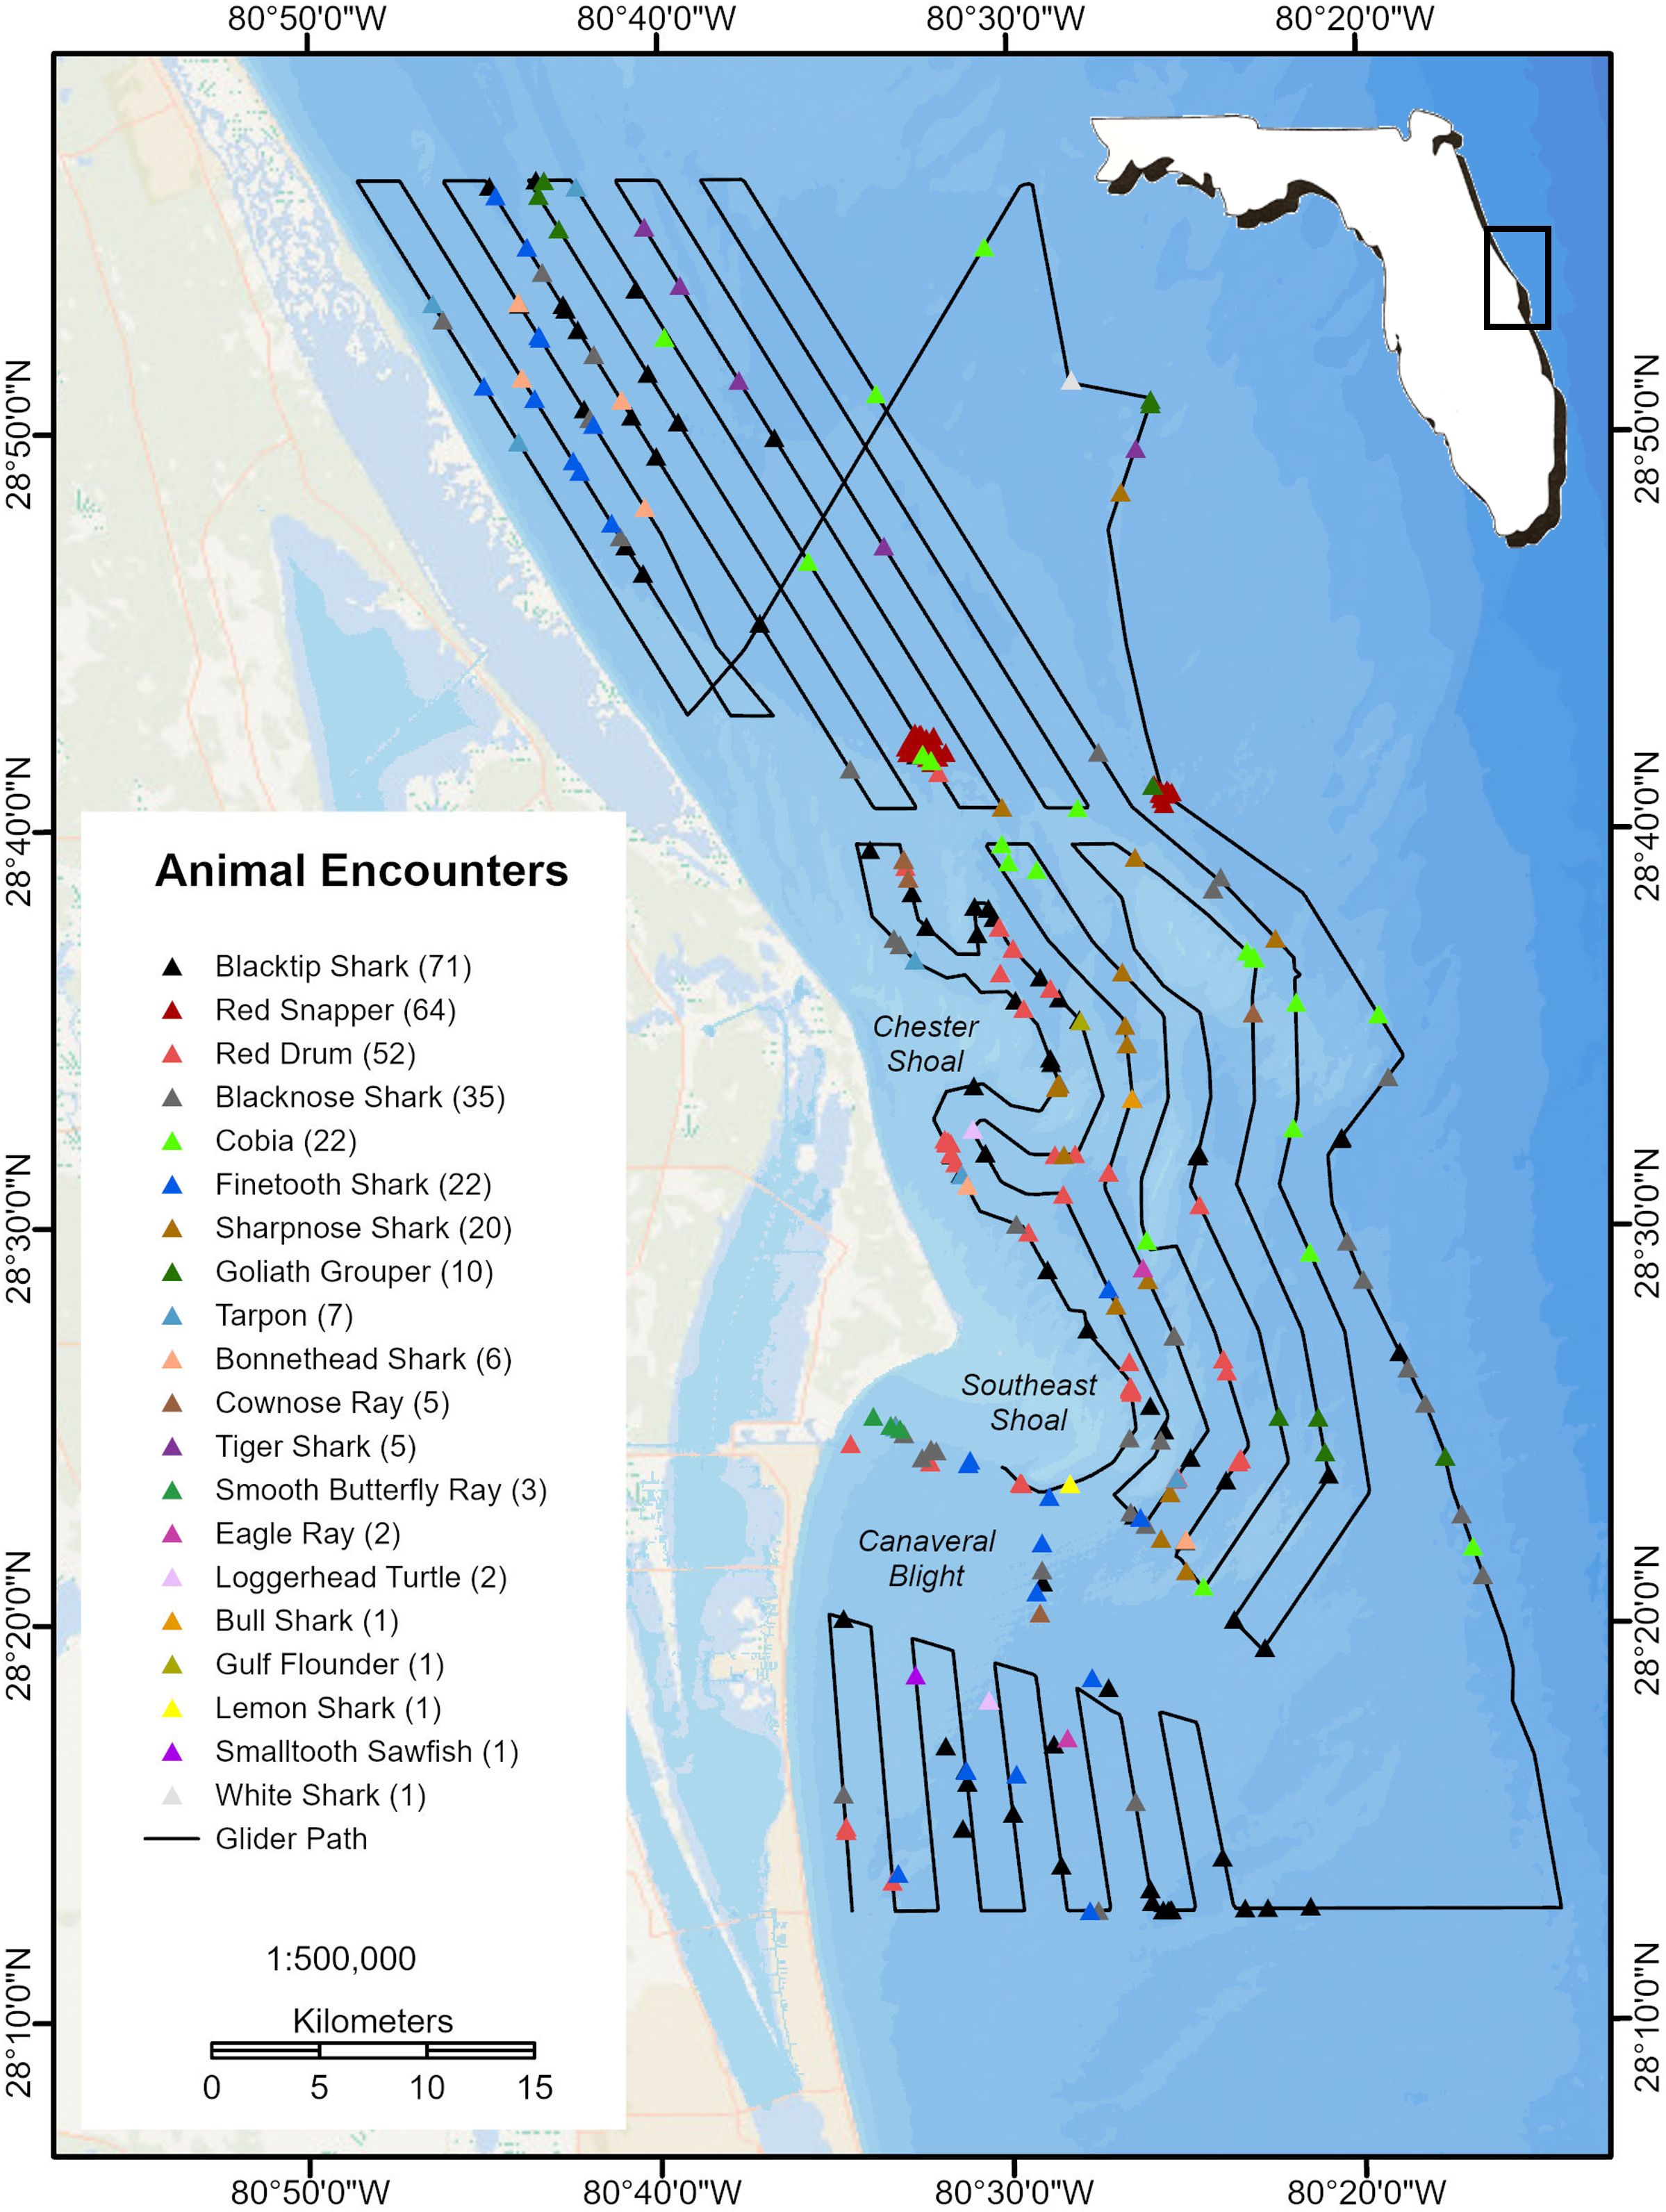
Figure 7. Encounter locations for all tagged animals detected by the Wave Glider. Values in parentheses are the number of unique encounters for each species.
Exactly half of the 226 valid or likely valid encounters were confirmed solely through multiple Wave Glider detections while the other half could only be verified with prior or subsequent movements through the Canaveral Array. Not all relocated animals were confirmed as alive. Over 100 of the 331 encounters were classified as suspect because the tag was relocated at the same location across multiple deployments (20 individuals, 99 encounters) or lacked other recent data from stationary receivers (6 individuals, 6 encounters). Both scenarios suggest a mortality, especially when seen in sharks, red drum, and cobia which are highly mobile. All 64 red snapper encounters were also classified as suspect because no movements were ever confirmed by the glider or Canaveral Array. However, their naturally high site fidelity, confirmed in previous studies (e.g., Topping and Szedlmayer, 2011; Everett et al., 2020), suggests that some suspect encounters could be from living snapper that simply did not disperse from their original tagging locations.
The overall animal encounter rate on the glider transect averaged 0.023 encounters per kilometer traveled and was slightly elevated in the Shoal Zone (0.030 per km) and lowest in the North and Reef Zones (0.018 per km; Figure 8) although these differences were not significant (Kruskal-Wallis Test, p = 0.381). Encounter rate did differ across seasons, being highest in late fall surveys (0.055 per km) and lowest in spring and summer (0.008–0.011 per km; Kruskal-Wallis Test, p < 0.001). This seasonal disparity is likely because many fish species are overwintering in east Florida, a phenomenon now well documented for many migratory sharks and bony fishes (Iafrate et al., 2019). Although not detailed here, a summary of environmental conditions under which animals were detected by the Wave Glider is available in Supplementary Table 2.
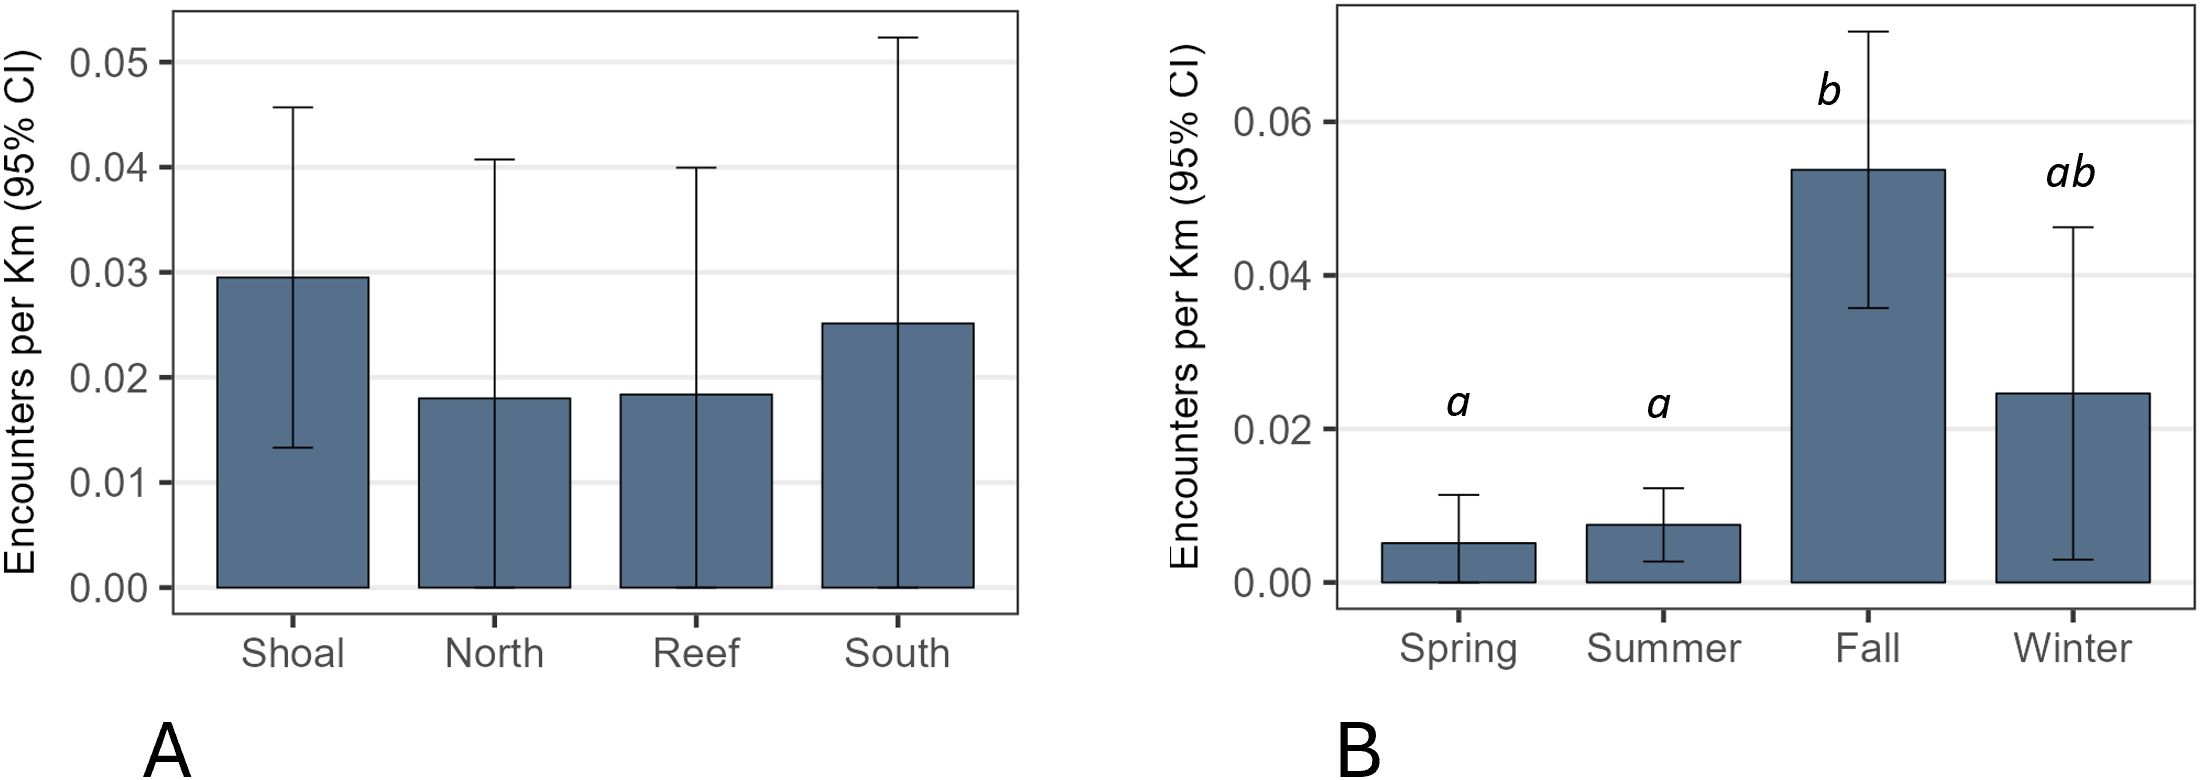
Figure 8. Animal encounter rates by the Wave Glider across (A) survey zones and (B) seasons. Bars represent means with 95% confidence intervals. Significant differences were only detected across seasons with pairwise differences denoted with lowercase letters.
During the same 190 days that the Wave Glider was deployed, the Canaveral Array recorded 11,712 valid animal encounters (226,000 detections) produced by 364 individuals in 30 species (14 sharks, 7 bony fish, 6 rays, 3 sea turtles, Supplementary Table 3). On average, the glider detected 64% of the species and 40% of the tags, but only 2% of the detections recorded by the stationary array on any single deployment. Further, all but four live animals encountered by the glider were also detected by the Canaveral Array at some point, with 55% of all animals detected by the Wave Glider also detected by the Canaveral Array within 24 hours.
On a per-receiver basis, the mobile and stationary receivers performed equally well. Specifically, when considering detections throughout the entire study area, the Wave Glider and Canaveral Array averaged similar numbers of encounters per day (1.1 vs. 1.3; Mann-Whitney U-test, W = 733832, p = 0.52), unique animals per day (1.0 vs. 0.9; W = 720459, p = 0.27), and species per day (0.7 vs. 0.6; W = 720621, p = 0.27; Figure 9). When considering just detections in the Shoal Zone where the glider and Canaveral Array most extensively overlapped, both approaches still yielded similar numbers of daily encounters (1.5 vs. 1.4; W = 96010, p = 0.07), but the glider detected modestly more animals (1.3 vs. 1.0; W = 98962, p = 0.02), and species per day (1.0 vs. 0.7; W = 98061, p = 0.03). Finally, of the 226 non-suspect encounters with tagged animals by the glider, only 9 (4%) were at locations within 500 m of a Canaveral Array receiver, highlighting the ability of this mobile platform to expand searches into otherwise unmonitored areas.
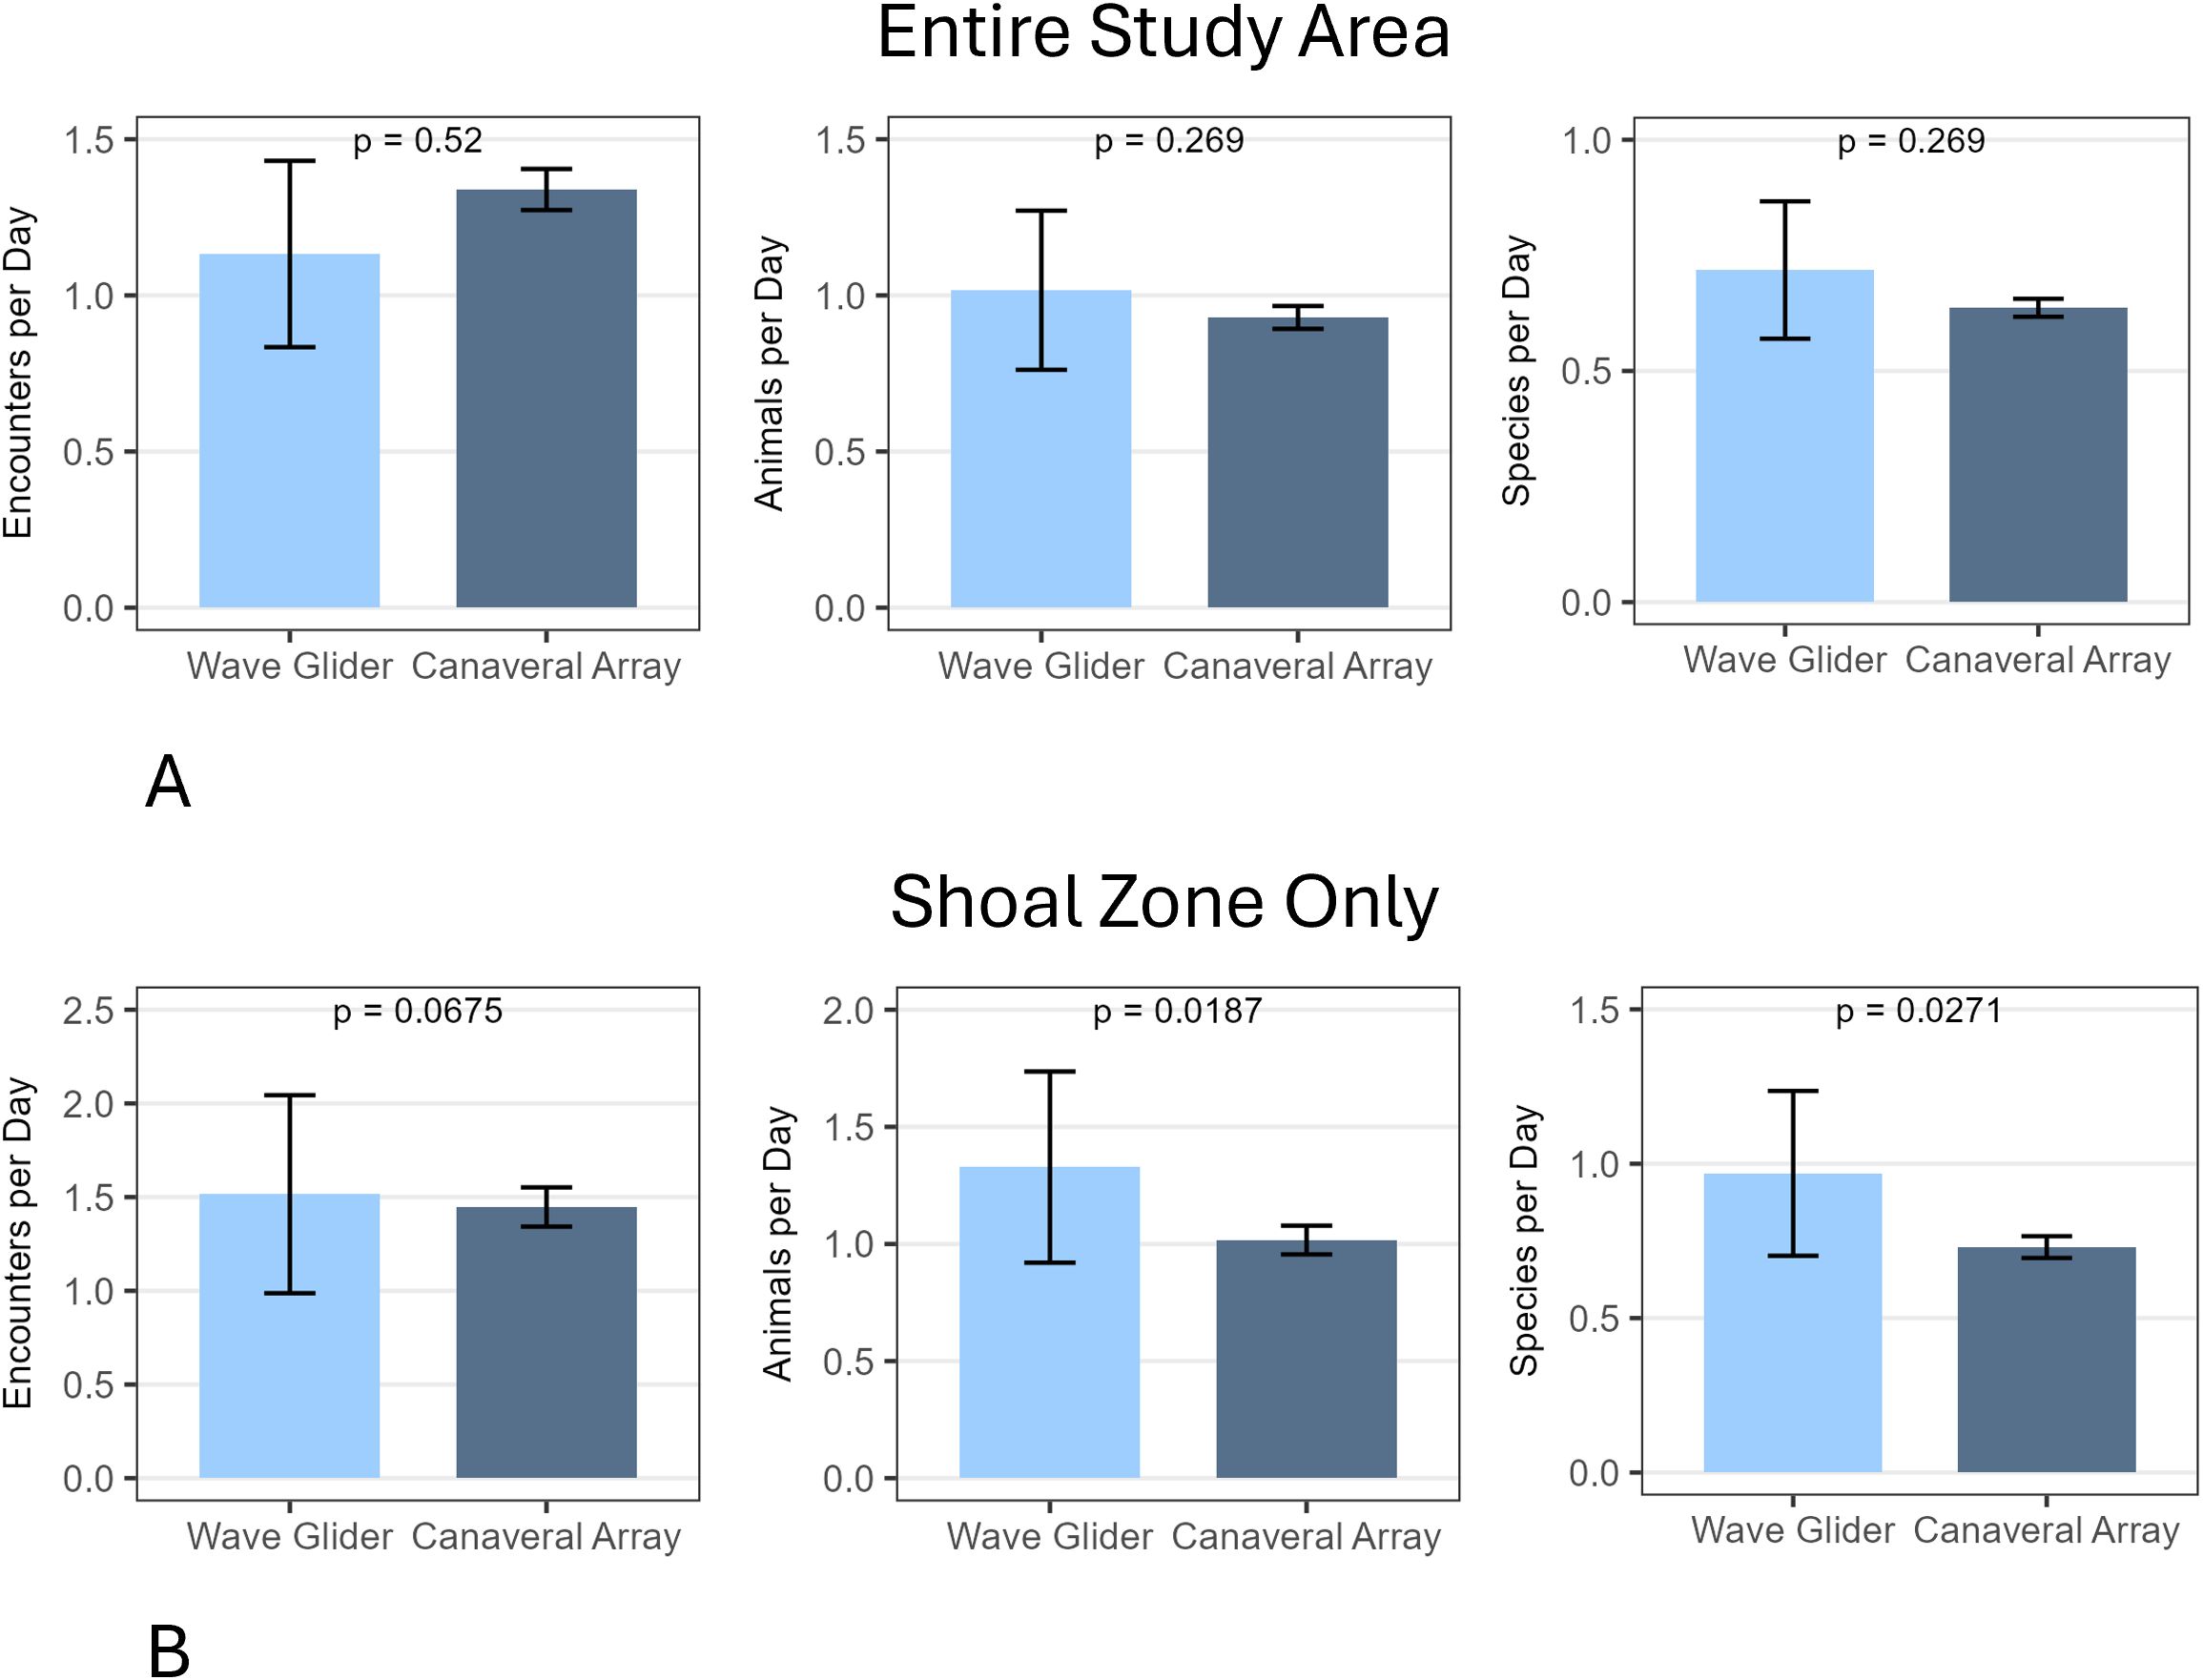
Figure 9. Wave Glider and Canaveral Array performance on a per-receiver basis. Metrics include the number of encounters per day, unique animals per day, and species per day for the (A) entire study region, and (B) Shoal Zone. Bars represent means with95% confidence intervals. Note the differing y-axis scales across plots.
Animal encounters with the Wave Glider averaged 14 ± 24 minutes (Table 3; Figure 10). The longest encounter was with a blacktip shark in March 2018 whose course of travel paralleled the Wave Glider for over 4 hours. Over 20% of glider encounters were single detections. By convention, single detections are often excluded from acoustic telemetry analyses although virtually all in this study were confirmed as valid through previous or subsequent encounters elsewhere in the study area. In contrast, encounters of animals with Canaveral Array lasted 48 ± 92 minutes. The longest encounter was a tagged red drum continuously detected for 2413 minutes (1.7 days), and numerous red drum and blacknose shark had encounters lasting >12 hours, usually at stations in the Canaveral Bight. Tiger, bull, and white sharks were the only species whose interactions with the Wave Glider lasted longer than with stationary receivers, although the glider only encountered these large sharks a combined seven times.

Figure 10. Distribution of encounter durations recorded on the (A) Wave Glider and (B) Canaveral Array, as well as the (C) effect of water depth on encounter duration for both receiver types.
GAMM modeling revealed that animal encounters at Canaveral Array receivers were significantly longer than those recorded by the Wave Glider, even after accounting for differences in water depth (estimate = 0.926, p < 0.001; Figure 10C). This corresponds to a roughly 2.5-fold shorter mean encounter duration by the glider on the original (untransformed) scale. The effect of water depth on encounter duration was significant and non-linear (edf = 10.29, F = 15.55, p < 0.001; Table 4) but the model explained only ~3% of the deviance in encounter duration, suggesting that depth had a modest influence over the relatively narrow range of depths surveyed.
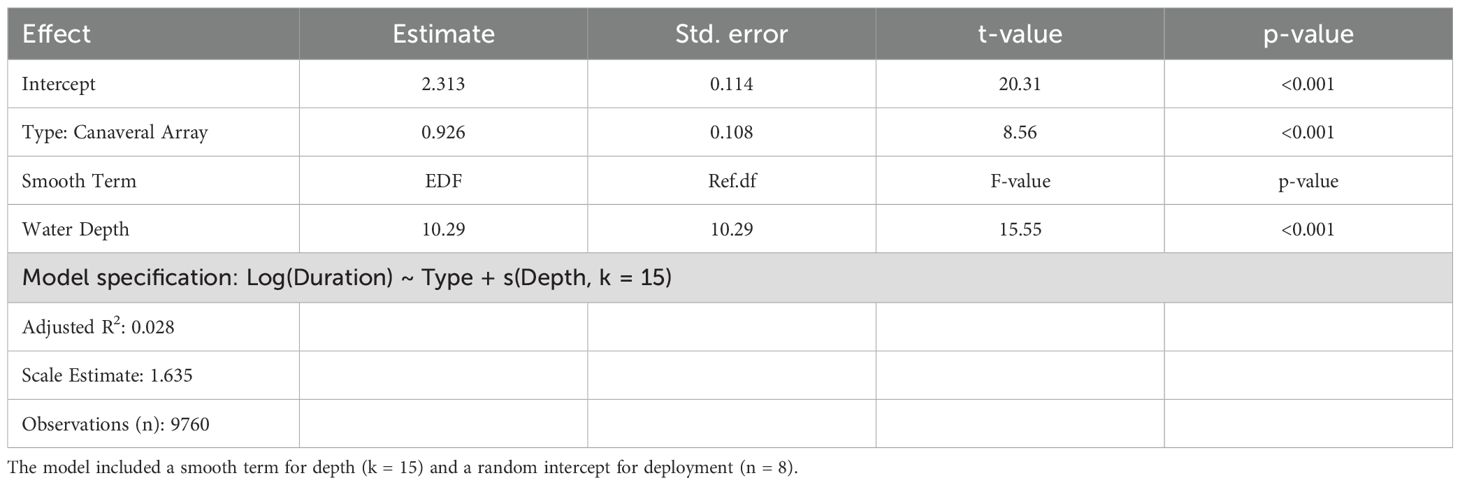
Table 4. Summary of generalized additive mixed model comparing the duration of animal encounters (in minutes) between the Wave Glider and Canaveral Array independent of water depth.
Discussion
This study demonstrated that unmanned surface vessels are a feasible option to systematically survey for acoustically tagged fish. Over this two-year evaluation, the Wave Glider USV successfully completed all eight multi-week deployments, travelled nearly 10,000 km, and repeatedly navigated complex bathymetry around offshore sand shoals. In the process, the glider relocated meaningful numbers of tagged fish and species (aided greatly by operating in a region with multiple active acoustic telemetry projects), communicated these detections in near real-time, and paired them with highly localized oceanographic and meteorological measurements. Most glider encounters with tagged animals occurred outside the detection range of stationary receivers, over half of the detected fish were originally tagged outside the Cape Canaveral region, and relocations occurred almost three years after tagging on average. Collectively, these findings highlight the capacity for ocean gliders to expand the spatial scope and operational flexibility of acoustic telemetry studies over the continental shelf.
A handful of other glider studies (e.g., Cote et al., 2019; Cypher et al., 2023; Lembke et al., 2018; Moser et al., 2023; Zemeckis et al., 2019), primarily using Slocum AUVs, have also undertaken multiple long duration coastal tracking surveys for tagged fish and invertebrates. In general, however, most glider tracking studies are single events lasting only hours to days, and—the present study included—are framed as technical demonstrations. With rare exception (e.g., Zemeckis et al., 2019), these surveys have not addressed specific fisheries management topics. Moreover, the Ocean Tracking Network’s use of glider-mounted acoustic modems to remotely download data from stationary deep-water receivers off Newfoundland is perhaps the only example of gliders being integrated into long-term acoustic tracking programs anywhere in the world (von Oppeln-Bronikowski et al., 2023; Jon Pye, OTN, pers. comm). As gliders mature into more capable and routine options for monitoring the movements of tagged fish, the relative investment into mobile versus stationary tracking infrastructure will be an important consideration for new projects. Ultimately, multiple glider evaluations across a variety of platforms, regions, habitats, and species are needed to fully characterize the strengths and limitations of each approach, optimize strategies for glider-based fish tracking, and begin supporting a broader suite of fishery management tasks.
Merits of glider vs. stationary array fish tracking
Stationary receivers are generally deployed without a detailed prior knowledge of a focal species’ distribution, and increasingly to accommodate the tracking of multiple species simultaneously (Ellis et al., 2019), as was the case with the Canaveral Array. Sub-optimal selection of fixed locations—sites that are unimportant to the target species or acoustically challenging — may occur frequently and can result in incomplete or even biased conclusions regarding animal distribution and behavior (Crossin et al., 2017; Gabriel et al., 2021). Mobile gliders are better suited for revealing the broad spatial extent of animal dispersal, especially in areas not monitored by collaborative regional-scale stationary arrays, or where animals periodically occupy deeper waters where stationary receivers are difficult to maintain (Arostegui et al., 2024). At Cape Canaveral, fish encounters with the glider occurred up to 30 km outside the fixed array. Similarly, in a study of Atlantic cod (Gadus morhua) in Massachusetts Bay, Zemeckis et al. (2019) reported that gliders relocated 25 fish never recorded by stationary receivers and identified core use areas outside of a stationary array footprint.
Gliders also expand the capacity to locate the shed transmitters that generally indicate animal mortality events. The Wave Glider detected at least six internally implanted transmitters that remained stationary across deployments, representing likely mortalities in finetooth shark, sharpnose shark, red drum, and cobia that were invisible to the Canaveral Array. Zemeckis et al. (2019) similarly detected multiple cod mortalities off Massachusetts, and Cypher et al. (2023) suggested that nearly half of the 30 relocated Pacific herring (Clupea pallasii) in Prince William Sound, Alaska, were shed tags. An enhanced capacity to detect shed transmitters may be especially important for future studies designed to estimate demographic parameters of fish populations including survivorship and recruitment.
Finally, gliders enable the simultaneous collection of multiple environmental covariates at the location of animal detections, offering more localized and accurate habitat context (Testor et al., 2019). In this study, the glider recorded sea surface temperature, dissolved oxygen, chlorophyll, and turbidity every 10 minutes. Similar oceanographic data are increasingly paired with stationary coastal arrays via satellite-based measurements, including in east Florida (e.g., Bangley et al., 2020a; Ahr et al., 2025), but parameters are averaged over large ocean areas at daily or longer intervals, and thus may not accurately reflect the conditions experienced by tagged animals, especially in highly variable coastal waters. Moreover, gliders can now characterize ocean currents, baitfish biomass, seafloor rugosity, and other habitat qualities that are not accessible through satellite-based remote sensing (Verfuss et al., 2019; Whitt et al., 2020). These fine scale measurements enhance the understanding of how habitat influences animal distribution, providing a significant advantage over stationary arrays.
The main functional limitation of glider fish tracking is that monitoring occurs around only a single location at any given time, resulting in a sparser dataset for inferring animal status and movement. While the Wave Glider performed similarly on a per-receiver basis at Cape Canaveral, it averaged only 2% of the detections compared to the stationary array on any single deployment. Such disparities will always be study-specific, dependent on the number and locations of stationary receivers, animal behavior, and local habitat conditions. Lembke et al. (2018) similarly noted fewer detections of red snapper (Lutjanus campechanus) and red grouper (Epinephelus morio) from a Slocum glider compared to fixed stations during a pipeline survey in the Gulf of Mexico, while Moser et al. (2023) observed fewer detections of green sturgeon by a Slocum glider compared to a fixed receiver gate off the Oregon coast. Conversely, Zemeckis et al. (2019), while also reporting that Slocum gliders produced only 1-2% of the Atlantic cod detections compared to a stationary array, still detected more individuals. Fewer encounters make it difficult to confirm that an animal is alive because confirmation generally requires observing movement between at least two locations. Locally, the status of many fish detected by the Wave Glider could only be confirmed with subsequent detections in the Canaveral Array, which occasionally took several months to verify. Further, because both the glider and tagged animals were generally moving, the duration of animal encounters with the Wave Glider (a rarely reported metric in previous surveys) averaged just 14 minutes in this study, only a fourth as long as those produced by nearby fixed stations. Short encounters make it virtually impossible for a single glider to estimate site fidelity of a tagged animal to a given location.
Several other operational constraints were identified in this study. For example, the tag detection range of Wave Glider receivers appeared modestly lower than that of stationary receivers at Cape Canaveral. During separate range test trials using transmitters of the same power, stationary Canaveral Array receivers produced 50% detection ranges at 400 m with a maximum range of 1700 m (Iafrate et al., 2019), although variability across locations was high. Moser et al. (2023) similarly noted decreased detection ranges from a Slocum glider compared to nearby fixed receivers off the Oregon coast. The reasons for reduced performance by the Wave Glider receivers aren’t fully understood but may be due to noise from the ocean surface (Bingham et al., 2012), continuous water flow across the hydrophone (Gaskell et al., 2023), or miniaturization of receiver components. Vehicle self-noise (e.g., use of a thruster) increases broadband noise levels, mostly at bands < 69kHz. While this effect can be controlled during range test trials, it may reduce receiver detection radius when actively searching for tagged animals (Gaskell et al., 2023).
Gliders on coastal fish tracking deployments may also face challenges with extreme shallow depths, limited power budgets, strong currents, mechanical issues, sea ice, boat traffic, vandalism, and entanglement (Merckelbach, 2013; Davis et al., 2018; Whitt et al., 2020; von Oppeln-Bronikowski et al., 2023). Solar power to operate glider sensors in the present study was generally sufficient although less critical systems were occasionally powered down at night or on cloudy days. Solar-supplemented USVs with similar sensor payloads may be highly power-constrained at higher latitudes, especially in winter, limiting deployment duration or sensor duty cycles (Drushka et al., 2024). Further, while no boat strikes occurred in the present study, the Wave Glider often made temporary automated course deviations to avoid the path of AIS-enabled vessels, and fishing line tangled the Wave Glider thruster during Deployment 3 which reduced the vehicle’s speed. Entanglement in kelp is also a concern in other regions (Rudnick, 2016; Pagniello et al., 2019). Shark bites have also prematurely ended a Wave Glider mission off Nova Scotia (Jon Pye, Ocean Tracking Network, pers. comm.), and Slocum glider missions along the Florida east coast have been aborted due to buoyancy issues caused by remoras (Chad Lembke, Univ. South Florida, pers. comm). Mechanical or communication issues will typically be more detrimental to glider missions than single fixed station malfunctions. Notably, however, in the US southeast, hurricanes have caused extensive damage to stationary arrays over the last decade while gliders can be relocated or even temporarily retrieved prior to a storm, as was the case at Cape Canaveral before Hurricane Dorian in 2019. Many gliders also now have a proven track record of operating in high sea states (Miles et al., 2021).
Merits of surface vs. subsurface gliders for fish tracking
The choice of glider platform is also an important consideration for mobile fish tracking in the coastal ocean. One of the main operational advantages of surface gliders is a robust satellite link that allows for continuous communication and precise GPS-enabled navigation (Verfuss et al., 2019). In contrast, sub-surface gliders communicate intermittently, inhibiting precise course keeping, often resulting in somewhat erratic and torturous survey tracks. In this study, the Wave Glider followed pre-planned transects with high fidelity (with a few exceptions), allowing for a complex transect design and consistent data collection across deployments. It also visited small points of interest including known reefs and shipwrecks, avoided shallow shoal ridges and navigation buoys, and approached close to shore when not constrained by depth. Additionally, pilots could remotely alter the glider’s course in response to unexpected conditions. For example, at the end of Deployment 4, the glider was commanded to enter Port Canaveral for recovery due to hazardous seas farther offshore. The Wave Glider also assisted in managing the Canaveral Array itself. During Hurricane Dorian in September 2019, four VR2-AR receivers with internal transmitters were displaced from the reef tract despite being deployed with 45-kg cement moorings in water 15–25 m deep. These transmitters were detected during the next glider deployment and systematic orbital searches were conducted. All four units were ultimately relocated and recovered after having shifted up to five kilometers from their original deployment sites.
Despite these operational advantages, the Wave Glider had drawbacks relative to other ocean glider platforms for certain applications and locations. At Cape Canaveral, although the Wave Glider effectively surveyed the active dredge site, its 5-meter draft precluded it from sampling the shallowest parts of offshore sand shoals. Buoyancy gliders are also generally constrained to operations greater than 30 m in depth (von Oppeln-Bronikowski et al., 2023). Other surface gliders (e.g., Saildrone, AutoNaut, SeaTrak) are less depth-constrained but have trade-offs in maneuverability, endurance, and payload capacity. Subsurface buoyancy-driven gliders are also a logical choice for tracking tagged animals in deep or stratified water as they can effectively characterize vertical gradients in temperature, salinity, and other properties that influence animal behavior (Eiler et al., 2013; Testor et al., 2019; Verfuss et al., 2019). Moreover, performance of their acoustic receivers are less affected by ambient noise at the ocean surface, and can operate below thermoclines which are known to decrease tag detection ranges (McQuarrie et al., 2021) Subsurface gliders are also less susceptible to interactions with human activities such as boat traffic and fishing operations. One unresolved question is the acoustic detection efficiency of surface gliders vs. subsurface gliders. Range test trials have been conducted on both Slocum and Wave Gliders (Haulsee et al., 2015; Oliver et al., 2017; Cimino et al., 2018; McQuarrie et al., 2021; Gaskell et al., 2023), and while overall performance seems comparable, the wide variety of glider platforms, receiver and transmitter styles, and habitats evaluated makes direct comparison difficult.
Ideal coastal glider tracking scenarios
Ocean gliders currently remain too expensive to serve as core elements of most routine fish tracking studies. While operating a stationary array is also costly, hardware and labor expenses can be incurred more gradually. The Canaveral Array, for example, grew from 4 to 62 stations between 2008 and 2013. In the near term, ocean gliders, when they are available, will most often be leveraged to fill complementary roles. Animal tracking objectives vary widely, however, and there are scenarios where gliders are well suited to serve as the centerpiece tracking technology.
With their more precise navigation, surface gliders are a realistic means to track fish species that preferentially distribute across discrete habitat patches such as patch reefs, offshore wind turbines and oil platforms, and fish aggregating devices (FADs), or along linear features like barrier reefs and steep rocky shorelines. In these instances, tagged fish likely concentrate in a small subset of the overall project area with minimal time spent between patches. Well-designed glider surveys can visit more locations than can be monitored with stationary receivers and help characterize space use and dispersal. Such surveys could identify previously unknown fish aggregation sites and even help refine the future placement of stationary receivers. With prior knowledge of a species’ general life history, sample size, tag specifications, and a glider’s acoustic detection range, various search strategies could even be simulated and optimized before the first glider deployment.
Gliders are also valuable when resolving a species’ habitat preferences over wide areas is a high priority. Traditional tracking studies accomplish this by examining abundance indices (e.g., raw detections, time present) only at fixed receiver locations. Glider surveys conducted between and beyond fixed stations provide an independent validation of these habitat associations. Moreover, by not being constrained to a small set of pre-defined locations, glider surveys guided by satellite imagery could track tagged animals across gradients in sea surface temperature and chlorophyll (McClatchie et al., 2012) or to move through regions experiencing ocean hypoxia.
The continuous communication link of surface gliders makes them viable options for real-time monitoring at dredge and construction sites for at-risk fish species (Verfuss et al., 2019). In the southeastern US, this could include federally protected smalltooth sawfish (Pristis pectinata), oceanic manta ray (Mobula birostris), and Atlantic sturgeon (Acipenser oxyrinchus). The real-time data stream allows operations to be modified or halted when animals are detected inside a predefined perimeter, although the value of this approach is proportional to the percentage of the population tagged, and lack of detections does not assure that a species is absent. Gliders could also carry passive acoustic recorders and turbidity sensors to simultaneously measure anthropogenic noise, sedimentation, and other disturbances that are often a high concern during these projects.
Finally, one of the most anticipated near-term innovations in coastal glider surveys is expected improvements in what has been termed reactive sampling or focal animal monitoring (Eiler et al., 2019; Verfuss et al., 2019). This approach involves gliders estimating a tag range and bearing and then maneuvering to remain in close contact with a relocated animal. Research is well underway in this area (e.g., Clark et al., 2013; Dodson et al., 2018; Eiler et al., 2019; Skomal et al., 2015; White et al., 2016) but trials have generally been limited to short deployments in small areas using highly modified AUVs, often tracking animals still recovering from tagging. The ability to track “fish of opportunity” during long duration glider deployments over the open shelf will help confirm if a detected animal is alive, document habitat associations in greater detail, and even allow home range estimates in some instances. This capability would be particularly beneficial in regions like the US southeast coast where encounter rates with tagged fish are high and relocations occur months or years after tagging. Modest glider speeds (mean 2 km/hr in this study) may limit the duration of tracks for many fast-moving species. At Cape Canaveral, however, even large and mobile red drum, cobia, and blacknose shark traveled at less than 1 km/hr on average when moving through the Canaveral Array (Iafrate et al., 2019).
Lessons learned and best practices
Range testing is an essential quality control aspect for all acoustic telemetry studies (Kessel et al., 2014), perhaps even more so for glider-based tracking where the factors affecting receiver performance are not well understood. Range testing will help set realistic expectations regarding study area size, transect spacing, and overall mission duration. At Cape Canaveral, Wave Glider range testing was simplified by deploying range test tags with a 1-yr battery life along the survey transect and allocating time for dedicated range trials during each of the first four missions. This approach can be replicated in other studies with pre-defined survey areas to measure receiver performance under differing ocean conditions and to identify any glider hardware issues early in each deployment. Many newer acoustic receivers now contain embedded tags used (in part) to facilitate range testing. In areas where mobile and fixed tracking will be used in concert, range testing the glider receiver(s) against these fixed station beacons will be even easier. Conversely, a glider carrying a tag could be an ideal means for range test multiple fixed stations in a variety of conditions, information which might be valuable in habitats that are acoustically complex.
Range testing at Cape Canaveral used a single style of high-power range tag to mimic those implanted locally in sharks and sportfish. Species requiring lower power (and generally smaller) tags will have much reduced detection ranges, and these tag styles should be directly evaluated. Additionally, glider orbits around range test tags were conducted at 250 m increments, which in hindsight was an overly large interval given the maximum detection range of 900 m. Finer resolution (perhaps 100 m increments) would be ideal, especially when testing lower power tags. The use of test tags with uniform transmission intervals, as opposed to the random intervals typically used in animal tags, was helpful for determining the exact timing of transmissions and simplifying the calculation of detection rates. Finally, previous studies have reported a variety of detection efficiency metrics. A 20% detection efficiency (i.e., the distance at which the receiver detected 20% of transmissions) was reported by both Oliver et al. (2017) and Cimino et al. (2018). Given that many glider encounters with tagged animals consist of just a few detections, reporting at a second higher rate, perhaps 50% detection efficiency, would also be informative.
The higher number and density of animal encounters at Cape Canaveral compared to most previous glider tracking surveys was largely due to operating in a region with multiple species under active study. This will not be the case for many regions and several steps can be taken to increase the number and quality of animal relocations. First, given the brief encounter times, tags with shorter transmission intervals are more likely to be detected. Second, low power tags at Cape Canaveral have resulted in relatively sparse datasets (Iafrate et al., 2019) and should be used only when absolutely required in open coastal settings. Finally, confirming the status of animals (alive vs. dead) is challenging in glider tracking studies because movement can generally not be confirmed in a single encounter. Although protocols can be adopted where gliders immediately loiter or make multiple passes at a detection site, this typically requires pilot intervention and an environment that allows for high maneuverability. As an alternative, depth or swim speed sensors can now be incorporated into acoustic transmitters which could often confirm animal movement during brief encounters at a single location.
Conclusions
This study demonstrates that gliders have a valuable role in coastal animal tracking, providing complementary data to stationary arrays and offering unique advantages in certain scenarios. The effectiveness of gliders varies based on the locations and species under study, necessitating careful consideration of study goals and conditions. To optimize the advantages of glider-based studies, careful planning and consideration of both technological capabilities and environmental conditions are essential. Collaborative efforts and advancements in technology will further enhance the utility and effectiveness of gliders in acoustic telemetry studies.
Data availability statement
The raw data supporting the conclusions of this article will be made available by the authors, without undue reservation.
Ethics statement
All animal capture, handling, and tagging was conducted in accordance with a State of Florida Special Activity License SAL-12-512-SR and renewals, National Marine Fisheries Service Biological Opinion F/SER/2011/05647, and under the auspices of Kennedy Space Center Institutional Animal Care & Use Committee protocol GRD-06-049.
Author contributions
ER: Conceptualization, Data curation, Formal analysis, Funding acquisition, Investigation, Methodology, Project administration, Resources, Supervision, Visualization, Writing – original draft, Writing – review & editing. JI: Conceptualization, Funding acquisition, Investigation, Methodology, Project administration, Resources, Supervision, Visualization, Writing – review & editing. BA: Conceptualization, Data curation, Formal analysis, Investigation, Methodology, Project administration, Supervision, Visualization, Writing – review & editing. SW: Conceptualization, Funding acquisition, Investigation, Methodology, Project administration, Supervision, Writing – review & editing. DS: Conceptualization, Investigation, Methodology, Supervision, Writing – review & editing. JL: Conceptualization, Funding acquisition, Methodology, Project administration, Resources, Writing – review & editing. CS: Investigation, Visualization, Writing – review & editing.
Funding
The author(s) declare that financial support was received for the research and/or publication of this article. This work was funded by the US Bureau of Ocean Energy Management (BOEM) via Interagency Agreement M13PG00031 with the US Naval Undersea Warfare Center. BOEM provided general guidance as to information needs, approved the general study design, and reviewed the manuscript prior to submission. Data collection and analyses, interpretation of results, and decision to submit for publication was made solely by study authors. In addition, species-level information presented in acoustic telemetry analyses was made possible by direct funding to tagging agencies that contributed these data (see acknowledgements).
Acknowledgments
We thank Jen Bucatari and Deena Hansen (BOEM), Jeff Collins and Lynne Phillips (NASA), and Jane Provancha (Herndon Solutions Group) for support with project management. Russ Lowers and Brenton Back (Herndon Solutions Group) assisted with glider deployments, Ben Harmon and Eric Niven (Liquid Robotics, Inc.) and Dave Strum (Air Force Technical Applications Center) provided excellent support with the Wave Glider systems and software, and Jessica Greene (Naval Undersea Warfare Center) and Dave Foster (Axiom Data Sciences) provided data animation assistance. Special thanks goes to the Ocean Tracking Network for loan of a VMT receiver, and to all FACT and ACT Network members who allowed presentation of their animal detections.
Conflict of interest
Authors ER, BA, DS, and CS were employed by Herndon Solutions Group, LLC.
The authors declare that the research was conducted in the absence of any commercial or financial relationships that could be construed as a potential conflict of interest.
Generative AI statement
The author(s) declare that no Generative AI was used in the creation of this manuscript.
Publisher’s note
All claims expressed in this article are solely those of the authors and do not necessarily represent those of their affiliated organizations, or those of the publisher, the editors and the reviewers. Any product that may be evaluated in this article, or claim that may be made by its manufacturer, is not guaranteed or endorsed by the publisher.
Supplementary material
The Supplementary Material for this article can be found online at: https://www.frontiersin.org/articles/10.3389/fmars.2025.1505425/full#supplementary-material
Footnotes
References
Ahr B. J., Reyier E. A., Iafrate J. D., Kalinowsky C., Arendt M., Frazier B. S., et al. (2025). Multi-year migrations of four coastal shark species in the southeastern USA: trends in timing and temperature. Mar. Ecol. Prog. Ser. 758, 103–123. Available at: https://www.int-res.com/abstracts/meps/v758/p103-123/.
Aniceto A. S., Pedersen G., Primicerio R., Biuw M., Lindstrøm U., and Camus L. (2020). Arctic marine data collection using oceanic gliders: providing ecological context to cetacean vocalizations. Front. Mar. Sci. 7. doi: 10.3389/fmars.2020.585754
Arostegui M. C., Afonso P., Fauconnet L., Fontes J., Macena B. C. L., Meyer C., et al. (2024). Advancing the frontier of fish geolocation into the ocean’s midwaters. Deep Sea Res. Part I: Oceanographic Res. Papers 212, 104386. doi: 10.1016/J.DSR.2024.104386
Bangley C. W., Curtis T. H., Secor D. H., Latour R. J., and Ogburn M. B. (2020a). Identifying important juvenile dusky shark habitat in the northwest Atlantic Ocean using acoustic telemetry and spatial modeling. Mar. Coast. Fisheries 12, 348–363. doi: 10.1002/mcf2.10120
Bangley C. W., Whoriskey F. G., Young J. M., and Ogburn M. B. (2020b). Networked animal telemetry in the northwest Atlantic and caribbean waters. Mar. Coast. Fisheries 12, 339–347. doi: 10.1002/mcf2.10128
Benoist N. M. A., Morris K. J., Bett B. J., Durden J. M., Huvenne V. A. I., Le Bas T. P., et al. (2019). Monitoring mosaic biotopes in a marine conservation zone by autonomous underwater vehicle. Conserv. Biol. 33, 1174–1186. doi: 10.1111/cobi.13312
Benoit-Bird K. J., Patrick Welch T., Waluk C. M., Barth J. A., Wangen I., McGill P., et al. (2018). Equipping an underwater glider with a new echosounder to explore ocean ecosystems. Limnol Oceanogr Methods 16, 734–749. doi: 10.1002/lom3.10278
Breece M. W., Fox D. A., Dunton K. J., Frisk M. G., Jordaan A., and Oliver M. J. (2016). Dynamic seascapes predict the marine occurrence of an endangered species: Atlantic Sturgeon Acipenser oxyrinchus oxyrinchus. Methods Ecol. Evol. 31. doi: 10.1111/2041-210X.12532
Bingham B., Kraus N., Howe B., Freitag L., Ball K., Koski P., et al. (2012). Passive and active acoustics using an autonomous wave glider. J. Field Robot 29, 911–923. doi: 10.1002/rob.21424
Cauchy P., Heywood K. J., Merchant N. D., Risch D., Queste B. Y., and Testor P. (2023). Gliders for passive acoustic monitoring of the oceanic environment. Front. Remote Sens. 4. doi: 10.3389/frsen.2023.1106533
Cimino M., Cassen M., Merrifield S., and Terrill E. (2018). Detection efficiency of acoustic biotelemetry sensors on Wave Gliders. Anim. Biotelemetry 6, 1–14. doi: 10.1186/s40317-018-0160-4
Clark C. M., Forney C., Manii E., Shinzaki D., Gage C., Farris M., et al. (2013). Tracking and following a tagged leopard shark with an autonomous underwater vehicle. J. Field Robot 30, 309–322. doi: 10.1002/rob.21450
Cote D., Nicolas J.-M., Whoriskey F., Cook A. M., Broome J., Regular P. M., et al. (2019). Characterizing snow crab (Chionoecetes opilio) movements in the Sydney Bight (Nova Scotia, Canada): a collaborative approach using multiscale acoustic telemetry. Can J Fish Aquat Sci. 76. doi: 10.1139/cjfas-2017-0472
Crossin G. T., Heupel M. R., Holbrook C. M., Hussey N. E., Lowerre-Barbieri S. K., Nguyen V. M., et al. (2017). Acoustic telemetry and fisheries management. Ecol. Appl. 27, 1031–1049. doi: 10.1002/eap.1533
Cypher A. D., Statscewich H., Campbell R., Danielson S. L., Eiler J., and Bishop M. A. (2023). Detection efficiency of an autonomous underwater glider carrying an integrated acoustic receiver for acoustically tagged Pacific herring. ICES J. Mar. Sci. 80, 329–341. doi: 10.1093/icesjms/fsac241
Davis R., Comeau A., L’Orsa S., van der Meer J., Covey B., Pye J., et al. (2018). Lessons learned in developing a canadian operational glider fleet. Mar. Technol. Soc. J. 52, 13–18. doi: 10.4031/MTSJ.52.3.20
Dedman S., Officer R., Clarke M., Reid D. G., and Brophy D. (2017). Gbm.auto: A software tool to simplify spatial modelling and Marine Protected Area planning. PloS One 12, 1–16. doi: 10.1371/journal.pone.0188955
Dodson T., Grothues T. M., Eiler J. H., Dobarro J. A., and Shome R. (2018). Acoustic-telemetry payload control of an autonomous underwater vehicle for mapping tagged fish. Limnol Oceanogr Methods 16, 760–772. doi: 10.1002/lom3.10280
Drushka K., Westbrook E., Bingham F. M., Gaube P., Dickinson S., Fournier S., et al. (2024). Salinity and Stratification at the Sea Ice Edge (SASSIE): an oceanographic field campaign in the Beaufort Sea. Earth Syst. Sci. Data 16, 4209–4242. doi: 10.5194/essd-16-4209-2024
Eiler J. H., Grothues T. M., Dobarro J. A., and Masuda M. M. (2013). Comparing Autonomous Underwater Vehicle (AUV) and vessel-based tracking performance for locating acoustically tagged fish. Mar. Fisheries Rev. 75, 27–42. doi: 10.7755/MFR.75.4.2
Eiler J. H., Grothues T. M., Dobarro J. A., and Shome R. (2019). Tracking the movements of juvenile Chinook salmon using an autonomous underwater vehicle under payload control. Appl. Sci. (Switzerland) 9, 1–20. doi: 10.3390/app9122516
Elith J., Leathwick J. R., and Hastie T. (2008). A working guide to boosted regression trees. J. Anim. Ecol. 77, 802–813. doi: 10.1111/j.1365-2656.2008.01390.x
Ellis R. D., Flaherty-Walia K. E., Collins A. B., Bickford J. W., Boucek R., Walters Burnsed S. L., et al. (2019). Acoustic telemetry array evolution: From species- and project-specific designs to large-scale, multispecies, cooperative networks. Fish Res. 209, 186–195. doi: 10.1016/j.fishres.2018.09.015
Everett A. G., Szedlmayer S. T., and Gallaway B. J. (2020). Movement patterns of red snapper Lutjanus campechanus based on acoustic telemetry around oil and gas platforms in the northern Gulf of Mexico. Mar. Ecol. Prog. Ser. 649, 155–173. doi: 10.3354/meps13448
Ferrari R., Marzinelli E. M., Ayroza C. R., Jordan A., Figueira W. F., Byrne M., et al. (2018). Large-scale assessment of benthic communities across multiple marine protected areas using an autonomous underwater vehicle. PloS One 13, 1–20. doi: 10.1371/journal.pone.0193711
Fox J. and Weisberg S. (2019). An R Companion to Applied Regression. 3rd ed. (Thousand Oaks CA: Sage).
Gabriel S. M., Patterson T. A., Eveson J. P., Semmens J. M., Harasti D., Butcher P. A., et al. (2021). Determining effective acoustic array design for monitoring presence of white sharks Carcharodon carcharias in nearshore habitats. Mar. Biol. 168, 1–14. doi: 10.1007/s00227-021-03850-x
Gaskell E. M., Funnell T. R., Holbrook C. M., Hondorp D. W., and Tan X. (2023). Characterization of acoustic detection efficiency using an unmanned surface vessel as a mobile receiver platform. Anim. Biotelemetry 11, 1–13. doi: 10.1186/s40317-023-00350-1
Guihen D., Fielding S., Murphy E. J., Heywood K. J., and Griffiths G. (2014). An assessment of the use of ocean gliders to undertake acoustic measurements of zooplankton: The distribution and density of Antarctic krill (Euphausia superba) in the Weddell Sea. Limnol Oceanogr Methods 12, 373–389. doi: 10.4319/lom.2014.12.373
Harris J. L. and Stevens G. M. W. (2021). Environmental drivers of reef manta ray (Mobula alfredi) visitation patterns to key aggregation habitats in the Maldives. PloS One 16, 1–25. doi: 10.1371/journal.pone.0252470
Haulsee D. E., Breece M. W., Miller D. C., Wetherbee B. M., Fox D. A., and Oliver M. J. (2015). Habitat selection of a coastal shark species estimated from an autonomous underwater vehicle. Mar. Ecol. Prog. Ser. 528, 277–288. doi: 10.3354/meps11259
Hijmans R. J., Williams E., and Vennes C. (2019). geosphere: Spherical Trigonometry. R package version 1.5-10. Package Geosphere. Available at: https://CRAN.R-project.org/package=geosphere (Accessed February 1, 2024).
Hussey N. E., Kessel S. T., Aarestrup K., Cooke S. J., Cowley P. D., Fisk A. T., et al. (2015). Aquatic animal telemetry: A panoramic window into the underwater world. Sci. (1979) 348, 1255642. doi: 10.1126/science.1255642
Iafrate J., Reyier E., Ahr B., Carroll A., Rice A. N., Dossot G., et al. (2023). Evidence of Atlantic midshipman (Porichthys plectrodon) vocalizations from an unmanned surface vehicle in the U.S. South Atlantic. J. Acoust Soc. Am. 154, 2928–2936. doi: 10.1121/10.0022328
Iafrate J., Watwood S., Reyier E., Ahr B., Scheidt D., Holloway-Adkins K., et al. (2019). Behavior, seasonality, and habitat preferences of mobile fishes and sea turtles within a large sand shoal complex: Insights from traditional sampling and emerging technologies OCS Study BOEM 2019-043 (Sterling (VA: US Department of the Interior, Bureau of Ocean Energy Management), 183.
Kessel S. T., Cooke S. J., Heupel M. R., Hussey N. E., Simpfendorfer C. A., Vagle S., et al. (2014). A review of detection range testing in aquatic passive acoustic telemetry studies. Rev. Fish Biol. Fish 24, 199–218. doi: 10.1007/s11160-013-9328-4
Lembke C., Lowerre-Barbieri S., Mann D., and Taylor J. C. (2018). Using three acoustic technologies on underwater gliders to survey fish. Mar. Technol. Soc. J. 52, 39–52. doi: 10.4031/MTSJ.52.6.1
Leathwick J. R., Elith J., Francis M. P., Hastie T., and Taylor P. (2006). Variation in demersal fish species richness in the oceans surrounding New Zealand: an analysis using boosted regression trees. Mar Ecol Prog Ser. 321, 267–281. doi: 10.3354/meps321267
Luczkovich J. J. and Sprague M. W. (2022). Soundscape maps of soniferous fishes observed from a mobile glider. Front. Mar. Sci. 9. doi: 10.3389/fmars.2022.779540
McClatchie S., Cowen R., Nieto K., Greer A., Luo J. Y., Guigand C., et al. (2012). Resolution of fine biological structure including small narcomedusae across a front in the Southern California Bight. J. Geophys Res. Oceans 117, 1–18. doi: 10.1029/2011JC007565
McQuarrie F., Woodson C. B., and Edwards C. R. (2021). Modeling acoustic telemetry detection ranges in a shallow coastal environment. 1–5. doi: 10.1145/3491315.3491331
Mendelssohn R. (2020). rerddapXtracto: Extracts Environmental Data from “ERDDAP” Web Services. Available online at: https://github.com/rmendels/rerddapXtracto (Accessed January 10, 2024).
Merckelbach L. (2013). On the probability of underwater glider loss due to collision with a ship. J. Mar. Sci. Technol. (Japan) 18, 75–86. doi: 10.1007/s00773-012-0189-7
Miles T. N., Zhang D., Foltz G. R., Zhang J. A., Meinig C., Bringas F., et al. (2021). Uncrewed ocean gliders and saildrones support hurricane forecasting and research. Oceanography 34, 78–82. doi: 10.5670/oceanog.2021.supplement.02-28
Moser M. L., Erickson D. L., Corbett S., Barth J. A., Erofeev A., and Pierce S. D. (2023). Detecting acoustically tagged green sturgeon in the Northeast Pacific Ocean. Environ. Biol. Fishes 106, 883–893. doi: 10.1007/s10641-022-01353-2
Nicholson J. W. and Healey A. J. (2008). The present state of Autonomous Underwater Vehicle (AUV) applications and technologies. Mar. Technol. Soc. J. 42, 44–51. doi: 10.4031/002533208786861272
Oliver M. J., Breece M. W., Haulsee D. E., Cimino M. A., Kohut J., Aragon D., et al. (2017). Factors affecting detection efficiency of mobile telemetry Slocum gliders. Anim. Biotelemetry 2017 5:1 5, 1–9. doi: 10.1186/S40317-017-0129-8
Pagniello C. M. L. S., Cimino M. A., and Terrill E. (2019). Mapping fish chorus distributions in Southern California using an autonomous wave glider. Front. Mar. Sci. 6. doi: 10.3389/fmars.2019.00526
Reyier E., Ahr B., Iafrate J., Scheidt D., Lowers R., Watwood S., et al. (2023). Sharks associated with a large sand shoal complex: Community insights from longline and acoustic telemetry surveys. PloS One 18, 1–25. doi: 10.1371/journal.pone.0286664
Rudnick D. L. (2016). Ocean research enabled by underwater gliders. Ann. Rev. Mar. Sci. 8, 519–541. doi: 10.1146/annurev-marine-122414-033913
Skomal G. B., Hoyos-Padilla E. M., Kukulya A., and Stokey R. (2015). Subsurface observations of white shark Carcharodon carcharias predatory behaviour using an autonomous underwater vehicle. J. Fish Biol. 87, 1293–1312. doi: 10.1111/JFB.12828
Testor P., DeYoung B., Rudnick D. L., Glenn S., Hayes D., Lee C., et al. (2019). OceanGliders: A component of the integrated GOOS. Front. Mar. Sci. 6. doi: 10.3389/fmars.2019.00422
Topping D. T. and Szedlmayer S. T. (2011). Site fidelity, residence time and movements of red snapper Lutjanus campechanus estimated with long-term acoustic monitoring. Mar. Ecol. Prog. Ser. 437, 183–200. doi: 10.3354/meps09293
Verfuss U. K., Aniceto A. S., Harris D. V., Gillespie D., Fielding S., Jimnez G., et al. (2019). A review of unmanned vehicles for the detection and monitoring of marine fauna. Mar. Pollut. Bull. 140, 17–29. doi: 10.1016/j.marpolbul.2019.01.009
von Oppeln-Bronikowski N., de Young B., Belzile M., Comeau A., Cyr F., Davis R., et al. (2023). Best practices for operating underwater gliders in Atlantic Canada. Front. Mar. Sci. 10. doi: 10.3389/fmars.2023.1108326
Wall C. C., Mann D. A., Lembke C., Taylor C., He R., and Kellison T. (2017). Mapping the soundscape off the southeastern USA by using passive acoustic glider technology. Mar. Coast. Fisheries 9, 23–37. doi: 10.1080/19425120.2016.1255685
White C. F., Lin Y., Clark C. M., and Lowe C. G. (2016). Human vs robot: Comparing the viability and utility of autonomous underwater vehicles for the acoustic telemetry tracking of marine organisms. J. Exp. Mar. Biol. Ecol. 485, 112–118. doi: 10.1016/j.jembe.2016.08.010
Whitt C., Pearlman J., Polagye B., Caimi F., Muller-Karger F., Copping A., et al. (2020). Future vision for autonomous ocean observations. Front. Mar. Sci. 7. doi: 10.3389/fmars.2020.00697
Wood S. N. (2017). Generalized Additive Models: An Introduction with R, 2nd ed. (New York: Chapman and Hall/CRC). doi: 10.1201/9781315370279
Young J. M., Bowers M. E., Reyier E. A., Morley D., Ault E. R., Pye J. D., et al. (2020). The FACT network: philosophy, evolution, and management of a collaborative coastal tracking network. Mar. Coast. Fisheries 12, 258–271. doi: 10.1002/mcf2.10100
Zemeckis D. R., Dean M. J., Deangelis A. I., Van Parijs S. M., Hoffman W. S., Baumgartner M. F., et al. (2019). Identifying the distribution of Atlantic cod spawning using multiple fixed and glider-mounted acoustic technologies. ICES J. Mar. Sci. 76, 1610–1625. doi: 10.1093/icesjms/fsz064
Keywords: acoustic telemetry, ocean glider, wave glider, range testing, FACT network, autonomous animal tracking, unmanned surface vehicle
Citation: Reyier E, Iafrate J, Ahr B, Watwood S, Scheidt D, Levenson J and Schumann C (2025) An unmanned surface vehicle for acoustic telemetry surveys of coastal fishes: range testing, real world performance, and comparison with a stationary tracking array. Front. Mar. Sci. 12:1505425. doi: 10.3389/fmars.2025.1505425
Received: 02 October 2024; Accepted: 16 June 2025;
Published: 15 July 2025.
Edited by:
Ibon Galparsoro, Technological Center Expert in Marine and Food Innovation (AZTI), SpainReviewed by:
Martin C. Arostegui, Woods Hole Oceanographic Institution, United StatesCatherine Edwards, University of Georgia, United States
Frank McQuarrie Jr, University of Georgia, United States, in collaboration with reviewer CE
Copyright © 2025 Reyier, Iafrate, Ahr, Watwood, Scheidt, Levenson and Schumann. This is an open-access article distributed under the terms of the Creative Commons Attribution License (CC BY). The use, distribution or reproduction in other forums is permitted, provided the original author(s) and the copyright owner(s) are credited and that the original publication in this journal is cited, in accordance with accepted academic practice. No use, distribution or reproduction is permitted which does not comply with these terms.
*Correspondence: Eric Reyier, ZXJpYy5hLnJleWllckBuYXNhLmdvdg==