 Chenchen Zha
 Sen Wang
 Shiyao Ying3
 Hui Chen
 Guoqing Han
- 1Marine Science and Technology College, Zhejiang Ocean University, Zhoushan, China
- 2Institute of Marine Resources Development, Jiangsu Ocean University, Lianyungang, China
- 3Zhoushan Natural Resources Surveying and Mapping Design Center, Zhoushan Natural Resources and Planning Bureau, Zhoushan, China
Mesoscale eddies can affect the distribution of matter in the ocean due to their inherent characteristics, thereby affecting local ecosystems. However, there are few previous studies on the influence of Great Whirl (GW) on the distribution of particulate organic carbon (POC). This study analyzes the influence of the GW on the three-dimensional distribution of marine POC concentration in the northwestern Indian Ocean, off the coast of Somalia. It is shown that there are significant differences in the spatial distribution modes of POC in the surface and subsurface ocean of GW. In the sea surface, the POC concentration at the edge of GW is higher than the eddy center resulting from the capturing and transporting effect of GW. The difference is about 20 mg·m−3 between the center and the edge. At the subsurface layer (approximately between 50 and 175 m), the concentration of POC in the eddy center is high, while that in the surrounding water is low. The maximum difference between the center and the edge can reach about 10 mg·m−3. These phenomena show that GW will have an impact on the distribution of POC in the ocean, which in turn may affect the carbon cycle progress in the local ocean.
1 Introduction
Mesoscale eddies are widely present in various oceans around the world, accounting for 80% of the total kinetic energy in the ocean (Klein et al., 2019). Typical mesoscale eddies have spatial scales ranging from tens to hundreds of kilometers and temporal scales ranging from weeks to months (Chaigneau et al., 2009; Chelton et al., 2011b). Mesoscale eddies are the primary carriers of material transport in the ocean (Zhang et al., 2016, 2014a; Dong et al., 2014) and can affect the distribution of substances. For example, mesoscale eddies can influence the distribution of chlorophyll and other substances in the ocean and affect primary productivity and biological pump efficiency (Benitez-Nelson et al., 2007; Correa-Ramirez et al., 2007). The assessment of fixed Nitrogen loss in the oxygen minimum zones can be affected by mesoscale eddies (Bourbonnais et al., 2015). In the Southern Ocean, mesoscale eddies can transport seawater tracers southward through polar front (PF) (Dufour et al., 2015). Mesoscale eddies can also affect the distribution of substances in seawater in the vertical direction. For example, in the South China Sea, the maximum depth affected by mesoscale eddies can exceed 2000 m (Zhang et al., 2016). Mesoscale eddies can provide channels for the transportation of deep-sea sediments (Zhang et al., 2014b). Furthermore, mesoscale eddies can participate in transporting chemical substances generated by seafloor hydrothermal vents (Adams et al., 2011). The changes in vertical nutrient flux caused by eddies can extend to shallower depths (Castelao, 2014).
Particulate organic carbon (POC) is defined as particulate organic matter that is insoluble in water. The chemical composition of POC is extremely complex, mainly including lipids, hydrolyzable amino acids and proteins, carbohydrates, nucleic acids, lignin, black carbon, microplastics, and uncharacterized components (Kharbush et al., 2020). The distribution of POC in the ocean is not uniform. The POC concentration is highest in the horizontal direction at the continental margin, where approximately half of the carbon in the ocean is sequestered (Muller-Karger et al., 2005). In the vertical direction, the concentration of POC in the ocean exhibits a logarithmic decline with increasing depth, sometimes exhibiting abnormally high values (Wangersky, 1976). POC plays a crucial role in the global carbon cycle and is the major pathway by which organic carbon (OC) produced by phytoplankton is exported mainly by gravitational settling – from the surface to the deep ocean (Le Moigne, 2019; Siegel et al., 2016). Meanwhile, the ocean is the world’s largest carbon sink, and POC is the primary vector sequestering carbon in the abyssal ocean (Pavia et al., 2019). Accordingly, fluctuations in POC concentration in the ocean may have a significant influence on global climate. Previous studies have shown that POC, as a seawater tracer in the ocean, is also influenced by the widely distributed mesoscale eddies in the ocean. For example, the mesoscale eddies in the waters of California can transport high concentration POC water from nearshore areas to the west, increasing the concentration of POC at sea and facilitating nutrient redistribution (Amos et al., 2019). Mesoscale eddies can increase POC flux and are a key channel for deep-sea carbon sequestration (Shih et al., 2015; Omand et al., 2015; Dobashi et al., 2022; Li et al., 2017).
Great Whirl (GW) is a large quasi-stationary anticyclone that annually generates near the coast of Somalia during the southwest monsoon season (Figures 1A, B) (Beal and Donohue, 2013; Wang et al., 2019; Vic et al., 2014), with an average center position of approximately 8°N and 53°E (Figure 1C) and an average lifespan of approximately 166 days (Cao and Hu, 2015). Previous studies have explored several theories regarding the mechanism of GW generation, such as: Rossby waves may be responsible for GW generation (Beal and Donohue, 2013; Beal et al., 2013); The sloping coastline of the Somalia may be responsible for GW generation (McCreary and Kundu, 1988); Barotropic instability may be the cause of GW generation (Jensen, 1991). It also has been confirmed that GW, as a large mesoscale eddy, has a significant influence on the transport and distribution of substances in the ocean near the Somali, thereby affecting the distribution of nutrients and marine ecosystems in the entire sea area. For example, GW can affect the distribution of its internal chlorophyll (Dai et al., 2021). However, limited research has been conducted on the influence of GW on the 3D distribution of POC concentration. This study analyzed the flow field and POC data for 24 consecutive years from 1998 to 2021. The distribution characteristics of POC and the influence area of GW indicate that GW had a significant influence on the distribution of POC concentration (Figures 1C, D).
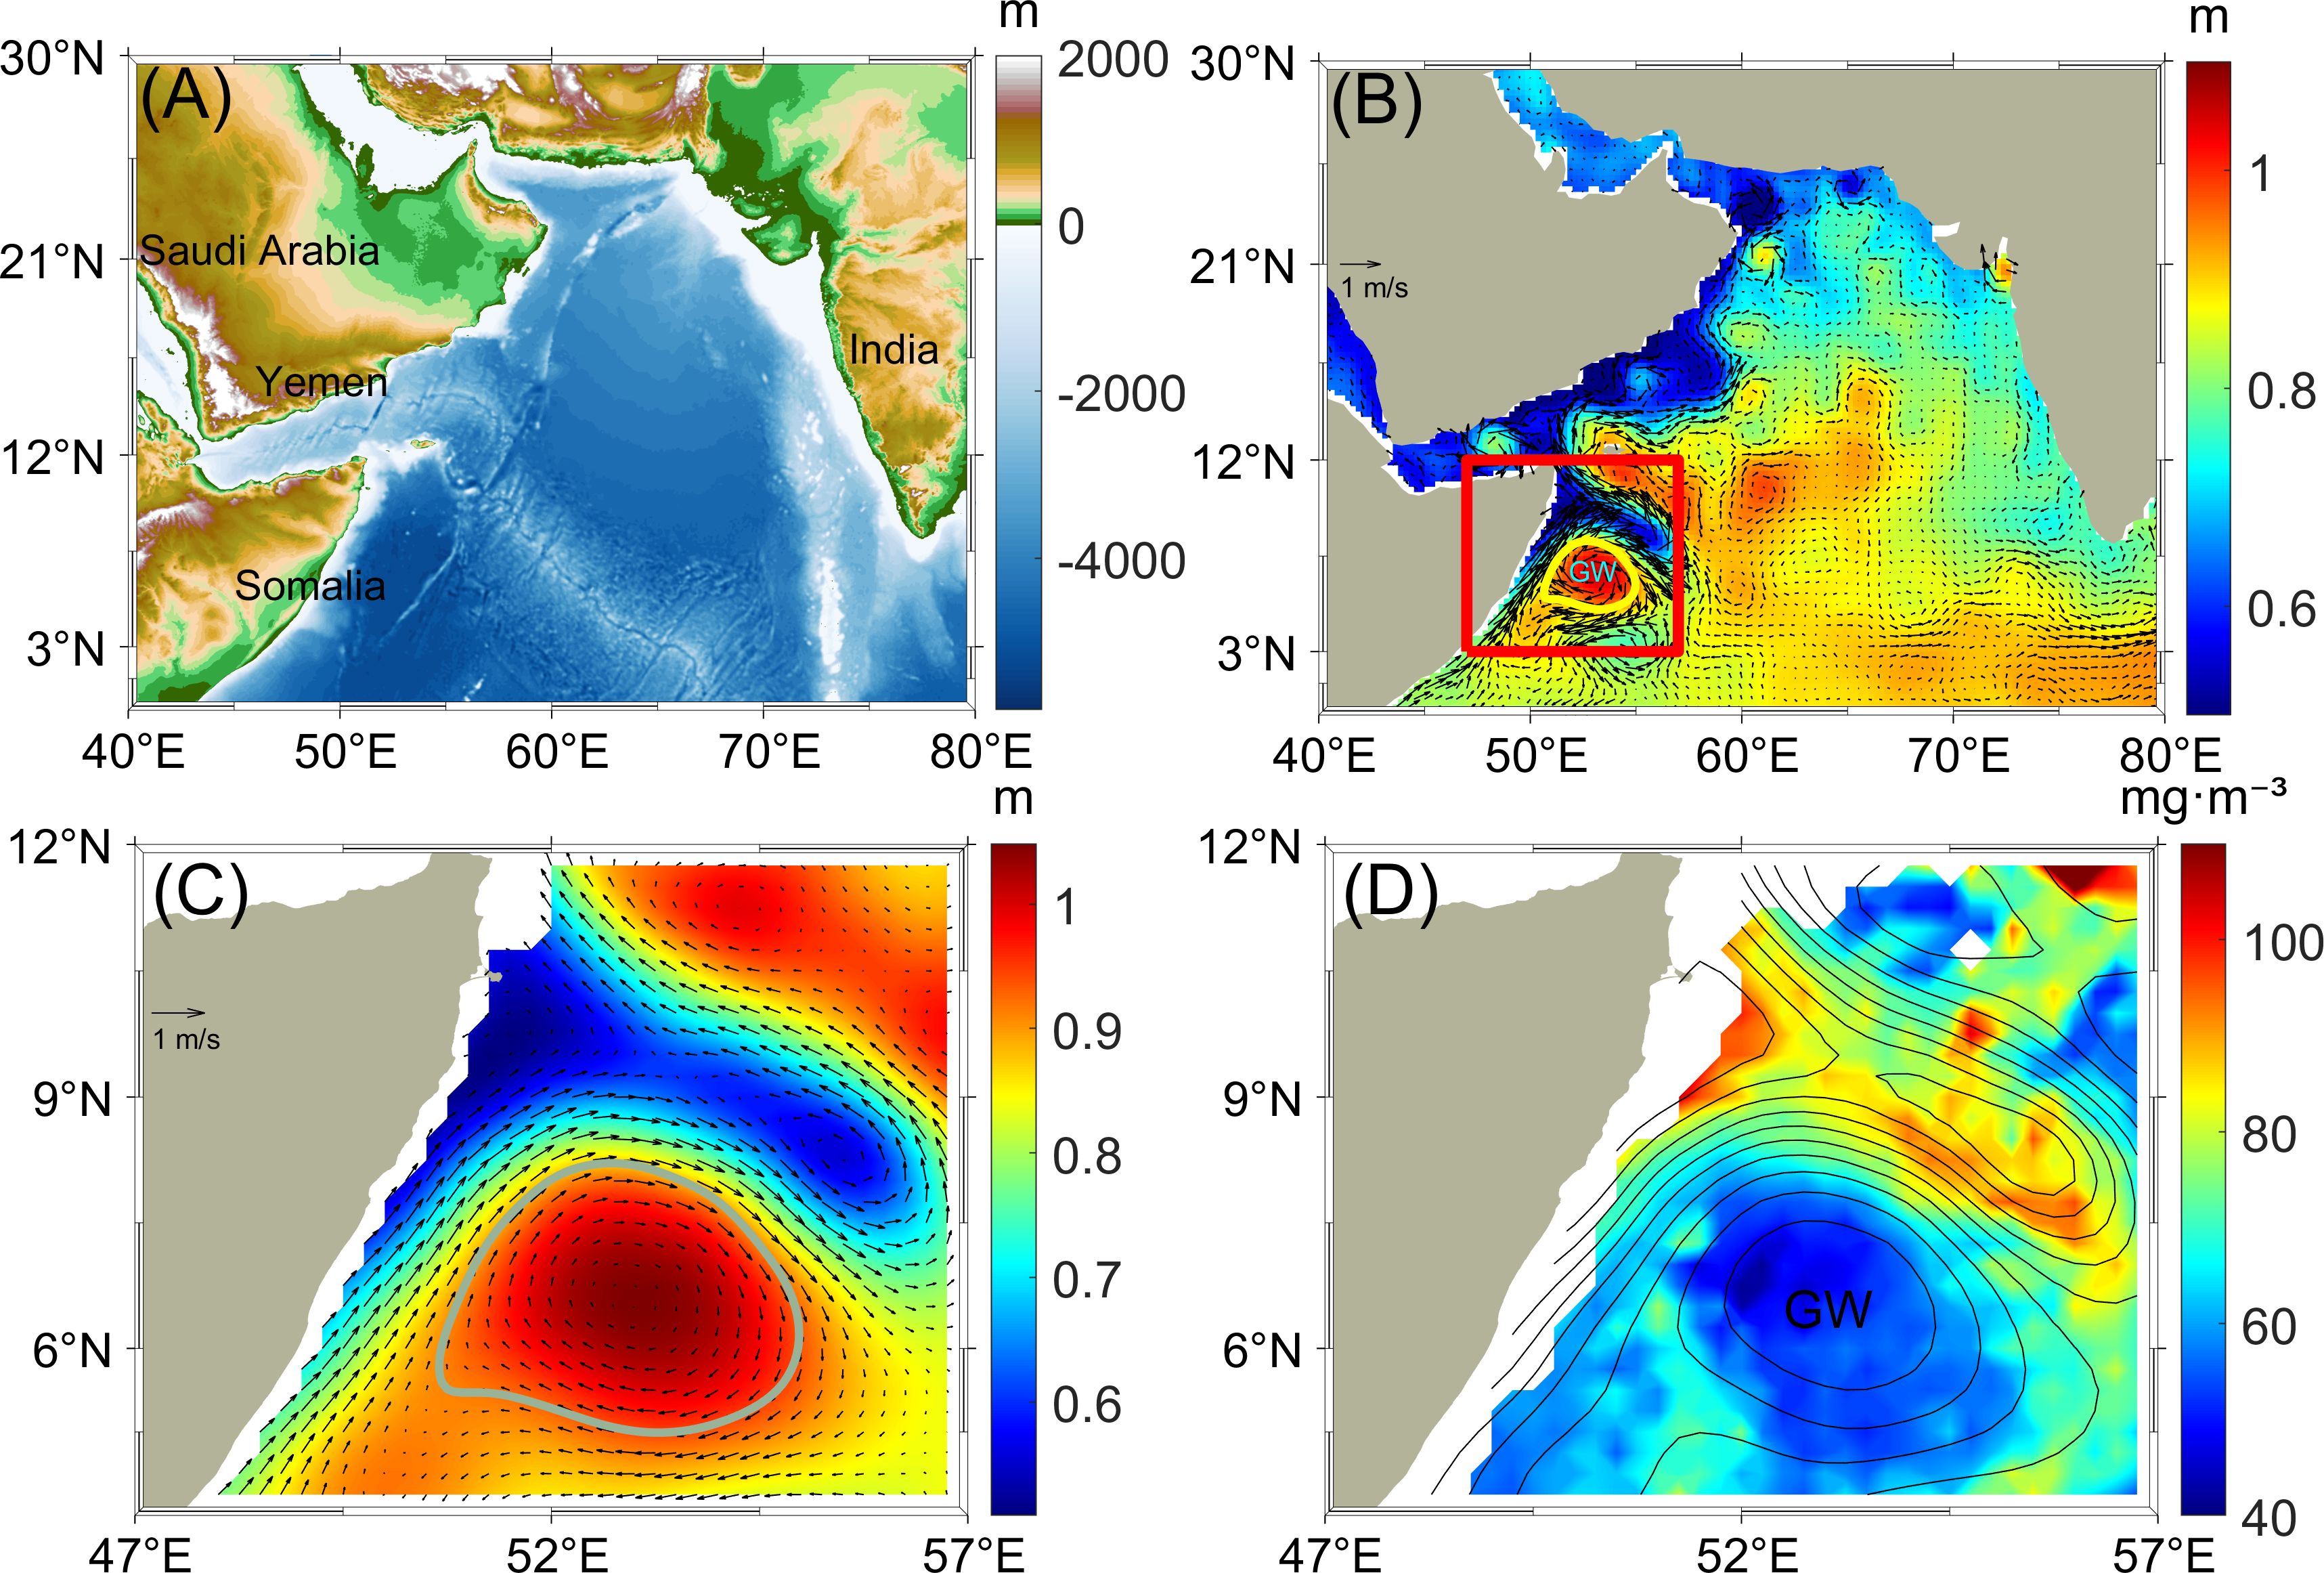
Figure 1. The introduction of the GW and the phenomenon. (A) Water depth topographic map of the Arabian Sea. (B) Flow field distribution map of the Arabian Sea in August 2021. (C) GW flow field distribution map in August 2021, where the gray line represents the eddy boundary of GW. (D) POC concentration distribution map in August 2021, and the solid line represents the contour line of absolute dynamic topography (ADT).
2 Data and methods
2.1 POC data
The POC data used in this study were derived from CMEMS (Copernicus Marine Environment Monitoring Service, https://data.marine.copernicus.eu/product/MULTIOBS_GLO_BIO_BGC_3D_REP_015_010/description). The particulate backscattering coefficient (bbp) and POC data were inverted using the SOCA-BBP algorithm based on temperature and salinity data from Argo buoys and satellite observations by the Laboratoire d’Océanographie de Villefranche (LOV). The algorithm used a multi-layer perceptron type artificial neural network (Rumelhart et al., 1986; Bishop, 1995). This artificial neural network consisted of an input layer, including time component, surface component (satellite-derived log-transformed particulate backscattering coefficient and chlorophyll-a concentration), vertical component (i.e., normalized depth), and multiple hidden layers (Sauzède et al., 2016). The horizontal resolution of this data was 0.25° × 0.25°, with a time span from 1998 to 2021, covering the ocean from the sea surface to a depth of 1000 m. The data were averaged at a 1-month interval.
We used Equation 1 to define a new variable, abnormal POC concentration (POCa) to efficiently evaluate the influence of GW on POC:
where .represents POC concentration values in the area affected by GW and represents the horizontal average of POC concentration values in that area.
2.2 Sea surface height
The data used in this study were absolute dynamic topography (ADT) and flow field data published by the Collecte Localisation Satellites (CLS) using the DUACS system, sourced from CMEMS (https://data.marine.copernicus.eu/product/SEALEVEL_GLO_PHY_L4_MY_008_047/services). ADT is the sum of sea level anomalies (SLA) and mean dynamic topography (MDT) over a reference period of 20 years (1993-2012). The SLA data were filtered from the available altimeter tasks, such as Sentinel-3A, Sentinel-3B, Sarah, HaiYang-2A, HaiYang-2B, Topex/Poseidon, Jason-1, Jason-2, Jason-3, Envisat, ERS-1, ERS-2, Geosat Follow On, and Cryosat-2, and combined to obtain the best interpolation value. The horizontal resolution of this data is 0.25° × 0.25°, spanning from 1993 to 2023. Before eddy detection was conducted, the data were averaged at a 1-month interval.
2.3 Angular momentum eddy detection and tracking algorithm
This study used AMEDA to identify mesoscale eddies from the above sea surface height dataset (Le Vu et al., 2018). The parameter used in this method (local normalized angular momentum, LNAM) replaces the previously used OW parameter. The main difference between this parameter and the previously used OW parameter is that its value does not depend on the eddy intensity.
First, we identify the extreme point of LNAM as the center of the eddy. Thereafter, we calculate the streamline around that center. We calculate the average radius of each closed streamline by Equation 2, which is the equivalent radius of a circle with the same area as the closed streamline we calculated before:
where represents the average radius and A represents the area of the equivalent circle
The mean velocity is evaluated for each closed streamline by Equation 3:
where represents the mean velocity of the closed streamline, represents the circumference of the closed streamline and represents the velocity on the closed streamline.
We identify the Vmax=the maximum value of and its corresponding speed radius =Rmax. When the last streamline’s velocity ≤ 0.97 Vmax, the streamline corresponding to this velocity is the characteristic contour line of the eddy.
3 Results
Overall, the distribution of POC concentration in the surface region shows a characteristic of high in the north, low in the south, and high near the shore. In terms of time, the concentration of POC in seawater is highest in summer (July, August, and September) due to the influence of lighting conditions and other factors. Furthermore, the influence signal of GW on the distribution of POC concentration is highly evident in these three months.
In the horizontal direction, when the seawater depth is not more than 50 m, GW mainly affects the surface distribution of POC through water transport (Figures 2A–F). During the lifecycle of GW, the influence area of GW is mainly concentrated at its edge. Over time, a notable trend is observed, where high concentration POC water bodies in the nearshore and northern waters of GW migrate toward areas with lower POC concentrations due to the flow of water bodies in the GW flow field. High concentration POC water bodies diffuse eastward and southward with the flow of water bodies at the edge of the GW. However, the POC concentration of the water in the central area of the eddy was not significantly affected, and the maximum difference between its concentration and the POC concentration at the edge of the eddy could reach about 20 mg·m−3, with the highly evident signal from July to September. However, the influence of GW on POC in the subsurface layer is different from the transport in the surface layer. In the area affected by the eddy, the extreme value of POC concentration is located inside the eddy, and the signal is most evident from July to September (Figures 2G–L).
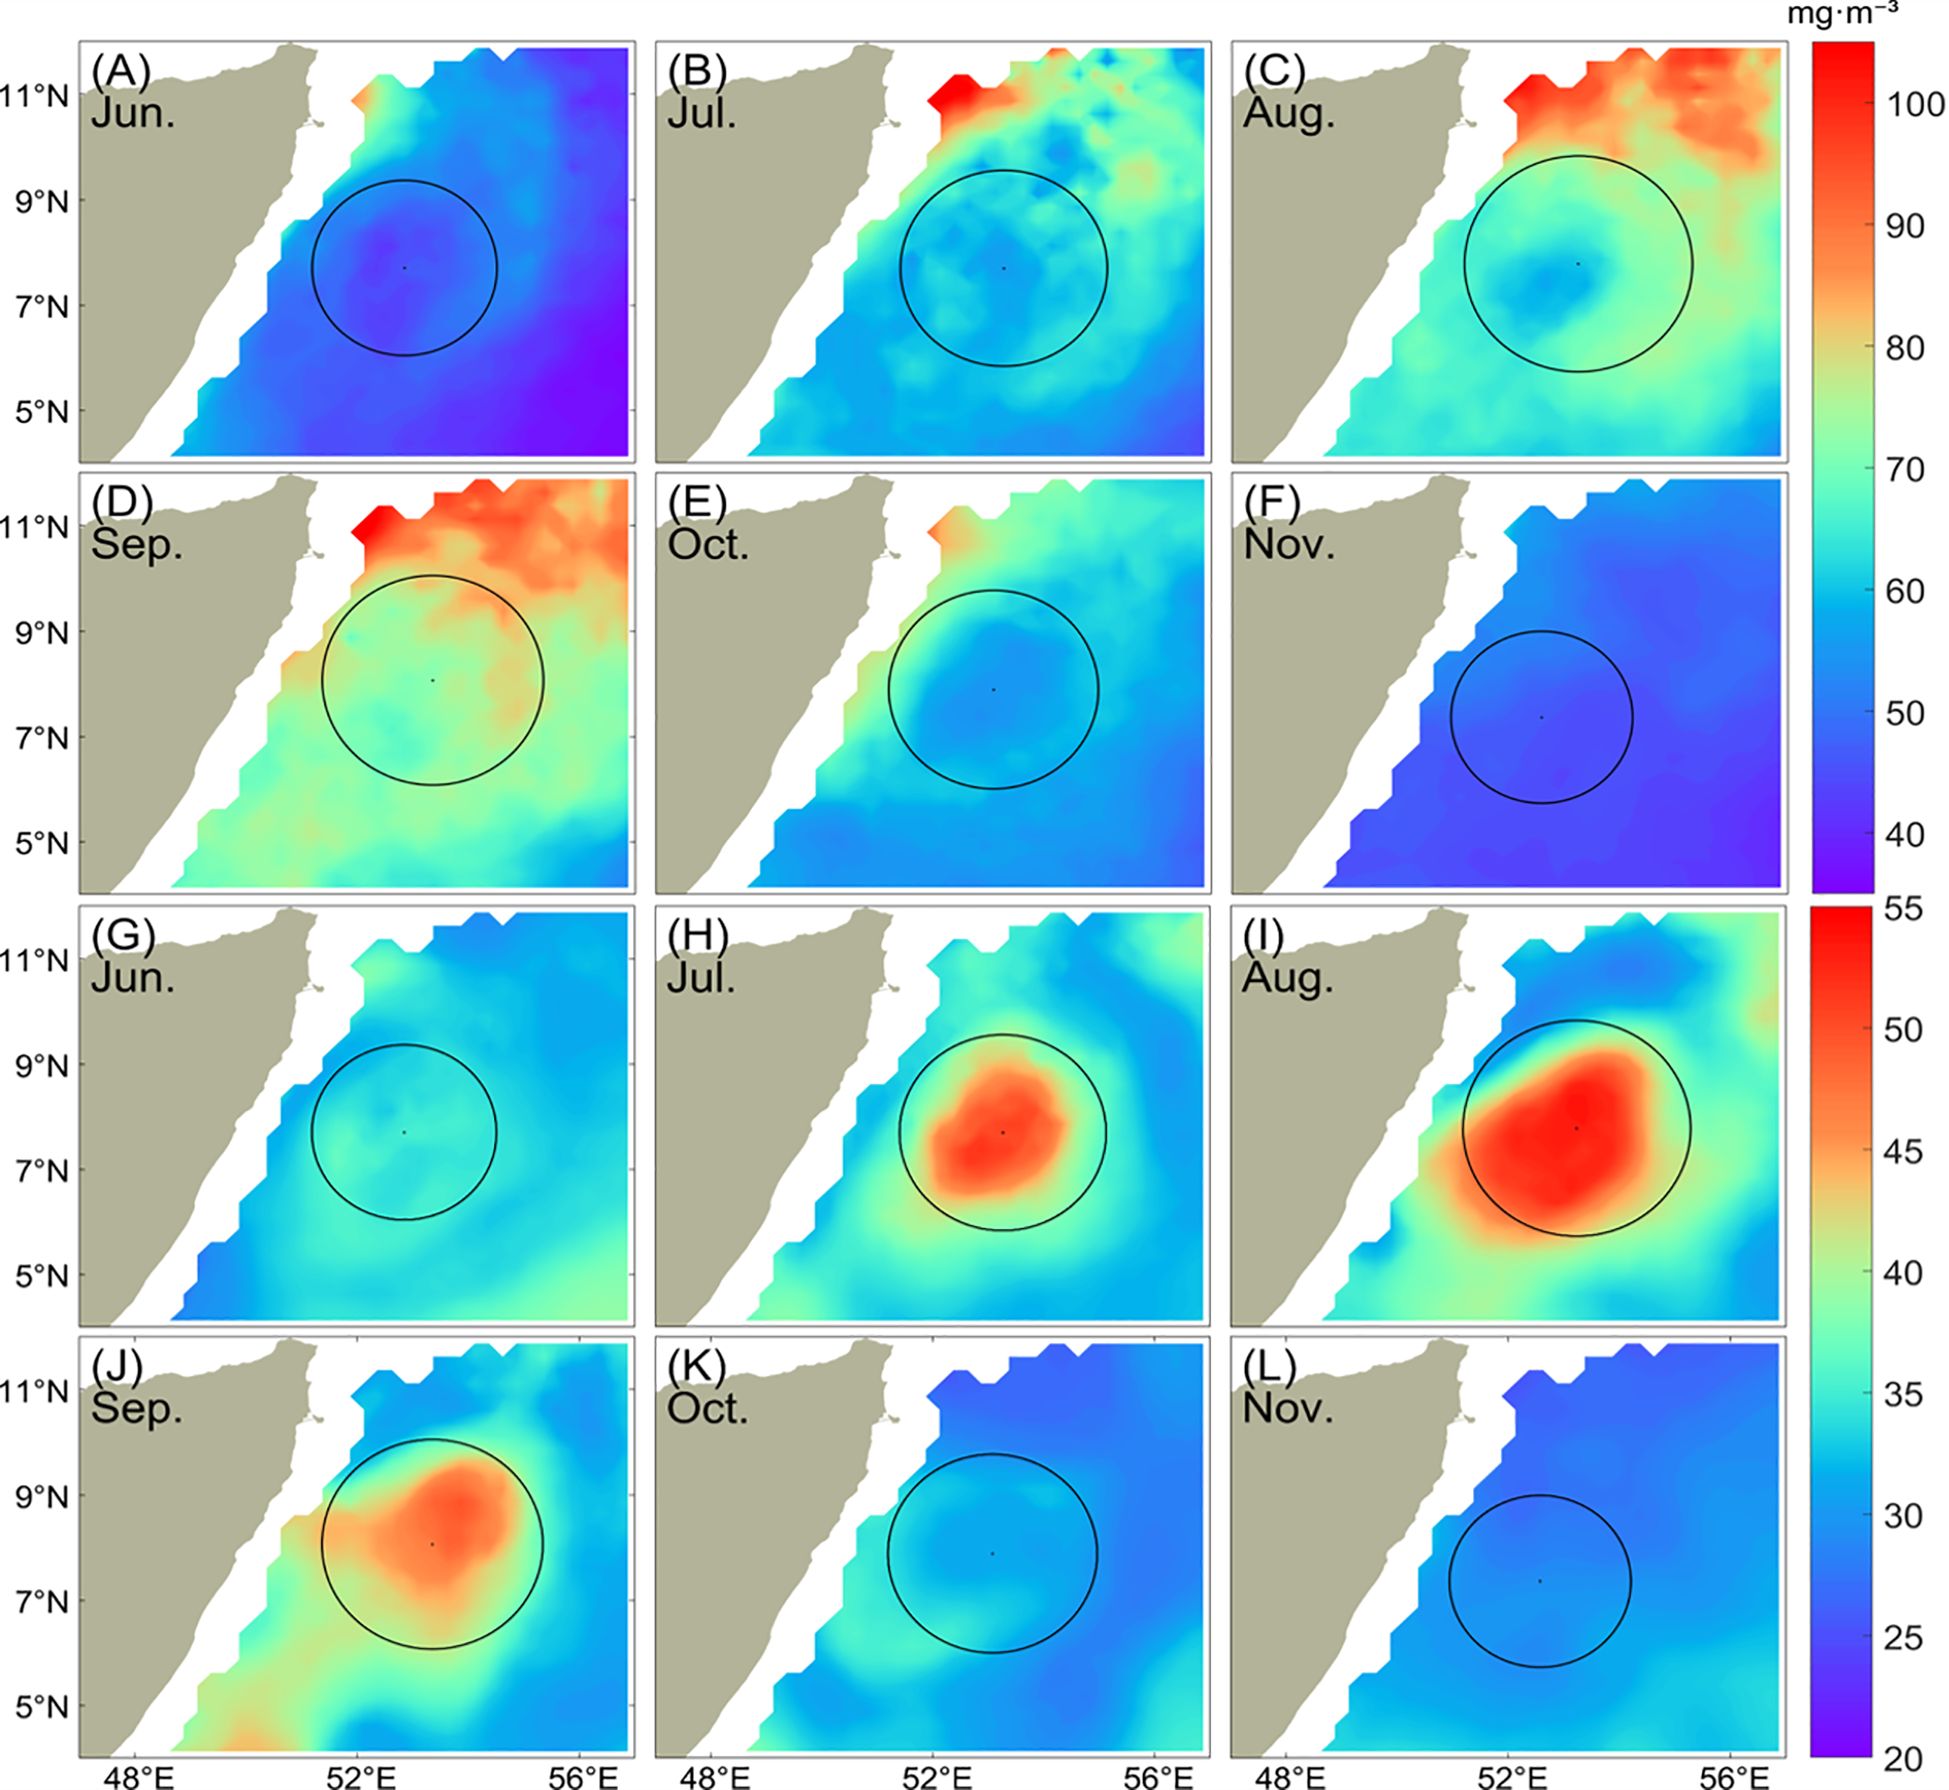
Figure 2. Distribution map of POC concentration in the horizontal direction under climatic conditions. (A–F) Distribution of POC concentration on the sea surface from June to November. (G–L) Distribution of POC concentration on the 80 m layer from June to November. The center position of the circle in the figure is the eddy center position of GW after averaging, with a radius of Rmax, which is the equivalent circle radius.
When the seawater depth is approximately between 50 and 175 m, the high concentration range of POC is mainly distributed in the subsurface layer inside the eddy, with the strongest abnormal signal occurring in the area at a depth of about 100 m and the strongest signal occurring in July and August (Figure 3). The abnormal increase in POC concentration in this area can reach around 8 mg·m−3. This phenomenon indicates that GW has a significant influence on the horizontal distribution of POC within the eddy at the depth approximately between 50 and 175 m.
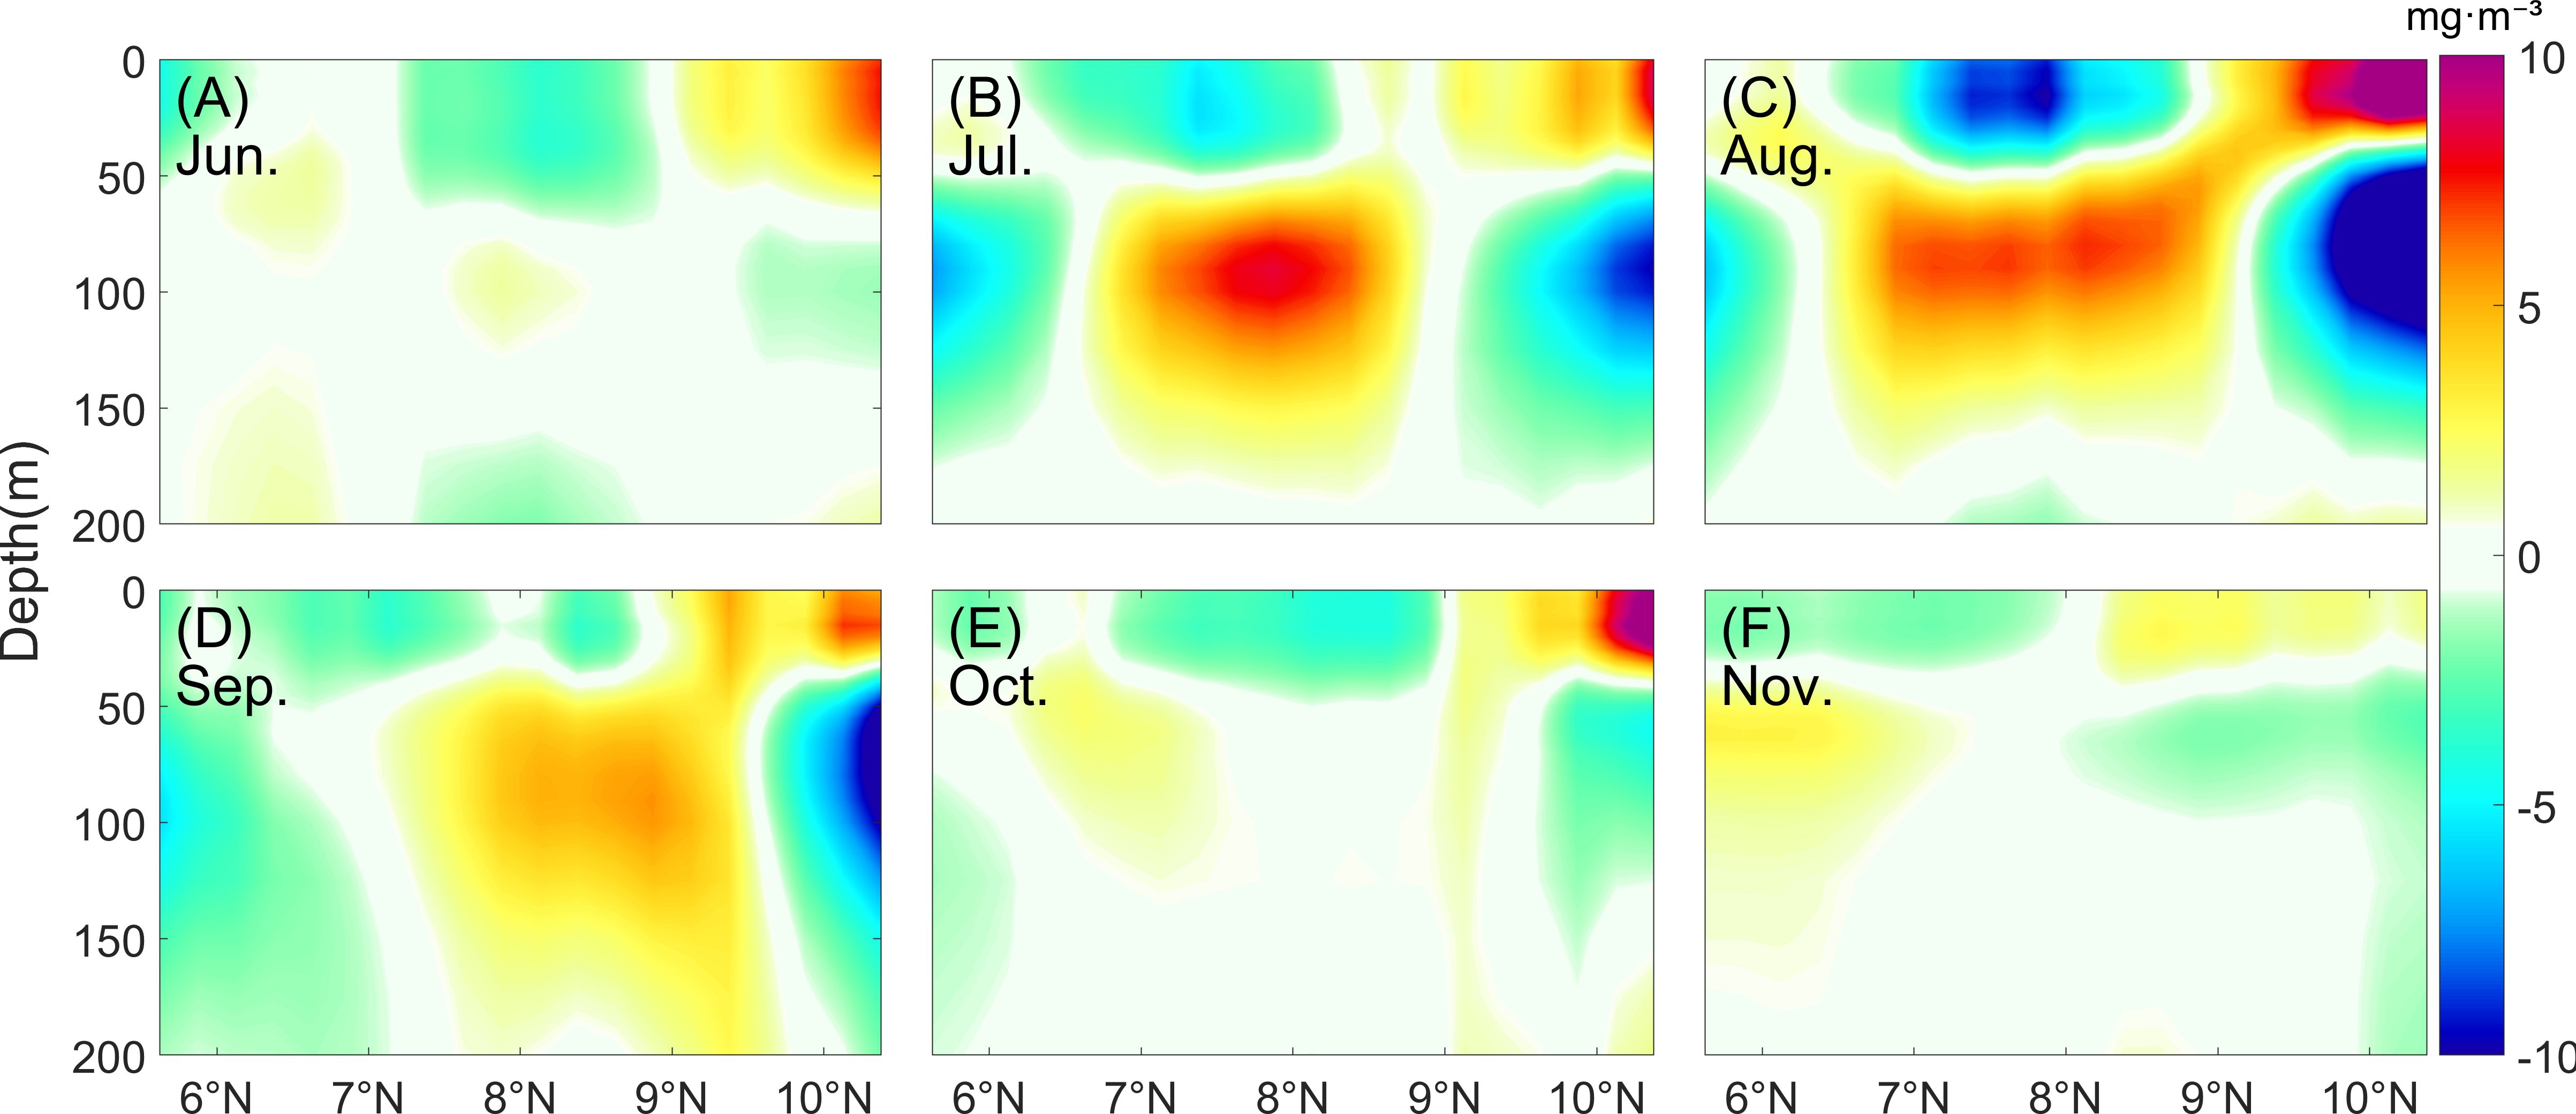
Figure 3. Vertical distribution of inside the eddy. (A–F) Vertical distribution of at 53.625° E in the climate state from June to November.
In the vertical direction, the average concentration of POC inside and outside the eddy also shows the signal of GW transport and enrichment (Figure 4). In seawater with a depth of no more than 50 m, the at the edge of the eddy from July to October is higher than that of the internal one, corresponding to the horizontal distribution of surface POC concentration. This notion indicates that GW can transport high concentration POC water in the surface. In the subsurface layer (approximately between 50 and 175 m), the within the eddy region from July to September is higher than that outside the eddy, and this signal is strongest in July and August. The maximum difference in between inside and outside the eddy can reach about 10 mg·m−3. This phenomenon further indicates that GW can influence the distribution of POC in the subsurface layer, which helps in enriching marine nutrients in the subsurface layer.
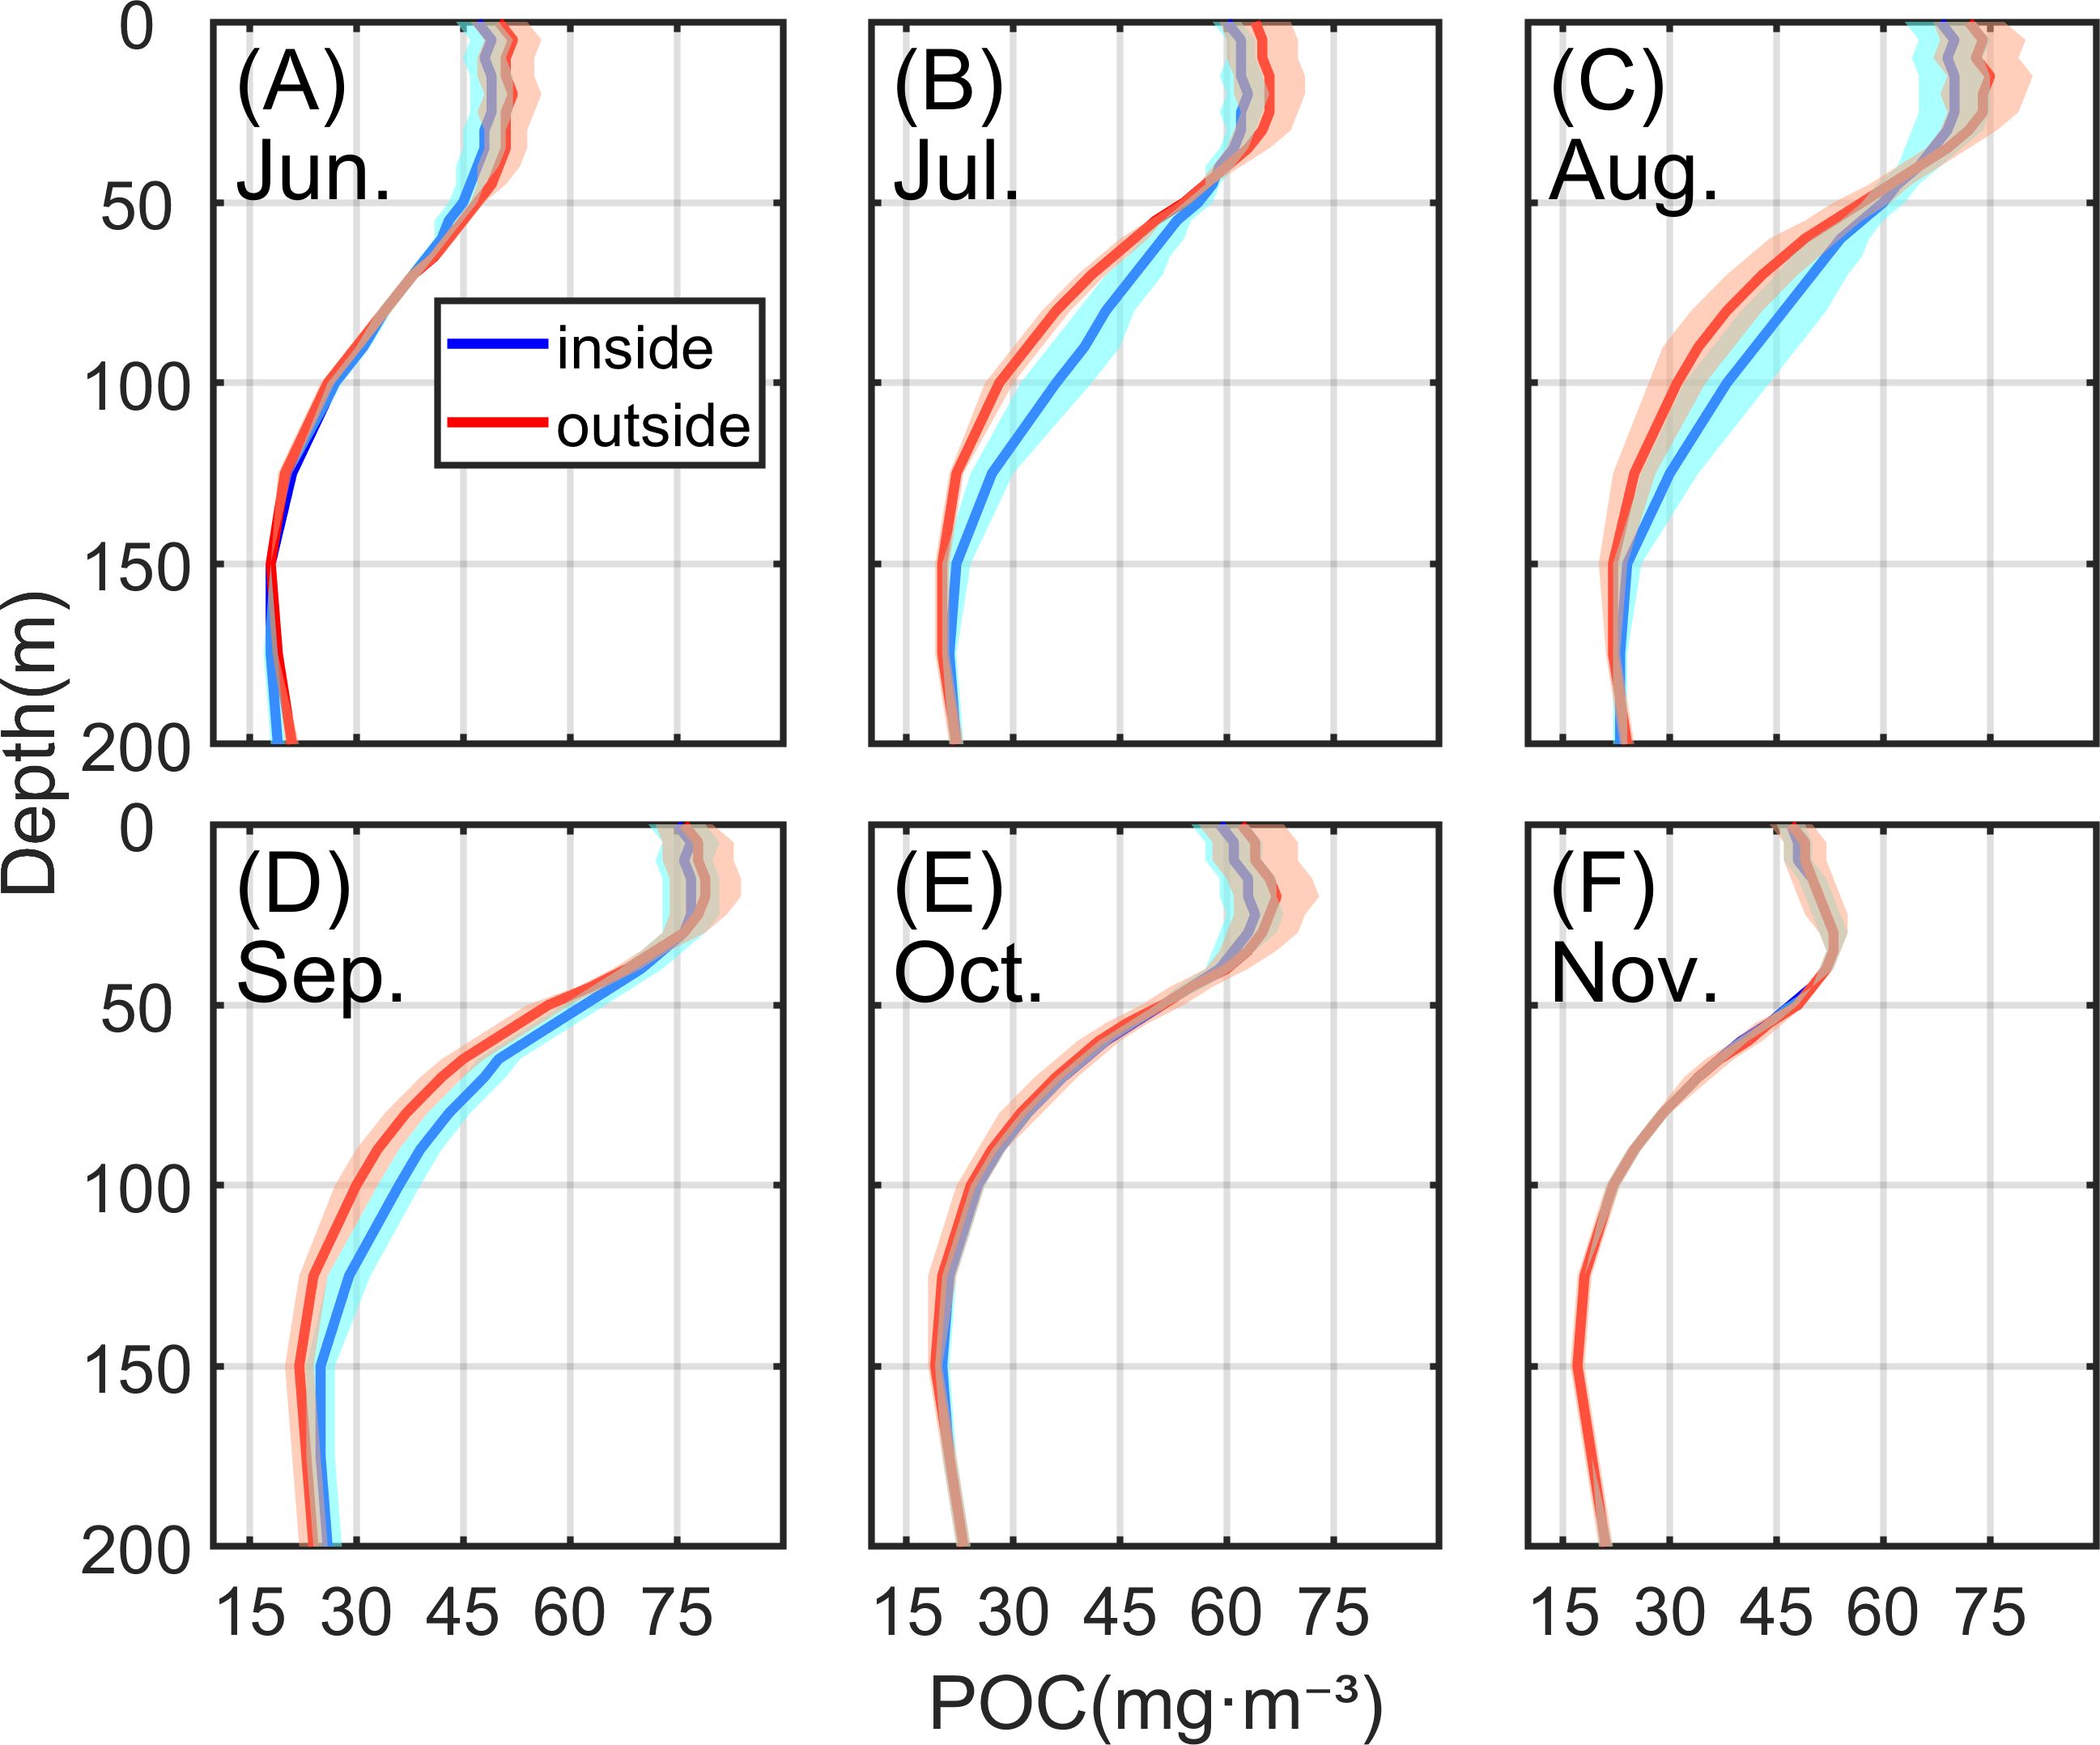
Figure 4. Vertical distribution of inside and outside the eddy. (A–F) Vertical distribution of in the climate state from June to November. The red line represents the outside of the eddy, and the blue line denotes the inside of the eddy. Shadows represent standard deviation.
4 Discussion
Previous studies have shown that the rotational velocity field around eddies can induce horizontal advection of chlorophyll (Chelton et al., 2011a). We also found horizontal advection of POC induced by GW on the surface. Specifically, GW can induce high concentrations of POC water in the north and nearshore to move southward during its lifecycle, especially in summer (July, August, and September). The concentration of POC in the seawater at the edge of the eddy is about 20 mg·m−3 higher than the maximum value at the center resulting from the capturing and transporting effect of GW, which helps in redistributing nutrients in the surface seawater. Mesoscale eddies generate eddy-induced Ekman pumping at the center of the eddy due to differences in surface ocean currents and surface wind speeds or stress curling caused by eddy-induced spatial variability of sea surface temperature or the interaction of the surface stress with the surface current vorticity gradient. This notion means that upwelling is generated in the core of the anticyclone, and downwelling is generated in the core of the cyclone (Gaube et al., 2015). The eddy-induced Ekman pumping can increase the concentration of nutrients inside the anticyclone, resulting in an increase in chlorophyll concentration inside the eddy (Gaube et al., 2013, 2014). In summer (July, August, and September), the eddy center of GW, as an anticyclone, is highly likely to undergo eddy-induced Ekman pumping, generating upwelling and promoting the upwelling of seawater carrying high concentrations of nutrients in the lower layer. This situation results in an abnormal increase in the concentration of POC inside the eddy in the subsurface layer (approximately between 50 and 175 m), with the maximum value even reaching about 10 mg·m−3, which helps in enriching nutrients in the subsurface seawater and works together with the previous horizontal advection, affecting the local marine ecosystem. In addition to the aforementioned two mechanisms, mesoscale eddies can also affect the distribution of chlorophyll through the eddy pumping-the upwelling or downwelling generated during eddy enhancement and so on (Gaube et al., 2014). However, the study results indicated that the signals of the latter did not appear or were weak; hence, it is not discussed here.
In addition, mesoscale eddies are an extremely important oceanic phenomenon closely related to global warming. Greenhouse warming conditions may make mesoscale eddies more frequent (Yun et al., 2024). Mesoscale eddies play an important role in regulating ocean heat absorption and redistribution (Wang et al., 2023; He et al., 2024), especially mesoscale eddies with a horizontal scale of O(100) km, which play a crucial role in regulating ocean heat absorption and redistribution (He et al., 2024). And mesoscale eddies affect ocean carbon sequestration by influencing the heat supply to the ocean surface in the frontal region associated with strong western boundary current extensions (Jing et al., 2020). Our study suggests that mesoscale eddies can also have an impact on the distribution of POC in the ocean, thereby affecting ocean carbon sequestration.
Our study can only investigate the changes in the distribution of climate state POC concentration over the life cycle of GW due to limitations in the quality of POC data. However, we are unable to explore on smaller time scales, such as interannual variations and monthly variations. We only conducted preliminary calculations on the influence of GW on the distribution of POC concentration but did not conduct more precise quantitative calculations.
5 Conclusion
In this study, we mainly study the effect of GW on the spatial and temporal distribution of POC. Our results show that there is a significant difference between the effect of GW on the spatial and temporal distribution of POC when the sea depth is no more than 50 m and when the sea depth is approximately between 50 and 175 m.
From June to November, when the seawater depth is not more than 50 m, the effect of GW on the distribution of POC is mainly manifested in the transport of high-concentration POC water. The flow field at the edge of GW will cause the high concentration of POC water to flow from the north of the GW and the nearshore to the south and east with the flow of seawater, so that the concentration of POC at the edge of GW is higher than that of the water at the center of the eddy, and the difference between the edge and the center can reach about 20 mg·m−3 at most. Due to the influence of light conditions, southwest monsoon, sea temperature and other factors, the signal begins to appear in June and begins to gradually strengthen, and the signal is strongest in August and September. Then the signal begins to weaken and dissipate in November. This phenomenon indicates that GW has a significant impact on the redistribution of nutrients in the local sea area.
From June to November, when the sea depth is approximately between 50 and 175 m, the effect of GW on the distribution of POC is mainly realized that the POC concentration of the water inside the eddy was higher than that of the water at the edge of the eddy, and the difference between the center and the edge is the largest at the depth about 100 m, and the maximum can reach about 10 mg·m−3. Influenced by factors such as the strength of the eddy, the southwest monsoon, and the sea temperature, the signal begins to appear in June and gradually strengthens, and the signal is strongest in July and August. Subsequently, the signal begins to gradually weaken, and in November the signal dissipates. This phenomenon indicates that GW will enrich the nutrients in the subsurface layer of the seawater at approximately between 50 and 175 m, which will increase the concentration of POC in the subsurface water at approximately between 50 and 175 m inside the eddy. The reason for this phenomenon may be that eddy-induced Ekman pumping occurred inside the GW, which causes an upwelling to cause the upwelling of the seawater carrying high concentrations of nutrients in the lower layer, so that the POC concentration of the eddy seawater is higher than that at the edge of the eddy.
Data availability statement
The original contributions presented in the study are included in the article/supplementary material. Further inquiries can be directed to the corresponding author/s.
Author contributions
CZ: Writing – original draft, Writing – review & editing. SW: Conceptualization, Investigation, Validation, Writing – original draft. SY: Methodology, Supervision, Writing – review & editing. HC: Writing – original draft, Writing – review & editing. GH: Conceptualization, Writing – original draft.
Funding
The author(s) declare financial support was received for the research, authorship, and/or publication of this article. This research was funded by the National Natural Science Foundation of China, grant number 42206005; the National Undergraduate Training Program for Innovation and Entrepreneurship, grant number 202210340017.
Conflict of interest
The authors declare that the research was conducted in the absence of any commercial or financial relationships that could be construed as a potential conflict of interest.
Generative AI statement
The author(s) declare that no Generative AI was used in the creation of this manuscript.
Publisher’s note
All claims expressed in this article are solely those of the authors and do not necessarily represent those of their affiliated organizations, or those of the publisher, the editors and the reviewers. Any product that may be evaluated in this article, or claim that may be made by its manufacturer, is not guaranteed or endorsed by the publisher.
References
Adams D. K., McGillicuddy J. D.J., Zamudio L., Thurnherr A. M., Liang X., Rouxel O., et al. (2011). Surface-generated mesoscale eddies transport deep-sea products from hydrothermal vents. Science 332, 580–583. doi: 10.1126/science.1201066
Amos C. M., Castelao R. M., Medeiros P. M. (2019). Offshore transport of particulate organic carbon in the California Current System by mesoscale eddies. Nat. Commun. 10, 4940. doi: 10.1038/s41467-019-12783-5
Beal L. M., Donohue K. A. (2013). The Great Whirl: Observations of its seasonal development and interannual variability. J. Geophysical Research: Oceans 118, 1–13. doi: 10.1029/2012JC008198
Beal L. M., Hormann V., Lumpkin R., Foltz G. R. (2013). The response of the surface circulation of the Arabian Sea to monsoonal forcing. J. Phys. Oceanogr. 43, 2008–2022. doi: 10.1175/JPO-D-13-033.1
Benitez-Nelson C. R., Bidigare R. R., Dickey T. D., Landry M. R., Leonard C. L., Brown S. L., et al. (2007). Mesoscale eddies drive increased silica export in the subtropical Pacific Ocean. Science 316, 1017–1021. doi: 10.1126/science.1136221
Bourbonnais A., Altabet M. A., Charoenpong C. N., Larkum J., Hu H., Bange H. W., et al. (2015). N-loss isotope effects in the Peru oxygen minimum zone studied using a mesoscale eddy as a natural tracer experiment. Global Biogeochemical Cycles 29, 793–811. doi: 10.1002/2014GB005001
Cao Z., Hu R. (2015). Research on the interannual variability of the great whirl and the related mechanisms. J. Ocean Univ. China 14, 17–26. doi: 10.1007/s11802-015-2392-8
Castelao R. M. (2014). Mesoscale eddies in the South Atlantic Bight and the Gulf Stream recirculation region: vertical structure. J. Geophysical Research: Oceans 119, 2048–2065. doi: 10.1002/2014JC009796
Chaigneau A., Eldin G., Dewitte B. (2009). Eddy activity in the four major upwelling systems from satellite altimetry, (1992–2007). Prog. Oceanography 83, 117–123. doi: 10.1016/j.pocean.2009.07.012
Chelton D. B., Gaube P., Schlax M. G., Early J. J., Samelson R. M. (2011a). The influence of nonlinear mesoscale eddies on near-surface oceanic chlorophyll. Science 334, 328–332. doi: 10.1126/science.1208897
Chelton D. B., Schlax M. G., Samelson R. M. (2011b). Global observations of nonlinear mesoscale eddies. Prog. Oceanography 91, 167–216. doi: 10.1016/j.pocean.2011.01.002
Correa-Ramirez M. A., Hormazábal S., Yuras G. (2007). Mesoscale eddies and high chlorophyll concentrations off central Chile (29°–39°S). Geophysical Res. Lett. 34. doi: 10.1029/2007GL029541
Dai L., Han B., Tang S., Chen C., Du Y. (2021). Influences of the Great Whirl on surface chlorophyll a concentration off the Somali Coast in 2017. Acta Oceanologica Sin. 40, 79–86. doi: 10.1007/s13131-021-1740-3
Dobashi R., Ueno H., Matsudera N., Fujita I., Fujiki T., Honda M. C., et al. (2022). Impact of mesoscale eddies on particulate organic carbon flux in the western subarctic North Pacific. J. Oceanography 1-14. doi: 10.1007/s10872-021-00620-7
Dong C., McWilliams J. C., Liu Y., Chen D. (2014). Global heat and salt transports by eddy movement. Nat. Commun. 5, 3294. doi: 10.1038/ncomms4294
Dufour C. O., Griffies S. M., de Souza G. F., Frenger I., Morrison A. K., Palter J. B., et al. (2015). Role of mesoscale eddies in cross-frontal transport of heat and biogeochemical tracers in the Southern Ocean. J. Phys. Oceanography 45, 3057–3081. doi: 10.1175/JPO-D-14-0240.1
Gaube P., Chelton D. B., Samelson R. M., Schlax M. G., O’Neill L. W. (2015). Satellite observations of mesoscale eddy-induced Ekman pumping. J. Phys. Oceanography 45, 104–132. doi: 10.1175/JPO-D-14-0032.1
Gaube P., Chelton D. B., Strutton P. G., Behrenfeld M. J. (2013). Satellite observations of chlorophyll, phytoplankton biomass, and Ekman pumping in nonlinear mesoscale eddies. J. Geophysical Research: Oceans 118, 6349–6370. doi: 10.1002/2013JC009027
Gaube P., McGillicuddy D. J. Jr., Chelton D. B., Behrenfeld M. J., Strutton P. G. (2014). Regional variations in the influence of mesoscale eddies on near-surface chlorophyll. J. Geophysical Research: Oceans 119, 8195–8220. doi: 10.1002/2014JC010111
He Q., Mo D., Zhan W., Cai S., Tang S., Zha G., et al. (2024). Thermal imprints of mesoscale eddies in the global ocean. J. Phys. Oceanography 54, 1991–2009. doi: 10.1175/JPO-D-23-0226.1
Jensen T. G. (1991). Modeling the seasonal undercurrents in the Somali Current system. J. Geophysical Research: Oceans 96, 22151–22167. doi: 10.1029/91JC02383
Jing Z., Wang S., Wu L., Chang P., Zhang Q., Sun B., et al. (2020). Maintenance of mid-latitude oceanic fronts by mesoscale eddies. Sci. Adv. 6, eaba7880. doi: 10.1126/sciadv.aba7880
Kharbush J. J., Close H. G., Van Mooy B. A., Arnosti C., Smittenberg R. H., Le Moigne F. A., et al. (2020). Particulate organic carbon deconstructed: molecular and chemical composition of particulate organic carbon in the ocean. Front. Mar. Sci. 7, 518. doi: 10.3389/fmars.2020.00518
Klein P., Lapeyre G., Siegelman L., Qiu B., Fu L. L., Torres H., et al. (2019). Ocean-scale interactions from space. Earth Space Sci. 6, 795–817. doi: 10.1029/2018EA000492
Le Moigne F. A. (2019). Pathways of organic carbon downward transport by the oceanic biological carbon pump. Front. Mar. Sci. 6, 634. doi: 10.3389/fmars.2019.00634
Le Vu B., Stegner A., Arsouze T. (2018). Angular momentum eddy detection and tracking algorithm (AMEDA) and its application to coastal eddy formation. J. Atmospheric Oceanic Technol. 35, 739–762. doi: 10.1175/JTECH-D-17-0010.1
Li H., Wiesner M. G., Chen J., Ling Z., Zhang J., Ran L. (2017). Long-term variation of mesopelagic biogenic flux in the central South China Sea: Impact of monsoonal seasonality and mesoscale eddy. Deep Sea Res. Part I: Oceanographic Res. Papers 126, 62–72. doi: 10.1016/j.dsr.2017.05.012
McCreary J. P., Kundu P. K. (1988). A numerical investigation of the Somali Current during the Southwest Monsoon. J. Mar. Res. 46, 25–58. doi: 10.1357/002224088785113711
Muller-Karger F. E., Varela R., Thunell R., Luerssen R., Hu C., Walsh J. J. (2005). The importance of continental margins in the global carbon cycle. Geophysical Res. Lett. 32. doi: 10.1029/2004GL021346
Omand M. M., D’Asaro E. A., Lee C. M., Perry M. J., Briggs N., Cetinić I., et al. (2015). Eddy-driven subduction exports particulate organic carbon from the spring bloom. Science 348, 222–225. doi: 10.1126/science.1260062
Pavia F. J., Anderson R. F., Lam P. J., Cael B. B., Vivancos S. M., Fleisher M. Q., et al. (2019). Shallow particulate organic carbon regeneration in the South Pacific Ocean. Proc. Natl. Acad. Sci. 116, 9753–9758. doi: 10.1073/pnas.1901863116
Rumelhart D. E., Hinton G. E., Williams R. J. (1986). Learning representations by back-propagating errors. Nature 323, 533–536. doi: 10.1038/323533a0
Sauzède R., Claustre H., Uitz J., Jamet C., Dall’Olmo G., d’Ortenzio F., et al. (2016). A neural network-based method for merging ocean color and Argo data to extend surface bio-optical properties to depth: Retrieval of the particulate backscattering coefficient. J. Geophysical Research: Oceans 121, 2552–2571. doi: 10.1002/2015JC011408
Shih Y. Y., Hung C. C., Gong G. C., Chung W. C., Wang Y. H., Lee I. H., et al. (2015). Enhanced particulate organic carbon export at eddy edges in the oligotrophic Western North Pacific Ocean. PloS One 10, e0131538. doi: 10.1371/journal.pone.0131538
Siegel D. A., Buesseler K. O., Behrenfeld M. J., Benitez-Nelson C. R., Boss E., Brzezinski M. A., et al. (2016). Prediction of the export and fate of global ocean net primary production: The EXPORTS science plan. Front. Mar. Sci. 3, 22. doi: 10.3389/fmars.2016.00022
Vic C., Roullet G., Carton X., Capet X. (2014). Mesoscale dynamics in the Arabian Sea and a focus on the Great Whirl life cycle: A numerical investigation using ROMS. J. Geophysical Research: Oceans 119, 6422–6443. doi: 10.1002/2014JC009857
Wang H., Qiu B., Liu H., Zhang Z. (2023). Doubling of surface oceanic meridional heat transport by non-symmetry of mesoscale eddies. Nat. Commun. 14, 5460. doi: 10.1038/s41467-023-41294-7
Wang S., Zhu W., Ma J., Ji J., Yang J., Dong C. (2019). Variability of the great whirl and its impacts on atmospheric processes. Remote Sens. 11, 322. doi: 10.3390/rs11030322
Wangersky P. J. (1976). “Particulate organic carbon in the Atlantic and Pacific Oceans,” in Deep Sea Research and Oceanographic Abstracts, 23, 457–65. (Canada: Elsevier).
Yun J., Ha K. J., Lee S. S. (2024). Impact of greenhouse warming on mesoscale eddy characteristics in high-resolution climate simulations. Environ. Res. Lett. 19, 014078. doi: 10.1088/1748-9326/ad114b
Zhang Y., Liu Z., Zhao Y., Wang W., Li J., Xu J. (2014b). Mesoscale eddies transport deep-sea sediments. Sci. Rep. 4, 5937. doi: 10.1038/srep05937
Zhang Z., Tian J., Qiu B., Zhao W., Chang P., Wu D., et al. (2016). Observed 3D structure, generation, and dissipation of oceanic mesoscale eddies in the South China Sea. Sci. Rep. 6, 24349. doi: 10.1038/srep24349
Keywords: great whirl, particulate organic carbon, mass transport, Northwest Indian Ocean, mesoscale eddies
Citation: Zha C, Wang S, Ying S, Chen H and Han G (2025) 3D distribution of particulate organic carbon induced by the great whirl. Front. Mar. Sci. 12:1505781. doi: 10.3389/fmars.2025.1505781
Received: 03 October 2024; Accepted: 12 February 2025;
Published: 05 March 2025.
Edited by:
Meilin Wu, Chinese Academy of Sciences (CAS), ChinaCopyright © 2025 Zha, Wang, Ying, Chen and Han. This is an open-access article distributed under the terms of the Creative Commons Attribution License (CC BY). The use, distribution or reproduction in other forums is permitted, provided the original author(s) and the copyright owner(s) are credited and that the original publication in this journal is cited, in accordance with accepted academic practice. No use, distribution or reproduction is permitted which does not comply with these terms.
*Correspondence: Hui Chen, Y2hlbmh1aUB6am91LmVkdS5jbg==; Guoqing Han, aGFuZ3VvcWluZ0B6am91LmVkdS5jbg==