 Danning Wu
 Xiaojie Yu
 Xinyu Guo
 Yucheng Wang4
 Huiwang Gao
 Jianhui Tang
- 1Key Laboratory of Marine Environment and Ecology, College of Environmental Science and Engineering, Ocean University of China, Ministry of Education, Qingdao, China
- 2Laboratory for Marine Ecology and Environmental Science, Qingdao Marine Science and Technology Center, Qingdao, China
- 3Center for Marine Environmental Studies, Ehime University, Matsuyama, Japan
- 4Laoshan Laboratory, Qingdao, China
- 5Key Laboratory of Coastal Environmental Processes and Ecological Remediation, Yantai Institute of Coastal Zone Research, Chinese Academy of Sciences, Yantai, China
The exchange of water through the Bohai Strait, located between the Bohai Sea and the Yellow Sea, plays a crucial role in controlling physical-biogeochemical conditions in the coastal seas off northern and eastern China. We investigated the characteristics of the water exchange through the strait using a numerical model. Our results showed that the residual current was featured with inflow in the northern part and outflow in the southern part of the strait, consistent with previous studies. A two-layer structure, i.e. outflow in the surface layer and inflow in the bottom layer, was newly found in the southern part of the strait. Through a series of numerical experiments, we found that the two-layer structure was induced by density-driven currents and was strongest in summer. Furthermore, the seasonal variation of net water flux through the strait showed correspondence to that of the Yellow River discharge. We investigated the effect of Yellow River discharge on the water exchange through Bohai Strait by additional experiments. Results showed that the response of net water flux through the strait was nearly synchronous with the variation in the Yellow River discharge; however, the response of inflow/outflow flux was a combination of synchronous and delayed responses to the Yellow River discharge. Compared with the maximum Yellow River discharge in July, the largest increase in outflow volume through the strait occurred in next March. The synchronous response is induced by the barotropic effect, while the asynchronous response is due to the baroclinic effect of the Yellow River discharge. Meanwhile, tracers released from the Yellow River mouth at the end of June were detected at the southern strait in next January. Therefore, the Yellow River discharge likely has a delay effect on the Bohai Strait water exchange with an approximate lag of 7–9 months.
1 Introduction
The Bohai Sea is a semi-enclosed shelf sea located in northern China that includes Laizhou Bay, Bohai Bay, Liaodong Bay, and the central region (Figure 1). It is a shallow sea with an average depth of 18 m, and connects with the Yellow Sea via the Bohai Strait. The Bohai Strait is approximately 105 km wide and has a deep channel in its northern section, with a maximum water depth of 70 m. As the only passage between the Bohai Sea and the northern Yellow Sea, the water exchange capacity of the Bohai Strait plays a crucial role in regulating the water quality and environment of the Bohai Sea (Bi et al., 2011; Chen et al., 2010).
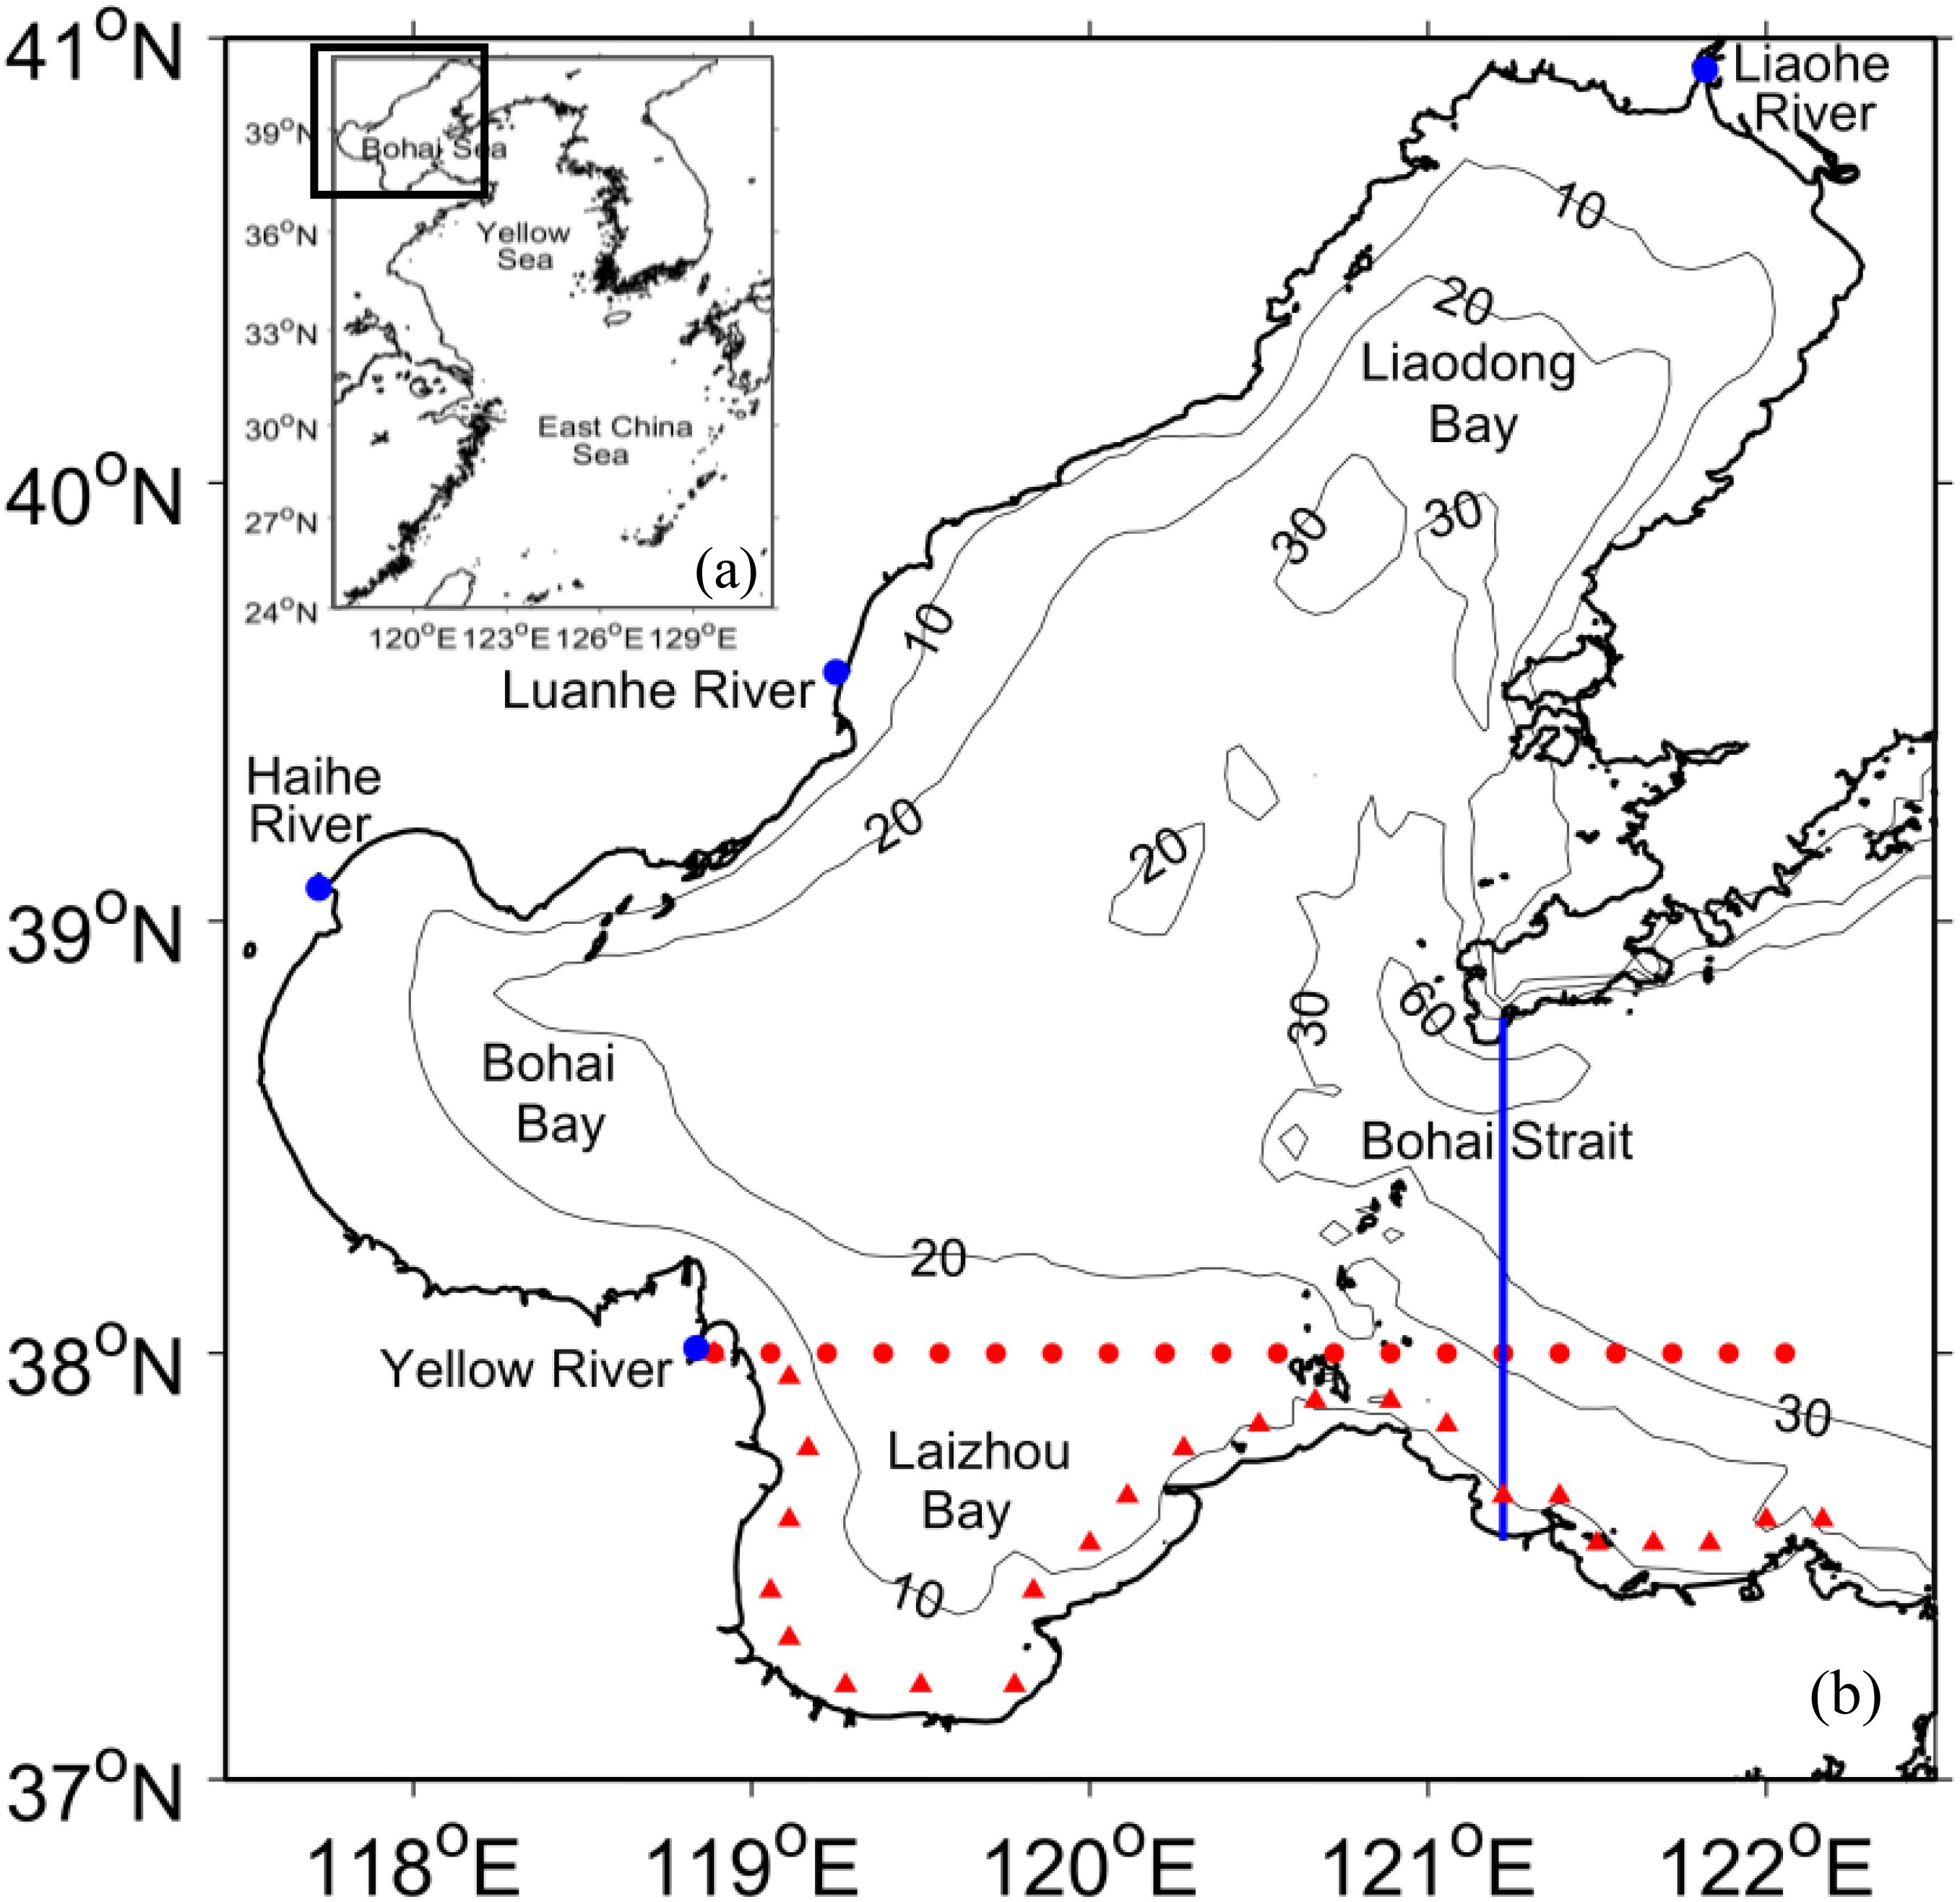
Figure 1. (a) Model domain and (b) bathymetry of the Bohai Sea. Isobaths of 10, 20, 30, and 60 m are indicated by contours. Blue line denotes the Bohai Strait section. Blue dots show the positions of rivers. Red dots denote the grid points where surface elevation is shown in Figure 10. Red triangles denote the grid points where tracer concentration is shown in Figure 13.
In recent decades, the water exchange in the Bohai Strait has been the subject of extensive research. It has been known that the water from the Bohai Sea flows out through the southern part of the strait, while the water from the Yellow Sea flows in through the northern part of the strait. This water exchange structure is known as “north in and south out” (Guan, 1994; Huang et al., 1998);. However, some modeling and observational studies do not show this “north in and south out” structure in summer (Wei et al., 2001; Zhang et al., 2018). Furthermore, numerical modeling results regarding water exchange in the Bohai Strait during summer exhibit significant variability, probably attributable to interannual variations. Some studies showed an alternating distribution between inflow and outflow zones (Bi, 2013), some showed a “north-south in and middle out” structure (Lin et al., 2002), and some even showed “north out and south in” (Huang et al., 1996; Wei et al., 2001). Furthermore, based on observational data, Wu et al. (2019) reported a stratified structure in the southern part of the strait in spring with outflow in the surface layer and inflow in the bottom layer, but the driving mechanism is still unclear.
Tide, wind, and river runoff can all influence the water exchange in the Bohai Strait. The predominant tides in the Bohai Strait are semi-diurnal constituents (Chen, 1992). In the northern part of the strait, the tidal current exhibits considerable strength, with a maximum current speed of 3 m/s (Wu et al., 2013). The average tidal range in the Bohai Strait is ~2 meters (Li et al., 2016). Tide-induced residual current plays an important role in water exchange through the Bohai Strait, especially for the inflow in the northern part of the strait (Lin et al., 2005; Zhang, 2019).
The wind is also an essential force in driving the current in the Bohai Strait (Zhao and Cao, 1998; Zhao and Shi, 1993). The wind over the Bohai Sea is northerly or northwesterly in autumn and winter, and southerly or southeasterly in spring and summer. As a result, the wind-driven surface current in autumn and winter in the Bohai Sea directs mainly southward and drives seawater into the Laizhou Bay. Then, the high sea level along the coast from the Laizhou Bay to the Bohai Strait forms an eastward costal current that brings low salinity water to the southern Bohai Strait (Wang et al., 2008; Zhang et al., 2010). The opposite situation occurs in spring and summer, with the wind-driven current directing northward and driving seawater from the southern Bohai Sea towards the central Bohai Sea (Wang et al., 2008; Wei et al., 2001). Consequently, the effect of wind on water exchange through the Bohai Strait is also subject to seasonal variations.
Density-driven current in summer also plays an important role in water exchange through the Bohai Strait (Lin et al., 2002; Wei et al., 2003). The net transport through the Bohai Strait into the northern Yellow Sea is larger in summer, which is related to strong precipitation and runoff in the Bohai Sea (Ji et al., 2019; Zhang et al., 2018). The high Yellow River flow rate was suggested to enhance density-driven current and promote water exchange through the Bohai Strait (Li et al., 2017; Men et al., 2017).
Yellow River is the second longest river in China and is notable for its substantial sediment load into the Bohai Sea. Since 2002, the Yellow River Conservancy Commission has annually implemented a water-sediment regulation scheme (WSRS). The WSRS aims to reshape the relationship between the water and sediment in the river by releasing a large amount of water in a short time in summer. The WSRS generally lasts for 15 ~ 20 days and inevitably impacts the hydrodynamic conditions in the Bohai Sea. In recent years, investigations concerning the impact of the Yellow River on the Bohai Sea have predominantly concentrated on the influence of the Yellow River discharge on the plume dynamics (Wang et al., 2011; Yu et al., 2021) and salinity in the Bohai Sea (Lin et al., 2001; Wu et al., 2004). The extension direction and range of the Yellow River plume are closely related to its discharge value (Shou et al., 2016; Yu et al., 2021). The large amount of freshwater released by the WSRS has significantly reduced the salinity of Laizhou Bay in both short-term and long-term time scales (Shi et al., 2020; Zhao et al., 2010; Mao et al., 2008). However, there is still a lack of further research on the influence of WSRS, especially the effect of large river discharge on water exchange through the Bohai Strait.
This study aims to investigate the water exchange in the Bohai Strait through numerical modeling and analyze the relative contributions of tide, wind, and Yellow River discharge. The influence of the Yellow River discharge on water exchange in the strait will be emphasized. Section 2 describes the configuration of the hydrodynamic model. Section 3 presents the characteristics of temperature, salinity, and residual current distributions in the Bohai Strait and the water exchange through the Bohai Strait. Section 4 discusses the effects of different factors including the Yellow River discharge on the Bohai Strait water exchange.
2 Materials and methods
The numerical model we adopted is a three-dimensional primitive equation ocean model, the Princeton Ocean Model (POM) (Blumberg and Mellor, 1987; Mellor, 2003). It uses a second-order momentum turbulent closure scheme to calculate the vertical eddy viscosity and diffusivity (Mellor and Yamada, 1982), and the Smagorinsky formulation is applied to parameterize the horizontal eddy viscosity and diffusivity (Smagorinsky, 1963). The model is based on Wang et al. (2008), with a defined model domain of 117.5°- 131.5°E and 24°- 41°N (Figure 1a), covering the Bohai Sea, Yellow Sea, and East China Sea. The horizontal resolution is 1/18°in both longitude and latitude, and there are 21 sigma layers in the vertical direction. The open boundary is far from the Bohai Strait, favoring a purely dynamic representation of water exchange between the Bohai Sea and the Yellow Sea.
The forcing conditions for the model included wind stress, river discharge, heat flux, precipitation, evaporation, and tide (Wang et al., 2008). The wind stresses from the European Centre for Medium-Range Weather Forecasts (ECMWF) in 2022 were used, with a spatial resolution of 0.25° × 0.25°. Being controlled by the Asian Monsoon, the winds over the Bohai Sea show an obvious seasonal variation: northerly winds prevail in winter and southeasterly winds in summer (Figure 2). The model includes ten rivers, among which the Yellow River, Liaohe River, Luanhe River, Haihe River are located in the study area (Figure 1b). The daily discharge of the Yellow River in 2022 was obtained from the Lijin station (Figure 3). We use the wind stress and Yellow River discharge in 2022 because we possess the observational salinity data in the southern Bohai Sea in 2022, and WSRS was also implemented in 2022. The monthly river discharges from other rivers were derived from Chen [1992]. The monthly heat flux (da Silva et al., 1994a), precipitation and evaporation (da Silva et al., 1994b) were used in the model, all with a spatial resolution of 1° × 1°. Along the lateral open boundary, monthly temperature, salinity, subtidal currents, and sea level elevation were calculated using a nested model (Guo et al., 2003). Four major tidal constituents (M2, S2, K1, and O1) provided by NAO.99b (Matsumoto et al., 2000) were linearly interpolated and superposed onto the subtidal currents, which is the same as Wang et al. (2008).
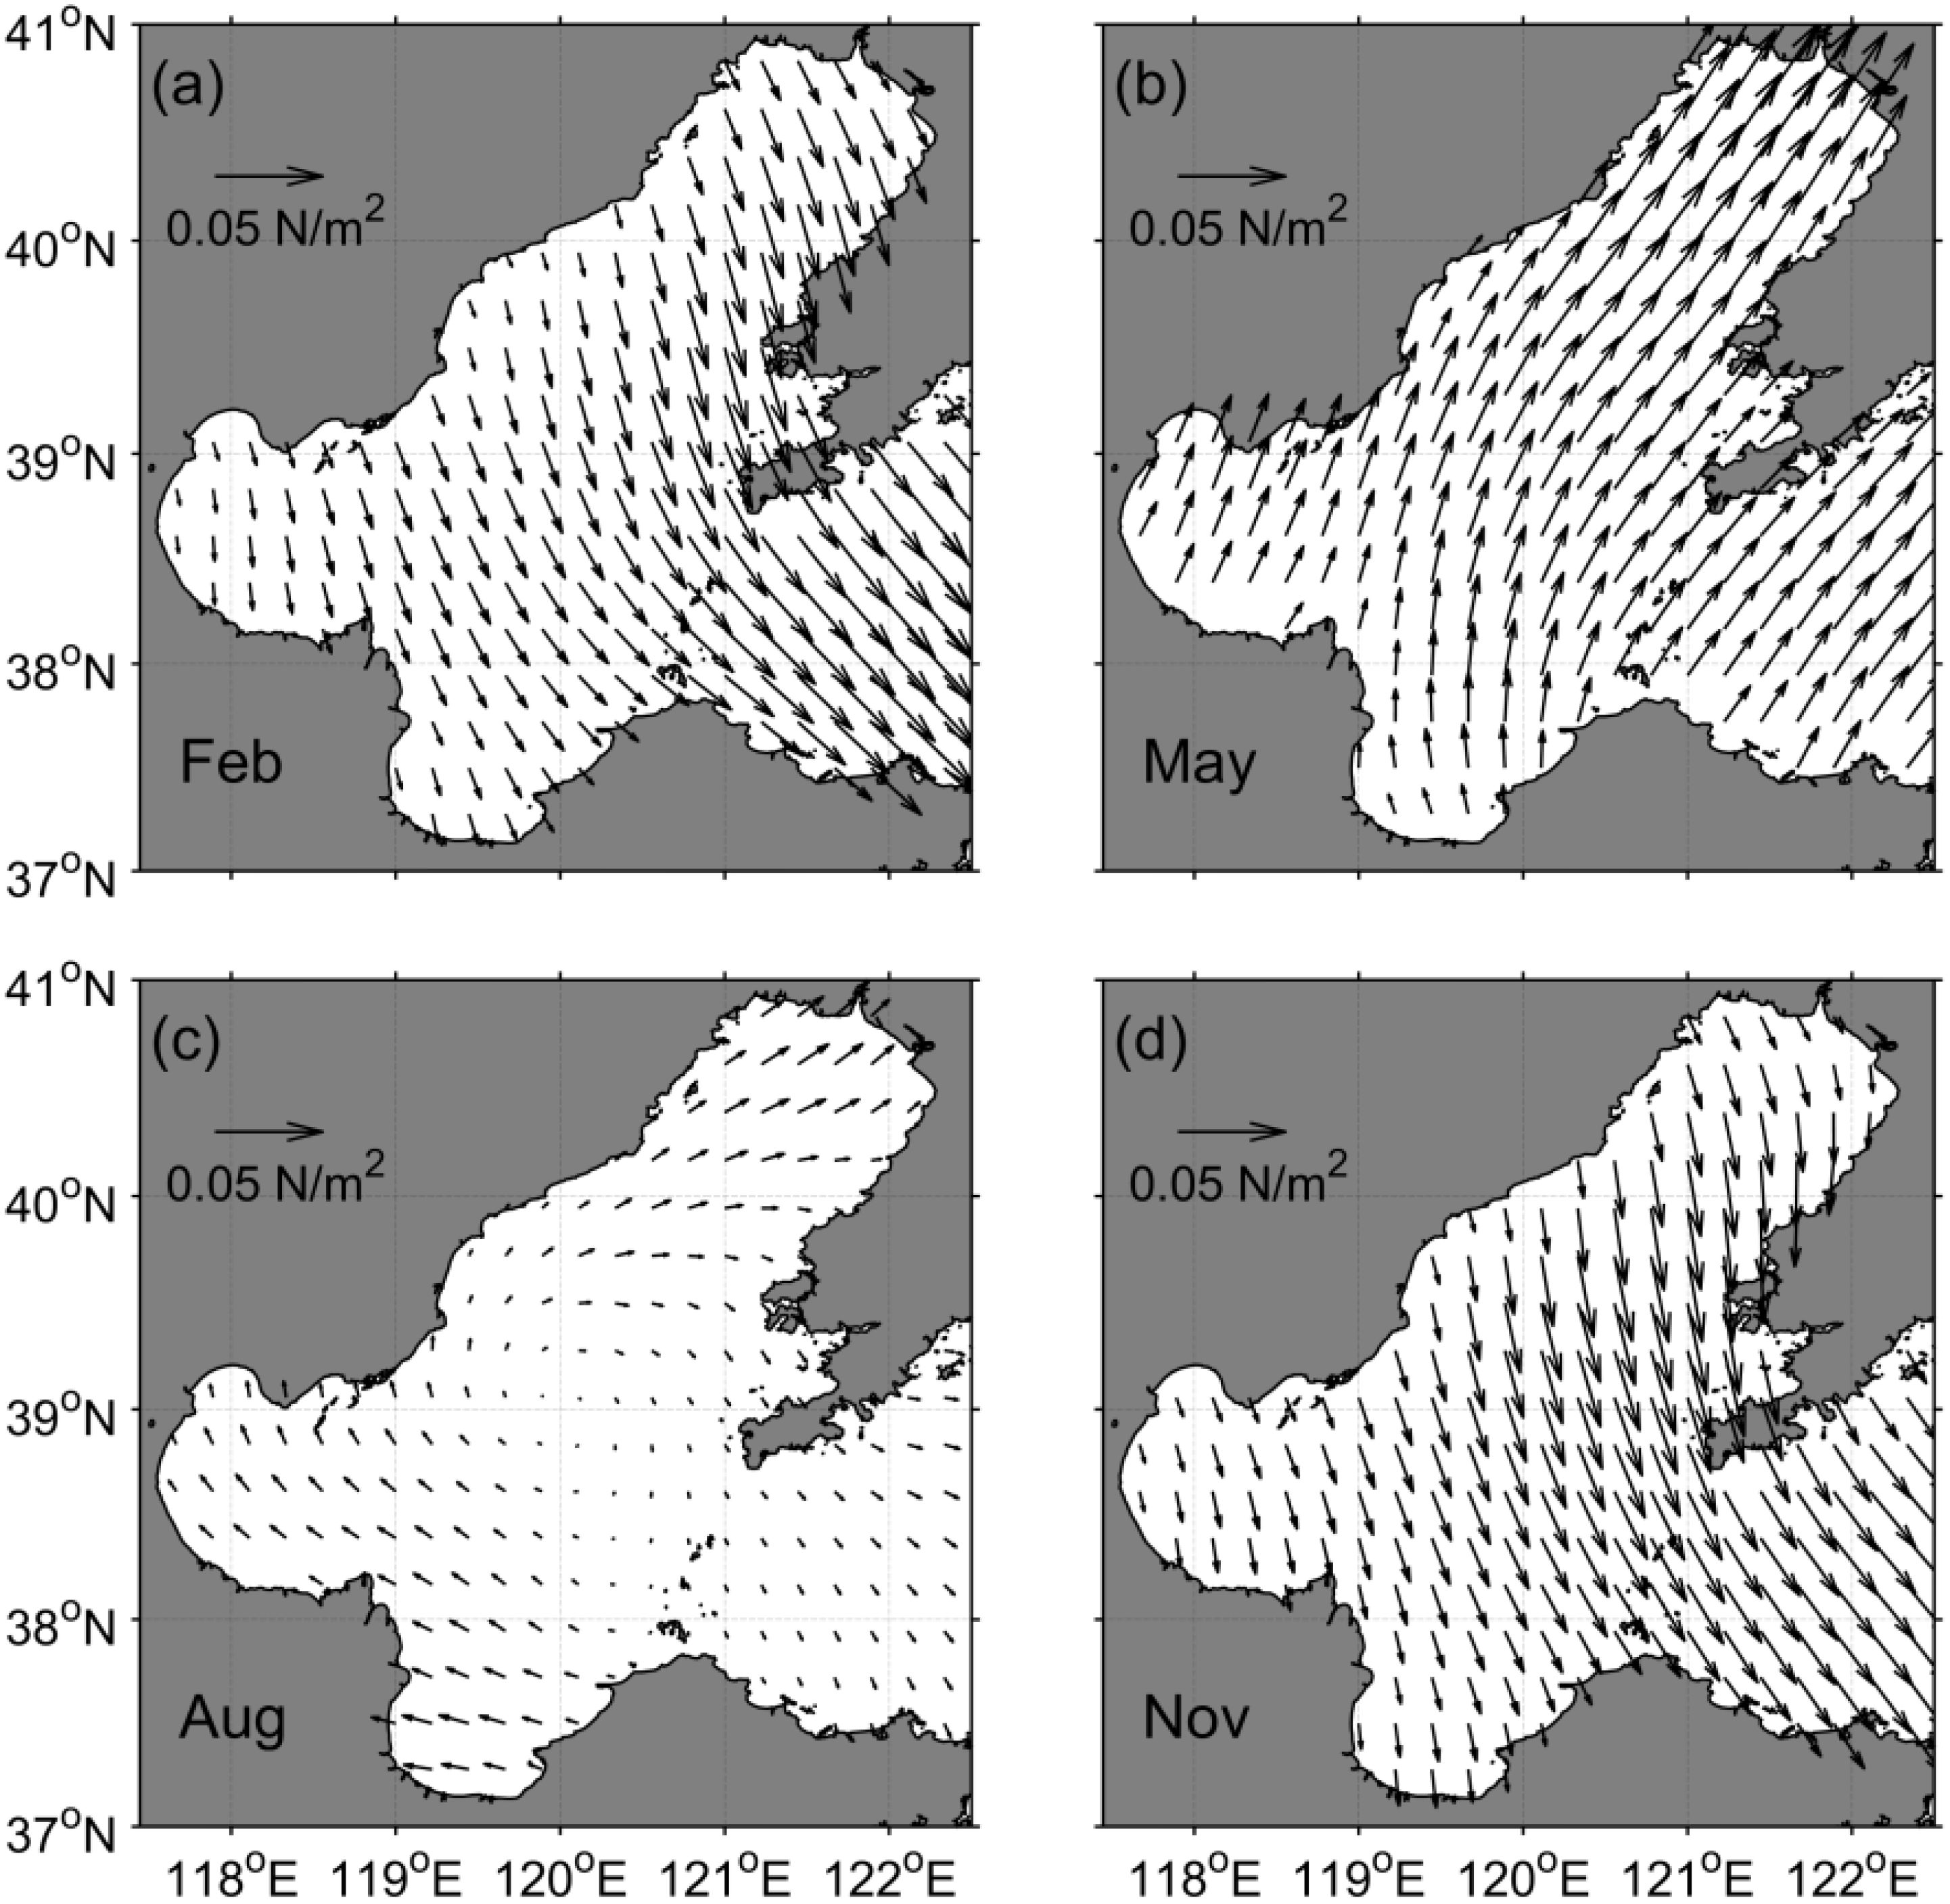
Figure 2. Monthly mean wind stress over the Bohai Sea in (a) February, (b) May, (c) August, and (d) November 2022.
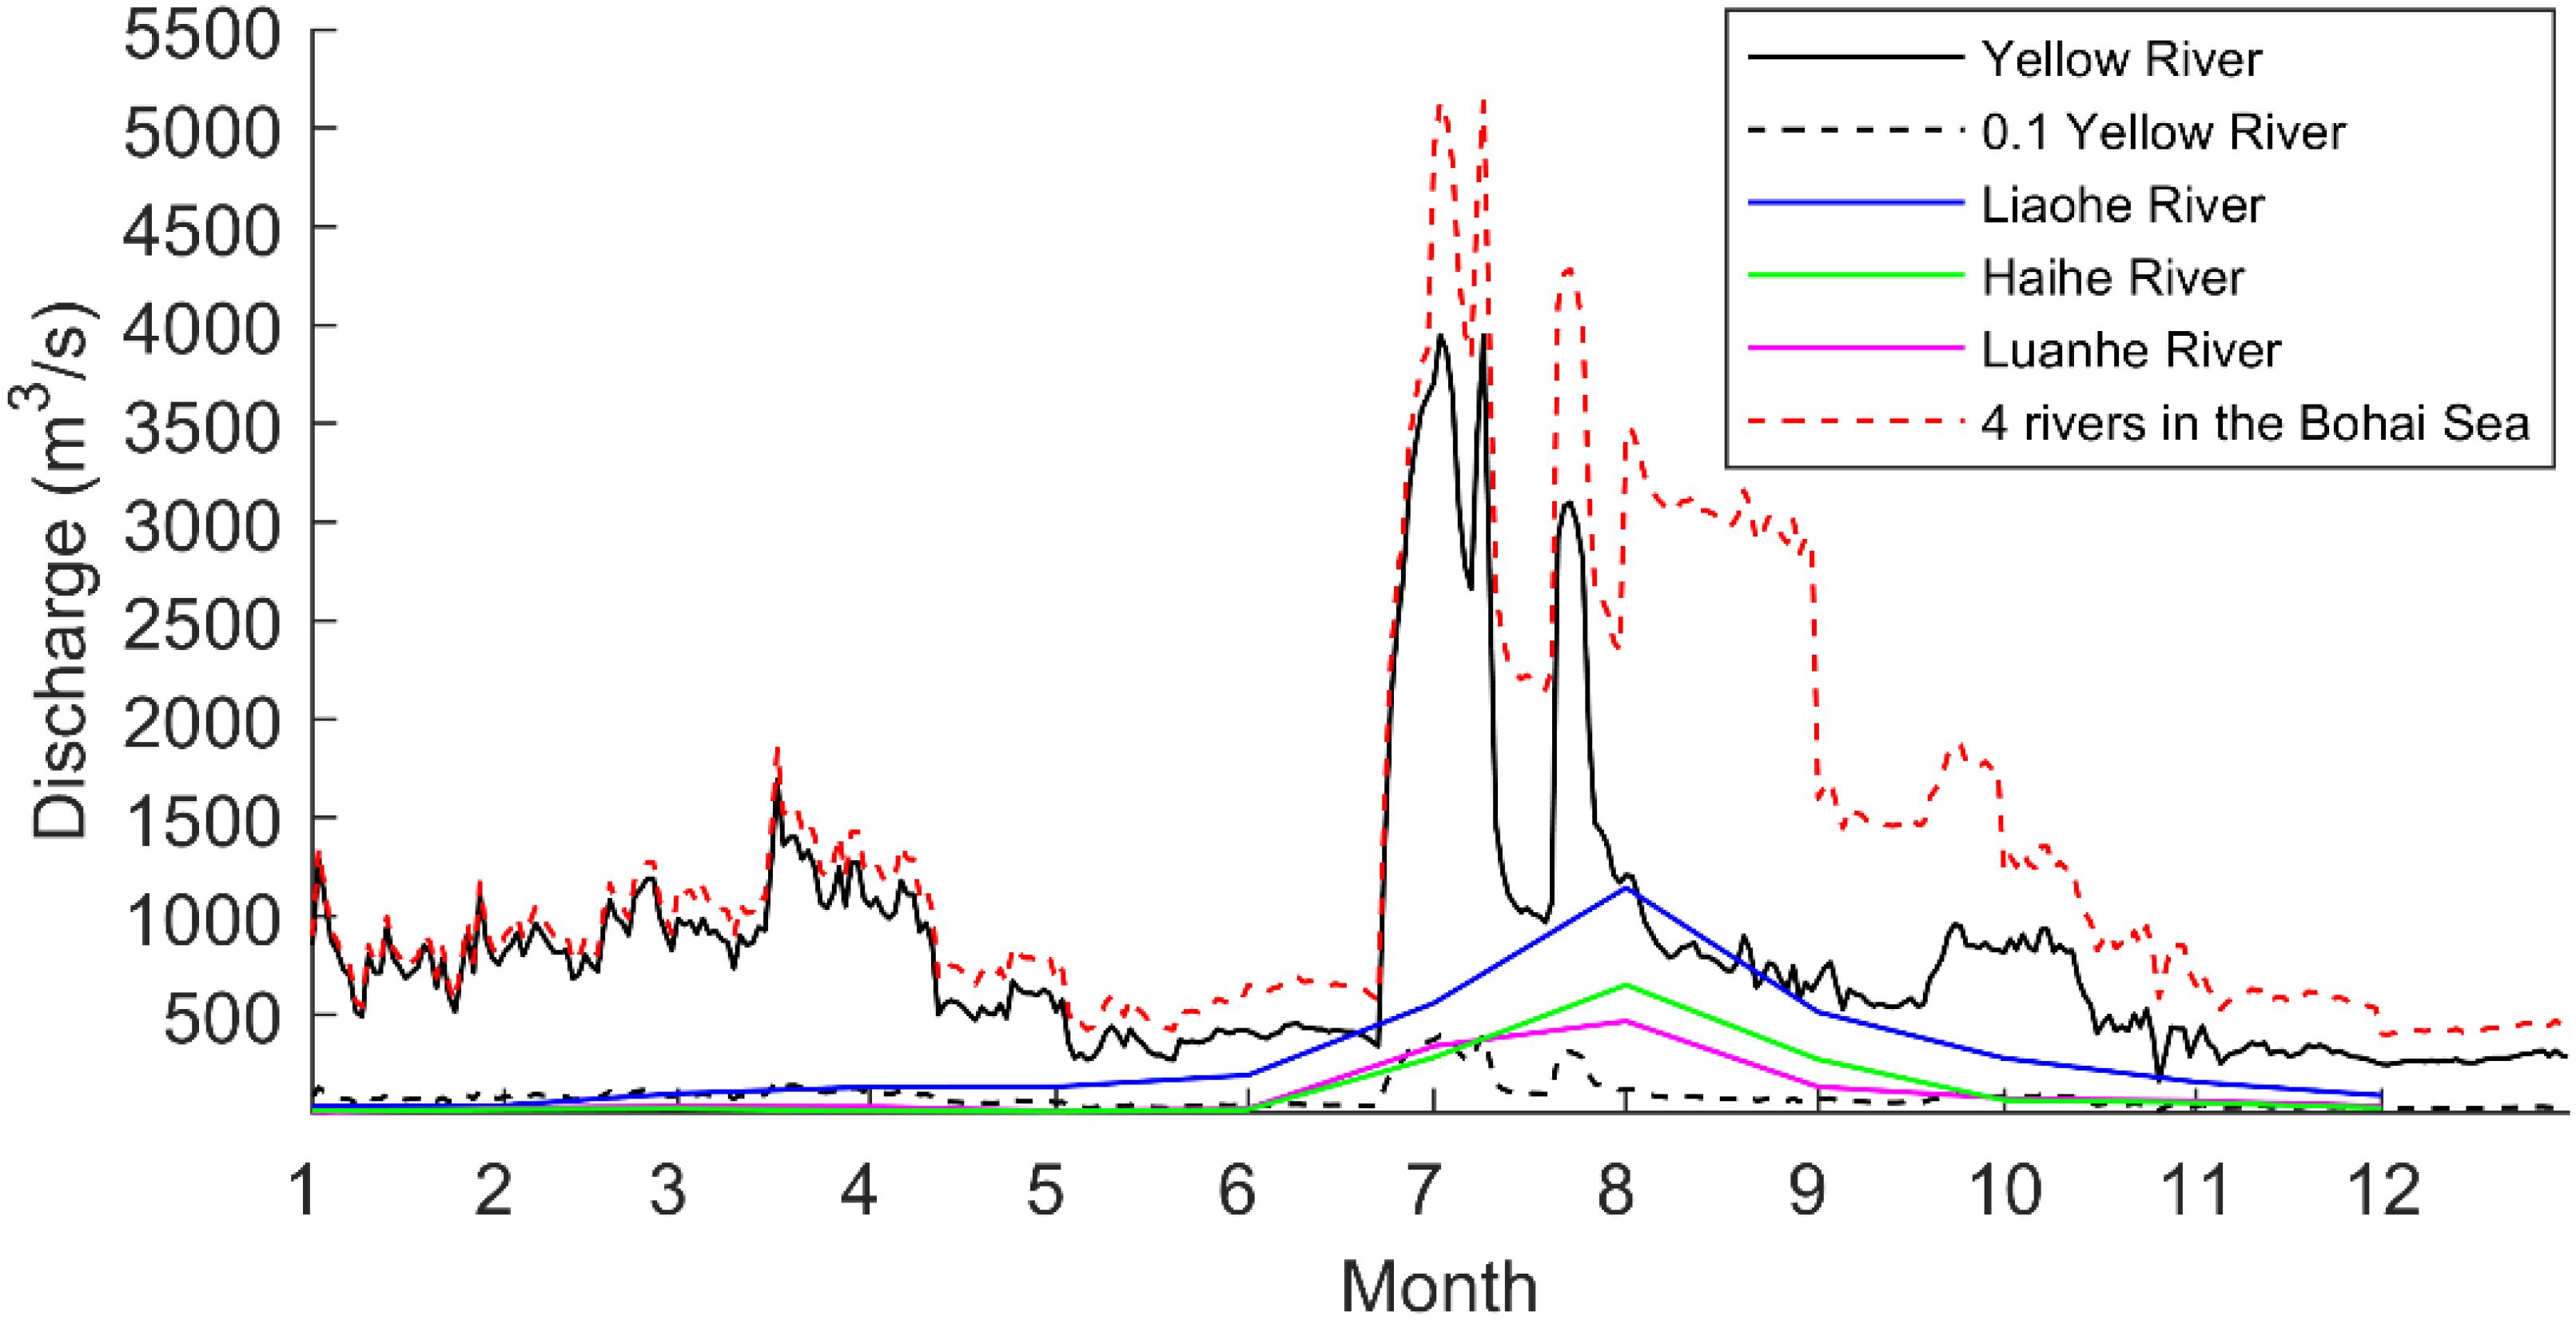
Figure 3. River discharge of four rivers into the Bohai Sea. The black dashed line represents the Yellow River discharge used in Case 5, scaled down to one-tenth of its original value. The red dashed line represents the total runoff of the four rivers.
The model simulation commenced from a state of rest, utilizing water temperature and salinity data on December 1 from Guo et al. [2003] as the initial conditions. We kept running the model for 3 years using the same forcing conditions mentioned above, and a quasi-equilibrium state was reached after one year of calculation. The model results were saved hourly and then filtered to remove tidal signals (Hanawa and Mitsudera, 1985).
3 Result
3.1 Seasonal variation of surface water temperature, salinity, and residual current in the Bohai Sea
The water temperature in the Bohai Sea varies with the seasons (Figures 4a–d). Influenced by the water depth, the coastal region warms up more rapidly in spring. The temperature is relatively high at the heads of Laizhou Bay, Bohai Bay, and Liaodong Bay, and low in the central region of Bohai Sea. In summer, the maximum water temperature of the Bohai Sea is about 29 °C. The temperature is slightly lower in the central Bohai Sea. In autumn, the coastal region is cooled faster than the offshore area, resulting in lower water temperature than the offshore area. In winter, the water temperature in the northern part of Liaodong Bay and the western part of Bohai Bay is below 0°C, while the temperature in the central region of the Bohai Sea and the Bohai Strait is about 4°C. This distribution is caused by a high-water temperature tongue that intrudes from the Yellow Sea through the northern Bohai Strait. The above seasonal variations in the water temperature given by the model are consistent with previous models and observations (Wang et al., 2008; Liu et al., 2003). It is worth noting that there is no sea ice module in this model. In winter, there is an area with floating ice in Liaodong Bay, but its impact on the water flux in the Bohai Strait is small (Zhang et al., 2019).
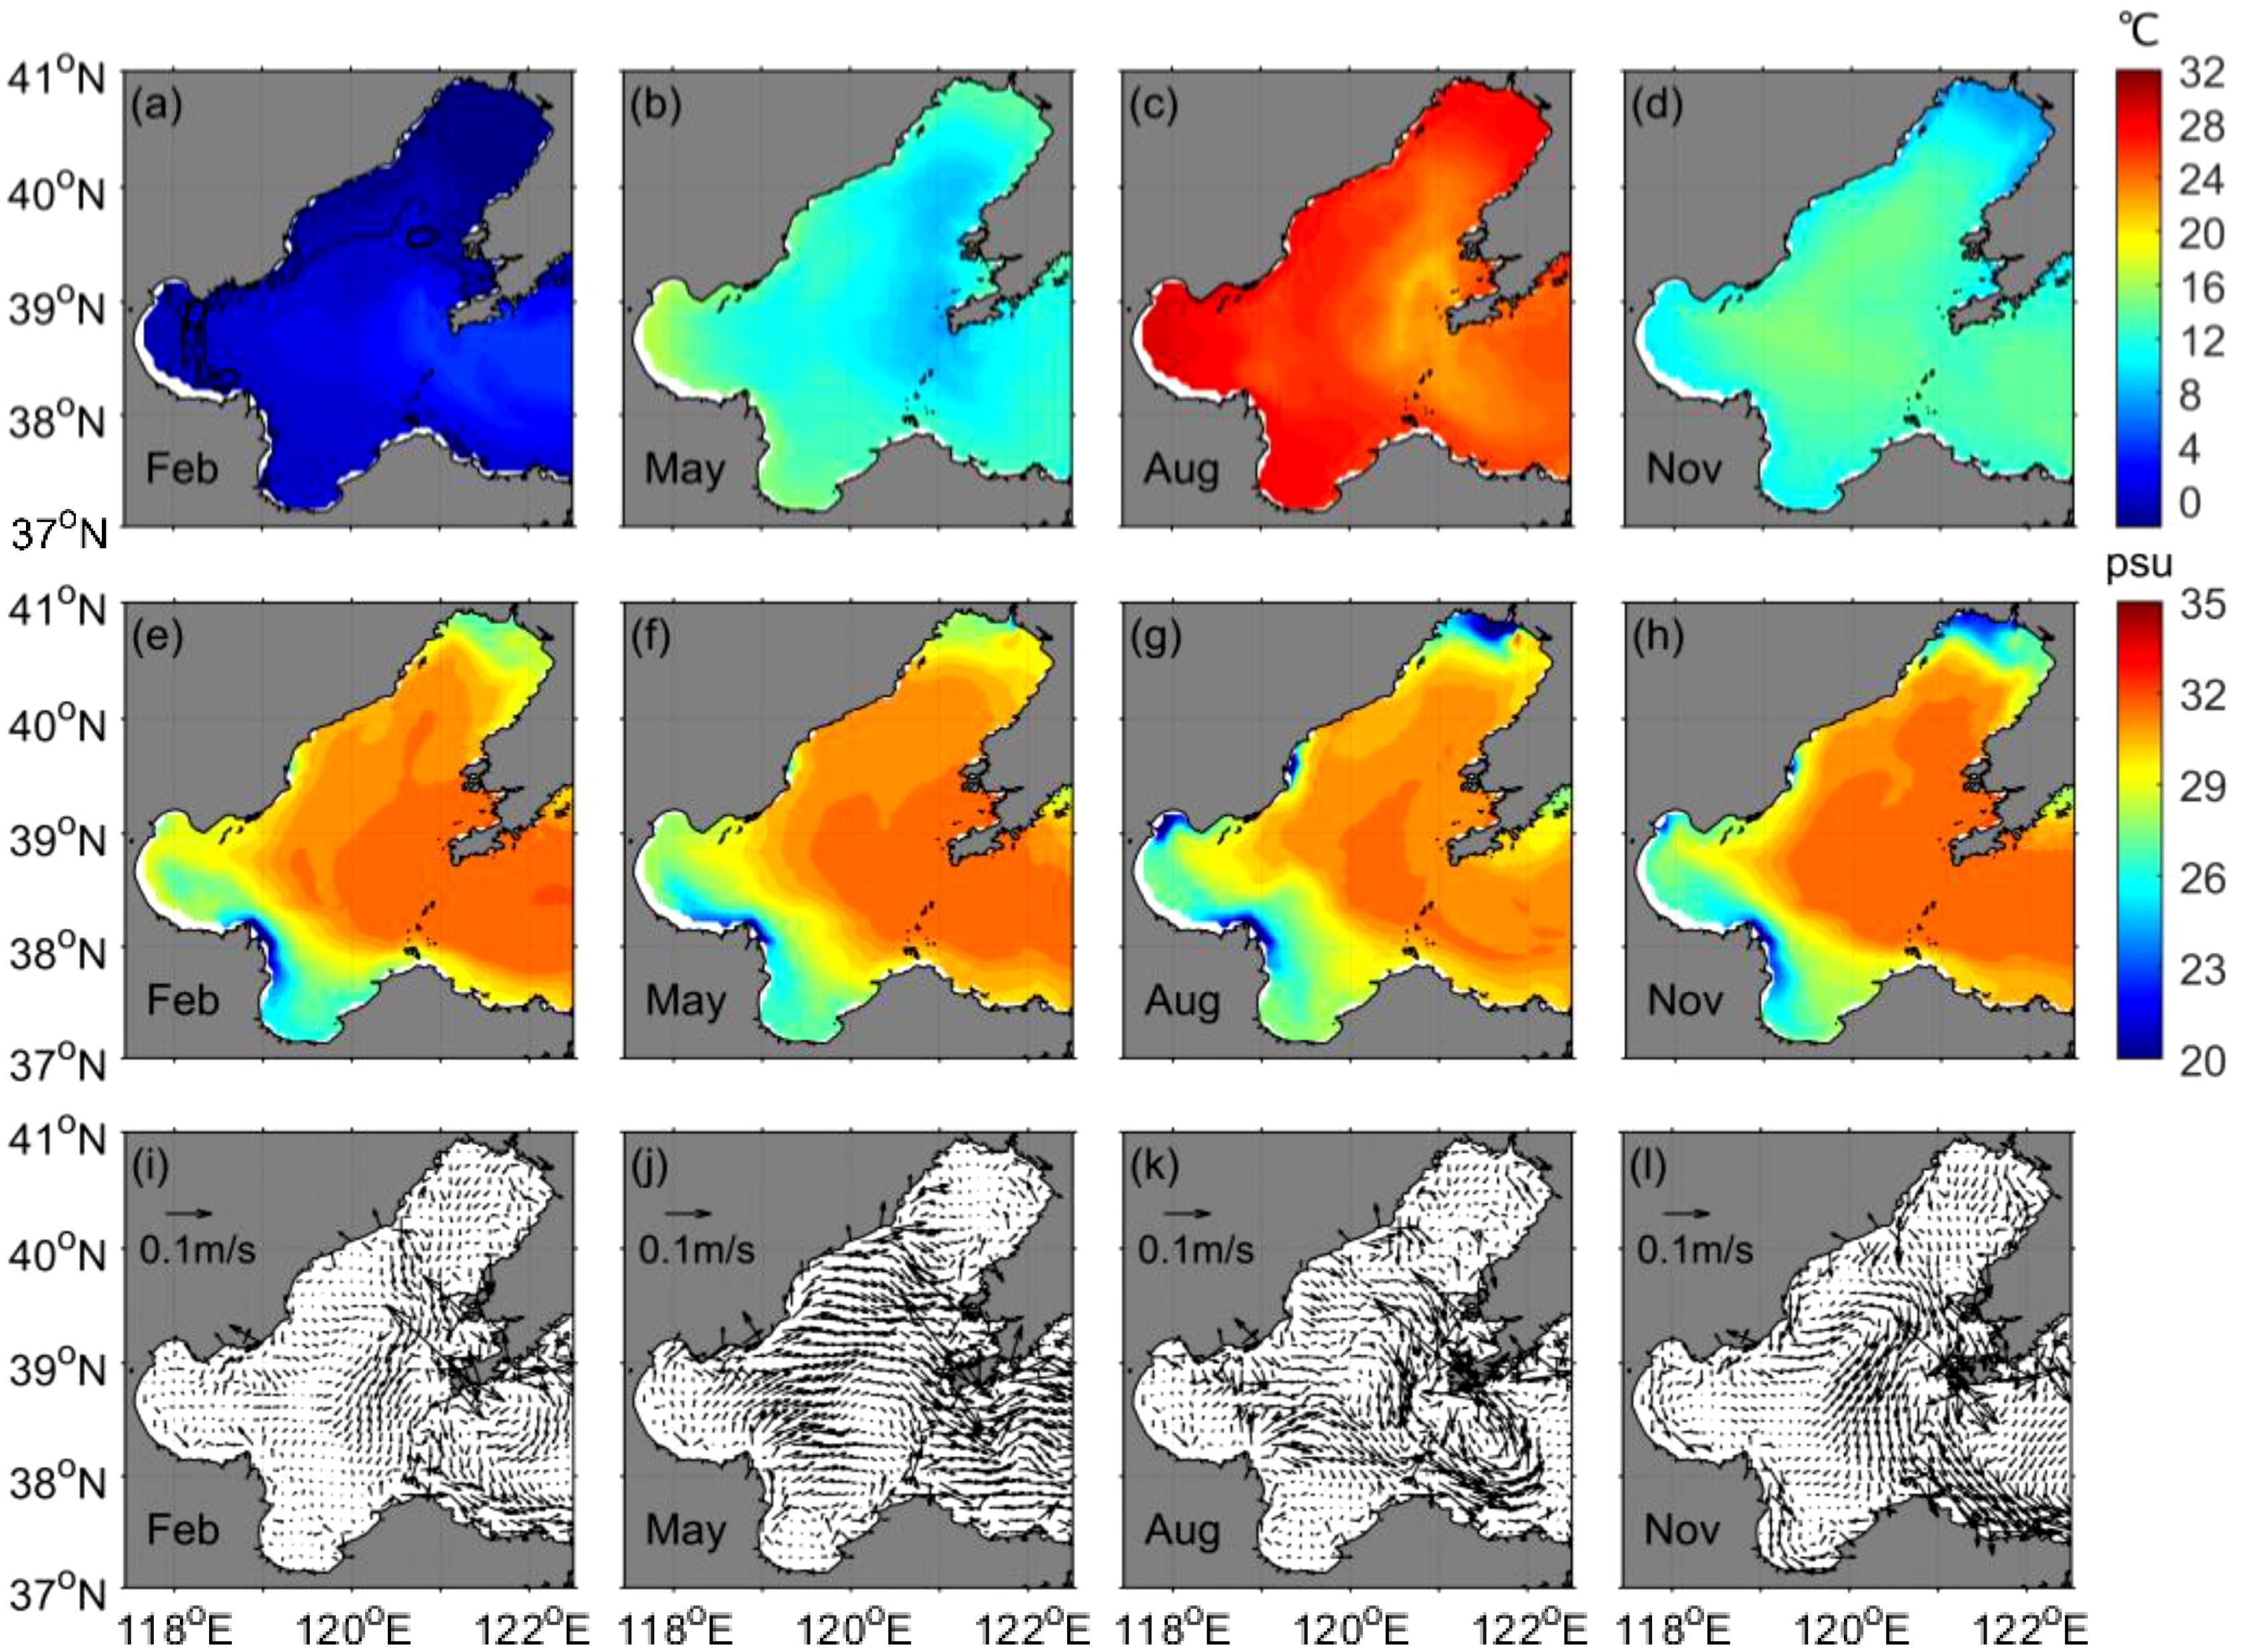
Figure 4. Horizontal distribution of monthly averaged (a-d) surface water temperature, (e-h) surface salinity, and (i-l) surface residual current in winter, spring, summer, and autumn in the Bohai Sea. February, May, August, and November serve as the representative months for winter, spring, summer, and autumn, respectively.
The salinity in the Bohai Sea is mainly affected by the Yellow River and Liaohe River (Figures 4e–h). The extension direction of the Yellow River plume varies with seasons. In winter, driven by the northerly wind, the Yellow River plume extends into Laizhou Bay. In spring, under the influence of tide-induced residual current, the low-salinity water from the Yellow River propagates northwestward to the southeastern Bohai Bay (Yu et al., 2021). In summer, influenced by the southerly wind, lower-salinity water expands northeastward to the central Bohai Sea. In autumn, when wind turns southward, low-salinity water moves southward along the coast of Laizhou Bay. The discharge of Liaohe River is largest in summer, inducing low salinity around the head of Liaodong Bay. Due to the increase in river discharge in summer, the salinity in the Bohai Sea is lowest in summer. The high salinity (>30 psu) area in the central Bohai Sea is larger in autumn and winter than in summer. Besides the river runoff, the salinity in the central Bohai Sea is also influenced by the intrusion of high-salinity water from the Yellow Sea via the northern Bohai Strait. The seasonal variations in the surface salinity given by the model are consistent with previous model results and observations (Wang et al., 2008; Liu et al., 2003).
The residual current in the Bohai Sea is affected by the monsoon (Figures 4i–l). In winter, the prevailing northwesterly winds over the Bohai Sea (Figure 2a) induce southwestward currents in the surface layer, and the current velocity is below 5 cm/s in most areas. The surface residual current flows out of the Bohai Sea through the southern channel of the Bohai Strait and into the Bohai Sea from the northern channel of the strait. In spring, the south-southwesterly winds prevail over the Bohai Sea (Figure 2b), generating east-northeastward surface residual currents over most of the Bohai Sea. Compared with winter, the circulation is enhanced in spring with a speed of about 6 cm/s in most areas and the surface flow is mainly eastward in the Bohai Strait. Influenced by the southeasterly winds (Figure 2c), the Yellow River plume extends northeastward in summer. Eastward residual currents exist at the southern channel and westward currents in the northern channel of the Bohai Strait. In autumn, the winds turn southward in the Bohai Sea, inducing southward residual current in the surface layer. The circulation in the Bohai Sea and Bohai Strait in autumn is similar to that in winter but its magnitude is stronger. Throughout the year, the eastward residual current in the southern strait is strongest in summer with a speed up to 10 cm/s.
3.2 Vertical distribution of water temperature, salinity, and residual current in the Bohai Strait
In the Bohai Strait, the water temperature is vertically homogeneous in autumn and winter and stratified in the northern channel in spring and summer (Figures 5a–d). The water temperature is lowest in winter (-0.8°C) and highest in summer (26.7°C). Salinity is nearly vertically homogeneous except for the northern channel in summer (Figures 5e–h). Although the Yellow River discharge is not the largest in winter (Figure 3), the salinity in the southern channel of the strait is the lowest (~ 28.7 psu) in winter (Figure 5e). Similarly, although the Yellow River discharge is highest in summer, the salinity in the southern channel is not the lowest (~ 30.5 psu) (Figure 5g). The structures of water temperature and salinity at the strait given by the model are basically consistent with the observations of Wu et al. (2019) and Zhang et al. (2010).
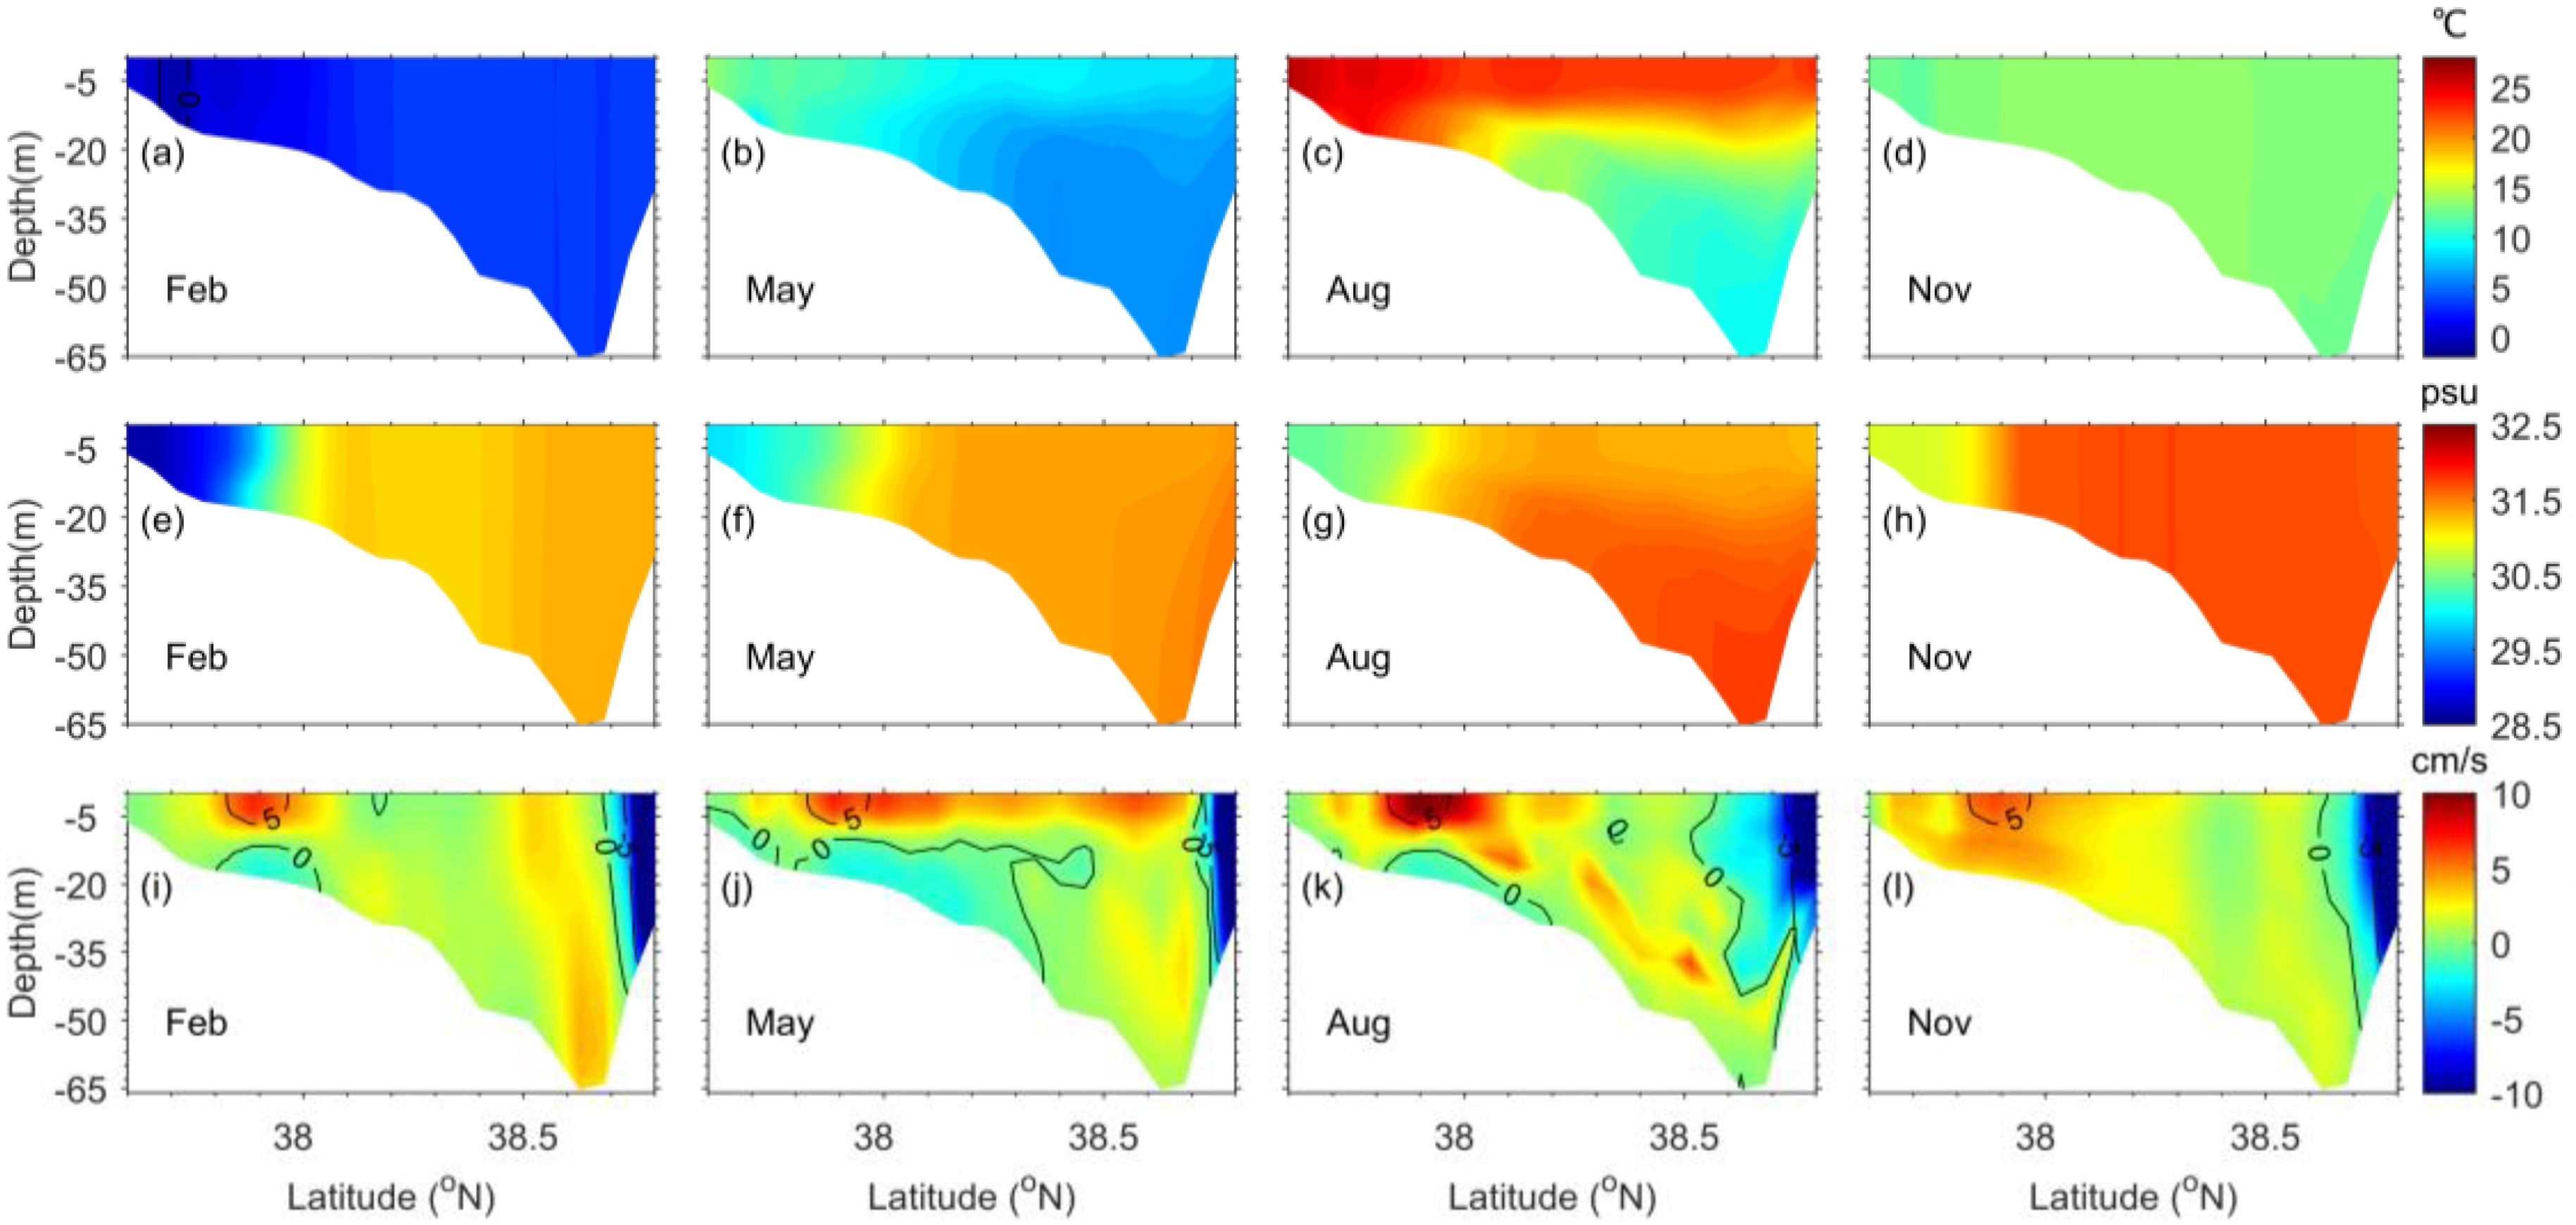
Figure 5. Vertical distributions of monthly averaged (a-d) water temperature, (e-h) salinity, and (i-l) normal component of residual current in the Bohai Strait (blue line in Figure 1b). Positive values of residual current indicate eastward current, while negative values mean westward current through the strait.
The residual current in the strait includes two parts: a westward current in the narrow area of the northern strait, and a two-layered current in the wide southern strait (Figures 5i–l). However, during the autumn season, the current in the southern strait is exclusively oriented eastward. The westward current in the northern strait exhibits considerable strength, with a maximum speed of ~31.6 cm/s, and demonstrates little seasonal variation. The two-layered current in the southern strait shows a strong outflow in the surface layer and a weak inflow in the bottom layer. The surface outflow is strongest in summer, with a maximum speed of 10.4 cm/s. The bottom inflow is at its peak in spring and weaker in summer and winter. This “north-in and south-out” water exchange structure is generally consistent with the previous modeling studies (Ji et al., 2019; Liu et al., 2021). The weak inflow at the bottom layer of the southern strait was observed in May by Wu et al. (2019).
3.3 Water flux through the Bohai Strait
In order to assess the seasonal variation of water flux through the Bohai Strait, we calculate the net water flux, outflow flux, and inflow flux through the Bohai Strait using the following formula during the model run, and then de-tide the hourly output of water flux.
Where u is the horizontal velocity that is oriented perpendicular to the Bohai Strait section, h is the bottom depth, is the surface elevation, the integration in the y direction is from the south to the north along the full section across the Bohai Strait, is the sigma coordinate and the integration is from the sea surface to the sea bottom.
The volume transport of the outflow is strongest (9.49×10⁴ m3/s) in September and weakest in November (5.88×10⁴ m3/s), with an annual average of 7.09×10⁴ m3/s (Figure 6a). The volume transport of the inflow is similar, strongest (9.38×10⁴ m3/s) in September and weakest in November (5.65×10⁴ m3/s) (Figure 6b). The annually averaged transport of inflow is about 7.04×10⁴ m3/s which is slightly smaller than the annual mean of outflow. The net volume transport through the strait has an annual mean of 470 m3/s (Figure 6c). The seasonal variation of the net water flux through the strait is different from that of the outflow and inflow but bears similarity to that of sum of the river discharges into the Bohai Sea (red dashed line in Figure 3). The net water flux after 15-day running mean is largest (0.46×10⁴ m3/s) in July, and smallest (-0.39×10⁴ m3/s) in December. The half-month oscillation of the water flux in Figure 6 is caused by the fortnightly variation of tides.
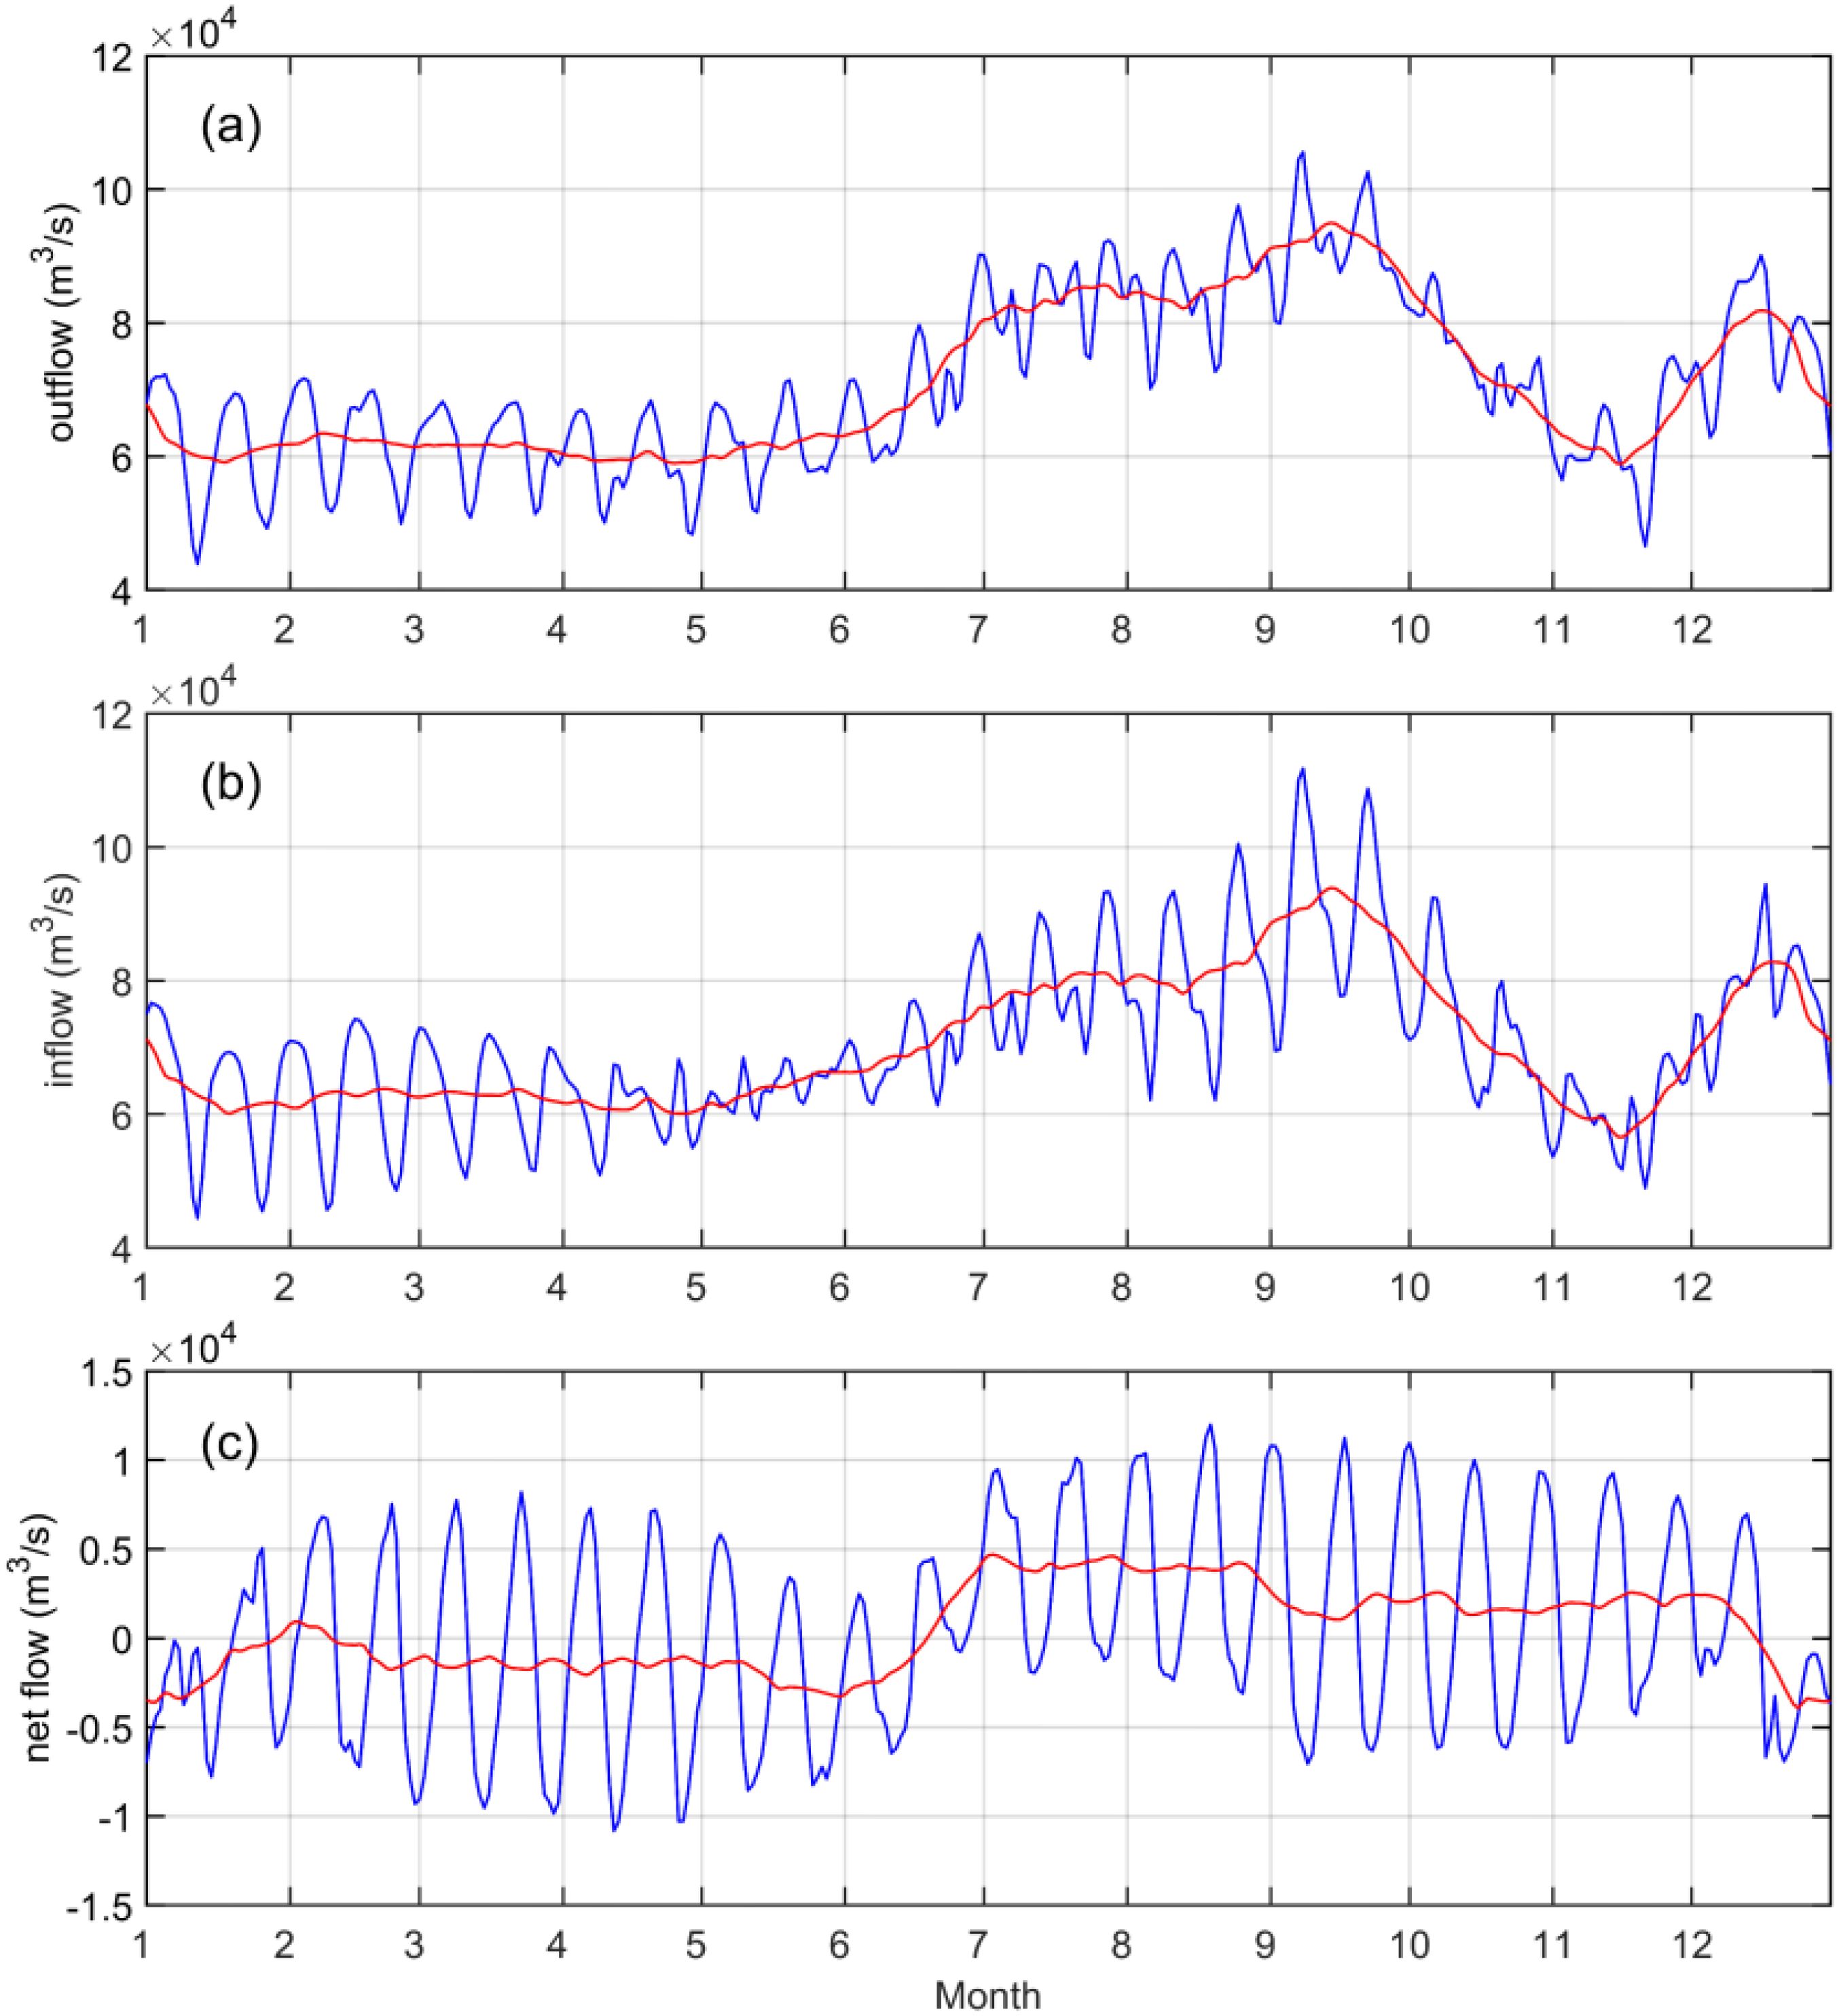
Figure 6. Time series of daily (a) outflow flux, (b) inflow flux, and (c) net water flux through the Bohai Strait (blue lines), and their 15-day running mean (red lines).
4 Discussion
4.1 Contribution of tide, wind, and baroclinic effects on water exchange through the Bohai Strait
In order to investigate the formation of the residual current structure in the Bohai Strait, we separate the residual current into the tide-induced residual current, wind-driven current, and density-driven current through five numerical experiments (Table 1). Case 1 is the control case, whose results have been presented in Section 3. Case 2a is driven by tide only. In case 2a, the temperature is fixed at 10°C, the salinity at 32 psu, and both the residual current and surface elevation at the open boundary are fixed at 0. The results of Case 2a represent the tide-induced residual current. In Case 2b, the open boundary conditions are the same as those in Case 1, and the remaining conditions are consistent with Case 2a. Case 2b is used to be subtracted from Case 3 and Case 4 to obtain the corresponding currents. Case 3 adds the wind stress to Case 2b and the difference between Case 3 and Case 2b represents the wind-driven current under a barotropic condition. Case 4 restarts from the result of Case 1 at the beginning of February, May, August, and November, respectively, and is calculated for one month without wind stress. Consequently, the difference between Case 1 and Case 4 represents the wind-driven current under a baroclinic condition. Additionally, the difference between Case 4 and Case 2b primarily represents the density-driven current in the Bohai Sea.
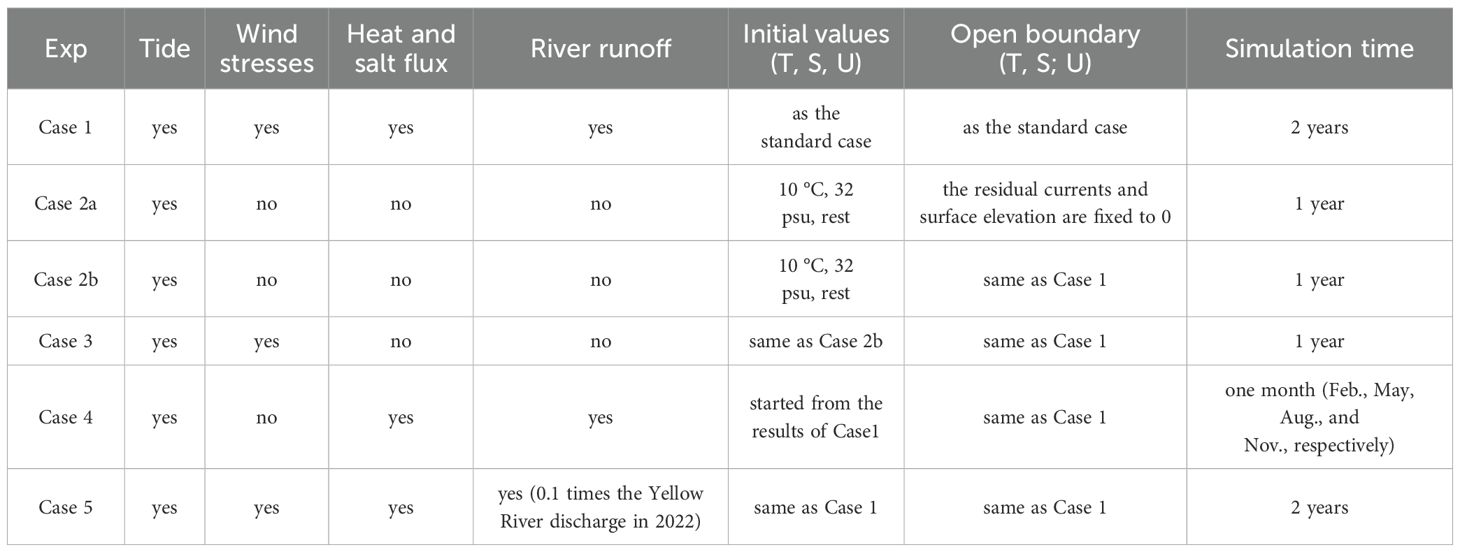
Table 1. List of numerical experiments.
In Case 2a, where tide is the only external forcing, the model result indicates that the seasonal variation of tide-induced residual current is small (Figures 7a–d). A strong westward current, with a maximum current speed of up to 29.88 cm/s, exists in the narrow area close to the northern strait. In the close south of this structure, an eastward current exists, with a maximum velocity of 3.98 cm/s, stronger in the bottom than in the surface layer. This current structure is likely associated with nonlinear effect near the cape. Weak outward currents can be found in the broad area of the southern strait. Consequently, the tide-induced residual current partly contributes to the flow pattern of “north in and south out” in the Bohai Strait.
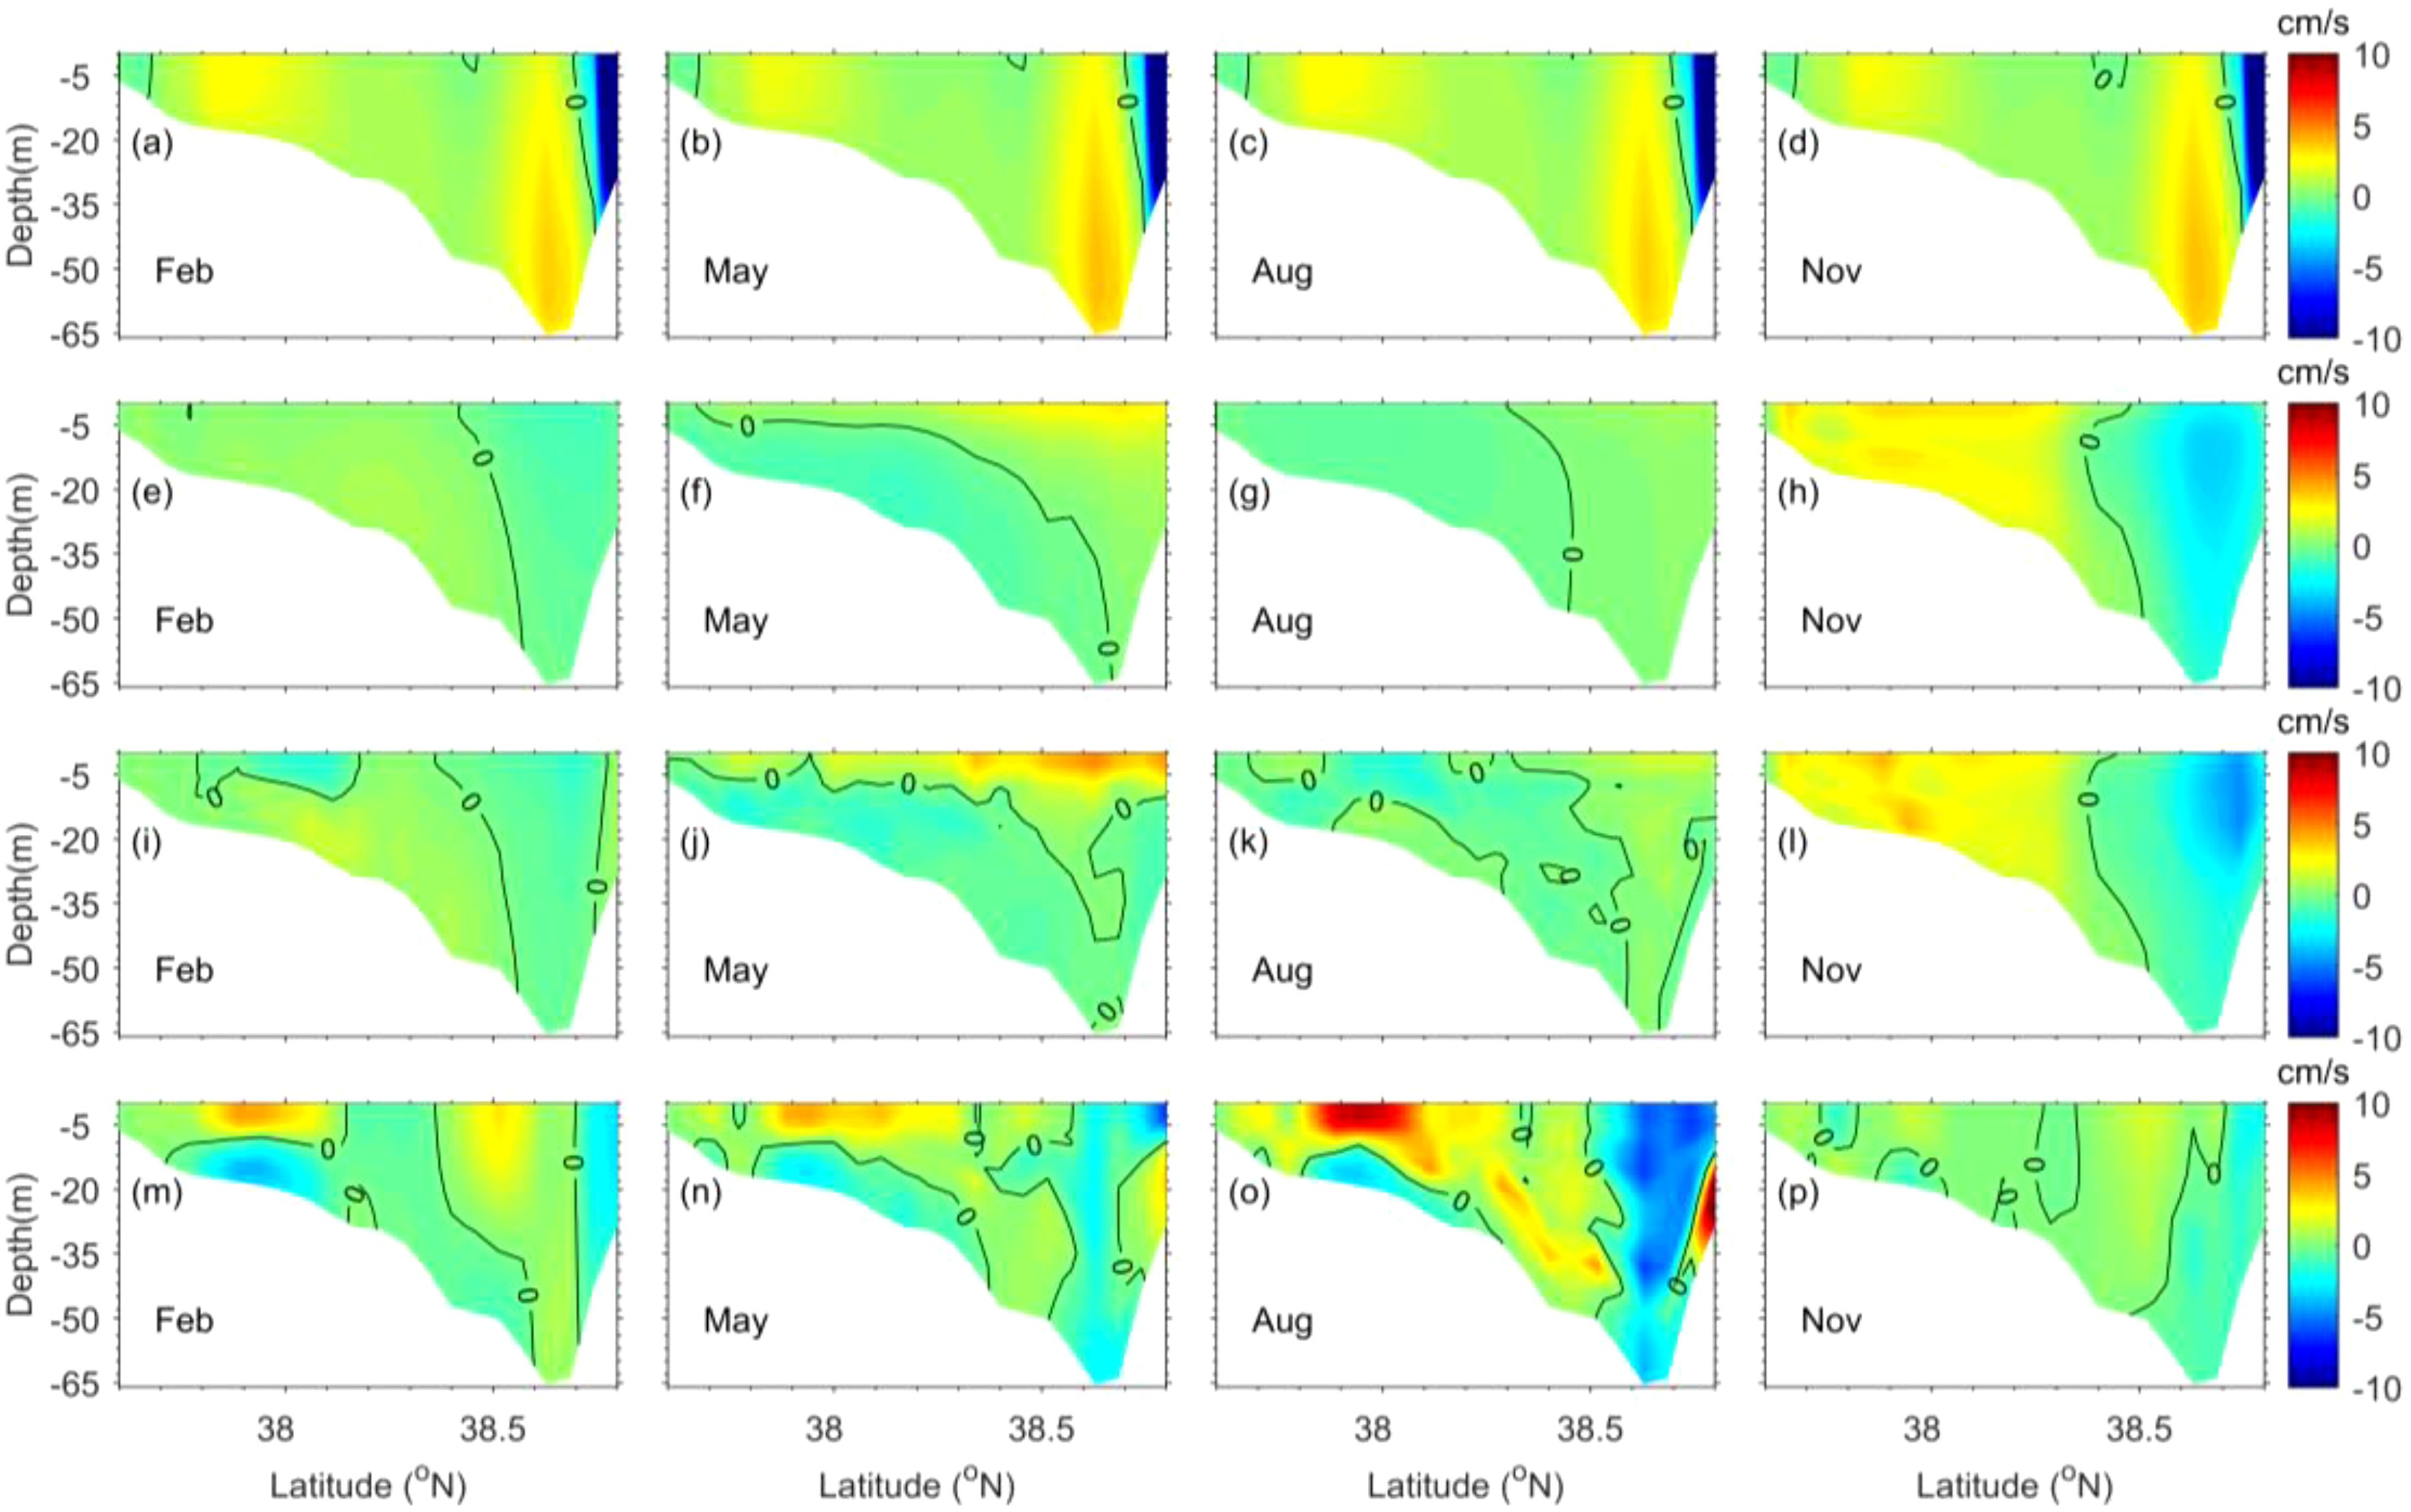
Figure 7. Vertical distribution of monthly averaged (a-d) tide-induced residual current from Case 2a, (e-h) wind-driven current (barotropic condition) from Case 3 - Case 2b, (i-l) wind-driven currents (baroclinic condition) from Case 1 - Case 4 and (m-p) density-driven currents from Case 4 - Case 2b in winter, spring, summer and autumn in the Bohai Strait. Positive value indicates eastward outflow, while negative value means westward inflow through the Bohai Strait.
The characteristics of wind-driven current under barotropic conditions (Figures 7e–h) and baroclinic conditions (Figures 7i–l) exhibit notable similarities, with the latter demonstrating a marginally greater intensity. In autumn and winter, the currents flow westward in the northern area and eastward in the southern area of the strait (Figures 7e, h, i, and l). This current structure is influenced by the prevailing northwesterly wind, which facilitates the movement of seawater from the Bohai Sea towards the southern region of the strait. This process subsequently generates an eastward current in the southern section and a compensatory westward current in the northern section of the strait (Wang et al., 2008). In spring, the current transitions to a two-layer structure, with outflow in the surface layer and inflow in the bottom layer (Figures 7f, j). The magnitude of velocity becomes a little stronger in spring than in winter. In summer, the wind-induced current is relatively weak (Figures 7g, k). The wind-driven current is the strongest in autumn and weakest in summer.
The density-driven current exhibits a more complex structure (Figures 7m–p). The current in the northern part of the strait is characterized by a “north in and south out” flow pattern, which is consistent with Wei et al. (2003). Moreover, it is strongest in summer and weakest in autumn. The current in the southern part of the strait is a two-layered structure in all seasons, which is outward in the surface layer and inward in the bottom layer. The outward current is stronger than the inward current and is strongest in summer and weakest in autumn. This current structure should be induced by the horizontal density gradient in the strait.
Consequently, we conclude that the inflow in the narrow area of northern strait is predominantly induced by the tide-induced residual current. The two-layered structure in the southern strait is primarily induced by the density-driven current. The wholly outward flow in the south in autumn is attributed to the wind-driven current.
We also calculate the monthly averaged water exchange flux through the Bohai Strait induced by the four factors (Figure 8). Compared with the volume fluxes due to other processes, the tide-induced net water flux is small with the largest value of 322 m3/s in spring (Figure 8a); the outflow and inflow fluxes are large but with a weak seasonal variation (Figures 8b, c). The net water flux induced by wind-driven current under both barotropic and baroclinic conditions has the largest value (~1.50×10³ m3/s and ~1.88×10³ m3/s) in autumn. The net water flux induced by density-driven current is significantly stronger in summer (~4.36×10³ m3/s) than in other seasons, and it dominates the net water exchange volume in summer. The outflow and inflow fluxes induced by density-driven current are also greatest in summer, and are larger than fluxes induced by other factors. Consequently, the density-driven current in summer is critical to water exchange through the Bohai Strait.
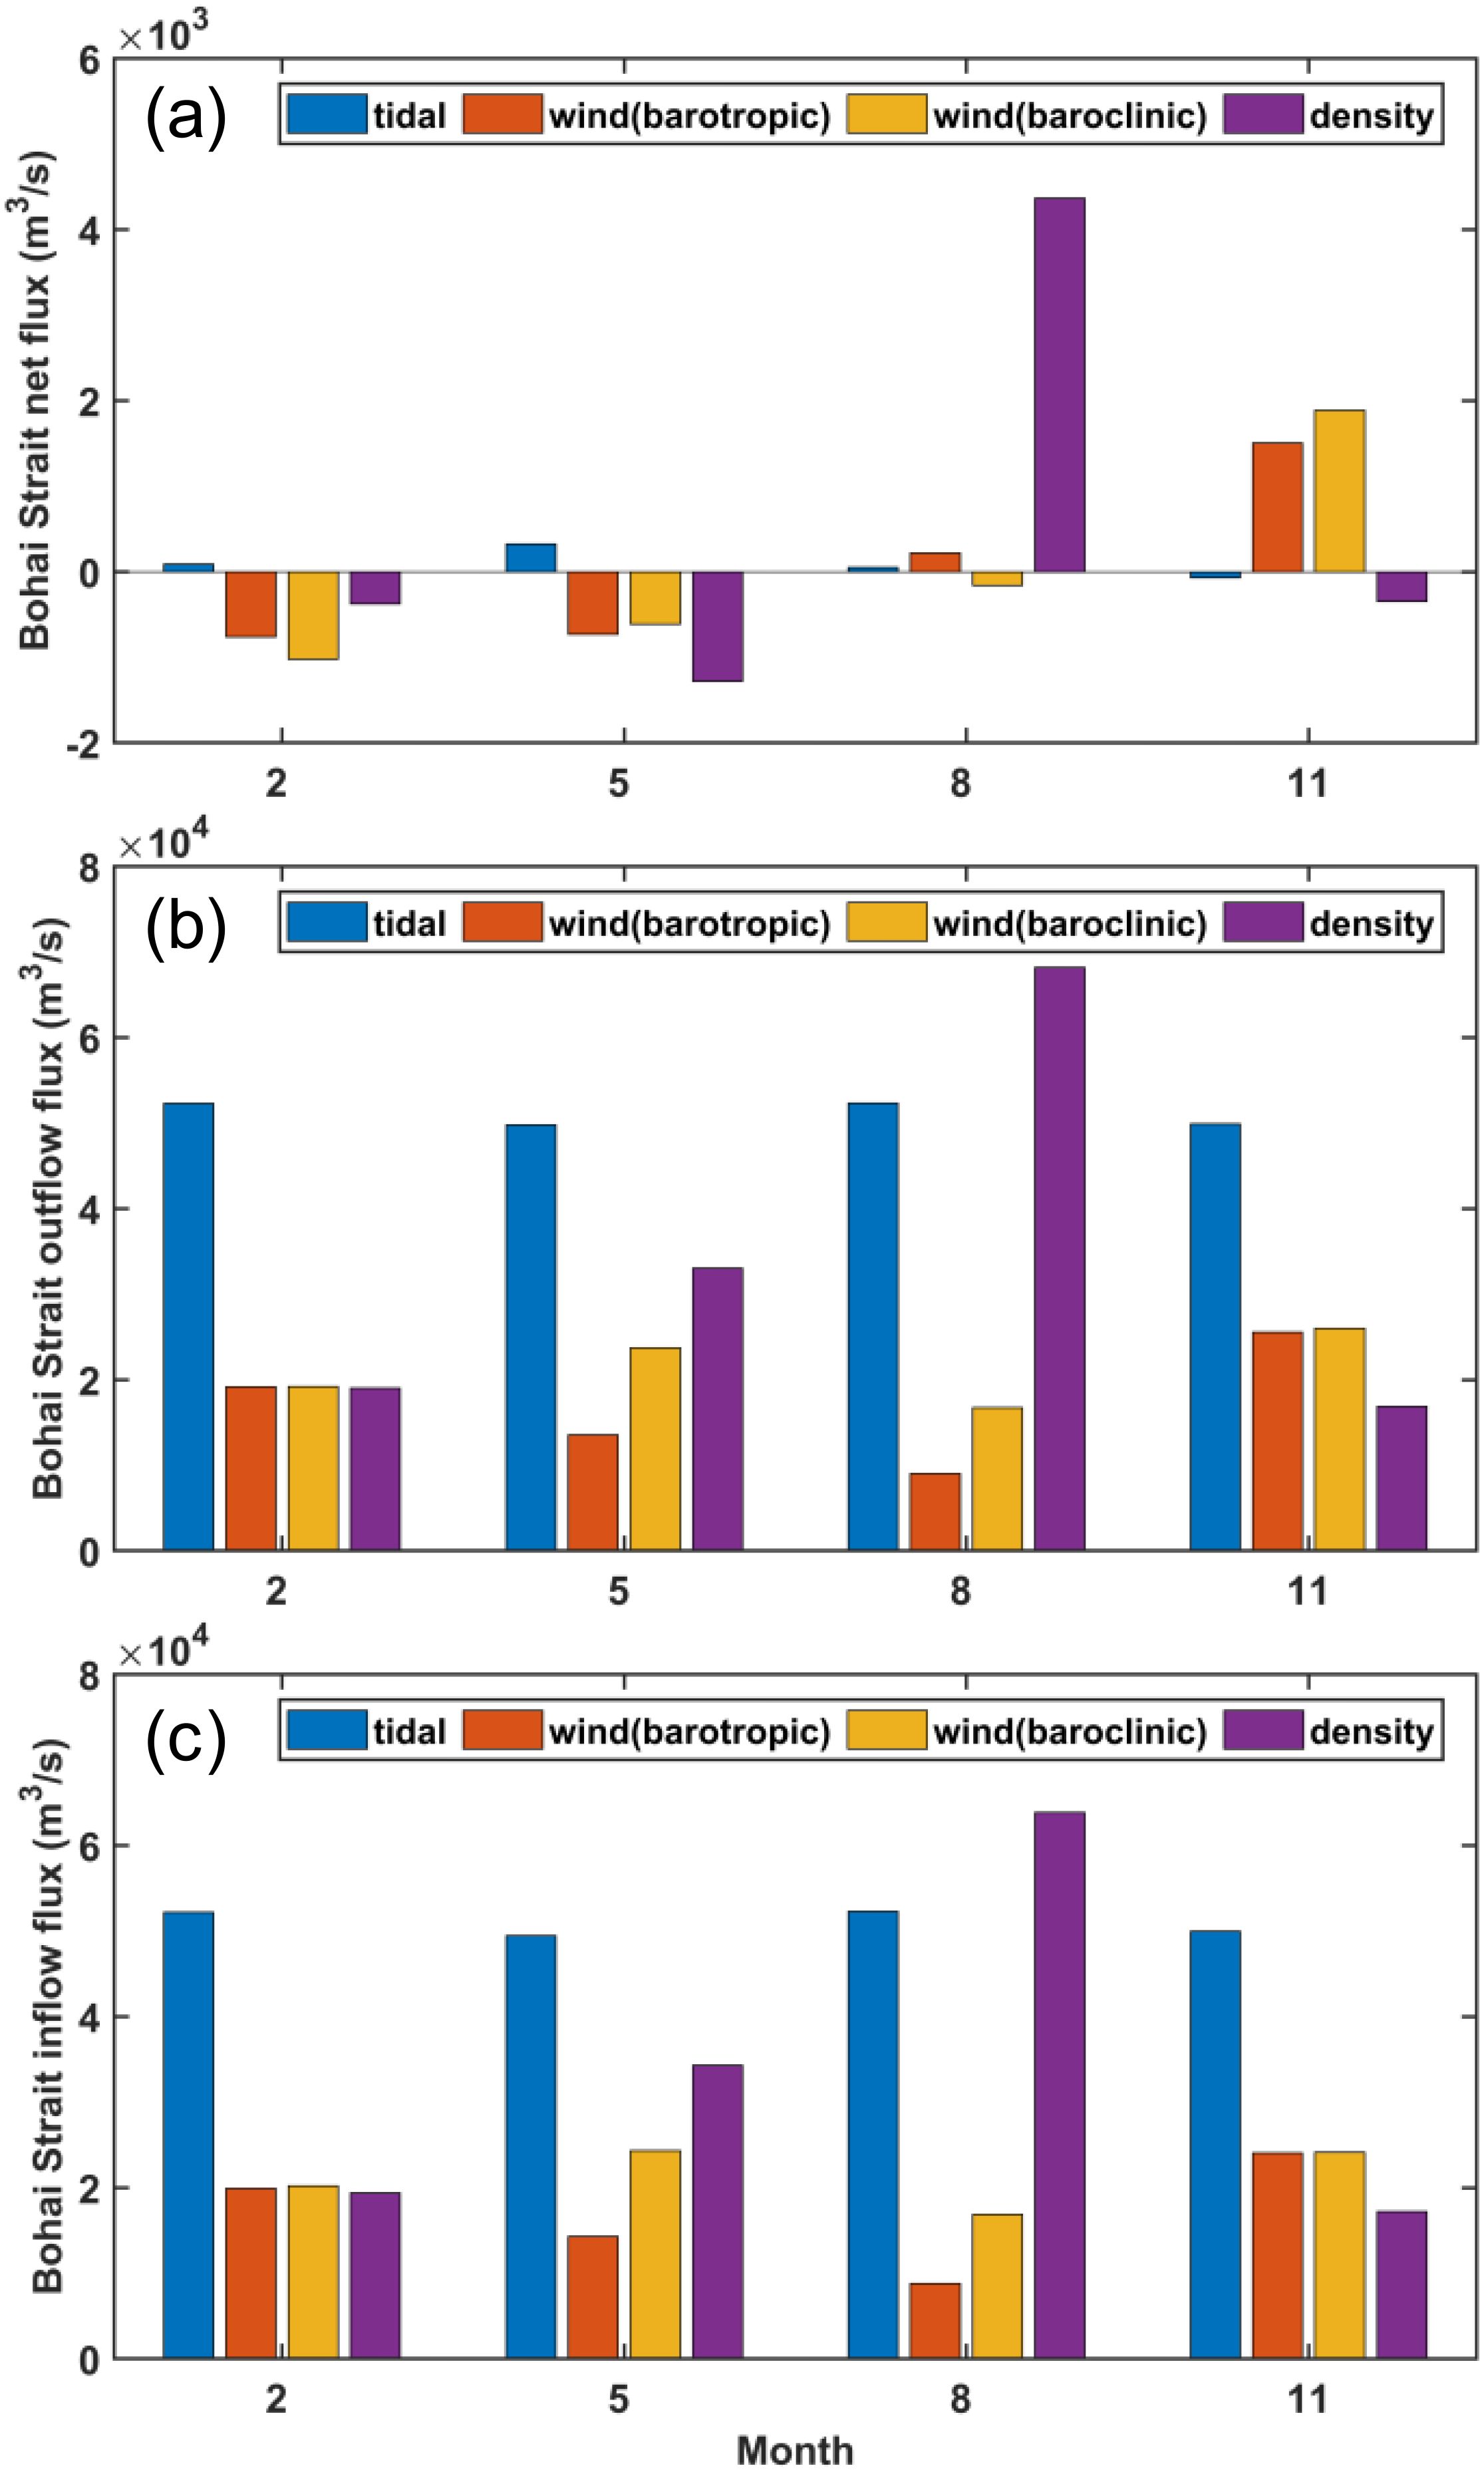
Figure 8. (a) Net water fluxes (Positive values indicate fluxes flowing eastward out of the Bohai Sea, negative values indicate fluxes flowing westward into the Bohai Sea), (b) outflow fluxes and (c) inflow fluxes through the Bohai Strait under different forcing conditions.
4.2 Impact of Yellow River discharge on water exchange through the Bohai Strait
Here, to investigate the response of the Bohai Strait to the Yellow River discharge during the WSRS in 2022, we carried out an additional numerical experiment (Case 5), which uses one tenth of the Yellow River discharge in 2022 but keeps the same other conditions as Case 1. The difference in Yellow River discharge between Case 1 and Case 5 (0.9 times YR discharge, green line in Figure 9a) was largest in July, with a maximum difference of 3555 m3/s. Case 5 also runs for two years as Case 1.
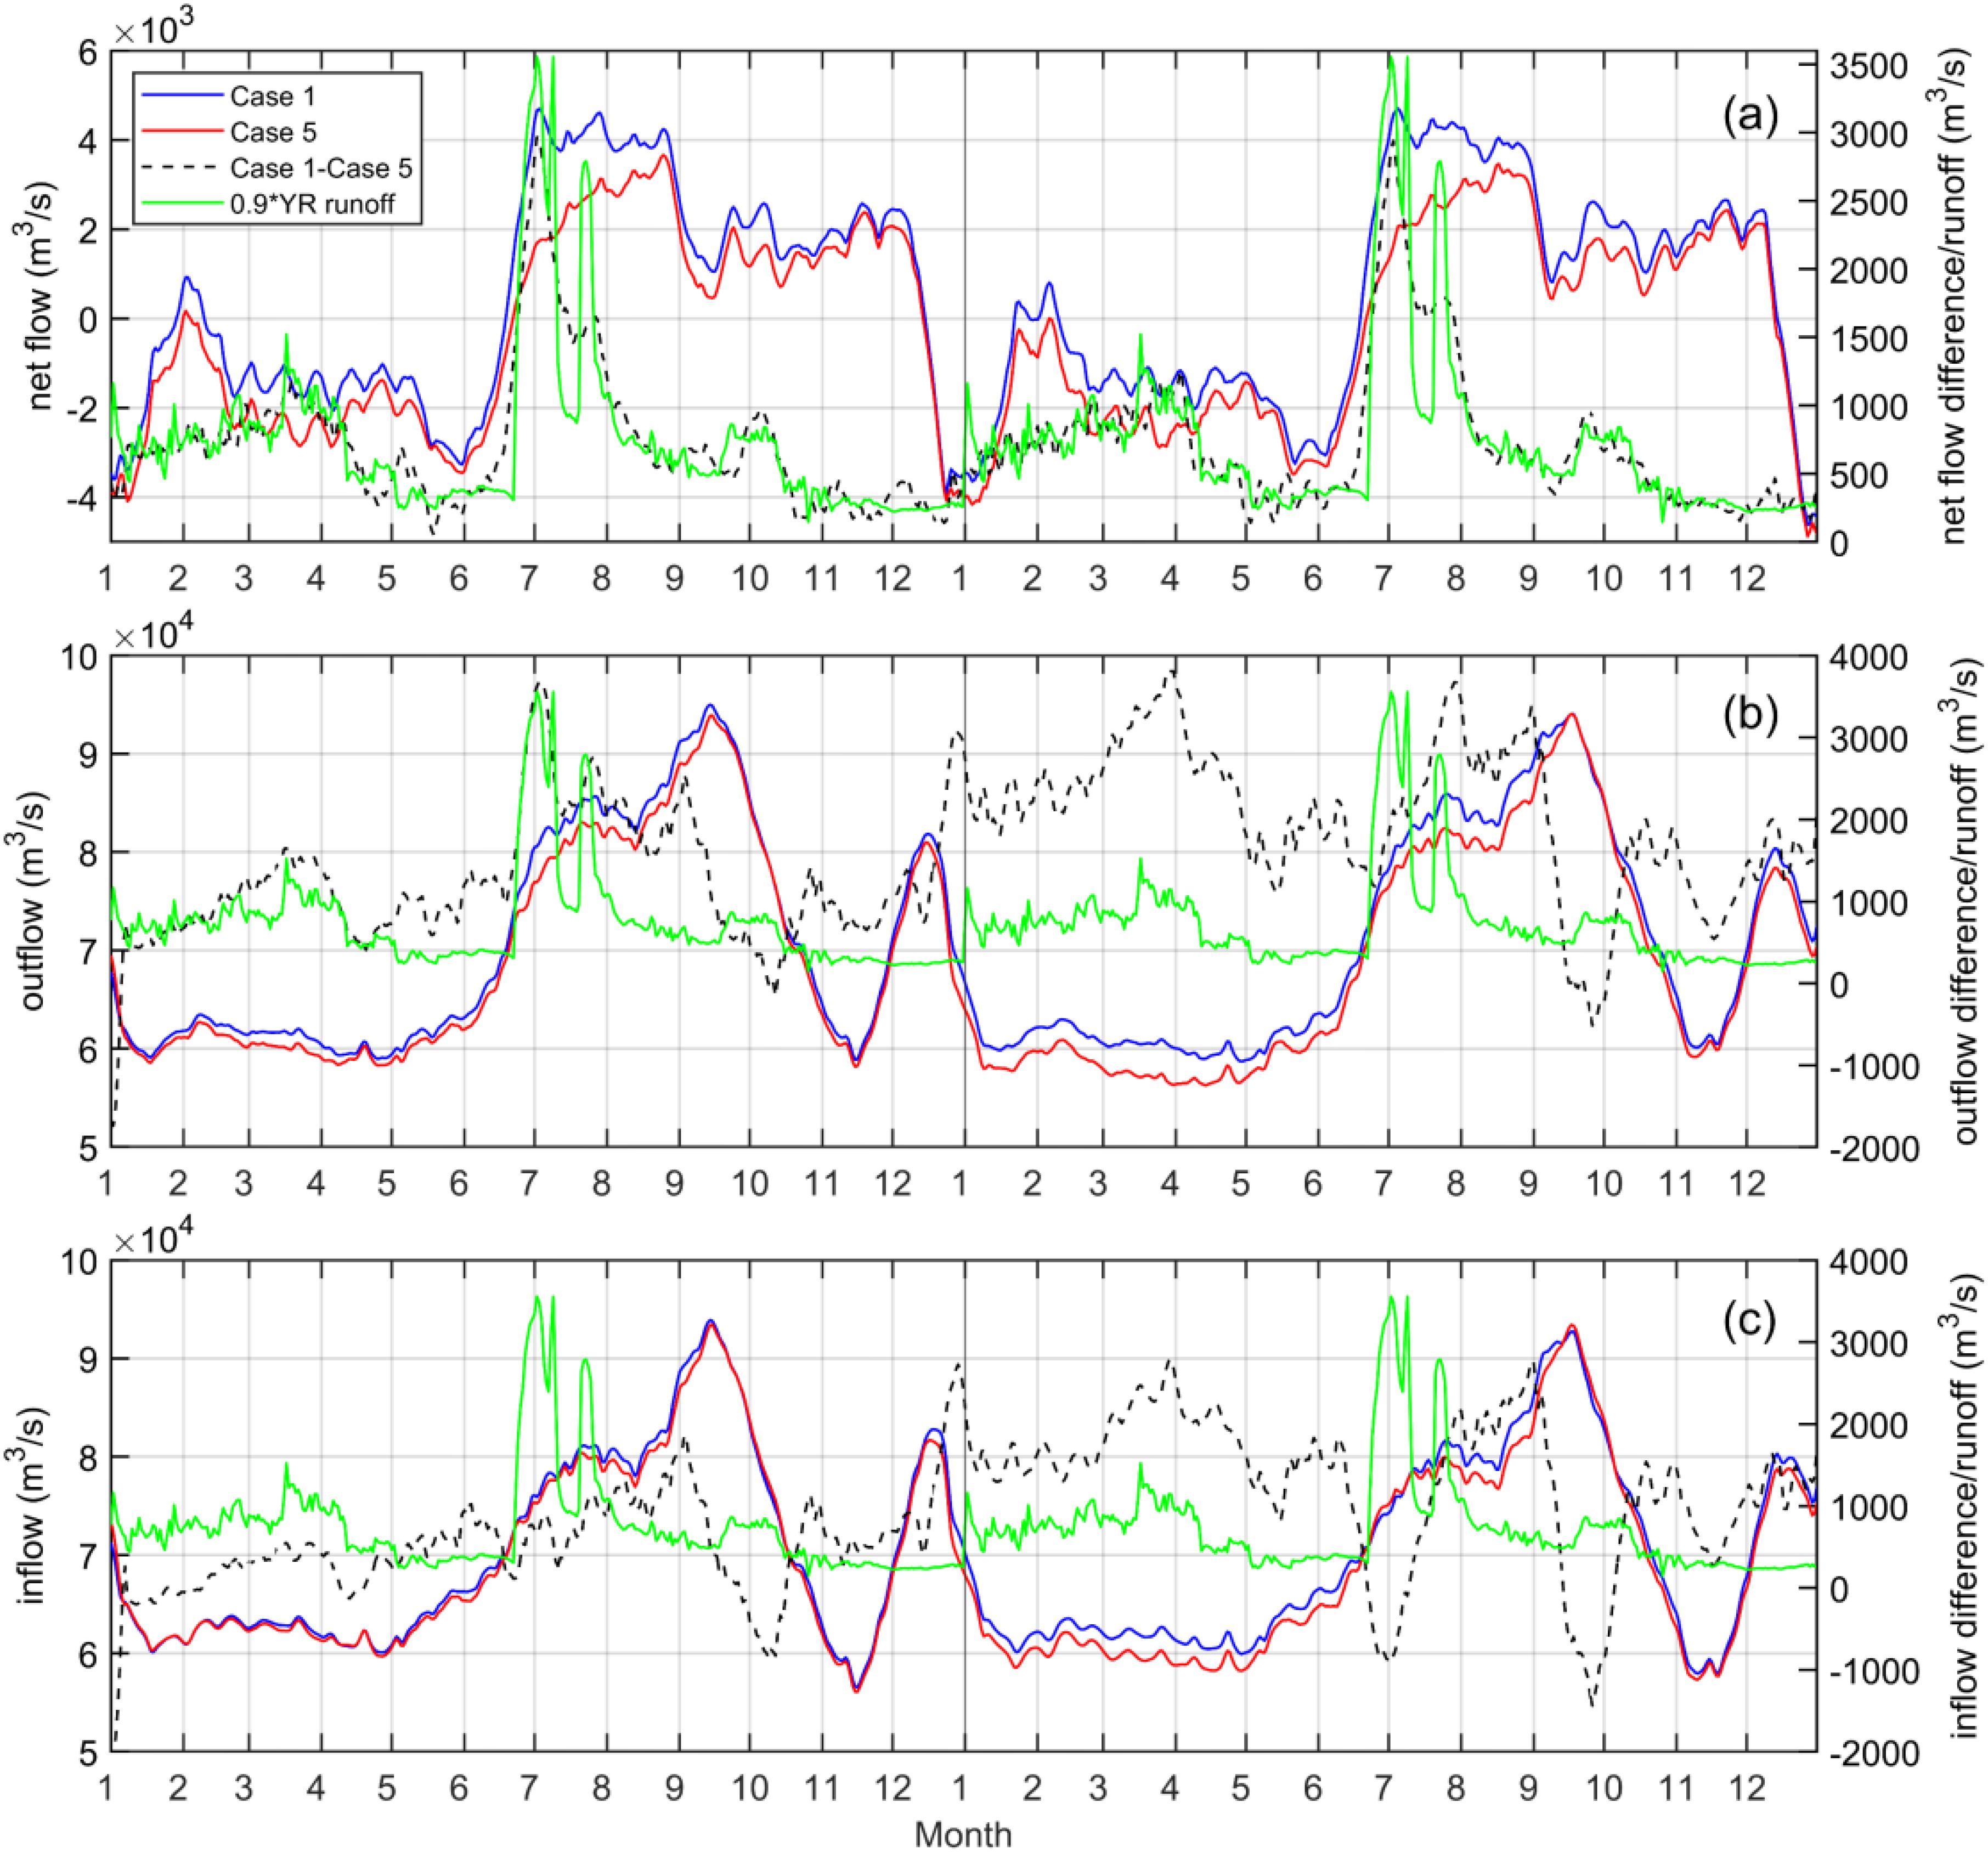
Figure 9. (a) Net water flux, (b) outflow flux and (c) inflow flux through the Bohai Strait in the model result. The blue, red and black dotted lines are for the values of Case 1, Case 5 and the difference between Case 1 and Case 5, respectively. The green line illustrates the difference in YR discharge between Case 1 and Case 5, quantified as 0.9 times the YR discharge.
The model result shows that the response of the net water flux through the Bohai Strait (dashed line in Figure 9a) is almost synchronous with the variation in the discharge of the Yellow River between Case 1 and Case 5 (green line in Figure 9a). The maximum difference of net flux between these two cases occurs in early July, consistent with that of the Yellow River discharge. However, the response of inflow/outflow is more complicated, and appears to be a combination of synchronous and asynchronous response with the variation of Yellow River discharge (Figures 9b, c). During the first 7 months of year 1, the difference in outflow (and to a less extent inflow) between Case 1 and Case 5 follows the difference in the discharge of the Yellow River (with a maximum in July). After the first 7 months, the difference in outflow/inflow shows a delayed response to the difference in river discharge. The difference in outflow/inflow shows a large increase in December of year 1, and then maintains at a high level with a peak value in March of year 2. In fact, the differences in outflow/inflow in the two years are quite different, suggesting that the differences can be mostly related to baroclinic instead of barotropic dynamics, likely the delayed response to Yellow River discharge.
The synchronous response of the net water flux through the Bohai Strait to the Yellow River discharge can be explained by the variation in the sea surface elevation. The sea surface elevation from the Yellow River mouth to the Bohai Strait is low during low Yellow River discharge period from January to May (Figure 10). As the Yellow River discharge increases from late June, the sea surface elevation at the Yellow River mouth rises, and it quickly propagates to the Bohai Strait. Therefore, the immediate response of the net water flux through the Bohai Strait is affected by the barotropic adjustment. This immediate response of the net water flux also appears at the response of inflow/outflow at the Bohai Strait.
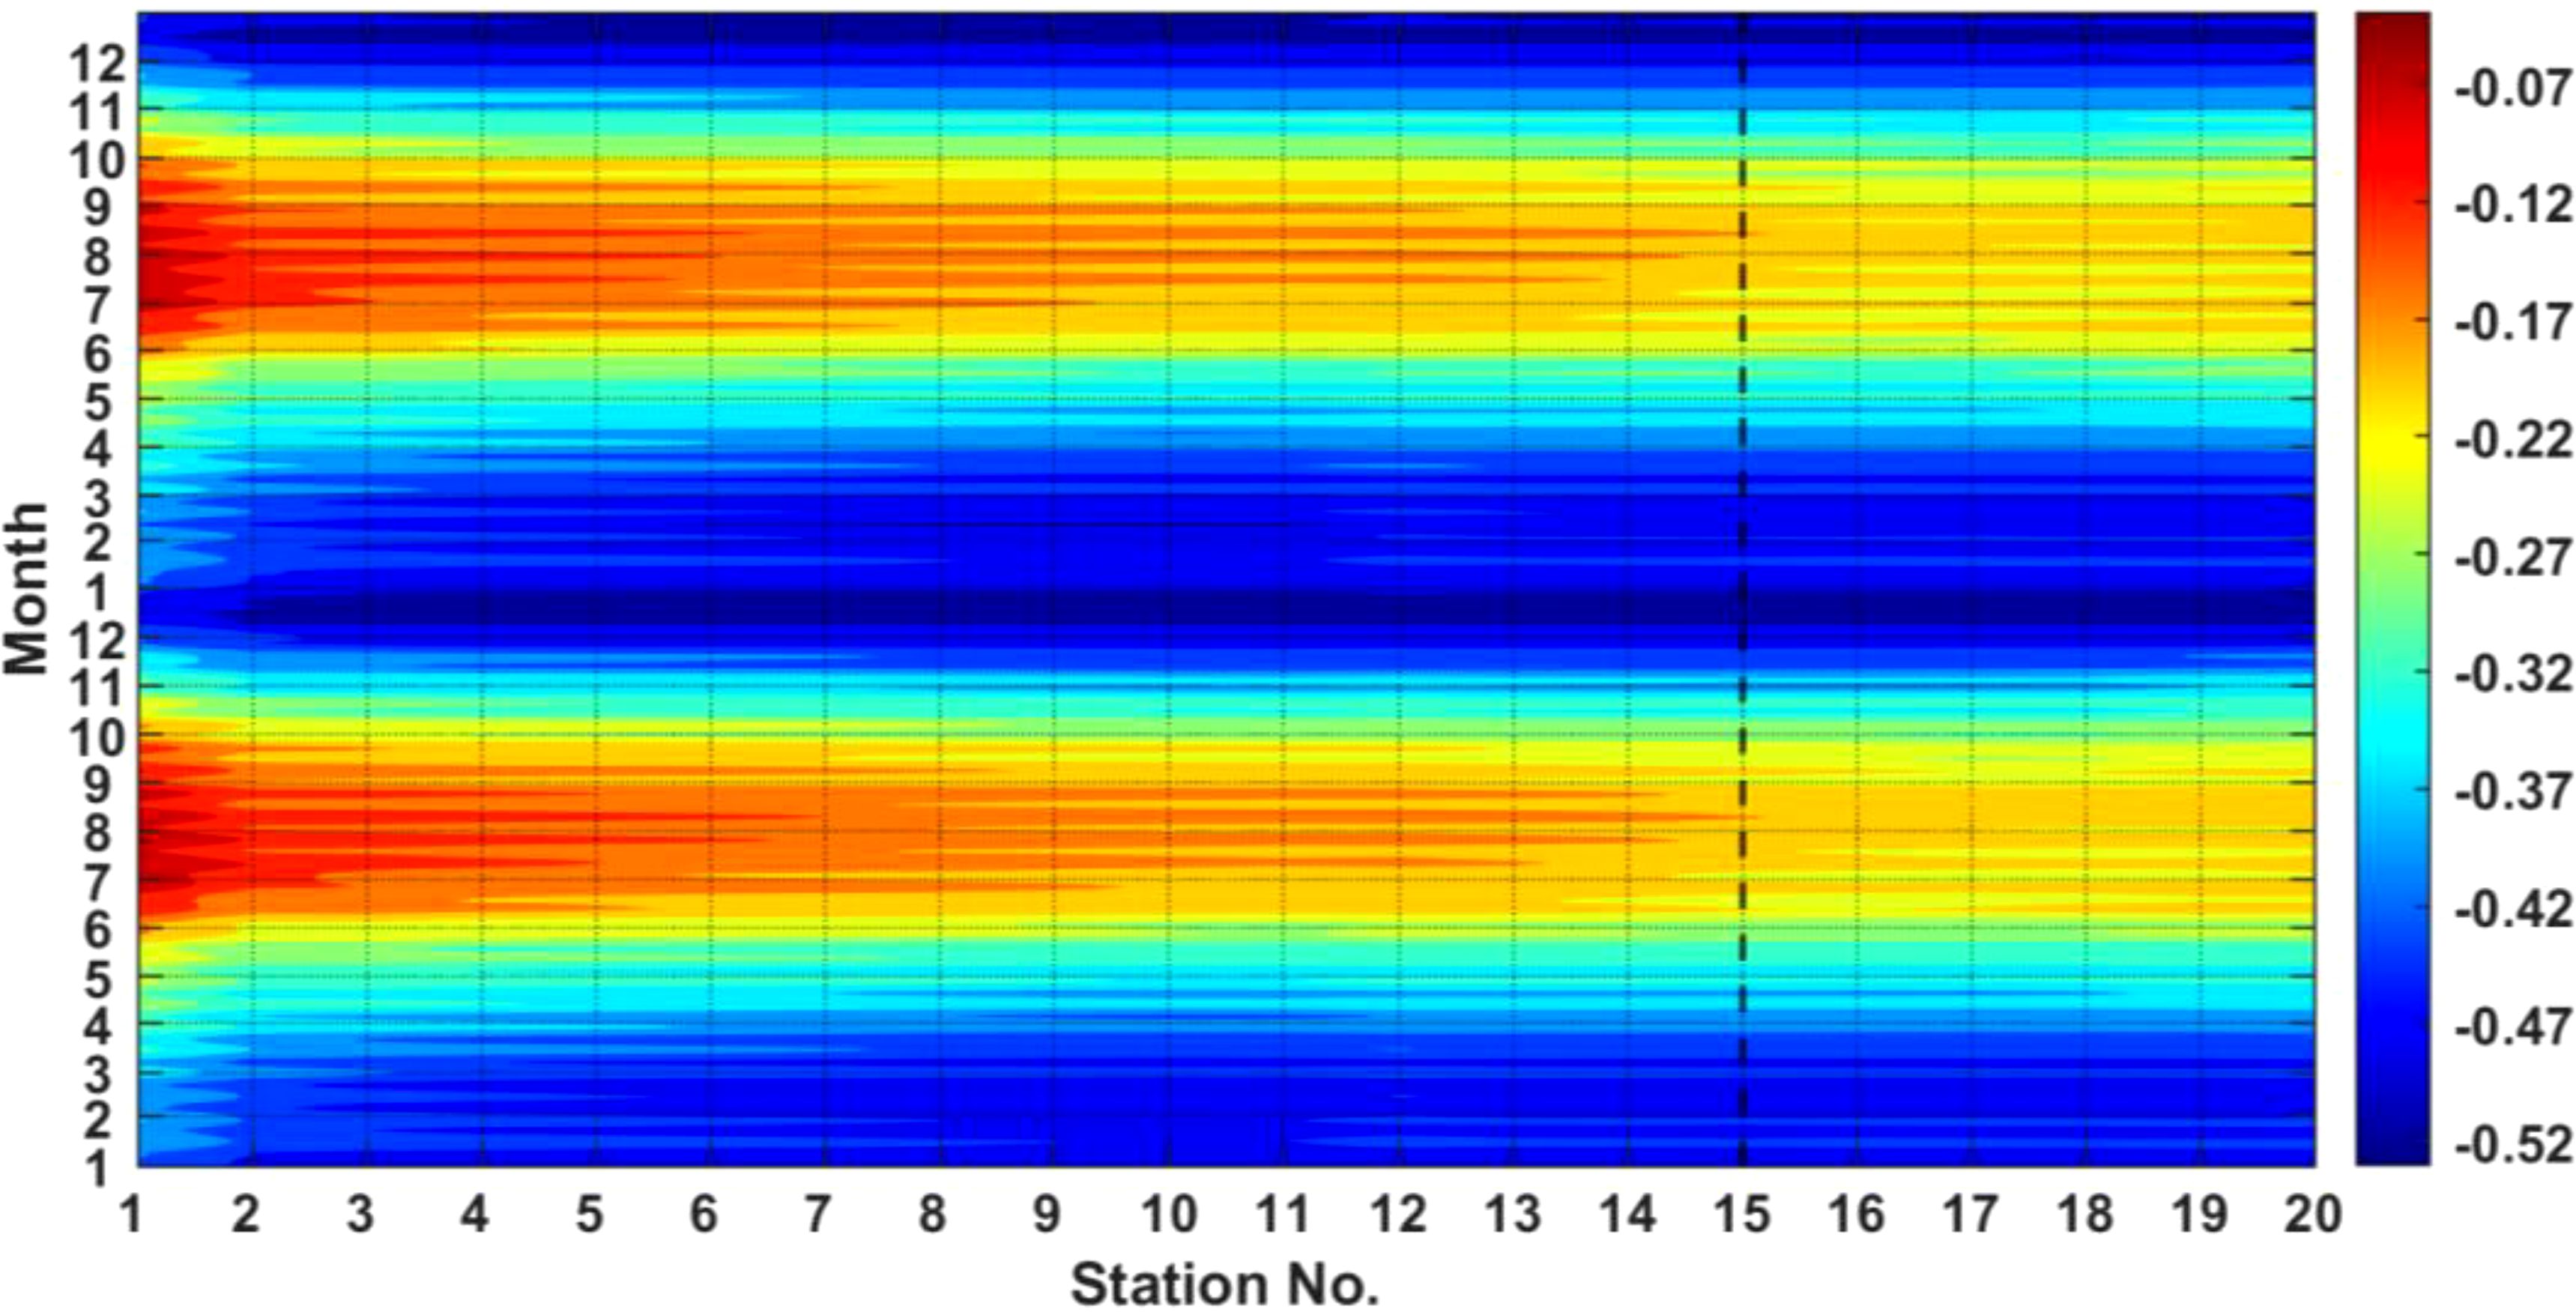
Figure 10. Time series of daily sea surface elevation (m) at 20 stations (locations shown by red dots in Figure 1b) from the Yellow River mouth to the Bohai Strait in Case 1. The dashed line at No. 15 station indicates the location of Bohai Strait.
The lag in the response of inflow/outflow flux through the Bohai Strait to the variation in the discharge from the Yellow River can be explained by the seasonal behavior of the Yellow River plume. As shown in section 3.1, the Yellow River plume extends northeastward in summer (Figure 4g), and turns southward into Laizhou Bay in autumn (Figure 4h). In winter, the low-salinity water arrives at the northeast coast of Laizhou Bay and flows out through the southern Bohai Strait (Figure 4e). According to the variation of inflow/outflow flux difference (dashed lines in Figures 9b, c), the low-salinity water starts to arrive at the Bohai Strait in second January, while the accumulated low-salinity water largely arrives in second March. Therefore, we know that it takes ~9 months for the strongest signal of variation in the discharge to arrive at the strait.
This modelled lagged phenomenon is also found in surveys around the Yellow River estuary. Researchers from Yantai Institute of Coastal Zone Research, Chinese Academy of Sciences, carried out field surveys around the Yellow River estuary from May 8-12, June 8-12, July 18–22 and November 5–11 of 2022, and February 2–7 of 2023. Surface salinity was measured at a depth of 2 meters. The spatial distribution of salinity around the Yellow River Estuary was plotted by linear interpolation (Figures 11b–f). In May and June, when the Yellow River discharge was relatively low (~500 m3/s, Figure 11a), the Yellow River plume extended northward (Figures 11b, c). In July, as the river discharge increased, a corresponding decrease in salinity was noted around the river mouth, and the low-salinity water flows toward the northeast under the influence of the dominant southeasterly wind in summer (Figure 11d). In November, the low-salinity water extended southward into the Laizhou Bay (Figure 11e), and finally arrived at the southern strait in February (Figure 11f). The salinity at the southern strait is lowest in February, although the Yellow River discharge is not high in February. Due to the lack of observations in January and March, we conclude that the Yellow River water discharged in early July arrived at the southern strait until 8 months later in the following February.
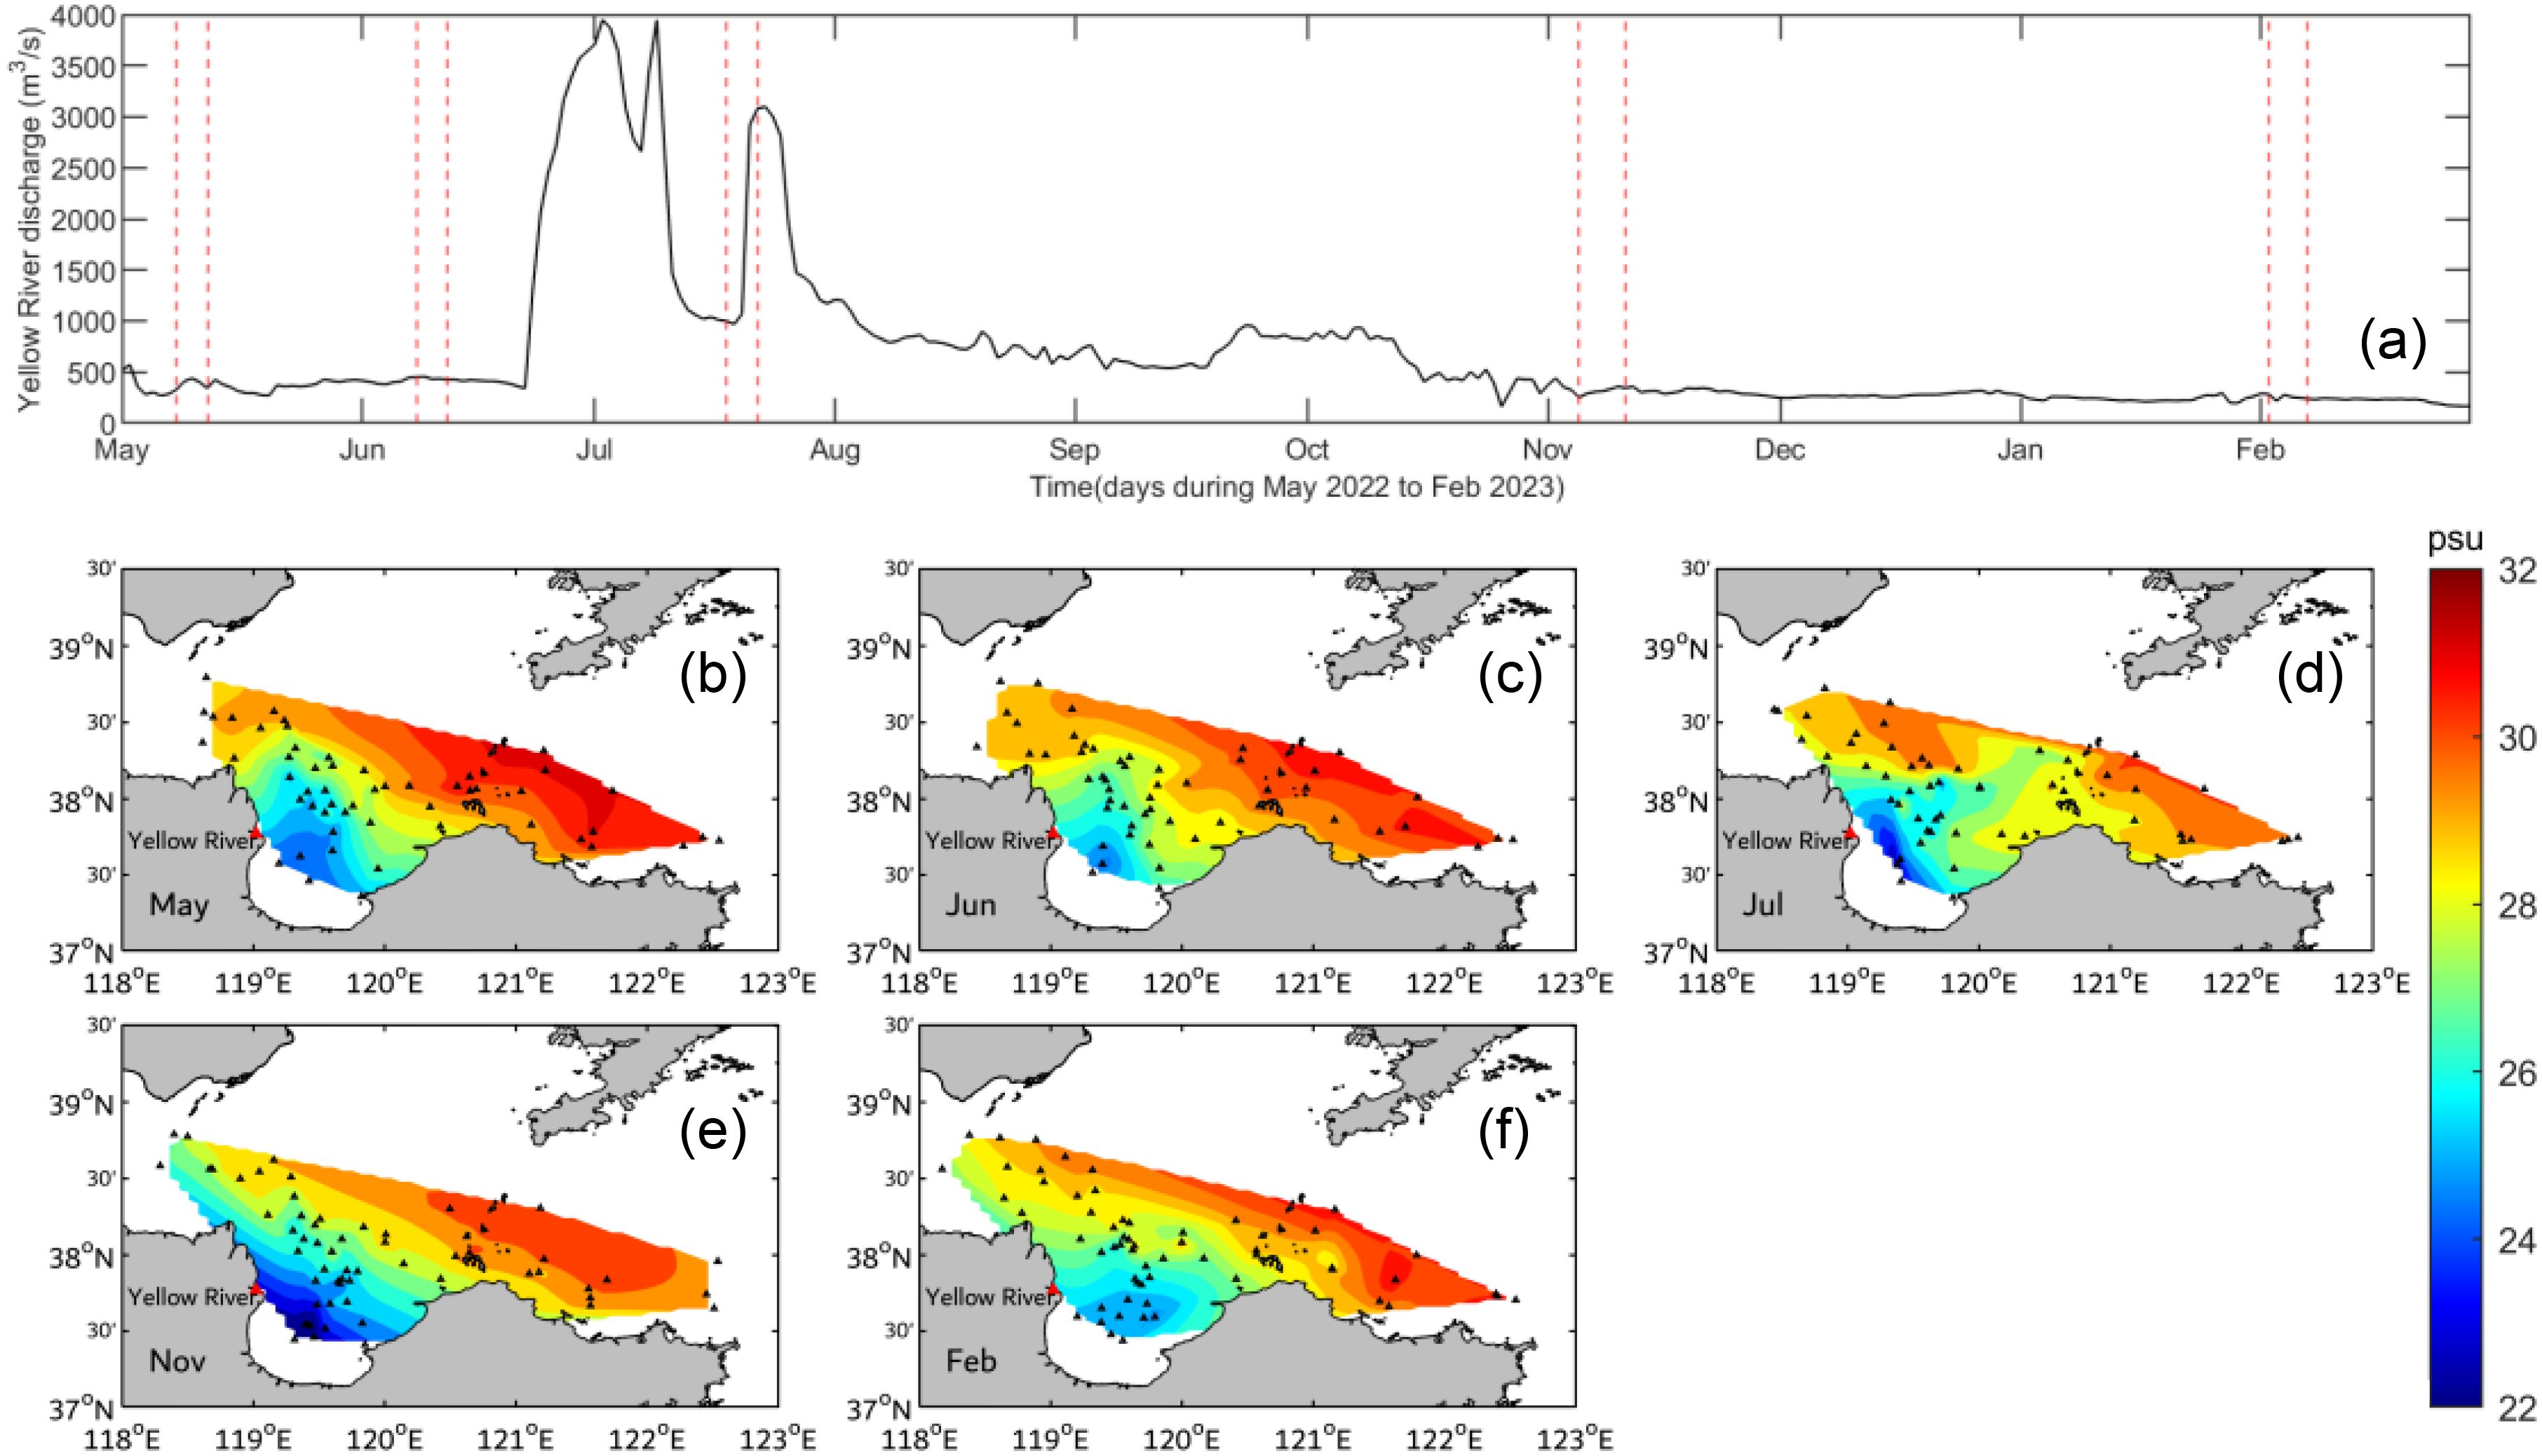
Figure 11. (a) Daily discharge of the Yellow River from May 2022 to February 2023 and (b-f) five observational results of salinity (2 m water depth). The black triangles indicate the observational sites. The dashed line in (a) indicates the observational period.
4.3 Tracer modeling
To further examine this lagged phenomenon, we carried out a tracer numerical experiment. Due to the implementation of the WSRS, the discharge of the Yellow River surged on June 22, 2022. Based on the above model, we released passive tracer at the surface of the Yellow River mouth on June 22 for three days, with the tracer concentration of 1. The advection-diffusion Equation 1 was used to calculate the tracer concentration.
where N represents the tracer concentration, t means the time, is the velocity, represents the vertical turbulent mixing coefficient, and represents the horizontal diffusion term. The tracer was modelled for one year.
The model result shows that the tracer concentration in the strait is close to zero in July and August (Figures 12a, b), indicating that tracer has not yet reached the Bohai Strait. Little tracer arrives at the southern channel from September to November (Figures 12c–e). The highest tracer concentration is found in the southern channel in December and the following January (Figures 12f, g), indicating that the tracer flows out through the southern Bohai Strait at this time. After that, the tracer concentration gradually decreases (Figures 12h–l).
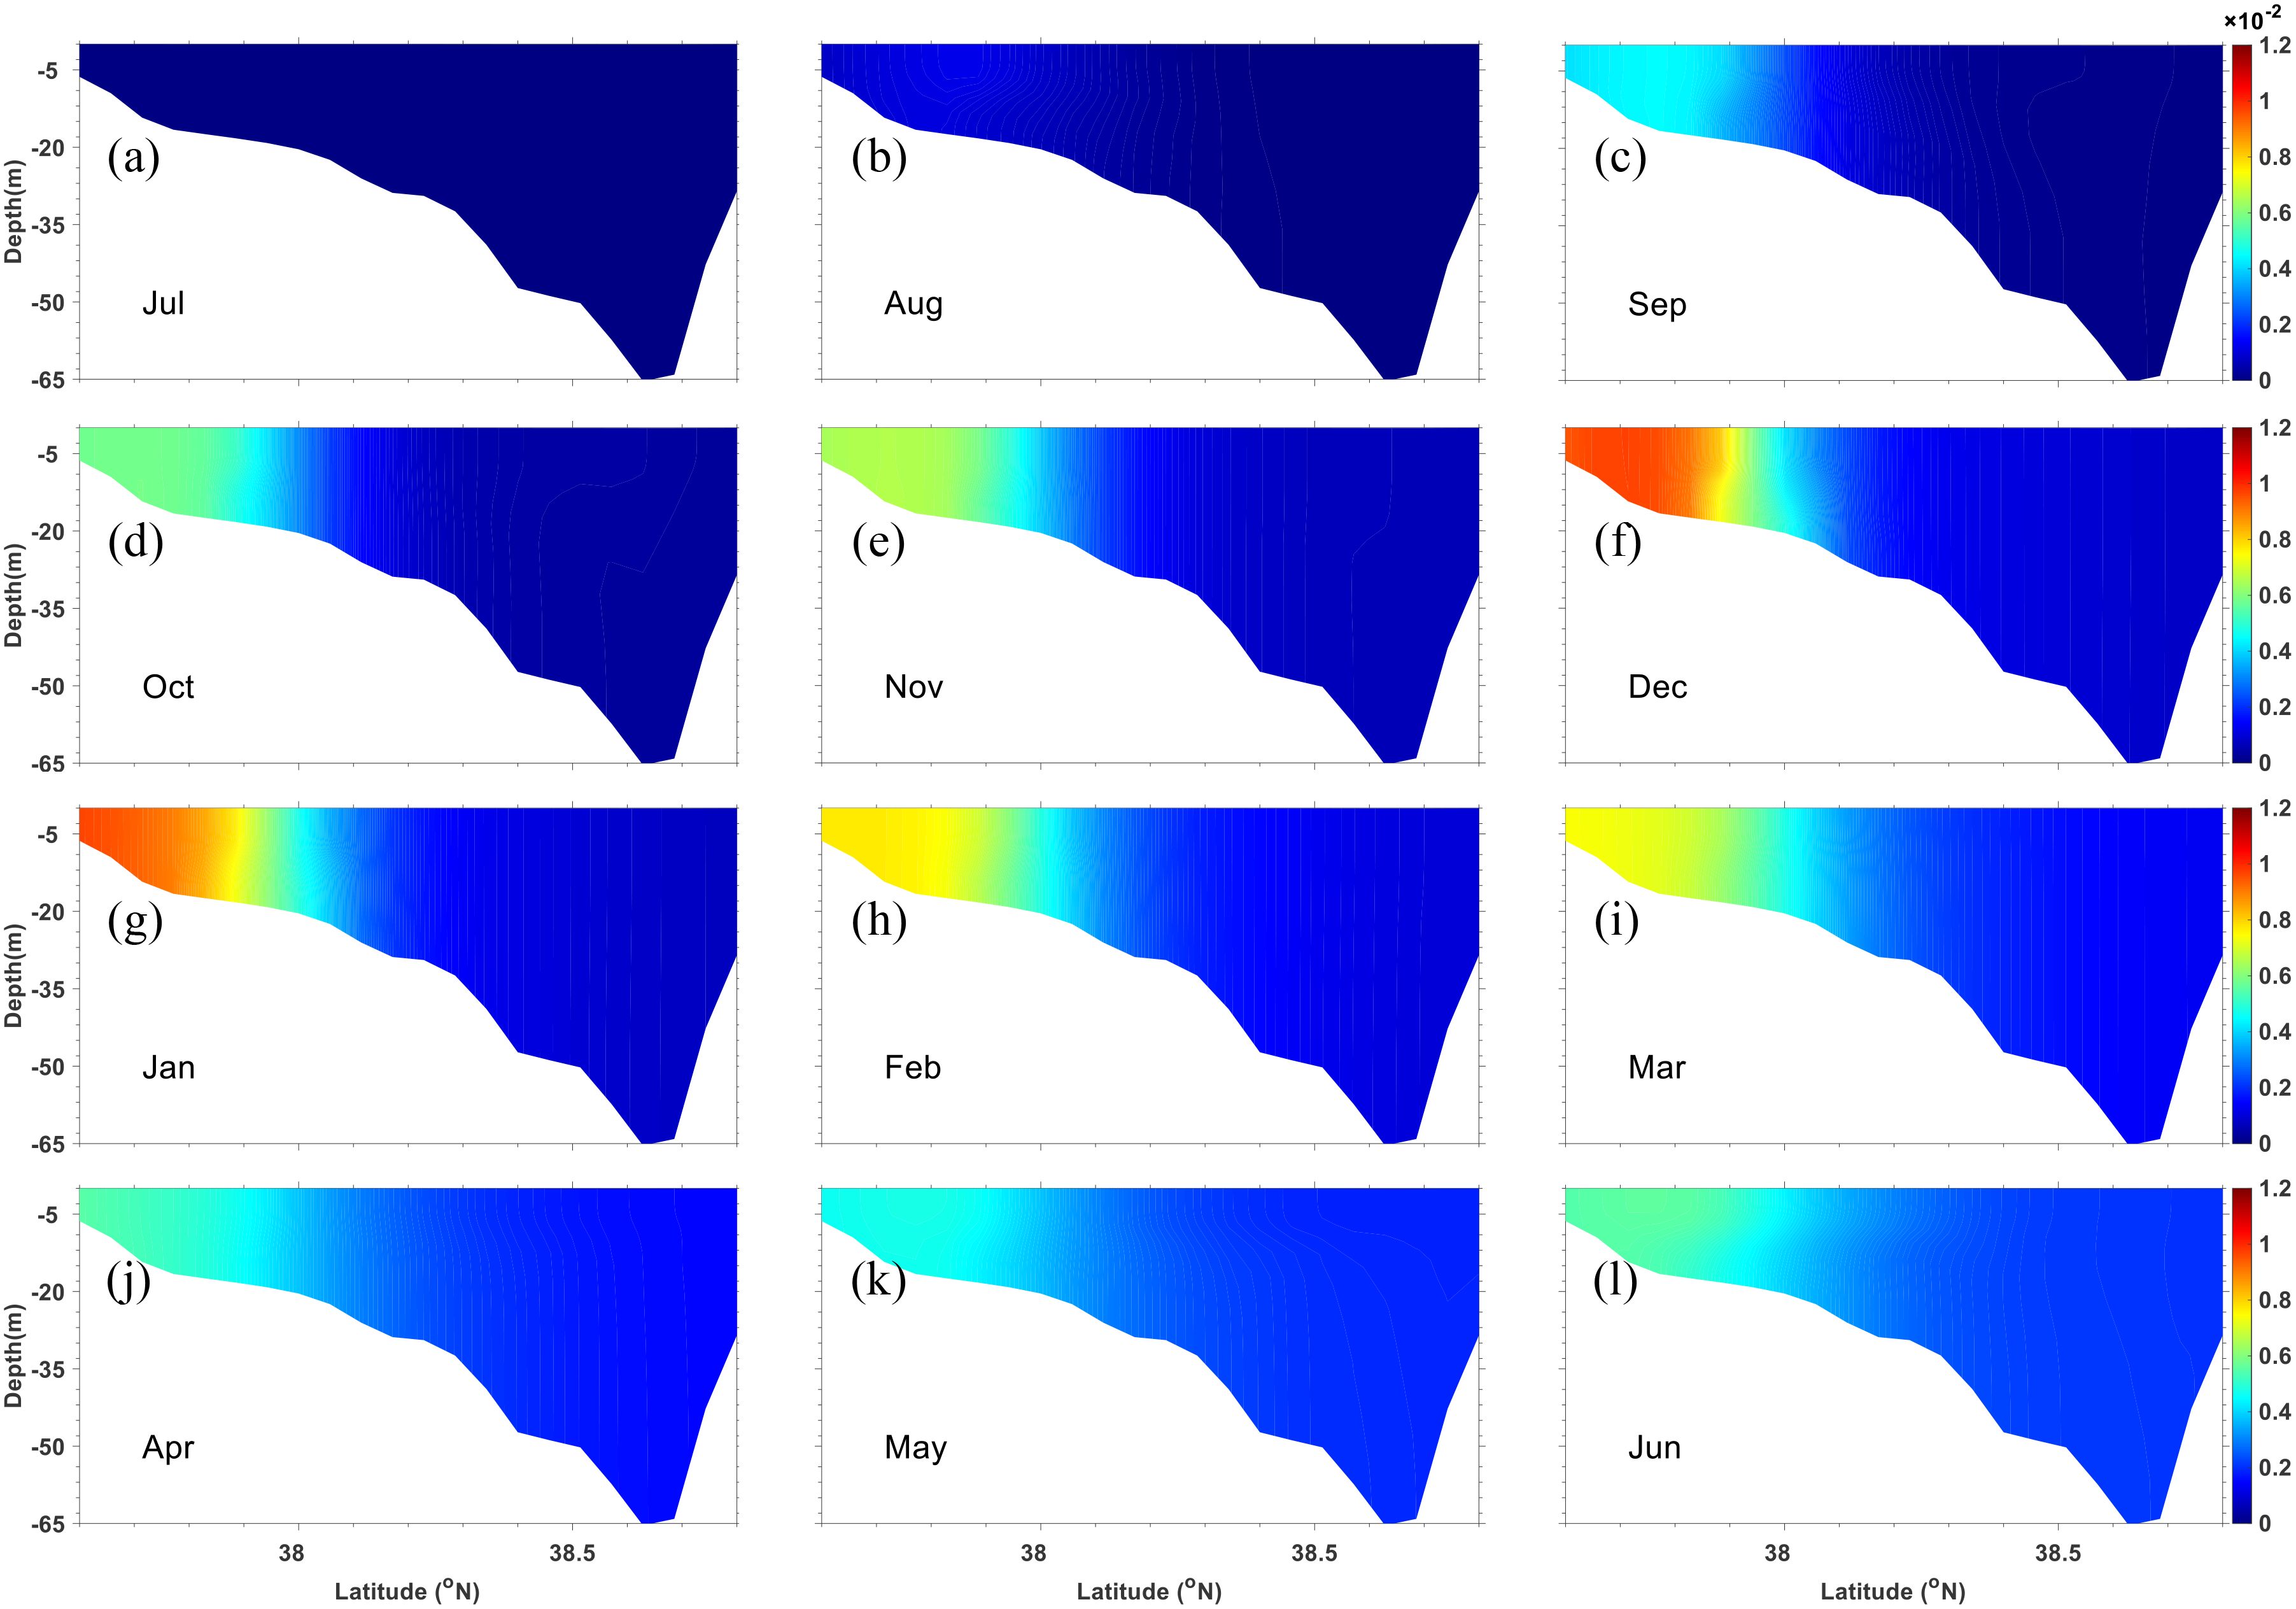
Figure 12. Vertical distribution of monthly averaged tracer concentration in the Bohai Strait during one year (a-l).
Time series of tracer concentrations at 24 stations from the Yellow River mouth to the strait (red triangles in Figure 1b) show that the tracer is concentrated at stations 1–4 in July and August (Figure 13). In September, tracer concentrations at stations 5–10 increase rapidly, indicating that tracer is moving along the coast of Laizhou Bay. The highest tracer concentrations in the Bohai Strait (No. 18) appear in December and January of the following year. A large amount of tracer arrives at the Bohai Strait, coinciding with the outflow volume increase in January (Figure 9b). Due to the short releasing duration (3 days), the tracer concentration does not show a second peak in March as that of outflow flux. Consequently, it can be concluded that the influence of the Yellow River discharge on the density-driven current through the Bohai Strait lags the discharge by ~7 months.
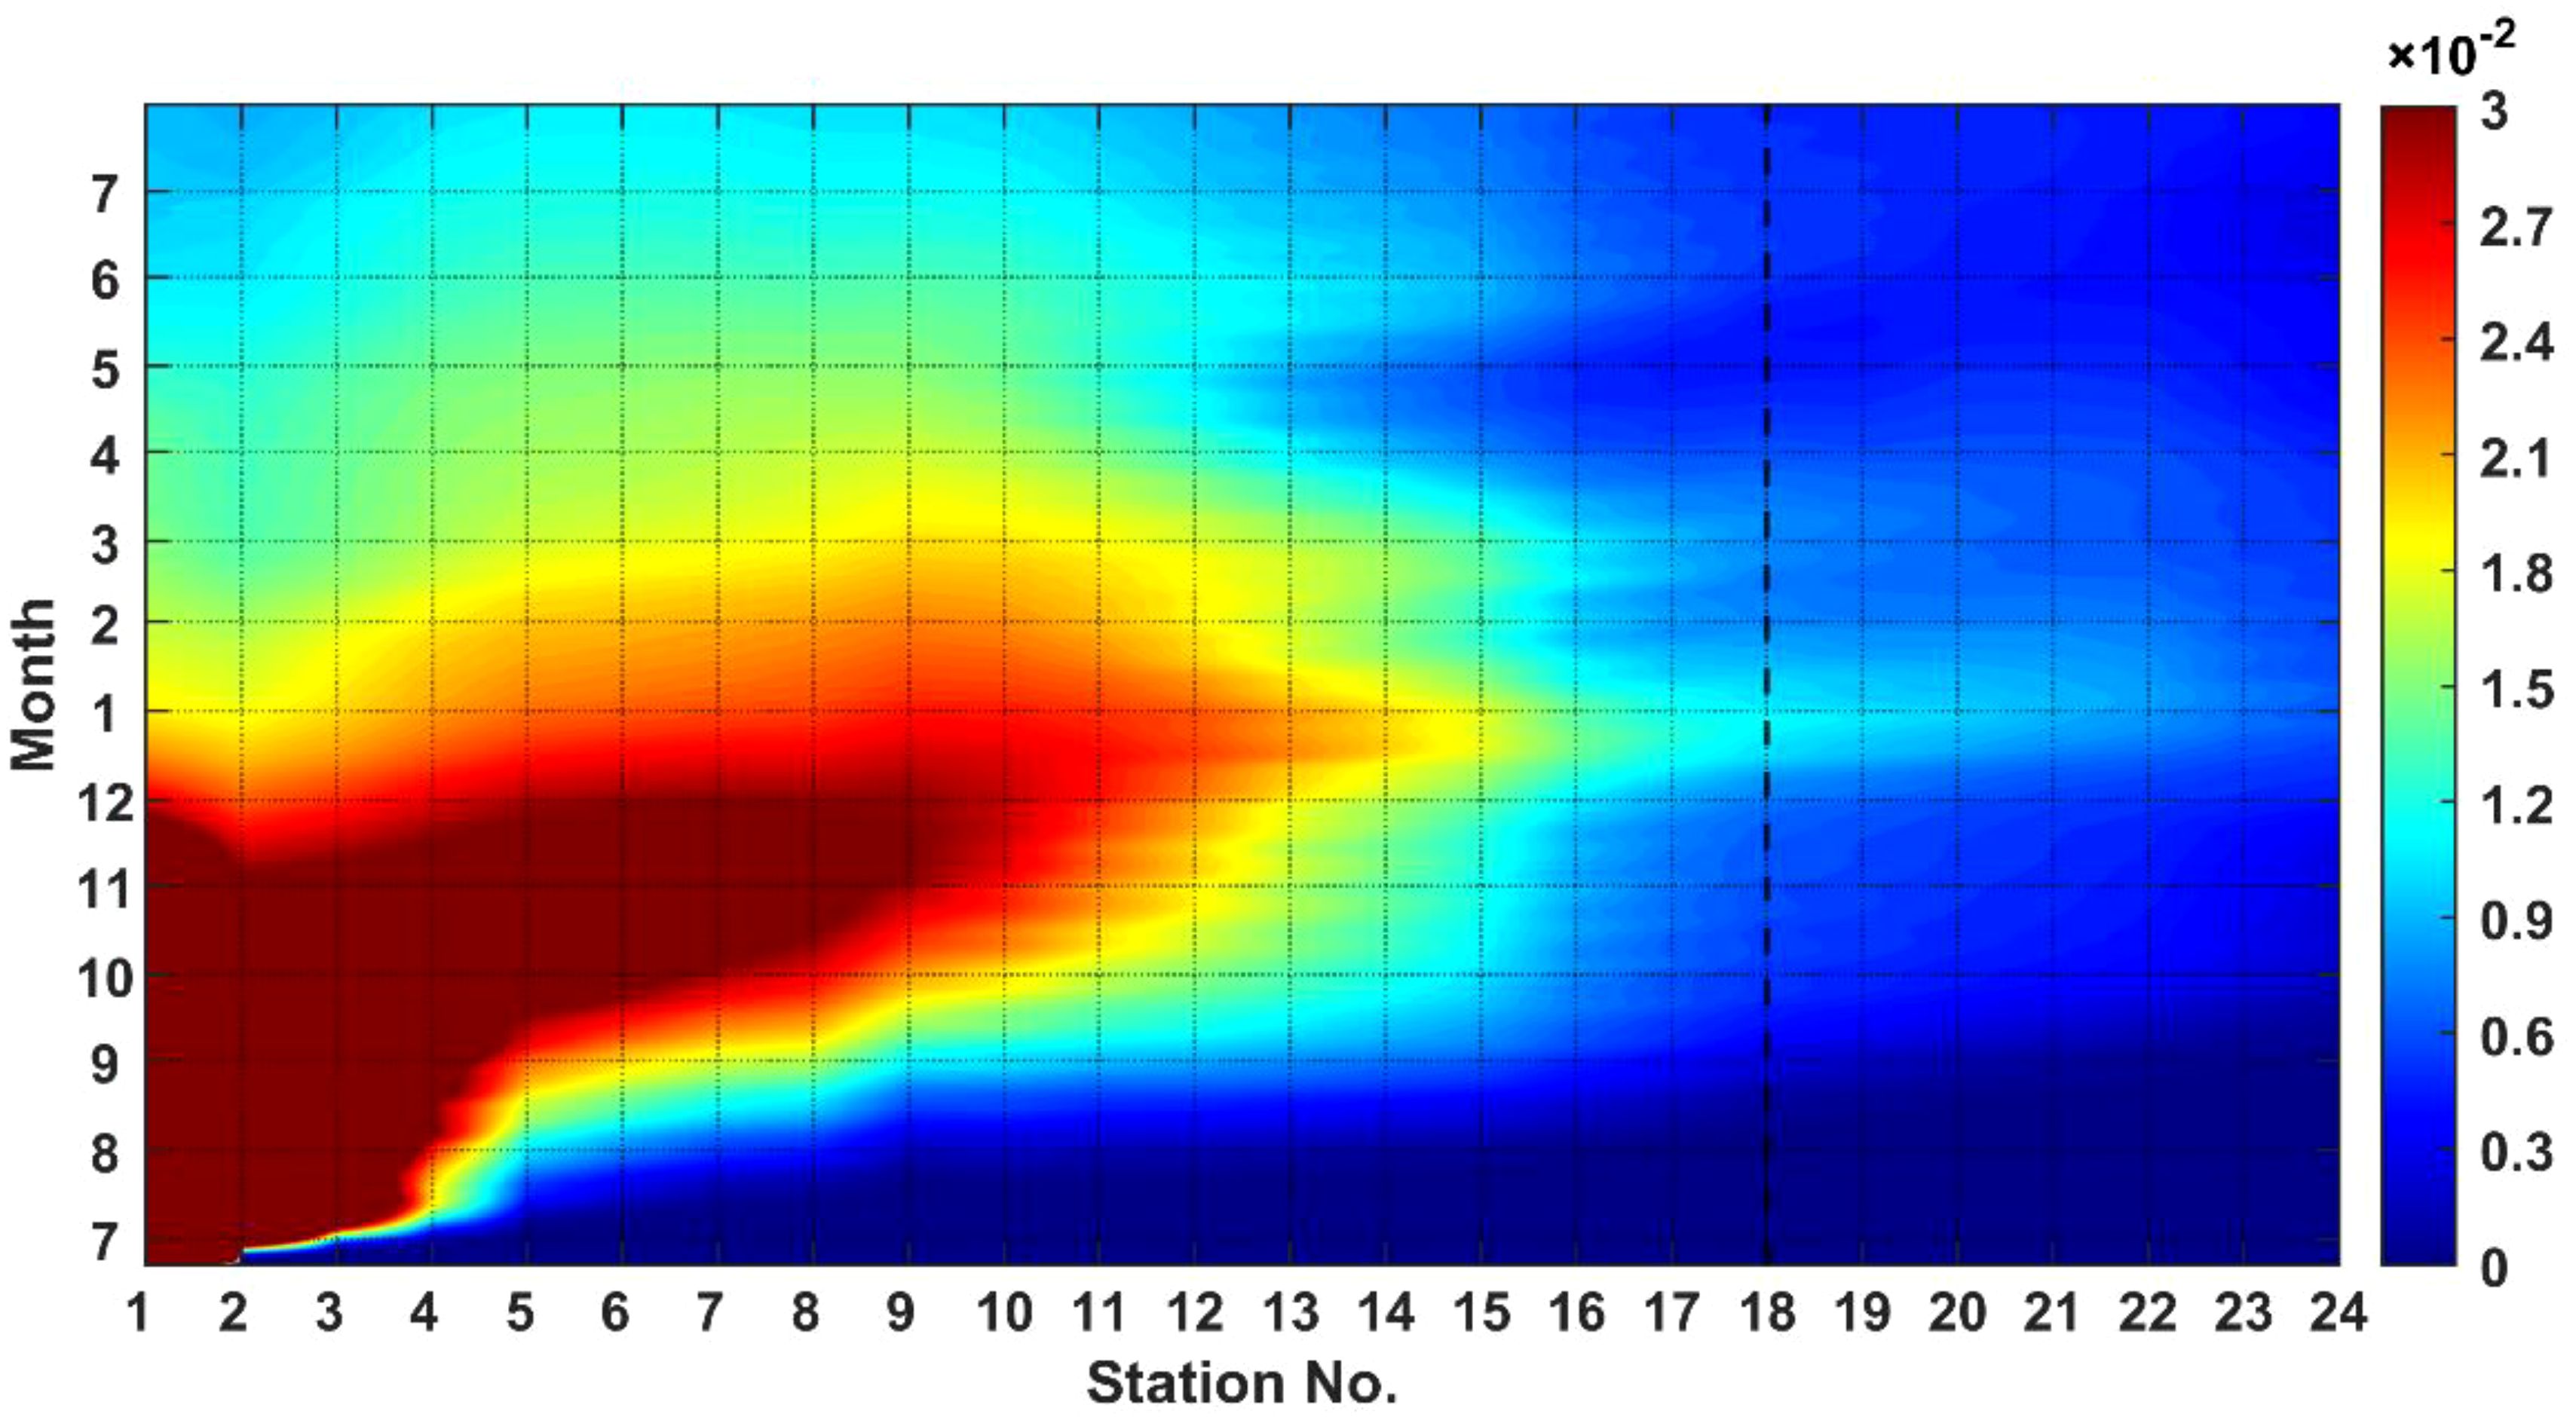
Figure 13. Time series of tracer concentration at 24 stations along the coast from the Yellow River mouth to the Bohai Strait (No. 18 station) during the modelled period.
5 Conclusion
In this study, we analyzed the residual current structure in the Bohai Strait and found that the general circulation pattern in the Bohai Strait is the inflow in the northern channel and a two-layer current in the southern channel, with strong outflow in the surface layer and weak inflow in the bottom layer. The inflow in the northern strait is induced by the tide-induced residual current, which exhibits little seasonal variation. The two-layered structure in the southern strait is generated by the density-driven current, which is strongest in summer. The increase in the Yellow River discharge during summer is a significant factor in enhancing the density-driven current. Although the net water flux through the Bohai Strait is synchronous with the variation in the discharge of the Yellow River, the response of inflow/outflow water flux is a combination of synchronous and asynchronous responses to the discharge. The asynchronous response can have a time lag of about 9 months. The synchronous response is induced by the barotropic effect, while the asynchronous response is mainly due to the baroclinic effect of Yellow River discharge. The field observations of salinity and the passive tracer numerical experiments confirmed the delay of 7–9 months.
Data availability statement
The raw data supporting the conclusions of this article will be made available by the authors, without undue reservation.
Author contributions
DW: Writing – original draft. XY: Writing – review & editing. XG: Writing – review & editing. YW: Writing – review & editing. HG: Writing – review & editing. TZ: Writing – review & editing. JT: Writing – review & editing.
Funding
The author(s) declare that financial support was received for the research and/or publication of this article. This study was supported by the National Natural Science Foundation of China (42276010; 42149301, NORC2022-304). Y. Wang was supported by Study on big data assimilation and fusion analysis model of super-resolution marine environment funded by the National Key Research and Development Program of China (No. 2021YFF0704002). X. Guo was supported by a Grant-in-Aid for Scientific Research (MEXT KAKENHI, grant number: 22H05206). This study was also partly supported by the Ministry of Education, Culture, Sports, Science and Technology, Japan (MEXT) to a project on Joint Usage/Research Center–Leading Academia in Marine and Environment Pollution Research (Lamer).
Acknowledgments
The authors sincerely thank the two reviewers for their helpful suggestions on the original manuscript.
Conflict of interest
The authors declare that the research was conducted in the absence of any commercial or financial relationships that could be construed as a potential conflict of interest.
Generative AI statement
The author(s) declare that no Generative AI was used in the creation of this manuscript.
Publisher’s note
All claims expressed in this article are solely those of the authors and do not necessarily represent those of their affiliated organizations, or those of the publisher, the editors and the reviewers. Any product that may be evaluated in this article, or claim that may be made by its manufacturer, is not guaranteed or endorsed by the publisher.
References
Bi C. (2013). A numerical study on the seasonal variability and dynamic mechanism of circulation in the Bohai Sea. (Qingdao, China: Ocean University of China).
Bi N., Yang Z., Wang H., Fan D., Sun X., Lei K. (2011). Seasonal variation of suspended-sediment transport through the southern Bohai Strait. Estuarine Coast. Shelf Sci. 93, 239–247. doi: 10.1016/j.ecss.2011.03.007
Blumberg A. F., Mellor G. L. (1987). A description of a three-dimensional coastal ocean circulation model. Ed. Heaps N. S. (Washington, D.C: American Geophysical Union), 1–16.
Chen D. (1992). Marine atlas of bohai sea, yellow sea and east China sea: hydrology (Beijing, China: China Ocean Press), 524.
Chen X., Lu J., Cui T., Jiang W., Tian L., Chen L., et al. (2010). Coupling remote sensing retrieval with numerical simulation for SPM study—Taking Bohai Sea in China as a case. Int. J. Appl. Earth Observation Geoinformation 12, S203–S211.
da Silva A., Young-Molling C., Levitus S. (1994a). “Atlas of surface marine data 1994,” in Algorithms and procedures, NOAA atlas NESDIS 6, vol. 1. (Maryland, USA: NOAA, Silver Spring, Md).
da Silva A., Young-Molling C., Levitus S. (1994b). “Atlas of surface marine data 1994,” in Anomalies of fresh water fluxes, NOAA atlas NESDIS 9, vol. 4. (Spring, Maryland, USA: NOAA, Silver Spring, Md).
Guan B. X. (1994). Patterns and structures of the currents in bohai, huanghai and east China seas. Oceanology China Seas 1, 17–26.
Guo X., Hukuda H., Miyazawa Y., Yamagata T. (2003). A triply nested ocean model for simulating the Kuroshio-roles of horizontal resolution on JEBAR. J. Phys. Oceanogr. 33, 146–169. doi: 10.1175/1520-0485(2003)033<0146:ATNOMF>2.0.CO;2
Hanawa K., Mitsudera H. (1985). On daily average of oceanographic data (in Japanese). Coast. Oceanography Bull. 23, 79–87.
Huang D., Chen Z., Su J. (1996). The application of three-dimensional shelf sea model in the Bohai Sea: I. Numerical Simulation of tidal and wind-driven current. Acta Oceanologica Sin. 18, 1–13.
Huang D., Su J., Zhang L. (1998). Numerical study of the winter and summer circulation in the bohai sea. Acta Aerodynamica Sin. 16, 115–121.
Ji C., Li G., Yu B., Dong L., Liu Q. (2019). The multi-time scale variations of water exchange across the Bohai Strait. Oceanologia Limnologia Sin. 50, 24–30.
Li A., Qiao L., Wang X., Ma W. (2016). Distribution, flux and seasonal variation of suspended particulate matters in the Bohai Strait. Oceanologia Limnologia Sin. 47, 310–318.
Li Z., Wang H., Guo X., Liu Z., Gao H., Zhang G. (2017). Influence of a water regulation event on the age of yellow river water in the bohai. J. Ocean Univ. China 16, 727–737. doi: 10.1007/s11802-017-3210-2
Lin C., Su J., Xu B., Tang Q. (2001). Long-term variations of temperature and salinity of the Bohai Sea and their influence on its ecosystem. Prog. Oceanography 49, 7–19. doi: 10.1016/S0079-6611(01)00013-1
Lin X., Wu D., Bao X., Jiang W. (2002). Study on seasonal temperature and flux variation of the Bohai Strait. Periodical Ocean Univ. China 32, 355–360.
Lin X., Wu D., Bao X., Jiang W. (2005). The numerical study on seasonal variation of Bohai Sea circulation. Proceedings of the 7th National Conference on Hydrodynamics and the 19th National Symposium on Hydrodynamics (Beijing, China), 1089–1095.
Liu H., Pang C., Yang D., Liu Z. (2021). Seasonal variation in material exchange through the Bohai Strait. Continental Shelf Res. 231, 104599. doi: 10.1016/j.csr.2021.104599
Liu Z., Wei H., Jiang S. (2003). Characteristics of seasonal variation of monthly mean temperature and salinity fields in the Bohai Sea and Analysis of the related dynamics. Periodical Ocean Univ. China 33, 7–14.
Mao X., Jiang W., Zhao P., Gao H. (2008). A 3-D numerical study of salinity variations in the Bohai Sea during the recent years. Continental Shelf Res. 28, 2689–2699. doi: 10.1016/j.csr.2008.09.004
Matsumoto K., Takanezawa T., Ooe M. (2000). Ocean tide models developed by assimilating TOPEX/POSEIDON altimeter data into hydrodynamical model: A Global Model and a Regional Model around Japan. J. Oceanography 56, 567–581. doi: 10.1023/A:1011157212596
Mellor G. L. (2003). Users guide for A three-dimensional, primitive equation, numerical ocean model, (2009 version), Atmospheric and Oceanic Sciences Program. (Princeton, New Jersey, USA: Princeton University).
Mellor G. L., Yamada T. (1982). Development of a turbulence closure model for geophysical fluid problems. Rev. Geophysics Space Phyics 20, 851–875. doi: 10.1029/RG020i004p00851
Men G., Wan X., Ma W., Wang Y. (2017). Variation in Huanghe River water age in the Bohai Sea simulated with CART method. Oceanologia Limnologia Sin. 48, 423–435.
Shi H., Li Q., Sun J., Gao G., Sui Y., Qiao S., et al. (2020). Variation of Yellow River runoff and its influence on salinity in Laizhou Bay. J. Ocean Univ. China 19, 1235–1244. doi: 10.1007/s11802-020-4413-5
Shou W., Zong H., Ding P. (2016). Numerical study of the circulation influenced by runoff input in the Huanghe (Yellow) River Estuary and adjacent waters in summer. Acta Oceanologica Sin. 38, 1–13.
Smagorinsky J. (1963). General circulation experiments with the primitive equations: I. The basic experiment. Monthly Weather Revie 91, 99–164. doi: 10.1175/1520-0493(1963)091<0099:GCEWTP>2.3.CO;2
Wang Q., Guo X., Takeoka H. (2008). Seasonal variations of the Yellow River plume in the Bohai Sea: A model study. J. Geophysical Research: Oceans 113, 1–14. doi: 10.1029/2007JC004555
Wang Y., Liu Z., Gao H., Ju L., Guo X. (2011). Response of salinity distribution around the Yellow River mouth to abrupt changes in river discharge. Continental Shelf Res. 31, 685–694. doi: 10.1016/j.csr.2011.01.005
Wei Z., Li C., Fang G., Wang X. (2003). Numerical diagnostic study of the summertime circulation in the Bohai Sea and the water transport in the Bohai Strait. Adv. Mar. Sci. 21, 454–464.
Wei H., Wu J., Thomas P. (2001). A simulation on the seasonal variation of the circulation and transport in the bohai sea. Adv. Mar. Sci. 19, 1–9.
Wu D., Mao L., Li Q., Bao X., Wan X. (2004). Long-term variation characteristics of the salinity of the Bohai Sea and the probable leading factors (in Chinese). Prog. Natural Sci. 14, 191–195.
Wu L., Wang X., Xiong X. (2013). Assessment of tidal stream energy in the Bohai Strait using a high resolution model. Adv. Mar. Sci. 31, 12–21.
Wu X., Wu H., Wang H., Bi N., Duan H., Wang C., et al. (2019). Novel, repeated surveys reveal new insights on sediment flux through a narrow strait, Bohai, China. J. Geophysical Research: Oceans 124, 6927–6941. doi: 10.1029/2019JC015293
Yu X., Guo X., Gao H., Zou T. (2021). Upstream extension of a bottom-advected plume and its mechanism: The case of the Yellow River. J. Phys. Oceanography 51, 2351. doi: 10.1175/JPO-D-20-0235.1
Zhang L. (2019). Seasonal variations of mass transport between Bohai Sea and Yellow Sea — A numerical modeling study. (Harbin, China: Harbin Institute of Technology).
Zhang Z., Qiao F., Guo J., Guo B. (2018). Seasonal changes and driving forces of inflow and outflow through the Bohai Strait. Continental Shelf Res. 154, 1–8. doi: 10.1016/j.csr.2017.12.012
Zhang Z., Qiao F., Guo J., Yu F. (2010). Seasonal variation of coastal water movement in the southern Bohai Sea and water exchange between the Bohai Sea and the Yellow Sea. Adv. Mar. Sci. 28, 142–148.
Zhang N., Wang J., Wu Y., Wang K., Zhang Q., Wu S., et al. (2019). A modelling study of ice effect on tidal damping in the Bohai Sea, Ocean Engineering, Vol. 173. 748–760.
Zhao B., Cao D. (1998). Dynamic analysis and numerical modeling of forming mechanisms of winter circulations in the Bohai Sea. Oceanologia Limnologia Sin. 29, 86–96.
Zhao P., Jiang W., Mao X., Gao H., Guo X. (2010). Salinity change and influencing factor in the Laizhou Bay from 2000 to 2005. Oceanologia Limnologia Sin. 41, 12–23.
Keywords: time lag, water exchange, Yellow River discharge, Bohai Strait, numerical modeling
Citation: Wu D, Yu X, Guo X, Wang Y, Gao H, Zou T and Tang J (2025) Delay effect of Yellow River discharge on the water exchange through the Bohai Strait. Front. Mar. Sci. 12:1512318. doi: 10.3389/fmars.2025.1512318
Received: 16 October 2024; Accepted: 10 April 2025;
Published: 30 April 2025.
Edited by:
Youyu Lu, Bedford Institute of Oceanography (BIO), CanadaReviewed by:
Qianqian Liu, University of North Carolina Wilmington, United StatesXianmin Hu, Bedford Institute of Oceanography (BIO), Canada
Copyright © 2025 Wu, Yu, Guo, Wang, Gao, Zou and Tang. This is an open-access article distributed under the terms of the Creative Commons Attribution License (CC BY). The use, distribution or reproduction in other forums is permitted, provided the original author(s) and the copyright owner(s) are credited and that the original publication in this journal is cited, in accordance with accepted academic practice. No use, distribution or reproduction is permitted which does not comply with these terms.
*Correspondence: Xiaojie Yu, eXhqQG91Yy5lZHUuY24=