 Kathryn L. Sobocinski1*
 Michael LeMoine2
 Joshua W. Chamberlin3
 Letitia Conway-Cranos4
 Annelise Del Rio5
 Heida L. Diefenderfer6,7
 Correigh M. Greene3
 Jason Hall8
 Gary E. Johnson6
 Ronald M. Thom5
 Elene Trujillo5
 Todd Zackey9
- 1Department of Environmental Sciences, Marine and Coastal Science, Western Washington University, Bellingham, WA, United States
- 2Research and Recovery Program, Skagit River System Cooperative, La Conner, WA, United States
- 3Fish Ecology Division, Northwest Fisheries Science Center, NOAA Fisheries, Seattle, WA, United States
- 4Estuary and Salmon Restoration Program, Washington Department of Fish and Wildlife, Olympia, WA, United States
- 5Science and Evaluation, Puget Sound Partnership, Olympia, WA, United States
- 6Coastal Sciences Division, Pacific Northwest National Laboratory, Sequim, WA, United States
- 7School of Environmental and Forest Sciences, College of the Environment, University of Washington, Seattle, WA, United States
- 8Cramer Fish Sciences, Watershed Sciences Lab, Issaquah, WA, United States
- 9Marine and Nearshore Program, Tulalip Tribes of Washington, Tulalip, WA, United States
Ecosystem restoration is a common tool for re-establishing ecosystem processes, structures, and functions to improve biodiversity and services in coastal and estuarine ecosystems. In the Salish Sea, salmon habitats have been fragmented, reduced in size, and diminished in quality, and the ecosystem processes that form and sustain these habitats have been degraded and disrupted as well. This loss is especially prevalent in estuaries, where up to 90% of former salmon habitat has been lost or compromised. Salmon species are integral to the identities and cultures of people in the Pacific Northwest, yet salmon abundances remain at historic lows, especially in urbanized areas. Recent investments in restoration are creating rearing habitat and repairing lost ecosystem function. However, restoration efforts in this region have largely proceeded at the site scale, with less attention to big-picture thinking regarding how restoration will effectively recover degraded or lost habitats for target species. As a result, no landscape-scale evaluation program exists, and the cumulative benefits of multiple interventions are unknown. We describe innovative methods for science synthesis related to the evaluation of cumulative effects of ecosystem restoration for Pacific salmon, using years of existing, but disparate data. Building from previous work on cumulative effects evaluation and incorporating a hierarchy of hypotheses approach, we propose using causal inference across numerous hypotheses in a framework to assess the cumulative benefits to Pacific salmon from multiple estuarine restoration projects. We present the framework as a method that can be used to address many complex questions and provide examples from the Salish Sea where the approach is being implemented. The framework draws on science synthesis from numerous fields and uses a hierarchy of hypotheses, causal analysis at multiple scales, and a new hierarchy of synthesis for assessing multiple lines of evidence documenting restoration effects on Pacific salmon. We propose causal inference to synthesize dissimilar data streams, in our case, to identify various manifestations of cumulative effects of restoration and benefits to salmon, and to further inform restoration and recovery planning. A unifying framework would allow for the detection of thresholds at which restoration provides measurable improvement and would greatly advance understanding of the effects of restoration on ecosystems.
1 Introduction
Ecosystem restoration is an increasingly common tool for re-establishing ecosystem processes, structures, and functions to improve biodiversity and services in coastal and estuarine ecosystems with legacy land-use changes. Such restoration efforts reflect a worldwide challenge to recover habitat (Silliman et al., 2015) for migratory bird populations (Casazza et al., 2021), intertidal invertebrates (Needles et al., 2015), diadromous species (Chen et al., 2014; Bartz et al., 2015), and other species in the face of widespread local anthropogenic impacts (Greene et al., 2015; Brophy et al., 2019; Murray et al., 2022) and climate-driven coastal change (Pontee, 2013). However, many of these efforts are proceeding at the site scale with less attention to big-picture thinking regarding connectivity and how restoration will cumulatively address recovery of degraded or lost habitat mosaics and species (Sánchez-Arcilla et al., 2022). In some systems, coordinated efforts have explicit goals to increase connectivity within the ecosystem (e.g., Floodplains Reimagined in California’s Central Valley, https://floodplainsreimagined.org/; REST-COAST in EU countries, https://rest-coast.eu/), yet research on the cumulative benefits of restoration across landscapes is nascent.
The U.S. Federal listing of Puget Sound Chinook salmon (Oncorhynchus tshawytscha) under the Endangered Species Act prompted a wide range of recovery and protection efforts throughout the species’ life cycle, spanning the natal headwaters where the fish spawn, as well as the streams, rivers, and estuaries that provide important rearing opportunities along their migration to the Pacific Ocean, where they mature (NOAA, 2007). Since 1999, over 3,400 acres have been restored in nearshore and estuarine systems in Puget Sound (Puget Sound Partnership, 2023), with additional projects occurring within the U.S.-Canada transboundary Salish Sea ecosystem (DFO, 2023). Given the documented value of functional coastal wetlands (Barbier et al., 2011) and major investments in restoration efforts in many nations (de Groot et al., 2013; Wainger et al., 2017), understanding the cumulative effects of multiple restoration actions within and across landscapes and seascapes is necessary for effective management, yet methodology for such synthesis is lacking (NASEM, 2022).
The pressing need for synthesizing data from multiple restoration actions across a large spatial scale (basin-wide), and over a long period of time (decades), can be met using an approach called cumulative effects evaluation (CEE, Diefenderfer et al., 2016). While assessments of the cumulative impacts of multiple stressors on species and ecosystems have been implemented in response to the National Environmental Policy Act for many decades (Preston and Bedford, 1988; Smit and Spaling, 1995; Foley et al., 2017), the further development and application of a conceptually similar approach for the cumulative effects or assumed benefits of restoration (Box 1) is relatively new. The purpose of a cumulative effects evaluation is to analyze the combined effects produced from a suite of restoration actions across a landscape to inform programmatic adaptive management and recovery planning. Here, we assess cumulative effects as the collective results of human actions across a landscape that aim to produce beneficial outcomes resulting in net ecosystem improvement (Thom et al., 2005; WSAS, 2022a, b).
Box 1. Definition of cumulative effects as used here.
Cumulative Effects in the context of ecosystem restoration are the “…collective additive, synergistic, and antagonistic effects of all restoration activities that occur within a setting defined by common or connected characteristics of hydrology, geomorphology, ecology, ecological function, and biodiversity.” NASEM (2022; p.61).
Methodologies for assessing cumulative effects are relatively new and draw from science synthesis (Carpenter, 2009; Kemp and Boynton, 2012) and systematic review and weight of evidence approaches (Hill, 1965). An evidence-based method to evaluate the cumulative effects of restoration actions was developed and successfully implemented in the Columbia River estuary (Diefenderfer et al., 2011, 2016) and has gained traction and acceptance in other coastal and fluvial regions (Diefenderfer et al., 2021; LaPeyre et al., 2022; NASEM, 2022; Gladstone-Gallagher et al., 2023, 2024). Researchers have investigated landscape-scale effects of ecological restoration actions in other large-scale coastal systems, including Northeastern U.S.A. coastal states (Burdick et al., 1997; Burdick and Roman, 2012; McKown et al., 2024), Florida Everglades (LoSchiavo et al., 2013), Gulf of Mexico coast (Peyronnin et al., 2013; Diefenderfer et al., 2022), and the San Francisco Bay (Kimmerer et al., 2005) and Sacramento deltas (DiGennaro et al., 2012), enabling synthesis at ecosystem scales, where suitable data exist. Notably, a National Academies of Science, Engineering, and Medicine (NASEM) committee proposed using a cumulative effects evaluation framework to evaluate the effects of Gulf Coast ecosystem restoration efforts in response to the Deepwater Horizon oil spill in 2010 (NASEM, 2022; Greening et al., 2023; Davenport et al., 2024), demonstrating the need for, and perceived benefits from, large-scale evaluation.
As efforts toward species recovery build and older habitat restoration projects mature, our ability to use long-term monitoring to detect change increases. This is especially true where comprehensive monitoring of fundamental structures and processes has occurred at the site scale. However, regional scale effects of conservation actions, while likely critically important, are challenging to detect due to limitations in assessment methodology (Osenberg et al., 2006; Bisson et al., 2024) and the high degree of noise in coastal systems (Cloern et al., 2016). Uncertainty is increased by physical processes that change at numerous time scales and where much habitat remains heavily impacted (Bilby et al., 2024). Nevertheless, we believe empirical data collected piecemeal over decades within and across watersheds enables the development and implementation of novel methods for addressing landscape- and seascape-level effects of multiple site-scale restoration actions.
We outline here innovative methods for synthesis related to the evaluation of cumulative effects of ecosystem restoration for Pacific salmon. Building from the work of Diefenderfer et al. (2016) and Heger et al. (2021) and using over 20 years of restoration site data across numerous projects, we have developed a synthesis methodology (Carpenter, 2009) to assess the cumulative benefits to Pacific salmon from multiple restoration projects. Our methodology draws on previous work on science synthesis (Pickett, 1999; Kemp and Boynton, 2012; Diefenderfer et al., 2022) and uses a hierarchy of hypotheses approach (Heger et al., 2021) for assessing multiple lines of evidence using causal analysis. This is the first evidence-based cumulative effects evaluation to be performed at this scale in Puget Sound, although other efforts to evaluate beyond site-scale effects have been implemented in this region (Dethier et al., 2016; Bisson et al., 2024). While we apply our methodology to restoration of estuaries important to Pacific salmon, the approach is generalizable to any system, species, or problem where multiple, disparate data streams exist and where synthesis would further understanding and improve management.
Here, we provide a framework for synthesizing and evaluating the cumulative effects of restoration and demonstrate the application for habitat restoration designed to benefit Pacific salmon populations during their juvenile life stages in a subbasin of the Salish Sea. We document our approach including: the development of conceptual models that frame the research questions and describe the systems and species, describe a hierarchy of hypotheses that emerges from key research questions, identify and organize of lines of evidence, and detail an analytical framework involving causal analysis, collectively aimed at evaluating cumulative benefits using disparate datasets. We are currently applying the CEE framework to ecosystem restoration in the Whidbey Basin, Washington as an example of using the analytical approach at the system scale for addressing research questions, here related to restoration benefits for juvenile Pacific salmon. This article documents advances in the cumulative effects evaluation framework and describes a novel method for science synthesis.
2 Study system: estuarine restoration in Whidbey Basin, Washington
As part of the greater transboundary Salish Sea ecosystem, Puget Sound is one of the largest estuaries in the United States. Whidbey Basin (Figure 1), one of Puget Sound’s distinct hydrographic subbasins, is home to three of Puget Sound’s largest river deltas (the Skagit, Stillaguamish, and Snohomish Rivers). These three rivers collectively represent the largest freshwater inputs (a combined 60% of the freshwater inflow) to Puget Sound (Khangaonkar et al., 2011). In addition to freshwater input from the three major rivers, Whidbey Basin receives saltwater input via Deception Pass in the northwest, Swinomish Channel from Padilla Bay in the northeast, and via Possession Sound in the south.
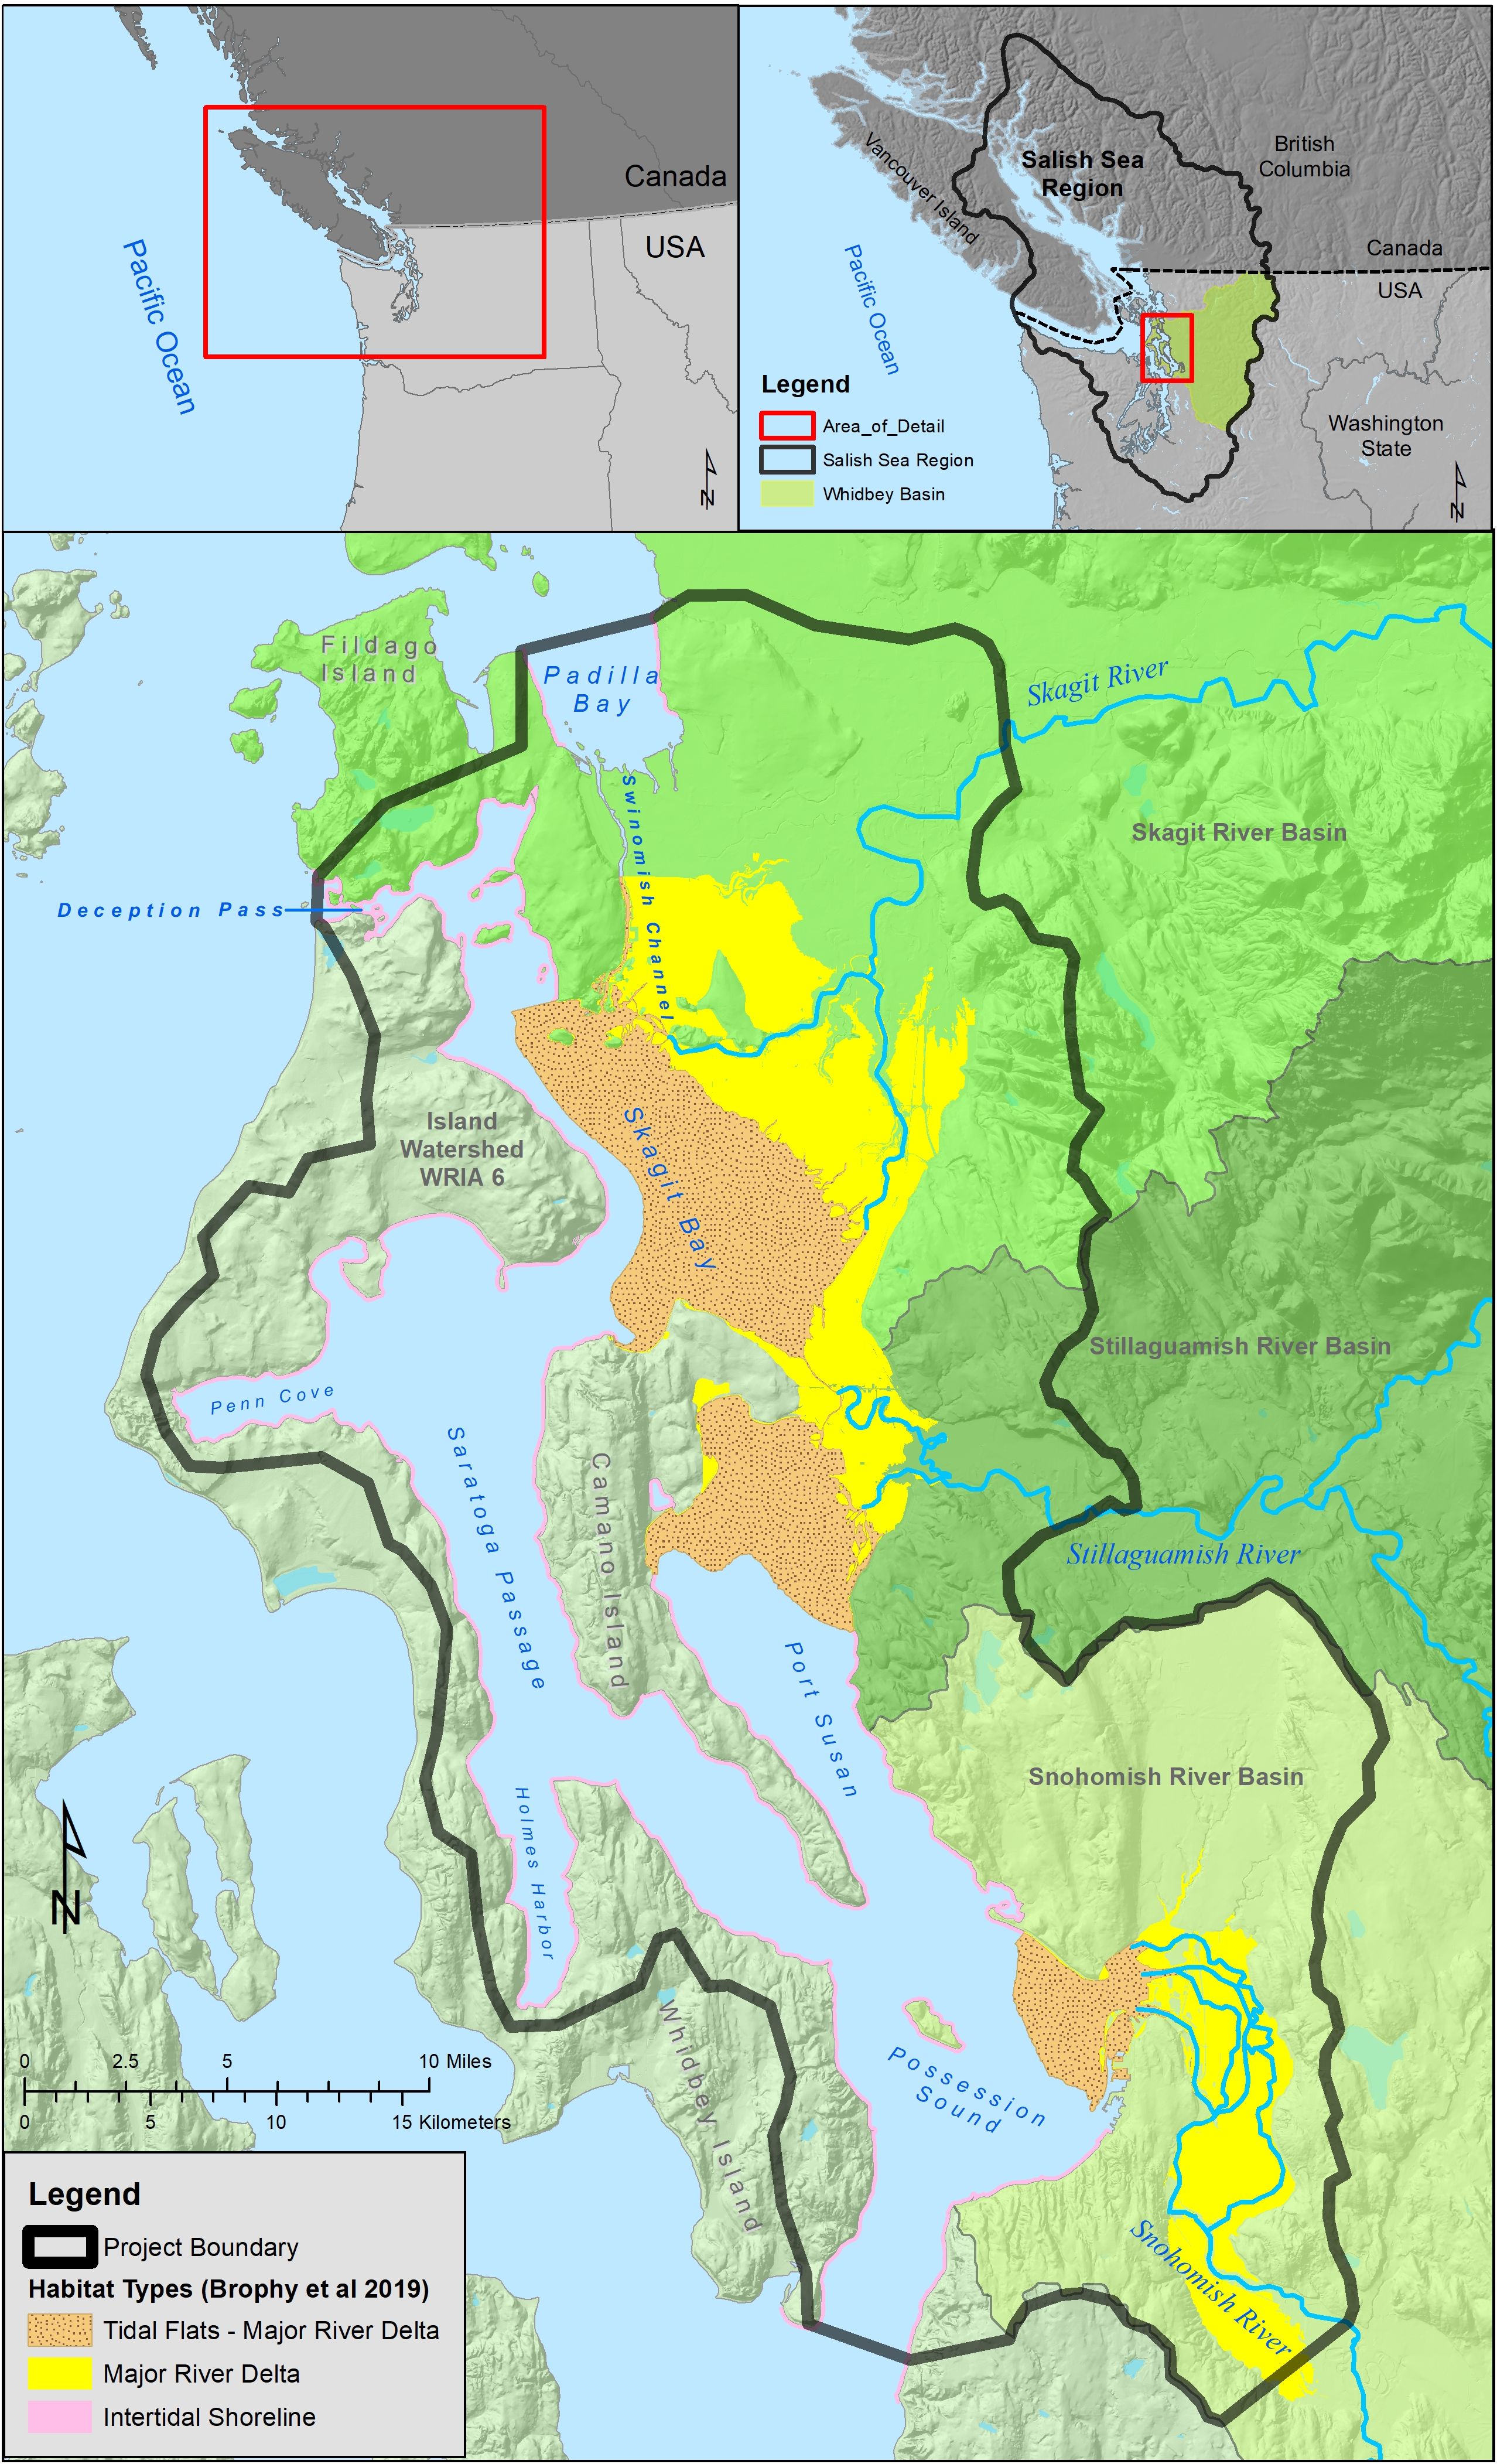
Figure 1. Whidbey Basin’s nearshore habitat areas across the three contributing watersheds (Skagit, Stillaguamish, and Snohomish Rivers, north to south, blue lines), connection to the marine waters via Deception Pass and Swinomish Channel to the north and Possession Sound to the south, and habitat types (color shading, based on Brophy et al., 2019).
The basin supports 10 of the 22 extant Chinook salmon populations in Puget Sound, and provides habitat for all salmonid species that historically occurred in the region (Ford, 2011). Chinook salmon use estuaries for feeding and growth, refuge, and migration as they transition from their natal freshwater habitats to the marine environment as juveniles. Additionally, recent evidence shows unexpected comingling of populations, where non-natal populations occupy nearshore marine and estuarine delta habitats (Beamer et al., 2013; LeMoine et al., 2022), emphasizing the importance of these areas in providing a suitable habitat mosaic for multiple populations during their early life histories.
More broadly, Pacific salmon are integral to the identity and culture of the Salish Sea region, yet salmon abundances remain at historic lows, especially in urbanized areas (Pearsall et al., 2021). Many Pacific salmon stocks have not experienced significant positive population change since they were first Federally listed under the Endangered Species Act (ESA) in 1999 (NOAA, 2007; Puget Sound Partnership, 2023). The causes of Puget Sound salmon population declines from historical levels are numerous and interconnected, related to their complex life history and use of diverse habitats across their life cycle, migrating from headwater streams to the ocean and back. Causes differ across salmon populations, but include: overharvest, poor water quality and contamination, habitat loss, barriers to migration such as culverts and dams, ocean conditions, and others (NOAA, 2007). Salmon habitats throughout the Salish Sea have been fragmented, reduced in size, and diminished in quality, while the ecosystem processes that form and sustain these habitats have been degraded and disrupted (Simenstad et al., 2011; Thom et al., 2012; Dethier et al., 2016). While changes in harvest management even before the Federal listing slowed population declines, reversing historical habitat loss has been the focus of recovery actions since the Federal listing (PSP, 2022).
Investments in ecosystem protection and restoration in Whidbey Basin are significant. State agencies, Tribal and local governments, and non-profit organizations have all implemented restoration projects in this region. Over $122M for land acquisitions intended for conservation and protection purposes and over $97M for restoration of salmon habitat have been invested in the Basin since 2000 (Washington State Recreation and Conservation Office’s PRISM database project data query for years 2000–2022, accessed 16 June 2023). Restoration and protection actions have occurred at 72 sites within the Whidbey Basin study area, representing a total of over 1,200 ha of tidal wetland area and beach habitats. Actions included shoreline armoring (e.g., seawalls and riprap used to reduce erosion) removal or modification, beach nourishment supplementation, tidal structure placement or modification (e.g., tidegates, floodgates, culverts), dike or levee removal or lowering, dike or levee structural breaching, channel creation or rehabilitation, overwater structure removal, creosote (piling and log) removal, invasive species removal, and native vegetation planting. The diversity of actions has resulted in restoration of multiple habitat types with varied outcomes, and yet, much of the three estuaries and associated nearshore habitats remains impacted by anthropogenic activities.
Given extensive habitat loss and continued depressed abundances of Pacific salmon in the Salish Sea, Federal, State, Tribal, and other entities working in the Whidbey Basin have implemented habitat restoration actions, maintained long-term habitat and species monitoring data, and performed numerous targeted research studies providing decades of site-specific data and producing reports and peer-reviewed articles documenting results. Efforts to implement and study estuary restoration within the urbanizing Salish Sea have led the way in addressing how ecosystem restoration benefits target species (Simenstad et al., 1982; Levings and MacDonald, 1991; Simenstad and Thom, 1996; Simenstad and Cordell, 2000). Evaluation of project success has occurred at the local, or site scale, and monitoring efforts vary considerably by project or location. Generally, site-specific results indicate restoration benefits to salmon (Simenstad and Cordell, 2000; Bottom et al., 2005; Ellings et al., 2016; Beamer et al., 2019), but effective restoration planning requires understanding the effects of restoration beyond project boundaries and population-specific domains (Simenstad et al., 2000). Meanwhile, there is increasing evidence that lack of estuarine habitat is limiting salmon productivity (Greene and Beechie, 2004; David et al., 2016; Davis et al., 2022; Sawyer et al., 2023), and accordingly, investment in restoration actions is increasing (Jaeger and Scheuerell, 2023; Bilby et al., 2024). Large-scale and comprehensive evaluations are necessary to inform and address critical scientific uncertainties, design or engineering improvements, and the effectiveness of implemented restoration actions.
3 Methods: cumulative effects evaluation
Building from the basic elements previously established for cumulative effects evaluations (scope and key research questions, conceptual models, hypotheses and indicators, lines of evidence, causal criteria analysis, cumulative effects modes, and conclusions; Diefenderfer et al., 2011, 2016), we developed a new, detailed framework for synthesis and evaluation grounded in our understanding of ecosystem science and regional salmon ecology to drive synthesis methodology forward and assess the cumulative effects of restoration. There are three primary components to the CEE framework presented here: 1) the Hierarchy of Hypotheses, 2) Causal Analysis, and 3) Hierarchy of Synthesis (Figure 2). The first component leverages existing expertise to identify research questions, create conceptual models to articulate understanding, and generate a suite of nested hypotheses. The second component uses observation, primarily through existing data and publications, to build lines of evidence related to each hypothesis, and applies causal criteria analysis for evaluation. The final component, Hierarchy of Synthesis, uses the causal analysis to draw inferences about the cumulative effects of ecosystem restoration across tiers of nested hypotheses and to derive conclusions. In this article, we present the key aspects of the analysis, synthesis, and evaluation framework, define terminology (Supplementary Appendix A), and provide details of application to our study system.
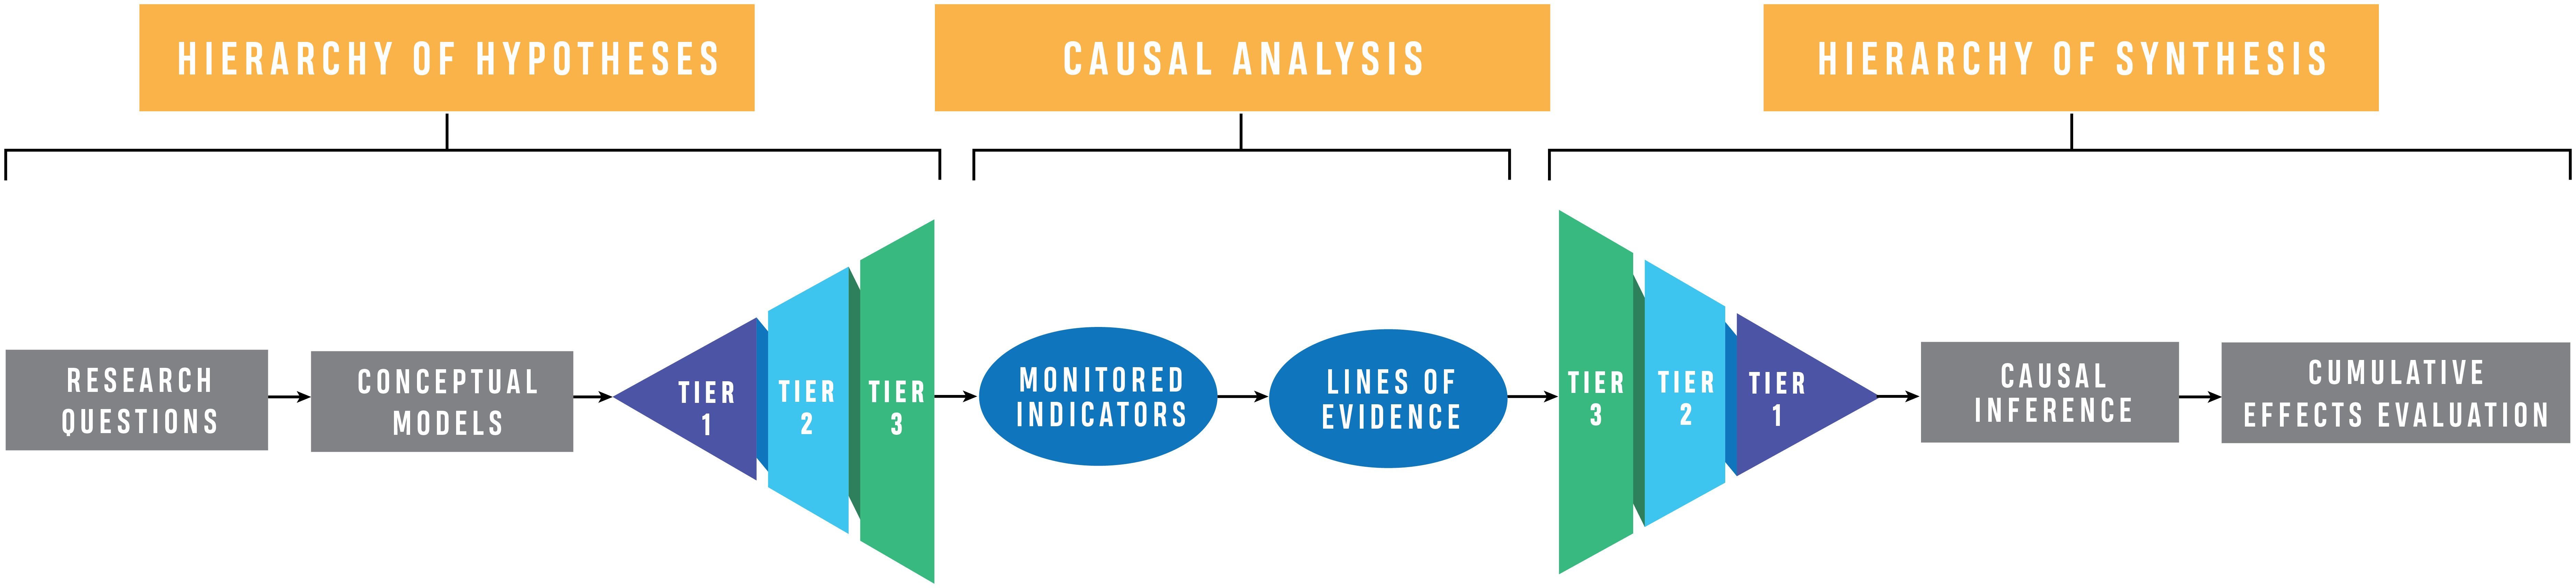
Figure 2. Cumulative effects evaluation framework described herein, with incorporation of three main elements: 1) Hierarchy of Hypotheses, including defining research questions, developing conceptual models, and articulating hypotheses, 2) Causal Analysis, focused on generating lines of evidence and assessing causal relationships, and 3) Hierarchy of Synthesis, building causal inference and determining cumulative effects.
3.1 Hierarchy of hypotheses
3.1.1 Scope and key research questions
Identifying key research questions and scope for the evaluation is foundational to CEE design. This provides purpose for the evaluation and addresses scientific uncertainties. Furthermore, it is necessary to draw boundaries for the evaluation’s scope to direct the associated analyses. These steps can be undertaken during workshops involving experts with knowledge of the ecosystem, the species of concern, and with interest, generally, in cumulative effects evaluation.
Of primary interest in our case is the need to address scientific uncertainties related to the effectiveness of restoration actions in achieving salmon recovery (Puget Sound Science Panel, 2020). Therefore, the goal of this CEE is to identify the cumulative effects of restoration projects on Chinook salmon populations in the Whidbey Basin, WA, USA, focusing on two key research questions: 1) What are the benefits from restoration of estuarine habitats for salmonid populations in the Whidbey Basin in the face of continued impacts? 2) After restoration is implemented, what are the trajectories of juvenile salmon population characteristics, and how are they linked to habitat improvements in the Whidbey Basin?
The current analysis focuses entirely on juvenile Chinook salmon, given their population status, importance, and the heavy reliance on various estuarine and nearshore marine habitats during the juvenile life stage. We drew boundaries for the scope of the project (e.g., in space and time, as well as in topical focus) to aid in honing tractable research questions and directing analyses. The research team (authors of this paper) carried out these tasks in workshops that included regional experts with knowledge of the ecosystem, Pacific salmon, and cumulative effects evaluation, organized by the Puget Sound Partnership, a Washington state agency coordinating habitat restoration and protection efforts in Puget Sound. Our CEE is bounded from 1990 to present, given the available data, timeline for salmon population listing (1999, for most populations), and the implementation of the majority of restoration actions in the basin. The focal components and scope of the Whidbey Basin CEE are outlined in Table 1.
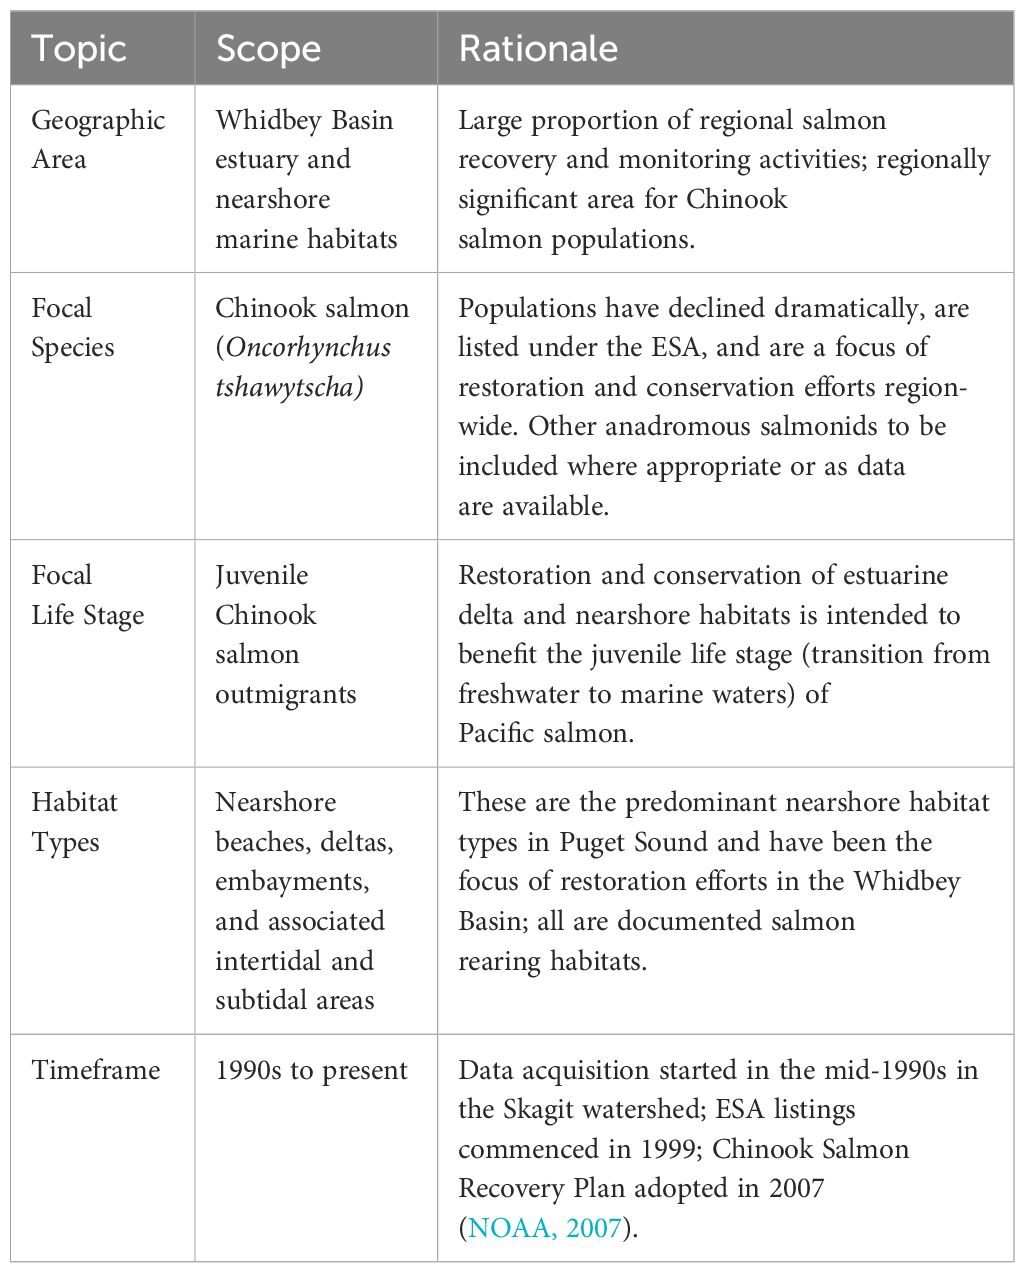
Table 1. Scope for the Whidbey Basin cumulative effects evaluation.
3.1.2 Conceptual models
The first step to address the research questions is development of a set of conceptual ecosystem models to articulate understanding and linkages relevant to the research questions and scope of evaluation. Conceptual ecosystem models are science-based representations of complex human-natural systems (Heemskerk et al., 2003; Kelble et al., 2013). They illustrate critical interdisciplinary connections and are integral to a CEE, providing a visualization of hypothesized causal relationships that underpin understanding of the system and how it might respond to restoration actions (King and Hobbs, 2006). The models identify the elements of the ecosystem that are critical to evaluating effects (here, of benefit to salmon) and employ underlying knowledge, both evidence and causal inference, to show connections between these elements. The intent is to strike a balance between being overly simple and excessively complex, because it is essential that the models be easy to understand and communicate. In addition to guiding research, conceptual models are useful communication tools for visually representing ideas and connections (Heemskerk et al., 2003). To this end, we developed three conceptual models, each focused on a different aspect of salmon use of the ecosystem. The conceptual models organized existing knowledge of the system, salmon, and restoration and were foundational to the CEE in structuring the questions, analyses, and inferences within.
The three conceptual models we developed are: Chinook Salmon Life History Context Model to articulate relationships between Chinook salmon use of the estuary and adjacent habitats; Spatial Context Model to describe the Whidbey Basin and physical drivers within; and Restoration Context Model, both detailed and simplified, to demonstrate linkages between restoration actions and habitat structure and function. All models are fully described in Supplementary Appendix B to demonstrate the specificity of the conceptual models and utility for a CEE. We present the simple Restoration Context Model (Figure 3) for clarity in describing subsequent analytical steps.
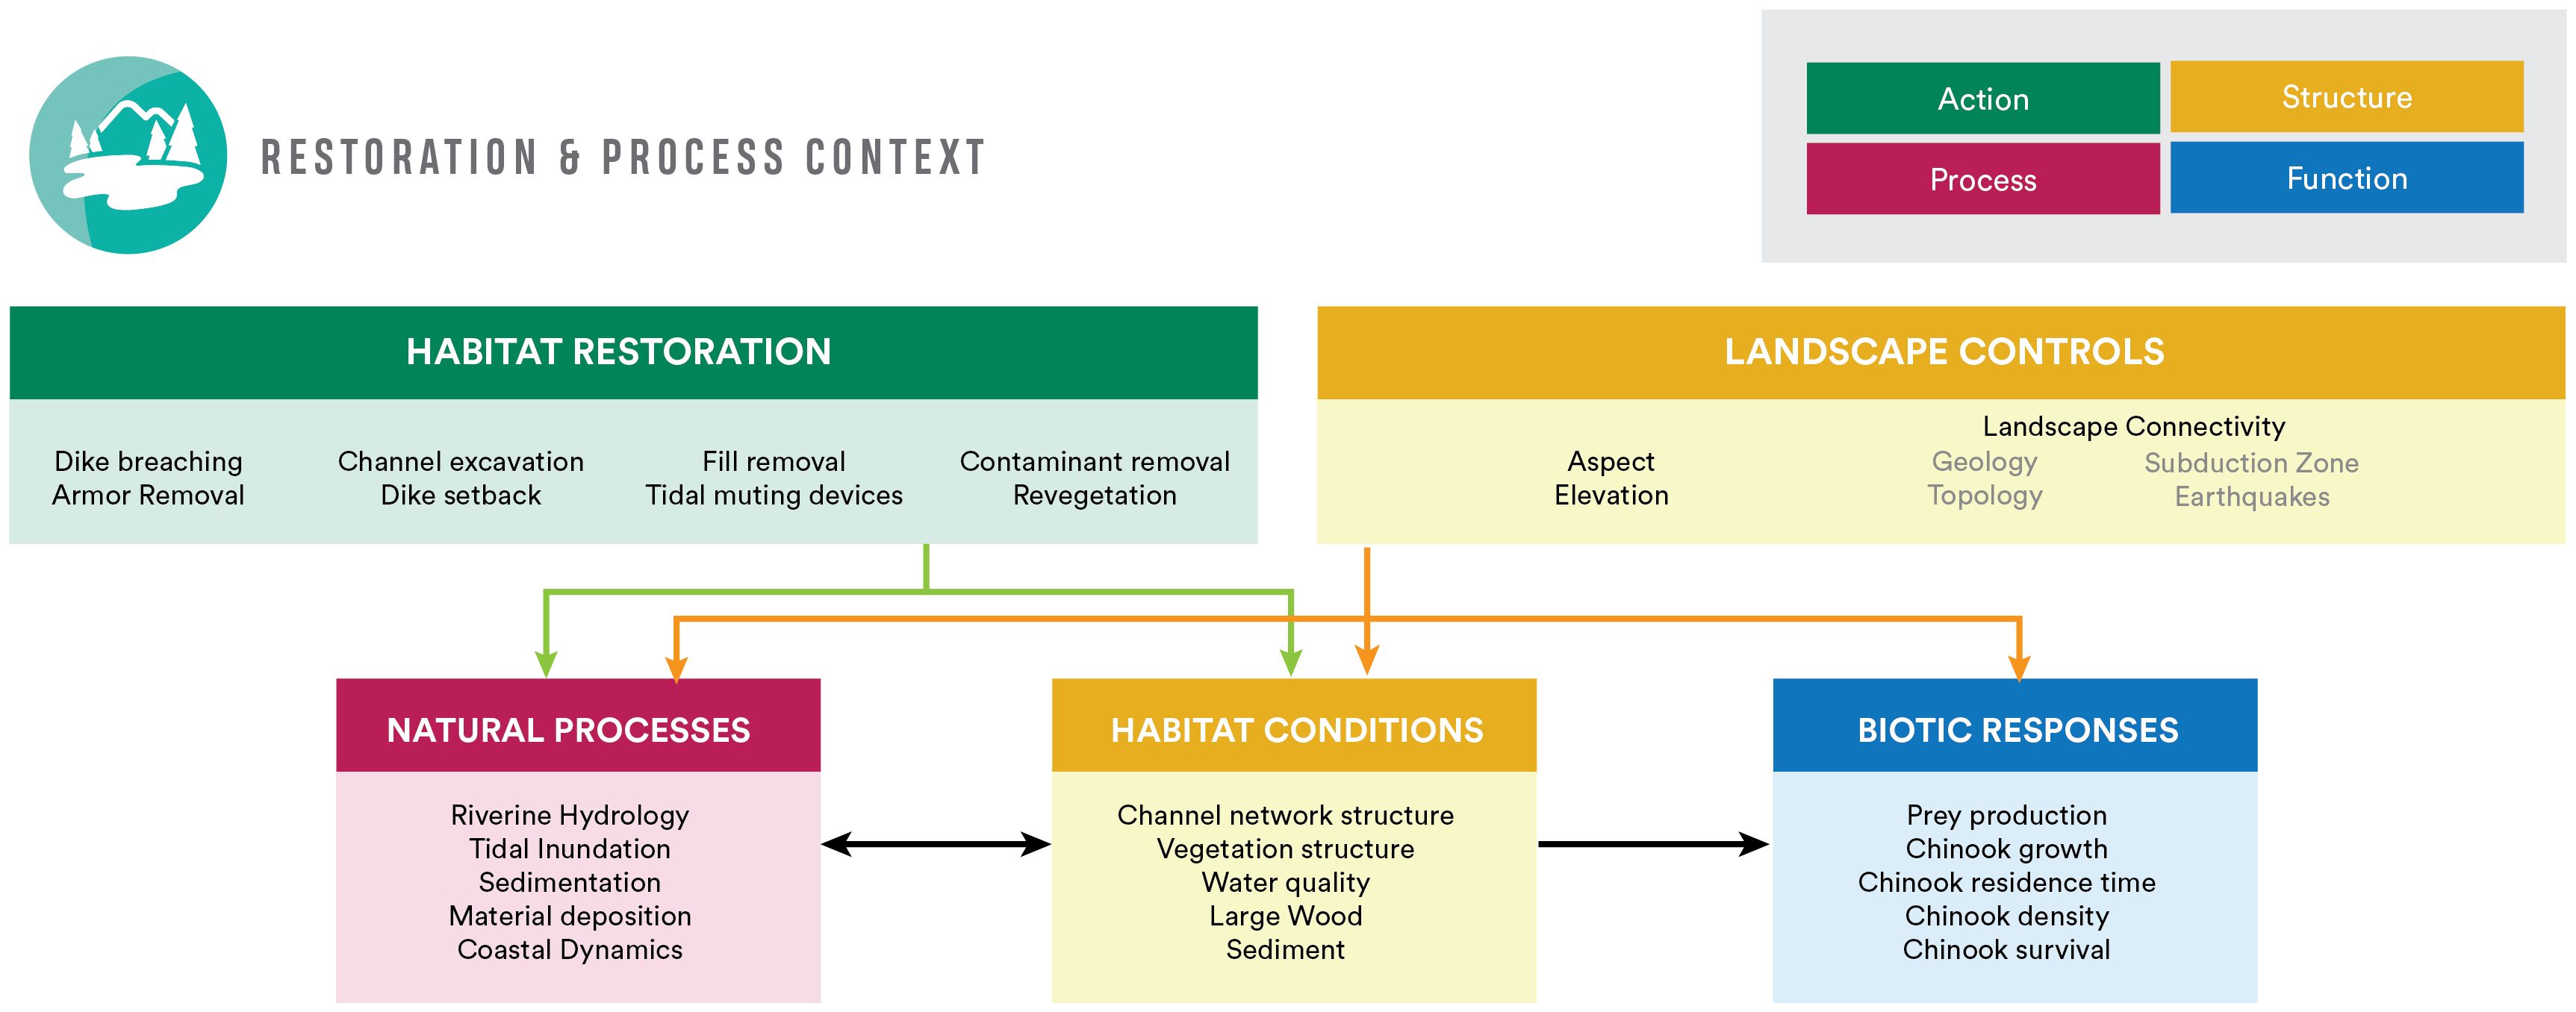
Figure 3. Simple restoration context model. This conceptual model shows actions, processes, structure, and functional responses that may influence and be altered by generalized restoration actions (green box). Gray text in the Landscape Controls box indicates extrinsic factors not explicitly considered in the Whidbey Basin cumulative effects study but that may be important across larger time/spatial scales.
The Restoration Context Model (Figure 3) focuses on restoration actions and their connections with habitats and the greater landscape and seascape. Landscape-scale controls (e.g., geology, elevation, aspect, topology/bathymetry, etc.) interact with natural processes (e.g., river flow and tidal inundation) to influence habitat conditions, as well as biotic responses at any site. Landscape connectivity is an important structural component that influences many processes and functions (Beamer et al., 2005, 2024; Chamberlin et al., 2022a); therefore, this concept is described in all conceptual models (Appendix B), and with respect to restoration specifically, in the Restoration Context Model. Restoration strategies are increasingly considering the influence of landscape connectivity in restoration design (Rudnick et al., 2012) and reconnecting habitat is a frequent goal of salmon habitat restoration (Littles et al., 2022). Connectivity is also an important factor in evaluating responses to restoration actions, for example, access by juvenile Chinook salmon to restored habitats for rearing and foraging.
3.1.3 Tiers of hypotheses
Conceptual models and hypotheses are coupled in a CEE framework in that conceptual models depict relationships and expected responses based on existing understanding and theory, from which hypotheses are drawn. Conceptual models were used to identify hypothesized relationships and inform testable hypotheses, which were articulated in nested tiers to drive analyses (Figure 4). We used the interrelated conceptual models described above and in Supplementary Appendix B to develop a series of hypotheses (Table 2) for the Whidbey CEE, following a “Hierarchy of Hypotheses” approach (Jeschke et al., 2012; Heger et al., 2021), with the aim of evaluating evidence for cumulative effects.
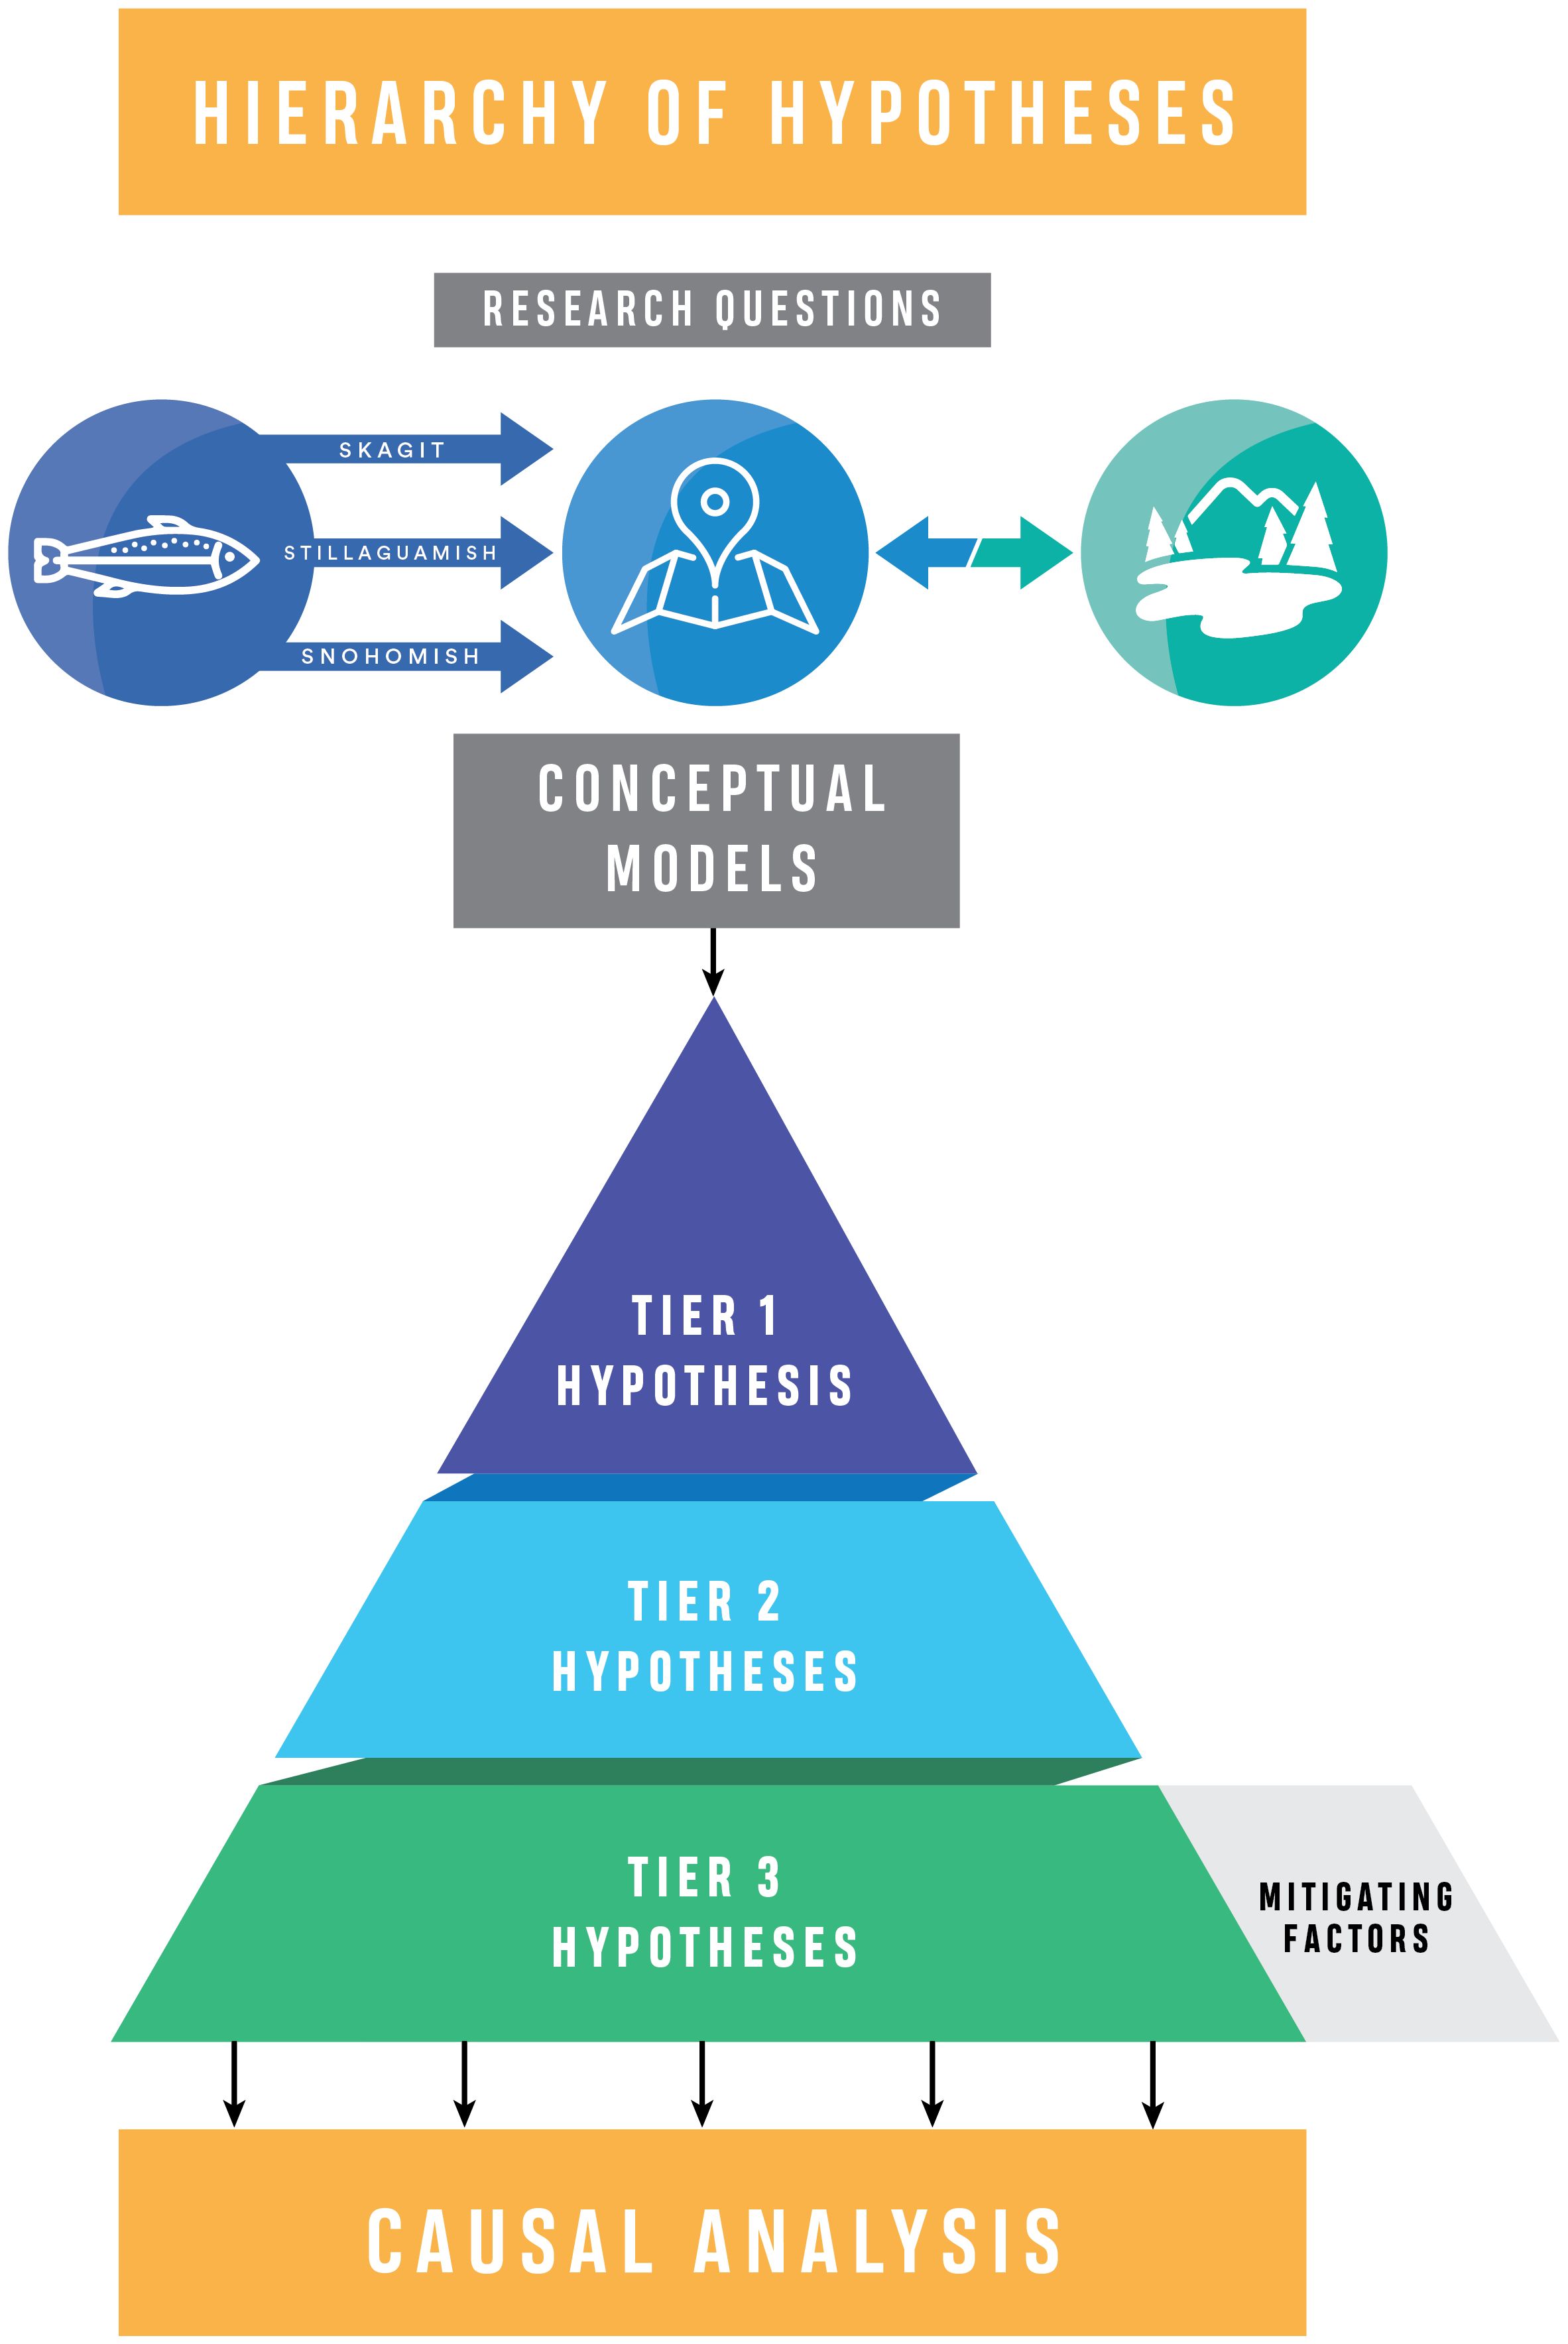
Figure 4. Hierarchy of hypotheses for the cumulative effects evaluation. Defining key research questions, crafting conceptual models, and articulating the nested hypotheses initiate the analysis. We also define mitigating factors, those factors that may limit inference, such as climate change or continued habitat loss. The Whidbey CEE project conceptual model showing the linkages between salmon life history, the Whidbey Basin study area, and restoration context is at the top. Causal Analysis is the subsequent analytical step.
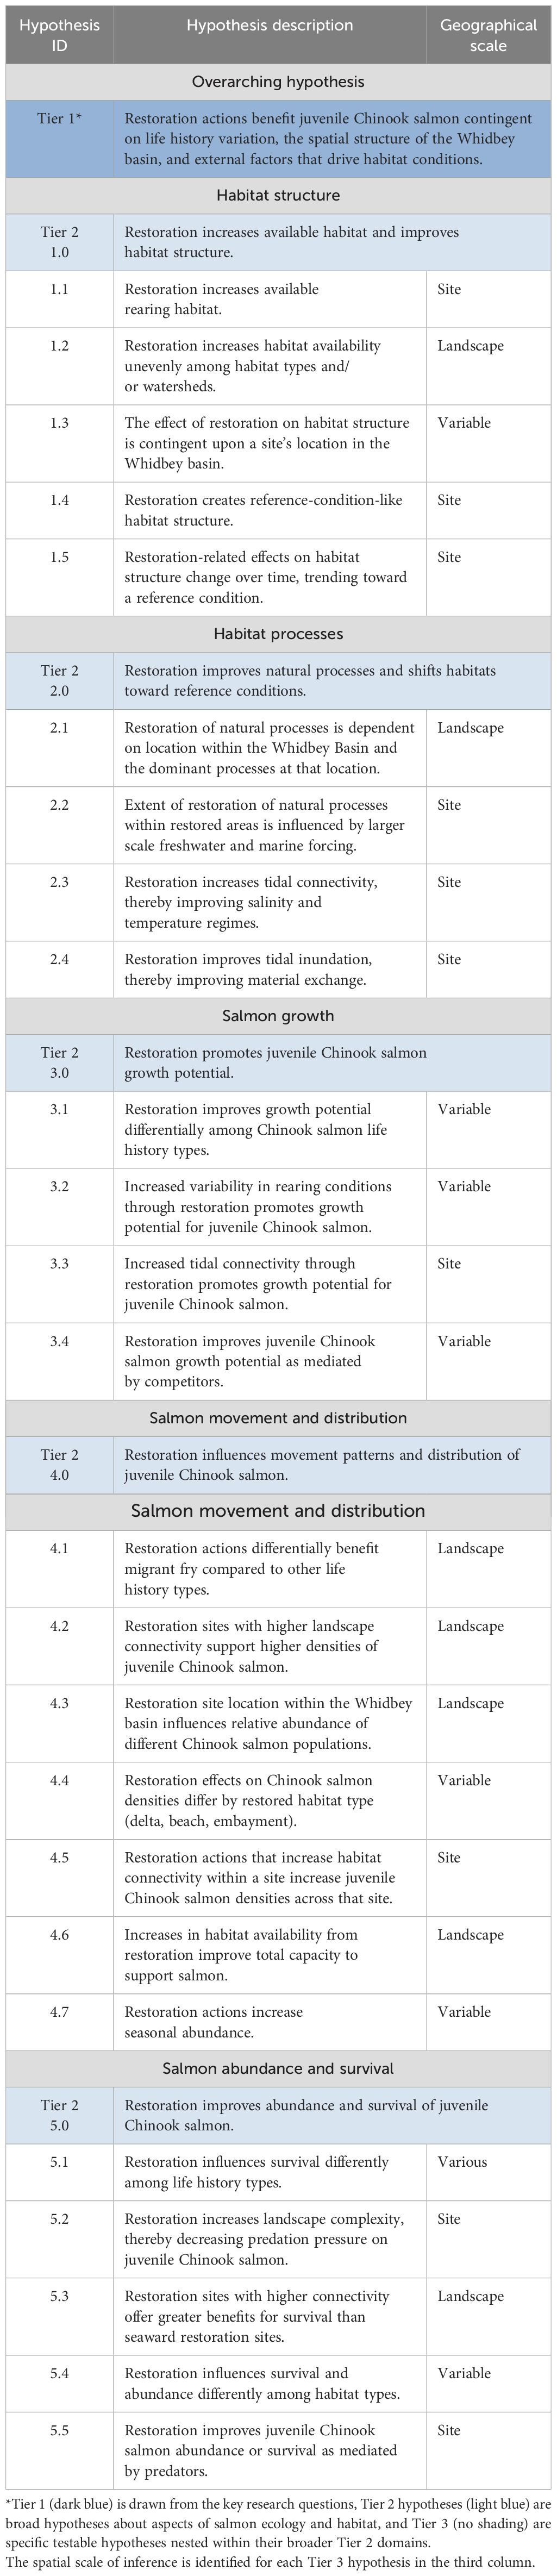
Table 2. Tier 1, 2, and 3 hypotheses.
A “Hierarchy of Hypotheses” approach (Heger et al., 2021) moves the investigation from a single overarching hypothesis (Tier 1, drawn from the key research questions), to general domain-specific hypotheses, in our case relative to habitat restoration actions and salmon response (Tier 2), and finally to more specific, testable hypotheses (Tier 3). This hierarchical approach facilitates building causal understanding across several levels of specificity and reflects the nested processes and scales that occur in nature (Wiens, 1989; Wiens et al., 1993; Cantor et al., 2017). For the CEE, this same structure is used to draw inference from analysis related to those hypotheses (see Hierarchy of Synthesis below).
A Tier 1 hypothesis is analogous to the “Overarching Hypothesis” of Heger et al. (2021), which is defined as an “unspecified assumption derived from a general idea, concept or major principle.” The Tier 1 hypothesis in our CEE is an umbrella statement about the cumulative effects of restoration on ecosystems with respect to salmon and is directly tied to the key research questions. For this study, the null hypothesis is that there is no evidence of cumulative effects of restoration actions.
Tier 2 hypotheses are akin in the hierarchy to “Operational Hypotheses,” defined by Heger et al. (2021) as a “narrowed version of an overarching hypothesis, accounting for a specific study design. Operational hypotheses explicate which method (e.g., which study system or research approach) is used to study the overarching hypothesis.” Tier 2 hypotheses do not imply a specific study design, and in fact, were designed to enable the inclusion of multiple studies through meta-analytic methods. Tier 2 hypotheses identify the specific system elements and response pathways used to draw inferences about the cumulative effects of habitat restoration on species and encompass the variation in spatial setting and characteristics of salmon and responses to restoration as articulated in the conceptual models.
In this CEE, the Tier 2 hypotheses were structured around five functional domains needed to address the question of cumulative effects of restoration for juvenile salmon (Table 2). Habitat-specific hypotheses were structured around two habitat elements: habitat structure (the amount, accessibility, and quality) and ecosystem processes (characterization and complexity of the habitat) following Schlenger et al. (2011; Figure 3; Table 2: Tier 2 hypotheses 1 and 2). For hypotheses regarding salmon functional attributes, we focused on three response pathways: growth, distribution and migration, and abundance and survival (Table 2: Tier 2 hypotheses 3, 4, and 5, respectively). We considered aspects of rearing (primarily growth, but also habitat availability), as well as distribution and abundance, as functional attributes. Migration and distribution account for the use of preferred habitats in space (whether for feeding or rearing), and abundance and survival account for both the numbers of fish using habitats (a measurable quantity) and their ability to complete the estuarine phase of their life history (i.e., realized function, Simenstad and Cordell, 2000), although this is difficult to parse from marine survival overall. These domains support evaluation of whether restoration has altered habitat and produced a biological response.
The most detailed and specific hypotheses are the Tier 3 hypotheses. Nested within each Tier 2 hypothesis, a suite of Tier 3 hypotheses articulate central assumptions about specific mechanisms of habitat restoration to biological response. These hypotheses are what Heger et al. (2021) term “Mechanistic Hypotheses,” and defined as a “narrowed version of an overarching hypothesis, resulting from specialization or decomposition of the unspecified hypothesis with respect to assumed underlying causes.” The Tier 3 hypotheses represent various alternative hypotheses to the null hypothesis of no cumulative effects of restoration for species recovery. With 4–7 hypotheses nested within each Tier 2 hypothesis, Tier 3 hypotheses pose central assumptions about specific mechanisms by which habitat and fish respond to restoration actions (Table 2). The Tier 3 hypotheses are specific enough to be testable, but broad enough to encompass multiple mechanisms, complex feedbacks, and expected non-linear responses. These complex responses would be difficult to discern with a single response variable or even via a single study, necessitating the more complex approach to evaluation proposed herein.
Implicit in each of the Tier 3 hypotheses is the variety of habitats that have been restored in the Whidbey Basin, from river-dominated delta sites to subtidal marine nearshore sites, and the protracted time within which restoration has occurred (late 1990s to present). In each location or site, the dominant processes vary, creating differences in primary structuring forces. At the site scale, a restoration project could have a large effect on structure and habitat processes; however, as the spatial scale increases, the local effect of that one restoration project could be undetectable given other ecosystem processes, similar to the riverscape concept (Fausch et al., 2002). The suite of hypotheses explicitly addresses spatial scale, where each is evaluated at the site or landscape scale. This structure acknowledges that ecological interactions change depending on the spatial extent (i.e., scale) that is observed (Wiens, 1989). Tiered hypotheses leverage information from prior evaluation of restoration actions, typically within a study, at the site scale, with the intent of the CEE to draw inferences at a broader geographic scale.
The same attention to scale is necessary when thinking about time with respect to organism life-history (Montero-Serra et al., 2018), especially for species like Pacific salmon that use multiple habitats across time. We also acknowledge that restoration trajectory (Simenstad and Thom, 1996; Borja et al., 2010) will evolve over time, all while surrounding conditions continue to change (Cloern et al., 2016; Coleman et al., 2020; Bilby et al., 2024). Additionally, restoration actions have occurred across several decades, meaning some sites have had more time to develop, or degrade, than others. In some cases, attributes of space and/or time are explicitly posited for exploration, but in other cases the inherent variability of multiple habitat types and differing dates of action are implied.
Scale can be invoked to address the effect of restoration on natural processes at site, system, and subbasin levels. Understanding the effects of time and space in any ecosystem and building the CEE analysis to accommodate relevant scales is essential for drawing causal inference. The goal of CEE is to move beyond site-scale inference, but because sites form the scale of observation from which we build our lines of evidence, we use this hypothesis framework and the Hierarchy of Synthesis (below) for drawing inference at broader scales.
3.2 Causal analysis
3.2.1 Monitored indicators and lines of evidence
Causal Analysis (Figure 5) involves identifying monitored indicators and lines of evidence, a step central to CEE methodology (Diefenderfer et al., 2011, 2016). For each Tier 3 hypothesis, a suite of relevant monitored indicators (e.g., water temperature, channel morphology, fish abundance) was identified from conceptual models, research questions, and existing experimental and observational data. An initial evaluation of available data collected within the Whidbey Basin indicated reasonable coverage of fish and habitat data across the habitat types identified in our conceptual models and among the three river systems, with deficiencies in some regions and habitat types. With such robust existing data, leveraging existing but disparate information is a substantial undertaking, as is extracting data conducive for meta-analyses. This work is currently on-going for our CEE, and in subsequent publications we will present the study-specific results.
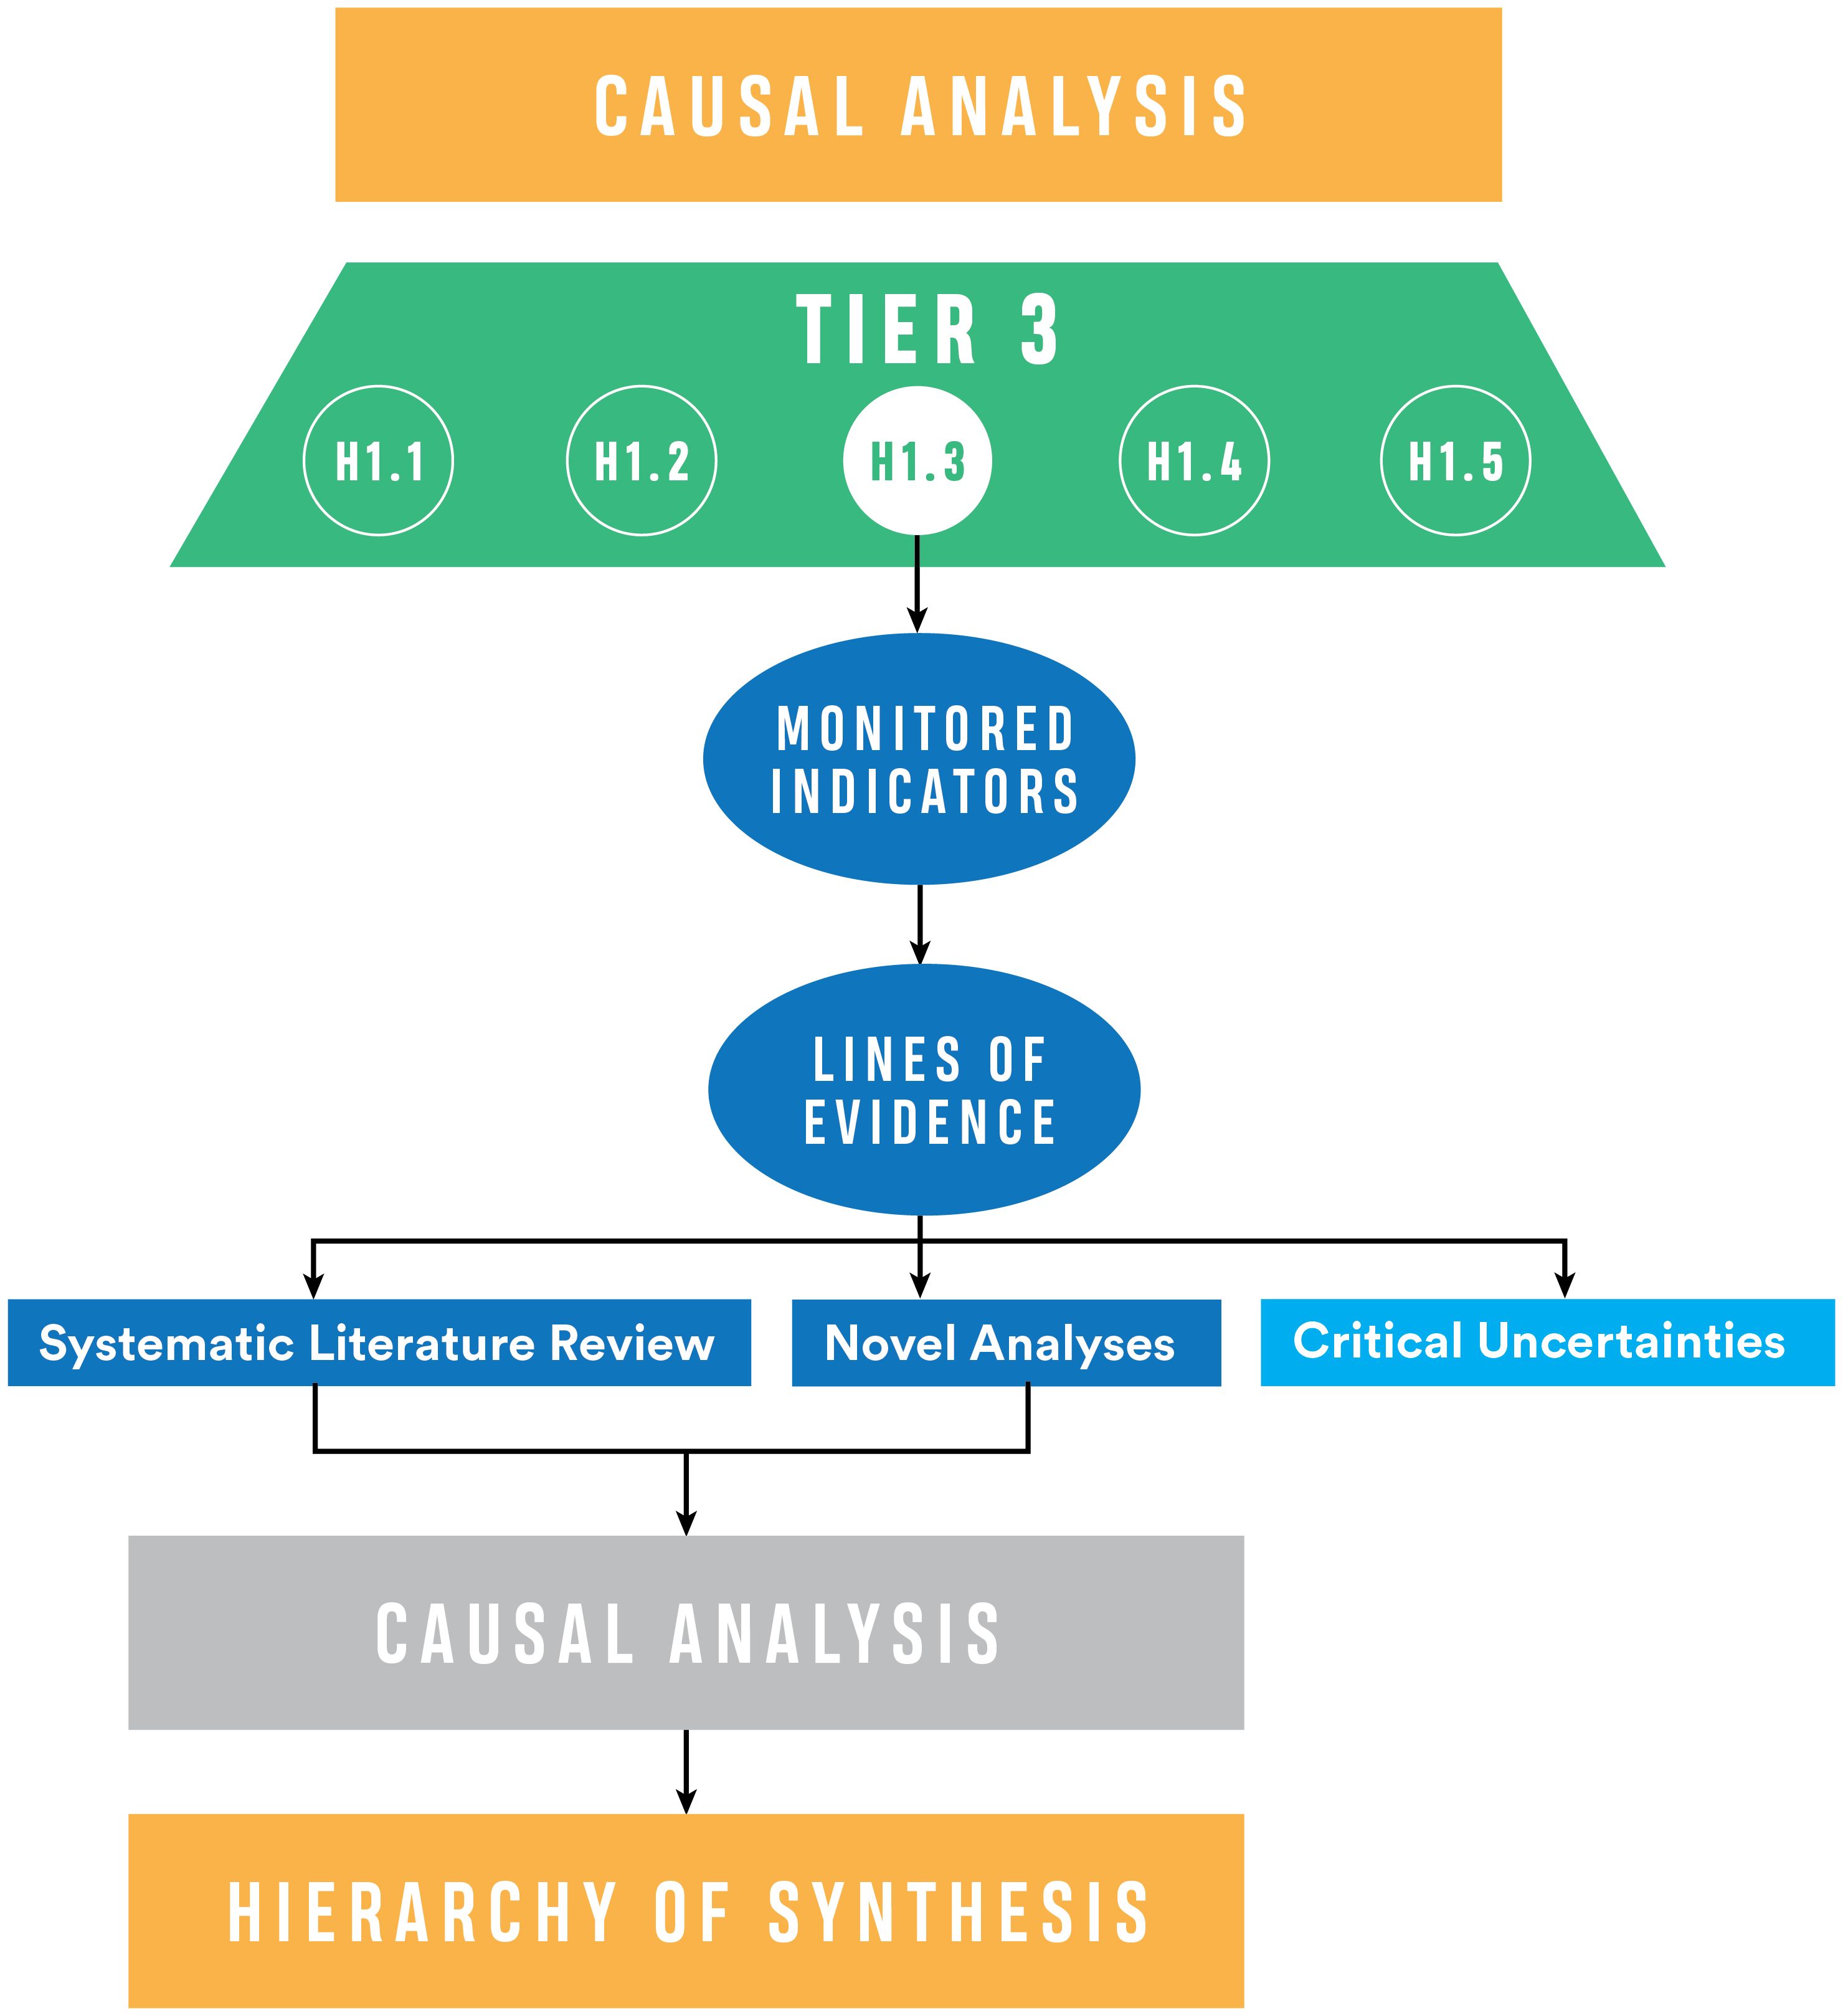
Figure 5. Causal analysis for the cumulative effects evaluation. Lines of Evidence are developed for the Tier 3 hypotheses, including literature review and empirical analyses, and evaluated with causal analysis. Critical uncertainties, those that cannot be addressed with existing information, emerge from the review for each hypothesis.
Each hypothesis is evaluated using one or more lines of evidence (Table 3), bringing multiple forms of inference together. While we developed lines of evidence similar to the approach described by Diefenderfer et al. (2011) and as recommended previously (NASEM, 2022; Greening et al., 2023), the framework herein centers the lines of evidence on review of existing literature, given the numerous published reports and vast quantities of data available, owing to years of collective monitoring and reporting. We used an evidence-based literature review adapted from previous approaches (Norris et al., 2012; Diefenderfer et al., 2016) that incorporates a weighting and scoring scheme to rank the strength and consistency of evidence for each hypothesis as a primary means of evidence (J. Hall, Cramer Fish Sciences, unpublished). The weighting scheme accounts for the robustness of a monitoring study design and includes scoring elements to reflect the overall study design and the level of spatial and temporal replication. The study scores are then summed and used to weight the available evidence for sufficiency and strength of evidence for each hypothesis via the literature review.
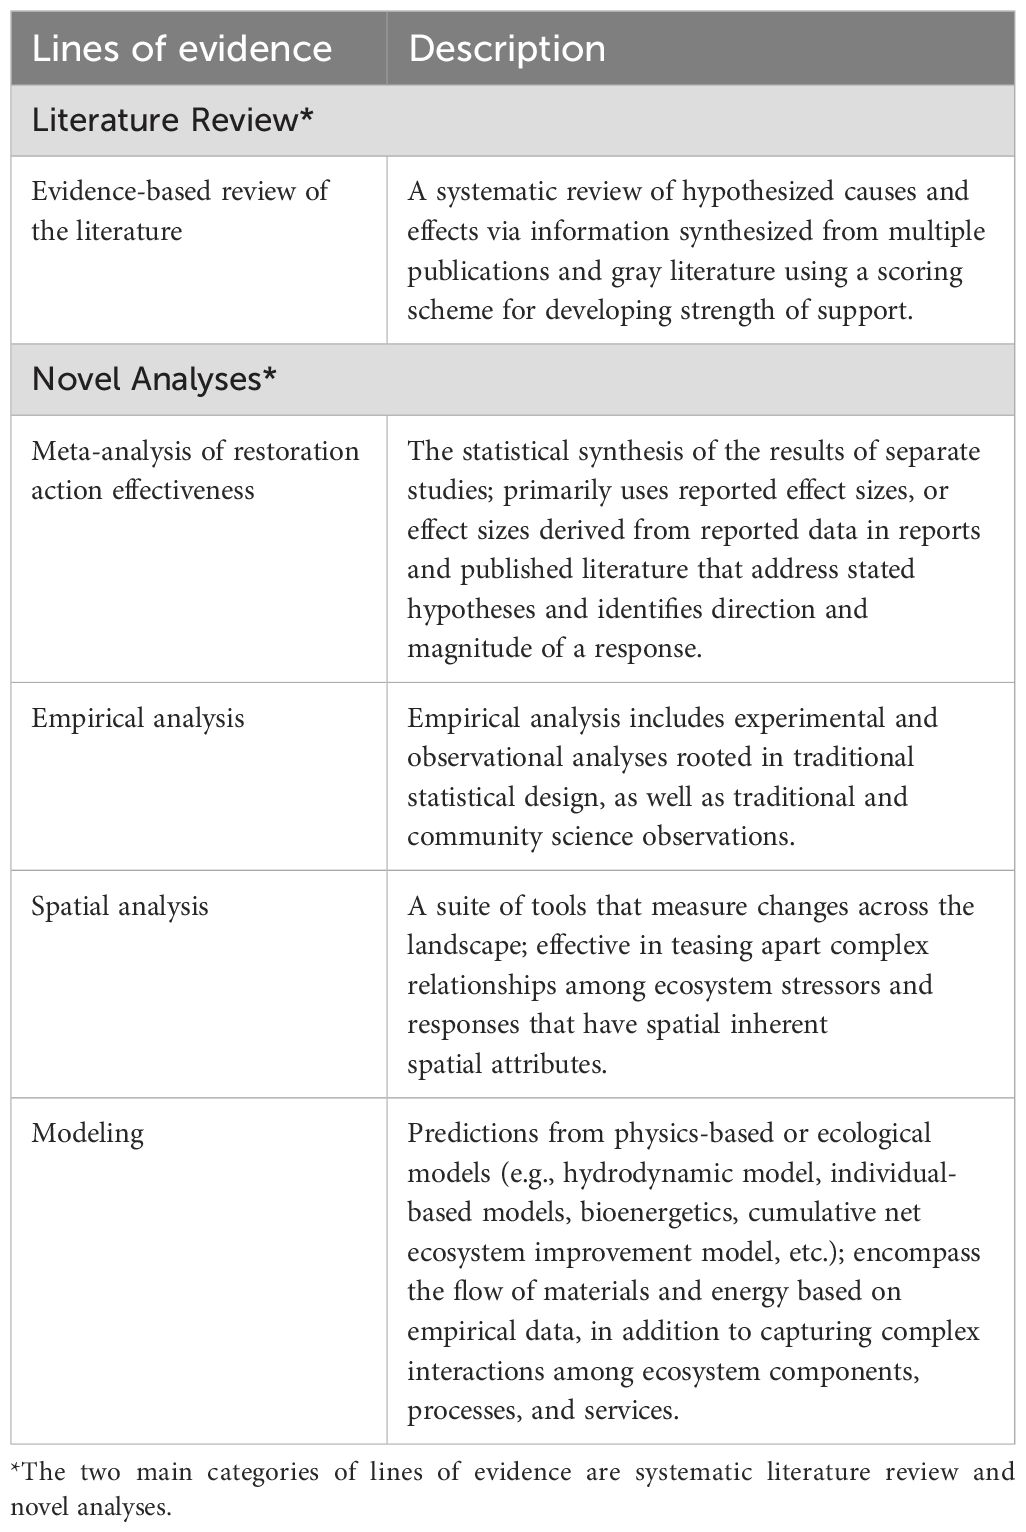
Table 3. Lines of evidence for the CEE framework, with descriptions, adapted from Diefenderfer et al. (2016); Greening et al. (2023).
The reliance on an exhaustive literature review means that not all hypotheses will need new analyses. Currently, we have identified approximately 1,000 sources (published papers, gray literature, unpublished data sets) associated with the Whidbey Basin that are derived from decades of data collection among project partners and collaborators. Still, the published record may be insufficient to evaluate some hypotheses, necessitating traditional empirical analyses (e.g., population trends analysis, habitat response to restoration), spatial analyses (e.g., land change evaluations), or modeling (e.g., hydrodynamic or bioenergetic modeling). In some cases, published literature or data to address a hypothesis may be absent or sparse enough that the line of inquiry is identified as a critical uncertainty (Figure 5, with additional detail in Supplementary Appendix C). The development of lines of evidence identifies hypotheses where evidence is sufficient for evaluation and others where better understanding is needed.
Where possible, multiple lines of evidence are applied collectively to a specific Tier 3 hypothesis, increasing strength of support. This inference represents deductive and inductive types of reasoning, elucidates additive and synergistic cumulative ecosystem responses to restoration actions within a complex landscape, and incorporates growing understanding of the specific ecosystem being investigated. In many cases, a hypothesis will have multiple lines of evidence associated with available information in the form of data, analyses, and publications. For example, to evaluate Chinook salmon growth, we could include measures of individual growth, simulated growth from bioenergetics models, and reported measures of individual growth from published literature from systems similar to those within the Whidbey Basin. Inherently, lines of evidence require a strong understanding of the diversity and quality of data available, which includes measured data, as well as synthesis reports and publications, both within the study system and among similar systems. Through extensive literature review, including scoring and weighting based on sampling design and robustness, existing information is being used to determine support for the causal criteria, specifically for the consistency of association.
The literature review and scoring are key steps in evaluating hypotheses; hypotheses that have multiple lines of evidence indicate the potential for causal inference, and thus, causal criteria analysis can be performed. The evidence-based literature review also identifies data gaps and key uncertainties that cannot be addressed with existing data or tools. Gaps and uncertainties may then be addressed by considering literature and data from other similar systems, or through new analysis of existing data, modeling, or development of research plans or recommendations. In addition to systematic literature review, novel analyses are underway to specifically address changes in habitat availability from habitat restoration and responses in juvenile Chinook salmon distribution across the Whidbey Basin.
3.2.2 Causal criteria analysis
Within each Tier 3 hypothesis, lines of evidence are evaluated using causal criteria (Table 4). Causal criteria analysis (CCA) has provided ecologists with a powerful tool for quantifying (putative) cause-effect linkages. Within a CCA, causal criteria (Table 4) are arguments to evaluate strength of cause-effect relationships and are applied to multiple lines of evidence for specific hypotheses (Figure 5). Causal criteria then provide a “checklist” whereby the observed association between a cause and effect for a given hypothesis is evaluated (Table 4). Generally, CCA is conducted on a suite of hypotheses or causal pathways described for a given system under study (Norris et al., 2012).
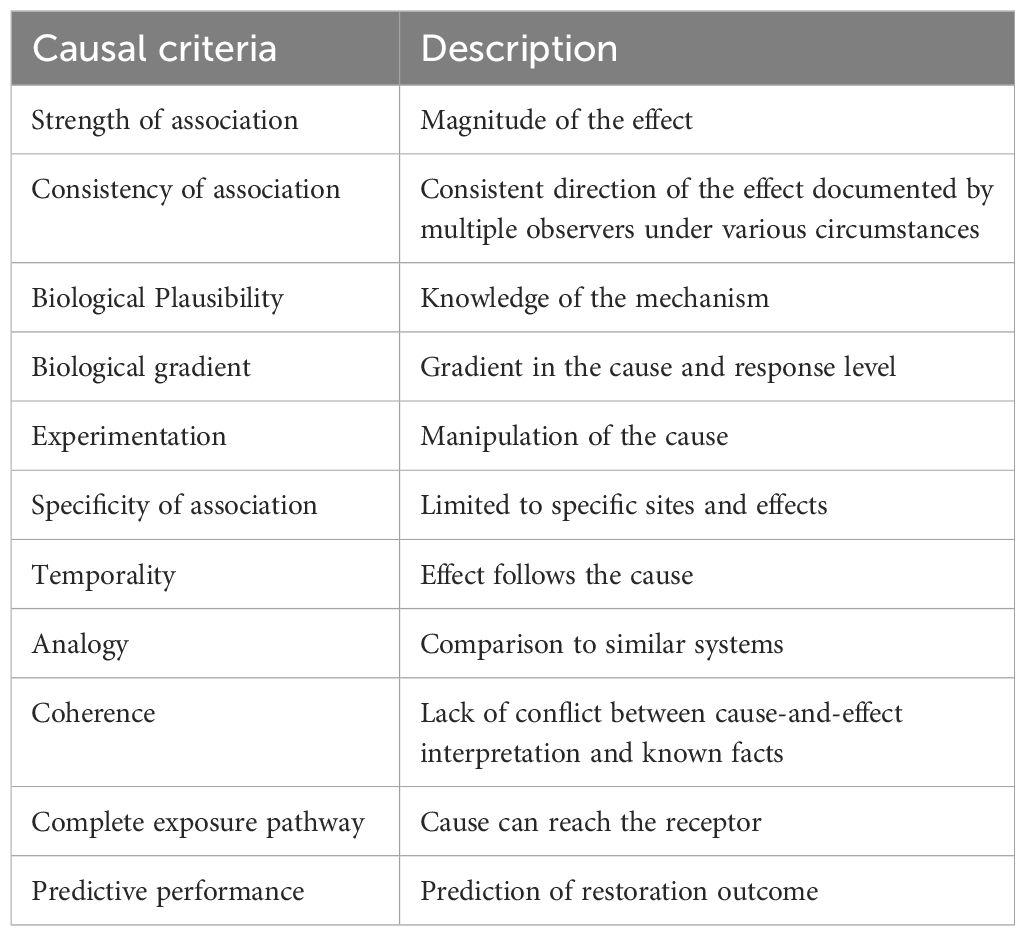
Table 4. Causal Criteria as invoked in the Hierarchy of Synthesis, from Diefenderfer et al. (2016).
In the CEE for Whidbey Basin, we evaluate a restoration action and some response within salmon habitats or salmon populations. The application of causal criteria provides the basis for causal inference supporting or refuting a given hypothesis in the analysis. For a given Tier 3 hypothesis, each relevant causal criterion is scored to reflect the strength of support across all available lines of evidence. This approach is common among other causal analyses (see Diefenderfer et al., 2011; Norris et al., 2012). For Tier 3 hypotheses, the established methods described by Norris et al. (2012) apply causal criteria across lines of evidence and then score the strength of the causal relationships. We refine this scoring to employ a scale from 0 to 3, corresponding to no support, weak support, moderate support, and strong support for the hypothesis. Scoring using causal criteria is the initial step of building causal inference.
3.3 Hierarchy of synthesis
Once the lines of evidence have been identified for each hypothesis, hypotheses are evaluated in a step-wise fashion, starting with Tier 3 hypotheses, the most granular within the Hierarchy of Hypotheses framework (Figure 6). The results of the causal criteria analysis of Tier 3 hypotheses are aggregated to evaluate the corresponding Tier 2 hypotheses, which are then used to evaluate the overarching Tier 1 hypothesis. Our approach uses causal synthesis to draw inference about the hypotheses, as described below and for which we provide an example from our study system and research questions. The Hierarchy of Synthesis herein builds on Heger et al. (2021) by providing a framework to develop inference from causal analysis through Hierarchy of Hypotheses and the associated syntheses.
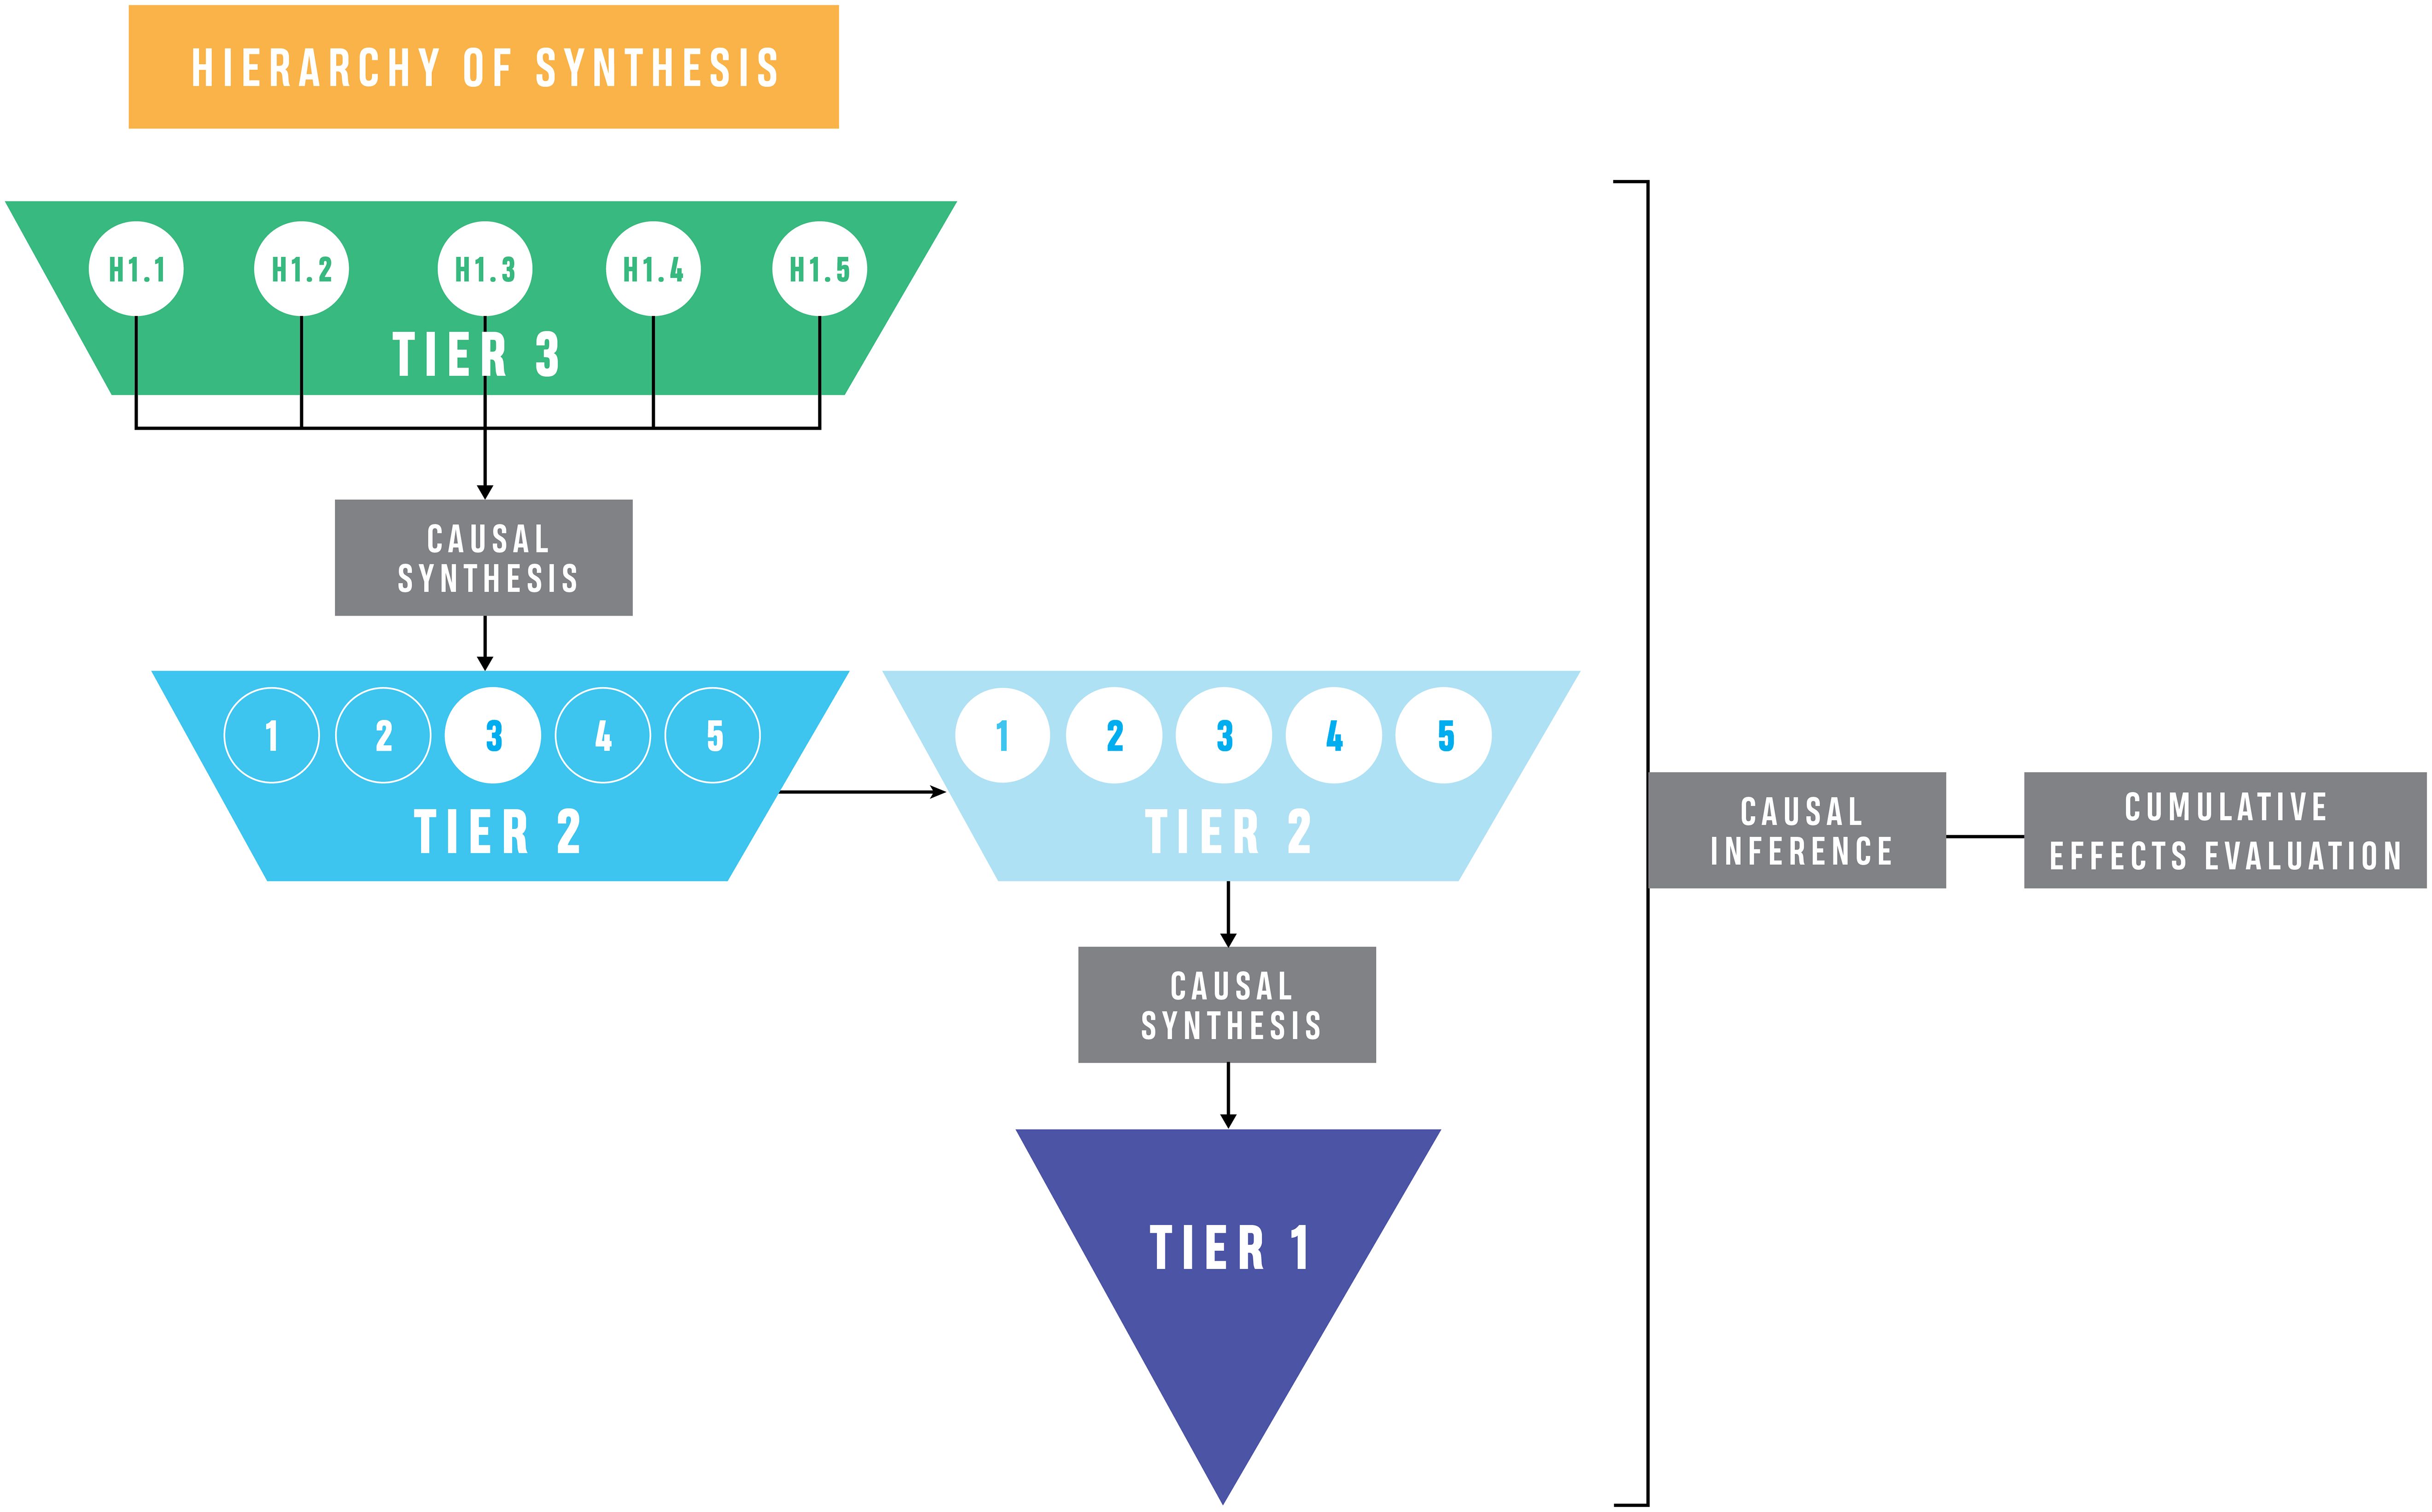
Figure 6. Hierarchy of synthesis for the cumulative effects evaluation. The evaluation of Tier 3 hypotheses and the synthesis from Tier 3 to Tier 2, and again across all Tier 2 hypotheses to the overarching research question in Tier 1, reflects the causal synthesis approach. Numbers within the trapezoids refer to specific hypotheses (e.g., for Tier 2, hypothesis 1 has 5 Tier 3 hypotheses which are all evaluated to draw inference about the Tier 2 domain hypothesis).
Because ecosystems are generally described as hierarchical (Pickett et al., 1989; Menge et al., 2015), we evaluate relevant ecological concepts across five different topical domains (the Tier 2 hypotheses) at the site and landscape scales (Table 2), taking advantage of hierarchical inference fundamental in our analysis. This approach builds on the Causal Analysis (section 3.2) across levels of hierarchy by assessing the Tier 2 (domain) hypotheses using the information gained in the Tier 3 causal criteria analysis. Results are used as inference for Tier 2 and Tier 1 evaluation, forming the Hierarchy of Synthesis. The linkage of CCA (Norris et al., 2012) with Hierarchy of Hypotheses (Heger et al., 2021) is formalized to form a Hierarchy of Synthesis (Figure 6) unique to this study design, thereby utilizing the nested analyses to gain inference at increasingly broad scales. Ultimately, this approach uses causal inference to draw conclusions about the cumulative effects of ecosystem restoration via this hierarchical synthesis (see Box 2 for distinctions regarding terminology).
Box 2. Definitions of analytical terminology. For a full glossary, see Supplementary Appendix A.
Observations are the data and reports of monitored indicators relevant for each hypothesis.
Lines of Evidence are the collective observations (including literature review, analyses, and models) upon which causal analysis is applied (Table 3 herein); under a hierarchy of synthesis framework, they are also be the results of causal synthesis of hypotheses within a domain when evaluating the higher tier (Tier 3 to Tier 2, Tier 2 to Tier 1).
Causal Criteria are a suite of philosophical arguments (Hill, 1965) applied to observations that help describe the causal relationship within an argument (e.g., causal pathway or hypothesis), Table 4, herein.
Causal Criteria Analysis is specific evaluation and scoring of lines of evidence for a specific Tier 3 hypothesis using causal criteria.
Causal Inference is an overall evaluation of causality of an argument that synthesizes the causal criteria analyses across related hypotheses.
Hierarchy of Synthesis is the approach to work up through the hierarchy of hypotheses, in which lines of evidence for Tier 3 hypotheses are used in aggregate to build causal inference that supports the next tier of hypotheses (Tier 2) and then the overarching hypothesis (Tier 1).
3.3.1 Causal inference and synthesis
Causal inference relies on integrating evidence from multiple sources using a variety of methodological approaches to address complex problems (Hernán and Robins, 2023). The development of causal inference through the analysis of causal criteria has historically been used in medical sciences (Hill, 1965); however, it has been increasingly used in evaluation of ecosystem responses to human actions (Norris et al., 2012; Vilizzi et al., 2015). Intrinsic to our analysis is the goal of evaluating the cumulative effects of restoration via multiple testable hypotheses centered around juvenile salmon access to, use of, and benefit from restoring habitats across the seascape using disparate data collected over different time periods and multiple sites. Using conceptual models, we set the stage for causal inference by articulating causal pathways and the hierarchy of hypotheses allows for the testing of hypotheses to build and synthesize inference.
We established our testable hypotheses in hierarchy (Hierarchy of Hypotheses, Figure 4) to facilitate synthesis of results, from the most granular hypotheses (Tier 3, with associated indicators and lines of evidence) to an overarching hypothesis aimed at identifying support for cumulative effects of restoration (via causal inference). For Tier 2 hypotheses, the average and standard deviation are calculated across all causal criteria for the nested Tier 3 hypotheses (no support, weak support, moderate support, and strong support). We then repeat the approach for the Tier 1 hypothesis, using the scores of causal strength from the Tier 2 causal synthesis. For both Tier 1 and Tier 2 syntheses, narrative statements related to the hypotheses are produced to summarize the key subject findings and assessments, giving context to the evidence for support.
To envision scoring and synthesis of results, given that the current analysis is ongoing, we simulated data for several hypotheses using expert opinion from the research team. We sought to test the full CEE methodology and tested various scoring schemes to determine sensitivity and robustness across causal criteria. Our scoring system identifies the strength and consistency in results and provides narrative statements to further substantiate findings. It also accomplishes the parsing of negative results (where a hypothesis is refuted) from lack of support (where evidence is neutral, equivocal, or differing among various lines of evidence).
Here we demonstrate scoring among Tier 3 hypotheses, and we further qualify the results with a brief narrative of key findings. For the example used previously, Tier 3 Hypothesis 2.1 (Box 3), we would have a score (Figure 7, mean=2.8, standard deviation=0.64), indicating strong support and include a summary statement such as: Natural processes are highly variable yet have spatial gradients in Whidbey Basin. Detecting changes from restoration to natural processes is hindered by large scale forcing from marine and fluvial sources, strong variability, alternate causal mechanisms, and variable restoration designs. In this way, we combine quantitative and qualitative observations gained through analyses to support inference. Where discrepancies exist (leading to increased variance in the score and greater uncertainty), the narrative can detail sources of uncertainty. This process is repeated for the roll-up from Tier 2 to our overarching hypothesis (simulated results depicted in the bottom row of Figure 7), allowing an overall evaluation of our primary research question. Through evaluation, we build inference from Tier 3 hypotheses to support or refute Tier 2 hypotheses, and ultimately, the Tier 1 hypothesis. The novel aspect in this approach is applying CCA at the most granular level of hypotheses (Tier 3) and drawing inference across the Hierarchy of Hypotheses to yield a synthesis of causal inference.
Box 3. An example of the Hierarchy of Hypotheses approach to illustrate the causal pathways underlying the CEE analysis.
To illustrate the Hierarchy of Hypotheses (Figure 4), an example follows. Starting with the overarching (Tier 1) hypothesis, which states that restoration benefits Chinook salmon, we evaluate one of our five operational hypotheses (Tier 2, Hypothesis 2.0), “Restoration improves natural processes and shifts habitat toward reference conditions.” This Tier 2 hypothesis posits restoration has a positive effect on the natural processes that form habitat and determine habitat quality, from which Chinook salmon can benefit. In effect, this assertion sets up the initial hypothesized causal pathway by which restoration results in improved natural processes and increases available habitat. As stated above, Tier 2 hypotheses are not meant to be testable, but rather serve to structure relevant aspects of salmon response.
Tier 3 hypotheses are specific enough to build inference to evaluate the Tier 2 hypothesis. An example is the hypothesis Restoration of natural processes is dependent on location within the Whidbey Basin and the dominant processes at that location (Tier 3, Hypothesis 2.1). The Spatial Context Model can be used to frame the analysis of this hypothesis to a) identify how near or far a site is from fluvial or marine forcing factors and b) to evaluate how habitat processes related to restoration are influenced by location in the delta. In addition, salmon functional response hypotheses that include distribution and migration pathways can be evaluated in the context of restoration location and the effects on habitat process, available habitat, and other aspects of habitat capacity, as related to spatial location.
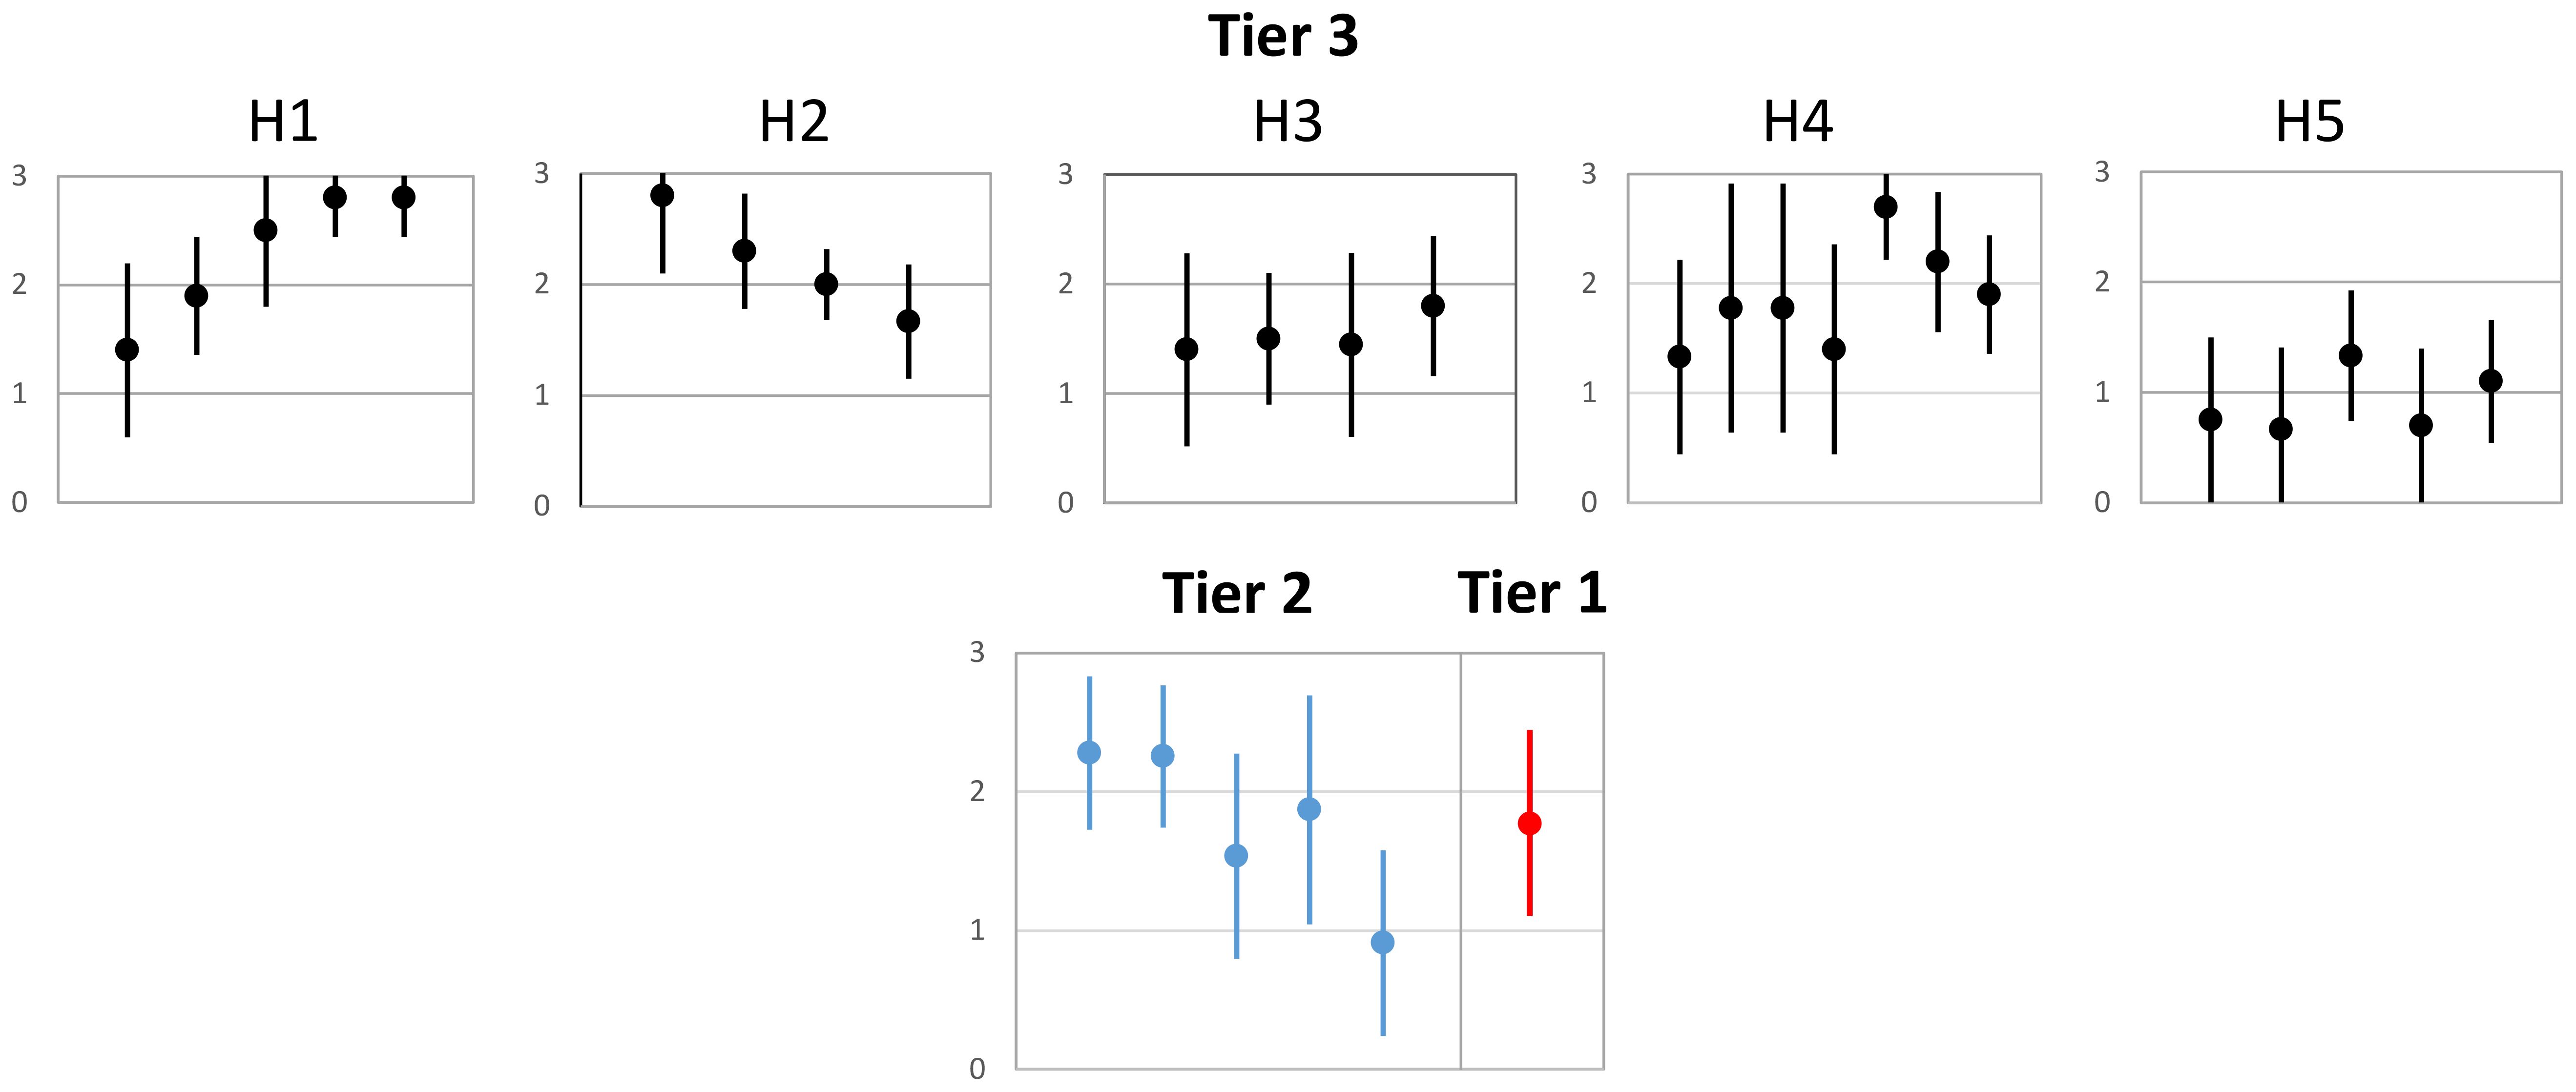
Figure 7. Simulated causal inference. Top row, H1-H5, depicts the simulated Tier 3 scoring (black dots and error bars) within each Tier 2 hypothesis (H1-H5) and narrative statements as follows: H1: All Tier 3 hypotheses exhibited moderate to strong support with low deviation among causal criteria. H2: Three of four Tier 3 hypotheses exhibited moderate to strong support, while one showed weaker support. There was low deviation among causal criteria. H3: All Tier 3 hypotheses exhibited moderate support with moderate causal deviation. H4: All Tier 3 hypotheses exhibited moderate to strong support, with two having much stronger support than the others. All Tier 3 hypotheses exhibited a wide range of causal deviation. H5: Four of five hypotheses exhibited less than moderate support, with some contraindications. Deviation among causal criteria was highly variable across hypotheses. Bottom figure shows a simulated summary of Tier 2 scoring and variance based on synthesis of Tier 3 hypotheses (blue dots and associated error bars) and Tier 1 score and variance based on Tier 2 hypotheses (red dot and associated bars). The resulting hierarchical narrative is: 1) Restoration improves habitat processes and extent across populations (H1 and H2), resulting in moderate benefits to growth and shifts in distribution. Benefits to changes in migration and abundance and survival remain equivocal (H3, H4, and H5); 2) Across all hypotheses, there was weak to moderate support for cumulative effects of habitat restoration for juvenile salmon.
3.4 Summary of methodology
In summary, we have both incorporated and advanced prior methods for the synthesis of disparate data sets in examining ecological restoration in several ways. Identifying key research questions and building models of existing understanding (conceptual models) and testable hypotheses (hierarchy of hypotheses) around them, enables inquiry across a range of domains relevant to the research question. Here, we were concerned with using site-scale responses to draw inference at the watershed or larger scale, a subbasin incorporating three estuaries. The suite of conceptual models we generated is similar in its interdisciplinary habitat-population detail to the basis of restoration analysis and synthesis in the recovery of wading birds in the Florida Everglades (Trexler and Goss, 2009; Beerens et al., 2015). We have included three tiers of hypotheses in a nested approach to facilitate specificity per Heger et al. (2021). This facilitates “rolling up” of causal inferences from the testable Tier 3 hypotheses, through operational Tier 2 hypotheses in multiple domains, to the key research questions. We use causal inference, specifically causal criteria analysis (Norris et al., 2012), on existing data and observations, to identify lines of evidence supporting benefits to salmon from restoration interventions in a hierarchy of synthesis. This synthesis methodology poses specific hypotheses for understanding ecosystem change and salmon response because of recovery actions. The synthesis approach builds on existing work while adding to available approaches used for causal inference in ecological and restoration science.
4 Results: identifying cumulative effects
Cumulative effects evaluations attempt to disentangle the multiple ecological processes influencing target species, as a result of restoration interventions, and draw inference beyond the site scale (Diefenderfer et al., 2021). Here, since the null hypothesis is that there are no cumulative effects of restoration actions, identifying cumulative effects is one of the fundamental challenges in this inquiry. Multiple possible mechanisms or modes of cumulative effects can describe change within an ecosystem restoration context (e.g., through time lags or ecological thresholds; Diefenderfer et al., 2021; Greening et al., 2023). While modes of cumulative effects are based upon phenomena common in ecology, it is important to recognize that in the context of restoration, an action (typically initiated by humans) may precipitate a state change. But much restoration effectiveness monitoring is done on a short-term timeframe, at the local scale, with incomplete documentation (Nilsson et al., 2016) and likely does not capture complex responses. Modes of cumulative effects provide hypothesized mechanisms for cumulative effects of multiple restoration efforts beyond simple additive or incremental changes at the site scale. Previously described modes of cumulative effects, such as compounding, cross-boundary, and time lags (Supplementary Appendix D, Diefenderfer et al., 2021) can help contextualize the insights that emerge through causal inference and hierarchy of synthesis in our analysis. The ecological concepts underlying those modes are integrated into our hypotheses, so the inferences are conceptually connected.
Describing how cumulative effects manifest in this system (Diefenderfer et al., 2021) will depend on the outcomes of the analyses currently underway. Given current knowledge, we anticipate specific modes of cumulative effects related to each hypothesis. For example, those modes related to the spatial domain (e.g., Landscape Pattern, Cross Boundary, and Space Crowding) are likely to emerge from the hypotheses related to habitat structure and habitat processes (Tier 2 Hypotheses 1 and 2, and their subordinate Tier 3 hypotheses), as well as fish movement (Tier 2 Hypothesis 4). Given our conceptual models and the spatial context implicit and explicit in our hypotheses, the detection of cumulative effects related to the spatial domain is possible with this methodology. In essence, cumulative effects detection at the landscape scale is embedded in our hypotheses. Other cumulative effects that function in the temporal domain, such as time lags and compounding effects, are also likely to be detectable with this methodology, given the decades of diverse data available.
Cumulative effects evaluation is inherent in our hierarchical framework of hypotheses and synthesis. In this framework, various expressions of cumulative effects underlie Tier 3 hypotheses and serve as demonstrable statements about the benefits of multiple restoration efforts. Using a multi-method framework (e.g., multimodel ensembles) is a recommended approach to identifying cumulative phenomena (Hodgson and Halpern, 2019), and here, multiple lines of evidence aid in addressing hypotheses and drawing inference through causal analysis to illustrate modes of cumulative effects. Understanding the mechanisms associated with these cumulative effects will enable improvements in restoration efforts moving forward, taking advantage of learning gained from previous assessment and inference gained at larger scales here.
5 Conclusions
We provide a framework for synthesizing and evaluating disparate data streams across multiple scales, specifically applied to detecting the cumulative effects of ecosystem restoration for juvenile salmon. We have developed an integrated, comprehensive update to CEE methodology, rooted in current understanding of the study system, and positioned to evaluate testable hypotheses related to cumulative effects using existing data. This information is critical to informing ongoing monitoring activities and the adaptive management of ecosystem restoration worldwide and, in our case, for salmon recovery in the Salish Sea region. Our methodology could be useful to many research arenas where a singular hypothesis is insufficient for addressing complex responses.
We offer advances in CEE methodology, including a formal Hierarchy of Hypotheses based on Heger et al. (2021), a robust causal criteria analysis using existing data and literature, rooted in a comprehensive and quantitative literature review, and a novel Hierarchy of Synthesis. The latter is analogous to the Hierarchy of Hypotheses, drawing on causal inference along two axes: horizontal across a given tier of hypotheses and vertical between hierarchical tiers. Despite the lack of documented responses to restoration at the population level, this approach will enable evaluation of potential outcomes occurring beyond site-scale projects in a highly dynamic environment. Results can inform programmatic adaptive management decisions, policy changes, funding allocation, as well as future restoration actions and science. The benefits of ecosystem restoration go beyond salmon habitat, and this framework could be adapted to more general ecosystem response to restoration, or other problems of synthesis.
Identifying cumulative effects is a challenge in a dynamic system with high levels of noise. We recognize that a range of success is possible with respect to restoration outcomes, meaning support for a given hypothesis could be variable. Failure to meet restoration objectives and realize benefits to salmon may be due to poor design, incorrect implementation, or mitigating and extrinsic factors (i.e., those factors that might limit the success of restoration actions, such as adjacent land use, or that cannot be controlled, such as sea level rise and heat waves due to climate change). Similarly, a lack of effectiveness monitoring, reporting, or adaptive management, undoubtedly limit our ability to draw inference. In all evaluations, accurately measuring cumulative effects will be impeded due to some combination of the above and the pervasiveness of anthropogenic impacts that remain in the study system.
The nature of analysis and evaluation herein is made possible by the programs and associated datasets that have been stewarded as restoration projects were implemented and thereafter. While we are grateful for the productive collaboration, the analytical lift associated with merging disparate datasets and findings argues for consistent monitoring at a landscape-scale with appropriate analytical design to evaluate the effectiveness of site-based actions when multiple interventions occur along a species’ migratory pathway. A coordinated and dedicated monitoring effort would foster detection of cumulative effects through appropriate research questions and concomitant sampling designs developed with the intention of detecting such effects at scales of ecological relevance.
While the methodology is generally applicable to multiple research problems, for purposes of a CEE for salmon habitat restoration in the Whidbey Basin nearshore, we provide details related to salmonid use of estuaries to 1) provide context for others assessing restoration benefits for salmonids, and 2) provide the scale of detail we considered in developing our methodology. Formalizing the spatial, life-history, and restoration models that we drew upon to generate this methodology is what allows us to implement some of the highly specific, yet broadly germane, hypothesis testing. It is also important to note that increased understanding of population-specific juvenile salmon distributions suggests mixing in estuaries may occur more frequently and at greater magnitudes among populations and habitats than previously believed (Rice et al., 2011; Hayes et al., 2019; Chamberlin et al., 2022b). Thus, cross-watershed boundary recovery planning is important and supports the need to synthesize and evaluate cumulative effects of multiple restoration projects beyond the watershed. As salmon from multiple populations may use and benefit from restoration sites across the seascape, existing paradigms of estuarine use during salmon outmigration may need to be refined, along with objectives related to restoration.
Through the adaptation and development of the cumulative effects assessment framework described here, we have built on science synthesis, which occurs through collaboration among communities of practice with ready access to data, metadata, and varied analytical tools (Halpern et al., 2020). Using a multi-institutional collaboration to develop our approach, we concur with previous researchers that such collaborations leveraged capacity and led to additional productivity and creativity (Hampton and Parker, 2011; Diffendorfer et al., 2023). While much of the innovation in our approach is directly related to the extensive knowledge of salmon in estuaries and the available data within the research team network, the wide range of experience represented by the team also fostered new ideas and innovation for complex ecosystem analyses and syntheses (Diffendorfer et al., 2023).
Synthesis occurs when disparate data, concepts, or theories are integrated in ways that yield new knowledge, insights, or explanations (Pickett et al., 2007). With our framework, we have developed a methodology that allows the detection of cumulative effects to emerge from existing data, while recognizing that the majority of the landscape in the systems under study remains highly impacted by past and present anthropogenic disturbance (Hodgson et al., 2020; Sobocinski et al., 2022). The complex life history of Pacific salmon means other insults, experienced beyond estuarine residence, may negatively impact survival. Nevertheless, estuarine rearing is known to be important for salmon growth (Healey, 1982; Chalifour et al., 2021), which in turn confers a survival advantage (Beamish et al., 2004; Duffy and Beauchamp, 2011; Greene et al., 2024). With much estuarine habitat lost to development and agriculture since colonization (Brophy et al., 2019), habitat restoration is one tool for improving life-stage-specific survival. Without a unifying monitoring and synthesis scheme, site-scale successes may fail to account for broader benefits. Detecting thresholds at which restoration provides measurable improvement would greatly advance understanding of the effects of restoration on ecosystems. Establishing a solid analytical foundation and applying rigorous synthesis methods for evaluating the cumulative effects of restoring habitats, benefits both Pacific Northwest salmon recovery efforts and other regional ecosystem restoration worldwide.
Data availability statement
The data analyzed in this study is subject to the following licenses/restrictions: Data underlying our analyses are held by some public agencies as well as Tribal governments in Washington. Requests to access these datasets should be directed to bWxlbW9pbmVAc2thZ2l0Y29vcC5vcmc=.
Author contributions
KS: Conceptualization, Funding acquisition, Investigation, Methodology, Project administration, Visualization, Writing – original draft, Writing – review & editing. ML: Conceptualization, Funding acquisition, Investigation, Methodology, Project administration, Visualization, Writing – original draft, Writing – review & editing. JC: Investigation, Methodology, Visualization, Writing – original draft, Writing – review & editing. LC-C: Conceptualization, Methodology, Writing – review & editing. AD: Conceptualization, Funding acquisition, Project administration, Visualization, Writing – review & editing. HD: Conceptualization, Methodology, Writing – review & editing. CG: Conceptualization, Formal analysis, Funding acquisition, Investigation, Methodology, Project administration, Visualization, Writing – review & editing. JH: Conceptualization, Data curation, Formal analysis, Funding acquisition, Investigation, Methodology, Software, Validation, Visualization, Writing – review & editing. GJ: Conceptualization, Methodology, Project administration, Writing – review & editing. RT: Conceptualization, Writing – review & editing. ET: Conceptualization, Funding acquisition, Methodology, Project administration, Visualization, Writing – review & editing. TZ: Conceptualization, Funding acquisition, Visualization, Writing – review & editing.
Funding
The authors declare financial support was received for the research and/or publication of this article. Funding for this project was provided by Puget Sound Partnership through grants to KS, ML, JC, CG, HD, GJ, JH, and TZ.
Acknowledgments
The CEE Research Team thanks the numerous technicians, scientists, students, community volunteers, and other participants who have committed time toward estuarine restoration and research in the Whidbey Basin. We also thank the Federal, State, and local sponsors and Tribal nations that have supported, and continue to support, restoration and research in the region. The commitment to restoration and monitoring by all parties has contributed to deep understanding of the Whidbey Basin system and enables a cumulative effects evaluation because of the availability of data, reports, and supporting materials. We would like to thank Lorraine Loomis, Casey Rice, and Eric Beamer who were pivotal in starting and committing to a robust research program addressing benefits of restoration in the Whidbey Basin. C. Nuuhiwa provided assistance with graphic design, M. Camp facilitated project organization, and A. Haase provided assistance with reference-checking. We thank J. Samhouri for early review of the manuscript and comments, as well as numerous people who have provided feedback to public presentations, all of whom encouraged us to critically evaluate our approach. The manuscript was improved by comments from two reviewers. We thank the Puget Sound Partnership for coordination and funding.
Conflict of interest
The authors declare that the research was conducted in the absence of any commercial or financial relationships that could be construed as a potential conflict of interest.
Generative AI statement
The author(s) declare that no Generative AI was used in the creation of this manuscript.
Publisher’s note
All claims expressed in this article are solely those of the authors and do not necessarily represent those of their affiliated organizations, or those of the publisher, the editors and the reviewers. Any product that may be evaluated in this article, or claim that may be made by its manufacturer, is not guaranteed or endorsed by the publisher.
Supplementary material
The Supplementary Material for this article can be found online at: https://www.frontiersin.org/articles/10.3389/fmars.2025.1514508/full#supplementary-material
References
Barbier E. B., Hacker S. D., Kennedy C., Koch E. W., Stier A. C., and Silliman B. R. (2011). The value of estuarine and coastal ecosystem services. Ecol. Monogr. 81, 169–193. doi: 10.1890/10-1510.1
Bartz K. K., Ford M. J., Beechie T. J., Fresh K. L., Pess G. R., Kennedy R. E., et al. (2015). Trends in developed land cover adjacent to habitat for threatened salmon in Puget Sound, Washington, USA. PloS One 10, e0124415. doi: 10.1371/journal.pone.0124415
Beamer E. M., Greene C., and LeMoine M. (2019). Skagit River Estuary Intensively Monitored Watershed Annual Report for 2019. Report to the Washington State Salmon Recovery Funding Board Monitoring Panel (La Conner, WA: Skagit River System Cooperative), pp. 27.
Beamer E. M., Greene C. M., Chamberlin J. W., Hood W. G., Ellings C. S., Hodgson S., et al. (2024). Landscape determinants of aquatic estuarine habitat use by juvenile Chinook salmon. Can. J. Fisheries Aquat. Sci. 81, 747–767. doi: 10.1139/cjfas-2023-0249
Beamer E. M., Hayman B., and Smith D. (2005). Appendix C of the Skagit Chinook recovery plan. Linking freshwater rearing habitat to Skagit Chinook salmon recovery. Available online at: http://skagitcoop.org/wp-content/uploads/Appendix-C-Freshwater.pdf (Accessed May 15, 2025).
Beamer E. M., Zackey W. T., Marks D., Teel D., Kuligowski D., and Henderson R. (2013). Juvenile Chinook salmon rearing in small non-natal streams draining into the Whidbey basin. Available online at: http://skagitcoop.org/wp-content/uploads/EB2752_Beamer-et-al_2013.pdf.
Beamish R. J., Sweeting R. M., and Neville C. M. (2004). Improvement of juvenile Pacific salmon production in a regional ecosystem after the 1998 climatic regime shift. Trans. Am. Fisheries Soc. 133, 1163–1175. doi: 10.1577/T03-170.1
Beerens J. M., Noonburg E. G., and Gawlik D. E. (2015). Linking dynamic habitat selection with wading bird foraging distributions across resource gradients. PloS One 10, e0128182. doi: 10.1371/journal.pone.0128182
Bilby R. E., Currens K. P., Fresh K. L., Booth D. B., Fuerstenberg R. R., and Lucchetti G. L. (2024). Why aren’t salmon responding to habitat restoration in the Pacific Northwest? Fisheries 49, 16–27. doi: 10.1002/fsh.10991
Bisson P., Hillman T., Beechie T., and Pess G. (2024). Managing expectations from intensively monitored watershed studies. Fisheries 49, 8–15. doi: 10.1002/fsh.10992
Borja Á., Dauer D. M., Elliott M., and Simenstad C. A. (2010). Medium-and long-term recovery of estuarine and coastal ecosystems: patterns, rates and restoration effectiveness. Estuaries Coasts 33, 1249–1260. doi: 10.1007/s12237-010-9347-5
Bottom D. L., Jones K. K., Cornwell T. J., Gray A., and Simenstad C. A. (2005). Patterns of Chinook salmon migration and residency in the Salmon River estuary (Oregon). Estuarine Coastal Shelf Sci. 64, 79–93. doi: 10.1016/j.ecss.2005.02.008
Brophy L. S., Greene C. M., Hare V. C., Holycross B., Lanier A., Heady W. N., et al. (2019). Insights into estuary habitat loss in the western United States using a new method for mapping maximum extent of tidal wetlands. PloS One 14, e0218558. doi: 10.1371/journal.pone.0218558
Burdick D. M., Dionne M., Boumans R. M., and Short F. T. (1997). Ecological responses to tidal restorations of northern New England salt marshes. Wetlands Ecol. Manage. 4, 129–144. doi: 10.1007/BF01876233
Burdick D. M. and Roman C. T. (2012). “Salt Marsh Responses to Tidal Restriction and Restoration,” in Tidal Marsh Restoration. The Science and Practice of Ecological Restoration. Eds. Roman C. T. and Burdick D. M. (Island Press, Washington, DC). doi: 10.5822/978-1-61091-229-7_22
Cantor M., Pires M. M., Marquitti F. M. D., Raimundo R. L. G., Sebastián-González E., Coltri P. P., et al. (2017). Nestedness across biological scales. PloS One 12, e0171691. doi: 10.1371/journal.pone.0171691
Carpenter S. R. (2009). Accelerate synthesis in ecology and environmental sciences. BioScience 59, 699–701. doi: 10.1525/bio.2009.59.8.11
Casazza M. L., McDuie F., Jones S., Lorenz A. A., Overton C. T., Yee J., et al. (2021). Waterfowl use of wetland habitats informs wetland restoration designs for multi-species benefits. J. Appl. Ecol. 58, 1910–1920. doi: 10.1111/1365-2664.13845
Chalifour L., Scott D. C., MacDuffee M., Stark S., Dower J. F., Beacham T. D., et al. (2021). Chinook salmon exhibit long-term rearing and early marine growth in the Fraser River, British Columbia, a large urban estuary. Can. J. Fisheries Aquat. Sci. 78, 539–550. doi: 10.1139/cjfas-2020-0247
Chamberlin J. W., Zackey W. T., Spidle A., Seamons T., Crewson M., and Totman M. (2022b). Population –specific distribution, individual growth, and residency or juvenile Chinook salmon in the Snohomish estuary. ESRP Project Report 14-2303 2 (Olympia, WA: Washington Department of Fish and Wildlife, Estuary Salmon and Restoration Program).
Chamberlin J. W., Zackey W. T., and Stefankiv O. (2022a). Revised estimates of habitat capacity for Chinook salmon in tidal deltas: Implications for recovery planning in the Snohomish delta. ESRP Project Report 14-2303 1 (Olympia, WA: Washington Department of Fish and Wildlife, Estuary Salmon and Restoration Program).
Chen J. Z., Huang S. L., and Han Y. S. (2014). Impact of long-term habitat loss on the Japanese eel Anguilla japonica. Estuarine Coastal Shelf Sci. 151, 361–369. doi: 10.1016/j.ecss.2014.06.004
Cloern J. E., Abreu P. C., Carstensen J., Chauvaud L., Elmgren R., Grall J., et al. (2016). Human activities and climate variability drive-fast paced change across the world’s estuarine-coastal ecosystems. Global Change Biol. 22, 513–529. doi: 10.1111/gcb.13059
Coleman M. A., Wood G., Filbee-Dexter K., Minne A. J., Goold H. D., Vergés A., et al. (2020). Restore or redefine: Future trajectories for restoration. Front. Marine Sci. 7. doi: 10.3389/fmars.2020.00237
Davenport T. M., Comba D. A., Dalyander P. S., Enwright N. M., Palmsten M. L., Steyer G. D., et al. (2024). Cumulative effects assessment of restoration programs: a framework to assess achievement of regional and programmatic goals (Washington, D.C: U.S. Department of Interior, Fish and Wildlife Service, Cooperator Science Series FWS/CSS-162-2024). doi: 10.3996/css78994021
David A. T., Simenstad C. A., Cordell J. R., Toft J. D., Ellings C. S., Gray A., et al. (2016). Wetland loss, juvenile salmon foraging performance, and density dependence in Pacific Northwest estuaries. Estuaries Coasts 39, 767–780. doi: 10.1007/s12237-015-0041-5
Davis M. J., Woo I., Ellings C. S., Hodgson S., Beauchamp D. A., Nakai G., et al. (2022). A climate-mediated shift in the estuarine habitat mosaic limits prey availability and reduces nursery quality for juvenile salmon. Estuaries Coasts 45, 1445–1464. doi: 10.1007/s12237-021-01003-3
De Groot R. S., Blignaut J., van der Ploeg S., Aronson J., Elmqvist T., and Farley J. (2013). Benefits of investing in ecosystem restoration. Conserv. Biol. 27, 1286–1293. doi: 10.1111/cobi.12158
Department of Fisheries and Oceans (DFO) (2023). BC salmon restoration and innovation fund projects. Available online at: https://www.dfo-mpo.gc.ca/fisheries-peches/initiatives/fish-fund-bc-fonds-peche-cb/projects-projets-eng.html (Accessed May 02, 2023).
Dethier M. N., Raymond W. W., McBride A. N., Toft J. D., Cordell J. R., Ogston A. S., et al. (2016). Multiscale impacts of armoring on Salish Sea shorelines: evidence for cumulative and threshold effects. Estuarine Coastal Shelf Sci. 175, 106–117. doi: 10.1016/j.ecss.2016.03.033
Diefenderfer H. L., Johnson G. E., Thom R. M., Buenau K. E., Weitkamp L. A., Woodley C. M., et al. (2016). Evidence-based evaluation of the cumulative effects of ecosystem restoration. Ecosphere 7, e01242. doi: 10.1002/ecs2.1242
Diefenderfer H. L., McKinney L. D., Boynton W. R., Heck K. L. Jr., Kleiss B. A., Mishra D. R., et al. (2022). Ten years of Gulf Coast ecosystem restoration projects since the Deepwater Horizon oil spill. Proc. Natl. Acad. Sci. 119, e2213639119. doi: 10.1073/pnas.2213639119
Diefenderfer H. L., Steyer G. D., Harwell M. C., LoSchiavo A. J., Neckles H. A., Burdick D. M., et al. (2021). Applying cumulative effects to strategically advance large-scale ecosystem restoration. Front. Ecol. Environ. 19, 108–117. doi: 10.1002/fee.2274
Diefenderfer H. L., Thom R. M., Johnson G. E., Skalski J. R., Vogt K. A., Ebberts B. D., et al. (2011). A levels-of-evidence approach for assessing cumulative ecosystem response to estuary and river restoration programs. Ecol. Restor. 29, 111–132. doi: 10.3368/er.29.1-2.111
Diffendorfer J. E., Drum R. G., Mitchell G. W., Rendón-Salinas E., Sánchez-Cordero V., Semmens D. J., et al. (2023). The benefits of big-team science for conservation: Lessons learned from trinational monarch butterfly collaborations. Front. Environ. Sci. 11, 1079025. doi: 10.3389/fenvs.2023.1079025
DiGennaro B., Reed D., Swanson C., Hastings L., Hymanson Z., Healey M., et al. (2012). Using conceptual models and decision-support tools to guide ecosystem restoration planning and adaptive management: an example from the Sacramento–San Joaquin Delta, California. San Francisco Estuary Watershed Sci. 10, 1. doi: 10.15447/sfews.2012v10iss3art1
Duffy E. J. and Beauchamp D. A. (2011). Rapid growth in the early marine period improves the marine survival of Chinook salmon (Oncorhynchus tshawytscha) in Puget Sound, Washington. Can. J. Fisheries Aquat. Sci. 68, 232–240. doi: 10.1139/F10-144
Ellings C. S., Davis M. J., Grossman E. E., Woo I., Hodgson S., Turner K. L., et al. (2016). Changes in habitat availability for outmigrating juvenile salmon (Oncorhynchus spp.) following estuary restoration. Restor. Ecol. 24, 415–427. doi: 10.1111/rec.2016.24.issue-3
Fausch K. D., Torgersen C. E., Baxter C. V., and Li H. W. (2002). Landscapes to riverscapes: bridging the gap between research and conservation of stream fishes: a continuous view of the river is needed to understand how processes interacting among scales set the context for stream fishes and their habitat. BioScience 52, 483–498. doi: 10.1641/0006-3568(2002)052[0483:LTRBTG]2.0.CO;2
Foley M. M., Mease L. A., Martone R. G., Prahler E. E., Morrison T. H., Murray C. C., et al. (2017). The challenges and opportunities in cumulative effects assessment. Environ. Impact Assess. Rev. 62, 122–134. doi: 10.1016/j.eiar.2016.06.008
Ford M. J. (2011). Status review update for Pacific salmon and steelhead listed under the Endangered Species Act: Pacific Northwest (Seattle: U.S. Dept. Commer., NOAA Tech. Memo. NMFS-NWFSC-113), 281.
Gladstone-Gallagher R. V., Hewitt J. E., Low J. M., Pilditch C. A., Stephenson F., Thrush S. F., et al. (2024). Coupling marine ecosystem state with environmental management and conservation: A risk-based approach. Biol. Conserv. 292, 110516. doi: 10.1016/j.biocon.2024.110516
Gladstone-Gallagher R. V., Thrush S. F., Low J. M., Pilditch C. A., Ellis J. I., and Hewitt J. E. (2023). Toward a network perspective in coastal ecosystem management. J. Environ. Manage. 346, 119007. doi: 10.1016/j.jenvman.2023.119007
Greene C. M. and Beechie T. J. (2004). Consequences of potential density-dependent mechanisms on recovery of ocean-type Chinook salmon (Oncorhynchus tshawytscha). Can. J. Fisheries Aquat. Sci. 61, 590–602. doi: 10.1139/f04-024
Greene C. M., Blackhart K., Nohner J., Candelmo A., and Nelson D. M. (2015). A national assessment of stressors to estuarine fish habitats in the contiguous USA. Estuaries Coasts 38, 782–799. doi: 10.1007/s12237-014-9855-9
Greene C. M., Chamberlin J. W., Munsch S., Anderson J., Beamer E., Belleveau L., et al. (2024). Multi-scale assessment of population responses to estuary restoration for Puget Sound Chinook Salmon, Final report. ESRP Project 18-2248 (Olympia, WA: Washington Department of Fish and Wildlife, Estuary Salmon and Restoration Program). 188.
Greening H. S., Heck K. L., McKinney L. D., Diefenderfer H. L., Boynton W. R., Kleiss B. A., et al. (2023). Assessing the effectiveness of large-scale environmental restoration: Challenges and opportunities. Estuaries Coasts 46, 293–301. doi: 10.1007/s12237-022-01149-8
Halpern B. S., Berlow E., Williams R., Borer E. T., Davis F. W., Dobson A., et al. (2020). Ecological synthesis and its role in advancing knowledge. BioScience 70, 1005–1014. doi: 10.1093/biosci/biaa105
Hampton S. E. and Parker J. N. (2011). Collaboration and productivity in scientific synthesis. BioScience 11, 900–910. doi: 10.1525/bio.2011.61.11.9
Hayes M. C., Hodgson S., Ellings C. S., Duval W. D., and Rubin. S. P. (2019). Seasonal use of a nonnatal marine basin by juvenile hatchery chinook salmon. Marine Coastal Fisheries 11, 437–453. doi: 10.1002/mcf2.10098
Healey M. C. (1982). “Juvenile Pacific salmon in estuaries: the life support system,” in Estuarine Comparisons. Ed. Kennedy V. S. (Academic Press), 315–341. doi: 10.1016/B978-0-12-404070-0.50025-9
Heemskerk M., Wilson K., and Pavao-Zuckerman M. (2003). Conceptual models as tools for communication across disciplines. Conserv. Ecol. 7, 8. Available at: http://www.jstor.org/stable/26271969.
Heger T., Aguilar-Trigueros C. A., Bartram I., Braga R. R., Dietl G. P., Enders M., et al. (2021). The hierarchy-of-hypotheses approach: a synthesis method for enhancing theory development in ecology and evolution. BioScience 71, 337–349. doi: 10.1093/biosci/biaa13
Hernán M. A. and Robins J. M. (2023). Causal Inference: What If (Boca Raton: CRC Press). doi: 10.1201/9781315374932
Hill A. B. (1965). The environment and disease: association or causation? J. R. Soc. Med. 58, 295–300. doi: 10.1177/003591576505800503
Hodgson E. E. and Halpern B. S. (2019). Investigating cumulative effects across ecological scales. Conserv. Biol. 33, 22–32. doi: 10.1111/cobi.2019.33.issue-1
Hodgson E. E., Wilson S. M., and Moore J. W. (2020). Changing estuaries and impacts on juvenile salmon: A systematic review. Global Change Biol. 26, 1986–2001. doi: 10.1111/gcb.14997
Jaeger W. K. and Scheuerell M. D. (2023). Return(s) on investment: Restoration spending in the Columbia River Basin and increased abundance of salmon and steelhead. PloS One 18, e0289246. doi: 10.1371/journal.pone.0289246
Jeschke J. M., Gómez Aparicio L., Haider S., Heger T., Lortie C. J., Pyšek P., et al. (2012). Support for major hypotheses in invasion biology is uneven and declining. NeoBiota 14, 1–20. doi: 10.3897/neobiota.14.3435
Kelble C. R., Loomis D. K., Lovelace S., Nuttle W. K., Ortner P. B., Fletcher P., et al. (2013). The EBM-DPSER conceptual model: integrating ecosystem services into the DPSIR framework. PloS One 8, e70766–e70766. doi: 10.1371/journal.pone.0070766
Kemp W. M. and Boynton W. R. (2012). Synthesis in estuarine and coastal ecological research: what is it, why is it important, and how do we teach it? Estuaries Coasts 35, 1–22. doi: 10.1007/s12237-011-9464-9
Khangaonkar T., Yang Z., Kim T., and Roberts M. (2011). Tidally averaged circulation in Puget Sound sub-basins: Comparison of historical data, analytical model, and numerical model. Estuarine Coastal Shelf Sci. 93, 305–319. doi: 10.1016/j.ecss.2011.04.016
Kimmerer W. J., Murphy D. D., and Angermeier P. L. (2005). A landscape-level model for ecosystem restoration in the San Francisco Estuary and its watershed. San Francisco Estuary Watershed Sci. 3. Available at: http://repositories.cdlib.org/jmie/sfews/vol3/iss1/art2 (Accessed May 15, 2025).
King E. G. and Hobbs R. J. (2006). Identifying linkages among conceptual models of ecosystem degradation and restoration: towards an integrative framework. Restor. Ecol. 14, 369–378. doi: 10.1111/j.1526-100X.2006.00145.x
La Peyre M. K., Marshall D. A., Buie S. C. L., Hijuelos A., and Steyer G. D. (2022). Are we falling short on restoring oysters at a regional scale? Environ. Manage. 70, 581–592. doi: 10.1007/s00267-022-01691-y
LeMoine M., Beamer E., Henrichs B., and Hood G. (2022). Zis a ba Restoration: Early effects on water conditions, fish community structure and juvenile Chinook salmon densities (La Conner, WA: Skagit River System Cooperative), 82.
Levings C. D. and Macdonald J. S. (1991). “Rehabilitation of estuarine fish habitat at Campbell River. Fisheries Bioengineering Symposium,” in American Fisheries Society Symposium (Bethesda: American Fisheries Society), Vol. 10. 176–190.
Littles C. J., Karnezis J. P., Blauvelt K., Creason A. M., Diefenderfer H. L., Johnson G. E., et al. (2022). Adaptive management of large-scale ecosystem restoration: increasing certainty of habitat outcomes in the Columbia river estuary, USA. Restor. Ecol. 30, e13634. doi: 10.1111/rec.13634
LoSchiavo A. J., Best R. G., Burns R. E., Gray S., Harwell M. C., Hines E. B., et al. (2013). Lessons learned from the first decade of adaptive management in comprehensive everglades restoration. Ecol. Soc. 18, 70–766. doi: 10.5751/ES-06065-180470
McKown J. G., Moore G. E., Burdick D. M., Ballestero T. P., and White N. A. (2024). Short-term recovery of pilot living shoreline projects for salt marsh habitat in New Hampshire. Estuaries Coasts 47, 315–329. doi: 10.1007/s12237-023-01284-w
Menge B. A., Gouhier T. C., Hacker S. D., Chan F., and Nielsen K. J. (2015). Are meta-ecosystems organized hierarchically? A model and test in rocky intertidal habitats. Ecol. Monogr. 85, 213–233. doi: 10.1890/14-0113.1
Montero-Serra I., Garrabou J., Doak D. F., Figuerola L., Hereu B., Ledoux J. B., et al. (2018). Accounting for life-history strategies and timescales in marine restoration. Conserv. Lett. 11, e12341. doi: 10.1111/conl.12341
Murray N. J., Worthington T. A., Bunting P., Duce S., Hagger V., Lovelock C. E., et al. (2022). High-resolution mapping of losses and gains of Earth’s tidal wetlands. Science 376, 744–749. doi: 10.1126/science.abm9583
National Academies of Sciences, Engineering, and Medicine (NASEM) (2022). An Approach for Assessing U.S. Gulf Coast Ecosystem Restoration: A Gulf Research Program Environmental Monitoring Report (Washington, DC: The National Academies Press).
National Oceanic and Atmospheric Administration (NOAA) (2007). Puget sound salmon recovery plan. Shared strategy for puget sound and NOAA fisheries, seattle, WA. Available online at: https://repository.library.noaa.gov/view/noaa/16005 (Accessed May 15, 2025).
Needles L. A., Lester S. E., Ambrose R., Andren A., Beyeler M., Connor M. S., et al. (2015). Managing bay and estuarine ecosystems for multiple services. Estuaries Coasts 38, 35–48. doi: 10.1007/s12237-013-9602-7
Nilsson C., Aradottir A. L., Hagen D., Halldórsson G., Høegh K., Mitchell R. J., et al. (2016). Evaluating the process of ecological restoration. Ecol. Soc. 21, article41. doi: 10.5751/ES-08289-210141
Norris R. H., Webb J. A., Nichols S. J., Stewardson M. J., and Harrison E. T. (2012). Analyzing cause and effect in environmental assessments: using weighted evidence from the literature. Freshwater Sci. 31, 5–21. doi: 10.1899/11-027.1
Osenberg C. W., Bolker B. M., White J. S. S., St. Mary C. M., and Shima J. S. (2006). “Statistical issues and study design in ecological restorations: lessons learned from marine reserves,” in Foundations of Restoration Ecology. Eds. Falk D. A., Palmer M. A., and Zedler J. B. (Island Press, Washington, D.C), 584.
Pearsall I., Schmidt M., Kemp I., and Riddell B. (2021). Synthesis of findings of the Salish Sea Marine Survival Project, Version 1.0. Available online at: https://marinesurvival.wpengine.com/wp-content/uploads/2021PSF-SynthesisPaper-Screen.pdf (Accessed June 21, 2023).
Peyronnin N., Green M., Richards C. P., Owens A., Reed D., Chamberlain J., et al. (2013). Louisiana’s 2012 coastal master plan: overview of a science-based and publicly informed decision-making process. J. Coastal Res. 67, 1–15. doi: 10.2112/SI_67_1.1
Pickett S. T. (1999). The culture of synthesis: habits of mind in novel ecological integration. Oikos 87, 479–487. doi: 10.2307/3546812
Pickett S. T. A., Kolasa J., Armesto J. J., and Collins S. L. (1989). The ecological concept of disturbance and its expression at various hierarchical levels. Oikos m, 129–136. doi: 10.2307/3565258
Pickett S. T. A., Kolasa J., and Jones C. G. (2007). Ecological Understanding: The Nature of Theory and the Theory of Nature. 2nd edition (Burlington: Academic Press).
Pontee N. (2013). Defining coastal squeeze: A discussion. Ocean Coastal Manage. 84, 204–207. doi: 10.1016/j.ocecoaman.2013.07.010
Preston E. M. and Bedford B. L. (1988). Evaluating cumulative effects on wetland functions: A conceptual overview and generic framework. Environ. Manage. 12, 565–583. doi: 10.1007/BF01867536
Puget Sound Partnership (2022). 2022–2026 Action Agenda for Puget Sound. Puget Sound Partnership 2022–2026 Action Agenda (wa.gov).
Puget Sound Science Panel (2020). Priority Science to Support Puget Sound Recovery: A science workplan for 2020-2024. Available online at: https://pspwa.box.com/s/e81y0ap941ntik8o0me8o1lo6v12act1 (Accessed September 13, 2024).
Rice C. A., Greene C. M., Moran P., Teel D. J., Kuligowski D. R., Reisenbichler R. R., et al. (2011). Abundance, stock origin, and length of marked and unmarked juvenile chinook salmon in the surface waters of greater puget sound. Trans. Am. Fisheries Soc. 140, 170–189. doi: 10.1080/00028487.2010.550253
Rudnick D. A., Ryan S. J., Beier P., Cushman S. A., Dieffenbach F., Epps C. W., et al. (2012). The role of landscape connectivity in planning and implementing conservation and restoration priorities. Issues Ecol. 16, 1–20.
Sánchez-Arcilla A., Cáceres I., Le Roux X., Hinkel J., Schuerch M., Nicholls R. J., et al. (2022). Barriers and enablers for upscaling coastal restoration. Nature-Based Solutions, 100032. doi: 10.1016/j.nbsj.2022.100032
Sawyer A. C., Atlas W. I., Seitz K. M., Wilson S. M., and Moore. J. W. (2023). State-dependent estuary stopover boosts juvenile salmon growth: Implications for marine survival. Ecosphere 14, e4689. doi: 10.1002/ecs2.v14.12
Schlenger P., MacLennan A., Iverson E., Fresh K., Tanner C., Lyons B., et al. (2011). Strategic Needs Assessment: Analysis of Nearshore Ecosystem Process Degradation in Puget Sound. Prepared for the Puget Sound Nearshore Ecosystem Restoration Project. Technical Report 2011-02 (Olympia, WA: Puget Sound Nearshore Ecosystem Restoration Project).
Silliman B. R., Schrack E., He Q., Cope R., Santoni A., van der Heide T., et al. (2015). Facilitation shifts paradigms and can amplify coastal restoration efforts. Proc. Natl. Acad. Sci. 112, 14295–14300. doi: 10.1073/pnas.1515297112
Simenstad C. A. and Cordell J. R. (2000). Ecological assessment criteria for restoring anadromous salmonid habitat in Pacific Northwest estuaries. Ecol. Eng. 15, 283–302. doi: 10.1016/S0925-8574(00)00082-3
Simenstad C. A., Fresh K. L., and Salo E. O. (1982). “The role of Puget Sound and Washington coastal estuaries in the life history of Pacific salmon: an unappreciated function,” in Estuarine Comparisons. Ed. Kennedy V. S. (Burlington: Academic Press), 343–364.
Simenstad C. A., Hood W. G., Thom R. M., Levy D. A., and Bottom D. L. (2000). “Landscape structure and scale constraints on restoring estuarine wetlands for Pacific Coast juvenile fishes,” in Concepts and Controversies in Tidal Marsh Ecology. Eds. Weinstein M. P. and Krueger D. A. (Kluwer Academic Publ., Dordrecht), 597–630.
Simenstad C. A., Ramirez M., Burke J., Logsdon M., Shipman H., Tanner C., et al. (2011). Historical change of Puget Sound shorelines: Puget Sound nearshore ecosystem project change analysis. Puget Sound nearshore report no. 2011-01 (Olympia, Washington and U.S. Army Corps of Engineers, Seattle, Washington: Washington Department of Fish and Wildlife). Available at: https://wdfw.wa.gov/sites/default/files/publications/02186/wdfw02186.pdf.
Simenstad C. A. and Thom R. M. (1996). Functional equivalency trajectories of the restored Gog-Le-Hi-Te estuarine wetland. Ecol. Appl. 6, 38–56. doi: 10.2307/2269551
Smit B. and Spaling H. (1995). Methods for cumulative effects assessment. Environ. Impact Assess. Rev. 15, 81–106. doi: 10.1016/0195-9255(94)00027-X
Sobocinski K. L., Harvell C. D., Baloy N. J., Broadhurst G., Dethier M. N., Flower A., et al. (2022). Urban seas as hotspots of stress in the Anthropocene ocean: The Salish Sea example. Elementa-Science Anthropocene 10. doi: 10.1525/elementa.2022.00055
Thom R. M., Diefenderfer H. L., Vavrinec J., and Borde. A. B. (2012). Restoring resiliency: Case studies from Pacific Northwest estuarine eelgrass (Zostera marina L.) ecosystems. Estuaries Coasts 35, 78–91. doi: 10.1007/s12237-011-9430-6
Thom R. M., Williams G. W., and Diefenderfer H. L. (2005). Balancing the need to develop coastal areas with the desire for an ecologically functioning coastal environment: Is net ecosystem improvement possible? Restor. Ecol. 13, 193–203. doi: 10.1111/j.1526-100X.2005.00024.x
Trexler J. C. and Goss C. W. (2009). Aquatic fauna as indicators for Everglades restoration: applying dynamic targets in assessments. Ecol. Indic. 9, 108–119. doi: 10.1016/j.ecolind.2008.11.001
Vilizzi L., Tarkan A. S., and Copp G. H. (2015). Experimental evidence from causal criteria analysis for the effects of common carp Cyprinus carpio on freshwater ecosystems: a global perspective. Rev. Fisheries Sci. Aquaculture 23, 253–290. doi: 10.1080/23308249.2015.1051214
Wainger L. A., Secor D. H., Gurbisz C., Kemp W. M., Glibert P. M., Houde E. D., et al. (2017). Resilience indicators support valuation of estuarine ecosystem restoration under climate change. Ecosystem Health Sustainability 3, e01268. doi: 10.1002/ehs2.1268
Washington State Academy of Sciences (2022a). Net Ecological Gain Definition, Goals, and Objectives (Seattle, WA), 1–15.
Washington State Academy of Sciences (2022b). Assessment of No Net Loss and Recommendations for Net Ecological Gain Metrics, Indicators, and Monitoring (Seattle, WA), 1–37.
Keywords: ecosystem restoration, cumulative effects, causal analysis, synthesis, salmon, estuary
Citation: Sobocinski KL, LeMoine M, Chamberlin JW, Conway-Cranos L, Del Rio A, Diefenderfer HL, Greene CM, Hall J, Johnson GE, Thom RM, Trujillo E and Zackey T (2025) Assessing the cumulative effects of nearshore habitat restoration actions for multiple populations of juvenile salmon in Whidbey Basin, Washington: foundation and approach for synthesis and evaluation. Front. Mar. Sci. 12:1514508. doi: 10.3389/fmars.2025.1514508
Received: 21 October 2024; Accepted: 29 April 2025;
Published: 17 June 2025.
Edited by:
Ibon Galparsoro, Technological Center Expert in Marine and Food Innovation (AZTI), SpainReviewed by:
Jinlin Liu, Tongji University, ChinaGeoff Steinhart, US Fish and Wildlife Service, United States
© 2025 At least a portion of this work is authored by Joshua W. Chamberlin and Correigh M. Greene on behalf of the U.S. Government and as regards Mr. Chamberlin, Dr. Greene, and the U.S. Government, is not subject to copyright protection in the United States. Foreign and other copyrights may apply. This is an open-access article distributed under the terms of the Creative Commons Attribution License (CC BY). The use, distribution or reproduction in other forums is permitted, provided the original author(s) or copyright owner(s) are credited and that the original publication in this journal is cited, in accordance with accepted academic practice. No use, distribution or reproduction is permitted which does not comply with these terms.
*Correspondence: Kathryn L. Sobocinski, c29ib2Npa0B3d3UuZWR1