 Mingxiang Niu
 Feng Lu3
 Tao Zuo
 Yongtao Li
 Zhaolong Cheng
- 1Yellow Sea Fisheries Research Institute, Chinese Academy of Fishery Sciences, Qingdao, China
- 2Laboratory for Marine Ecology and Environmental Science, Qingdao Marine Science and Technology Center, Qingdao, China
- 3Administration Committee of Shandong Yellow River Delta National Nature Reserve, Dongying, China
Introduction: The Yellow River estuary serves as a crucial convergence point between the Yellow River and the Bohai Sea and is a vital spawning, nursery, and feeding ground for a variety of fish species. Ichthyoplankton are essential for the replenishment and sustainable use of fishery resources. To gain insights into the distribution of fish in these early life stages and examine in depth the impacts of environmental factors on their presence and abundance in the waters around the Yellow River estuary, in this study, we analyzed the temporal and spatial distribution of ichthyoplankton and their correlation with environmental variables.
Methods: Data were gathered from horizontal-trawl surveys conducted between April and July of 2020, 2021, and 2023. In instances where no eggs or larvae were caught, a two-stage Generalized Additive Model (GAM) was employed to evaluate the influence of environmental factors on the presence/absence (P/A model) and abundance, given presence (Density model).
Results: The results revealed that there were significant fluctuations in species richness both monthly and annually. Moreover, notable spatial disparities were identified in the distribution of abundance encompassing estuarine, settled, and migratory fish populations. The final model accounted for 38.69% and 39.80% of the deviance in the presence and abundance of ichthyoplankton, respectively. The two-stage GAM results highlighted that sea surface temperature (SST), chlorophyll a concentration, sea bottom salinity, and water depth were the dominant factors influencing the presence of ichthyoplankton. Moreover, a model incorporating SST, sea surface salinity, and distance to shore best described the abundance of ichthyoplankton when present.
Discussion: Our findings contribute to understand the spatiotemporal dynamics of ichthyoplankton and their influencing factors in the waters around the Yellow River estuary, which have important implications for fisheries management.
1 Introduction
Estuaries are transitional zones connecting riverine and marine environments. They serve as important ecosystems for the renewal of fishery resources, thereby making important contributions to coastal fish stocks (Beck et al., 2001; Attrill and Power, 2002; McLusky and Elliott, 2004). Estuaries possess significant environmental attributes, including serving as migratory pathways, sheltered habitats, and nourishment areas for marine fish species (Dolbeth et al., 2008). They are also important breeding grounds (Freitas et al., 2012; Ha et al., 2022; Do and Tran, 2023), as their shallow waters provide refuge from predators and promote growth during the early life stages of these species (Able et al., 2013).
The Yellow River estuary, connecting the Yellow River to the Bohai Sea, is situated between Bohai Bay and Laizhou Bay and experiences a temperate monsoon climate. It is recognized as a highly dynamic estuary. The Yellow River, the second largest river in China, contributes a substantial amount of sediment and diversity of nutrients to the estuary, fostering a habitat rich in bait organisms and with high primary productivity, where many marine species feed, grow, and reproduce (Yang and Wang, 1993; Jin and Deng, 2000). However, influenced by human activities, climate change, runoff, and tidal currents, the Yellow River estuary exhibits a unique and complex ecological structure. This makes it particularly sensitive to external disturbances (Fan and Huang, 2005; Zhao et al., 2021; Wu et al., 2024). Variations in the ecosystem of the Yellow River estuary have negatively impacted fishery resources, resulting in habitat degradation, a decline in fish stocks, changes to population structure, and even the disappearance of marine organism spawning grounds (Bian et al., 2010; Cheminée et al., 2017).
The availability of ichthyoplankton is crucial for the replenishment and sustainable use of marine fishery resources. Changes in their distribution and abundance can significantly affect the balance of the marine ecosystem (Ellis and Nash, 1997; Yen et al., 2022; Zhang et al., 2022). As an early-stage replenishment group in fishery resources, ichthyoplankton face high mortality rates (Caley et al., 1996), and are susceptible to environmental variations (Perry et al., 2005; Bian et al., 2010). Water temperature and salinity are two key factors affecting the distribution and dynamics of early-stage fish in temperate estuaries (Kindong et al., 2020; Lima et al., 2020). Therefore, under the background of climate change, the water sediment regulation scheme of the Yellow River, and human activities, it is imperative to study the distribution patterns of ichthyoplankton, along with its relationship with environmental factors in Yellow River estuary waters.
The relationship between fisheries and environmental variables is complex, nonlinear (DingsØr et al., 2007) and nonadditive (Ciannelli et al., 2004). As an extension of the generalized linear model, GAMs allow for the modeling of nonlinear relationships between a response variable and multiple explanatory variables (Hastie and Tibshirani, 1990; Venables and Dichmont, 2004; Franca et al., 2012), which are frequently employed to explore the relationship between species distribution and environmental factors (Furey and Rooker, 2013; Feng et al., 2021; Wang et al., 2021). Therefore, GAMs were used to investigate the influence of environmental factors on ichthyoplankton spatiotemporal distribution in this study.
Previous research has predominantly concentrated on species composition, biodiversity, and community structure characteristics of ichthyoplankton in the waters around the Yellow River estuary (Bian et al., 2010; Song et al., 2019; Yang et al., 2023). In the present study, we analyzed the temporal variation in species richness and the spatiotemporal distribution of ichthyoplankton, including those of estuarine, settled, and migratory fish groups. Additionally, we explored the effects of environmental variables on the occurrence and abundance of ichthyoplankton in Yellow River estuary waters. The findings of this study will aid in clarifying the status of fishery resource replenishment in the region as well as improve the understanding of the ichthyoplankton distribution dynamics and their influencing factors. This will ultimately provide scientific support for informed decision-making in sustainable fishery management, thereby promoting the overall health and productivity of this marine ecosystem.
2 Materials and methods
2.1 Study area and sampling
Samples were collected during scientific surveys of spawning grounds conducted from 2020 to 2023. The survey area extended from 119°00′ E to 119°25′ E and from 37°20′ N to 38°05′ N, encompassing a total of 31 survey sites (Figure 1). This region includes the estuary of the Yellow River and its adjacent waters, with Laizhou Bay situated in the southern area, and Dongying Port and the Shengli Oilfield located in the northern area.
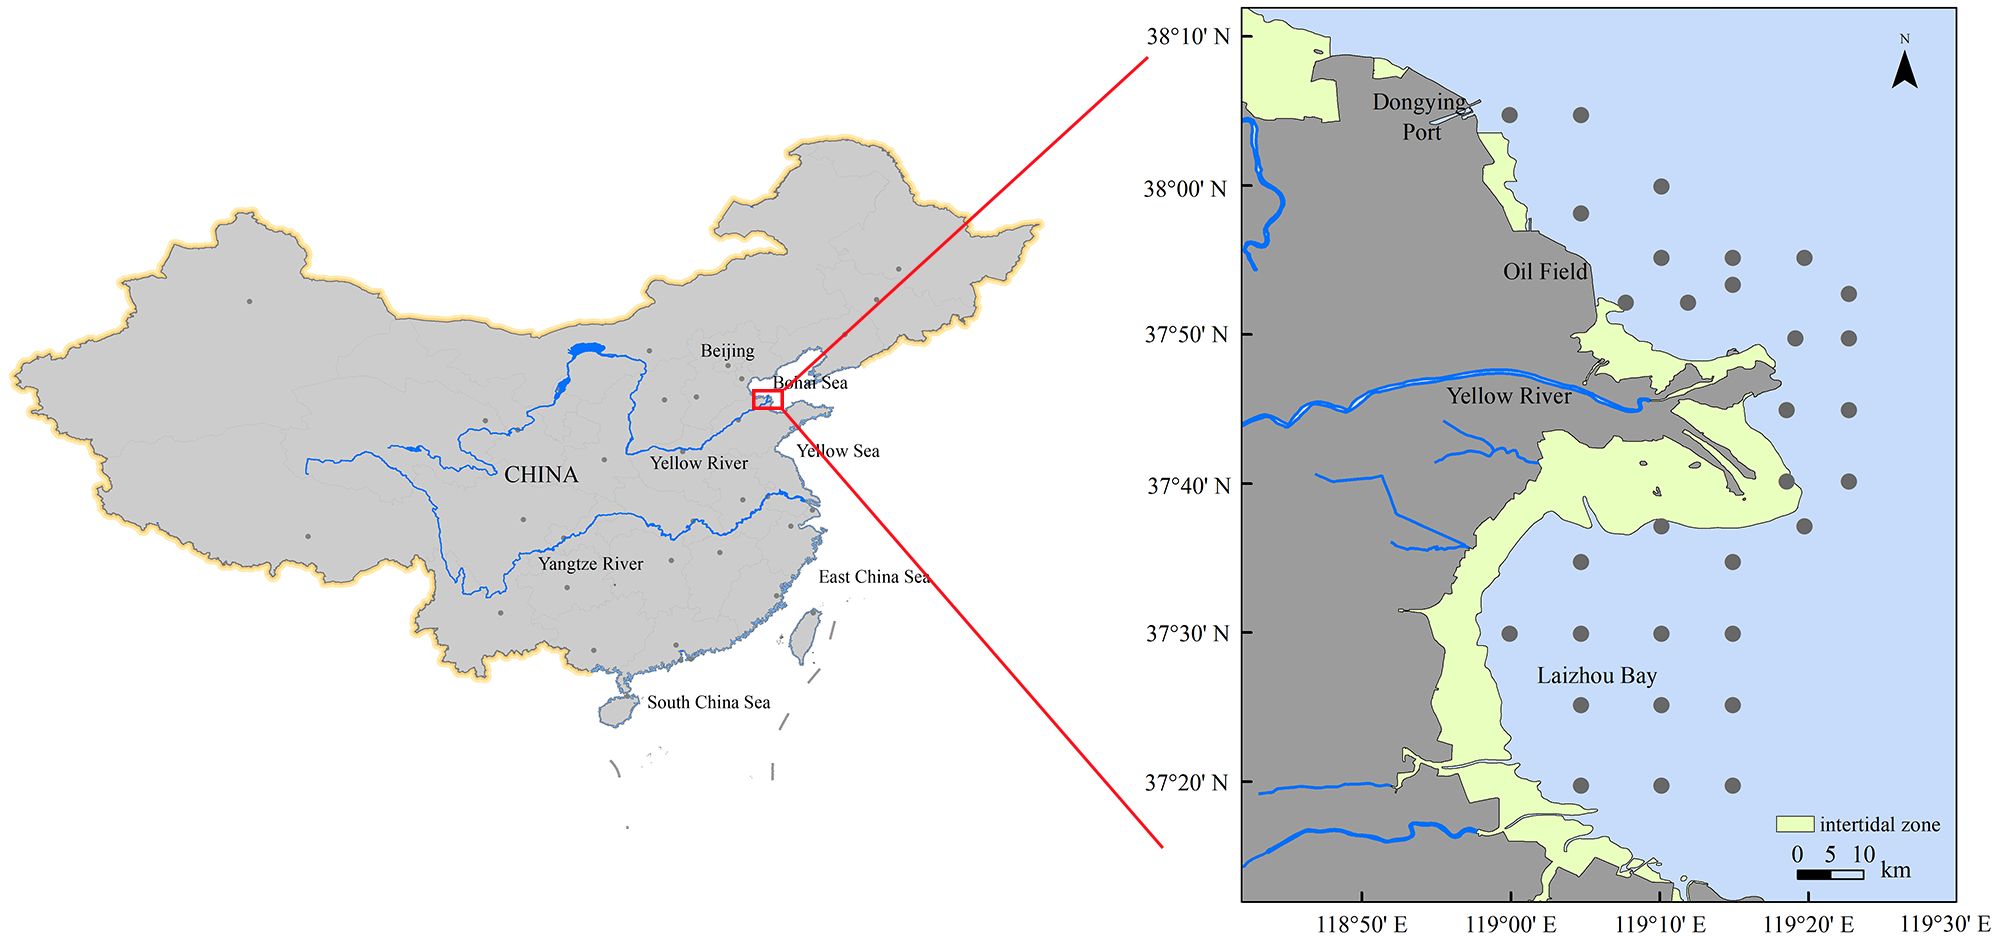
Figure 1. Spatial distribution of survey stations for the collection of ichthyoplankton in the waters around the Yellow River estuary during spring between 2020 and 2023. Inset with a red rectangular box marks the study area.
A large plankton net (0.8 m in diameter, 0.505 mm in mesh size, and 0.5 m2 in net mouth area) was employed to gather fish eggs and larvae. The net was trawled horizontally for 10 min at a towing speed of 2 knots covering predetermined sampling stations. The specimens were subsequently preserved in a 5% formalin-seawater solution and taken to the laboratory. Subsequently, all the fish eggs and larvae were classified and counted based on their morphological characteristics using a dissecting microscope (Zhang et al., 1985; Okiyama, 1988; Wan and Zhang, 2016). The data relating to fish eggs and larvae were aggregated and their number per net was used to calculate the relative density of ichthyoplankton (ind./net).
The survey was conducted monthly from April to July 2020. Because we found that ichthyoplankton were most prevalent in April and May, further investigations were carried out in April and May of 2021 and in May of 2023. The specific survey dates are listed in Table 1. Notably, the survey in April 2020 was split into two sessions due to persistent windy conditions, and no samples could be collected at seven sites in May 2021.
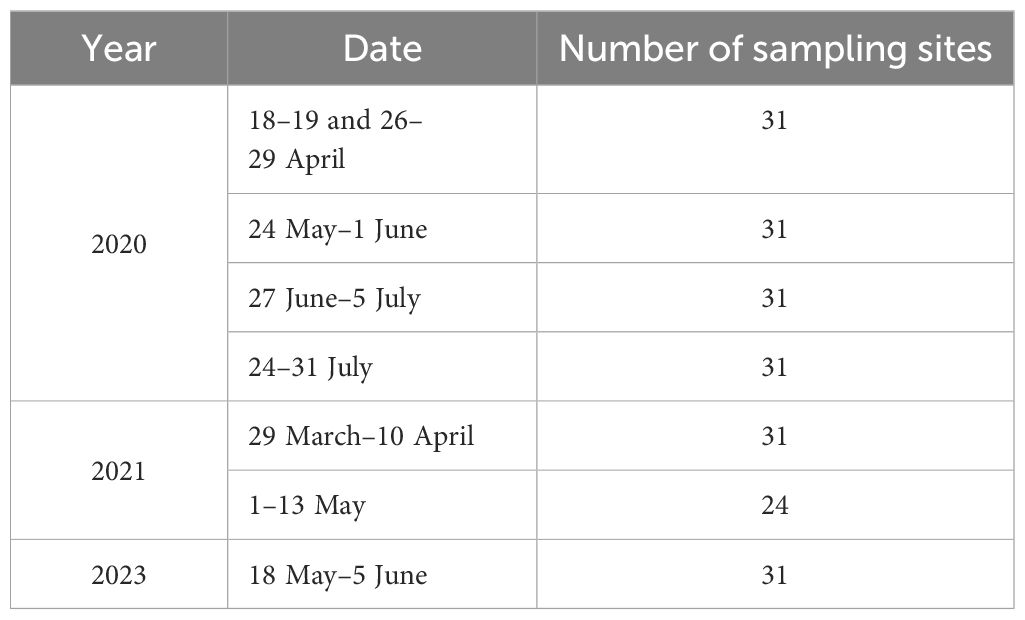
Table 1. Sampling time in Yellow River estuary waters from 2020 to 2023.
2.2 Environmental variables
The environmental factors sea surface temperature (SST), sea surface salinity (SSS), sea bottom temperature (SBT), sea bottom salinity (SBS), water depth (Depth), and dissolved oxygen (DO) were simultaneously measured at each survey station using an RBR maestro3 instrument (RBR Ltd., Ottawa, CA). For the determination of chlorophyll a (Chla) concentrations, 500 mL of seawater was first filtered through a Whatman (45-mm) GF/F filter membrane and then frozen in darkness for 24 h before extraction in 90% acetone. Subsequently, the Chla concentration was ascertained using a fluorescence extraction technique. The distance to shore (Distance), defined as the horizontal distance from the investigation site to the nearest coastline, was computed using ArcGIS software (ESRI Inc., Redlands, California, USA) with the aid of remote sensing data. Multicollinearity among all the environmental variables was assessed using Pearson correlation matrix analysis and Variance Inflation Factor (VIF) calculations. Only environmental variables exhibiting correlation and VIF values<0.7 and<4, respectively, were incorporated into the models (Guisan et al., 2017; Naimi and Araújo, 2016).
2.3 Temporal and spatial distribution
Venn diagrams were created in RStudio 4.40 and employed to analyze the fluctuations in species richness of ichthyoplankton. Based on the utilization characteristics in estuary and the adaptability to salinity of spawning adults, ichthyoplankton were classified into three groups, namely, estuarine, settled, and migratory (Whitfield and Elliott, 2002; Wang et al., 2019). The Spatial Analysis Model in ArcGIS10.2 was then applied to examine the temporal and spatial changes in the abundance of ichthyoplankton, and pie charts were used to illustrate the abundance of each category.
2.4 Generalized additive models
A two-stage GAM was applied to model the impact of environmental factors on the presence/absence and abundance of ichthyoplankton in Yellow River Estuary waters. First, the presence/absence of ichthyoplankton relating to each variable was established using logistic regression (P/A model), where P/A was zero if no ichthyoplankton were caught, and one if they were present. In the second stage, the density, given presence, was related to the environmental covariates, assuming a lognormal distribution for the response variable (Density model).
The general expressions of all the GAMs were as follows:
Akaike’s Information Criterion (AIC) and P-value were used to identify the covariates that best fit the model. A P-value<0.05 was indicative of a correlation between covariates and response variables. The AIC measured the fit of the model, and the smaller the AIC value, the better the model goodness-of-fit. A stepwise method was applied for variable selection to achieve the optimal model (Mohamed et al., 2018; García-Fernández et al., 2021). The AIC was calculated as follows:
where is the number of parameters and is the likelihood function. GAMs were run using the “mgcv” package in RStudio 4.40 software.
3 Results
3.1 Temporal variation in species richness
Species richness varied from month to month. A total of 29 ichthyoplankton species were identified from trawl samples collected from April to July 2020. The number of species collected was the same in May, June, and July (17 species each month), while only 7 occurred in April. Of these, 2 species were present every month, and 10 species were detected each in May, June, and July. Additionally, 3 species occurred only in April, 4 only in May, 2 only in June, and 4 only in July (Figure 2A).
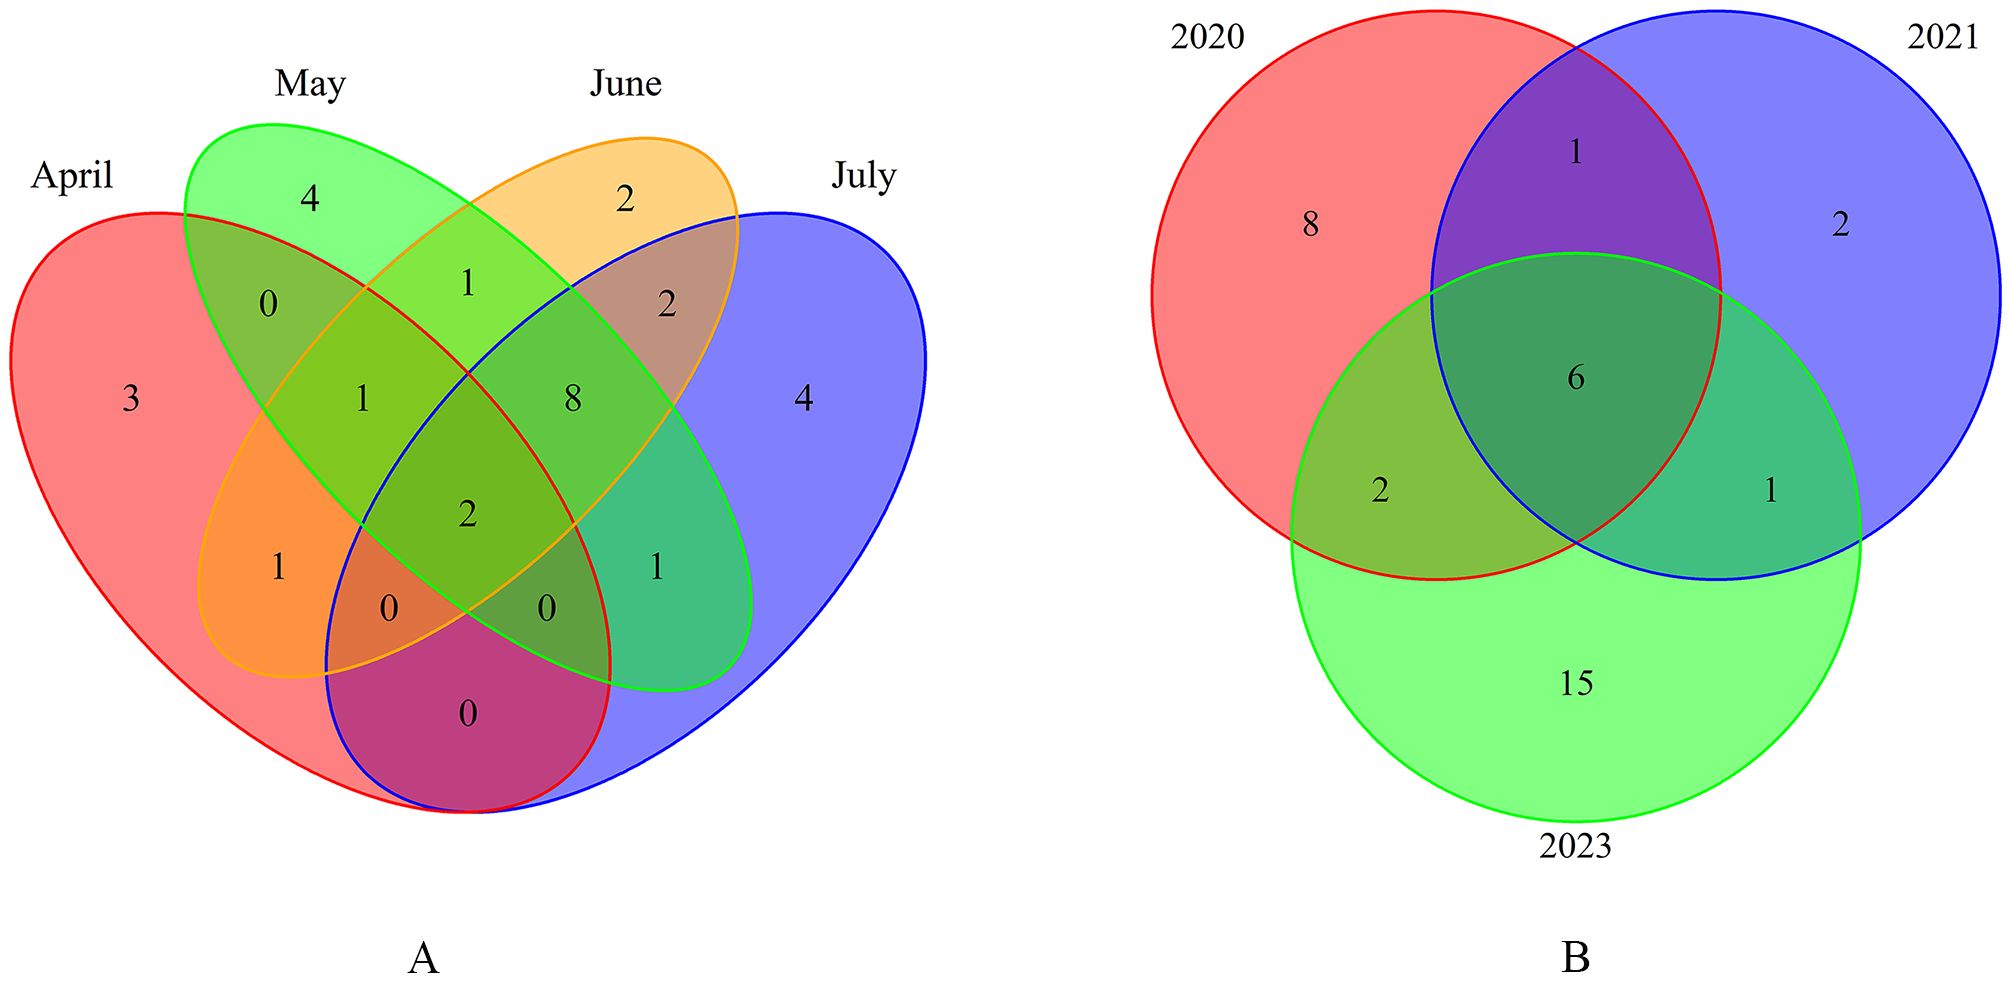
Figure 2. Species richness variation in Yellow River estuary waters. (A) Monthly variations in 2020. (B) Interannual variations between 2020 and 2023.
Species richness varied across different years. In May 2020, 2021, and 2023, a total of 35 fish species were identified. Specifically, most (24) species were collected in May 2023, followed by 17 in May 2020, and the lowest (10) species were collected in May 2021. Among these species, 6 were present each year, while 8 occurred only in May 2020, 2 only in May 2021, and 15 only in May 2023 (Figure 2B).
3.2 Temporal and spatial variations in abundance
The density distribution of ichthyoplankton from 2020 to 2023 displayed significant spatial variation (Figure 3). The highest abundance of ichthyoplankton was observed in the waters near Dongying Port, Laizhou Bay, and the southern waters of the estuary. Conversely, the lowest abundance was recorded in the waters around the mouth of the Yellow River estuary. Regarding fish migration patterns, the largest proportion of estuarine ichthyoplankton was found at stations in Laizhou Bay and the northern waters of the estuary. The ichthyoplankton of both settled and migratory fish were present across almost all the stations in the study area. However, the proportion of settled fish was highest near the estuary and at several stations in Laizhou Bay. In contrast, migratory fish ichthyoplankton were more prevalent in the waters near Dongying Port, the northern part of Laizhou Bay, and at several stations near the estuary.
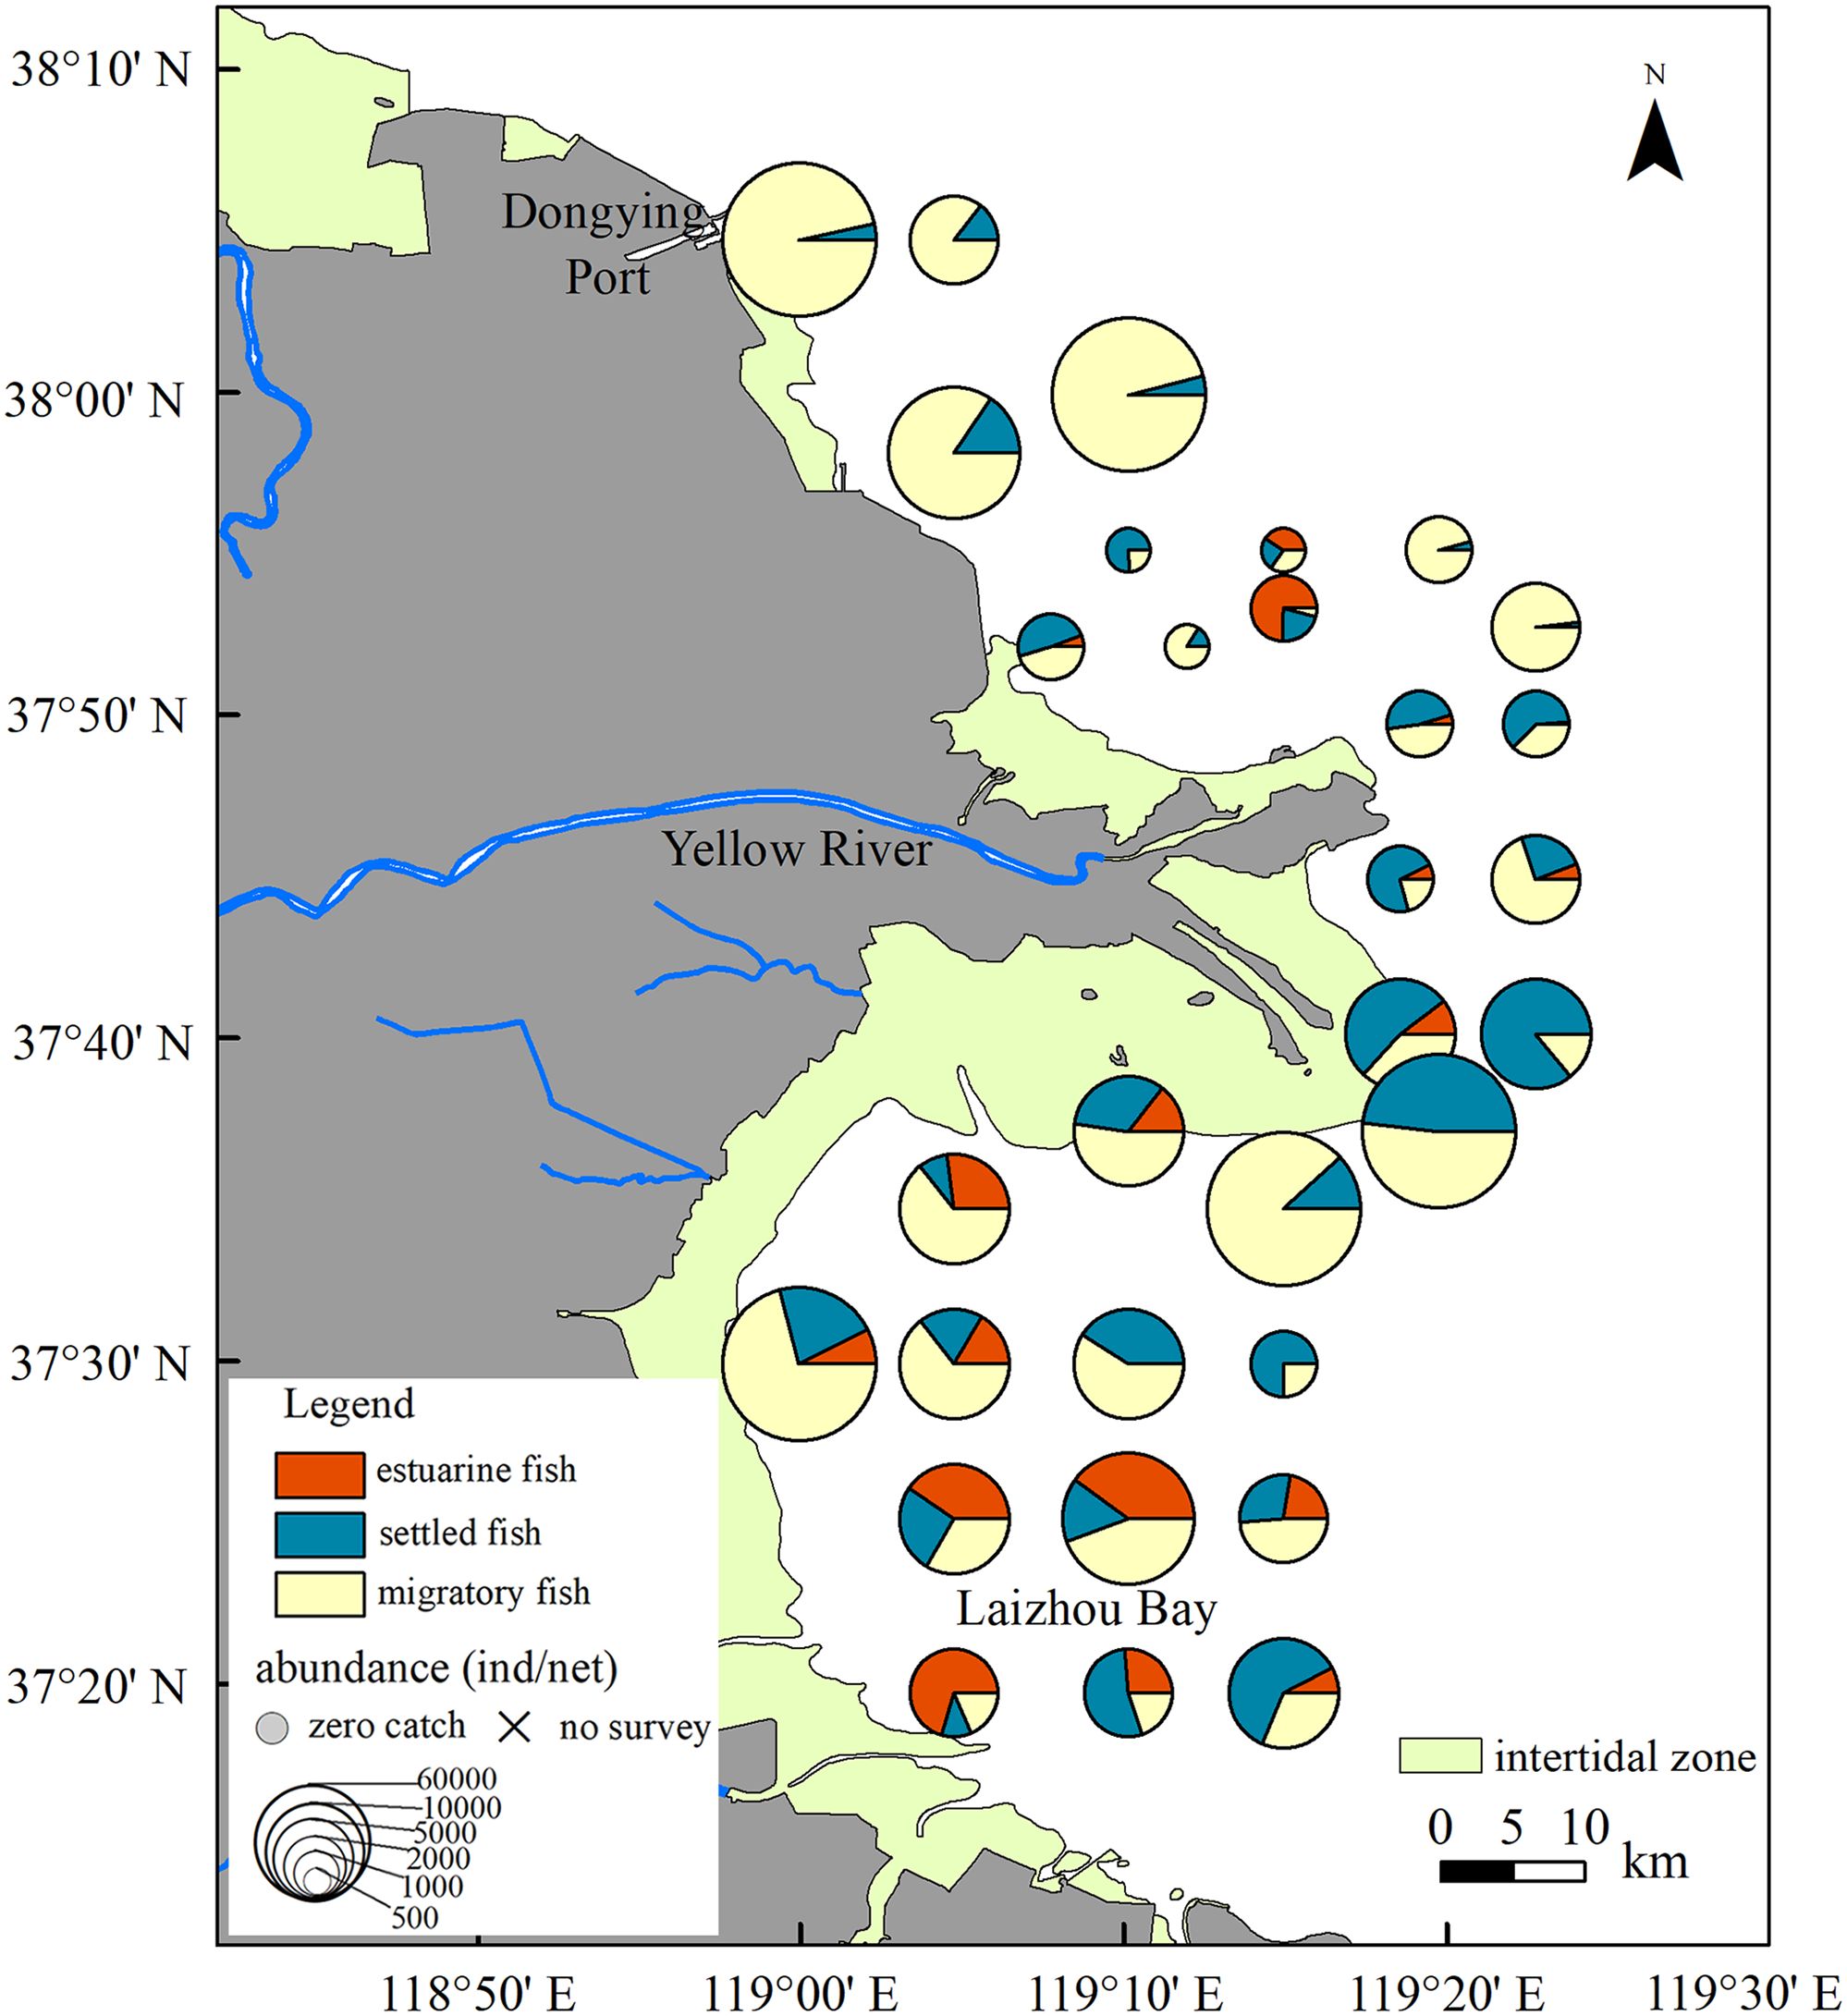
Figure 3. Spatial abundance distribution of ichthyoplankton encompassing estuarine, settled, and migratory fish in the waters around the Yellow River estuary from 2020 to 2023.
The spatial distribution of ichthyoplankton exhibited distinct monthly changes. In the sampling period of April to July 2020, the abundance of ichthyoplankton was highest in May, followed by April. In April, most ichthyoplankton were concentrated in Laizhou Bay, primarily consisting of estuarine species, while “zero catch” stations were located in the northern region of the estuary (Figure 4A). In May, ichthyoplankton were found in 30 out of 31 surveyed stations. High abundance, predominantly migratory species, was observed near Dongying Port and in the northern part of Laizhou Bay, whereas estuarine and settled species were more dispersed (Figure 4B). In June, the number of “zero catch” stations increased and became more widespread across the study area. This coincided with a decline in the overall abundance of ichthyoplankton, primarily comprising migratory and settled species (Figure 4C). In July, although only 3 “zero catch” stations were recorded, the overall abundance remained as low as in June, but there was an increase in the proportion of settled fish ichthyoplankton (Figure 4D).
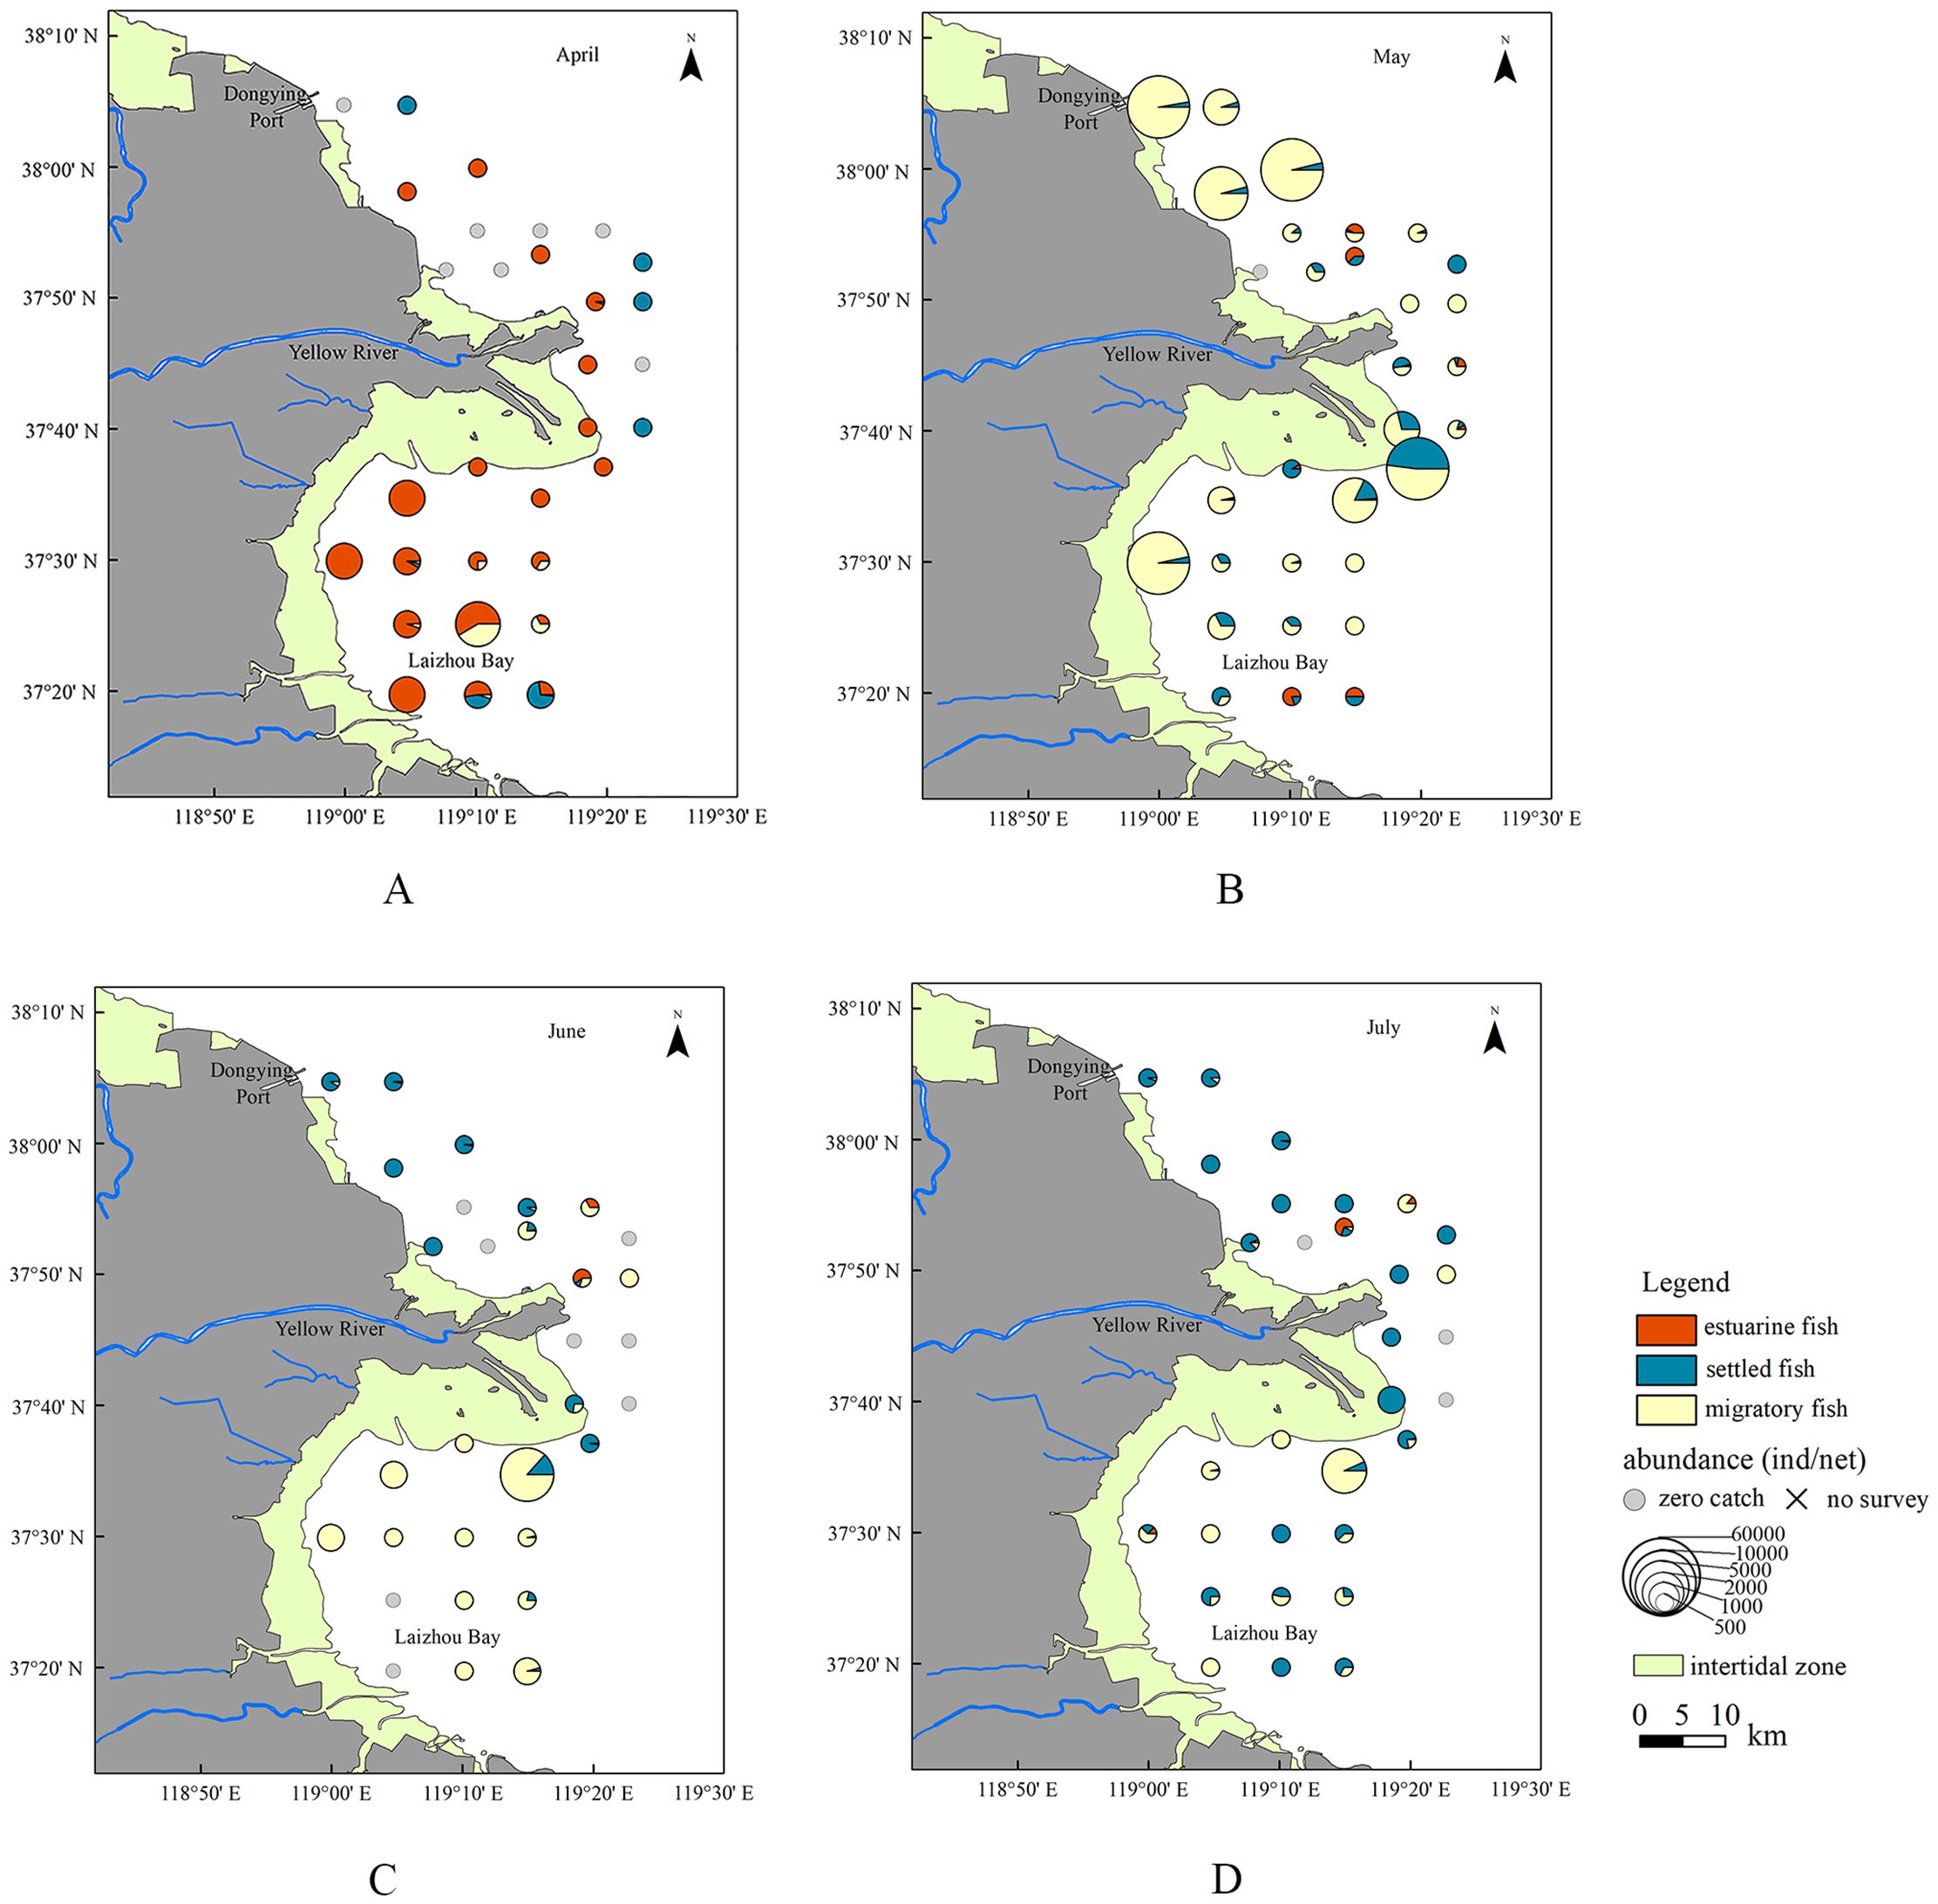
Figure 4. Spatial abundance distribution of ichthyoplankton encompassing estuarine, settled, and migratory fish in the waters around the Yellow River estuary in (A) April, (B) May, (C) June, and (D) July of 2020.
3.3 GAM analysis
Two GAMs were constructed to evaluate the influence of environmental factors on the presence and abundance of ichthyoplankton in the waters around the Yellow River estuary. Variables that impose significant impact on the model were selected based on P-value and AIC value by the stepwise method (Table 2). In consideration of their relatively large explained deviance and their expected effect on the distribution and abundance of ichthyoplankton, although not significant (P>0.05), Depth and Distance were retained in the optimal models. The first stage GAM (P/A model) retained four variables including SST, Chla, SBS, and Depth, which explained 38.69% of the variance in the presence of ichthyoplankton. The second stage GAM (Density model) retained three variables, namely SST, SSS, and Distance, and model deviation accounted for 39.80% of the variance in the abundance of ichthyoplankton.
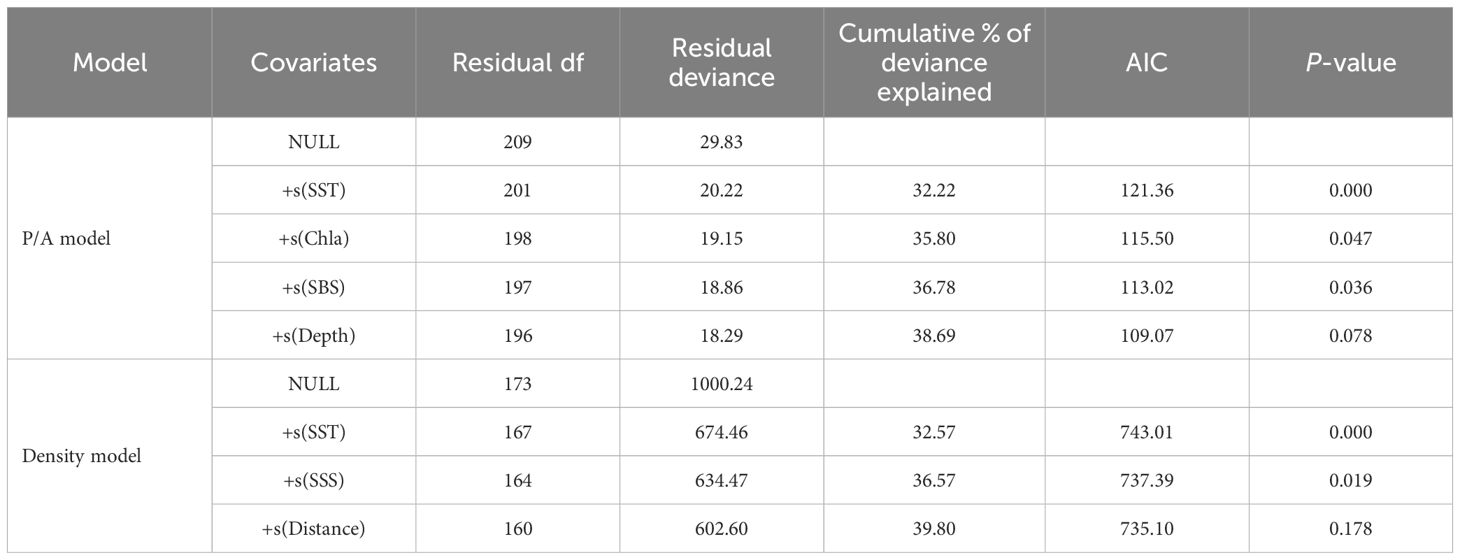
Table 2. Construction of a stepwise generalized additive model for factors influencing the presence/absence and abundance of ichthyoplankton in the waters around the Yellow River estuary.
In the models, the deviance of selected factors represents the influence degree of each factor on the presence and abundance of ichthyoplankton. In P/A model, SST was the most important factor affecting ichthyoplankton presence, with a contribution of 32.22%, followed by Chla, Depth, and SBS, with contributions of 3.58%, 1.91%, and 0.98%, respectively. In Density model, the most important influencing factor was the SST, with a contribution of 32.57%, followed by SSS and Distance, with contributions of 4.00% and 3.23%, respectively.
3.4 The influence of environmental factors on the ichthyoplankton distribution
The impacts of explanatory variables on the ichthyoplankton presence are shown in Figure 5. Ichthyoplankton were mainly located within the SST range of 7–26°C, with a peak at 16°C. The influence of SST on their presence was positive for temperatures between approximately 7°C and 16°C, after which there was a slight decline in their presence with increasing SST (Figure 5A). Ichthyoplankton were more frequently found in areas where the Chla concentration was between 0.8 and 6.5 mg/m3. Their presence rose gradually with increasing Chla concentration until it rapidly decreased; when the Chla concentration exceeded 8.0 mg/m3, the subsequent impact was less clear because there were fewer data points and wider confidence intervals (Figure 5B). Ichthyoplankton were predominantly found in the SBS range of 26–30, and there was a negative linear relationship between their presence and SBS (Figure 5C). Regarding Depth, ichthyoplankton were most likely to be present at water depths between 2 and 9 m; their presence slightly declined at depths from 2 to 6 m before stabilizing with further increases in Depth (Figure 5D).
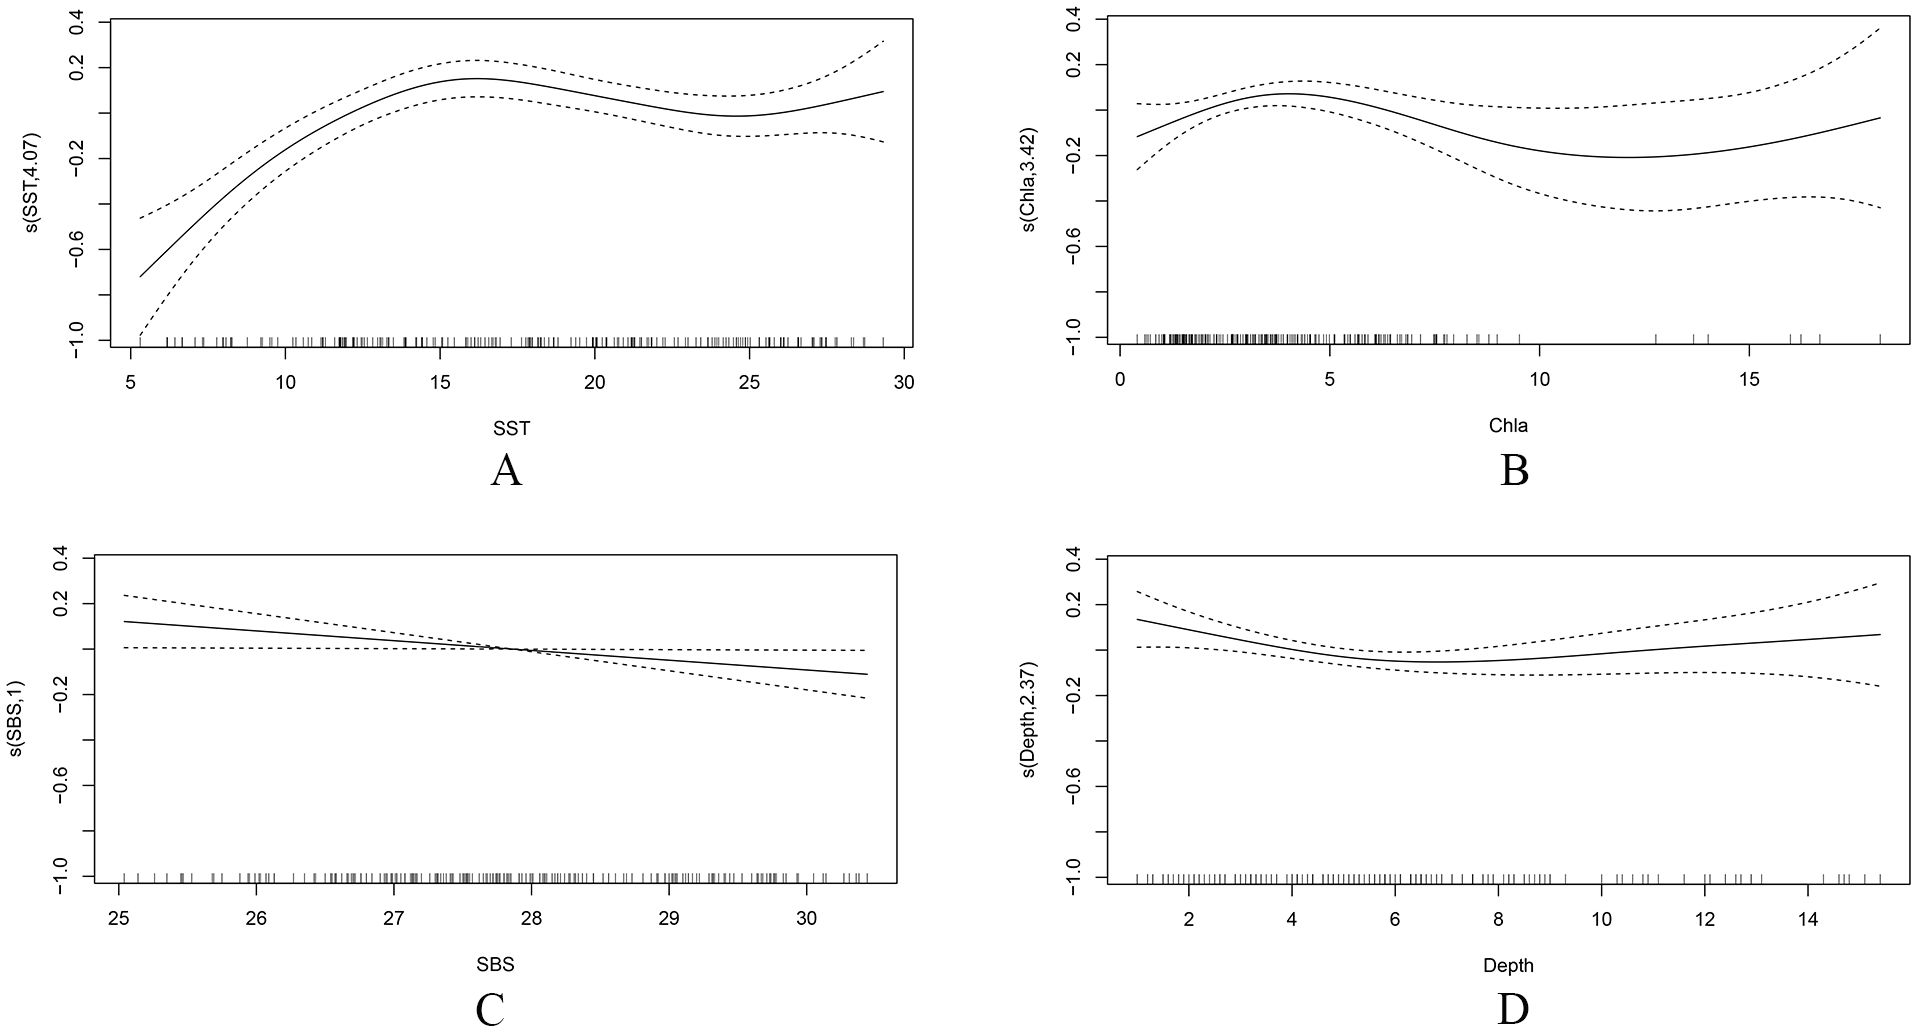
Figure 5. The effect of environmental factors on the presence of ichthyoplankton based on the Generalized Additive Model (GAM) (P/A model). The plot includes the additive effect of (A) sea surface temperature (SST), (B) chlorophyll a (Chla) concentration, (C) sea bottom salinity (SBS), and (D) Depth. Solid lines denote smoothed values and dotted lines represent the 95% confidence interval (CI).
The relationships between the variables and ichthyoplankton abundance are depicted in Figure 6. Ichthyoplankton, given presence, were mainly associated with temperatures ranging from approximately 10 to 25°C, with abundance peaking at 18°C. In the range of 10 to 18°C, the abundance increased as the SST rose, whereas the opposite trend was observed in the range of 18 to 25°C (Figure 6A). The influence of SSS on the abundance of ichthyoplankton remained stable. Ichthyoplankton were most abundant at the SSS range of 25 to 29. For other ranges, the confidence interval for the relationship curve between ichthyoplankton abundance and SSS exhibited a broad range, which reduced its credibility (Figure 6B). The abundance of ichthyoplankton decreased as the Distance increased within the range of 3,000–15,000 m. Although an upward trend was also observed when the Distance exceeded 15,000 m, the confidence intervals became wider owing to lower data density (Figure 6C).
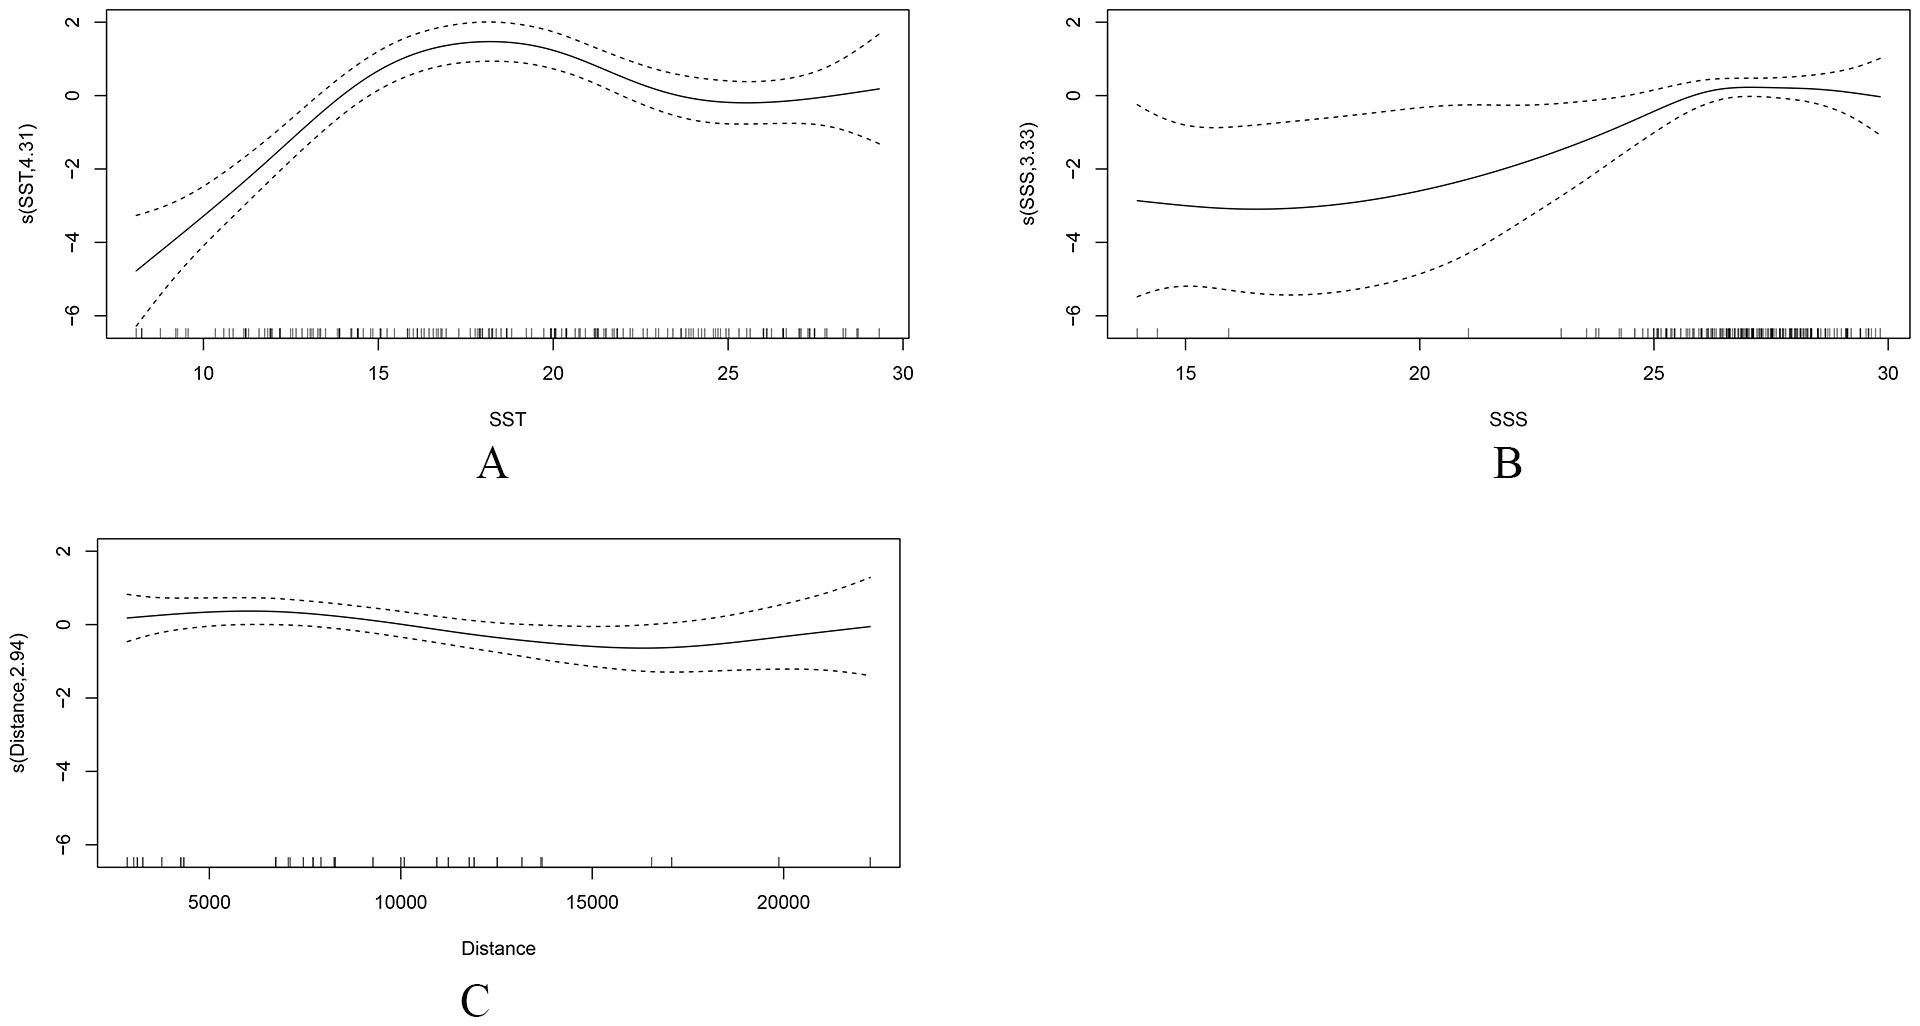
Figure 6. The effect of environmental factors on the abundance of ichthyoplankton based on the Generalized Additive Model (GAM) (Density model). The plot includes the additive effect of (A) sea surface temperature (SST), (B) sea surface salinity (SSS), and (C) Distance. Solid lines denote smoothed values and dotted lines represent the 95% confidence interval (CI).
4 Discussion
4.1 Variations in the species richness of ichthyoplankton
The species richness of ichthyoplankton in the waters around the Yellow River estuary, a typical temperate estuary, exhibited significant monthly variation. The lowest number of species was observed in April, with only 2 species overlapping with those detected in the other three months. However, the species number increased significantly from May onward, and the number of common species (May–July) increased to 10. Significant seasonal variations in fish species were also reported for the Yangtze estuary, which also has a temperate climate (Chen et al., 2022). Additionally, a pronounced seasonal succession (succession rate: ~83.33%) was observed in the ichthyoplankton category composition in the Yellow River estuary (Bian et al., 2010). The species and number of ichthyoplankton living in an estuary are determined by environmental conditions and material sources (Shan et al., 2004). Compared with that in April, the species richness changed from May onward, suggesting that environmental factors also changed. In another study, it was reported that the SST ranges of sampling sites varied from 10.66–15.71°C in April to 18.66–22.23°C in May (Niu et al., 2023). Meanwhile, temporal differences in species number among ichthyoplankton are mainly associated with seasonal migrations, particularly those associated with spawning and feeding, which affect species composition. In April, the water temperature is low in the Yellow River estuary, few fish species migrate to this area, and the settled species of gobiidae die after spawning in the previous year (Graham et al., 2005); in contrast, estuarine fish lay eggs in early spring (Dou and Chen, 1993). The spawning period of many fish occurs primarily during the warming season and many fish migrate to the Yellow River estuary and start to lay eggs when the water temperature rises in May (Wang et al., 2016). This explains why species richness was lower in April than in other months; analysis of the abundance distribution (Figure 4) also confirmed this pattern.
The species richness of ichthyoplankton demonstrated significant interannual variation. In May 2020, 2021, and 2023, ichthyoplankton belonging to 17, 10, and 24 species were collected, respectively. Six species were present across these 3 years. Notably, the reduction in species number in May 2021 may be attributed to weather-related sampling limitations at some stations. Despite this, interannual variations were still apparent. Previous studies have also reported limited common species and low species similarity between years in the Yellow River estuary and adjacent waters (Yang et al., 2022). The interannual succession of ichthyoplankton correlated with natural species turnover among spawning parents. Additionally, the estuarine ecological environment is highly complex and dynamic, and experiences strong fluctuations in habitat conditions that may influence the interannual variations in fish species (Yang et al., 2022). However, this possibility requires further study.
4.2 Temporal and spatial characteristics of the abundance distribution of ichthyoplankton
In estuarine areas, the physical, chemical, and hydrological conditions are complex and variable, leading to dramatic changes in environmental parameters over time and space (Harris and Cyrus, 1995; Hettler and Hare, 1998). Consequently, ichthyoplankton communities in these estuaries also undergo temporal and spatial changes that match the reproductive seasons of different fish species and environmental factors (Harris et al., 2001; Ren et al., 2021). In this study, we found that ichthyoplankton were highly abundant in the waters north of the Yellow River estuary and Laizhou Bay, with the highest proportion being migratory species, followed by settled species, and, finally, estuarine species (Figure 3). These findings are consistent with a previous study, which identified areas with high concentrations of ichthyoplankton in the coastal waters north of the Yellow River estuary and the southern waters of Laizhou Bay (Qin et al., 2017). Ocean currents significantly influence the distribution of ichthyoplankton owing to their weak independent swimming ability. The flow field in the Yellow River estuary and its adjacent waters is complex. One study reported that, influenced by the counterclockwise circulation system in the estuary, an area with a high density of ichthyoplankton formed at the tail of the residual current in the waters north of the estuary. Meanwhile, ichthyoplankton accumulated in Laizhou Bay, possibly due to the counterclockwise circulation in this region (Chen et al., 1998). A different study noted that, owing to the extension of coastline, a cape vortex formed between the Yellow River estuary and the southern sand mouth, trapping ichthyoplankton within the vortex, thereby forming a distribution center near the sand mouth (Bian et al., 2010). Our study confirmed the above conclusions (Figure 3).
Examination of the spatiotemporal dynamics of ichthyoplankton abundance from April to July 2020 (Figure 4) revealed notable monthly variations in both migration pattern proportions and overall abundance. For migration patterns, in April, most ichthyoplankton belonged to estuarine species. Additionally, the number of migratory fish rapidly increased in May, while the proportion of settled fish rose from June to July. This result suggested that the spawning timing of fish correlated with their ecological categorization, and migratory species moved toward coastal waters in May for egg-laying. Research on fish community composition has shown that both settled and migratory fish catch numbers were highest across four seasons in the Yellow River estuary and its adjacent waters (Wang et al., 2019). Zhang et al. (2016) also demonstrated that differences in horizontal distribution in different regions are related to species variation, abundance, and ecological categorization. Regarding abundance, Laizhou Bay consistently exhibited high levels during four months, whereas the northern waters of the estuary experienced elevated abundance only in May, coinciding with the highest overall abundance of ichthyoplankton. In general, the abundance of estuarine ichthyoplankton peaks in spring or summer (Kindong et al., 2020; Monteiro et al., 2021) and these are the reproductive seasons for most fish (Korsman et al., 2017). For Yellow River estuary waters, spring is the peak season for spawning. This period saw the highest number of fish eggs, while the number of larvae remained relatively low. In contrast, during the summer months, the number of fish eggs decreased, while that of larvae increased (Bian et al., 2010; Niu et al., 2022). Laizhou Bay, a semi-enclosed water body, receives inflow from numerous rivers, especially diluted water from the Yellow River. Consequently, Laizhou Bay is rich in nutrients, and has an amenable water temperature and low salinity, resulting in a crucial spawning, feeding, and nursery habitat for diverse fishery resources in the Yellow Sea and Bohai Sea (Jin and Deng, 1999). This explains why the ichthyoplankton distribution in Laizhou Bay predominantly occurred from April to July.
4.3 The influence of environmental factors on the presence and abundance of ichthyoplankton
The distribution, reproduction, and growth of marine organisms are closely related to the marine environment (Sherman et al., 1983). The spatiotemporal variations in dominant species abundance are mostly driven by physicochemical conditions (Chen et al., 2022), and the large-scale (kilometer) distribution patterns of species are likely the result of their responses to the physical environment (Martino and Able, 2003). The influence of environmental factors on species distribution is greater than that of biological factors (Hoeinghaus et al., 2007). In the present study, we found that in the waters around the Yellow River estuary, SST, Chla concentrations, SBS, and Depth affected the presence of ichthyoplankton, whereas SST, SSS, and Distance affected their abundance.
Water temperature has a major and direct or indirect effect on fish reproduction, recruitment, physiology, growth, and behavior (Vidy, 2000; Sabates et al., 2006; Doring et al., 2018), all of which are important for determining the spatial distribution and abundance of ichthyoplankton (Bruno et al., 2014; Chermahini et al., 2021). We found that SST was the most significant explanatory variable in both the P/A and Density models of ichthyoplankton in the waters around the Yellow River estuary. From April to July, ichthyoplankton mainly inhabited waters with an SST range of 7 to 26°C, and the most suitable SST was 16°C. Ichthyoplankton were abundant at temperatures between 10 and 25°C, with the optimal SST being 18°C. This result was in accordance with the conclusion that estuarine organisms that can adapt to a wide range of temperatures tend to be dominant (Yang et al., 2006). The optimal water temperature for maximizing the abundance of ichthyoplankton markedly exceeded that required for their presence, possible because higher water temperatures promote the development of fish gonads, resulting in increased spawning activity (Kimura et al., 2010) and ichthyoplankton abundance (Spies and Steele, 2016).
Within estuaries, salinity is highly variable due to alterations in freshwater inflow. Salinity plays a crucial role in the life history of estuarine fishes. The starting point and speed of fish development at different development stages such as fertilization, hatching, and spawning, are closely related to the salinity (Yin et al., 2019). Furthermore, salinity is a key abiotic determinant of the variation in ichthyoplankton community structure in estuaries (Wooldridge, 1999), affecting not only the growth, development, and reproduction of ichthyoplankton but also their spatiotemporal distribution and abundance (Jiang et al., 2013; Lima et al., 2019). Our analysis revealed that the presence of ichthyoplankton was significantly influenced by SBS, while their abundance was notably affected by SSS. This result aligned with those of previous studies. Yang et al. (2018, 2023, 2024) reported that environmental parameters such as salinity, water temperature, water depth, and plankton density influence the habitat selection of fishes. Specifically, they found that salinity greatly affected the abundance of fish eggs in the Yellow River estuary and its adjacent waters. Furthermore, we noted that ichthyoplankton were primarily found in areas where the SBS ranged from 26 to 30, as well as the abundance of ichthyoplankton remained relatively high and stable within the SSS range of 25–29. The optimum salinity range for both presence and abundance of ichthyoplankton was narrow, suggesting that the salinity values for their survival did not significantly vary between April and July. One possible explanation for this may be that too high or too low salinity prevented the exchange of substances between fertilized eggs and the surrounding medium, thereby reducing the hatching rate (Giffard-Mena et al., 2020). Similar results were observed in the Pearl River estuary (Wang et al., 2023).
The Chla concentration serves as an indicator of phytoplankton growth. The greater the phytoplankton biomass, the higher the primary productivity, and the more advantageous the environment for the growth of fish food (Whitfield, 1999). In the egg stage, fish depend on their egg yolk as a nutrient source for a brief period; subsequently, they transition to mixed feeding, before exclusively consuming external food sources, such as plankton, and zooplankton. Moreover, their diet varies at different developmental stages (Zhang et al., 2022). Given that we predominantly collected fish eggs in this study, the abundance of ichthyoplankton did not necessarily correlate with the distribution of phytoplankton. GAM results indicated that ichthyoplankton abundance was not related to the Chla concentration. However, in terms of spatial distribution, it has been shown that larvae prefer to inhabit waters with a stable and reliable plankton food supply (Whitfield, 1999). This observation is consistent with our findings, namely, that the presence of ichthyoplankton was significantly related to the Chla concentration, particularly in the range of 0.8 to 6.5 mg/m3.
Water depth influenced the presence of ichthyoplankton, which were more commonly found at depths of 2–9 m, although their presence declined with increasing depth across this range. Spring is characterized by a notable increase in temperature. Water temperature is influenced by both atmospheric warmth from land and variations in water depth. Thus, the temperature of coastal waters is higher than that of offshore waters (Zhao et al., 1995; Zhao et al., 2011), which may result in the congregation of reproductive groups near the shore for egg-laying. Meanwhile, there are many rivers in the Yellow River estuary and adjacent waters, and these bring abundant nutrients into the sea, resulting in the formation of a low saltwater system that provides favorable conditions for spawning and reproduction. Isobaths are evenly distributed throughout the study area, with water depth gradually increasing from nearshore to offshore. This explains why the presence of ichthyoplankton decreased as the water depth increased.
GAM results indicated that distance to shore influenced the abundance of ichthyoplankton to a certain extent, and their number decreased as the Distance increased within the suitable range. In agreement with our results, Song et al. (2019) demonstrated that ichthyoplankton were abundantly present in the waters near the estuary, but less so in the central waters of Laizhou Bay. This may be because the waters near the shore exhibit suitable water temperature and salinity, and are rich in nutrients, as previously noted.
Data availability statement
The raw data supporting the conclusions of this article will be made available by the authors, without undue reservation.
Ethics statement
The manuscript presents research on animals that do not require ethical approval for their study.
Author contributions
MN: Formal Analysis, Methodology, Writing – original draft, Writing – review & editing, Validation. FL: Writing – review & editing. TZ: Writing – review & editing. JW: Writing – review & editing. YL: Writing – review & editing. ZC: Writing – review & editing. JS: Writing – review & editing.
Funding
The author(s) declare financial support was received for the research, authorship, and/or publication of this article. This study was supported by the Project of Yellow River Fisheries Resources and Environment Investigation from the MARA, P. R. China (HHDC) and the National Key R&D Program of China (2019YFD0901201).
Acknowledgments
We are grateful to the members of R/V Lukenyu63109 for their help during the investigations. We also thank the editor and two reviewers for their valuable comments on the manuscript.
Conflict of interest
The authors declare that the research was conducted in the absence of any commercial or financial relationships that could be construed as a potential conflict of interest.
Generative AI statement
The author(s) declare that no Generative AI was used in the creation of this manuscript.
Publisher’s note
All claims expressed in this article are solely those of the authors and do not necessarily represent those of their affiliated organizations, or those of the publisher, the editors and the reviewers. Any product that may be evaluated in this article, or claim that may be made by its manufacturer, is not guaranteed or endorsed by the publisher.
References
Able K. W., Wuenschel M. J., Grothues T. M., Vasslides J. M., Rowe P. M. (2013). Do surf zones in New Jersey provide “nursery” habitat for southern fishes? Environ. Biol. Fishes 96, 661–675. doi: 10.1007/s10641-012-0056-8
Attrill M. J., Power M. (2002). Climatic influence on a marine fish assemblage. Nature 417, 275–278. doi: 10.1038/417275a
Beck M. W., Heck K. L., Able K. W., Childers D. L., Eggleston D. B., Gillanders B. M., et al. (2001). The identification, conservation, and management of estuarine and marine nurseries for fish and invertebrates. Bioscience. 51, 633–641. doi: 10.1641/0006-3568(2001)051[0633:TICAMO]2.0.CO;2
Bian X., Zhang X., Gao T., Wan R., Zhang D. (2010). Category composition and distributional patterns of ichthyoplankton in the Yellow River estuary during spring and summer 2007. J. Fish. Sci. China 17, 815–827. doi: 10.3724/SP.J.1011.2010.01351
Bruno D. O., Delpiani S. M., Cousseau M. B., Astarloa J. M. D., Blasina G. E., Mabragana E., et al. (2014). Ocean-estuarine connection for ichthyoplankton through the inlet channel of a temperate choked coastal lagoon (Argentina). Mar. Freshw. Res. 65, 1116–1130. doi: 10.1071/Mf13128
Caley M., Carr M., Hixon M., Hughes T., Jones G., Menge B. A. (1996). Recruitment and the local dynamics of open marine populations. Annu. Rev. Ecol. Syst. 27, 477–500. doi: 10.1146/annurev.ecolsys.27.1.477
Cheminée A., Rider M., Lenfant P., Zawadzki A., Mercière A., Crec’hriou R., et al. (2017). Shallow rocky nursery habitat for fish: spatial variability of juvenile fishes among this poorly protected essential habitat. Mar. pollut. Bull. 119, 245–254. doi: 10.1016/j.marpolbul.2017.03.051
Chen Z., Ren Q., Liu C., Xian W. (2022). Seasonal and spatial variations in fish assemblage in the Yangtze estuary and adjacent waters and their relationship with environmental Factors. J. Mar. Sci. Eng. 10, 1679. doi: 10.3390/jmse10111679
Chen Z., Wu S., Xia D., Xie Q., Chen F., Hu H., et al. (1998). Bays of China, the 14th volumes. Beijing: China Ocean Press 799.
Chermahini M. A., Shabani A., Naddafi R., Ghorbani R., Rabbaniha M., Noorinejad M. (2021). Diversity, distribution, and abundance patterns of ichthyoplankton assemblages in some inlets of the northern Persian Gulf. J. Sea Res. 167, 101981. doi: 10.1016/j.seares.2020.101981
Ciannelli L., Chan K. S., Bailey K. M., Stenseth N. C. (2004). Nonadditive effects of the environment on the survival of a large marine fish population. Ecology 85, 3418–3427. doi: 10.1890/03-0755
DingsØr G. E., Ciannelli L., Chan K. S., Ottersen G., Stenseth N. C. (2007). Density dependence and density independence during the early life stages of four marine fish stocks. Ecology 88, 625–634. doi: 10.1890/05-1782
Do A. N. T., Tran H. D. (2023). Potential application of artificial neural net works for analyzing the occurrences of fish larvae and juveniles in an estuary in northern Vietnam. Aquat. Ecol. 57, 813–831. doi: 10.1007/s10452-022-09959-5
Dolbeth M., Martinho F., Viegas I., Cabral H., Pardal M. A. (2008). Estuarine production of resident and nursery fish species: Conditioning by drought events? Estuar. Coast. Shelf. Sci. 78, 51–60. doi: 10.1016/j.ecss.2007.11.021
Doring J., Neumann S. I., Sloterdijk H., Ekau W. (2018). Seasonal growth differences of larval Hyporhamphus picarti (Hemiramphidae) in the Sine Saloum estuary, Senegal. J. Appl. Ichthyol 34, 97–102. doi: 10.1111/jai.13528
Dou S., Chen D. (1993). Fisheries biology of Neosalanx anderssoni and Salanx cuvier of Yellow River delta. B. Mar. Sci. 12, 63–68.
Ellis T., Nash R. D. M. (1997). Predation by sprat and herring on pelagic fish eggs in a plaice spawning area in the Irish Sea. J. Fish. Biol. 50, 1195–1202. doi: 10.1111/j.1095-8649.1997.tb01647.x
Fan H., Huang H. (2005). Changes in Huanghe (Yellow) River estuary since artificially rerouting in 1996. Chin. J. Oceanol. Limnol. 23, 299–305. doi: 10.1007/bf02847152
Feng Y., Yao L., Zhao H., Yu J., Lin Z. (2021). Environmental effects on the spatiotemporal variability of fish larvae in the western Guangdong waters, China. J. Mar. Sci. Eng. 9, 316. doi: 10.3390/jmse9030316
Franca S., Vasconcelos R. P., Fonseca V. F., Tanner S. E., Santos P. R., Costa M. J., et al. (2012). Predicting fish community properties within estuaries: influence of habitat type and other environmental features. Estuar. Coast. Shelf. Sci. 107, 22–31. doi: 10.1016/j.ecss.2012.04.013
Freitas V., Kooijman S. A. L. M., van der Veer H. W. (2012). Latitudinal trends in habitat quality of shallow-water flatfish nurseries. Mar. Ecol. Prog. Ser. 471, 203–214. doi: 10.3354/meps10025
Furey N. B., Rooker J. R. (2013). Spatial and temporal shifts in suitable habitat of juvenile southern flounder (Paralichthys lethostigma). J. Sea. Res. 76, 161–169. doi: 10.1016/j.seares.2012.08.007
García-Fernández C., Suca J., Llopiz J. K., Rey F. S. (2021). Spatial and temporal variability in the occurrence and abundance of European hake larvae, merluccius merluccius, on the galician shelf (NE atlantic). Front. Mar. Sci. 8. doi: 10.3389/fmars.2021.696246
Giffard-Mena I., Hernández-Montiel l. H., Pérez-Robles J., David-True C. (2020). Effects of salinity on survival and plasma osmolarity of Totoaba macdonaldi eggs, larvae, and juveniles-ScienceDirect. J. Exp. Mar. Biol. Ecol. 526, 1–5. doi: 10.1016/j.jembe.2020.151339
Graham N., Dulvy N. K., Jennings S., Polunin N. (2005). Size-spectra as indicators of the effects of fishing on coral reef fish assemblages. Coral Reefs 24, 118–124. doi: 10.1007/s00338-004-0466-y
Guisan A., Thuiller W., Zimmermann N. E. (2017). Habitat suitability and distribution models: with applications in R Vol. 37 (Cambridge, UK: Cambridge University Press).
Ha L. M., Nguyen H. H., Ta T. T., Nguyen H. X., Tran H. D. (2022). Spatio-temporal occurrence of different early life stages of Periophthalmus modestus in a tropical estuary. Ani. Biol. 72, 183–202. doi: 10.1163/15707563-bja10074
Harris S. A., Cyrus D. P. (1995). Occurrence of fish larvae in the St Lucia estuary, Kwazulu-Natal, South Africa. S. Afr. J. Mar. Sci. 16, 333–350. doi: 10.2989/025776195784156601
Harris S. A., Cyrus D. P., Beckley L. E. (2001). Horizontal trends in larval fish diversity and abundance along an ocean-estuarine gradient on the northern KwaZulu-Natal coast, South Africa. Estuar. Coast. Shelf Sci. 53, 221–235. doi: 10.1006/ecss.2001.0803
Hettler W. F., Hare A. J. A. (1998). Abundance and size of larval fishes outside the entrance to Beaufort Inlet, North Carolina. Estuaries 21, 476–499. doi: 10.2307/1352846
Hoeinghaus D. J., Winemiller K. O., Birnbaum J. S. (2007). Local and regional determinants of stream fish assemblage structure: inferences based on taxonomic vs. Funct. groups. J. Biogeogr 34, 324–338. doi: 10.1111/j.1365-2699.2006.01587.x
Jiang M., Shen X., Li L., Quan W. (2013). Annual variability of ichthyoplankton in the Yangtze estuary of China from August 2002 to 2009. Oceanol. Hydrobiol. Stud. 42, 59–69. doi: 10.2478/s13545-013-0060-4
Jin X., Deng J. Y. (1999). Yearly variations of fishery resources and biodiversity in the Laizhou Bay. Mar. Fish. Res. 20, 6–12.
Jin X., Deng J. (2000). Variations in community structure of fishery resources and biodiversity in the Laizhou Bay. Chin. Biodivers 8, 65–72.
Kimura S., Kato Y., Kitagawa T., Yamaoka N. (2010). Impacts of environmental variability and global warming scenario on Pacific bluefin tuna (Thunnus orientalis) spawning grounds and recruitment habitat. Prog. Oceanogr 86, 39–44. doi: 10.1016/j.pocean.2010.04.018
Kindong R., Wu J., Gao C., Dai L., Chen J. (2020). Seasonal changes in fish diversity, density, biomass, and assemblage alongside environmental variables in the Yangtze River estuary. Environ. Sci. pollut. Res. 27, 25461–25474. doi: 10.1007/s11356-020-08674-8
Korsman B. M., Kimball M. E., Hernandez F. J. (2017). Spatial and temporal variability in ichthyoplankton communities ingressing through two adjacent inlets along the southeastern US Atlantic coast. Hydrobiologia 795, 219–237. doi: 10.1007/s10750-017-3131-5
Lima C. S. D. S., Badú M. L. D. A. S., Pessanha A. L. M. (2020). Response of estuarine fish assemblages to an atypical climatic event in northeastern Brazil. Reg. Stud. Mar. Sci. 35, 101–121. doi: 10.1016/j.rsma.2020.101121
Lima A. R. A., Ferreira G. V. B., Barletta M. (2019). Estuarine ecocline function and essential habitats for fish larvae in tropical South Western Atlantic estuaries. Mar. Environ. Res. 151, 104786. doi: 10.1016/j.marenvres.2019.104786
Martino E. J., Able K. W. (2003). Fish assemblages across the marine to low salinity transition zone of a temperate estuary. Estuar. Coast. Shelf Sci. 56, 969–987. doi: 10.1016/S0272-7714(02)00305-0
McLusky D. S., Elliott M. (2004). The estuarine ecosystem: ecology, threats, and management. 3rd editio (Oxford: Oxford University Press). doi: 10.1093/ISBN
Mohamed K. S., Sajikumar K. K., Ragesh N., Ambrose T. V., Jayasankar J., Koya K. P. S., et al. (2018). Relating abundance of purpleback flying squid Sthenoteuthis oualaniensis (Cephalopoda: Ommastrephidae) to environmental parameters using GIS and GAM in south-eastern Arabian Sea. J. Nat. Hist. 52, 1869–1882. doi: 10.1080/00222933.2018.1497721
Monteiro M., Azeiteiro U. M., Martinho F., Pardal M. A., Primo A. L. (2021). Long-term changes of ichthyoplankton communities in an Iberian estuary are driven by varying hydrodynamic conditions. J. Plankton Res. 43, 33–45. doi: 10.1093/plankt/fbaa057
Naimi B., Araújo M. B. (2016). SDM: a reproducible and extensible R platform for species distribution modelling. Ecography 39, 368–375. doi: 10.1111/ecog.01881
Niu M., Li Y., Wang J., Liu Z., Zuo T., Cheng Z. (2023). Habitat suitability of mullet Liza haematocheila ichthyoplankton in coastal waters of the Yellow River Estuary using HSI method. Mar. Environ. Sci. 42, 766–773. doi: 10.13634/j.cnki.mes.2023.05.016
Niu M., Zuo T., Wang J., Chen R., Zhang J. (2022). Egg and larval distribution of Liza haematocheila and their relationship with environmental factors in the coastal waters of the Yellow River Estuary. J. Fish. Sci. China 29, 377–387. doi: 10.12264/JFSC2021-0532
Okiyama M. (1988). an atlas of the early stage fishes in Japan (Tokyo: Tokai University Press), 272–276.
Perry A. L., Low P. J., Ellis J. R., Reynolds J. D. (2005). Climate change and distribution shifts in marine fishes. Science. 308, 1912–1915. doi: 10.1126/science.1111322
Qin X., Zhang C., Xiao H., Ren J., Xu B. (2017). Composition and distribution of fish eggs and larvae in the Yellow River Estuary. Period. Ocean Univ. China 47, 46–55. doi: 10.16441/j.cnki.hdxb.20160023
Ren P., Schmidt B. V., Fang D., Xu D. (2021). Spatial distribution patterns of fish egg and larval assemblages in the lower reach of the Yangtze River: Potential implications for conservation and management. Aquat. Conserv. 31, 1929–1944. doi: 10.1002/aqc.3595
Sabates A., Martin P., Loret J., Raya V. (2006). Sea warming and fish distribution: the case of the small pelagic fish, Sardinella aurita, in the western Mediterranean. Glob. Change Biol. 12, 2209–2219. doi: 10.1111/j.1365-2486.2006.01246.x
Shan X., Xian W., Wu Y. (2004). Progress of studies on ichthyoplankton ecology of Changjiang River estuary. J. Oceanol. Limnol 4, 87–93. doi: 10.13984/j.cnki.cn37-1141.2004.04.015
Sherman K., Lasker R., Richards W., Kendall A. W. Jr (1983). Ichthyoplankton and fish recruitment studies in large marine ecosystem [Includes pollution stress, spawning estimates, Fishery Management Zone, USA. Mari. Fish. Rev. 45, 1–25.
Song Y., Zhang L., Luo X. (2019). Spatiotemporal distribution of fish eggs and larvae in the Huanghe (Yellow) River estuary, China in 2005–2016. J. Oceanol. Limnol 37, 1625–1637. doi: 10.1007/s00343-019-8167-0
Spies B. T., Steele M. A. (2016). Effects of temperature and latitude on larval traits of two estuarine fishes in differing estuary types. Mar. Ecol. Prog. Ser. 544, 243–255. doi: 10.3354/meps11552
Venables W. N., Dichmont C. M. (2004). GLMs, GAMs and GLMMs: an overview of theory for applications in fisheries research. Fish. Res. 70, 319–337. doi: 10.1016/j.fishres.2004.08.011
Vidy G. (2000). Estuarine and mangrove systems and the nursery concept: Which is which? The case of the Sine Saloum system (Senegal). Wetl. Ecol. Manage. 8, 37–51. doi: 10.1023/A:1008402905530
Wan R., Zhang R. (2016). Fish eggs, larvae and juveniles in the offshore waters of China and their adjacent waters (Shanghai: Shanghai Scientific & Technical Publishers).
Wang J., Xu B., Ren Y., Jiao Y. (2016). Size spectrum of fish community and its seasonal change in the Yellow River estuary and its adjacent waters. Period. Ocean Univ. China. 46, 44–53. doi: 10.16441/j.cnki.hdxb.20150062
Wang D., Yao L., Yu J., Chen P., Hu R. (2021). Response to environmental factors of spawning ground in the Pearl River estuary, China. J. Mar. Sci. Eng. 9, 763. doi: 10.3390/jmse90707
Wang D., Yu J., Lin Z., Chen P. (2023). Spatial-temporal distribution of fish larvae in the Pearl River estuary based on habitat suitability index model. Biology 12, 603. doi: 10.3390/biology12040603
Wang J., Zhang C., Xue Y., Ren Y., Wang X., Xu B. (2019). Composition of ecological groups and their seasonal changes of fish in Yellow River estuary and its adjacent waters. Period. Ocean Univ. China 49, 41–51. doi: 10.16441/j.cnki.hdxb.20180085
Whitfield A. K. (1999). Ichthyofaunal assemblages in estuaries: a South African case study. Rev. Fish Biol. Fish. 91, 151–186. doi: 10.1023/A:1008994405375
Whitfield A. K., Elliott M. (2002). Fishes as indicators of environmental and ecological changes within estuaries: a review of progress and some suggestions for the future. J. Fish. Biol. 61, 229–250. doi: 10.1006/jfbi.2002.2079
Wooldridge T. (1999). "Estuarine zooplankton community structure and dynamics," in Estuaries of South Africa, eds. Allanson B. R., Baird D.. (Cambridge: Cambridge University Press), 141–146. doi: 10.1017/CBO9780511525490.007
Wu A., Zhong Z., Yu S., Sui X., Yao X., Zou L. (2024). The current status and 20 years of evolution of nutrient structure in the Yellow River estuary. Prog. Fish. Sci. 45, 1–13. doi: 10.19663/j.issn2095-9869.2023103100
Yang Y., Gao Y., Wang J., Xu B., Sun C. (2018). Community structure of ichthyoplankton and its relationship with environmental factors in Laizhou Bay. Chin. J. Ecol. 37, 2976–2984. doi: 10.13292/j.1000-4890.201810.012
Yang Y., Li F., Zhu M., Su B., Chen W., Liu X., et al. (2023). Community structure characteristics of ichthyoplankton during the water-sediment regulation scheme in the Yellow River in 2020 and 2021. Mar. pollut. Bull. 191, 114972. doi: 10.1016/j.marpolbul.2023.114972
Yang J., Wang C. (1993). Primary fish survey in the Huanghe River estuary. Chin. J. Oceanol. Limnol 11, 368–374. doi: 10.1007/bf02850642
Yang Y., Wang Q., Chen J., Pang S. (2006). Research advance in estuarine zooplankton ecology. Acta Ecol. Sin. 26, 576–585. doi: 10.3321/j.issn:1000-0933.2006.02.034
Yang Y., Zhu M., Feng Y., Li H., Chen W., Wang X., et al. (2022). Annual changes in the community structure and diversity of fish eggs and larvae in the Huanghe River Estuary and its adjacent waters. Haiyang Xuebao. 44, 36–46. doi: 10.12284/hyxb2022074
Yang Y., Zhu M., Song Q., Wang X., Li F., Zhang X., et al. (2024). The Water-sediment regulaiton scheme on the community structure of ichthyoplankton in the Yellow River estuary. Acta Hydrobiol. Sinica. 48, 488–503. doi: 10.7541/2024.2023.0241
Yen K. W., Pan C. I., Chen C. H., Lien W. H. (2022). Spatiotemporal characteristics of fish larvae and juveniles in the waters around Taiwan from 2007 to 2019. Animals 12, 1890. doi: 10.3390/ani12151890
Yin J., Wang J., Zhang C., Xu B., Xue Y., Ren Y. (2019). Spatial and temporal distribution characteristics of Larimichthys polyactis eggs in Haizhou Bay and adjacent regions based on two stage GAM. J. Fish. Sci. China 26, 1164–1174. doi: 10.3724/SP.J.1118.2019.19032
Zhang R., Lu S., Zhao C., Chen L., Zang Z., Jiang Y. (1985). The ichthyoplankton in coastal waters of China (Shanghai: Shanghai Scientific & Technical Publishers).
Zhang H., Wang Y., Liang C., Liu S., Xian W. (2022). Estuarine ichthyoplankton studies – a review. Front. Mar. Sci. 9. doi: 10.3389/fmars.2022.794433
Zhang H., Xian W., Liu S. (2016). Autumn ichthyoplankton assemblage in the Yangtze estuary shaped by environmental factors. PeerJ 4, e1922. doi: 10.7717/peerj.1922
Zhao Y., Li J., Qi Y., Guan X., Zhao C., Wang H. (2021). Distribution, sources, and ecological risk assessment of polycyclic aromatic hydrocarbons (PAHs) in the tidal creek water of coastal tidal flats in the Yellow River Delta, China. Mar. pollut. Bull. 173, 113–110. doi: 10.1016/j.marpolbul.2021.113110
Zhao J., Zhang X., Bian X., Wu Z., Gao T., Zhang P. (2011). Species composition and distribution of ichthyoplankton in the coastal waters of Huludao in 2009. Period. Ocean Univ. China 41, 34–42. doi: 10.16441/j.cnki.hdxb.2011.11.007
Keywords: ichthyoplankton, distribution, environmental factors, GAMs, Yellow River estuary
Citation: Niu M, Lu F, Zuo T, Wang J, Li Y, Cheng Z and Sun J (2025) Spatiotemporal distribution of ichthyoplankton and their relationship with environmental factors in the waters around the Yellow River estuary, China. Front. Mar. Sci. 12:1523007. doi: 10.3389/fmars.2025.1523007
Received: 05 November 2024; Accepted: 29 January 2025;
Published: 19 February 2025.
Edited by:
Jing Yu, Chinese Academy of Fishery Sciences (CAFS), ChinaReviewed by:
Gang Hou, Guangdong Ocean University, ChinaWang Lin, Chinese Academy of Fishery Sciences (CAFS), China
Copyright © 2025 Niu, Lu, Zuo, Wang, Li, Cheng and Sun. This is an open-access article distributed under the terms of the Creative Commons Attribution License (CC BY). The use, distribution or reproduction in other forums is permitted, provided the original author(s) and the copyright owner(s) are credited and that the original publication in this journal is cited, in accordance with accepted academic practice. No use, distribution or reproduction is permitted which does not comply with these terms.
*Correspondence: Tao Zuo, enVvdGFvQHlzZnJpLmFjLmNu