 Iria Seijas-Díaz
 Pablo Presa*
- Laboratory of Marine Genetic Resources (ReXenMar), Centro de Investigación Mariña (CIM)-Universidade de Vigo, Vigo, Spain
Fishery management decisions based solely on demographic models risk unintended and detrimental socio-economic consequences. Integrating biologically relevant metrics into stock assessments is crucial for sustainability amidst anthropogenic and environmental stressors (e.g., invasions, overfishing, pollution, global ocean change). In this work the authors aim to develop Genetic Reference Points (GRPs) for monitoring and evaluating the genetic status of fisheries which are patently absent from the official assessment. Complementary to demographic metrics, incorporating genetic analogs such as the Basal Genetic Reference Point (BGRP), the Target Genetic Reference Point (TGRP), the Limit Genetic Reference Point (LGRP), the trigger Genetic Reference Point (tGRP), and Genetic Structural Reference Point (GSRP) is now a viable approach. Using long-term genetic data series of the European hake, Merluccius merluccius, we show that current GRPs can significantly contribute to quantify a critical biological dimension across spatial (metapopulation structure) and temporal (evolution of genetic background under exploitation) scales. Therefore, we propose the systematic monitoring of spatiotemporal genetic diversity in other fisheries using established metrics such as the effective size (Ne) and novel metrics, e.g., Z_LDNe, D_LDNe and a Genetic Resilience Index (GRI) which relates the amount of change in Ne between fishery moments. We advocate for an interdisciplinary effort to integrate GRPs into algorithms and analytical models to enhance their predictive capacity in assessing the comprehensive biological status of exploited fisheries. Establishing robust GRPs at defined historical baselines, following a systematic roadmap, would provide future generations with scientifically sound criteria to assess genetic over fishing and to implement rebuilding strategies where appropriate.
1 Introduction
Fisheries assessment is essential for management of industrialized fisheries, as it promotes the economic and social sustainability by providing scientific support for the adoption of corrective management measures and the improvement of fisheries legislation. Fisheries data to estimate species abundance and spatial distribution come from two sources: indirect data from the fishing industry and on-board observer programs (e.g., discards, landings, location, and fishing effort), and direct scientific surveys conducted by research vessels using standardized methods (trawl, acoustic, or tagging surveys) (e.g., Pinello et al., 2017). Fisheries data feeding the assessment allows for the calculation of fish demographic structure in terms of age and size, reproductive rates, mortality rates, and other biological parameters. Those metrics are limited by uncertainties in natural mortality, recruitment estimates, catch statistics, and the impact of illegal, unreported, and unregulated (IUU) fishing (e.g., Cisneros-Montemayor et al., 2013).
Beyond that, the statistical modeling of population size allows for biomass projections under different fishing scenarios. Demographic metrics are employed for assessing fishing pressure, fishery status, and potential yield and fishery reference points (FRPs) based on them are crucial pillars for defining sustainable fisheries management objectives (ICES, 2021). These FRPs, derived from stock assessment models analyzing biological, fishing, and environmental data, serve as benchmarks to evaluate a fishery’s condition relative to desired states, guiding precautionary management (e.g., Caddy and Mahon, 1995). For instance, Target Reference Points (TRPs) represent optimal states for long-term sustainability and high yields (e.g., BMSY, FMSY), aiming for management to maintain fisheries around these levels. Conversely, Limit Reference Points (LRPs) indicate critical thresholds that should be avoided to prevent stock impairment (e.g., Blim, Flim), triggering pre-defined management responses if breached. Triggering Reference Points (tRPs) act as early warning signals, prompting management action to prevent reaching undesirable fishing thresholds.
While fishery reference points (FRPs) are crucial biological referents for informed fisheries management, their primary reliance on demographic data oversimplify the complex ecological dynamics of fisheries, e.g. trophic relationships, abiotic variability (ocean currents, temperature, pollution, salinity) and spatial heterogeneity which patently influence fish recruitment, growth, mortality, and distribution (e.g., Nande et al., 2024). Altogether, those data constraints can undermine the reliability of stock assessments potentially leading to overestimation and mask localized depletion even when overall population metrics suggest a healthy stock (e.g., Siple and Litz, 2021).
Genetic diversity is crucial for a population’s adaptive capacity, resilience, and recovery from stressors like fishing, yet its absence in current fishery assessment models prevents the evaluation of selective pressures on specific stock segments that can alter life-history traits. Integrating genetic data can enhance our understanding of population dynamics, productivity, and long-term sustainability beyond biomass estimates (e.g., Bertola et al., 2024). Advocates propose incorporating genetic diversity metrics into stock assessments and management to ensure sufficient genetic variation for the sustained productivity of commercial fisheries (e.g., Laikre et al., 2010). That genetic approach aims to build resilience against environmental change, including the genetic erosion caused by overfishing i.e., higher genetic diversity increases the probability of survival and reproduction under changing environmental conditions (temperature, acidification, salinity) and resistance to diseases and parasites (Gibson and Nguyen, 2021); conversely, low genetic diversity increases vulnerability to mass mortality and extinction risk linked to genetic factors (Spielman et al., 2004) Also, maintaining genetic diversity helps prevent inbreeding depression, which can reduce reproductive success and offspring survival, particularly in isolated or overexploited populations (Kardos et al., 2023). Continuous monitoring of genetic diversity can also reveal shifts in spatial population structure and connectivity as a key information for effective management that avoids treating genetically distinct populations as a single unit, thereby preventing the overexploitation of less resilient ones (e.g., Allendorf et al., 2014).
Genetic diversity (GD) can be quantified using various molecular markers that assess genomic variability. These include 10–30 microsatellite markers on 25–30 specimens per population (e.g., Blouin, 2003; Hale et al., 2012), which are effective for population structure analysis, paternity assessment, and bottleneck detection; 100–200 single nucleotide polymorphisms (SNPs) (Weir et al., 2006) on 50–100 specimens (see Nazareno et al., 2017) as valuable markers for fine-scale population structure, and genome-wide association studies (GWAS). While a theoretical number of markers and samples may be proposed, it is important to note that it should be increased by an order of magnitude to achieve precise Ne estimates with finite bounds, a factor of particular importance for most marine fish species exhibiting large NSSB. Mitochondrial DNA (mtDNA) markers as useful for phylogeographic studies, historical demographic inference, and maternal lineage identification; expressed sequence-derived markers (EST), which provide insights into the genetic diversity of functionally relevant genes; and high-throughput sequencing (HTS) methodologies. Namely NGS, encompassing techniques like whole-genome sequencing (WGS), reduced representation sequencing (e.g., RAD-seq), and targeted capture sequencing, enables the simultaneous sequencing of numerous DNA fragments, facilitating cost-effective and high-resolution analysis of extensive genetic markers (e.g., SNPs, microsatellites) across multiple individuals within a fishery. The selection of specific metrics and markers is contingent upon the research objectives (e.g., Pita et al., 2022); often, an integrated approach employing a combination of different markers and metrics yields the most comprehensive evaluation of the genetic status of commercial fisheries (e.g., Cuéllar-Pinzón et al., 2016).
Several metrics are employed for the genetic assessment of fisheries, providing insights into genetic diversity, population structure, and evolutionary dynamics. Allelic richness (Ar) is often standardized for sample size variations across populations (El Mousadik and Petit, 1996); Heterozygosity (H) serves as a robust indicator of potential genome diversity (e.g., Blanco et al., 1998). For instance, selective fishing can lead to a reduction in allelic richness by removing specific genotypes or family lineages, and a decrease in heterozygosity by altering the proportion of heterozygous individuals (Sadler et al., 2023). The inbreeding coefficient (FIT) quantifies the reduction in heterozygosity within a fishery due to non-random mating, i.e. it considers both the inbreeding within subpopulations and the effects of population subdivision (Wright, 1922). The population effective genetic size (Ne, Wright, 1931) is a theoretical parameter which reflects a population’s vulnerability upon its gene diversity, i.e., a low Ne indicating a higher risk of genetic diversity loss via drift. Fishing often disproportionately removes larger, older individuals, potentially accelerating the decline in Ne beyond census size reductions, thereby increasing genetic drift and inbreeding. The genetic structural integrity of fisheries is also a relevant pattern to control, which necessitates multivariate analyses robust to migration, alongside annual hierarchical assessments of spatial density and inter-population connectivity (e.g., Pita et al., 2016a). Fishing-induced alterations in age structure and spatial distribution can modify gene flow, leading to increased genetic differentiation or reduced connectivity. Current metrics for assessing this structure include the number of migrants (Nm) which estimates gene flow and connectivity between populations, and heterozygote-based genetic distances, such as the fixation index (FST, Wright, 1931) which quantifies heterozygosity reduction due to population subdivision and informs about gene flow restrictions based on allele or trait frequencies (e.g., Cavalli-Sforza and Edwards chord distance for microsatellites or p-distance for DNA sequences).
While fishery demography provides a fundamental scientific basis for assessment, it is insufficient to resolve uncertainties such as recruitment failure, fishery collapse, or resilience to overfishing (e.g., Myers et al., 1997). A more holistic, medium-term approach integrating analytical models enriched with biological parameters like genetic metrics is necessary for enhanced fisheries foresight. Also, crucial unresolved questions on commercial fisheries include quantifying the extent of genetic erosion after decades of exploitation, the rate of genetic diversity loss relative to spawning stock biomass (NSSB), and its implications for fishery resilience. In this regard, the objective of this study is to investigate novel genetic metrics for their potential applicability in fisheries genetic assessment, to define basic genetic reference points (GRPs) along with their prospective threshold values in the European hake as case study, and to propose a preliminary roadmap for GRPs implementation.
2 Methodology
A glossary (Table 1) provides clarification of the acronyms used throughout this study to improve clarity and facilitate understanding.
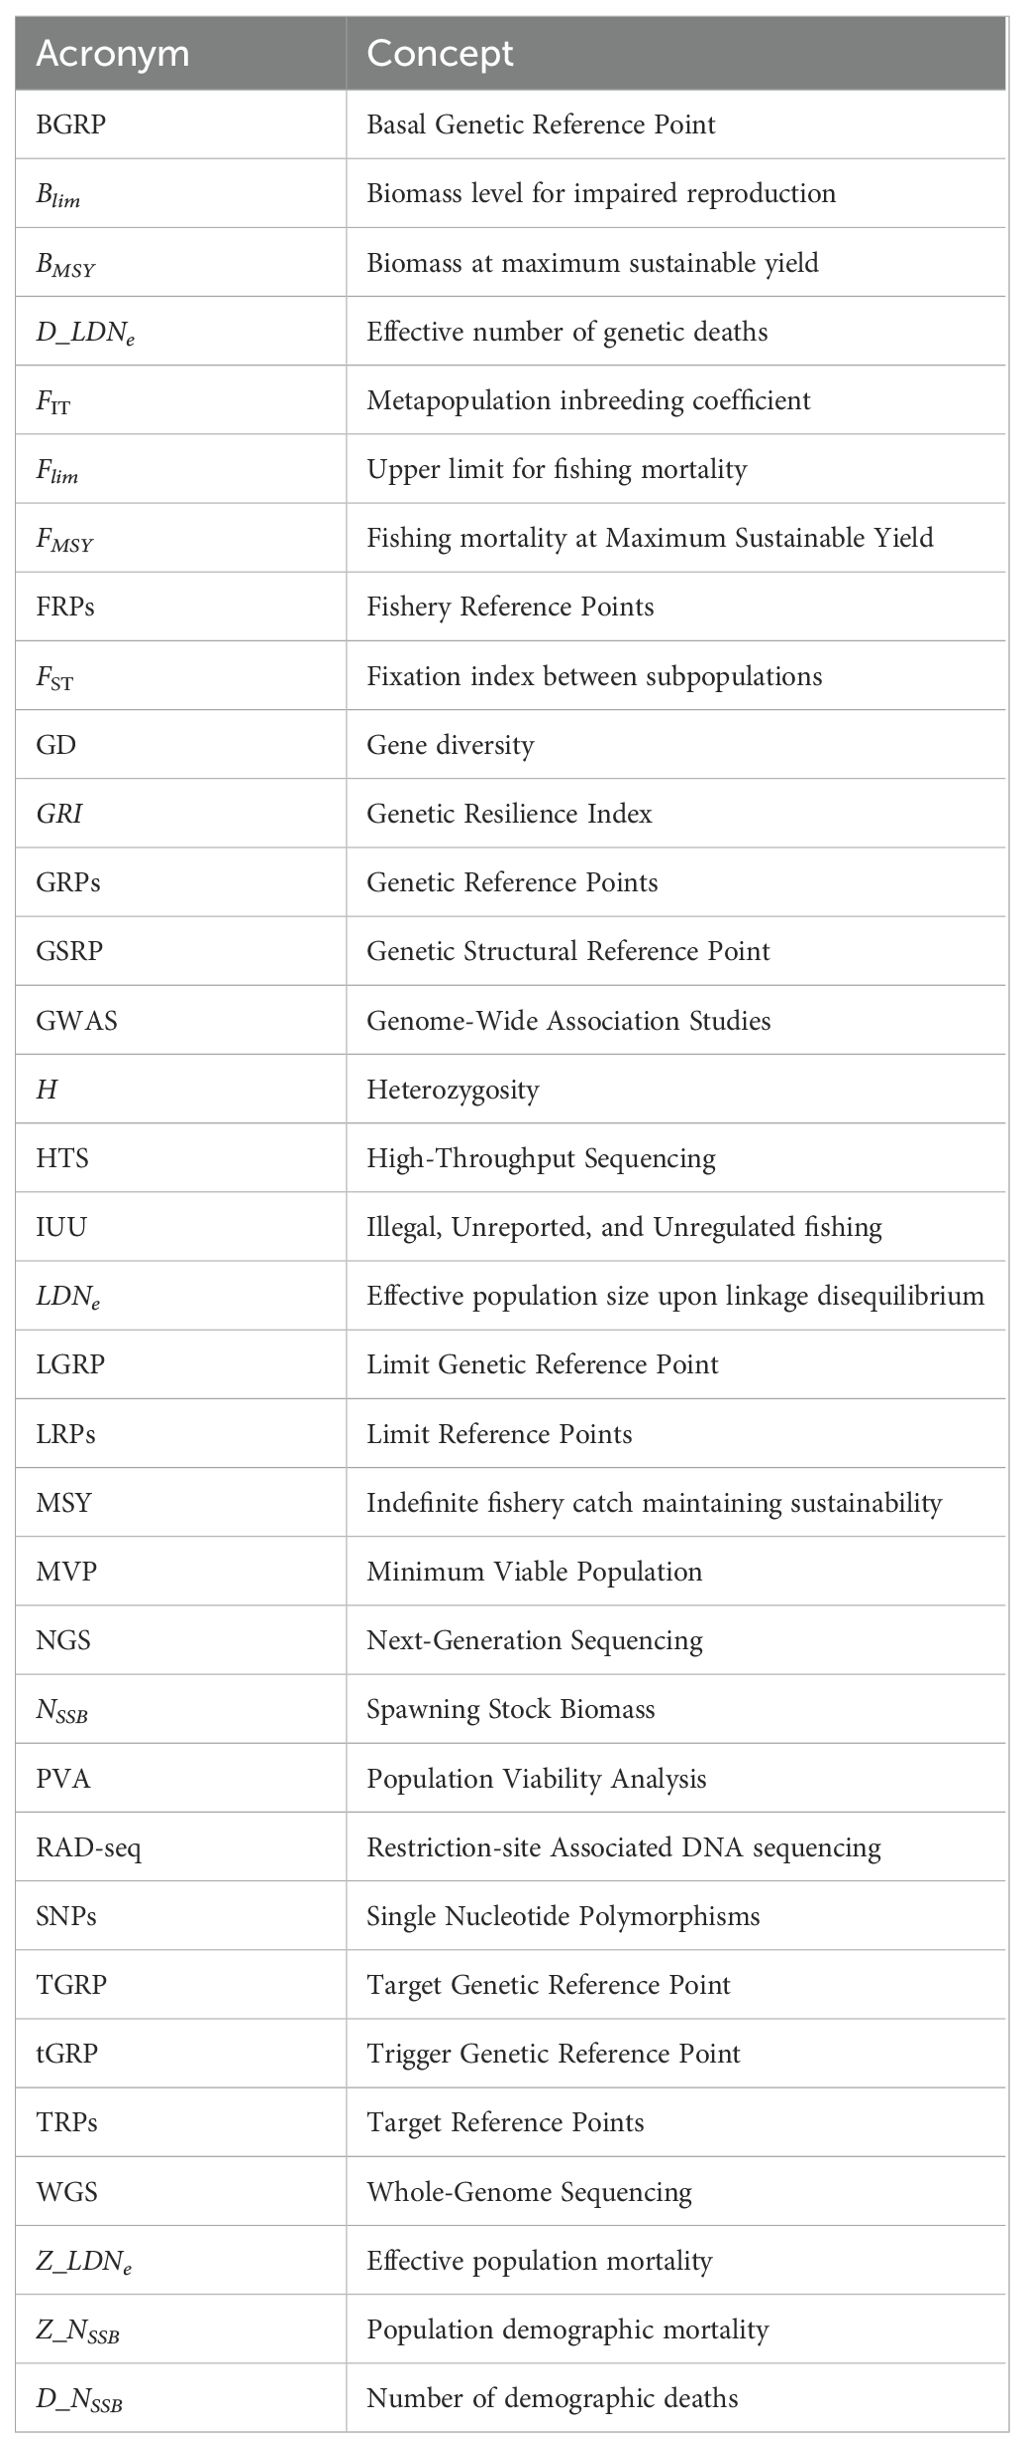
Table 1. Glossary of acronyms employed in this study.
2.1 Candidate metrics for genetic diversity
Recent studies are fueling relevant genetic diversity metrics and protocols (e.g., Hoban et al., 2023; Clarke et al., 2024). Candidate parameters for implementing genetic reference points (GRPs) should be reliable indicators of population genetic diversity for intergeneration comparisons. The population genetic effective size Ne is a parameter representing the theoretical minimum number of spawners (but not a rate of genetic change) of an idealized population whose random mating would yield the observed genetic diversity of the actual fishery. To effectively assess the impact of genetic drift, both fishing-induced and stochastic, the effective population size (Ne) should first be normalized within a species. This normalization characterizes the species maximum genetic resilience and allows for the long-term tracking of changes in its adaptive potential. (e.g., Keller et al., 1994). The strength of comprehensive scores of Ne or Ne/NSSB lies primarily in assessing past population dynamics and current fishery genetic status. However, their standardization to predict fisheries genetic architecture is challenging, and likely requires advanced AI models capable of integrating historical Ne or Ne/NSSB trends, species reproductive dynamics, and ecological/demographic factors (Waples, 2024).
The population effective genetic mortality rate (Ze or Z_LDNe), derived from historical genetic data of European hake (Merluccius merluccius), quantifies the instantaneous reduction in allele frequency dispersion due to genetic drift (Fernández-Míguez et al., 2023). Thus, Ze measures the rate of effective population size (Ne) decline driven by fishing pressure. This transcends demographic mortality by focusing on the genetic consequences of removals, including fishing-induced selection favoring certain genetic variants. Fernández-Míguez et al. (2023) demonstrated a direct computation of Z_LDNe between two infinitesimal LDNe moments provided estimates of Ne are available at an initial (t0) and at a subsequent (t) time point (Equation 1), i.e.
The effective number of genetic deaths is a parameter to estimate the reduction in the effective size LDNe in period t (Equation 2) and can be put as,
the substitution of Equation 1 in Equation 2 allows to afford the effective number of genetic deaths (Equation 3) as follows:
Similarly, the reduction in the reproductive census size NSSB in a period t can be put (Equation 5) as,
A way to express the number of genetic deaths () relative to the initial population effective size , i.e., the proportion of Ne eroded at an effective post harvesting mortality rate Z_LDNet, is through the Genetic Resilience Index (GRI) as deduced after Equation 4, i.e.,
This Genetic Resilience Index (GRI) quantifies the proportional reduction in effective genetic size relative to the initial effective genetic size over a period t, effectively representing the net change in (LDNe) between two moments of the fishery. The expected behavior of the GRI was simulated according to expression 1 by varying Z_LDNe in the range [-20, 50] and initializing LDNe in the range [0.001, 10] x 106. Furthermore, the simulated behavior of GRI was modeled using expression [6], by randomizing Z_LDNe within 21 deciles (1-210)% in the Z_LDNe range [-1, 10] using an excel spreadsheet.
2.2 Candidate genetic reference points
Genetic Reference Points (GRPs) are benchmark values of genetic indicators used to assess a fish stock’s genetic status and to guide management for maintaining or restoring its genetic diversity and adaptive potential. GRPs aim to prevent anthropogenic activities from eroding genetic diversity crucial for long-term population viability, encompassing adaptive responses to stressors, disease resistance, and sustained productivity (e.g., Gibson and Nguyen, 2021). GRPs aim to capture critical aspects of a population’s genetic status relevant to long-term persistence, quantified by genetic metrics (e.g., Ne), metapopulation structure (e.g., FST), and other parameters. Thus, GRP-based assessments can inform management interventions like adjusting fishing pressure, implementing genetically informed stock enhancement, or managing habitat connectivity. Analogous to biological FRPs (e.g., BMSY or Flim), genetic diversity-based Target Genetic Reference Points (TGRPs) specify optimal genetic status to avoid rare allele loss, maintain genome-wide diversity (e.g., Allelic Richness), retain adaptive variation, and limit the global inbreeding (FIT). The theoretical genetic diversity spectrum ranges from zero to the NSSB-dependent maximal evolutionary diversity, representing maximum genetic resilience. Also, maintaining metapopulation structure, i.e., a minimum gene flow (Nm) or acceptable levels of genetic differentiation (FST) can be another crucial TGRP. Limit Genetic Reference Points (LGRPs) establish thresholds not to be exceeded to prevent genetic degradation (e.g., minimum Ne). The following GRPs are based on demographic analogs and the historical genetics of southern European hake, and provide an example of guidelines dependent on each species genetic status and its metapopulation structure.
2.2.1 Basal genetic reference point
BGRP represents the inherent genetic identity of a stock as determined by its initial gene diversity assessment. This foundational genetic composition serves as the reference baseline for subsequent comparisons. BGRP reflects the total genetic diversity (GD) harbored by the reproductive biomass (NSSB) of either a pristine stock (stock category 1, see Table 2) or that of a fishery assessed for the first time (stock category 2). Consequently, BGRP is a function of weight-at-age, maturity-at-age, and natural mortality, and should be an intrinsic property of any age-structured model.
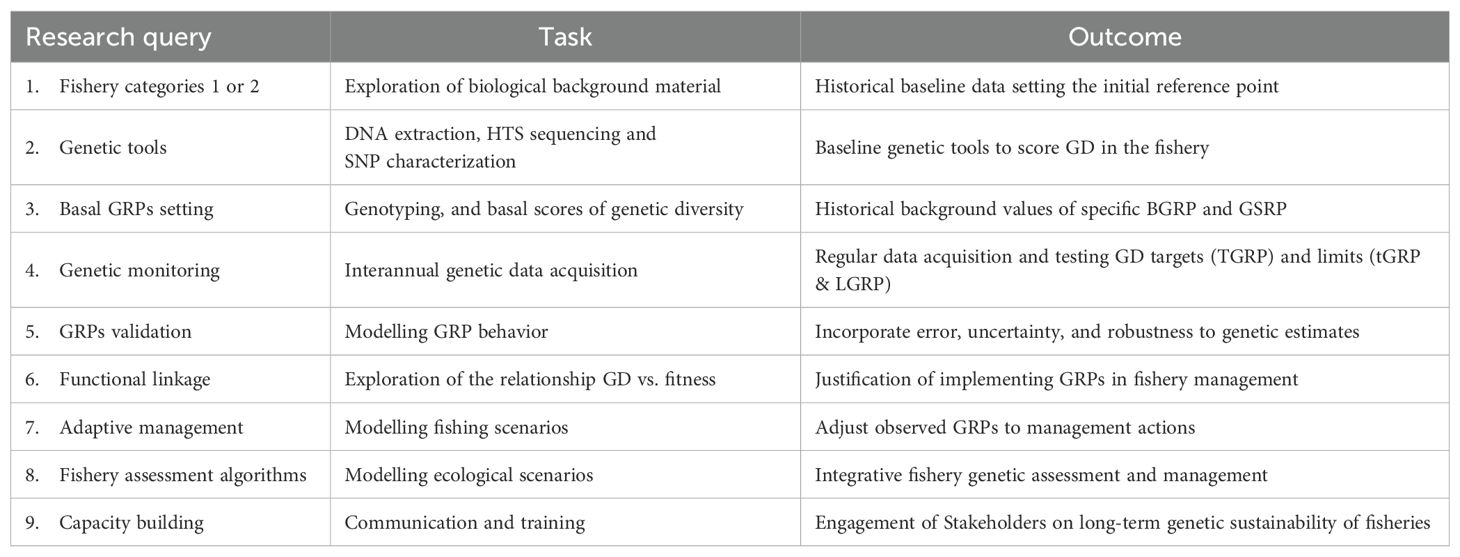
Table 2. Putative general roadmap to establish species-specific GRPs on relevant fisheries of conservation concern.
2.2.2 Target genetic reference point
TGRP defines the specific genetic diversity status that fishery managers aim to achieve for long-term sustainability and resilience. It serves as a predefined genetic endpoint or desired genetic state to be maintained by a fishery stock. Analogous to Btarget, TGRP represents the ideal or optimal GD status around which GD fluctuates under fishing pressure. Establishing the TGRP for a stock necessitates the reconstruction of the BGRP and its historical range of variation. The historical fluctuation of GD around the TGRP defines the comfort zone where genetic resilience for future generations is considered assured, e.g., TGRP≥0.60·BGRP.
2.2.3 Limit genetic reference point
LGRP is a critical GD value indicating a need for concern and potential intervention to safeguard the long-term genetic viability of a fishery stock. Analogous to the current Blim, LGRP establishes boundaries to constrain fishing within safe genetic limits relative to the historical BGRP. LGRP represents the GD threshold below which fishing a stock renders it less resilient to exploitation or other environmental challenges. GD scores below LGRP serves as a warning of a critical genetic status for that stock concerning its genetic degradation and loss of adaptive potential, e.g., LGRP=0.30·BGRP.
2.2.4 Trigger genetic reference point
tGRP is a predetermined GD threshold that, when reached or breached, prompts a predefined management action to prevent GD from reaching the LGRP. It serves as an early warning indicating that the genetic diversity of a fishery stock is approaching a potentially undesirable low score. Analogous to Btrigger, tGRP is a limit within the expected distribution of GD between LGRP and TGRP, where caution would advise a management response to ensure that the fishery remains close to the target, e.g., LGRP=0.30·BGRP<tGRP=0.40·BGRP<TGRP≥0.60·BGRP. When GD consistently declines below tGRP, protective spatio-temporal measures to reduce fish mortality would be required. When uncertainty increases, LGRP should approach TGRP to establish more conservative criteria given the crucial yet erodible nature of GD.
2.2.5 Genetic structural reference point
GSRP represents the specific genetic architecture of fishery stocks observed in a pristine metapopulation. It describes the spatial pattern of genetic differentiation and connectivity among subpopulations. Once estimated, as early as possible, a year-based temporal assessment of the genetic structure in terms of the amount and distribution of GD should enable the detection of GSRP rarefaction. Such GSRP deconstruction serves as a warning of significant environmental and/or anthropogenic disturbance to the metapopulation normal patterns. GD is intrinsically linked to GSRP, i.e. a GD falling below a given LGRP coupled with a rare genetic distance between stocks (e.g., FST) constitutes evidence of a significant alteration of the entire GSRP of the metapopulation (e.g., Palstra and Ruzzante, 2011).
2.3 Case study: the southern European hake stock
The southern European hake (Merluccius merluccius) stock, a fishery distributed across the Cantabrian Sea and the Atlantic Iberian Peninsula (ICES Management Divisions VIIIc and IXa, respectively), exhibits a lack of significant genetic structuring based on multiple genetic and geochemical markers (e.g., Tanner et al., 2014). A key challenge in the genetic management of this fishery lies in accurately assessing genetic diversity following periods of overfishing to ensure its long-term sustainability. Prior genetic investigations of this stock utilizing microsatellites revealed a post-fishing reduction in both the effective population size (Ne) (a 43-fold decrease) and its spawning stock biomass (NSSB, an 80% loss) (Pita et al., 2017). These findings suggested that the genetic consequences of fishing were more profound than a simple decline in population abundance, e.g., that genetic assessment indicated that this stock experienced a genetic bottleneck with an Ne≈300 in the early 2000s, followed by a recovery to Ne≈3200 in 2007. While acknowledging the potential role of environmental facilitation in this population rebound (Díez et al., 2012), the EU regulatory measures implemented on this fishery appeared to have been effective later on (European Commission Council Reg, 2005). However, the recovery of Ne from its historical minimum likely involved a synergistic effect of both demographic and genetic enrichment from the neighboring northern hake stock, as well as the maintenance of its genetic status above a minimum evolutionary Ne threshold, thereby safeguarding the stock’s resilience to overfishing (Pita et al., 2017).
Subsequent research on this stock highlighted a temporal dissociation between demographic and genetic metrics (Fernández-Míguez et al., 2023). Specifically, the peak of population demographic mortality (Z_NSSB) (1986–1990) preceded both the peak of effective genetic mortality (Z_LDNe) (1991–1995) and the peak of the official cohort-based mortality (Z_ICES) (1996–2000). This temporal decoupling between demographic and genetic indicators (see Waples, 2005), implies that a) genetic impacts exhibit delayed responses or recovery trajectories compared to changes in population size, and b) official cohort analyses were insufficiently aligned with assessing the true biological status of the southern European hake fishery to adequately inform about sustainability-oriented recommendations. In this study, we apply the candidate metric termed the effective genetic death number between two time points of the fishery, relative to the effective genetic size at an initial time point (), to calculate the proportion of Ne eroded at a post-harvest effective genetic mortality rate (Z_LDNe). This ratio, / (termed the GRI index or Genetic Resilience Index), expresses the net variation of LDNe between two time points in the fishery and can provide enhanced insights into genetic fluctuations compared to the absolute value of Ne which still lacks a species-specific quantitative or qualitative reference scale.
3 Results and discussion
3.1 Behavior of GRI as metric candidate
The rationale for the Genetic Resilience Index (GRI) is to provide a composite metric that summarizes a fish population capacity to maintain, lose, or recover genetic diversity in a timeframe between two points under environmental stressors (including fishing). It extends beyond the absolute value of Ne to offer a more nuanced and robust assessment of the population rate of genetic change for management applications. Randomization of the effective mortality rate Z_LDNe in the range [-3, 20] showed that GRI decreases exponentially with increasing effective mortality, approaching its minimum value (-1) when Z_LDNe > 1 (Figure 1).

Figure 1. Behavior of the GRI index for population effective genetic mortality Z_LDNe randomizations between -3 and 20 as extreme values.
The GRI index ranges from negative (up to -1) when genetic mortality occurs, to zero when there is no genetic mortality, and turns positive (theoretically unbounded) when there is a recovery of LDNe relative to the previous time point. Simulations of the GRI index under varying Z_LDNe indicate that GRI spans the range [-0.63, 1.72] when LDNe fluctuates smoothly around its initial value (), specifically under moderate Z_LDNe values [-1, 1], which corresponds to LDNe being approximately 3-fold less or 3-fold higher than . However, GRI rapidly approaches its minimum (-1) or becomes exceptionally large when Z_LDNe >1 or Z_LDNe <−1, respectively (Figure 2).
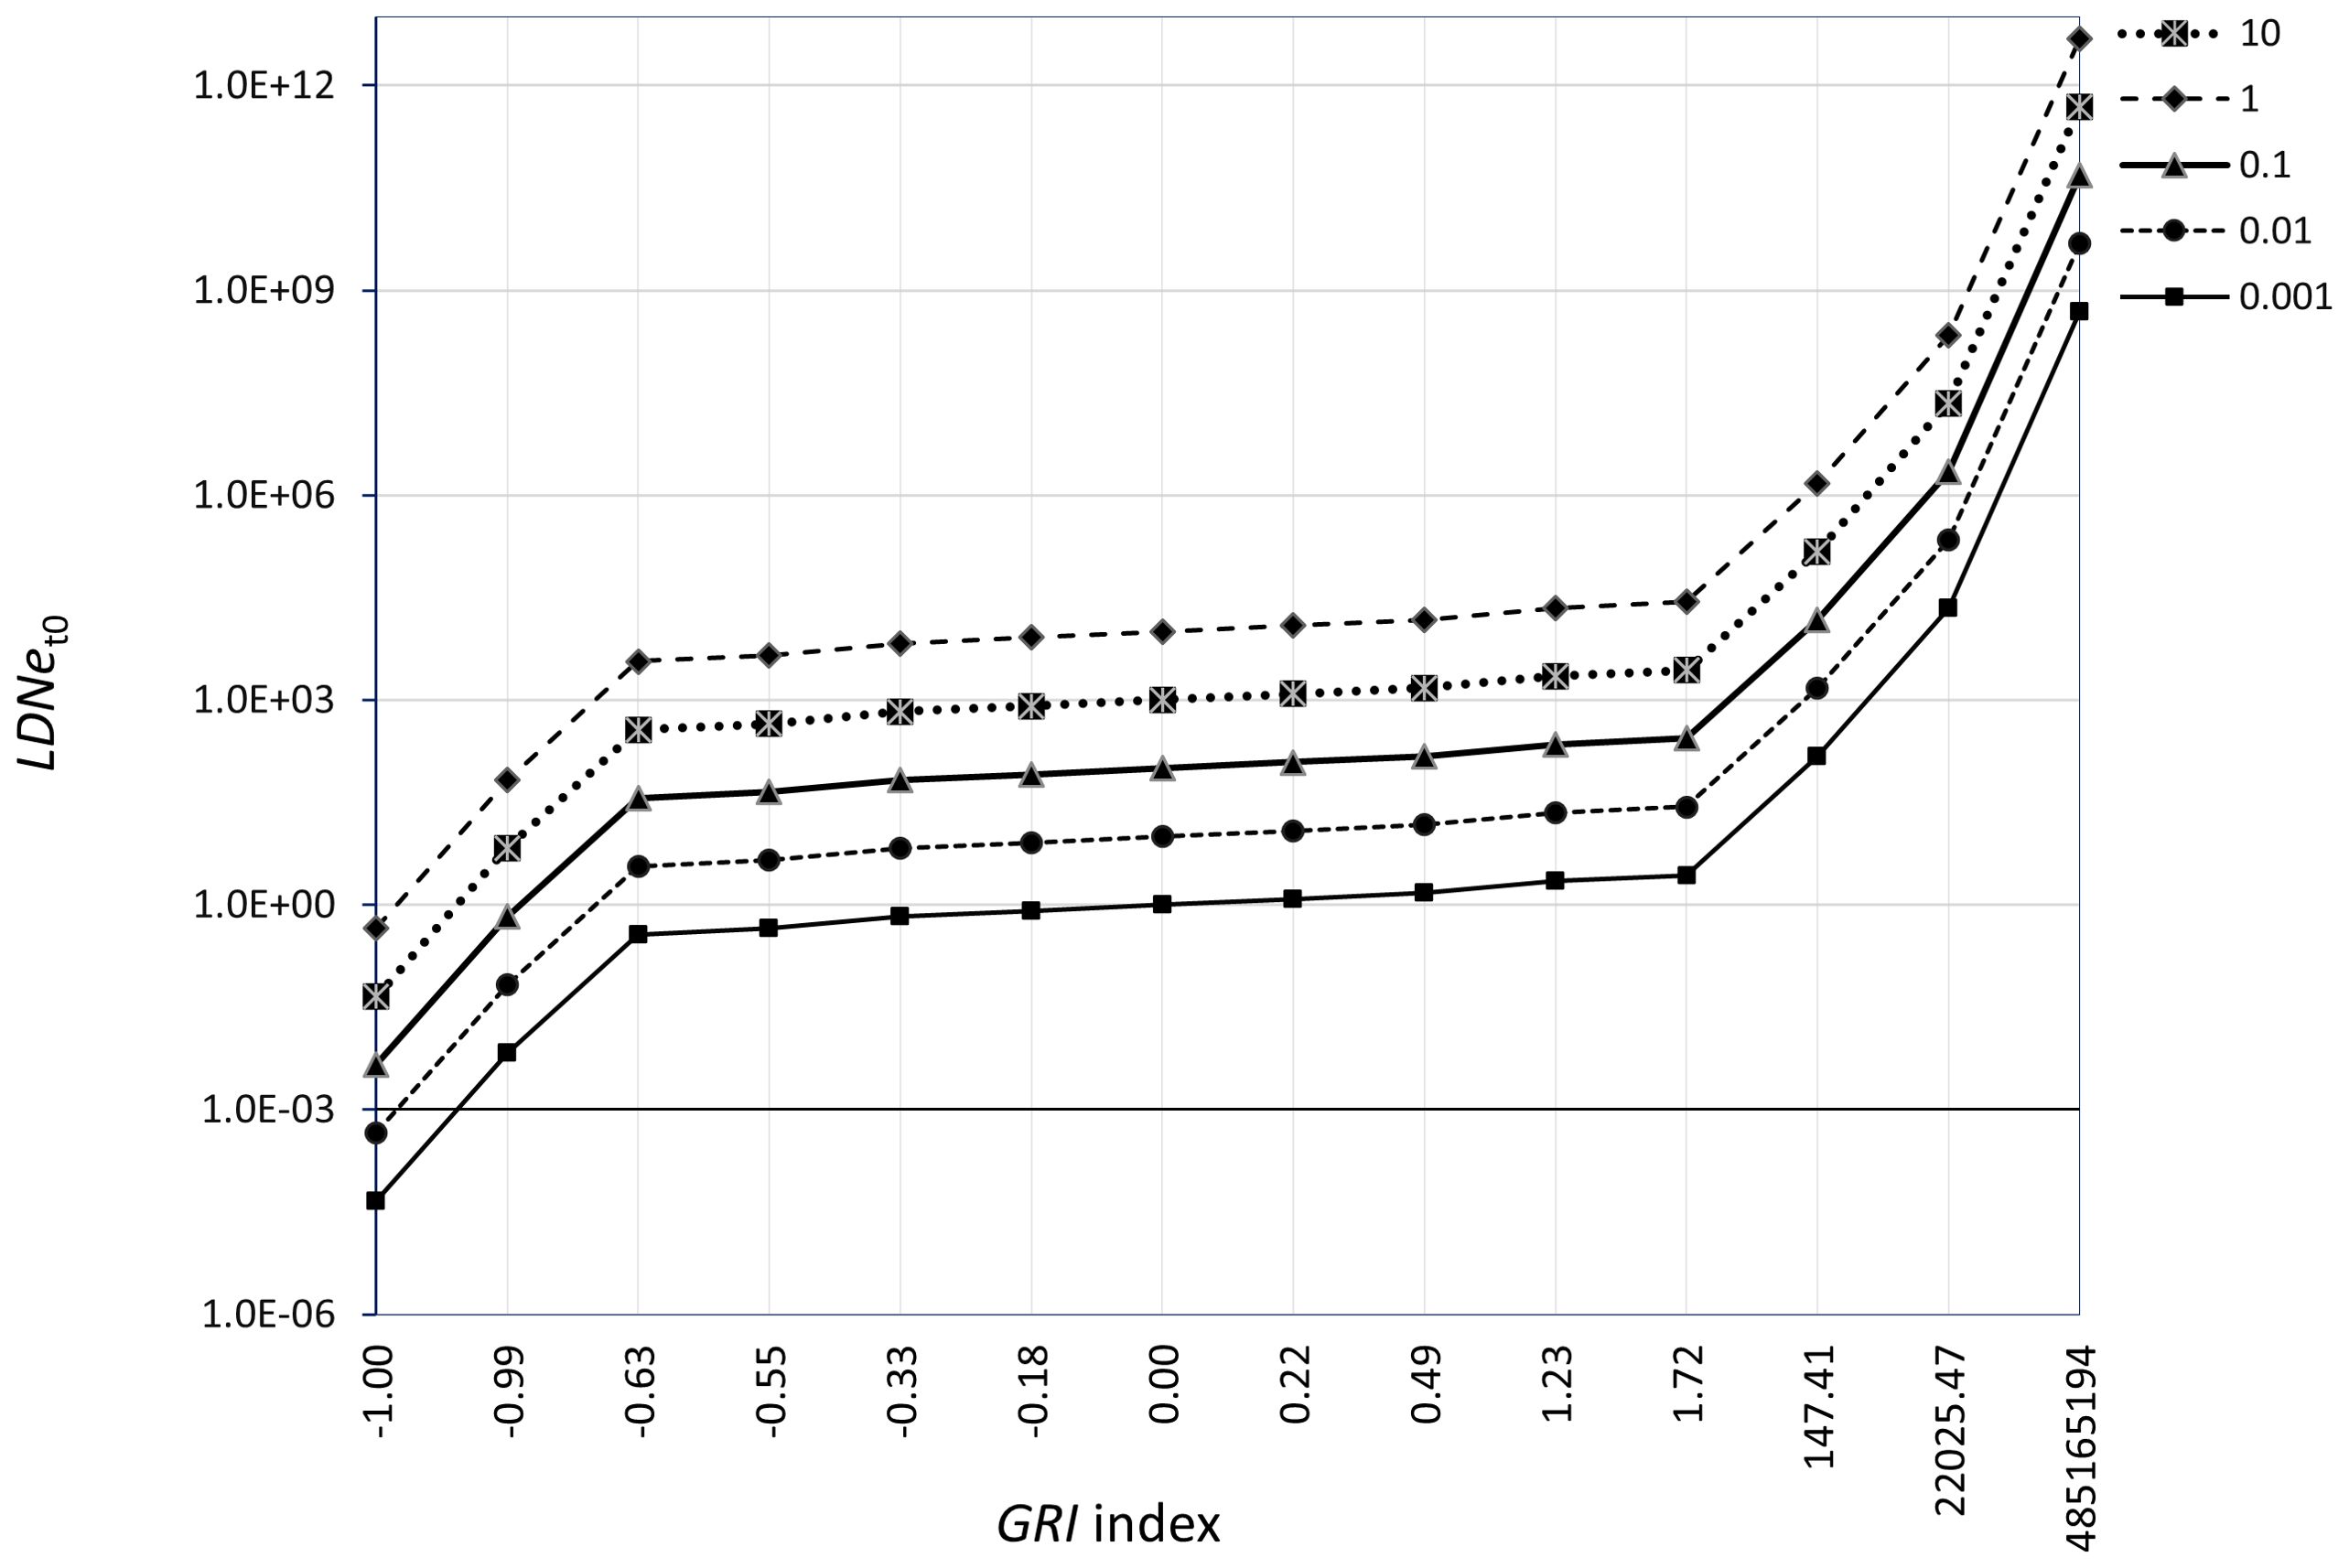
Figure 2. Logarithmic (base 10) behavior of the GRI index upon an initial population effective genetic size LDNet0 in the range (0.001 – 10) x 106 and a genetic effective mortality rate Z_LDNe ranging [-20, 50] (see Equations 1, 5). GRI is zero for any LDNet0 [written as above] when Z_LDNe [written as above] is zero.
3.2 Evolution of the GRI index in the southern hake stock
In the European hake case study, a comparison between the number of genetic deaths () and the number of demographic deaths () reveals a temporal disparity between the intergenerational demographic impact and its corresponding genetic impact. Specifically, the highest demographic death occurred during the lustrum 1986–1990 (Figure 3), consistent with the maximum mortality rate (Z) observed during that period (see Table 3 in Fernández-Míguez et al., 2023). However, the number of genetic deaths () was negligible and even negative in samples from that same period (Figure 3). This apparent mismatch likely arises because the genetic status of that generation is assessed on samples from the extant fished population which carries all the genetic diversity inherited from the preceding generation. Conversely, the fish biomass depleted during the lustrum 1986–1990 experiences a loss of genetic diversity that becomes quantifiable approximately one generation later, which in this case study corresponds to lustrum 1991–1995 (Figure 3). While the effective population size (LDNe) cannot be negative, its change can be negative under genetic erosion, or positive as reflecting inter-stock migration, mutation, reduction in reproductive variance, favorable reproductive conditions, or any combination thereof occurring alongside low mortality rates (natural and/or fishing-induced).
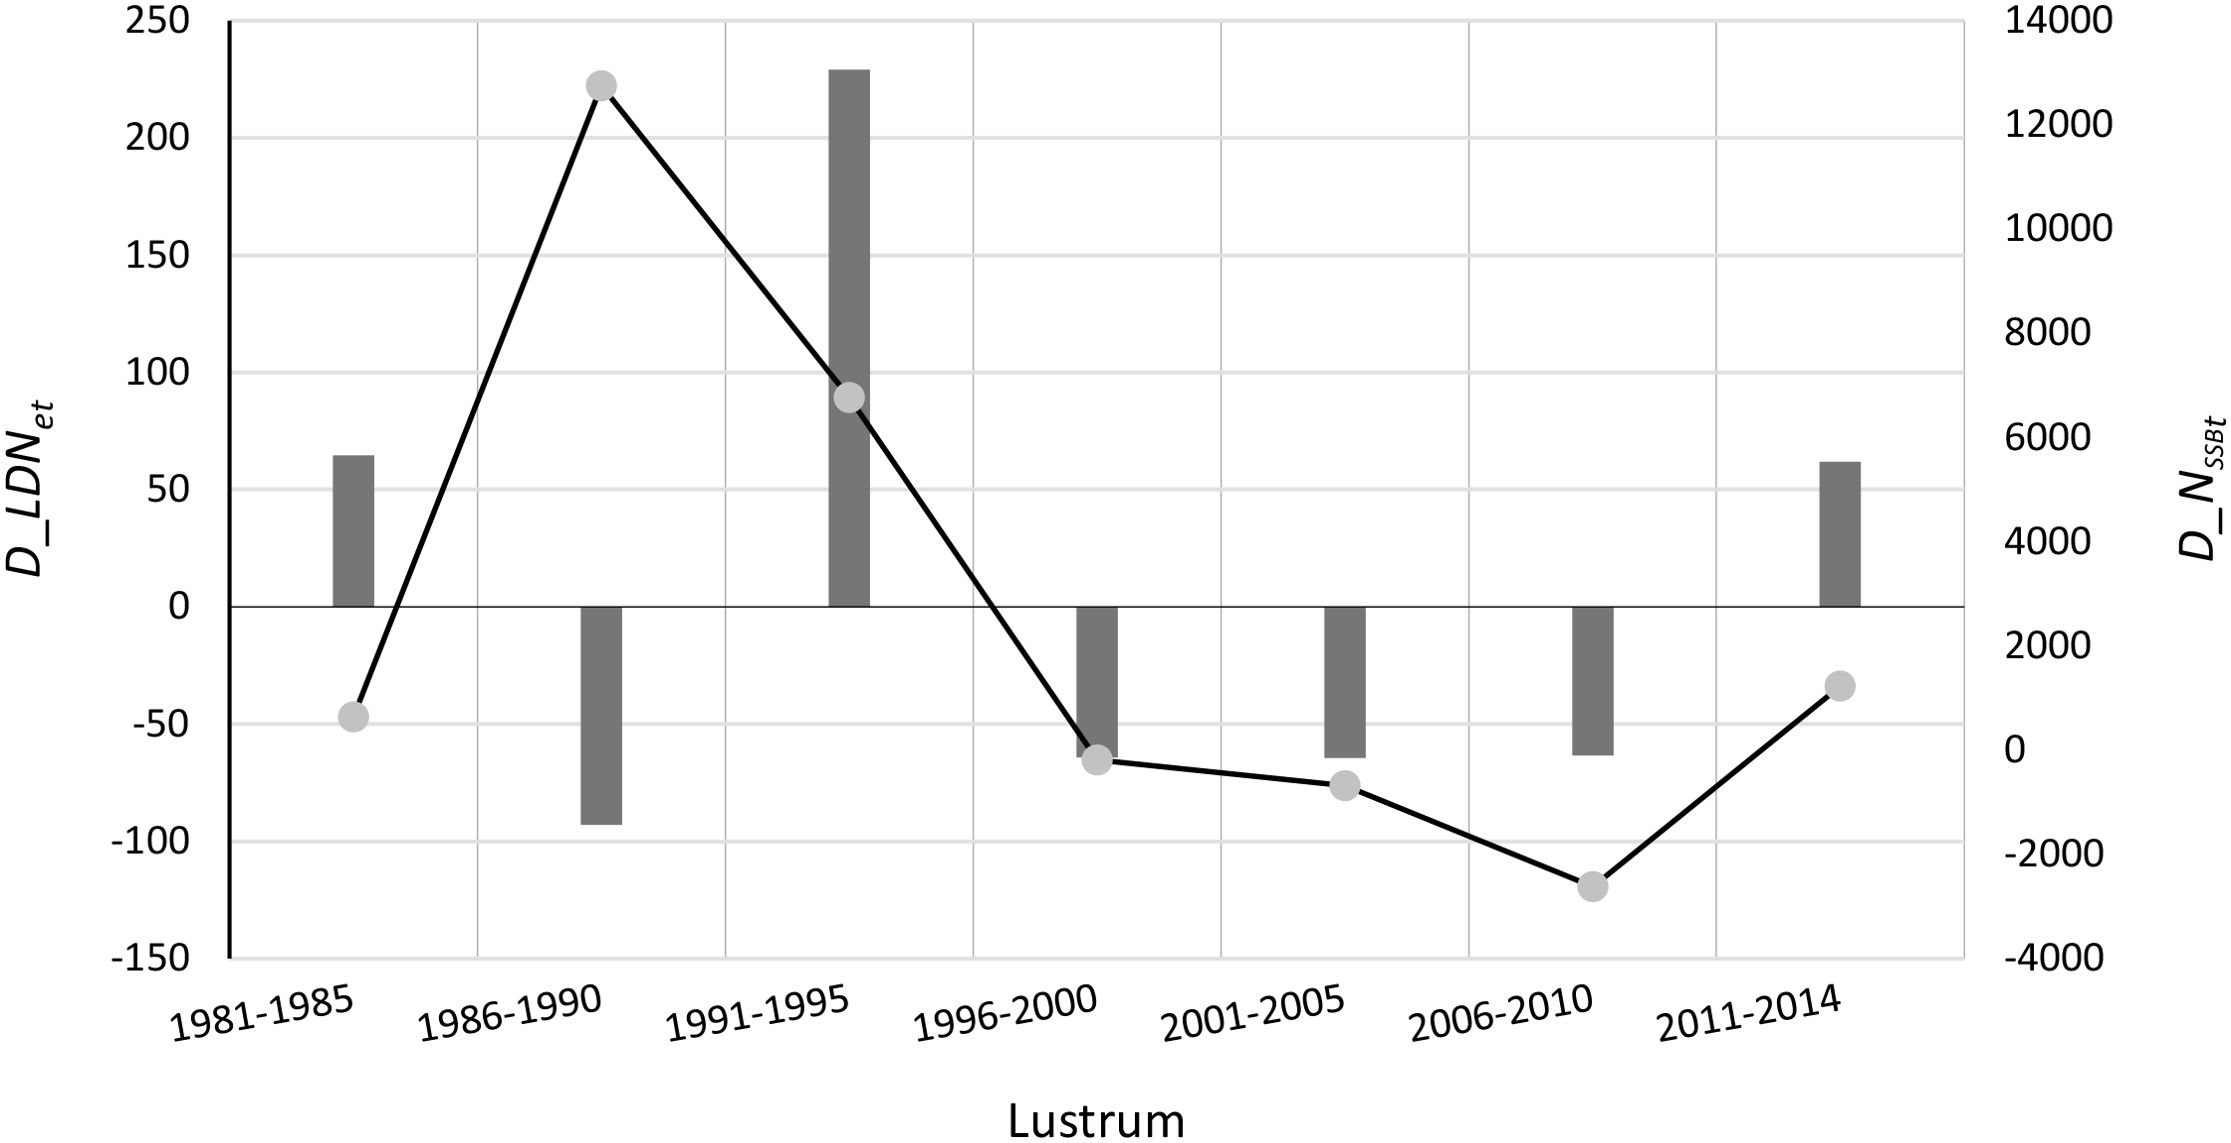
Figure 3. Per lustrum based effective number of genetic deaths (, Y-axis, bars) and the number of demographic deaths (t, Y’-axis, line) in M. merluccius from 1981 to 2014 [source data from Pita et al. (2017) and Fernández-Míguez et al. (2023)].
The Genetic Resilience Index (GRI) calculated for this fishery illustrates the behavior of (Figure 3) relative to (Figure 4). The differentiallity is that while quantifies the absolute change in Ne (positive, zero, or negative), GRI provides information on the genetic impact of the effective genetic mortality Z_LDNe during period t, representing the net Ne change in the population between two pre- and post-harvesting time points. Current lustrum-based LDNe estimates derived from relatively small European hake samples (n ≈ 40) (Fernández-Míguez et al., 2023) may indicate an accelerated loss of genetic diversity. However, the downward bias inherent in LDNe estimates from small sample sizes is expected to be minimized by the GRI indicator, as it is a proportion calculated within the same population (e.g., Jamieson and Allendorf, 2012). Metric GRI generally fluctuated within the interval [-1, 1] during the examined hake fishery period, specifically [-0.927, 0.786], with the exception of lustrum 1996–2000 when GRI reached 3.572, reflecting a substantial LDNe recovery. While acknowledging the potential influence of its large census size and migration from the northern hake stock (Pita et al., 2014), a compensatory effect cannot be ruled out given the depleted NSSB levels during that period.
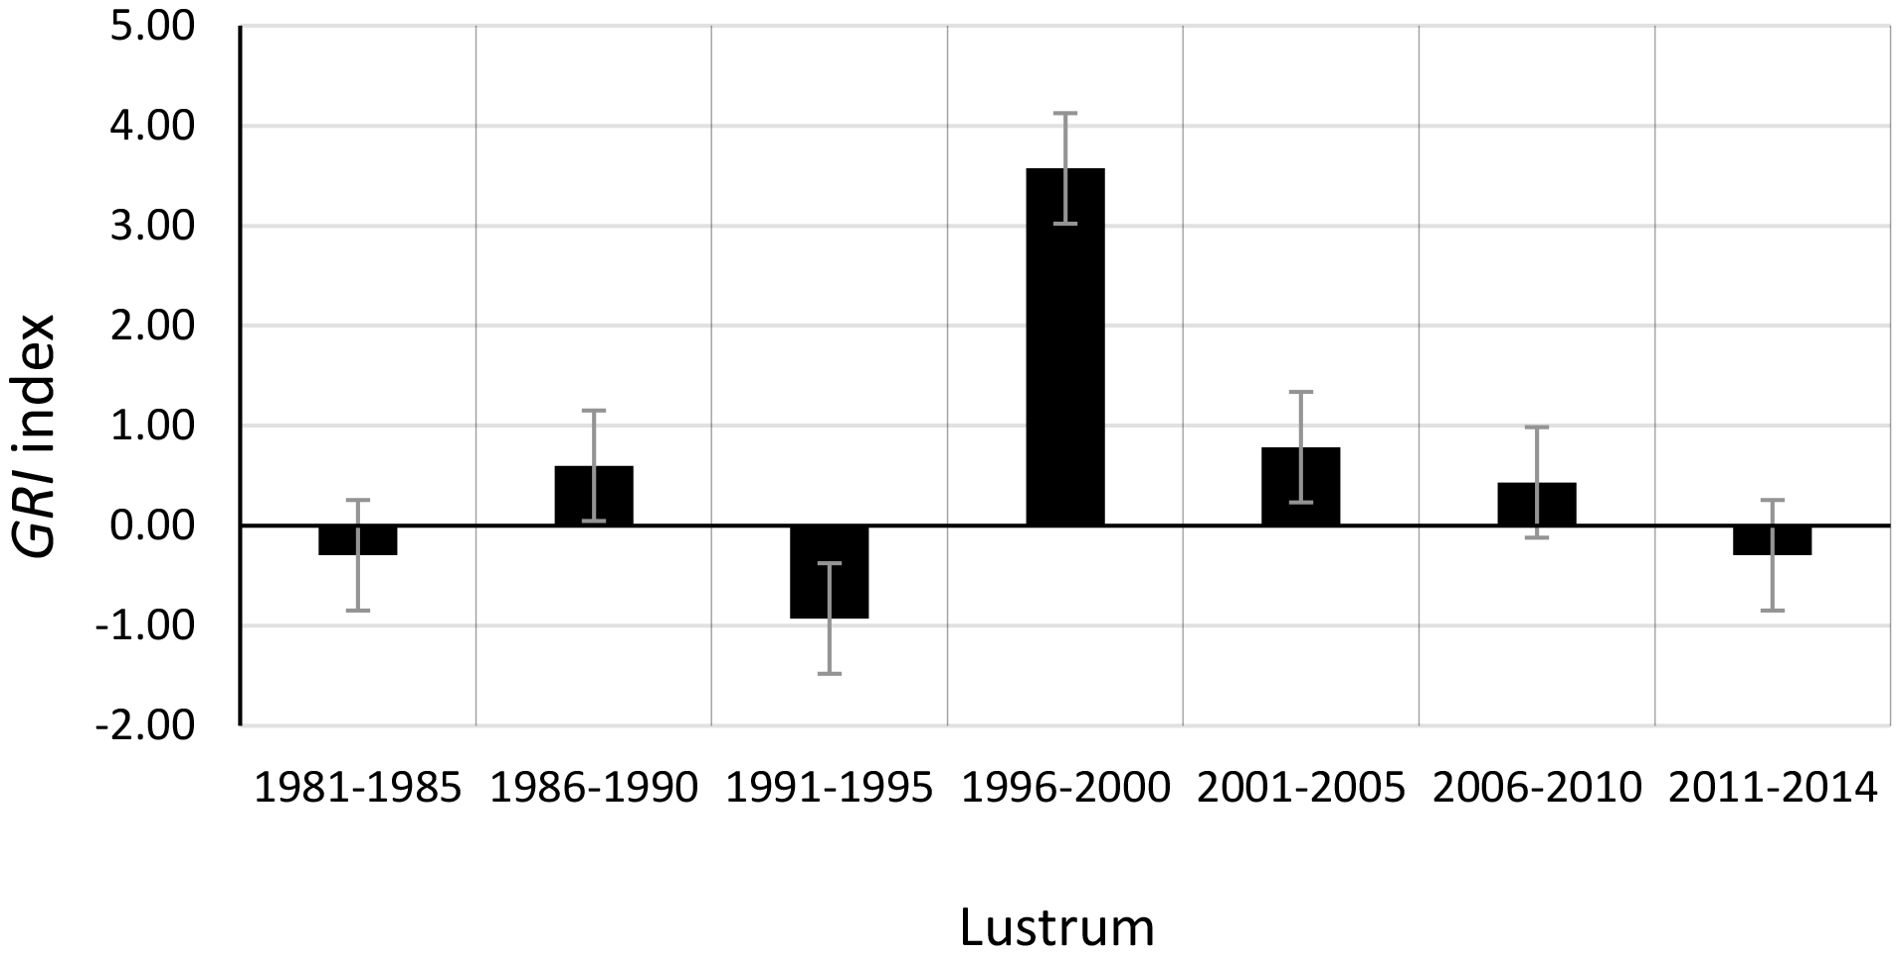
Figure 4. Per lustrum behavior of GRI in the European hake between 1981 and 2014 [data from Pita et al. (2017) and Fernández-Míguez et al. (2023)] as an index of genetic resilience. Positive GRI values imply negative effective genetic mortality or increased Ne relative to a previous moment (lustrum).
3.3 GRPs in the European hake
Genetic Reference Points (GRPs) derived from historical genetic data of the European hake establish the Basal Genetic Reference Point (BGRP) around 1976, when LDNe≈12000. Sustained overharvesting led to its subsequent erosion, with the stock entering a zone of critically low GD levels after the second half of 1980s (Figure 5), falling below the theoretically conservative LGRP = 0.30·BGRP. Previous studies estimated a bottleneck with Ne≈300 in the early 2000s for this southern hake stock (Pita et al., 2017), suggesting that this GD level might represent a critical threshold below which the stock resilience to environmental challenges would be compromised, increasing the risk of demographic non-recovery (e.g., Frankham et al., 2014).
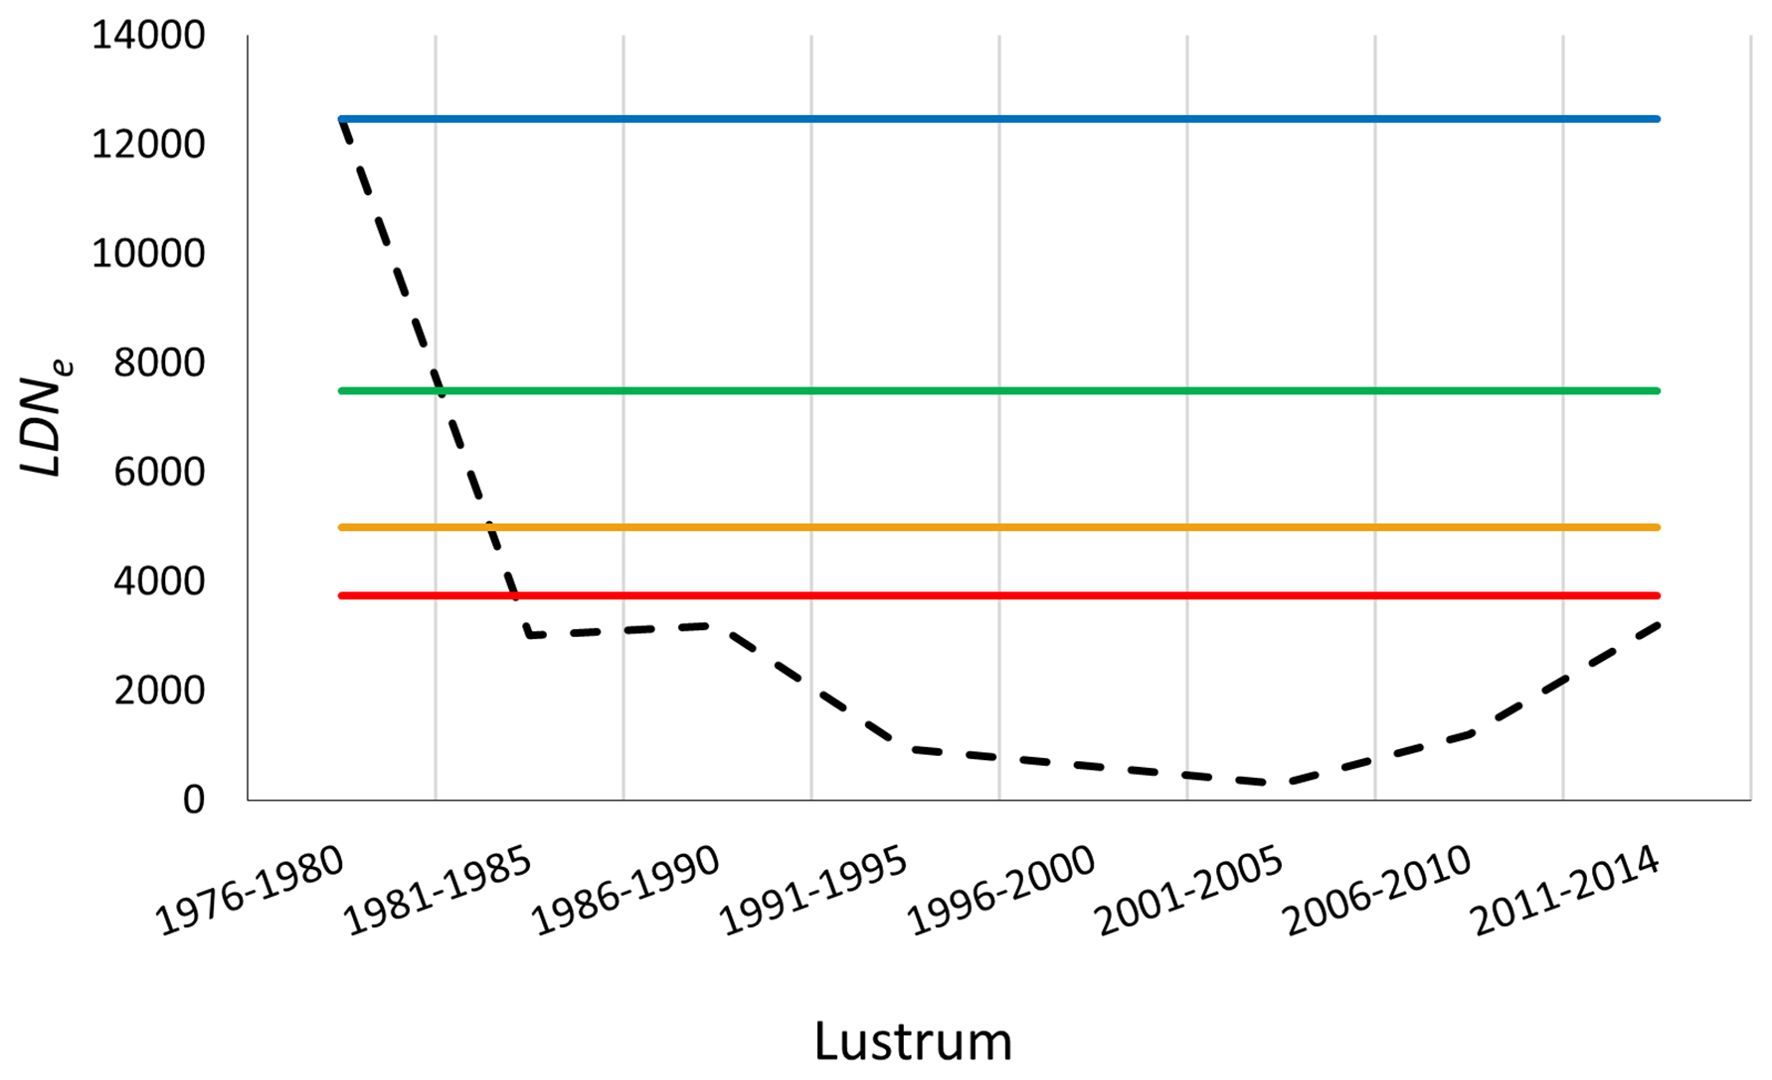
Figure 5. Genetic reference points (GRPs) applied to historical GD scores (LDNe, black dashed line) of the southern European hake fishery stock from 1976 to 2014 (Pita et al., 2017; Fernández-Míguez et al., 2023). BGRP (Basal Genetic Reference Point, blue line); LGRP (Limit GRP, red line) = 0.30*BGRP; tGRP (trigger GRP, orange line) = 0.40*BGRP; TGRP (Target GRP, green line) = 0.60*BGRP.
Despite the debated effectiveness of EU fishing regulations in recovering the southern hake stock based on its depleted NSSB figures (European Commission Council Reg, 2005), a significant fishery NSSB rebound was documented in lustrum 7 (2006–2010) (e.g., JRC (Joint Research Centre) et al., 2010), with Ne also rebounding to 3200 in 2006–2010 (Figure 5). Although the precise mechanisms of this rebound remain poorly elucidated in the literature, the synergistic effects of EU fishing regulations, a large population census size, the strong connectivity observed with the northern hake stock (Pita et al., 2014), and a compensatory effect on Ne (reduction of reproductive variance) (Pita et al., 2017) constitute the most plausible scenario given the historically depleted NSSB levels at that time. However, LDNe only re-approached the herein proposed Limit Genetic Reference Point (LGRP) in lustrum 8 (2011–2014) (Figure 5), following its positive trend from the preceding lustrum and the initiative-taking management implementation of EU fishing regulations (e.g., JRC (Joint Research Centre) et al., 2010) as should be pertinent once a species approaches the tGRP reference zone.
The Genetic Structural Reference Point (GSRP) is essential for the genetic delineation of fisheries (Pita et al., 2016a) and for assessing range shifts or stock collapses within a species metapopulation structure (e.g., Palacios-Abrantes et al., 2022). GSRP implementation is not feasible in this case study due to the steady genetic homogeneity observed in the southern hake stock (Pita et al., 2017). Nevertheless, the genetic structure of the Atlantic hake metapopulation exhibited connectivity among Atlantic stocks with variable directionality, intensity, and periodicity, and FST values ranging from 0.0001 to 0.024 during period 2000–2010 (Pita et al., 2016b). Opposite, temporal information on current structural genetic metrics from the two subpopulations in the European hake range (Atlantic and Mediterranean) can help identifying changes within their gene pools (e.g., Smedbol and Wroblewski, 2002) supporting their management distinction.
3.4 A roadmap towards implementation of genetic reference points
By adhering to a structured roadmap, fisheries management can progress towards the species-specific implementation of GRPs, thereby fostering more resilient and sustainable fisheries. However, the development and implementation of species-specific GRPs for fisheries is a multistage process necessitating collaboration among geneticists, fisheries scientists, managers, and stakeholders. A tentative roadmap aims to delineate the steps involved in establishing operational GRPs for fisheries (Table 2). We believe that setting validated GRPs in fisheries assessment can be far operational than the classical 50/500 rule (Franklin, 1980; Soulé, 1980) which proposes a minimum viable population (MVP) of 50 individuals to avoid inbreeding and 500 to mitigate genetic drift. That universal MVP rule is now considered too simplistic and less relevant as many species survive below its thresholds, and extinction risk varies greatly among species (see Jamieson and Allendorf, 2012; Frankham et al., 2013, 2014; Rosenfeld, 2014; Hoban et al., 2020). Species-specific MVPs estimated using Population Viability Analysis (PVA) models are more accurate (Shaffer, 2005). Such PVA models have evolved to handle complex scenarios and can identify factors significantly impacting extinction probability, such as habitat loss, disease, and inbreeding. Importantly, PVA can now incorporate genetic data to determine the minimum genetic diversity needed for a viable population (e.g., Zilko et al., 2021).
The first step to implement GRPs in concerned fisheries involves a clear categorization of fish stocks (e.g., ICES, 2021), i.e., stock category 1 encompasses fisheries with existing records of historical gene diversity (BGRP) and metapopulation structure (GSRP), or with the potential to reconstruct these through various means (e.g., museum collections, preserved tissue samples, otoliths, scales, bones, scientific data). Stock category 2 comprises fisheries where the reconstruction of either their historical genetic diversity or their spatiotemporal metapopulation structure (GSRP) is not feasible. In this last category, the first genetic assessment of the fishery should serve as a basis for subsequent assessments.
The second step involves developing the genetic tools using tissue samples of the species. Noteworthy, optimized purification methods now facilitate the extraction of DNA from subfossil material (e.g., Muschick et al., 2023), enabling the application of high-throughput sequencing and subsequent characterization of thousands of SNPs.
The third step entails the acquisition of high-resolution GD data from the baseline population using standardized methodologies. This GD data can be used to parameterize both the Basal Genetic Reference Point (BGRP) by applying a genetic metric (e.g., Ne) and the Genetic Structural Reference Point (GSRP) using an inter-stock genetic distance measure such as the inter-subpopulation fixation index (FST).
The fourth step involves annual genetic monitoring on non-invasive samples (e.g., from directed commercial sampling and oceanographic missions) of selected fisheries, e.g., those identified upon commercial, economic or ecological criteria, to track the genetic diversity indexes used to work out its specific GRPs. It is important to note that a spatio-temporal sampling design based on the species-specific life cycle is crucial to minimize bias in GRI and GRP estimates (based on the accuracy of Ne) and to produce meaningful data for comparing the genetic structural reference point (GSRP) of the metapopulation with the actual one. While sampling by direct fishing methods carried out by oceanographic institutes (scientific campaigns) already accounts for the species life cycle, sampling of new species of conservation concern necessitates an appropriate sampling strategy upon its life cycle (e.g. Harris et al., 2013).
At this stage, the trends and ratios of GD established through interannual data allow for the estimation of the post-harvesting rate of genetic erosion (e.g., GRI index) and the definition of the target (TGRP), the trigger GRP (tGRP), and the limit (LGRP) Genetic Reference Point based on field estimates of GD (e.g., Ne).
The fifth step consists of GRP testing to appraise error, uncertainty, and robustness of genetic estimates used to define GRPs for category 1 stocks, where comprehensive data knowledge is attainable. This task includes the validation and modeling of GRPs behavior and the assessment of their operational interest in fishery assessment (e.g., Kell et al., 2021).
The sixth step involves substantiating the biological relevance of GRPs in fishery management (through both laboratory and field-based studies, where feasible) to elucidate the relationships between GD and fitness-related traits such as growth rate, reproductive success, survival, and disease resistance in the target species. This task can be undertaken at any time, provided that large phenotypic and genetic datasets are available, e.g., enabling Genome-Wide Association Studies (GWAS).
The seventh step consists on implementing adaptive management strategies to modulate GRPs and management actions over time. This entails adjusting the observed GRPs in response to specific management interventions (e.g., fishing quotas, temporal or spatial closures, fishing gears, or genetic enhancement programs). In this context, the application of simulation modeling allows for the exploration of potential consequences of various fishing scenarios on GD and the evaluation of the effectiveness of modulating potential GRP values.
The eight step consists on integrating qualitative and quantitative GD, and structural (metapopulation) criteria into assessment process and fisheries management frameworks. The integration of genetic metrics into ecological models seems to be relatively straightforward, enabling the evaluation of extinction risks stemming from genetic factors and improving the precision of estimating fishing-induced genetic erosion rates (e.g., Yang et al., 2025; Shan et al., 2025). Its incorporation into fishery assessment algorithms and fishery management presents greater challenges, such as inertia, corporativism and across-agencies assumption of methodological novelty.
A final, yet crucial, step is capacity building to strengthen the sustainability of the genetic assessment of fisheries. Implementing GRPs necessitates a long-term commitment to research, monitoring, and adaptive management. The genetic dimension must be integrated into the scientific culture alongside traditional assessments and socio-economic considerations for holistic fisheries management. In this regard, the implementation of training programs for fishery scientists, managers, and enforcement agencies on the principles of fishery genetics, the interpretation of genetic data, and the application of GRPs becomes consequential. Within the socio-economic public domain, the engagement of stakeholders, including fishers, industry representatives, conservation organizations, and policymakers, in the development and implementation of GRPs is also a priority, as it facilitates co-participation in understanding the rationale behind GRPs and their potential benefits for the long-term sustainability of fisheries.
4 Conclusions
Overfishing and global change drive irreversible GD loss, diminishing reproductive success and potentially leading to fishery collapse (Sainsbury, 2008). While biomass management above MSY supports larger fish and sustainability (Punt and Smith, 2001), higher GD enhances resilience and reduces extinction risk (Spielman et al., 2004). This study develops Genetic Reference Points (GRPs) for monitoring and evaluating the genetic status of fisheries, which are patently absent from official assessment. That absence is due among others to the lack of both, standardization of genetic metrics into GRPs and their integration into assessment algorithms. As genetic monitoring accessibility and GD-population health understanding through IA improve, GRPs are likely to become central to fisheries management. Standardized Genetic Reference Points (GRPs) from historical species-specific baselines, alongside its demographic metrics, provide enduring criteria for identifying overfished stocks and rebuilding. For instance, because post-harvest GD quantity and quality influence rebound/collapse (Myers et al., 1997), GRPs monitoring safeguards against GD reaching extinction thresholds due to genetic factors (Hutchings, 1996). Monitoring GD evolution via GRPs is a crucial asset to understand erosion causes (e.g., overfishing, invasions, pollution, global change). Also, tracking GSRP and metapopulation dynamics allows managers to take a more informed approach to the preservation of species adaptive potential. GRPs can also help validating sustainability claims of certified fisheries. A very first drawback for the implementation of GRPs is the recognition of their importance as methodological assets for the long-term sustainability of fisheries, in parallel to the well developed Fishery Reference Points (FRPs). The lack of GD data for non model species and species with no fishing history is also a drawback to set their initial BGRPs, which should be implemented in a timely manner. The successful development of a GRPs roadmap necessitates the appropriate application of systematically collected large sample sizes, analyze them with the same marker set whichever better fits the goal and the methodological validation across laboratories to achieve a reliable GRPs standardization.
Data availability statement
Publicly available datasets were analyzed in this study. This data can be found here: The data employed in the design and simulation of novel genetic metrics is accessible from previous publications of the authors, i.e., https://doi.org/10.1016/j.fishres.2017.02.022 and https://doi.org/10.3389/fmars.2023.1214469.
Ethics statement
Ethical approval was not required for the study involving animals in accordance with the local legislation and institutional requirements. This study comprises conceptual and mathematical developments as well an applied case study employing previously published data from the authors.
Author contributions
IS: Data curation, Formal analysis, Investigation, Methodology, Validation, Visualization, Writing – review & editing. PP: Conceptualization, Formal analysis, Funding acquisition, Methodology, Project administration, Resources, Validation, Writing – original draft, Writing – review & editing.
Funding
The author(s) declare financial support was received for the research and/or publication of this article. The authors declare that financial support was received for the research, authorship, and/or publication of this article by contract TED2021-132258BI00 from MCIN/AEI/10.13039/501100011033 and The European UnionNextGenerationEU/PRTR.
Conflict of interest
The authors declare that the research was conducted in the absence of any commercial or financial relationships that could be construed as a potential conflict of interest.
Generative AI statement
The author(s) declare that no Generative AI was used in the creation of this manuscript.
Any alternative text (alt text) provided alongside figures in this article has been generated by Frontiers with the support of artificial intelligence and reasonable efforts have been made to ensure accuracy, including review by the authors wherever possible. If you identify any issues, please contact us.
Publisher’s note
All claims expressed in this article are solely those of the authors and do not necessarily represent those of their affiliated organizations, or those of the publisher, the editors and the reviewers. Any product that may be evaluated in this article, or claim that may be made by its manufacturer, is not guaranteed or endorsed by the publisher.
References
Allendorf F. W., Berry O., and Ryman N. (2014). So long to genetic diversity, and thanks for all the fish. Mol. Ecol. 23, 23–25. doi: 10.1111/mec.12574, PMID: 24372752
Bertola L. D., Brüniche-Olsen A., Kershaw F., Russo I. M., MacDonald A. J., Sunnucks P., et al. (2024). A pragmatic approach for integrating molecular tools into biodiversity conservation. Conserv. Sci. Pract. 6, e13053. doi: 10.1111/csp2.13053
Blanco G., Presa P., Vázquez E., and Sánchez J. A. (1998). Allozyme heterozygosity and development in Atlantic salmon, Salmo salar. Fish Physiol. Biochem. 19, 163–169. doi: 10.1023/A:1007771417270
Blouin M. S. (2003). DNA-based methods for pedigree reconstruction and kinship analysis in natural populations. Trends Ecol. Evol. 18, 503–511. doi: 10.1016/s0169-5347(03)00225-8
Caddy J. F. and Mahon R. (1995). Reference points for fisheries management. FAO Fisheries Tech. Paper 347, 83. Available online at: https://openknowledge.fao.org/items/4fb59221-195f-444f-86cb-574d50ce4aa5 (Accessed May 29, 2024).
Cisneros-Montemayor A. M., Cisneros-Mata M. A., Harper S., and Pauly D. (2013). Extent and implications of IUU catch in Mexico's marine fisheries. Mar. Policy 39, 283–288. doi: 10.1016/j.marpol.2012.12.003
Clarke S. H., Lawrence E. R., Matte J. M., Gallagher B. K., Salisbury S. J., Michaelides S. N., et al. (2024). Global assessment of effective population sizes: Consistent taxonomic differences in meeting the 50/500 rule. Mol. Ecol. 33 (11), e17353. doi: 10.1111/mec.17353, PMID: 38613250
Cuéllar-Pinzón J., Presa P., Hawkins S. J., and Pita A. (2016). Genetic markers in marine fisheries: types, tasks, and trends. Fish. Res. 173, 194–205. doi: 10.1016/j.fishres.2015.10.019
Díez I., Muguerza N., Santolaria A., Ganzedo U., and Gorostiaga J. M. (2012). Seaweed assemblage changes in the eastern Cantabrian Sea and their potential relationship to climate change. Estuar. Coast. Shelf Sci. 99, 108–120. doi: 10.1016/j.ecss.2011.12.027
El Mousadik A. and Petit R. J. (1996). High level of genetic differentiation for allelic richness among populations of the argan tree Argania spinosa (Skeels) endemic to Morocco. TAG 92, 832–839. doi: 10.1007/BF00221895, PMID: 24166548
European Commission Council Reg (2005). Plan for recovery measures for southern hake, COM 818. Off. J. Eur. Union Legis. 345, 5–10. Available online at: https://eur-lex.europa.eu/eli/reg/2005/2166/oj/eng (Accessed June 19, 2024).
Fernández-Míguez M., Pita A., Gómez A., and Presa. P. (2023). Temporal uncoupling between demographic and genetic metrics in fisheries assessment: the European hake case study. Front. Mar. Sci. 10. doi: 10.3389/fmars.2023.1214469
Frankham R., Bradshaw C. J. A., and Brook B. W. (2014). Genetics in conservation management: revised recommendations for the 50/500 rules, red list criteria and population viability analyses. Biol. Conserv. 170, 56–63. doi: 10.1016/j.biocon.2013.12.036
Frankham R., Brook B. W., Bradshaw C. J. A., Traill L. W., and Spielman D. (2013). 50/500 rule and minimum viable populations: Response to Jamieson and Allendorf. TREE 28, 187–188. doi: 10.1016/j.tree.2013.01.002, PMID: 23369407
Franklin I. R. (1980). Evolutionary Change in Small Populations (Sunderland, MA: Sinauer Associates. Inc.), 135–150.
Gibson A. K. and Nguyen A. E. (2021). Does genetic diversity protect host populations from parasites? A meta-analysis across natural and agricultural systems. Evol. Lett. 5, 16–32. doi: 10.1002/evl3.206, PMID: 33552533
Hale M. L., Burg T. M., and Steeves T. E. (2012). Sampling for microsatellite-Based population genetic studies: 25 to 30 individuals per population is enough to accurately estimate allele frequencies. PloS One 7, e45170. doi: 10.1371/journal.pone.0045170, PMID: 22984627
Harris G., Farley S., Russell G. J., Butler M. J., and Selinger J. (2013). Sampling designs matching species biology produce accurate and affordable abundance indices. PeerJ. 1, e227. doi: 10.7717/peerj.227, PMID: 24392290
Hoban S., Bruford M., D'Urban Jackson J., Lopes-Fernandes M., Heuertz M., Hohenlohe P. A., et al. (2020). Genetic diversity targets and indicators in the CBD post-2020 Global Biodiversity Framework must be improved. Biol. Conserv. 248, 108654. doi: 10.1016/j.biocon.2020.108654
Hoban S., da Silva J. M., Mastretta-Yanes A., Grueber C. E., Heuertz M., Hunter M. E., et al. (2023). Monitoring status and trends in genetic diversity for the Convention on Biological Diversity: an ongoing assessment of genetic indicators in nine countries. Conserv. Lett. 16, e12953. doi: 10.1111/conl.12953
Hutchings J. (1996). Spatial and temporal variation in the density of northern cod a review of hypotheses for the stock's collapse. Can. J. Fish. Aquat. Sci. 53, 943–962. doi: 10.1139/f96-097
ICES (2021). ICES fisheries management reference points for category 1 and 2 stocks; Technical Guidelines. In Report of the ICES Advisory Committee 2021,Section 16.4.3.1. International Council for the Exploration of the Sea (ICES)/ACOM. Copenhague, Denmark. doi: 10.17895/ices.advice.7891
Jamieson I. G. and Allendorf F. W. (2012). How does the 50/500 rule apply to MVPs? TREE 27, 578–584. doi: 10.1016/j.tree.2012.07.001, PMID: 22868005
JRC (Joint Research Centre), Institute for the Protection and Security of the Citizen, CEU, STECF, Simmonds J., Silva C., Trujillo V., et al. (2010). Scientific, Technical and Economic Committee for Fisheries (STECF) – Report on the subgroup on management objectives and strategies (SGMOS 10-06). Part d), evaluation of multi-annual plan for hake and nephrops in areas VIIIc and IXa. Eds. Simmonds J., Silva C., Trujillo V., and Da Rocha Alvarez J. M. (JRC 61946 Publications Office). Available online at: https://data.europa.eu/doi/10.2788/56371 (Accessed October 15, 2024).
Kardos M., Zhang Y., Parsons K. M., Yunga A., Kang H., Xu X., et al. (2023). Inbreeding depression explains killer whale population dynamics. Nat. Ecol. Evol. 7, 675–686. doi: 10.1038/s41559-023-01995-0, PMID: 36941343
Kell L. T., Sharma R., Kitakado T., Winker H., Mosqueira I.-, Cardinale M., et al. (2021). Validation of stock assessment methods: is it me or my model talking? ICES J. Mar. Sci. 78, 2244–2255. doi: 10.1093/icesjms/fsab104
Keller L. F., Arcese P., Smith J. N., Hochachka W. M., and Stearns S. C. (1994). Selection against inbred song sparrows during a natural population bottleneck. Nature 372, 356–357. doi: 10.1038/372356a0, PMID: 7969492
Laikre L., Schwartz M. K., Waples R. S., and Ryman N. (2010). The GeM Working Group. Compromising genetic diversity in the wild: unmonitored large-scale release of plants and animals. TREE 25, 520–529. doi: 10.1016/j.tree.2010.06.013, PMID: 20688414
Muschick M., Jemmi E., Lengacher N., Hänsch S., Wales N., Kishe M. A., et al. (2023). Ancient DNA is preserved in fish fossils from tropical lake sediments. Mol. Ecol. 32, 5913–5931. doi: 10.1111/mec.17159, PMID: 37830773
Myers R. A., Hutchings J. A., and Barrowman N. J. (1997). Why Do Fish Stocks Collapse? The example of cod in Atlantic Canada. Ecol. Appl. 7, 91–106. doi: 10.1890/1051-0761(1997)007[0091:WDFSCT]2.0.CO;2
Nande M., Pérez M., and Presa P. (2024). The embryo-oil drop assembly: the timing and morphology of a critical event for fish early-life history survival. Sci. Rep. 14, 6918. doi: 10.1038/s41598-024-57429-9, PMID: 38519522
Nazareno A. G., Bemmels J. B., Dick C. W., and Lohmann L. G. (2017). Minimum sample sizes for population genomics: an empirical study from an Amazonian plant species. Mol. Ecol. Resour. 17, 1136–1147. doi: 10.1111/1755-0998.12654, PMID: 28078808
Palacios-Abrantes J., Frölicher T. L., Reygondeau G., Sumaila U. R., Tagliabue A., Wabnitz C. C. C., et al. (2022). Timing and magnitude of climate-driven range shifts in transboundary fish stocks challenge their management. Glob. Change Biol. 28, 2312–2326. doi: 10.1111/gcb.16058, PMID: 35040239
Palstra F. P. and Ruzzante D. E. (2011). Demographic and genetic factors shaping contemporary metapopulation effective size and its empirical estimation in salmonid fish. Heredity 107, 444–455. doi: 10.1038/hdy.2011.31, PMID: 21522167
Pinello D., Gee J., and Dimech M. (2017). Handbook for fisheries socio-economic sample survey – principles and practice (Rome: FAO).
Pita A., Casey J., Hawkins S. J., Ruiz-Villarreal M., Gutiérrez M. J., Cabral H., et al. (2016a). Conceptual and practical advances in fish stock delineation. Fish. Res. 173, 185–193. doi: 10.1016/j.fishres.2015.10.029
Pita A., Fernández-Míguez M., and Presa P. (2022). EST-microsatellite types and structural scenarios in european hake fisheries. Animals 12, 1462. doi: 10.3390/ani12111462, PMID: 35681926
Pita A., Leal A., Santafé-Muñoz A., Piñeiro C., and Presa P. (2016b). Genetic inference of demographic connectivity in the Atlantic European hake metapopulation (Merluccius merluccius) over a spatio-temporal framework. Fish. Res. 179, 291–301. doi: 10.1016/j.fishres.2016.03.017
Pita A., Pérez M., Balado M., and Presa P. (2014). Out of the Celtic cradle: The genetic signature of European hake connectivity in South-western Europe. J. Sea Res. 93, 90–100. doi: 10.1016/j.seares.2013.11.003
Pita A., Pérez M., Velasco F., and Presa P. (2017). Trends of the genetic effective population size in the Southern stock of the European hake. Fish. Res. 191, 108–119. doi: 10.1016/j.fishres.2017.02.022
Punt A. E. and Smith A. D. M. (2001). “The Gospel of Maximum Sustainable Yield in Fisheries Management: Birth, Crucifixion and Reincarnation,” in Conservation of Exploited Species. Ed. Reynolds J. D., et al (Cambridge University Press, New York), 41–66. Available online at: http://hdl.handle.net/102.100.100/204091?index=1 (Accessed July 21, 2024).
Rosenfeld J. S. (2014). 50/500 or 100/1000? Reconciling short- and long-term recovery targets and MVPs. Biol. Conserv. 176, 287–288. doi: 10.1016/j.biocon.2014.05.00
Sadler D. E., Watts P. C., and Uusi-Heikkilä S. (2023). The riddle of how fisheries influence genetic diversity. Fishes 8, 510. doi: 10.3390/fishes810051
Sainsbury K. (2008). Best Practice Reference Points for Australian Fisheries, Australian Fisheries Management Authority. 156 p. Available online at: https://catalogue.nla.gov.au/catalog/4352935 (Accessed June 2, 2024).
Shaffer M. (2005). Population viability analysis. Conserv. Biol. 4, 39–40. doi: 10.1111/j.1523-1739.1990.tb00265.x
Shan B., Huang W., Zhang M., Wang L., Liu Y., Yan C., et al. (2025). Integrating population genetics and species distribution models to predict red seabream distribution under climate change. GECCO. 60, e03589. doi: 10.1016/j.gecco.2025.e03589
Siple J. and Litz F. N. (2021). “Trends in NOAA's Fisheries Stock Assessments,” in Fisheries Stock Assessments (Springer, Cham), 595–612.
Smedbol R. K. and Wroblewski J. S. (2002). Metapopulation theory and northern cod population structure: interdependency of subpopulations in recovery of a groundfish population. Fish. Res. 55, 161–174. doi: 10.1016/S0165-7836(01)00289-2
Soulé M. E. (1980). “Thresholds for Survival: Maintaining Fitness and Evolutionary Potential,” in Conservation Biology: An Evolutionary-Ecological Perspective. Eds. Soulé M. E. and Wilcox B. A. (Sinauer, Sunderland, MA: Sinauer, Sunderland, MA), 151–169.
Spielman D., Brook B. W., and Frankham R. (2004). Most species are not driven to extinction before genetic factors impact them. Proc. Natl. Acad. Sci. U.S.A. 101, 15261–15264. doi: 10.1073/pnas.0403809101, PMID: 15477597
Tanner S. E., Pérez M., Presa P., Thorrold S. R., and Cabral H. N. (2014). Integrating microsatellite DNA markers and otolith geochemistry to assess population structure of European hake (Merluccius merluccius). Estuar. Coast. Shelf Sci. 142, 68–75. doi: 10.1016/j.ecss.2014.03.010
Waples R. S. (2005). Genetic estimates of contemporary effective population size: to what time periods do the estimates apply? Mol. Ecol. 14, 3335–3352. doi: 10.1111/j.1365-294X.2005.02673.x, PMID: 16156807
Waples R. S. (2024). The Ne/N ratio in applied conservation. Evol. Appl. 17, e13695. doi: 10.1111/eva.13695, PMID: 38721593
Weir B. S., Anderson A. D., and Hepler A. B. (2006). Genetic relatedness analysis: modern data and new challenges. Nat. Rev. Genet. 7, 771–780. doi: 10.1038/nrg1960, PMID: 16983373
Wright S. (1922). Coefficients of inbreeding and relationship. Am. Nat. 56, 330–338. doi: 10.1086/279872
Wright S. (1931). Evolution in mendelian populations. Genetics 16, 97–159. doi: 10.1093/genetics/16.2.97, PMID: 17246615
Yang Y. Z., Sun P. W., Ke C. Y., Luo M. S., Chang J. T., Chao C. T., et al. (2025). Towards climate-resilient conservation: Integrating genetics and environmental factors in determining adaptive units of a xeric shrub. GECCO. 57, e03417. doi: 10.1016/j.gecco.2025.e03417
Keywords: effective genetic mortality (Z_LDNe), effective number of genetic deaths (D_LDNe), European hake, fishery assessment, genetic resilience index (GRI), genetic reference points (GRPs), GRPs implementation roadmap
Citation: Seijas-Díaz I and Presa P (2025) Towards a more integrative paradigm in fisheries assessment: genetic reference points. Front. Mar. Sci. 12:1524309. doi: 10.3389/fmars.2025.1524309
Received: 07 November 2024; Accepted: 08 August 2025;
Published: 11 September 2025.
Edited by:
David Seth Portnoy, Texas A&M University Corpus Christi, United StatesReviewed by:
Alice Ferrari, University of Bologna, ItalyNatalia Lam, University of Chile, Chile
Angka Mahardini, Universitas Muhammadiyah Semarang, Indonesia
Copyright © 2025 Seijas-Díaz and Presa. This is an open-access article distributed under the terms of the Creative Commons Attribution License (CC BY). The use, distribution or reproduction in other forums is permitted, provided the original author(s) and the copyright owner(s) are credited and that the original publication in this journal is cited, in accordance with accepted academic practice. No use, distribution or reproduction is permitted which does not comply with these terms.
*Correspondence: Pablo Presa, cHJlc3NhQHV2aWdvLmdhbA==