 Yafeng Zhong1
 Guo Yu
 Fajin Chen
- 1College of Electronic and Information Engineering, Guangdong Ocean University, Zhanjiang, China
- 2College of Chemistry and Environmental Science, Guangdong Ocean University, Zhanjiang, China
- 3College of Ocean and Meteorology, Guangdong Ocean University, Zhanjiang, China
- 4Suixi Meteorological Service, Guangdong Meteorological Service, Zhanjiang, China
Based on the field survey data collected in winter (January, 2018) and spring (April, 2017), the characteristic variability of chromophoric dissolved organic matter (CDOM) in different seasons in Zhanjiang Bay was analyzed. The results demonstrated that CDOM absorption coefficient at 280 nm (ag(280)) and the spectral slope from 275 to 295 nm (S275-295) representing the molecular weight of CDOM could both maintain good correlations with salinity in winter and spring, indicating that CDOM was more likely to exist as a conserved substance during its migration in Zhanjiang Bay. The characteristics of CDOM and the weak correlation between Chlorophyll a (Chl a) and CDOM revealed that the influence of algal activity on CDOM was limited. In addition, this study also suggested the idea of using CDOM to track the eutrophication of a bay. Based on the acceptable correlation between ag(280) and reflectance band ratio (Rrs(704)/Rrs(492)) recorded in-situ, and eutrophication index (EI), a series of empirical models were developed to categorize and retrieve the eutrophication through ag(280) and were then used to Sentinel-2. The eutrophication assessment of Zhanjiang Bay was examined by CDOM remote sensing. This study provided a fresh approach to measuring eutrophication that could help regional environmental quality management organizations to make informed decisions.
1 Introduction
A mixture of aromatic and lipid organic compounds known as dissolved organic matter (DOM) is widely present in various natural waters (Chen W. et al., 2003). Chromophoric or colored dissolved organic matter (CDOM), which is a component of DOM interacting with light and is also known as yellow substance due to its low absorption in the yellow band (Nelson and Siegel, 2002; Lei et al., 2018; Dias et al., 2021; Tian et al., 1994). The biogeochemical processes and primary productivity in water will be impacted by strong absorption properties of CDOM, which range from ultraviolet to blue light (Lei et al., 2018; Zhou et al., 2018). With increasing wavelengths, the typical CDOM absorption spectrum typically decreases exponentially (Bricaud et al., 1981). The CDOM concentration is typically described using the absorption coefficient of a specific band (Zhou et al., 2018; Yu et al., 2016). CDOM sources in coastal areas are primarily divided into terrestrial input, which includes river input, groundwater, terrestrial sewage input, and marine autogenic, which is consist of phytoplankton production, bacterial release, viral activity release, bottom sediment resuspension and upwelling (Yu et al., 2016; Kim and Kim, 2015; Birdwell and Engel, 2010; Spencer et al., 2012; Boss et al., 2001; Zhang et al., 2009; Romera-Castillo et al., 2011; Coble et al., 1998). The spectral slope (S) of CDOM from the range of 275–295 nm is more sensitive to the molecular weight and sources of CDOM (Helms et al., 2008; Fichot and Benner, 2012). The average molecular weight of CDOM is usually inversely related to S, and it can also be a crucial metric for assessing terrestrial or newly produced CDOM (Helms et al., 2008; Green and Blough, 1994; Nelson et al., 2004). Furthermore, determining CDOM origins, identifying water masses, analyzing CDOM mixing behavior, and other tasks could be aided by knowing how CDOM absorption coefficient and S relate to salinity, Chlorophyll a (Chl a), or other parameters (Lei et al., 2018; Zhou et al., 2018; Bai et al., 2013). CDOM removing processes, such as photo-bleaching and microbial decomposition are also observed in several studies (Moran et al., 2000; Nelson and Siegel, 2013; Yamashita et al., 2013).
CDOM is also a portion of the entire dissolved organic carbon (DOC) pool, which is an important carbon pool in water ecosystems (Carlson et al., 1994). Dynamics of CDOM have an important impact on the carbon cycle at the regional and even global scales (Hedges, 1992; Hansell et al., 2009). The absorption characteristics of CDOM in the surface water of the Changjiang Estuary and its adjacent sea areas were examined by Liu et al. (2014), who discovered a declining trend in CDOM concentrations from northwest to southeast. Additionally, they discovered that the Changjiang Estuary’s surface water’s CDOM absorption rose dramatically during phytoplankton blooms and somewhat correlated with dissolved organic carbon (Liu et al., 2014). The source and spatial dynamics of CDOM in the Changjiang Estuary’s surface water were investigated by Sun et al. (2014). This investigation demonstrated that phase transfer, conservative mixing, and allochthonous input dominated the distribution of CDOM. During a single annual cycle, Das et al. (2017) found that the northern Bay of Bengal’s nearshore to offshore transition zone showed notable spatial and temporal variability of CDOM. They discovered that the region’s CDOM varied considerably more during the monsoon season and less during the non-monsoon season (Das et al., 2017). Even though the researchers’ efforts described above have contributed to a general understanding of the dynamics of CDOM in coastal regions, there is still a lack of knowledge regarding how to swiftly, extensively, and deeply comprehend these dynamics.
Currently, satellite remote sensing technology is growing vigorously. Remote sensing has great advantages in obtaining CDOM information of water in high spatial and temporal resolution (Olmanson et al., 2020). Remote sensing estimations of CDOM in ocean environments and coastal regions have been widely reported in recent years (Tehrani et al., 2013; Ruescas et al., 2018; Ling et al., 2020). Recent satellite sensor products such as Sentinel-2 Multi-Spectral Instrument (MSI) have been used for retrieval of CDOM in some aquatic systems (Ruescas et al., 2018; Xu et al., 2018; Shang et al., 2021). Furthermore, CDOM has become a main proxy for DOC retrieval, salinity retrieval, assessment of eutrophication level (Bai et al., 2013; Zhang Y. et al., 2018; Tehrani et al., 2013; Shang et al., 2021). Therefore, using remote sensing technology to investigate CDOM dynamics and its proxies is a dependable and efficient way.
Coastal bays are the channel of terrestrial organic matter from land to the ocean, and its internal biogeochemical processes have an important impact on the carbon cycle of marginal sea (Zhao et al., 2021). Due to its dense population and rapid economic development, coastal bays are generally in a state of eutrophication and have been impacted by significant human activities like aquaculture and sewage discharge (Wang et al., 2012; Jiang Z. et al., 2019; Zhou et al., 2019; Ke et al., 2020; Zhao et al., 2021). These anthropic factors not only increased the complexity of organic matter sources and transformation processes, but also greatly interfered with original biogeochemical cycles and coastal ecosystems (Zhao et al., 2021; Lao et al., 2021). Consequently, it is very important to quickly understand the eutrophication level of coastal bays for analyzing the structure and function of the regional ecosystem, predicting the future change trend of the environment and formulating appropriate mitigation strategies (Zhang Y. et al., 2018).
Zhanjiang Bay is a semi-enclosed and eutrophic bay located in the northwest of the South China Sea. Affected by various anthropogenic activities, such as industrial activities, shipping activities and aquaculture, the water ecology and environment in Zhanjiang Bay was seriously disturbed by human activities (Li et al., 2020; Yu et al., 2023). As a result of anthropogenic pollution discharges, the content of dissolved organic matter in Zhanjiang coastal waters has increased dramatically, which has a serious impact on Zhanjiang coastal and its adjacent waters (Zhang et al., 2022; Yu et al., 2024). Previous studies have shown that the level of eutrophication is becoming increasingly serious in the Zhanjiang Bay (Zhang et al., 2020; Li et al., 2020). The east of the bay is mainly connected with the South China Sea through a narrow channel (about 2 km). The exchange of water between Zhanjiang Bay and the South China Sea is significantly restricted. Consequently, being a typical coastal bay with various human activities and a long water retention time, this study can benefit understanding of the combined effects of natural environment changes, anthropogenic activities and geomorphologic features on the dynamics of CDOM in Zhanjiang Bay.
Based on the field data in April 2017 and January 2018 and Sentinel-2 data, the main objectives of this study were: 1) to analysis of the CDOM variability in the Zhanjing Bay during spring and winter; 2) to assess the eutrophication level by Sentinel-2 MSI-derived CDOM data.
2 Materials and methods
2.1 Study area
At the southernmost point of the Chinese Mainland, Zhanjiang Bay is situated to the east of the Leizhou Peninsula (Figure 1). Zhanjiang City, a prefecture-level city in China’s Guangdong Province, Donghai island, and Nanshan island surround Zhanjiang Bay, and the Donghai dam closes off Zhanjiang Bay’s western entrance (Zhou et al., 2020). The overall water depth of Zhanjiang Bay is relatively shallow. As shown in Figure 1, except for the channel area, the overall water depth of bay is no more than 10 m, and the deepest area is the bay mouth, about 40 m. The subtropical marine monsoon climate of Zhanjiang Bay is characterized by a dry season that lasts from November to February and a wet season that lasts from April to September (Zhang J. et al., 2018; Chen et al., 2019). Zhanjiang Bay has an irregular semi-diurnal tide, despite the fact that a river (the Suixi River) flows into the bay from the north (Zhou et al., 2020; Wang et al., 2021). Because the bay’s tidal capacity is greatly exceeded the runoff from rivers, making tidal current the main hydrodynamic force there.
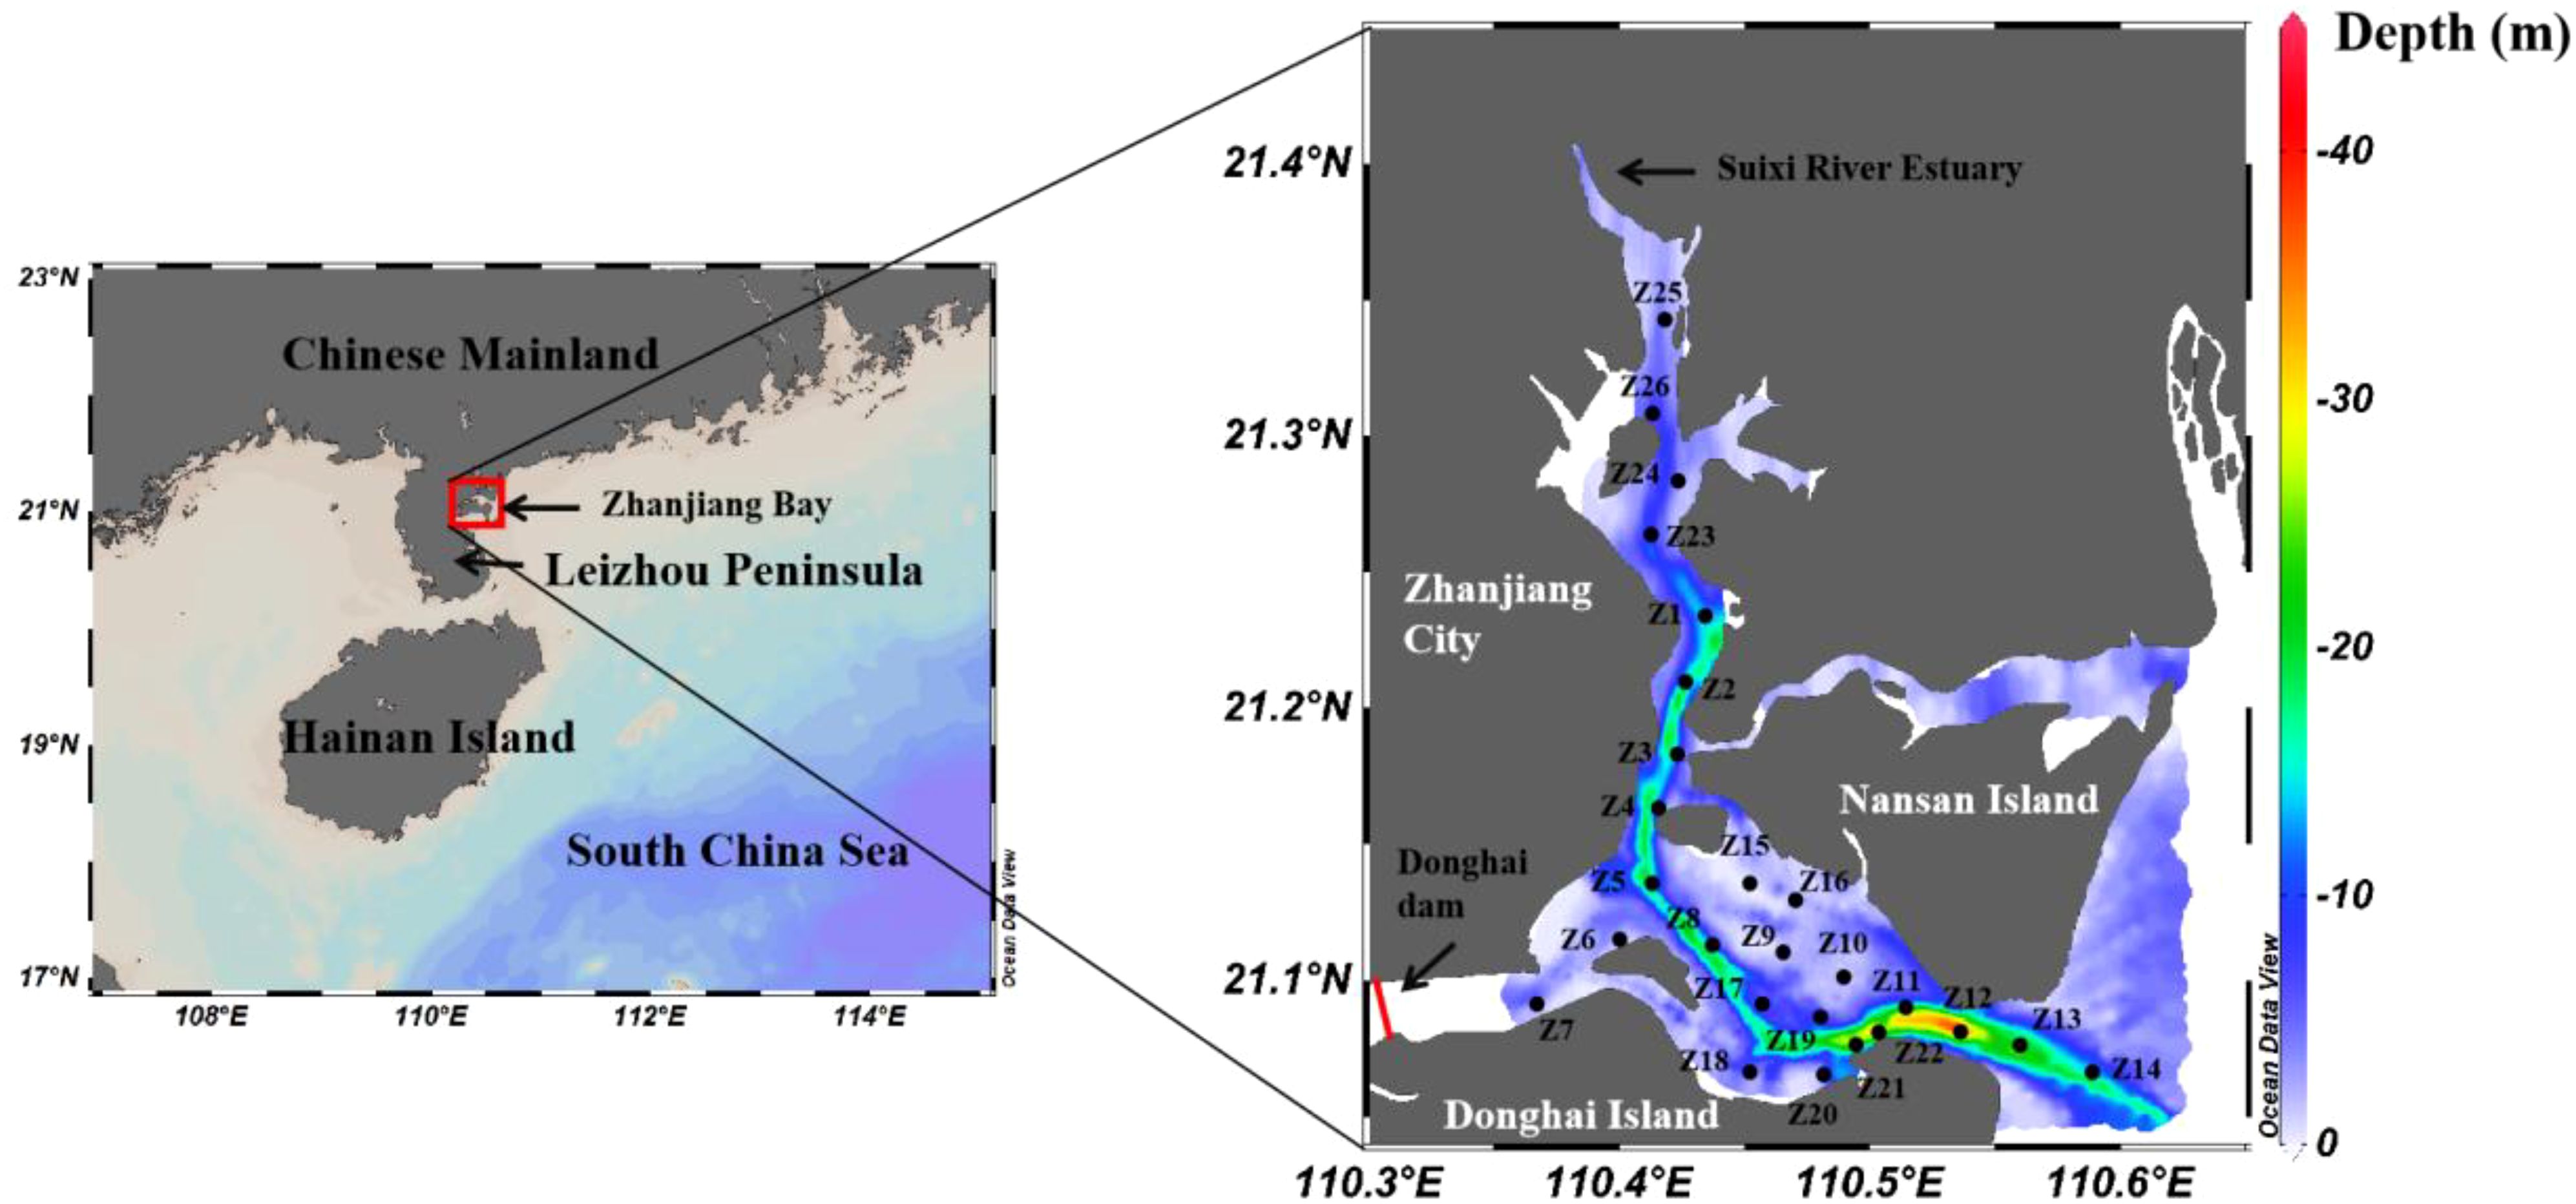
Figure 1. Map of the Zhanjiang Bay (left) and distribution of sampling sites in the Zhanjiang Bay (right). The stations were plotted as black dots from Z1 to Z26.
2.2 Sample collection and analysis
Two surveys were carried out in Zhanjiang Bay from April 14 to 16, 2017 (spring) and January 20 to 22, 2018 (winter). The survey was conducted between 21° and 21.4°N latitude and between 110.3° and 110.7°E longitude (Figure 1). At each sampling stations, surface water samples between 0 and 50 cm in depth were taken in April and January. In addition, bottom water samples were collected from each station for CDOM analysis. The bottom water samples were collected at a depth of 1 m above water bottom. During the surface water samples collection process, water samples for dissolved oxygen (DO) analysis were first collected. Water enclosed in Plexiglass water sampler was slowly drained into brown glass bottles, after a few minutes of overflow, and manganese sulfate and alkaline iodide solution was fixed into the bottle (Zhou et al., 2020). After that, unfiltered seawater also was collected for chemical oxygen demand (COD) analysis. Titrations of DO and COD were performed within 24 hours of sampling in the laboratory. Samples were filtered using filters (Whatman, 0.22 µm, Polycarbonate) and stored at -20°C for further CDOM analysis. Chl a was collected in pre-burned (450°C, 4 h) glass fiber filters (Whatman, 0.7 µm, GF/F) by filtering water samples (1000 mL) and the filtered seawater was collected for inorganic nutrients (NO3-N、NO2-N、PO4-P and SiO3-Si), which was stored at -20°C before further processing. Utilizing a conductivity-temperature-depth (CTD) meter (SBE911, Seabird, Inc., USA), water profile measurements of temperature, salinity, and depth were made. Significantly, there were only a small number of valid CTD data (14 station samples) available due to the CTD’s malfunction in the winter, therefore, in January, only 14 stations collected salinity, temperature and depth data in Zhanjiang Bay. With a spectroradiometer (USB2000+, Ocean Optics, Inc., USA), the spectral radiometric parameters (radiances from water, sky and reference panel) were measured above water surface between 200 and 1100 nm (1 nm interval). The spectroradiometer used the above-surface measurement technique suggested by Mobley (Mobley, 1999) as its measurement method. It should be noted that we did not use the spectroradiometer during the January survey, we only used it during the April survey, and the effective spectral data was 23. Remote sensing reflectance (Rrs(λ)) was calculated with upwelling spectral radiance Lu(λ), downwelling spectral irradiance Ed(λ), incident spectral sky radiance Ls(λ) and proportionality coefficient (δ) (Equation 1) (Yu et al., 2023). Ed(λ) was calculated with radiance from gray reference panel Lp(λ) with known irradiance reflectance (ρp) (Equation 2) (Yu et al., 2023).
Using a UV-Vis spectrophotometer (UV-2550PC, Shimadzu, Japan), CDOM optical density measurements of 52 station samples were made in the range of 250 to 800 nm (1 nm interval). The difference between the optical density of the sample and that of Milli-Q water at each wavelength was known as the CDOM absorption coefficient. Equations 3 and 4 were used to calculate the CDOM absorption coefficient ag(λ) (Green and Blough, 1994).
Where ag(λ)’ was the uncorrected absorption coefficient at wavelength λ; D(λ) was the optical density at wavelength λ; r was the cuvette length, which is 0.1 m in this study; ag(λ) was the modified absorption coefficient that has been corrected for scattering. The ag(280) was used to represent the concentration of CDOM (Zhou et al., 2018; Zhang et al., 2009; Lin et al., 2016). Furthermore, spectral slope (S275-295) was calculated from the absorption spectra between 275 and 295 nm by the non-linear regression (Matlab R2018a) using the following Equation 5:
Where ag(λ) and ag(λ0) were the absorption coefficients at wavelengths λ and λ0, respectively, and S was the spectral slope. λ0 was 280 nm in this study (Lin et al., 2016).
In addition, the DO was analyzed by Winkler titration (Fu et al., 2020), and COD was measured by the potassium permanganate oxidation method (Lao et al., 2021). Chl a in the GF/F filter was extracted using 90% acetone and analyzed by the fluorometric method (Fu et al., 2020; Lao et al., 2021). Inorganic nutrients (NO3-N、NO2-N、PO4-P and SiO3-Si) were measured by a San++ continuous flow analyzer (Skalar, Netherlands). NH4-N concentration was determined by spectrophotometry (Fu et al., 2020). In April, the COD value at station Z3 was below the detection limit and will not participate in subsequent analysis.
2.3 Trophic state assessment
As a critical eutrophication level, eutrophication index (EI) defines the trophic eutrophication status based on the nutrient concentration, which is widely used by the State Oceanic Administrative of China (SOA) (Lao et al., 2021), and has been implemented in many earlier studies (Jiang Q. et al., 2019; Liu et al., 2011; Liang et al., 2015; Lao et al., 2021). The eutrophication index (EI) method served as the foundation for this study’s assessment of the trophic state. This index was calculated using the dissolved inorganic nitrogen (DIN), PO4-P and COD, according to the following Equation 6 (Jiang Q. et al., 2019; Liu et al., 2011; Liang et al., 2015; Lao et al., 2021):
where COD was the concentration of chemical oxygen demand (mg L–1), DIP was the concentration of PO4–P (mg L–1), and DIN was the concentration of NO3–N, NO2–N and NH4–N (mg L–1). EI offered a scale to assess the water’s trophic state: EI< 1 indicated oligotrophic; EI ≥ 1 indicated eutrophication, i.e., the higher the value the more eutrophic condition (Jiang Q. et al., 2019).
2.4 Sentinel-2 image processing
Along with in-situ data, Sentinel-2 satellite data (launched by the European space agency in 2015 and 2017) was also used to track the degree of eutrophication in water. This satellite was chosen because of its high spatial resolution (10–60 m), high temporal resolution (five days of review), and narrow bandwidth that made it ideal for monitoring Zhanjiang Bay. Data from the Sentinel-2 Level-1C (L1C) MSI was downloaded from the European Space Agency Copernicus Data Center at https://dataspace.copernicus.eu/. L1C products provided the top-of-atmosphere reflectance (TOA). Sen2Cor toolbox (version 2.9.0) was used to perform atmospheric correction on the L1C image in order to obtain the bottom-of-atmosphere (BOA) reflectance image (L2A product) for further processing and analysis in the SNAP (Sentinel Applications platform, Version 8.0) and ENVI (Environment for Visualizing Images, Version 5.6) software, the L2A image was resampled to 10 m spatial resolution.
2.5 The retrieval model and accuracy assessment
Firstly, based on the atmospheric correction method carried by Sen2Cor toolbox, we selected five ground matching points that were less affected by clouds and solar flares to verify the atmospheric correction effect, as well as the five points should match the station in cruise. The closer the ratio between the BOA reflectance of the ground matching point and the in-situ remote sensing reflectance was to 1, the better the atmospheric correction result of this band. The verification results were shown in Figure 2, and the atmospheric correction were generally satisfactory. Secondly, the in-situ remote sensing reflectance corresponding to the central wavelength of different bands in Sentinel-2 data was selected, and then was made up the band ratio and performed a unary linear fitting with ag(280) to check whether the band ratio could be used to retrieve ag(280). The band ratio combination refers to the research of Xu et al. (2018) and Shang et al. (2021). Actually, CDOM retrieval models using band ratios are less sensitive to atmospheric correction than using reflectance at a single band (Stramska and Stramski, 2005). Thirdly, the linear fitting formula composed of the selected band ratio and ag(280) was applied to Sentinel-2 data, in which the band ratio of BOA reflectance was the independent variable, and the retrieval of ag(280) was the dependent variable, thus completing the retrieval of ag(280). Finally, the EI and ag(280) were fitted by linear or nonlinear regression to explore the correlation between them. On the premise of strong correlation, the fitting model was applied to the retrieved ag(280) of Sentinel-2 data generated in the third step, where the independent variable was the retrieved ag(280) and the dependent variable was the retrieved EI, so as to complete the retrieval of EI in Sentinel-2 data.
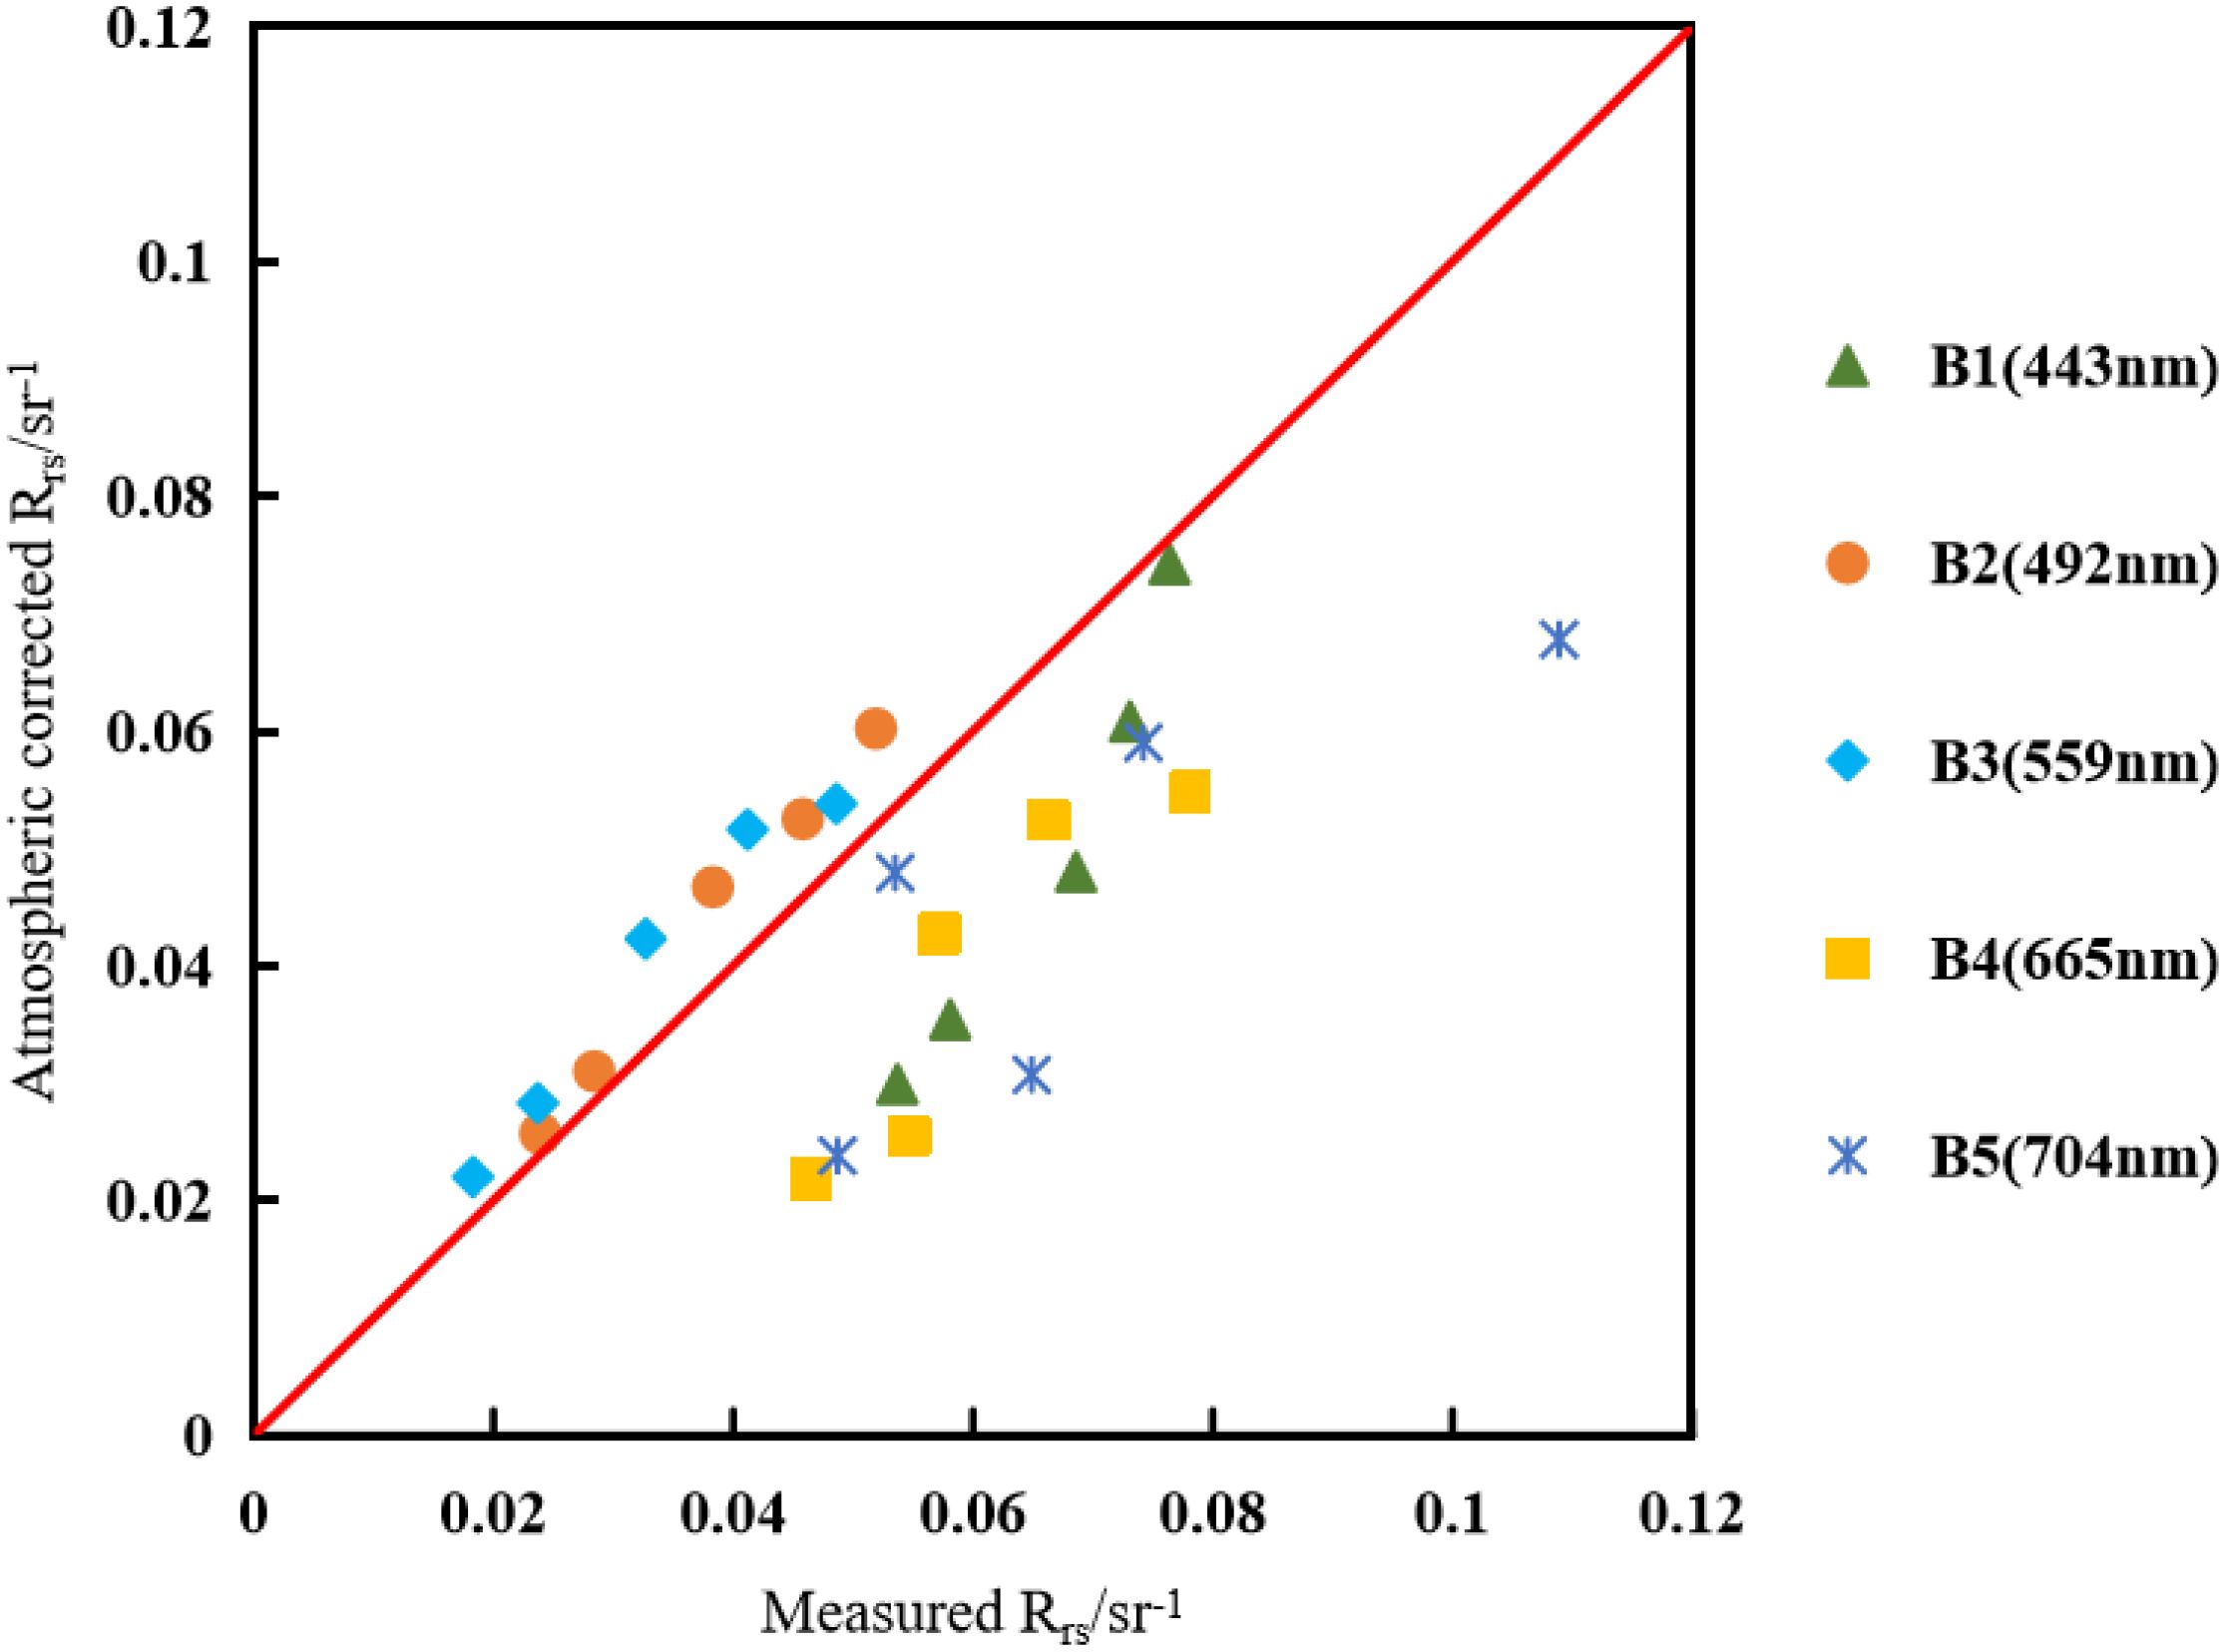
Figure 2. The relationship between the Rrs of the 5 satellite-ground matching samples via atmosphere correction from the Sentinel-2 data and the measured Rrs.
The accuracy of CDOM retrieval results was evaluated by calculating linear regression, the coefficient of determination (R2), the relative error (RE), the mean absolute percentage error (MAPE) and the root mean square error (RMSE). These accuracy assessment indexes were shown in Equations 7–11:
Where independent (explanatory) variable Xi, and dependent variable Yi, for i = 1,…, n subjects. The regression parameter a is the intercept (on the y axis), and the regression parameter b is the slope of the regression line. Where Z is the average of Xi.
3 Results
3.1 Physicochemical parameters
The water physicochemical values were presented in Table 1. Z26 station, which was close to the sewage of outfall thermal power plant and may be impacted by the high-temperature drainage of the thermal power plant, had the highest surface water temperature in that location in April and January. Additionally, due to local monthly variations in total solar radiation and sunshine duration, the surface water temperature in April was higher than that was in January. The Suixi River’s land runoff may have an impact on the station because the surface salinity at station Z25 was lowest in April and January. The salinity fluctuated significantly between 20.97 PSU and 30.23 PSU in January and only slightly between 23.51 PSU and 29.89 PSU in April. In April, the average Chl a concentration was 1.85 μg L-1, January’s average Chl a concentration was 3.26 μg L-1. In April and January, the DO concentration at Z25 station was at its lowest point (5.93 mg L-1 and 7.12 mg L-1, respectively). In comparison to April, January had a slightly higher overall concentration of DO. The highest COD measurements in April and January at Z5 and Z25, respectively, was 2.42 mg L-1 and 1.61 mg L-1.
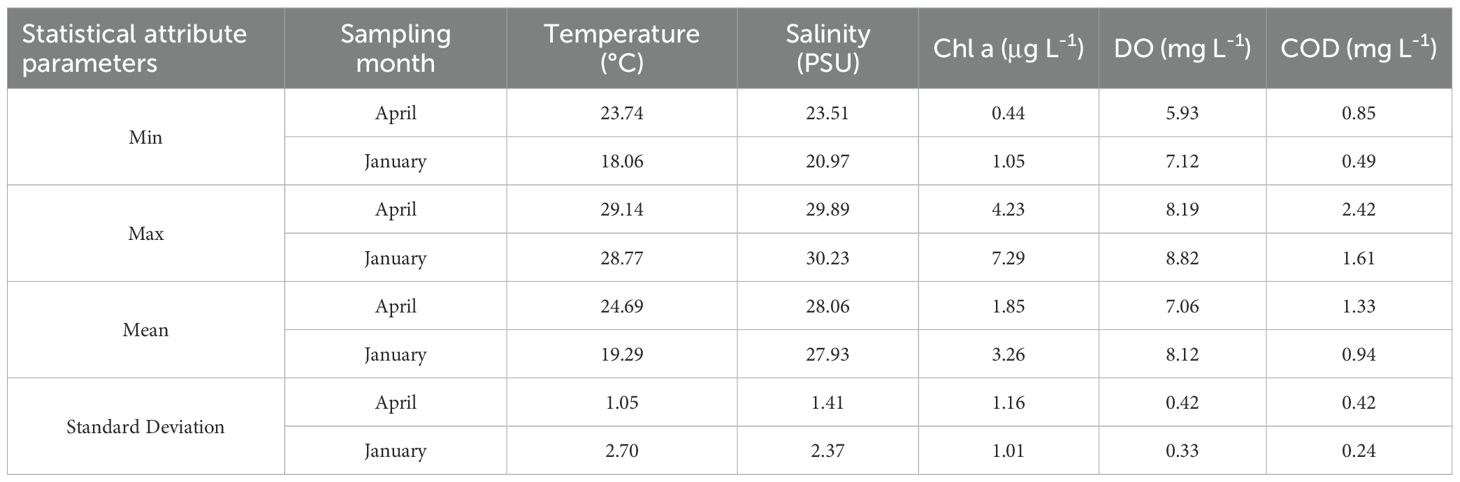
Table 1. Statistical distribution of water physicochemical parameters during the investigation in the Zhanjiang Bay.
3.2 Spatiotemporal variations of CDOM absorption coefficient
Figure 3 showed the spatial distribution characteristics of the surface CDOM absorption coefficient (ag(280)) in January and April, and the patterns in spatio-temporal variability were clear. The ag(280) in April ranged from 2.07 to 7.83 m-1, with an average of 3.92 m-1. The ag(280) in January ranged from 2.30 to 7.83 m-1, with an average of 3.47 m-1. As can be seen, there was little change in the surface ag(280) in Zhanjiang Bay in April and January, but there was a big change in the spatial distribution. From the inner bay to the outer bay, ag(280) showed a clear trend of gradually declining values. In general, the ag(280) in northern bay was larger than the southern bay’s, and the western bay’s was larger than the eastern bay’s. With the change from April to January, this characteristic difference gradually became less noticeable. Additionally, the Z25 station recorded the highest levels of ag(280) in January and April. We also compared the surface and bottom ag(280) and found that there was little difference between the surface and bottom (Figure 4).

Figure 3. Surface distributions of ag(280) in the Zhanjiang Bay during different seasons.

Figure 4. Comparison of surface and bottom ag(280) in January (a) and April (b).
3.3 CDOM absorption coefficient and salinity
Salinity is a crucial water mass tracer indicator. In coastal waters, the mixing of freshwater and seawater is the main factor influencing its change. It is generally accepted that if the salinity is below 20 PSU, river drives the variability in salinity and that the open sea will typically have a salinity of at least 32 PSU. Salinity during the survey ranged from 20 to 32 PSU, indicating a reasonably robust mixing of freshwater and saltwater in this region. Figure 5 illustrated the significant negative correlation between the surface ag(280) and salinity in April and January (April: R2 = 0.96, P<0.001; January: R2 = 0.78, P<0.001). It showed that terrestrial and marine CDOM in the Zhanjiang Bay behaved conservatively during the mixing process.
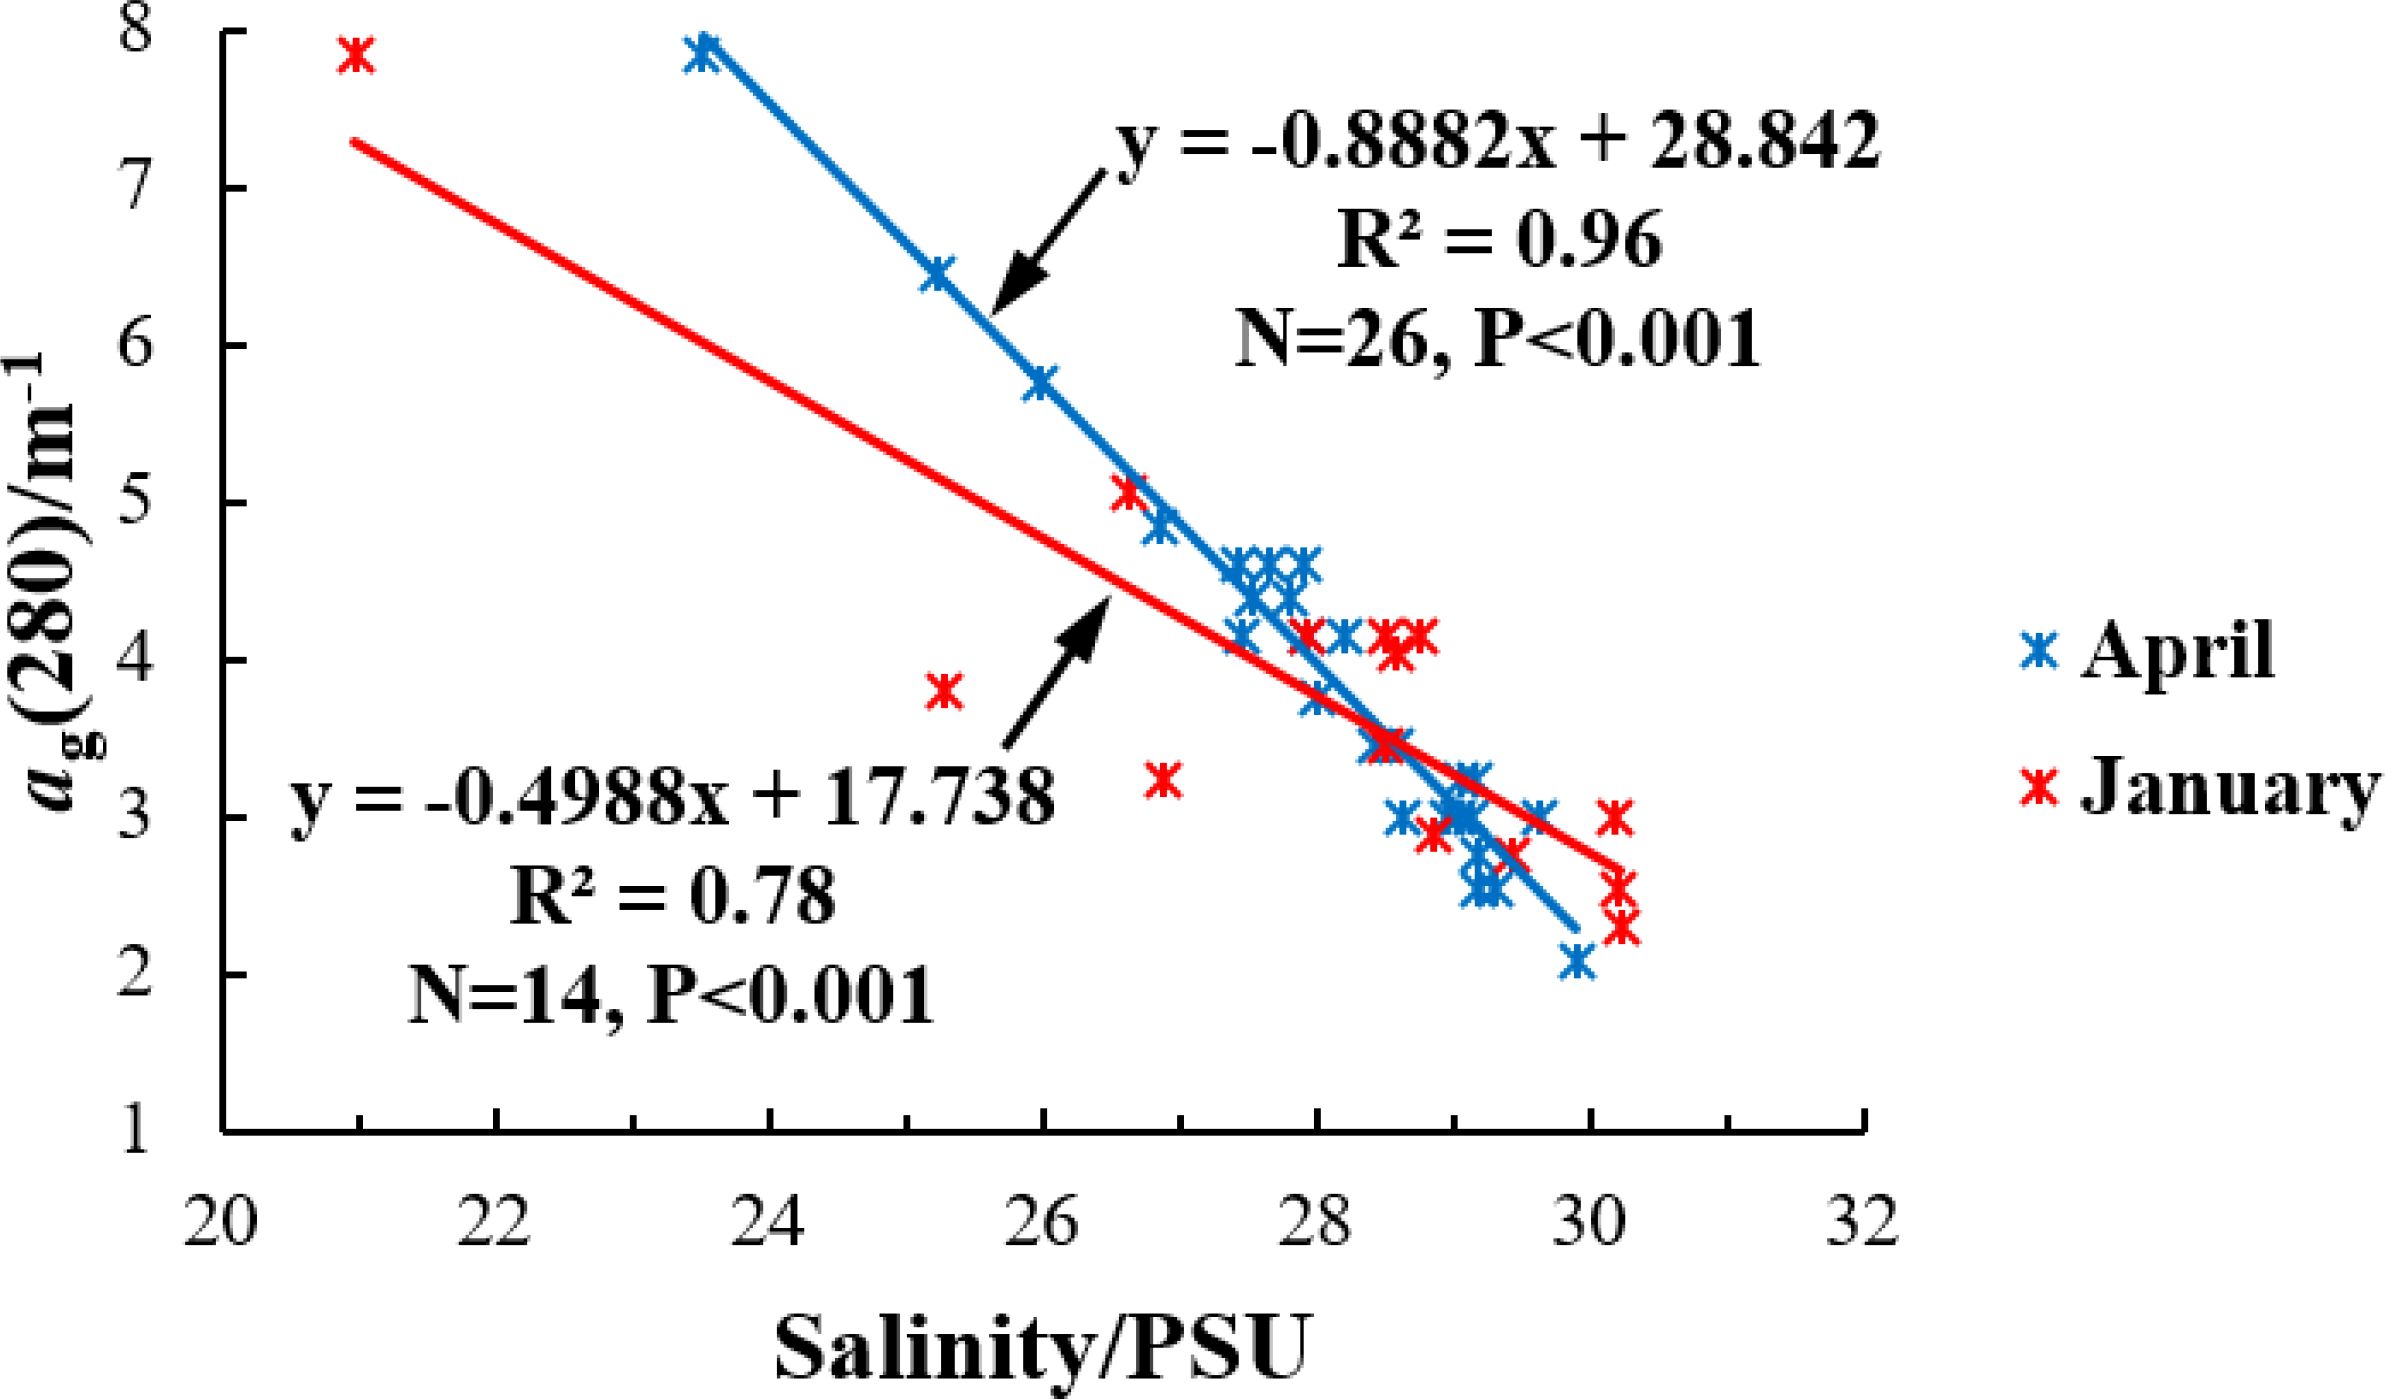
Figure 5. Salinity versus ag(280) in April and January.
3.4 CDOM spectral slope and salinity
The main representation of the molecular weight of CDOM in water is S275-295. The molecular weight of CDOM increases as S275–295 decreases (Helms et al., 2008). The low value suggests that it is connected to input from the terrestrial CDOM (Zhou et al., 2018). The S275–295 varied between 0.016 and 0.029 nm-1 during the survey, with an average value of 0.02 nm-1. The lowest value was observed at Z25 in January, which was close to the Suixi River Estuary and an area where aquaculture was practiced. This location may be impacted by the high molecular organic matter brought by the terrigenous materials of the Suixi River and aquaculture activities. Z14, which was outside the bay and was less impacted by terrigenous materials, recorded the maximum S275–295 value in April. Figure 6 showed a significant but nonlinear positive correlation between the S275–295 and salinity (April: R2 = 0.51; P<0.001; January: R2 = 0.57; P<0.001), which was consistent with the common mixed model of freshwater end-member and seawater end-member (Zhou et al., 2018).

Figure 6. Salinity versus S275–295 in April and January.
3.5 Correlations between the ag(280) and the EI
The EI in the Zhanjiang Bay varied between 0.07 and 50.43 during the survey, with an average value of 7.32. Except for the EI of Z13, and Z14 in spring, which were less than 1, and other stations were all in the state of eutrophication. The station with the most serious eutrophication was Z25 in winter. According to the standards of EI, Zhanjiang Bay was basically in the state of eutrophication, with obvious enrichment of nutrients in seawater.
The EI and ag(280) were found to have a strong nonlinear relationship (R2 = 0.80, P<0.01, as shown in Figure 7). The classification standard of nutrient status in the Zhanjiang Bay was proposed by using ag(280) based on this regression model. When EI equaled 1, ag(280) equaled 1.92 based on nonlinear fitting formula in Figure 7. According to the EI scale, if 1.92≤ag(280), it corresponded to eutrophication, and when ag(280)<1.92, it corresponded to oligotrophic. i.e., the higher ag(280) the more eutrophic condition.
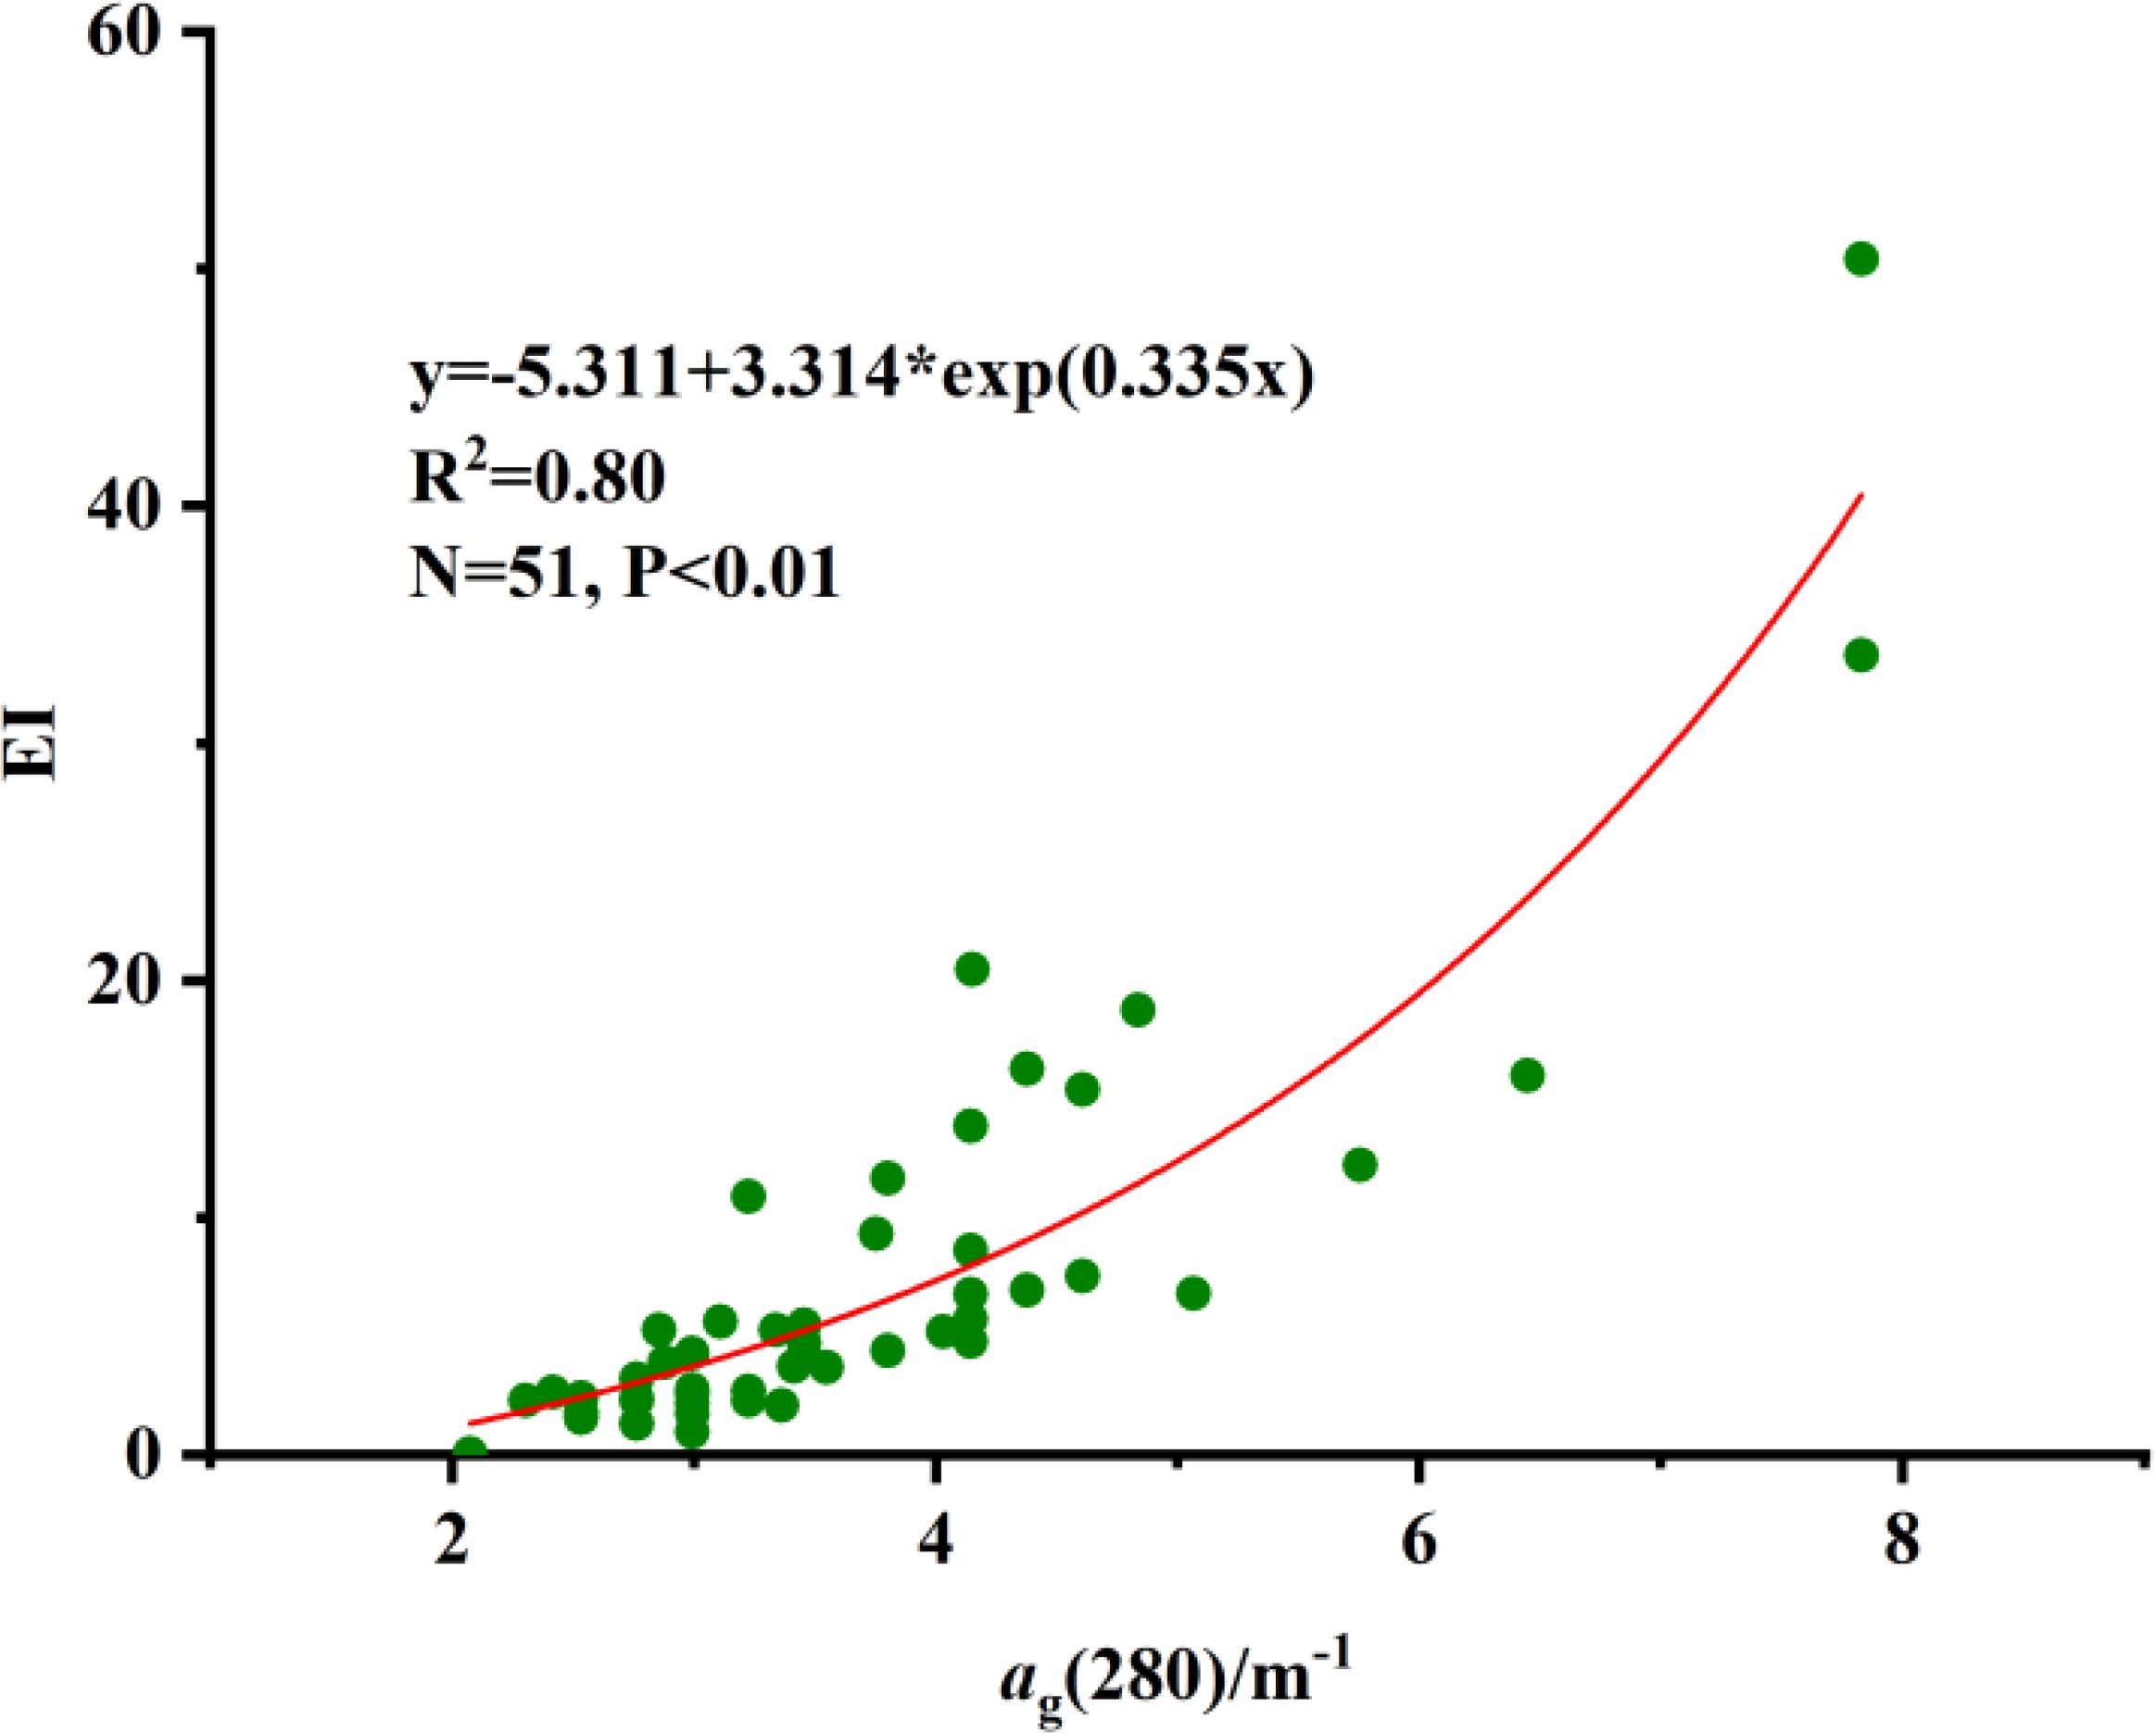
Figure 7. Correlations between the ag(280) and the EI.
3.6 EI retrieved from Sentinel-2 image
Some studies have proposed to apply the band ratio model to Sentinel-2 data, and have achieved good CDOM estimation results (Xu et al., 2018; Shang et al., 2021). Based on previous studies (Xu et al., 2018; Shang et al., 2021), a CDOM retrieval model (y=5.9657x+0.9074, x=Rrs(704)/Rrs(492), R2 = 0.70, N=23, P<0.001, as show in Figure 8) was established based on the in-situ remote sensing reflectance at 704 nm and 492 nm and measured ag(280). In the band setting of Sentine-2, 704 and 492 nm correspond to the central wavelengths of B5 and B2 of Sentinel-2, respectively. Unfortunately, there was no suitable Sentinel-2 image in the time period of the survey in April, but we obtained an image with high quasi-synchronous quality in January. We applied the CDOM retrieval model to Sentine-2 image in January and exported satellite retrieval values corresponding to 26 stations. The relative error between the retrieval results of the satellite data after atmospheric correction and the measured ag(280) at each station was shown in Figure 9. The mean absolute percentage error between retrieved values and measured values was calculated to be 19.3%, and the RMSE was 1.09 m-1. For coastal case-II waters, the retrieval accuracy was within an acceptable range of precision. Subsequently, we combined the nonlinear relationship between ag(280) and EI (y=-5.311 + 3.314*exp(0.335x), x=ag(280), R2 = 0.80, N=51, P<0.01, as shown in Figure 7) to obtain EI. Figure 10 showed the relative error between satellite derived EI and measured EI at each station. For EI, the mean absolute percentage error between retrieved values and measured values was calculated to be 46.2%, and the RMSE was 9.3.

Figure 8. The relationship between in-situ measured remote sensing reflectance of band ratio and ag(280).
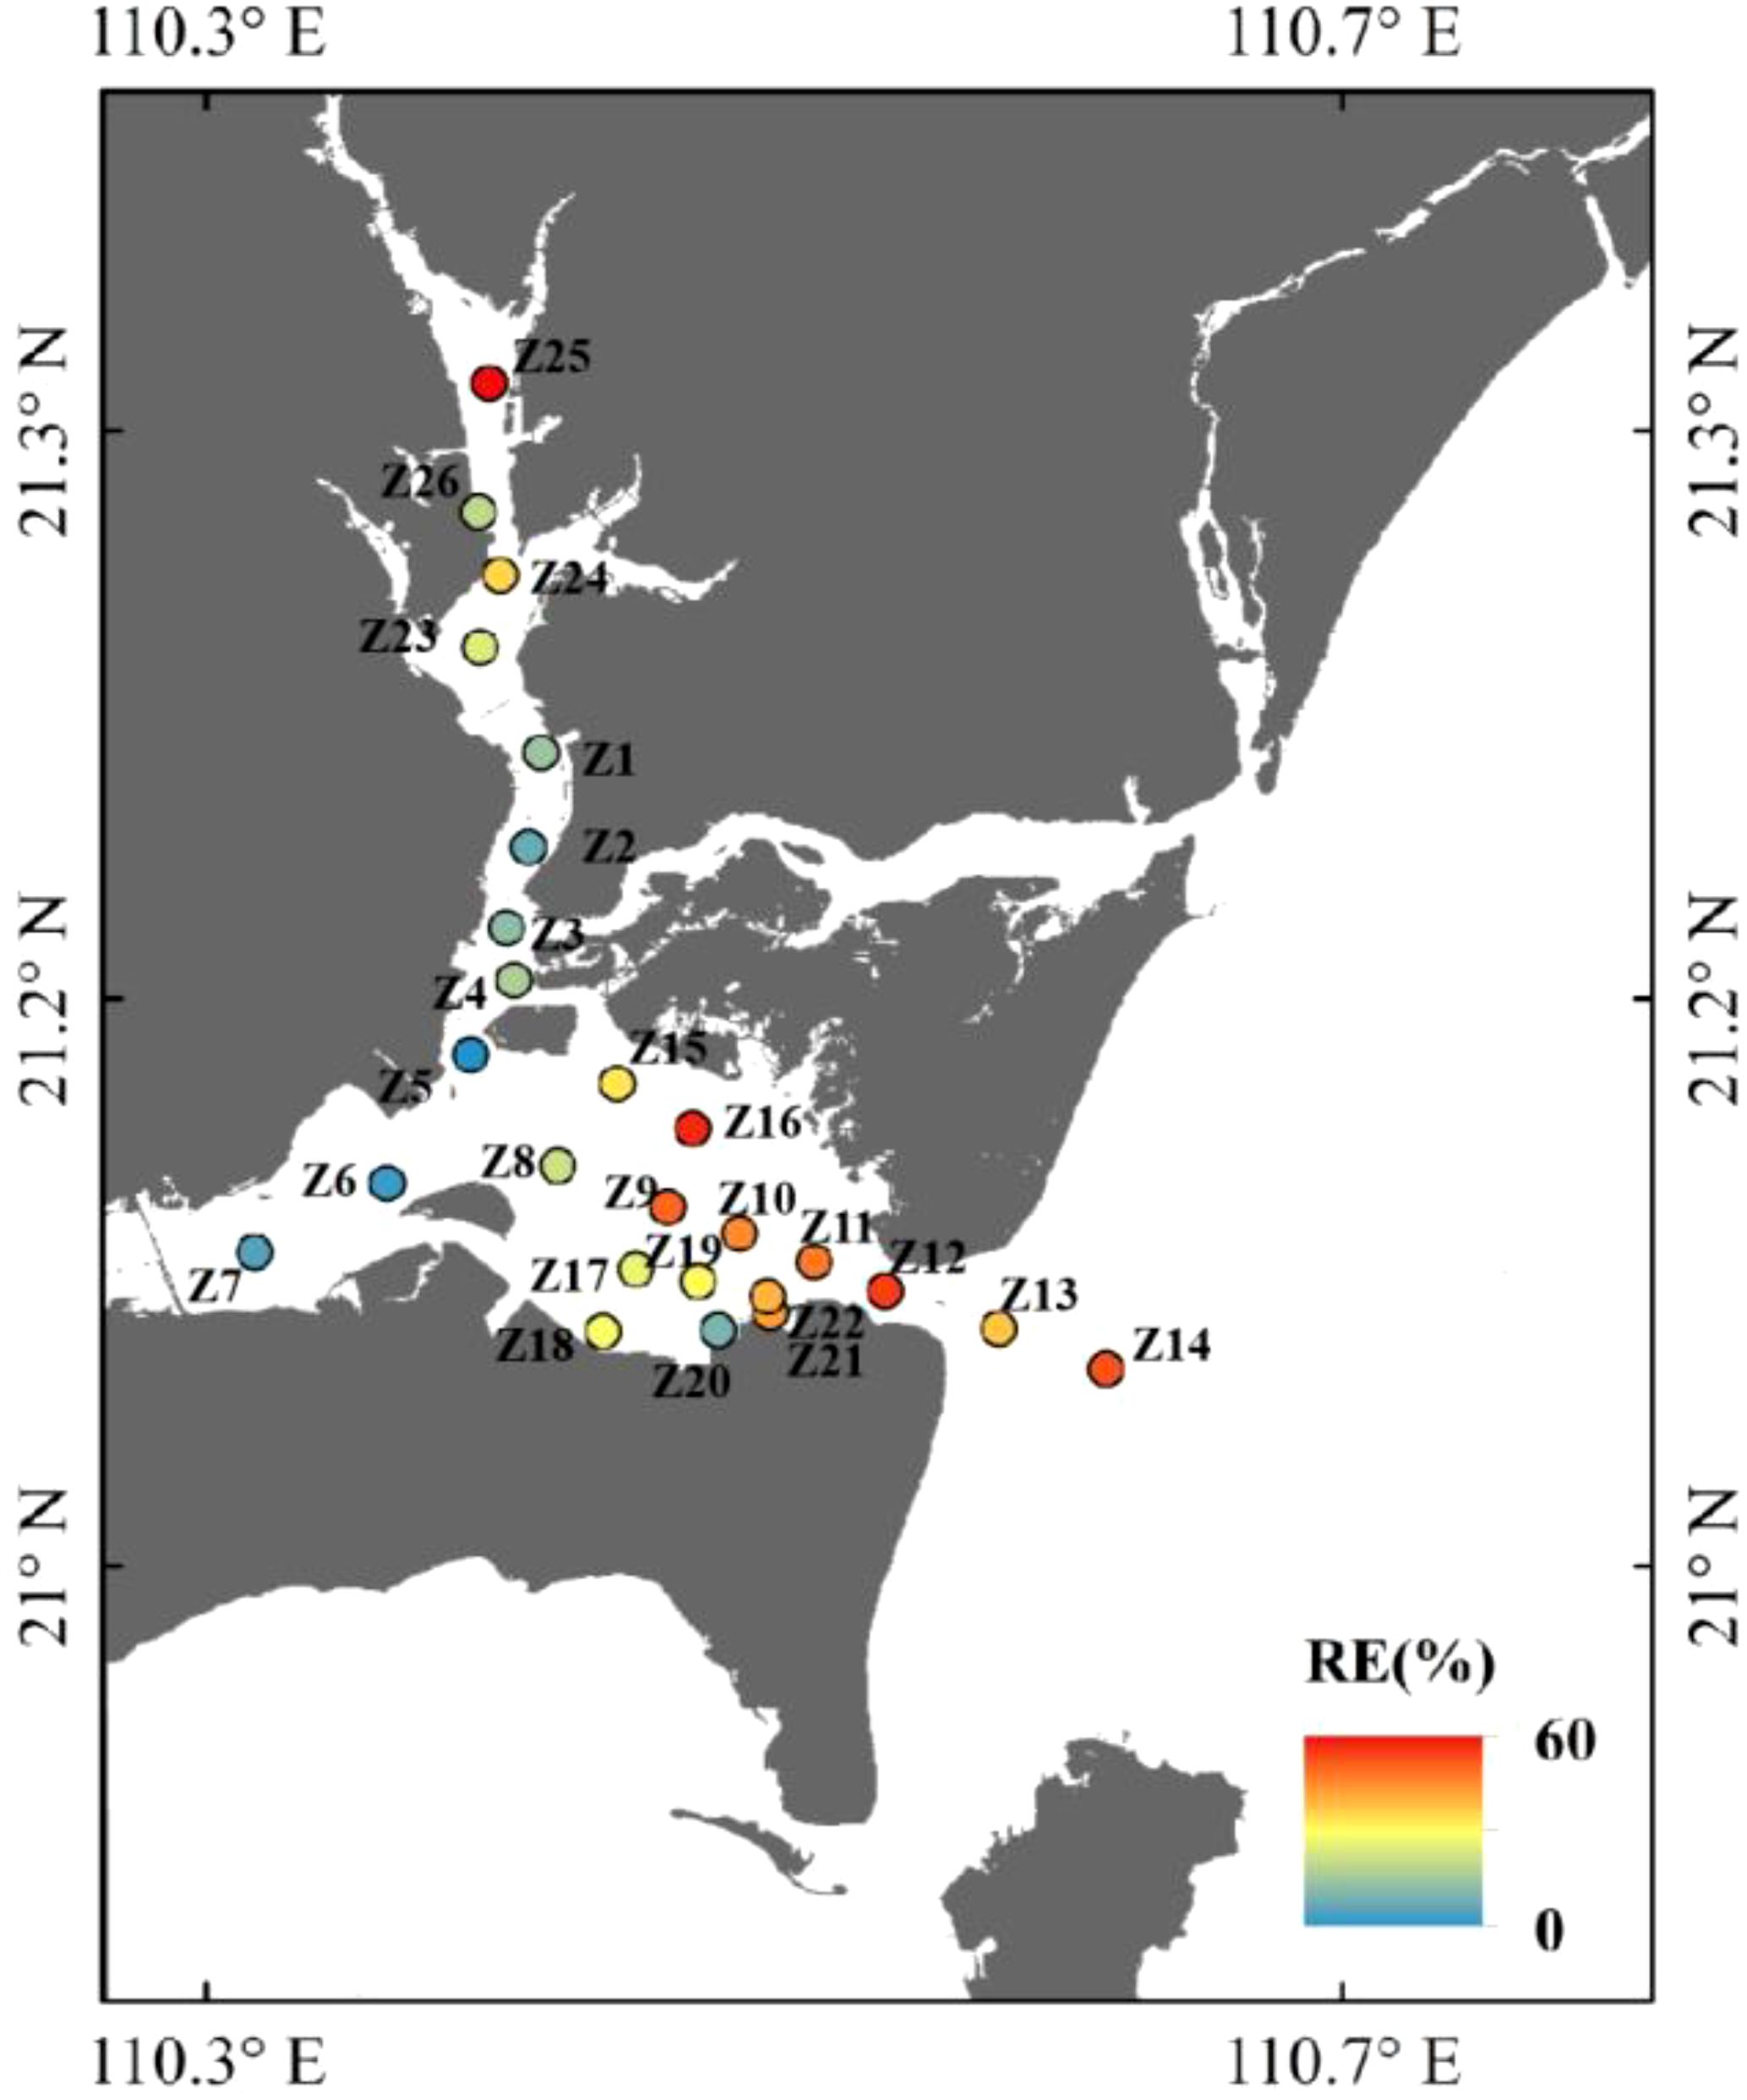
Figure 9. Relative error between satellite derived ag(280) and measured ag(280).

Figure 10. Relative error between satellite derived EI and measured EI.
4 Discussion
4.1 Sources of CDOM in the Zhanjiang Bay
Generally speaking, the sources of CDOM in the coastal bays was mainly affected by many factors such as land runoff, phytoplankton production, bottom sediment resuspension and microbial activities (Li et al., 2014). Given the small difference in ag(280) between the surface and bottom water in Zhanjiang Bay in April and January (Figure 4), as well as the bay’s narrow topography and poor hydrodynamic conditions, the resuspension of bottom sediment should have little impact on the release of organic matter in the bay unless the time for CDOM release from sediment to water was much longer than the time for physical mixing (Li et al., 2014). In terms of land runoff and phytoplankton production, the ag(280) of surface water in April and January showed a significant negative correlation with salinity (Figure 5), but the ag(280) and Chl a showed a relatively weak correlation in different months (April: R2 = 0.33, P<0.001; January: R2 = 0.54, P<0.001). Therefore, it appeared that the control of CDOM abundance was influenced differently by phytoplankton production and land runoff.
According to previous studies, the CDOM absorption coefficient sometimes appeared short ultraviolet absorption shoulders in the 260–290 nm band range. These shoulders had been reported in the Bohai Bay (Li et al., 2014), the North Pacific (Yamashita and Tanoue, 2009), the St. Lawrence Estuarine (Xie et al., 2012) and the South Bay of the North Sea (Warnock et al., 1999). Although the exact molecular process by which these shoulders form was unknown, they were related to proteins and other bio-molecules, in which bacteria and algae play significant roles (Li et al., 2014). In this study, the most CDOM absorption curves of surface water in Zhanjiang Bay in April and January showed smooth curve that decreased exponentially with the increase of wavelength but no obvious short ultraviolet absorption shoulders (Figure 11). Combined with the correlation between ag(280) and Chl a (April: R2 = 0.33, P<0.001; January: R2 = 0.54, P<0.001), it was obvious that the algae in Zhanjiang Bay had limited influence on CDOM abundance in spring and winter. In addition, the most of CDOM molecular weights in Zhanjiang Bay in April and January was larger than 1 kDa, with a high molecular weight, which was also not consistent with the molecular characteristics of algal of CDOM (Li et al., 2014). Furthermore, according to the absorption formula of provided by Bai et al (Bai et al., 2013), the contribution ratio of CDOM absorption by algae sources could be calculated. The average ratio in April and January was 5.63% and 8.11% respectively, which also showed that the contribution of CDOM from algae sources to CDOM in Zhanjiang Bay was low.

Figure 11. Spectra of CDOM absorption coefficient in January (a) and April (b).
Rivers served as bridges between terrigenous materials and bays. Suixi river was the main river and the main source of CDOM in Zhanjiang Bay. According to in-situ data, the concentration of CDOM in Zhanjiang Bay showed a decreasing trend from the inner bay to the outer bay in April and January (Figure 3), indicating the important impact of river input on the organic matter in Zhanjiang Bay. In April and January, the ag(280) of surface water showed a significant negative correlation with salinity (Figure 5), the S275–295 and salinity showed a significant but nonlinear positive correlation (Figure 6). Therefore, the transportation of CDOM showed a conservative behavior, indicating that in spring and winter, river input may dominate the abundance and composition of CDOM in Zhanjiang Bay. CDOM concentration had good consistency with salinity and runoff of Suixi River (April: 3798899.8m3; January: 932850m3, Harrigan et al., 2020).
Moreover, it is worth noting that the aforementioned analysis only involves data from two specific moments, which helps us to evaluate two seasonal scenarios, so our next frontier is to analyze the CDOM spatiotemporal variability throughout the annual cycle.
4.2 CDOM absorption coefficient applications for monitoring and assessing eutrophication
According to the calculation formula of EI, the value of EI was determined by the concentration of DIN, DIP and COD, which not only ignored the influence of ocean color factor on eutrophication of water, but also the determination process of these chemical parameters was time-consuming and laborious, and it was difficult to realize rapid and real-time monitoring and management. CDOM absorption coefficient was not only an important ocean color factor, but also included nutrients (Vähätalo and Zepp, 2005; Zhang Z. et al., 2018). Moreover, measuring CDOM absorption coefficient is relatively easy. Therefore, the CDOM absorption coefficient could be used to describe eutrophication level instead of EI, so as to realize rapid monitoring of eutrophication in the sea area. The nonlinear regression model of ag(280) and EI in this study also confirmed the feasibility of using CDOM absorption coefficient to describe eutrophication.
Using the absorption coefficient of CDOM to monitor the eutrophication level reflected a great advantage that CDOM was one of the three elements of ocean color remote sensing. In this paper, we indirectly obtained the eutrophication index through CDOM remote sensing. Although the accuracy of the remote sensing results of the eutrophication index was disturbed by many factors (such as the atmospheric correction method, the satellite transit time was not synchronized with the field survey time, etc.), this was a meaningful experiment, which provided a new idea for eutrophication remote sensing monitoring. Next, we will further improve the retrieval accuracy to obtain the spatial-temporal distribution characteristics of eutrophication. Satellite remote sensing had the advantages of high spatial and temporal resolution (Olmanson et al., 2020), and the CDOM retrieval algorithms for coastal and inland case-II waters with complex optical properties had been developed successively (Ruescas et al., 2018; Xu et al., 2018; Shang et al., 2021; Al-Kharusi et al., 2020). At present, CDOM retrieval theory and application were relatively mature. In this study, the adopted band combination B5/B2 reflected two important characteristics of CDOM in the coastal waters (Chen C. et al., 2003): strong absorption in the short band (negatively correlated with the reflectance in the blue light band), and the concentration of terrestrial CDOM showed the same trend as that of suspended solids in water (positively correlated with the reflectance in the red light band). Consequently, by means of remote sensing, it could not only carry out long-term and large-scale dynamic monitoring of eutrophication level, but also make up for the shortcomings of using COD and nutrients to assess the nutritional status, which is an excellent monitoring and evaluation method.
However, the limitations and deficiencies of the method should be recognized. Firstly, due to the complexity of the optical properties of case-II waters and the uncertainty of Sen2Cor atmospheric correction method, there was always an inevitable disparity between the in-situ reflectance and bottom-of-atmosphere corrected reflectance in case-II waters, which was one of the reasons for the difficulty of remote sensing retrieval in case-II waters. Secondly, when the primary source of CDOM is phytoplankton, using CDOM remote sensing to assess the level of eutrophication in water is also an effective approach (Shang et al., 2021; Zhang et al., 2018; Guan et al., 2024). However, it should be noted that phytoplankton dominate the composition of CDOM, which mostly occurs in inland water (Shang et al., 2021; Guan et al., 2024). The main source of CDOM in coastal surface water, especially in estuaries/bays, comes from land runoff, unless algal blooms occur in the area (Kong et al., 2017; Otis et al., 2004; Chen et al., 2004; Zhao et al., 2009). In addition, if the behavior of CDOM is not conservative, whether CDOM and EI still maintain a good nonlinear relationship, and whether remote sensing approach can still be applicable, remains to be further explored. Thirdly, from Figure 9 and Figure 10, we can see that the serious estimation errors in ag(280) and EI obtained from the satellite retrieval at stations Z9-Z12, Z14, Z16, and Z25. This may be due to the high dynamic changes in the water of Z11-Z14 located at the mouth and outside of the bay, and the time difference between satellite transit and in-situ measurement was 2 days, resulting in a certain difference between the retrieved values and the measured values. The Z9, Z10, Z16, and Z25 stations are located near the aquaculture area and may be affected by sewage or breeding activities, there may be high variability in CDOM, DIN, DIP, and COD in the water of these regions, leading to significant deviations in satellite retrieval values. The relative error between the satellite retrieval values and the measured values was relatively low at stations Z5-Z7, which may be due to the fact that these stations are located in areas with weak water exchange capacity, and the Donghai dam (Figure 1) blocks the flow of seawater on the west side of Zhanjiang Bay, making the water mass properties relatively stable. Moreover, the CDOM retrieval model only involves data from spring, and it cannot be denied that the model has certain limitations. In the future, based on the premise that the measurement time and the satellite overpass time remain on the same day, research would continue to be carried out in different seasons of the year, to compare the retrieved EI and measured EI, and to analyze whether the relationship between CDOM and EI could remain unchanged under different hydrological conditions. Additionally, multiple satellite sensors (Landsat-8-OLI, MERIS-Envisat, Sentinel-3-OLCI, MODIS-Aqua) have been used for CDOM retrieval of coastal water (Mabit et al., 2022; Cao et al., 2018; Ruescas et al., 2018). Next, we will further utilize multi-source satellite remote sensing data to conduct research on eutrophication, so as to improve the eutrophication monitoring and ecosystem management level.
5 Conclusions
In this study, we gathered optical data of CDOM absorption coefficient and spectral slope in Zhanjiang Bay, examined how CDOM properties varied during spring and winter, discussed the effects of salinity and algae activity on CDOM, and proposed the viability of using CDOM remote sensing to monitor the eutrophication of the bay. S275–295 and ag(280) of surface water both had significant correlations with salinity in April and January, respectively. As a result, CDOM transportation exhibited a conservative tendency, suggesting that river inflow may predominate CDOM abundance and composition in Zhanjiang Bay during spring and winter. However, there was no obvious short ultraviolet absorption shoulder in the absorption curve of CDOM, and the correlation between CDOM and Chl a was weak, so the effect of algal activity on CDOM was not significant. In addition, an empirical model was established using the band ratio of Rrs(704)/Rrs(492) to retrieve ag(280). At the same time, based on a nonlinear regression model between ag(280) and EI, EI was retrieved indirectly through ag(280) retrieval of Sentinel-2, which laid a foundation for the assessment of eutrophication level by using the CDOM absorption coefficient and provided a new strategy for eutrophication monitoring.
Data availability statement
The raw data supporting the conclusions of this article will be made available by the authors, without undue reservation.
Author contributions
YZ: Conceptualization, Data curation, Methodology, Software, Validation, Writing – original draft, Writing – review & editing. GY: Conceptualization, Investigation, Methodology, Software, Validation, Visualization, Writing – review & editing. DF: Funding acquisition, Project administration, Resources, Writing – review & editing. FC: Formal Analysis, Supervision, Writing – review & editing. YL: Project administration, Writing – review & editing. RD: Visualization, Writing – review & editing.
Funding
The author(s) declare that financial support was received for the research and/or publication of this article. This study was supported by the National Key Research and Development Program of China (No. 2022YFC3103101); Key Special Project for Introduced Talents Team of Southern Marine Science and Engineering Guangdong Laboratory (No. GML2021GD0809); National Natural Science Foundation of China (No. 42206187); Key projects of the Guangdong Education Department (No. 2023ZDZX4009); Program for scientific research start-upfunds of Guangdong Ocean University (060302112404).
Conflict of interest
The authors declare that the research was conducted in the absence of any commercial or financial relationships that could be construed as a potential conflict of interest.
Generative AI statement
The author(s) declare that no Generative AI was used in the creation of this manuscript.
Publisher’s note
All claims expressed in this article are solely those of the authors and do not necessarily represent those of their affiliated organizations, or those of the publisher, the editors and the reviewers. Any product that may be evaluated in this article, or claim that may be made by its manufacturer, is not guaranteed or endorsed by the publisher.
References
Al-Kharusi E. S., Tenenbaum D. E., Abdi A. M., Kutser T., Karlsson J., Bergström A. K., et al. (2020). Large-scale retrieval of colored dissolved organic matter in northern lakes using Sentinel-2 data. Remote Sens. 12, 157. doi: 10.3390/rs12010157
Bai Y., Pan D., Cai W. J., He X., Wang D., Tao B., et al. (2013). Remote sensing of salinity from satellite-derived CDOM in the Changjiang River dominated East China Sea. J. Geophys. Res.: Oceans. 118, 227–243. doi: 10.1029/2012JC008467
Birdwell J. E. and Engel A. S. (2010). Characterization of dissolved organic matter in cave and spring waters using UV-Vis absorbance and fluorescence spectroscopy. Org. Geochem. 41, 270–280. doi: 10.1016/j.orggeochem.2009.11.002
Boss E., Pegau W. S., Zaneveld J. R. V., and Barnard A. H. (2001). Spatial and temporal variability of absorption by dissolved material at a continental shelf. J. Geophys. Res.: Oceans 106, 9499–9507. doi: 10.1029/2000JC900008
Bricaud A., Morel A., and Prieur L. (1981). Absorption by dissolved organic matter of the sea (yellow substance) in the UV and visible domains. Limnol. Oceanogr. 26, 43–53. doi: 10.4319/lo.1981.26.1.0043
Cao F., Tzortziou M., Hu C., Mannino A., Fichot C. G., Del Vecchio R., et al. (2018). Remote sensing retrievals of colored dissolved organic matter and dissolved organic carbon dynamics in North American estuaries and their margins. Remote Sens. Environ. 205, 151–165. doi: 10.1016/j.rse.2017.11.014
Carlson C. A., Ducklow H. W., and Michaels A. F. (1994). Annual flux of dissolved organic carbon from the euphotic zone in the northwestern Sargasso Sea. Nature 371, 405–408. doi: 10.1038/371405a0
Chen R. F., Bissett P., Coble P., Conmy R., Gardner G. B., Moran M. A., et al. (2004). Chromophoric dissolved organic matter (CDOM) source characterization in the Louisiana Bight. Mar. Chem. 89, 257–272. doi: 10.1016/j.marchem.2004.03.017
Chen F., Lao Q., Jia G., Chen C., Zhu Q., and Zhou X. (2019). Seasonal variations of nitrate dual isotopes in wet deposition in a tropical city in China. Atmos. Environ. 196, 1–9. doi: 10.1016/j.atmosenv.2018.09.061
Chen C., Shi P., and Zhan H. (2003). A local algorithm for estimation of yellow substance (gelbstoff) in coastal waters from SeaWiFS data: Pearl River estuary, China. Int. J. Remote Sens. 24, 1171–1176. doi: 10.1080/0143116021000047901
Chen W., Westerhoff P., Leenheer J. A., and Booksh K. (2003). Fluorescence excitation-emission matrix regional integration to quantify spectra for dissolved organic matter. Environ. Sci. Technol. 37, 5701–5710.2. doi: 10.1021/es034354c
Coble P. G., Del Castillo C. E., and Avril B. (1998). Distribution and optical properties of CDOM in the Arabian Sea during the 1995 Southwest Monsoon. Deep Sea Res. Part II. 45, 2195–2223. doi: 10.1016/S0967-0645(98)00068-X
Das S., Das I., Giri S., Chanda A., Maity S., Lotliker A. A., et al. (2017). Chromophoric dissolved organic matter (CDOM) variability over the continental shelf of the northern Bay of Bengal. Oceanologia 59, 271–282. doi: 10.1016/j.oceano.2017.03.002
Dias A., Kurian S., Thayapurath S., and Pratihary A. K. (2021). Variations of colored dissolved organic matter in the mandovi estuary, goa, during spring inter-monsoon: A comparison with COVID-19 outbreak imposed lockdown period. Front. Mar Sci. 8, 638583. doi: 10.3389/fmars.2021.638583
Fichot C. G. and Benner R. (2012). The spectral slope coefficient of chromophoric dissolved organic matter (S275-295) as a tracer of terrigenous dissolved organic carbon in river-influenced ocean margins. Limnol. Oceanogr. 57, 1453–1466. doi: 10.4319/lo.2012.57.5.1453
Fu D., Zhong Y., Chen F., Yu G., and Zhang X. (2020). Analysis of dissolved oxygen and nutrients in Zhanjiang Bay and the adjacent sea area in spring. Sustainability 12, 889. doi: 10.3390/su12030889
Green S. A. and Blough N. V. (1994). Optical absorption and fluorescence properties of chromophoric dissolved organic matter in natural waters. Limnol. Oceanogr. 39, 1903–1916. doi: 10.4319/lo.1994.39.8.1903
Guan Y., Yu G., Jia N., Han R., and Huo D. (2024). Spectral characteristics of dissolved organic matter in Plateau Lakes: Identifying eutrophication indicators in Southwest China. Ecol. Inform. 82, 102703. doi: 10.1016/j.ecoinf.2024.102703
Hansell D. A., Carlson C. A., Repeta D. J., and Schlitzer R. (2009). Dissolved organic matter in the ocean: A controversy stimulates new insights. Oceanography 22, 202–211. doi: 10.5670/oceanog.2009.109
Harrigan S., Zoster E., Cloke H., Salamon P., and Prudhomme C. (2020). Daily ensemble river discharge reforecasts and real-time forecasts from the operational Global Flood Awareness System. Hydrol. Earth Syst. Sci. 27, 1–22. doi: 10.5194/hess-27-1-2023
Hedges J. I. (1992). Global biogeochemical cycles: progress and problems. Mar. Chem. 39, 67–93. doi: 10.1016/0304-4203(92)90096-S
Helms J. R., Stubbins A., Ritchie J. D., Minor E. C., Kieber D. J., and Mopper K. (2008). Absorption spectral slopes and slope ratios as indicators of molecular weight, source, and photobleaching of chromophoric dissolved organic matter. Limnol. Oceanogr. 53, 955–969. doi: 10.4319/lo.2008.53.3.0955
Jiang Z., Gao Y., Chen Y., Du P., Zhu X., Liao Y., et al. (2019). Spatial heterogeneity of phytoplankton community shaped by a combination of anthropogenic and natural forcings in a long narrow bay in the East China Sea. Estuarine Coastal Shelf Sci. 217, 250–261. doi: 10.1016/j.ecss.2018.11.028
Jiang Q., He J., Wu J., Hu X., Ye G., and Christakos G. (2019). Assessing the severe eutrophication status and spatial trend in the coastal waters of Zhejiang province (China). Limnol. Oceanogr. 64, 3–17. doi: 10.1002/lno.11013
Ke Z., Chen D., Liu J., and Tan Y. (2020). The effects of anthropogenic nutrient inputs on stable carbon and nitrogen isotopes in suspended particulate organic matter in Jiaozhou Bay, China. Cont. Shelf Res. 208, 104244. doi: 10.1016/j.csr.2020.104244
Kim J. and Kim G. (2015). Importance of colored dissolved organic matter (CDOM) inputs from the deep sea to the euphotic zone: Results from the East (Japan) Sea. Mar. Chem. 169, 33–40. doi: 10.1016/j.marchem.2014.12.010
Kong X., Sun Y., Su R., and Shi X. (2017). Real-time eutrophication status evaluation of coastal waters using support vector machine with grid search algorithm. Mar. Pollut. Bull. 119, 307–319. doi: 10.1016/j.marpolbul.2017.04.022
Lao Q., Liu G., Shen Y., Su Q., and Lei X. (2021). Biogeochemical processes and eutrophication status of nutrients in the northern Beibu Gulf, South China. J. Earth Syst. Sci. 130, 1–14. doi: 10.1007/s12040-021-01706-y
Lei X., Pan J., and Devlin A. T. (2018). Mixing behavior of chromophoric dissolved organic matter in the Pearl River Estuary in spring. Cont. Shelf Res. 154, 46–54.4. doi: 10.1016/j.csr.2018.01.004
Li J., Cao R., Lao Q., Chen F., Chen C., Zhou X., et al. (2020). Assessing seasonal nitrate contamination by nitrate dual isotopes in a monsoon-controlled bay with intensive human activities in South China. Int. J. Environ. Res. Public Health 17, 1921. doi: 10.3390/ijerph17061921
Li G., Liu J., Ma Y., Zhao R., Hu S., Li Y., et al. (2014). Distribution and spectral characteristics of chromophoric dissolved organic matter in a coastal bay in northern China. J. Environ. Sci. 26, 1585–1595. doi: 10.1016/j.jes.2014.05.025
Liang S. K., Pearson S., Wu W., Ma Y. J., Qiao L. L., Wang X. H., et al. (2015). Research and integrated coastal zone management in rapidly developing estuarine harbors: A review to inform sustainment of functions in Jiaozhou Bay, China. Ocean Coast Manage. 116, 470–477. doi: 10.1016/j.ocecoaman.2015.09.014
Lin H., Cai Y., Sun X., Chen G., Huang B., Cheng H., et al. (2016). Sources and mixing behavior of chromophoric dissolved organic matter in the Taiwan Strait. Mar. Chem. 187, 43–56. doi: 10.1016/j.marchem.2016.11.001
Ling Z., Sun D., Wang S., Qiu Z., Huan Y., Mao Z., et al. (2020). Remote sensing estimation of colored dissolved organic matter (CDOM) from GOCI measurements in the Bohai Sea and Yellow Sea. Environ. Sci. Pollut. Res. 27, 6872–6885. doi: 10.1007/s11356-019-07435-6
Liu S., Lou S., Kuang C., Huang W., Chen W., Zhang J., et al. (2011). Water quality assessment by pollution-index method in the coastal waters of Hebei Province in western Bohai Sea, China. Mar. Pollut. Bull. 62, 2220–2229. doi: 10.1016/j.marpolbul.2011.06.021
Liu Y., Shen F., and Li X. (2014). “Light absorption properties of colored dissolved organic matter (CDOM) in adjacent waters of the Changjiang Estuary during a flood season: implication for DOC estimation,” in Proceedings of Society of Photo-Optical Instrumentation Engineers 9261, Ocean Remote Sensing and Monitoring from Space 92610k. (United States: Society of Photo-Optical Instrumentation Engineers (SPIE)) doi: 10.1117/12.2069245
Mabit R., Araújo C. A., Singh R. K., and Bélanger S. (2022). Empirical remote sensing algorithms to retrieve SPM and CDOM in Québec coastal waters. Front Remote Sens. 3, 834908. doi: 10.3389/frsen.2022.834908
Mobley C. D. (1999). Estimation of the remote-sensing reflectance from above-surface measurements. Appl. Optics 38 (36), 7442–7455. doi: 10.1364/ao.38.007442
Moran M. A., Sheldon W. M. Jr., and Zepp R. G. (2000). Carbon loss and optical property changes during long-term photochemical and biological degradation of estuarine dissolved organic matter. Limnol. Oceanogr. 45, 1254–1264. doi: 10.4319/lo.2000.45.6.1254
Nelson N. B., Carlson C. A., and Steinberg D. K. (2004). Production of chromophoric dissolved organic matter by Sargasso Sea microbes. Mar. Chem. 89, 273–287. doi: 10.1016/j.marchem.2004.02.017
Nelson N. B. and Siegel D. A. (2002). Chromophoric DOM in the open ocean. Biogeochem. Mar. Dissolved Org. Matter, 547–578. doi: 10.1016/B978-012323841-2/50013-0
Nelson N. B. and Siegel D. A. (2013). The global distribution and dynamics of chromophoric dissolved organic matter. Annu. Rev. Mar. Sci. 5, 447–476. doi: 10.1146/annurev-marine-120710-100751
Olmanson L. G., Page B. P., Finlay J. C., Brezonik P. L., Bauer M. E., Griffin C. G., et al. (2020). Regional measurements and spatial/temporal analysis of CDOM in 10,000+ optically variable Minnesota lakes using Landsat 8 imagery. Sci. Total Environ. 724, 138141. doi: 10.1016/j.scitotenv.2020.138141
Otis D. B., Carder K. L., English D. C., and Ivey J. E. (2004). CDOM transport from the Bahamas banks. Coral Reefs. 23, 152–160. doi: 10.1007/s00338-003-0356-8
Romera-Castillo C., Sarmento H., Alvarez-Salgado X. A., Gasol J. M., and Marrasé C. (2011). Net production and consumption of fluorescent colored dissolved organic matter by natural bacterial assemblages growing on marine phytoplankton exudates. Appl. Environ. Microbiol. 77, 7490–7498. doi: 10.1128/AEM.00200-11
Ruescas A. B., Hieronymi M., Mateo-Garcia G., Koponen S., Kallio K., and Camps-Valls G. (2018). Machine learning regression approaches for colored dissolved organic matter (CDOM) retrieval with S2-MSI and S3-OLCI simulated data. Remote Sens. 10, 786. doi: 10.3390/rs10050786
Shang Y., Liu G., Wen Z., Jacinthe P. A., Song K., Zhang B., et al. (2021). Remote estimates of CDOM using Sentinel-2 remote sensing data in reservoirs with different trophic states across China. J. Environ. Manage. 286, 112275. doi: 10.1016/j.jenvman.2021.112275
Spencer R. G., Butler K. D., and Aiken G. R. (2012). Dissolved organic carbon and chromophoric dissolved organic matter properties of rivers in the USA. J. Geophys. Res.: Biogeosci 117, 1–14. doi: 10.1029/2011JG001928
Stramska M. and Stramski D. (2005). Variability of particulate organic carbon concentration in the north polar Atlantic based on ocean color observations with Sea-viewing Wide Field-of-view Sensor (SeaWiFS). J. Geophys. Res.:Oceans 110, 1–16. doi: 10.1029/2004JC002762
Sun Q., Wang C., Wang P., Hou J., and Ao Y. (2014). Absorption and fluorescence characteristics of chromophoric dissolved organic matter in the Yangtze Estuary. Environ. Sci. Pollut. Res. 21, 3460–3473. doi: 10.1007/s11356-013-2287-4
Tehrani N. C., D’Sa E. J., Osburn C. L., Bianchi T. S., and Schaeffer B. A. (2013). Chromophoric dissolved organic matter and dissolved organic carbon from sea-viewing wide field-of-view sensor (SeaWiFS), moderate resolution imaging spectroradiometer (MODIS) and MERIS sensors: Case study for the northern gulf of Mexico. Remote Sens. 5, 1439–1464. doi: 10.3390/rs5031439
Tian F., Healy T. R., and Davies-Colley R. J. (1994). Light absorption by yellow substance in storm runoff from log handling areas at a timber export port, Tauranga, New Zealand. J. Coastal Res., 803–808.
Vähätalo A. V. and Zepp R. G. (2005). Photochemical mineralization of dissolved organic nitrogen to ammonium in the Baltic Sea. Environ. Sci. Technol. 39, 6985–6992. doi: 10.1021/es050142z
Wang Y., Liu D., Dong Z., Di B., and Shen X. (2012). Temporal and spatial distributions of nutrients under the influence of human activities in Sishili Bay, northern Yellow Sea of China. Mar. Pollut. Bull. 64, 2708–2719. doi: 10.1016/j.marpolbul.2012.09.024
Wang S., Zhou F., Chen F., Meng Y., and Zhu Q. (2021). Spatiotemporal distribution characteristics of nutrients in the drowned tidal inlet under the influence of tides: A case study of zhanjiang bay, China. Int. J. Environ. Res. Public Health 18, 2089. doi: 10.3390/ijerph18042089
Warnock R. E., Gieskes W. W., and van Laar S. (1999). Regional and seasonal differences in light absorption by yellow substance in the Southern Bight of the North Sea. J. Sea Res. 42, 169–178. doi: 10.1016/S1385-1101(99)00025-8
Xie H., Aubry C., Bélanger S., and Song G. (2012). The dynamics of absorption coefficients of CDOM and particles in the St. Lawrence estuarine system: Biogeochemical and physical implications. Mar. Chem. 128, 44–56. doi: 10.1016/j.marchem.2011.10.001
Xu J., Fang C., Gao D., Zhang H., Gao C., Xu Z., et al. (2018). Optical models for remote sensing of chromophoric dissolved organic matter (CDOM) absorption in Poyang Lake. ISPRS J. Photogramm. 142, 124–136. doi: 10.1016/j.isprsjprs.2018.06.004
Yamashita Y., Nosaka Y., Suzuki K., Ogawa H., Takahashi K., and Saito H. (2013). Photobleaching as a factor controlling spectral characteristics of chromophoric dissolved organic matter in open ocean. Biogeosciences 10, 7207–7217. doi: 10.5194/bg-10-7207-2013
Yamashita Y. and Tanoue E. (2009). Basin scale distribution of chromophoric dissolved organic matter in the Pacific Ocean. Limnol. Oceanogr. 54, 598–609. doi: 10.4319/lo.2009.54.2.0598
Yu X., Shen F., and Liu Y. (2016). Light absorption properties of CDOM in the Changjiang (Yangtze) estuarine and coastal waters: An alternative approach for DOC estimation. Estuarine Coastal Shelf Sci. 181, 302–311. doi: 10.1016/j.ecss.2016.09.004
Yu G., Zhong Y., Fu D., Chen F., and Chen C. (2024). Remote sensing estimation of δ15NPN in the Zhanjiang Bay using Sentinel-3 OLCI data based on machine learning algorithm. Front. Mar Sci. 11, 1366987. doi: 10.3389/fmars.2024.1366987
Yu G., Zhong Y., Liu S., Lao Q., Chen C., Fu D., et al. (2023). Remote sensing estimates of particulate organic carbon sources in the Zhanjiang bay using sentinel-2 data and carbon isotopes. Remote Sens. 15, 3768. doi: 10.3390/rs15153768
Zhang P., Peng C., Zhang J., Zhang J., Chen J., and Zhao H. (2022). Long-term harmful algal blooms and nutrients patterns affected by climate change and anthropogenic pressures in the Zhanjiang Bay, China. Front. Mar. Sci. 9, 849819. doi: 10.3389/fmars.2022.849819
Zhang Y., van Dijk M. A., Liu M., Zhu G., and Qin B. (2009). The contribution of phytoplankton degradation to chromophoric dissolved organic matter (CDOM) in eutrophic shallow lakes: field and experimental evidence. Water Res. 43, 4685–4697. doi: 10.1016/j.watres.2009.07.024
Zhang P., Xu J. L., Zhang J. B., Li J. X., Zhang Y. C., Li Y., et al. (2020). Spatiotemporal dissolved silicate variation, sources, and behavior in the eutrophic Zhanjiang Bay, China. Water 12, 3586. doi: 10.3390/w12123586
Zhang J., Zhou F., Chen C., Sun X., Shi Y., Zhao H., et al. (2018). Spatial distribution and correlation characteristics of heavy metals in the seawater, suspended particulate matter and sediments in Zhanjiang Bay, China. PLoS One 13, e0201414. doi: 10.1371/journal.pone.0201414
Zhang Y., Zhou Y., Shi K., Qin B., Yao X., and Zhang Y. (2018). Optical properties and composition changes in chromophoric dissolved organic matter along trophic gradients: Implications for monitoring and assessing lake eutrophication. Water Res. 131, 255–263. doi: 10.1016/j.watres.2017.12.051
Zhao J., Cao W., Wang G., Yang D., Yang Y., Sun Z., et al. (2009). The variations in optical properties of CDOM throughout an algal bloom event. Estuarine Coastal Shelf Sci. 82, 225–232. doi: 10.1016/j.ecss.2009.01.007
Zhao C., Zhou Y., Pang Y., Zhang Y., Huang W., Wang Y., et al. (2021). The optical and molecular signatures of DOM under the eutrophication status in a shallow, semi-enclosed coastal bay in southeast China. Sci. China: Earth Sci. 64, 1090–1104. doi: 10.1007/s11430-020-9728-4
Zhou F., Gao X., Song J., Chen C. T. A., Yuan H., and Xing Q. (2018). Absorption properties of chromophoric dissolved organic matter (CDOM) in the East China Sea and the waters off eastern Taiwan. Cont. Shelf Res. 159, 12–23. doi: 10.1016/j.csr.2018.03.005
Zhou Y., Li Y., Yao X., Ding W., Zhang Y., Jeppesen E., et al. (2019). Response of chromophoric dissolved organic matter dynamics to tidal oscillations and anthropogenic disturbances in a large subtropical estuary. Sci. Total Environ. 662, 769–778. doi: 10.1016/j.scitotenv.2019.01.220
Keywords: CDOM, optical properties, sentinel-2, eutrophication index, Zhanjiang Bay
Citation: Zhong Y, Yu G, Fu D, Chen F, Luo Y and Deng R (2025) Optical properties of CDOM and assessing eutrophication by remote sensing of CDOM in the Zhanjiang Bay, China. Front. Mar. Sci. 12:1527200. doi: 10.3389/fmars.2025.1527200
Received: 13 November 2024; Accepted: 01 May 2025;
Published: 23 May 2025.
Edited by:
Alejandro Jose Souza, Center for Research and Advanced Studies - Mérida Unit, MexicoReviewed by:
Grace Chang, Integral Consulting, United StatesAbigail Uribe-Martinez, Instituto de Investigaciones Oceanologicas UABC, Mexico
Copyright © 2025 Zhong, Yu, Fu, Chen, Luo and Deng. This is an open-access article distributed under the terms of the Creative Commons Attribution License (CC BY). The use, distribution or reproduction in other forums is permitted, provided the original author(s) and the copyright owner(s) are credited and that the original publication in this journal is cited, in accordance with accepted academic practice. No use, distribution or reproduction is permitted which does not comply with these terms.
*Correspondence: Guo Yu, eWcxMDBAZ2RvdS5lZHUuY24=; Dongyang Fu, ZmR5MTYzQDE2My5jb20=