Abstract
Glycogen, a critical nutrient in Crassostrea hongkongensis, exhibits essential biological properties, with its quantitative levels serving as a pivotal parameter for phenotypic selection and genetic improvement of superior oyster strains. To investigate the characteristics of glycogen content and identify single nucleotide polymorphisms (SNPs) associated with this trait in C. hongkongensis, we cloned the full-length cDNA of key genes involved in glycogen metabolism, determined glycogen content and gene expression in different tissues and months of the oyster specimen collection, and developed SNPs in the gene coding region. The results demonstrated that glycogen synthase (ChGS) and glycogen phosphorylase (ChGP) are key genes regulating glycogen metabolism in C. hongkongensis. Both genes were ubiquitously expressed across all six analyzed tissues: gills, adductor muscle, mantle, labial palps, gonads, and digestive gland. Notably, mRNA expression levels of ChGS and ChGP in gonad and visceral tissues exhibited seasonal fluctuations, which showed significant correlation with glycogen content dynamics. Fifteen SNP markers were identified within the coding regions of ChGS and ChGP using fragment-length discrepant allele-specific polymerase chain reaction. The success rate of SNP identification was 37.5% (15/40). Using association analysis, one SNP located in the coding region of ChGS was found to be associated with glycogen content. These results provide potential molecular markers that can be used for the selection and breeding of glycogen traits in C. hongkongensis, and demonstrate the potential influence of ChGS and ChGP on glycogen content.
1 Introduction
Crassostrea hongkongensis, a marine oyster belonging to the phylum Mollusca, class Lamellibranchia, subclass Pteriomorphia, order Pterioida, family Ostreidae, and genus Crassostrea, is an economically important species in southern China. It accounts for 34.45% of China’s total oyster production (Fisheries Administration Bureau, MARA, and PRC, 2021). Despite its high production volume, C. hongkongensis struggles to meet the market demand for high-quality oysters, resulting in reduced economic returns for producers. This challenge is attributed to factors, such as excessive aquaculture in the sea and changes in the aquaculture environment, which have led to a decline in the quality of C. hongkongensis (Xia et al., 2009; Ma et al., 2022).
Glycogen, a branched-chain polysaccharide found in animal liver and muscles, is an easily stored and readily available glucose reserve (Greenberg et al., 2006). The presence of glycogen ensures the normal operation of the body and it plays a vital role in maintaining energy homeostasis. Glycogen is the primary source of energy in oysters, influencing gamete development, growth, reproduction, stress resistance, and flavor (Samain, 2011; Liu et al., 2017; Meng et al., 2019). Many studies have demonstrated that the variation in glycogen content in oysters is closely related to their reproductive activity, with levels peaking during non-reproductive periods (Normand et al., 2008; Mondol et al., 2016). The glycogen content in the gonado-visceral mass of Crassostrea gigas begins to accumulate before gamete development, reaching a maximum value in April, and rapidly decreases with gamete development and emission (Zhong et al., 2019). In C. hongkongensis, glycogen levels decrease during the high energy demands of gamete formation and proliferation (February to June), reaching their lowest levels during gonad maturation. Subsequently, glycogen slowly accumulates again, with levels peaking in December (Roach et al., 2012). Notably, glycogen levels serve as an indicator of oyster tolerance to environmental stress. Oysters with high glycogen content exhibit low mortality rates and increased resistance to adverse environments. Conversely, low glycogen content weakens oyster resistance, potentially contributing to large-scale death in summer (Bacca et al., 2005).
Glycogen synthase (GS) and glycogen phosphorylase (GP) are key enzymes involved in the synthesis and degradation of glycogen, respectively. GS catalyzes the transfer of glucose molecules from uridine-5-diphosphate-glucose to the terminal branches of glycogen molecules, whereas GP cleaves glucose units by breaking the alpha-1,4 glycosidic bonds in glycogen (Palsamy and Subramanian, 2009; Zhao et al., 2014). In marine mollusks, the full-length cDNA sequence of the gene encoding GS (GS) has been reported in Crassostrea virginica and Sinonovacula constricta (Swift et al., 1988; Chen et al., 2021). Previous studies have also shown a close link between the expression level of GS in Crassostrea gigas and its reproductive cycle, influencing variations in glycogen levels (Liu et al., 2017). The full-length cDNA sequence of the gene encoding GP (GP) has been cloned into C. gigas and Crassostrea angulata, and its expression levels have been found to be related to changes in glycogen levels (Bacca et al., 2005; Zeng et al., 2015). However, no study has investigated the genes encoding GS (ChGS) and GP (ChGP) in C. hongkongensis.
To explore the relationship between key genes related to glycogen metabolism and content-related traits in C. hongkongensis, we determined the glycogen content and expression levels of ChGS and ChGP in different tissues and during different specimen collection months. We then conducted an association analysis to screen for single nucleotide polymorphisms (SNP) associated with glycogen content, laying the foundation for breeding high-quality oysters.
2 Materials and methods
2.1 Oyster collection
Adult oysters were collected from the Sandun culture area of Qinzhou City, Guangxi. Because the nutritional content of adult oysters is relatively stable compared with that of juvenile oysters, we selected adult oysters at the second instar stage (shell height = 84.19 ± 9.66 mm, body weight = 105.42 ± 22.42 g). To avoid differences between groups growing under different environments, the oysters were attached at the same time and grew and developed in the same natural environment. From June 2020 to April 2021, the oysters (15 each time) were collected monthly from the same location, and the chlorophyll-a (Chl-a) content in the sea area was measured using a data sonde (6600V2; YSI, Yellow Springs, OH, USA). The adductor muscles, gills, and remaining tissues were separated, frozen in liquid nitrogen, and stored at –80°C. From each oyster, half of the gills were used for RNA extraction and half of the adductor muscle was used for glycogen content detection. Samples collected in April were used for analyses of different tissues, including the adductor muscle, gills, mantle, gonads, digestive glands, and labial palps.
The oysters used for SNP identification and association analysis were collected from two locations in Guangxi, China. Forty-five individuals were collected from the Dafengjiang Sea (DFJ group) at the coordinates E108°86′16″, N21°67′77″. Sixty individuals were also collected from Sandun (SD group), where individuals were attached simultaneously, and grew and developed in the same environment. The adductor muscle, gills, and other tissues were dissected, frozen in liquid nitrogen, and stored at −80°C for glycogen content detection and RNA extraction.
2.2 Cloning full-length cDNA of key genes
Total RNA was extracted from the samples using the TRIzol method. The extracted RNA was measured through spectrophotometry using a nucleic acid protein concentration meter (Gene Company Limited, Thermo, China). RNA integrity was determined via 1% agarose gel electrophoresis, and the RNA was reverse transcribed into cDNA using a reverse transcription kit (TransGen Biotech, Beijing, China). Primers were designed for intermediate fragment cloning using the CSAD and CDO sequences of C. gigas as references. The 5′ and 3′ templates used for rapid amplification of cDNA ends (RACE) were synthesized using the SMART 5′ RACE & 3′ RACE Reagents Kit (TaKaRa, Tokyo, Japan). Adapter sequences were added to the 5′ and 3′ end of total RNA extracted from the oysters (C. hongkongensis), following the instructions in the reagent kit, and the RNA was then reverse transcribed into cDNA. The cDNA was used as the template for 5′ and 3′ end amplification using Tks Gflex™ DNA Polymerase (TaKaRa), with one end of the primer designed as a 3′- or 5′-specific primer for the cloned intermediate fragment, and the other end as the UPM and UPS primer in the SMART 5’ RACE & 3’ RACE Reagents Kit (Table 1). The PCR conditions involved pre-denaturation at 94°C for 1 min and denaturation at 98°C for 10 s, followed by annealing and extension. The annealing temperature was set at 60°C when the average Tm of the forward and reverse primers was greater than 55°C and at 55°C when the average Tm of the forward and reverse primers was less than 55°C. The extension time was set according to the length of the fragment; that is, 1 min/kb. The product was detected using 1% agarose gel electrophoresis, ligated to the pEASY clone vector, and transformed into T1 Escherichia coli cells. After overnight cultivation and PCR detection, the bacterial suspension was sent to Shanghai Shenggong Biotechnology Co., Ltd. (Shanghai, China) for sequencing.
Table 1
| Primers | Primer sequences (5′-3′) | Usages |
|---|---|---|
| 221 ChGS-F1 | ATCGCCTGGGAAGTAGCA | Fragment cloning |
| 627 ChGS-R1 | TCCGAAACTCACCAATAAACC | Fragment cloning |
| 605 ChGS-F2 | CTCTAGTAGCCTGGTTTATTGGT | Fragment cloning |
| 1265 ChGS-R2 | AGTTGTTGGTCTTGGTGGG | Fragment cloning |
| 1094 ChGS-F3 | GAATCACTGGCAAGACTAAA | Fragment cloning |
| 1930 ChGS-R3 | GCAGCAAGGTCAGGGTAT | Fragment cloning |
| 4 ChGP-F1 | GAGAAGGAAGCAGACAGCCAAAGAA | Fragment cloning |
| 2572 ChGP-R1 | CTATCCATTGAGTCTAGGCCCTCGT | Fragment cloning |
| 416 ChGP-F2 | TGAGGAGTTGGAGGAGATTGAGGAG | Fragment cloning |
| 2796 ChGP-R2 | AGAGCTGAGTATGTCCAATGGCCTG | Fragment cloning |
| 95 ChGS-5-R1 | CGTTATAGGGACCCAGCAGAC | 5′ RACE |
| 177 ChGS-5-R2 | GCGTCCCTCATGGTCTGTAGT | 5′ RACE |
| 1647 ChGS-3-F1 | ACAGCGTATCATTCAGAGAAATC | 3′ RACE |
| 1721 ChGS-3-F2 | ACAGAAAAGCCCGCCAGATCGCA | 3′ RACE |
| 66 ChGP-5-R1 | TTGCTTTCGCTTCTCGTGGTCAGTT | 5′ RACE |
| 203 ChGP-5-R2 | TGTGGGCAAGAGAGAGGTAGTAGTC | 5′ RACE |
| 394 ChGP-5-R3 | CTCCTCAATGTCAAGGCCAATCTGA | 5′ RACE |
| 2601 ChGP-3-F1 | CTTCAATTCGCCCTATAGTGAGTCG | 3′ RACE |
| 2459 ChGP-3-F2 | GTCCTCAACATTGCATCTTCGGGTA | 3′ RACE |
| 2268 ChGP-3-F3 | TGCGGTTGGTACTCGATCAGCTGTA | 3′ RACE |
| M13F | TGTAAAACGACGGCCAGT | universal primer |
| M13R | CAGGAAACAGCTATGACC | universal primer |
| UPM | CTAATACGACTCACTATAGGGCAAGCAGTGGTATCAACGCAGAGT | RACE |
| UPS | CTAATACGACTCACTATAGGGC | RACE |
| 1149 qPCR-GS-F1 | CAAGCTAACAGTGAGGCGACAG | RT-qPCR |
| 1265 qPCR-GS-R1 | GATCTGAGTCTGTACGTGGTGC | RT-qPCR |
| 1370 qPCR-GP-F1 | ATCGTAGAGGAGGATGGAGAGAA | RT-qPCR |
| 1502 qPCR-GP-R1 | GTTTTGGAAGCGCTCGGGATACAT | RT-qPCR |
| LActinF | CTGTGCTACGTTGCCCTGGACTT | RT-qPCR |
| LActinR | TGGGCACCTGAATCGCTCGTT | RT-qPCR |
Primers used for full-length cDNA cloning and quantitative polymerase chain reaction.
RACE, rapid amplification of cDNA ends; RT-qPCR, reverse transcription quantitative polymerase chain reaction.
2.3 Gene sequence and evolutionary analysis
The ORF Finder online tool (https://www.ncbi.nlm.nih.gov) was used to predict the open reading frame (ORF) and amino acid sequences based on the full-length cDNA sequences. The molecular weight, isoelectric point, hydrophobicity, signal peptide, and structural domain of the proteins were predicted using online software programs, such as Expasy (https://web.expasy.org), SignalP (http://www.cbs.dtu.dk/services/SignalP/), and the National Center for Biotechnology Information (NCBI) tools. After sequence alignment and homology searches using the NCBI BLAST tool, multiple comparisons of homologous sequences were performed using DNAMAN 7.0 software. The neighbor-joining method in MEGA 5.1 software was used to build the evolutionary tree, with the bootstrap value set to 1,000.
2.4 Analysis of glycogen content
The adductor muscle, gills, mantle, gonads, digestive gland, and labial palps were used for glycogen content analyses in different tissues, and the adductor muscle was used for analysis at different time points. Glycogen content was detected using a glycogen enzyme-linked immunosorbent assay (ELISA) kit (Shanghai Meilian Biotechnology Co., Ltd., Shanghai, China). The assay used blank, standard, and sample wells. Briefly, 50 μL of standard solution was added to each standard well, followed by the addition of 40 μL of sample diluent and 10 μL of sample solution to each sample well. The plate was incubated at 37 °C for 30 min and then washed five times. Subsequently, 50 μL of horseradish-peroxidase-conjugated ELISA reagent was added to each well, followed by the addition of 100 μL of acidic chromogenic agent for color development in the dark at 37 °C for 10 min. The absorbance was measured at 450 nm using an ELISA reader (Spectra Max Id5, USA), and the nutrient content of the samples was calculated using a standard curve. After normality and variance homogeneity tests, analysis of variance (ANOVA) and multiple comparisons were performed using SPSS 22.0 (IBM, Armonk, NY, USA) to evaluate differences in glycogen content between different tissues and time points.
2.5 Gene expression analysis in different tissues and at different time points
Total RNA was extracted from gills collected in different months and from various tissue samples from April using the TRIzol method. A 5,000-ng sample of total RNA was reverse transcribed into cDNA using the TransScript® One-Step gDNA Removal and cDNA Synthesis SuperMix kit (TransGen Biotech Co., Ltd.) and the cDNA was diluted to 100 ng/µL for use as a qPCR template. We used PerfectStart® Green qPCR SuperMix (TransGen Biotech Co., Ltd.; SYBR Green as the fluorescent dye) to detect the mRNA expression levels of the key genes. The RT-qPCR reaction conditions were as follows: predenaturation at 95°C for 30 s, followed by 40 cycles of denaturation at 95°C for 15 s and annealing at 60°C for 30 s. β-Actin served as a reference gene. The primers used for RT-qPCR are listed in Table 1. RT-qPCR was performed using a fluorescence quantitative PCR instrument (CFX96; Bio-Rad, Hercules, CA, USA). Each experimental group included three biological replicates and three technical replicates. The relative expression level of the target gene was calculated using the 2-△△CT method, with results presented as the mean ± standard deviation. SPSS 22.0 software was used to test the normality and variance homogeneity of the gene expression data for different time periods and different tissues. For data meeting the normality and homogeneity of variance criteria, one-way ANOVA, with Tukey’s post-hoc analysis, was used for multiple comparisons. For data that did not meet the homogeneity of variance criteria, logarithmic conversion was first performed and then one-way ANOVA was performed.
2.6 SNP identification
The full-length cDNAs of ChGS and ChGP were used as templates, and primers for amplifying the ORF region of the genes (Supplementary Table 1) were designed using Oligo 7. Ten oysters with significant differences in glycogen content were selected to clone the same gene fragment, and the PCR products were sent to Shanghai Shenggong Biotechnology Co., Ltd. for sequencing. DNAMAN was used for sequence comparisons to identify candidate SNPs, which were then validated using fragment length discrepant allele-specific PCR (FLDAS-PCR) and polyacrylamide gel electrophoresis. First, two upstream primers of different lengths were designed using Oligo 7, with each having a 3′ end that paired with one of the two SNP allele bases. To enhance specificity, mismatches were also introduced at the 3rd or 4th base from the 3′ end of these two allele-specific primers. We then added base sequences of different lengths at the 5′ end, with a universal primer sequence downstream. The amplified DNA fragments were 100–200 bp long and were visualized using 12% polyacrylamide gel electrophoresis at 180 v for 120 min.
2.7 Population genotyping
Genotyping was performed using FLDAS-PCR and polyacrylamide gel electrophoresis. Due to the different lengths of the upstream primers, homozygotes showed a single band and heterozygotes showed two bands with an 8 bp size difference.
2.8 Association analysis
Using SPSS 22.0, descriptive statistics were calculated for the glycogen content of the two populations used for association analysis, and association analysis was performed between the glycogen content and SNP genotype data using a mixed linear model (MLM) in GAPIT3 (Zhang et al., 2010). The equation used for the MLM model was as follows:
where Y is the glycogen content, β is the coefficient vector of the fixed effect, μ is the vector representing the coefficients of the random effect, X is the matrix of fixed effects, Z is the matrix of random additive genetic effects, and e is the residual effect.
SNP markers showing significant differences between different genotypes were considered to be associated with glycogen content. SNPs related to glycogen content in the DFJ population were further genotyped in the SD population, and association analysis was conducted to further validate the repeatability of the obtained SNPs.
3 Results
3.1 Characteristics of full-length cDNA of ChGS and ChGP
The total length of the ChGS cDNA was 2,591 bp (GenBank accession number: OP792981), with a 101 bp 5′ untranslated region (UTR), a 399 bp 3′ UTR, and a 2,091 bp ORF encoding 696 amino acids (Supplementary Figure 1). The relative molecular weight of the identified protein was 79.94 kDa, with an isoelectric point of 6.44. Notably, ChGS was predicted to contain a conserved GS domain (amino acids 40–677; Supplementary Figure 2). Similarly, the total length of the ChGP cDNA was 3,378 bp (GenBank accession number: OP792982), including a 5′ UTR of 73 bp, a 3′ UTR of 737 bp, and an ORF of 2,568 bp encoding 855 amino acids (Supplementary Figure 3). The relative molecular weight of the identified protein was 98.46 kDa, with an isoelectric point of 6.90. The predicted conserved domain in the ChGP was a phosphorylase domain (amino acids 115–697; Supplementary Figure 4).
3.2 Homology and phylogenetic analysis of ChGS and ChGP
Alignment of the amino acid sequences of C. hongkongensis ChGS and ChGP with those from C. gigas, C. virginica, and C. angulata revealed high amino acid conservation (Figure 1). Furthermore, the phylogenetic tree showed that ChGS and ChGP in C. hongkongensis were closely related to those of other invertebrates, such as C. gigas and C. angulata (Figure 2).
Figure 1
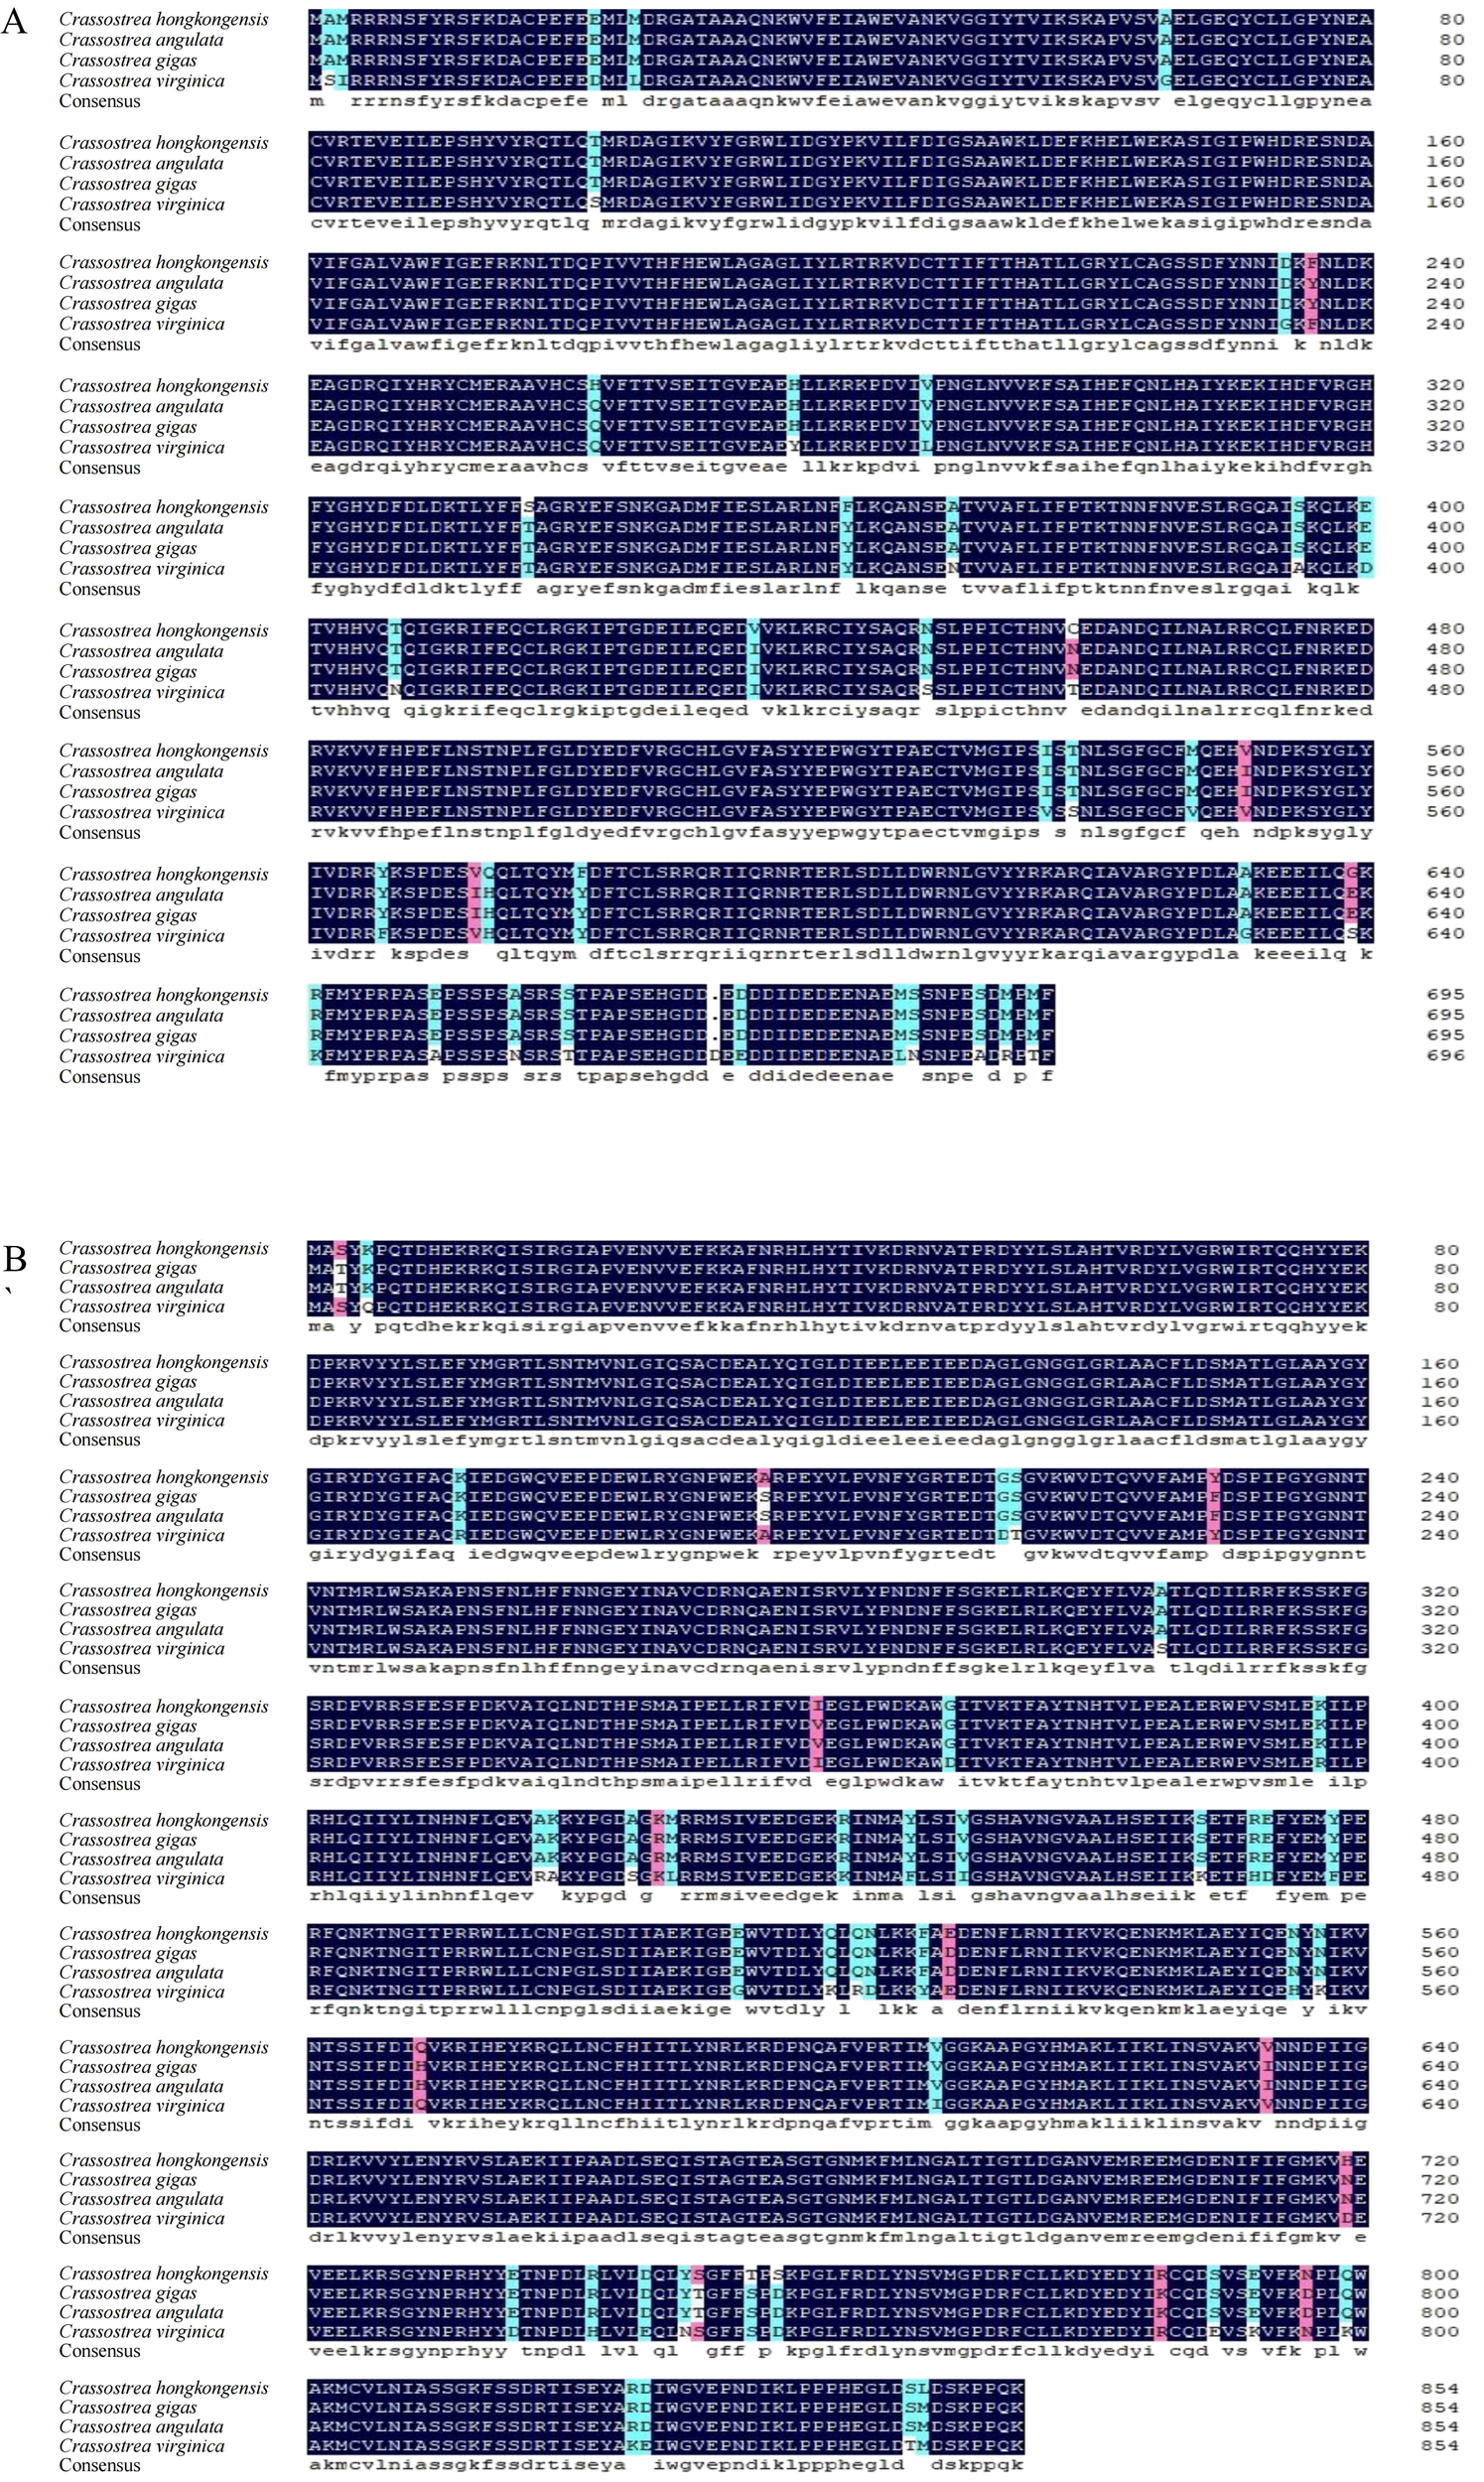
Multiple sequence alignments of ChGS(A) and ChGP(B). Black: domains with high similarity; blue: domains with low similarity; red: domains with relatively high similarity.
Figure 2
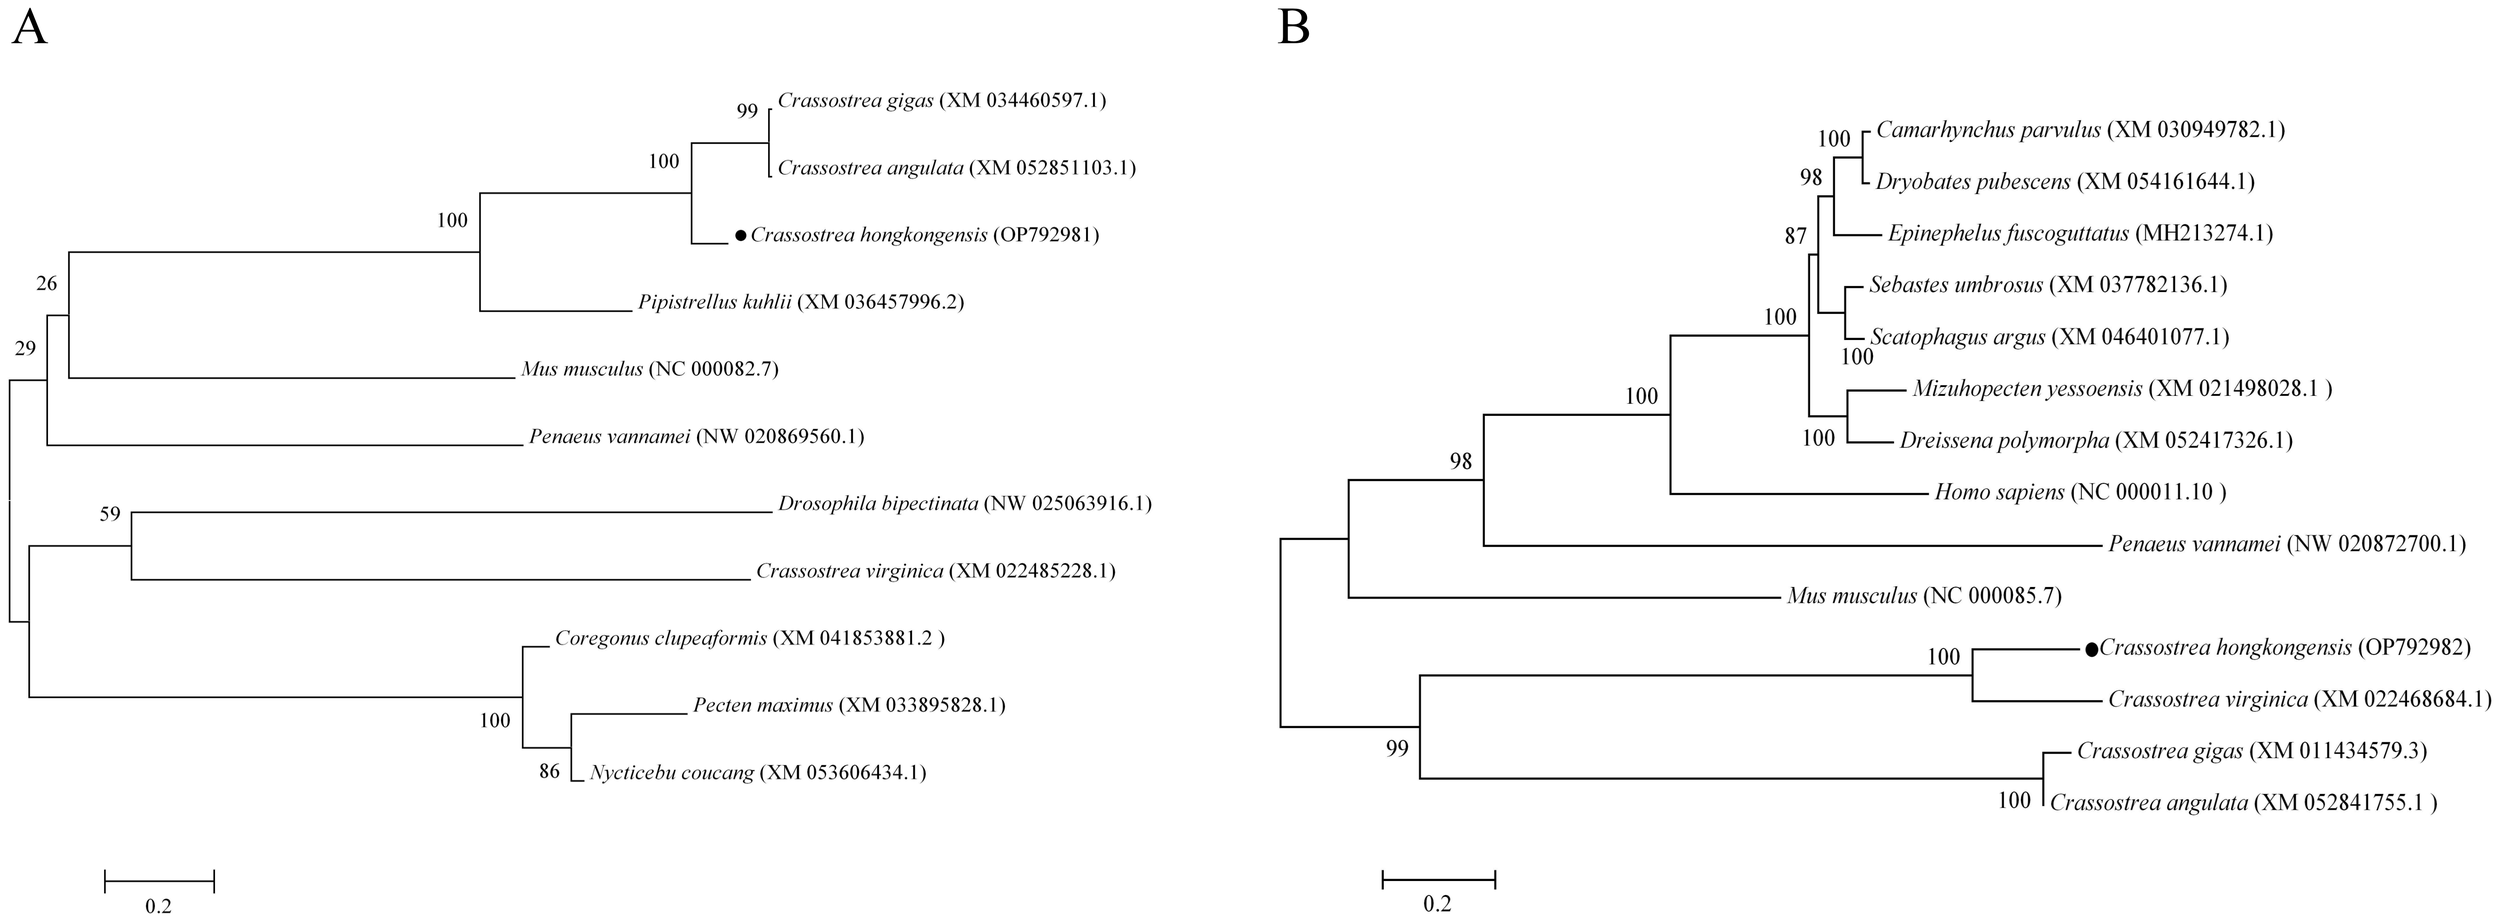
Phylogenetic analysis of ChGS (A) and ChGP (B). The number next to the internal branch represents the value based on 1,000 repeated calculations, and 0.2 represents the genetic distance.
3.3 Glycogen content and key gene expression in different tissues
C. hongkongensis exhibited the highest glycogen content in the gonads (1,714.48 μg/g) and mantle (1,682.69 μg/g), which had significantly higher levels than those of the other tissues (P < 0.05; Figure 3A). Of note, ChGS expression levels were highest in the gonads (P < 0.05), whereas ChGP expression levels were highest in the adductor muscle (P < 0.05; Figures 3B, C).
Figure 3
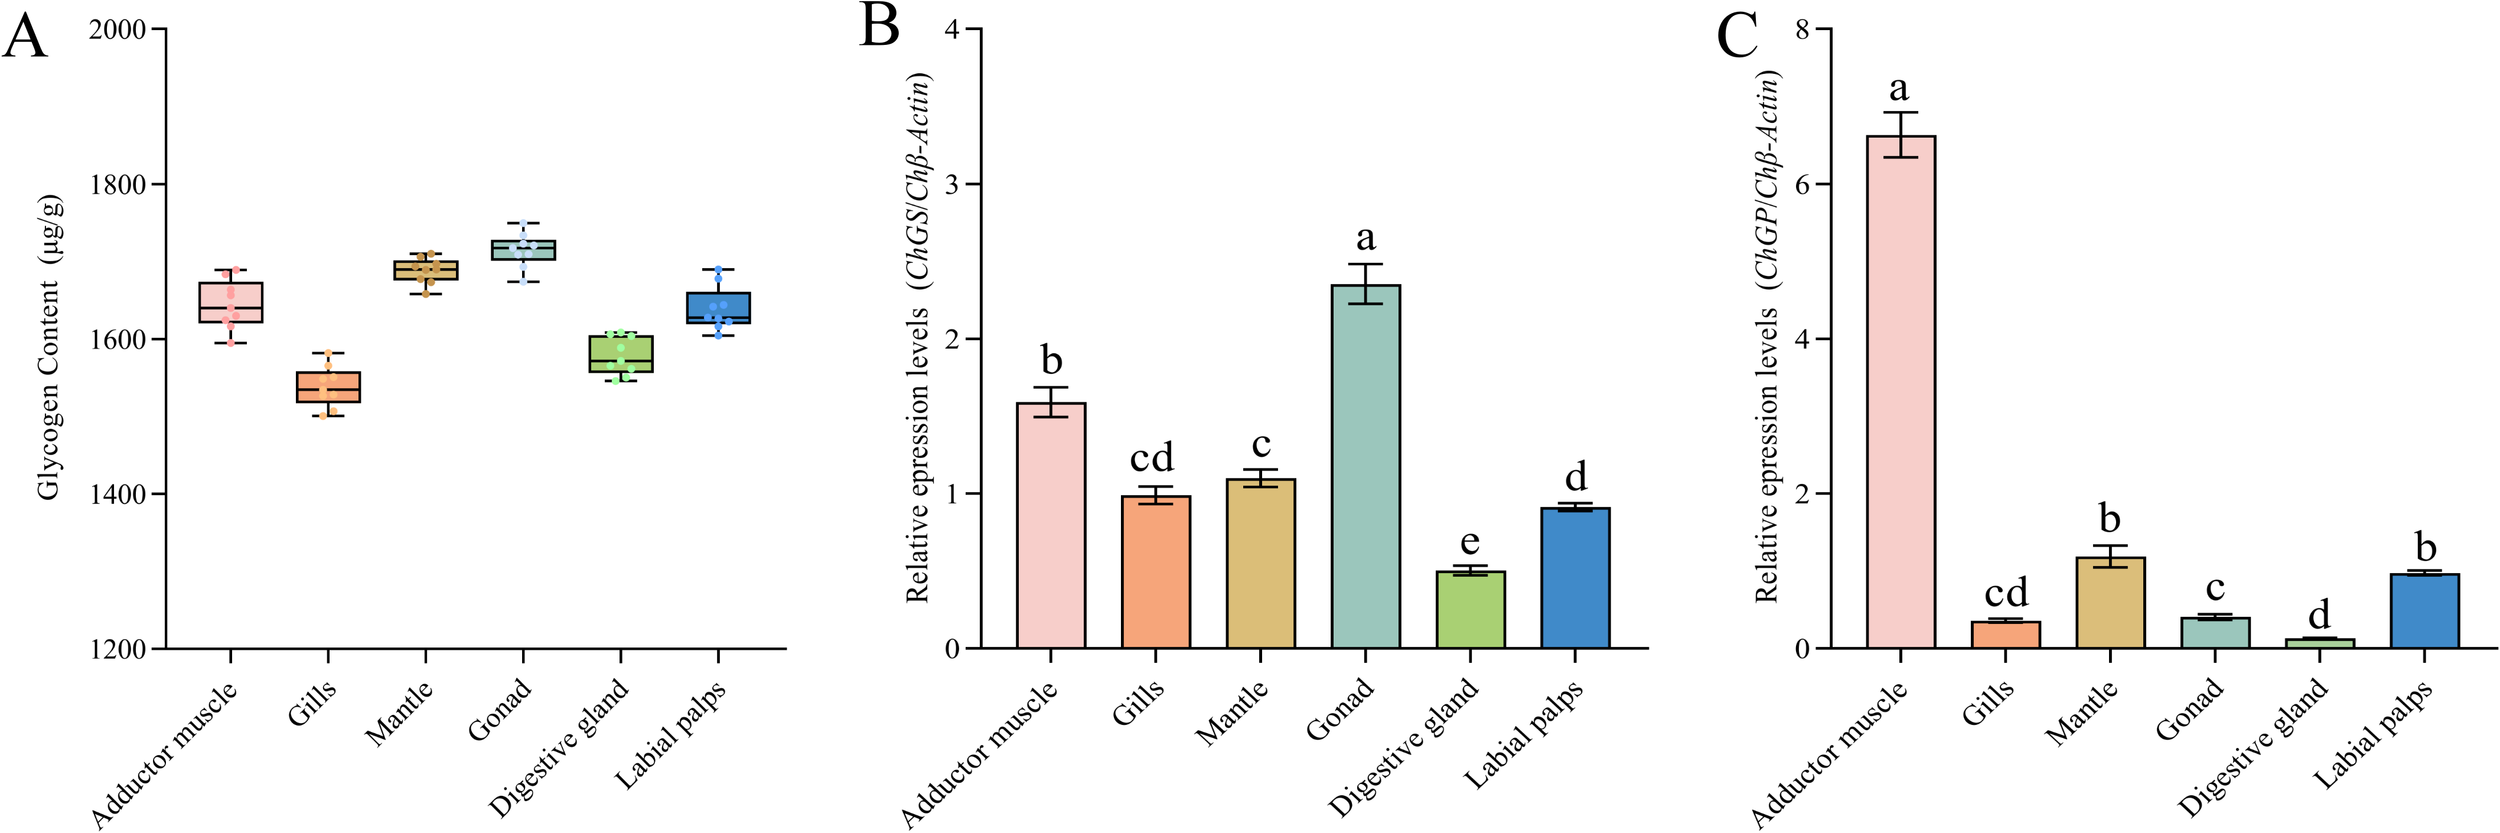
Glycogen content and gene expression in different tissues. Different letters indicate significant differences (P < 0.05). (A) Glycogen content in different tissues of C. hongkongensis; (B)ChGS expression in different tissues; (C)ChGP expression in different tissues. Different letters indicate significant differences (P < 0.05).
3.4 Glycogen content and key gene expression at different time points
The mass concentration of Chl-a in the Sandun culture area showed obvious seasonal fluctuation, with lower concentrations in December to February in winter. The lowest concentration was 1.4 mg/m3 in December. The concentration increased from April to June, and was highest in June, reaching 4 mg/m3 (Figure 4A). The glycogen content of C. hongkongensis was observed to decrease from February to March, reaching its lowest level of 1,508.1 μg/g in March. It then steadily increased from 1,508.11 μg/g in April, peaking at 1,812.03 μg/g in September (Figure 4A). The ChGS expression level remained low from January to June, before increasing gradually, reaching its peak in September and then declining (P < 0.05; Figure 4B). In contrast, the expression level of ChGP was high from January to April, followed by a significant decrease until June. However, ChGP expression then increased slowly, reaching a second peak in September (Figure 4C).
Figure 4
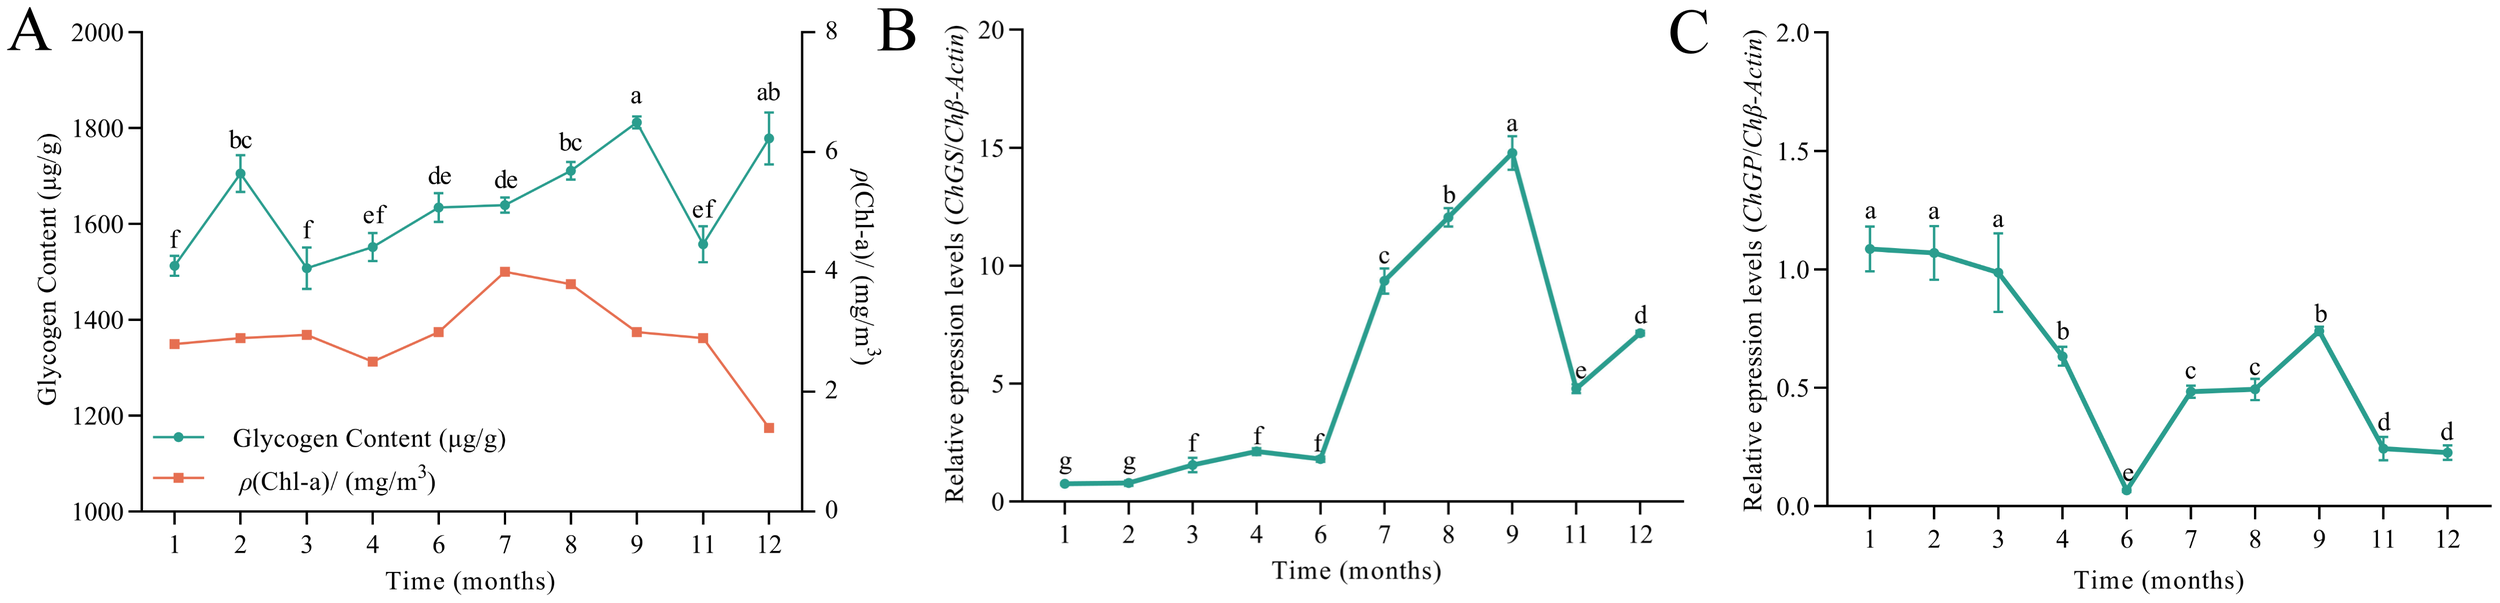
Glycogen content and gene expression across different months. Different letters indicate significant differences (P < 0.05). (A) Glycogen content; (B)ChGS expression; and (C)ChGP expression in C. hongkongensis in different months.
3.5 Characteristics of glycogen content in populations included in the association analysis
The glycogen content of the DFJ population ranged from 1,494.86 to 1,824.33 μg/g (Figure 5A), with an average of 1,611.86 ± 100.76 μg/g, and a coefficient of variation (CV) of 6.06%. The glycogen content of SD population ranged from 1514.87–1845.20 μg/g (Figure 5B), with an average of 1,678.11 ± 102.27 μg/g, and a CV of 6.09%. There was significant variation in glycogen content within both the DFJ and SD populations, and both followed a normal distribution (P > 0.05), making them suitable for conducting association analyses.
Figure 5
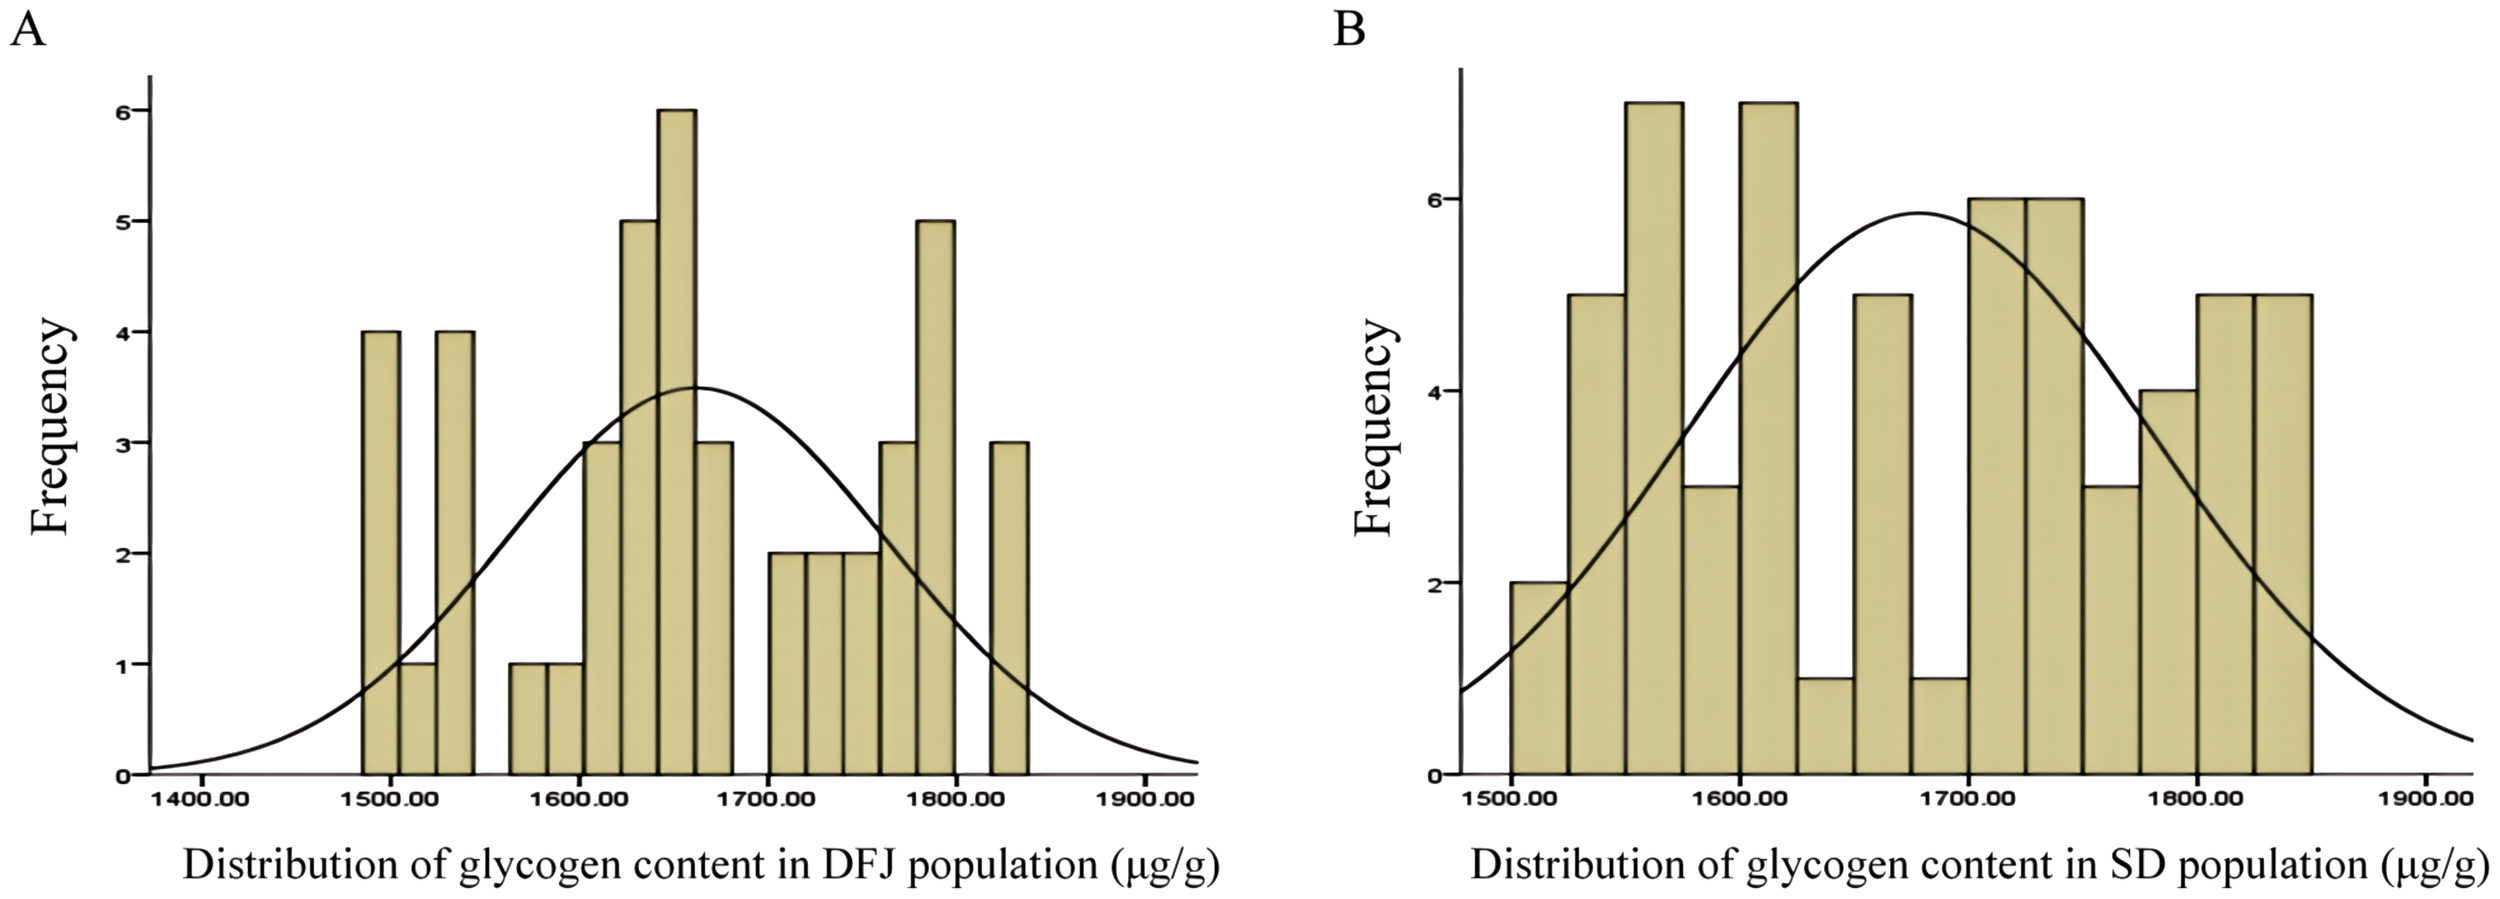
Histogram of glycogen content. Distribution of glycogen content in (A) the Dafengjiang Sea (DFJ) and (B) the Sandun (SD) populations.
3.6 SNPs in the coding regions of key genes
Using gene fragment cloning, Sanger sequencing, and multisequence alignment, 40 candidate SNPs were identified in ChGS and ChGP. Forty sets of primers were designed, and 15 SNPs were validated, all of which were successfully genotyped in the experimental population (Figure 6). The number of SNPs for each gene is shown in Supplementary Table 2, and information on the 15 validated SNPs is provided in Table 2.
Figure 6
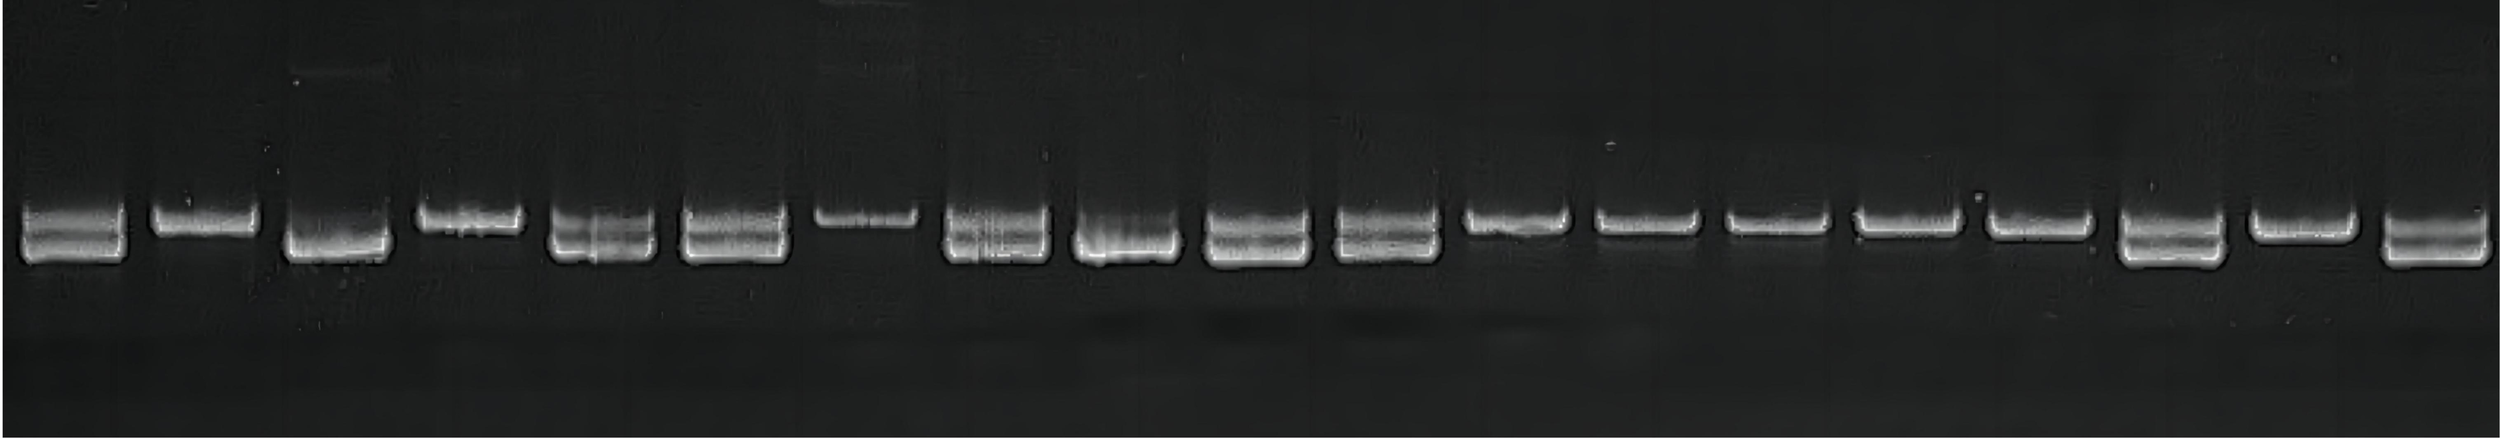
SNP genotyping results. Single nucleotide polymorphism (SNP) genotyping results based on FLDAS-PCR of the three different genotypes are shown. Two bands indicate heterozygosity, and one band indicates homozygosity.
Table 2
| Number | SNPs | Mutation type | Primers | Primer sequences (5′-3′) |
|---|---|---|---|---|
| 1 | ChGS-241 | A/C | ChGS 241-S1 | TGGGTCCCTATAACGAGACA |
| ChGS 241-S2 | ATATTATATGGGTCCCTATAACGAAGCC | |||
| ChGS 241-pub | TCCAAGCAGCAGATCCAATGTC | |||
| 2 | ChGS-575 | C/T | ChGS 575-s1 | GACCCACTTTCACGAGTTGT |
| ChGS 575-s2 | ATAATTAAGACCCACTTTCACGAGGGGC | |||
| ChGS 575-pub | CAGTAGCGGTGATAGATCTGACGG | |||
| 3 | ChGS-604 | G/T | ChGS 604-s1 | TACAGTCCACCTTCCTGATA |
| ChGS 604-s2 | ATAATTAATACAGTCCACCTTCCTAGTC | |||
| ChGS 604-pub | GGAGAAAGCAAGCATAGGAATC | |||
| 4 | ChGS-862 | T/C | ChGS 862-s1 | GGAAGCCAGATGTGATTTTC |
| ChGS 862-s2 | ATAATTAAGGAAGCCAGATGTGATGGTT | |||
| ChGS 862-pub | AGCCGAGAAAAAGTACAGCGTCTT | |||
| 5 | ChGS-916 | T/G | ChGS 916-s1 | TCTCTTTGTAGATGGCACGC |
| ChGS 916-s2 | ATAATTAATCTCTTTGTAGATGGCGTGA | |||
| ChGS 916-pub | TCCACTGCTCTCACGTGTTTAC | |||
| 6 | ChGS-1948 | T/C | ChGS 1948-s1 | CTGAGGGTGAGGAAGGTGCG |
| ChGS 1948-s2 | ATAATATACTGAGGGTGAGGAAGGGTCA | |||
| ChGS1948-pub | GACTGGAGAAACCTTGGAGTGT | |||
| 7 | ChGP-81 | T/C | ChGP 81-S1 | TTGCTCCCGTGGAAAAGGTT |
| ChGP 81-S2 | ATAATGAATTGCTCCCGTGGAAAAGGTC | |||
| ChGP 81-pub | TCCAACGCCCCACCAAATAATC | |||
| 8 | ChGP-1035 | A/G | ChGP1035-S2 | ATAATGAAACTCGGGGATAGCCATGGAC |
| ChGP1035-pub | TGGCAAAGAGCTCCGTCTGAAG | |||
| ChGP1074-S1 | CCCACGGGAGTCCCTCACTG | |||
| 9 | ChGP-1509 | G/A | ChGP1509-S1 | ATTTTCTCTGCGATAATGGCC |
| ChGP1509-S2 | ATAATGAAATTTTCTCTGCGATAAGGTCT | |||
| ChGP1509-pub | CAGCGTTACACTCAGAAATCAT | |||
| 10 | ChGP-1530 | C/T | ChGP1530-S1 | CTGTGACCCATTCCTCCACG |
| ChGP1530-S2 | ATAATGAACTGTGACCCATTCCTCACCA | |||
| ChGP1530-pub | CAGCGTTACACTCAGAAATCAT | |||
| 11 | ChGP-1785 | T/C | ChGP1785-S1 | CAAAGGCCTGGTTTGGGGCA |
| ChGP1785-S2 | ATAATGAACAAAGGCCTGGTTTGGTTCG | |||
| ChGP1785-pub | CAACATCAAGGTCAACACGTCC | |||
| 12 | ChGP-1985 | G/A | ChGP1985-S1 | GGCCGAGAAGATCATTCCGGCG |
| ChGP1985-S2 | ATAATGAAGGCCGAGAAGATCATTCCTTCA | |||
| ChGP1985-pub | CCATCTCCTCTCTCATCTCTACGT | |||
| 13 | ChGP-1998 | C/T | ChGP1998-S1 | CTGCCGTCGAGATCTGTGCG |
| ChGP1998-S2 | ATAATGAACTGCCGTCGAGATCTGGTCA | |||
| ChGP1998-pub | CAGTGTAGCCAAGGTCGTCAAC | |||
| 14 | ChGP-2013 | G/A | ChGP2013-S1 | CAGAAGCCTCGGTTCCTTCC |
| ChGP2013-S2 | ATAATGAACAGAAGCCTCGGTTCCGGCT | |||
| ChGP2013-pub | CAGTGTAGCCAAGGTCGTCAAC | |||
| 15 | ChGP-2034 | G/A | ChGP2034-S1 | CATGAACTTCATGTTTCCGGTC |
| ChGP2034-S2 | ATAATGAACATGAACTTCATGTTTCATGTT | |||
| ChGP2034-pub | AGGTCGTCAACAATGATCCAAT |
Information on the 15 validated SNPs.
SNP, single nucleotide polymorphism.
3.7 SNPs associated with glycogen content
In the DFJ population of C. hongkongensis, a synonymous SNP (ChGP-1998) located within the coding region of ChGP was detected and found to be significantly correlated with glycogen content (P < 0.05; Table 3). Individuals with the TT or TC genotypes exhibited higher glycogen content than those with the CC genotype (P < 0.05). These findings suggest that SNP ChGP-1998 may influence glycogen content in the DFJ population. However, this association was not replicated in the SD population (P > 0.05).
Table 3
| Population | SNPs | Genotype | Content (μg/g) | P-value |
|---|---|---|---|---|
| DFJ | ChGP-1998 | CC | 1630.83 | 0.005 |
| TC | 1679.20 | |||
| TT | 1689.23 |
SNPs associated with glycogen content.
4 Discussion
4.1 Glycogen and key gene expression levels in C. hongkongensis
In the present study, we found that the glycogen content was relatively high in the gonads and mantle tissues of C. hongkongensis (P < 0.05). Li et al. (2009) found that a high glycogen content in the mantle of C. gigas is closely related to oyster reproduction in South Australia. Research indicates that glycogen storage cells in C. gigas are predominantly distributed in the mantle, gonads, and labial palps, where they act as the primary nutritional reserve during gametogenesis (Berthelin et al., 2000a). These findings are consistent with the variations in glycogen content observed across different tissues in C. hongkongensis, including the gonads, labial palps, mantle, gills, and digestive gland, in this study. We further investigated the expression levels of ChGS and ChGP, in six tissues during the proliferative stage. We found that ChGS was highly expressed in the gonads (P < 0.05), whereas ChGP was highly expressed in the adductor muscle (P < 0.05). The high expression level of ChGS, a key gene involved in glycogen synthesis, in gonads, correlated with elevated glycogen content, suggested its important role in promoting glycogen synthesis during reproduction in C. hongkongensis (Zeng et al., 2013; Pang et al., 2021; Wang et al., 2023). Conversely, the high expression level of ChGP, a key gene responsible for glycogen breakdown via glucose-1-phosphate release, in the adductor muscle likely reflects the presence of an active glycogen breakdown pool in this tissue (Martínez et al., 2000; Zeng et al., 2015). This breakdown likely provides ATP for muscle contraction.
4.2 Factors affecting glycogen content and gene expression in C. hongkongensis
The Chl-a concentration in the ocean is often used to estimate phytoplankton biomass. Higher Chl-a concentrations indicate an abundance of phytoplankton, which usually means more food resources available to filter-feeding organisms (Pérez-Morales et al., 2023; Nong et al., 2024). We found that the Chl-a concentration peaked in June, which may be due to the longest daylight hours and higher light intensity in June. Sufficient light provides ideal conditions for algae to carry out photosynthesis, promoting their growth and reproduction. Moreover, the water temperature in June is relatively moderate, which is conducive to the growth of phytoplankton (Foy et al., 1976). In our study, when the Chl-a concentration increased rapidly from March to June, there was generally a corresponding increase in glycogen levels, which may be because oysters are able to ingest more food, leading to increased energy intake, which promotes glycogen synthesis and storage. However, the Chl-a concentration was relatively stable in February, when the glycogen content was at its highest level. We speculated that there was a certain correlation between the abundance of food and the glycogen content of oysters. However, this relationship is influenced by many factors, such as reproductive activity, water temperature, salinity, and dissolved oxygen concentration (Zhang et al., 2006; Liu et al., 2020). Many studies have confirmed that changes in the glycogen levels of bivalves are closely related to their reproductive activities (Ren et al., 2003; Ojea et al., 2004). Berthelin et al. (2000b) found that the ability of glycogen storage cells to accumulate glycogen from glucose is high, but significantly reduced during gametogenesis. Our study revealed that the glycogen content of C. hongkongensis in the Sandun aquaculture area was relatively low between March and June. This may be because the breeding period of C. hongkongensis is from February to June, during which the glycogen reserves of C. hongkongensis are fully utilized (Wang et al., 2024). Both Crassostrea ariakensis and Crassostrea sikamea were found to be in gametogenesis in March and spawning in May (Jiang et al., 2023). Qin et al. (2021) found that oysters begin to generate gametes in February, and gonads develop rapidly in April, with a large number of germ cells generated and matured. This process requires a lot of energy support, resulting in the rapid decomposition and utilization of glycogen and a significant reduction in glycogen content. This is consistent with the fluctuations in glycogen content observed in our study, which suggests a correlation between seasonal variations in glycogen content and the annual reproductive cycle in C. hongkongensis (Liu et al., 2020; Li et al., 2024). To further investigate this relationship, we studied monthly and seasonal differences in the expression levels of the key glycogen metabolism genes, ChGS and ChGP. The largest difference in expression levels between these genes was observed in June and September. The period from January to June represents a phase of high energy demand associated with gamete formation and proliferation. During this time, the ChGS expression level remained relatively low, whereas the ChGP expression level was relatively high from January to April. Notably, after gamete release in June, the expression levels of both ChGS and ChGP were very low in the gonadal-visceral mass. From June to September, we observed an increase in ChGS and ChGP expression levels, suggesting an acceleration of glycogen metabolism and storage, culminating in the peak glycogen content in oysters in September. These findings support the notion that the mRNA levels of ChGS and ChGP in the gonadal-visceral mass are seasonally regulated and correlate with glycogen content (Li et al., 2000; Bacca et al., 2005).
4.3 Coding region SNPs and their identification efficiency
SNPs are the most common type of DNA variation, constituting approximately 90% of DNA sequence variations and contributing to the rich genetic diversity of organisms (Collins et al., 1998). Genetic diversity is beneficial for environmental adaptability and the selective breeding of species. Most SNPs reside in non-coding regions of the genome and they play important roles in population genetics and evolutionary research (Fiume et al., 2004; Oruç and Dursun, 2011). In contrast, SNPs located within coding regions have high genetic stability (Tang et al., 2012; Tong et al., 2023). In this study, we employed FLDAS-PCR and polyacrylamide gel electrophoresis to detect 40 SNPs within the coding regions of ChGS and ChGP in C. hongkongensis and identify 15 SNP markers. The success rate of 37.5% (15/40) was comparable to the 33.3% success rate (14/42) reported by She et al. (2015) using high-resolution melting technology for SNP identification in C. gigas. These findings suggested that FLDAS-PCR offers a relatively high success rate for SNP identification. However, FLDAS-PCR has low throughput, making it less suitable for large-scale SNP detection and identification.
4.4 Correlation between SNPs and glycogen content
In the present study, we identified one SNP within the coding region of ChGS in the DFJ population of C. hongkongensis that was significantly associated with glycogen content. Notably, this SNP is synonymous and does not alter the encoded amino acid sequence. Although synonymous mutations typically do not affect protein structure, they can influence phenotypes by altering mRNA secondary structure stability, translation efficiency, or protein folding (Cartegni et al., 2002).
Of note, this association was not replicated in the SD population, potentially because of genetic variations between the populations. As reported by Jiang et al. (2020), differences in genetic background can reduce the association of SNPs with traits of interest across populations.
5 Conclusions
In this study, we successfully cloned the full-length cDNAs of ChGS and ChGP, which are key genes involved in glycogen metabolism in C. hongkongensis. Our findings revealed that the expression levels of ChGS and ChGP were seasonally regulated and correlated with glycogen content. Furthermore, using Sanger sequencing and multiple sequence alignment, 40 candidate SNPs were identified in the coding regions of ChGS and ChGP. Following validation using FLDAS-PCR, 15 SNPs were successfully genotyped. Of note, one SNP in the ChGS coding region of the DFJ population of C. hongkongensis showed a significant association with glycogen content (P < 0.05).
Statements
Data availability statement
The datasets presented in this study can be found in online repositories. The names of the repository/repositories and accession number(s) can be found in the article/Supplementary Material.
Ethics statement
The oysters used in this study were marine-cultured animals, and all experiments were conducted according to the regulations established by the local and central government. No specific permissions were required to collect oysters or conduct the experiments described. The study was conducted in accordance with the local legislation and institutional requirements.
Author contributions
LK: Conceptualization, Formal Analysis, Investigation, Methodology, Software, Supervision, Writing – original draft. ZC: Investigation, Writing – original draft. ZJ: Investigation, Writing – original draft. QD: Investigation, Writing – original draft. PZ: Resources, Writing – review & editing. YX: Resources, Writing – review & editing. ZS: Supervision, Writing – review & editing, Conceptualization, Formal Analysis, Funding acquisition, Methodology, Project administration.
Funding
The author(s) declare that financial support was received for the research and/or publication of this article. This work was supported by the Key Research and Development Program of Guangxi (GNK AB241484027), the Natural Science Foundation of Guangxi (No. 2023GXNSFAA026503), the Marine Science Guangxi First-Class Subject, Beibu Gulf University (No. DRC002), the Counterpart Aid Project for Discipline Construction from Guangxi University (No. 2023B03), and the Scientific Research and Technology Development Plan Project of Qinzhou (No. 20223637).
Conflict of interest
The authors declare that the research was conducted in the absence of any commercial or financial relationships that could be construed as a potential conflict of interest.
Generative AI statement
The author(s) declare that no Generative AI was used in the creation of this manuscript.
Publisher’s note
All claims expressed in this article are solely those of the authors and do not necessarily represent those of their affiliated organizations, or those of the publisher, the editors and the reviewers. Any product that may be evaluated in this article, or claim that may be made by its manufacturer, is not guaranteed or endorsed by the publisher.
Supplementary material
The Supplementary Material for this article can be found online at: https://www.frontiersin.org/articles/10.3389/fmars.2025.1532465/full#supplementary-material
References
1
Bacca H. Huvet A. Fabioux C. Daniel J. Y. Delaporte M. Pouvreau S. et al . (2005). Molecular cloning and seasonal expression of oyster glycogen phosphorylase and glycogen synthase genes. Comp. Biochem. Physiol. B Biochem. Mol. Biol.140, 635–646. doi: 10.1016/j.cbpc.2005.01.005
2
Berthelin C. Kellner K. Mathieu M. (2000a). Histological characterization and glucose incorporation into glycogen of the pacific oyster Crassostrea gigas storage cells. Mar. Biotechnol.2, 136–145. doi: 10.1007/s101269900017
3
Berthelin C. Kellner K. Mathieu M. (2000b). Storage metabolism in the Pacific oyster (Crassostrea gigas) in relation to summer mortalities and reproductive cycle (west coast of France). Comp. Biochem. Physiol. B Biochem. Mol. Biol.125, 359–369. doi: 10.1016/S0305-0491(99)00187-X
4
Cartegni L. Chew S. L. Krainer A. R. (2002). Listening to silence and understanding nonsense: exonic mutations that affect splicing. Nat. Rev. Genet.3, 285–298. doi: 10.1038/nrg775
5
Chen Y. Liu S. He J. Yao H. Lin Z. Dong Y. (2021). Glycogen content fluctuation and association analysis with polymorphism of gys gene of Sinonovacula constricta in the Zhejiang population. J. Fish. China45, 415–423. doi: 10.11964/jfc.202002121591
6
Collins F. S. Brooks L. D. Chakravarti A. (1998). A DNA polymorphism discovery resource for research on human genetic variation. Genome Res.8, 1229–1231. doi: 10.1101/gr.8.12.12291
7
Fisheries Administration Bureau, MARA, and PRC . (2021). 2021 China fishery statistics yearbooks (Beijing, China: Agricultural press).
8
Fiume E. Christou P. Gianì S. Breviario D. (2004). Introns are key regulatory elements of rice tubulin expression. Planta.218, 693–703. doi: 10.1007/s00425-003-1150-0
9
Foy R. H. Gibson C. E. Smith R. V. (1976). The influence of daylength, light intensity and temperature on the growth rates of planktonic blue-green algae. Brit. Phycol. J.11, 151–163. doi: 10.1080/00071617600650181
10
Greenberg C. C. Jurczak M. J. Danos A. M. Brady M. J. (2006). Glycogen branches out: new perspectives on the role of glycogen metabolism in the integration of metabolic pathways. J. Appl. Physiol. Endocrinol. Metab.291, E1–E8. doi: 10.1152/ajpendo.00652.2005
11
Jiang W. Shi W. Li N. Zhang W. Chen L. Liu Q. et al . (2023). Gonad development and recruitment pattern of the oysters Crassostrea ariakensis and C sikamea in a subtropical bay in China. Reg. Stud. Mar. Sci.58, 102781. doi: 10.1016/j.rsma.2022.102781
12
Jiang Y. Tang S. Xiao W. Yun P. Ding X. (2020). A genome-wide association study of reproduction traits in four pig populations with different genetic backgrounds. Asian-Australas. J. Anim. Sci.33, 1400–1410. doi: 10.5713/ajas.19.0411
13
Li Q. Osada M. Mori K. (2000). Seasonal biochemical variations in Pacific oyster gonadal tissue during sexual maturation. Fish Sci.66, 502–508. doi: 10.1046/j.1444-2906.2000.00067.x1
14
Li Y. Qin J. G. Li X. Benkendorff K. (2009). Monthly variation of condition index, energy reserves and antibacterial activity in Pacific oysters, Crassostrea gigas, in Stansbury (South Australia). Aquaculture286, 64–71. doi: 10.1016/j.aquaculture.2008.09.004
15
Li Z. Zhao L. Wang Y. Chen X. Ma P. Liu Z. et al . (2024). Glycogen variations and glycometabolism during the gametogenesis cycle of Jinjiang oyster Crassostrea (Magallana) ariakensis. Aquacult. Rep.37, 102251. doi: 10.1016/j.aqrep.2024.102251
16
Liu S. Li L. Wang W. Li B. Zhang G. (2020). Characterization, fluctuation and tissue differences in nutrient content in the Pacific oyster (Crassostrea gigas) in Qingdao, northern China. Aquacult. Res.51, 1353–1364. doi: 10.1111/are.14463
17
Liu S. Li Q. Yu H. Kong L. (2017). Relationship between single nucleotide polymorphism of glycogen synthase gene of Pacific oyster Crassostrea gigas and its glycogen content. J. Ocean Univ. China16, 168–174. doi: 10.1007/s11802-017-3141-y
18
Ma H. Yu D. Li J. Qin Y. Zhang Y. Yu Z. (2022). Construction of first genetic linkage map based on microsatellite markers and characterization of di- and tri-nucleotide microsatellite markers for crassostrea hongkongesis. Aquaculture556, 738272. doi: 10.1016/j.aquaculture.2022.738272
19
Martínez G. Brokordt K. Aguilera C. Soto V. Guderley H. (2000). Effect of diet and temperature upon muscle metabolic capacities and biochemical composition of gonad and muscle in Argopecten purpuratus Lamarck 1819. J. Exp. Mar. Biol. Ecol.247, 29–49. doi: 10.1016/S0022-0981(00)00143-X
20
Meng J. Song K. Li C. Liu S. Shi R. Li B. et al . (2019). Genome-wide association analysis of nutrient traits in the oyster Crassostrea gigas: genetic effect and interaction network. BMC Genomics20, 625. doi: 10.1186/s12864-019-5971-z
21
Mondol M. R. Kim C. Kang C. Park S. R. Noseworthy R. G. Choi K. (2016). Growth and reproduction of early grow-out hardened juvenile Pacific oysters, Crassostrea gigas in Gamakman Bay, off the south coast of Korea. Aquaculture.463, 224–233. doi: 10.1016/j.aquaculture.2016.05.047
22
Nong X. Huang L. Chen L. Wei J. Li R. (2024). Distribution, relationship, and environmental driving factors of Chl-a-a and algal cell density: a national view of China. Glob. Ecol. Conserv.54, e3084. doi: 10.1016/j.gecco.2024.e03084
23
Normand J. Le Pennec M. Boudry P. (2008). Comparative histological study of gametogenesis in diploid and triploid Pacific oysters (Crassostrea gigas) reared in an estuarine farming site in France during the 2003 heatwave. Aquaculture282, 124–129. doi: 10.1016/j.aquaculture.2008.06.026
24
Ojea J. Pazos A. J. Martínez D. Novoa S. Sánchez J. L. Abad M. (2004). Seasonal variation in weight and biochemical composition of the tissues of Ruditapes decussatus in relation to the gametogenic cycle. Aquaculture238, 451–468. doi: 10.1016/j.aquaculture.2004.05.022
25
Oruç Ö.E. Dursun Ö. (2011). An application of information theoretical measures for DNA structure. Turkiye Klinikleri J. Biostat.3, 1–7.
26
Palsamy P. Subramanian S. (2009). Modulatory effects of resveratrol on attenuating the key enzymes activities of carbohydrate metabolism in streptozotocin–nicotinamide-induced diabetic rats. Chem. Biol. Interact.179, 356–362. doi: 10.1016/j.cbi.2008.11.008
27
Pang Y. Zhang X. Yuan J. Zhang X. Su M. Li F. (2021). Glycogen synthase kinase 3 gene is important in growth and molting of the pacific white shrimp Litopenaeus vannamei. Front. Mar. Sci.8. doi: 10.3389/fmars.2021.681966
28
Pérez-Morales A. Martínez-López A. Olivos-Ortíz A. Álvarez-González C. A. (2023). The N: Chl-a ratio defines the optimal physiological state in marine microalgae. Algal Res.71, 103077. doi: 10.1016/j.algal.2023.103077
29
Qin Y. Li X. Li J. Zhou Y. Xiang Z. Ma H. et al . (2021). Seasonal variations in biochemical composition and nutritional quality of Crassostrea hongkongensis, in relation to the gametogenic cycle. Food Chem.356, 129736. doi: 10.1016/j.foodchem.2021.129736
30
Ren J. S. Marsden I. D. Ross A. H. Schiel D. R. (2003). Seasonal variation in the reproductive activity and biochemical composition of the Pacific oyster (Crassostrea gigas) from the Marlborough Sounds, New Zealand. N. Z. J. Mar. Freshw. Res.37, 171–182. doi: 10.1080/00288330.2003.9517155
31
Roach P. J. Depaoli-Roach A. A. Hurley T. D. Tagliabracci V. S. (2012). Glycogen and its metabolism: some new developments and old themes. Biochem. J.441, 763–787. doi: 10.1042/BJ20111416
32
Samain J. (2011). Review and perspectives of physiological mechanisms underlying genetically based resistance of the Pacific oyster Crassostrea gigas to summer mortality. Aquat. Living Resour.24, 227–236. doi: 10.1051/alr/2011144
33
She Z. Li L. Qi H. Song K. Que H. Zhang G. (2015). Candidate gene polymorphisms and their association with glycogen content in the Pacific oyster Crassostrea gigas. PloS One10, e124401. doi: 10.1371/journal.pone.0124401
34
Swift M. L. Thomas T. P. Humphrey C. L. (1988). Characteristics of glycogen synthase activity in the oyster, Crassostrea virginica Gmelin. Comp. Biochem. Physiol. B Biochem. Mol. Biol.90, 361–365. doi: 10.1016/0305-0491(88)90087-9
35
Tang L. Q. Xiao C. L. Wang W. P. (2012). Research and application progress of SNP markers. Chin. Agric. Sci. Bull.28, 154–158. doi: 10.3969/j.issn.1000-6850.2012.12.028
36
Tong Y. N. Gao F. Y. Liu Z. G. Wang M. Cao J. M. Yi M. M. et al . (2023). Screening of SNP locus and association with growth traits of MYF5 gene in Nile tilapia (Oreochromis niloticus). J. DaLian Ocean Univ.38, 935–946. doi: 10.16535/j.cnki.dlhyxb.2023-073
37
Wang Y. Liu Z. Chen X. Zhou L. Sun X. Yu T. et al . (2023). Identification and characterization of gys and gsk3β provides insights into the regulation of glycogen synthesis in Jinjiang oyster Crassostrea ariakensis. Fishes.8, 65. doi: 10.3390/fishes8020065
38
Wang X. Wei Y. Cong R. Wang W. Qi H. Zhang G. et al . (2024). DNA methylation-mediated energy metabolism provides new insight into the quality losses during oyster reproductive process. Aquaculture.583, 740595. doi: 10.1016/j.aquaculture.2024.740595
39
Xia J. He X. Yu Z. (2009). Isolation and characterization of fourteen novel microsatellite loci in the hong kong oyster, Crassostrea hongkongensis. Conserv. Genet.10, 1829–1832. doi: 10.1007/s10592-009-9826-z
40
Zeng Z. Ni J. Ke C. (2013). Expression of glycogen synthase (GYS) and glycogen synthase kinase 3β (gsk3β) of the Fujian oyster, Crassostrea angulata, in relation to glycogen content in gonad development. Comp. Biochem. Physiol. B Biochem. Mol. Biol.166, 203–214. doi: 10.1016/j.cbpb.2013.09.003
41
Zeng Z. Ni J. Ke C. (2015). Glycogen content relative to expression of glycogen phosphorylase (Gph) and hexokinase (Hk) during the reproductive cycle in the Fujian oyster, Crassostrea angulata. Acta Oceanol. Sin.34, 66–76. doi: 10.1007/s13131-015-0639-2
42
Zhang Z. Ersoz E. Lai C. Todhunter R. J. Tiwari H. K. Gore M. A. et al . (2010). Mixed linear model approach adapted for genome-wide association studies. Nat. Genet.42, 355–360. doi: 10.1038/ng.546
43
Zhang Z. C. Xue C. H. Gao X. Li Z. J. Wang Q. (2006). Monthly changes of glycogen, lipid and free amino acid of oyster. J. Ocean Univ.5, 257–262. doi: 10.1007/s11802-006-0011-4
44
Zhao N. Hou M. Wang T. Chen Y. Lv Y. Li Z. et al . (2014). Cloning and expression patterns of the brine shrimp (Artemia sinica) glycogen phosphorylase (GPase) gene during development and in response to temperature stress. Mol. Biol. Rep.41, 9–18. doi: 10.1007/s11033-013-2764-3
45
Zhong J. D. Li Q. Xu C. J. Liu S. K. (2019). Seasonal variation in growth and gonadal development of the Pacific oyster “Haida No. 3“ in relation to the nutritive components. J. Fish. China44, 411–418. doi: 10.11964/jfc.201901116341
Summary
Keywords
Crassostrea hongkongensis , glycogen, single nucleotide polymorphism, association analysis, glycogen synthase, glycogen phosphorylase
Citation
Kong L, Chen Z, Jia Z, Deng Q, Zhu P, Xu Y and She Z (2025) Identification of single nucleotide polymorphisms in key glycogen metabolism genes of Crassostrea hongkongensis and their association with glycogen content. Front. Mar. Sci. 12:1532465. doi: 10.3389/fmars.2025.1532465
Received
22 November 2024
Accepted
23 April 2025
Published
15 May 2025
Volume
12 - 2025
Edited by
Fei Xu, Chinese Academy of Sciences (CAS), China
Reviewed by
Yanping Qin, Chinese Academy of Sciences (CAS), China
Wengang Lü, Guangdong Ocean University, China
Updates
Copyright
© 2025 Kong, Chen, Jia, Deng, Zhu, Xu and She.
This is an open-access article distributed under the terms of the Creative Commons Attribution License (CC BY). The use, distribution or reproduction in other forums is permitted, provided the original author(s) and the copyright owner(s) are credited and that the original publication in this journal is cited, in accordance with accepted academic practice. No use, distribution or reproduction is permitted which does not comply with these terms.
*Correspondence: Zhicai She, shezc@bbgu.edu.cn
Disclaimer
All claims expressed in this article are solely those of the authors and do not necessarily represent those of their affiliated organizations, or those of the publisher, the editors and the reviewers. Any product that may be evaluated in this article or claim that may be made by its manufacturer is not guaranteed or endorsed by the publisher.