 Fábio L. Matos
 Ana Hilário
 Heliana Teixeira
- Centre for Environmental and Marine Studies (CESAM), Department of Biology, University of Aveiro, Aveiro, Portugal
Pressures on the marine environment threaten biodiversity, ecosystem functions and services. Current marine environmental policies, such as the European Marine Strategy Framework Directive, require the assessment of combined effects and the application of ecosystem-based management approaches to maintain or achieve Good Environmental Status (GES) of marine ecosystems. We mapped the major activities and pressures affecting deep-sea benthic habitats in the mainland component of the Portuguese EEZ to assess their combined effects and support decision-making on management and conservation. Activities related to marine traffic, fisheries, and climate change processes are among the most prevalent in the study area. As a data-poor case study, most of the pressure layers were only partially mapped due to a lack of information or the inadequacy of the available data on activities to derive suitable proxies of pressure intensity. Pressures related to chemical changes, chemicals and other pollutants were the most widespread, while abrasion and damage were the most geographically limited. Endogenic pressures dominate in bathyal benthic habitats and decrease their prevalence with depth, while exogenic pressures are more widespread in the abyss than in the bathyal area. Benthic habitats in the bathyal zone, closer to the 200-meter bathymetric contour, consistently exhibited higher combined effect scores, suggesting higher risk of potential impacts on these ecosystem components. Research directed towards these areas is required to assess the state of these habitats and develop conservation and restoration measures, if necessary, to achieve GES. A continuous support for open-access databases containing high-quality, standardized, and harmonized marine data is crucial for future assessments of the combined effects of human pressures on deep-sea ecosystems.
1 Introduction
Marine ecosystems are increasingly affected by human activities (Borja et al., 2024), and the deep sea is no exception (Jouffray et al., 2020; Ramirez-Llodra, 2020). The largest biome on Earth is located in the ocean’s aphotic zone, below 200 meters depth, and covers approximately 65% of the planet’s surface. However, the remoteness of deep sea does not protect this environment from anthropogenic impacts (Benn et al., 2010). Human activities such as fishing and the introduction of pollutants contribute to a multitude of pressures in the deep sea, including physical disturbances, litter concentration, and climate change effects such as ocean acidification and warming (Glover and Smith, 2003; Sweetman et al., 2017). However, our understanding of the deep sea and impacts of anthropogenic activities remains limited because of sampling/observing/monitoring constrains, both technical and logistical, arising from deep sea remoteness and vastness (Paulus, 2021). Nevertheless, it is already acknowledged that the deep sea harbors a rich variety of lifeforms and supports various ecosystem functions and services [e.g., habitat provision, nutrients regeneration, carbon storage (Thurber et al., 2014; Hilmi et al., 2023; La Bianca et al., 2023)].
International organizations and national governments are developing marine environmental policies and adopting mechanisms to address the protection of marine ecosystems while ensure the sustainable use of the ocean [e.g., ecosystem-based management - EBM, maritime spatial planning - MSP (Fraschetti et al., 2018; O’Hagan, 2020)]. At the European level, the Marine Strategy Framework Directive (MSFD) (European Commission, 2008) establishes a framework for EU member states to develop and implement individual marine strategies to achieve or maintain “Good Environmental Status” (GES) in their marine waters. The implementation of the MSFD requires the application of an ecosystem-based approach to the management of human activities, enabling a sustainable use of marine goods and services. For this purpose, comprehensive and consistent information on human activities is needed, as well as information on the resulting pressures and consequent state changes of ecosystem components (Smith et al., 2016; Borgwardt et al., 2019).
The concept of activities and pressures is central to environmental impact assessment and marine management. Activities refer to human actions within the system to be managed, whereas pressures are the mechanisms resulting from activities that directly impact the environment (Elliott et al., 2017). Pressures can be classified as endogenic, if generated within the system under study, or exogenic, if they result from outside the system (e.g., due to climate change or seismic activity) (Elliott, 2011). While endogenic pressures can be locally manageable, exogenic pressures are not and management decisions can only respond to their effects (Elliott, 2011). Another key aspect of the assessment of the impact of human activities and derived pressures is the identification of the ecosystem components (EC) potentially affected (Eastwood et al., 2007). In addition to our limited understanding of the impacts resulting from human activities on the deep sea, our knowledge of the distribution of deep-sea ecosystem components is also basic. The European Nature Information System (EUNIS) developed a comprehensive and hierarchical classification system for benthic habitats considering environmental factors that impact biological communities (Galparsoro et al., 2012). Although the EUNIS classification for deep-sea habitats has been improved (Howell, 2010; Galparsoro et al., 2012), its application in the European broad-scale seabed habitat map (EUSeaMap 2023; Vasquez et al., 2021) still relies solely on depth and substrate information (EUNIS 2019 - level 3), mostly due to a generalized lack of knowledge of the distribution of biological communities at deeper environments to support habitat mapping with higher resolution. The scarcity of readily accessible, long-term, and spatially extensive datasets on human activities and pressures coupled with limited representation of the heterogeneity of the deep-sea benthic habitats, significantly challenges the assessment of the human impacts on marine ecosystems (Smith et al., 2016). Moreover, the absence of reference or other baseline conditions hinders the identification of state changes in ecological indicators.
Several approaches have been developed to support the EBM of marine ecosystems. Spatial explicitly Cumulative Impact Assessment/Combined Effects Assessment (CIA/CEA) approaches, enable the quantification of the combined effects of multiple pressures on the marine environment and guidance to targeted management action [e.g., Halpern et al. (2008)]. These approaches incorporate spatial information on the intensity of human pressures, the distribution of ecosystem components, and the vulnerability of ecosystem components to pressures affecting them. However, applying this approach is not trivial, especially for the deep sea, due to the limited availability of data on anthropogenic activities and pressures affecting this environment, as well as how ecosystem components respond to these pressures (Howell et al., 2020). This makes any attempt to conduct a CEA in a deep-sea area a typical case study characterized by poor data availability (e.g., Rodrigues et al., 2023). Spatial Cumulative Assessment of Impact Risk for Management (SCAIRM) is another CEA approach that calculates Impact Risk (IR) by integrating expert judgment and quantitative methods into a single framework (Piet et al., 2023). Because it allows the integration of qualitative and quantitative information into a single approach, this method is more easily applied in data-poor areas. SCAIRM relies on a linkage framework consisting of impact chains that connect activities to pressures, and pressures to ecosystem components. To calculate the IR, this approach incorporates estimates of Exposure (i.e., the spatial overlap of an EC with a given pressure) and Effect Potential (i.e., the degree to which an EC is likely to be affected by a pressure). However, CEA approaches typically make several assumptions (Halpern and Fujita, 2013) and therefore, the results might be subject to high uncertainty. Hence, assessing the uncertainty of model results is a crucial component of CEA, directly relevant to the management process of ecosystem components (Stelzenmüller et al., 2018; Murphy et al., 2024).
Located within the Northeast Atlantic Ocean, the Portuguese maritime space holds significant potential for natural resources and cultural heritage (Fernandes et al., 2017). The Exclusive Economic Zone (EEZ) of Portugal extends over 1.7 million km² and is divided into three sub-areas: the Azores, Madeira, and Mainland Portugal. The Mainland component extends from the continental shelf to the abyssal plain, encompassing several topographic features such as submarine canyons and seamounts. The narrow continental shelf is followed by a steep continental slope, which reduces the extent of the seabed within the 200-2000 m depth bands, culminating in large abyssal plains (Stratoudakis et al., 2019). Two Ecologically or Biologically Significant Areas (EBSAs), considered essential for key ecological functions and processes by the Convention on Biological Diversity (Dunn et al., 2014), are included within the Mainland Portugal EEZ: the West Iberian Canyons and the Banks and Madeira-Tore. These areas are marine hotspots with diverse benthic communities, characterized by enhanced productivity compared to adjacent areas and supporting important spawning grounds for various species. Among deep-sea environments, the Mainland Portugal EEZ hosts vulnerable marine ecosystems (VMEs) indicators and habitat types, such as cold-water corals, sponge aggregations, and cold seeps (e.g., mud volcanoes) (ICES, 2020). Marine Protected Areas (MPAs) have been recognized as key elements in the suite of measures designed to attain GES under the MSFD (European Commission, 2008). Portugal has proposed and/or designated (sensu Grorud-Colvert et al., 2021) over 140 MPAs, encompassing various protection levels and habitats, but fully protected marine reserves are still limited in number and area covered (Stratoudakis et al., 2019). At present, there are no fully protected MPAs in the Mainland Portugal EEZ encompassing deep-sea ecosystems.
Previous studies aiming to assess the combined effect of human activities within the Mainland Portugal EEZ focused essentially within the limits of territorial waters (12 nautical miles) (Batista et al., 2014; Fernandes et al., 2017). Currently, there is no clear picture of the mains activities affecting deep-sea ecosystems within the Mainland Portugal EEZ and resulting impact chains. With this study we aim to (i) map activities affecting the deep-sea areas within the Mainland Portugal EEZ, (ii) determine how these activities generate pressures on deep-sea ecosystems and set a baseline of the pressures effects, and (iii) identify areas with high levels of human impacts that might require conservation and management measures to mitigate negative effects on marine ecosystems.
2 Materials and methods
The study area encompasses the seabed below the 200 meters depth, within the Portuguese EEZ sub-area Mainland Portugal. It includes four MPAs, either proposed or designated, that cover deep-sea regions: the Nazaré Canyon, Gorringe Bank, Amperè - Coral Patch and Mud Volcanoes. The Amperè - Coral Patch MPA partially encompass areas within the Extended Continental Shelf claimed under the United Nations Convention on the Law of the Sea, as well as of the EEZ of the Madeira Archipelago (Figure 1). The data sources about the geographical limits and bathymetric information are identified in Table 1. The coordinate reference system used in this study is the ETRS89-extended/LAEA Europe (EPSG:3035), and the resolution adopted for the data layers is 3 x 3 km.
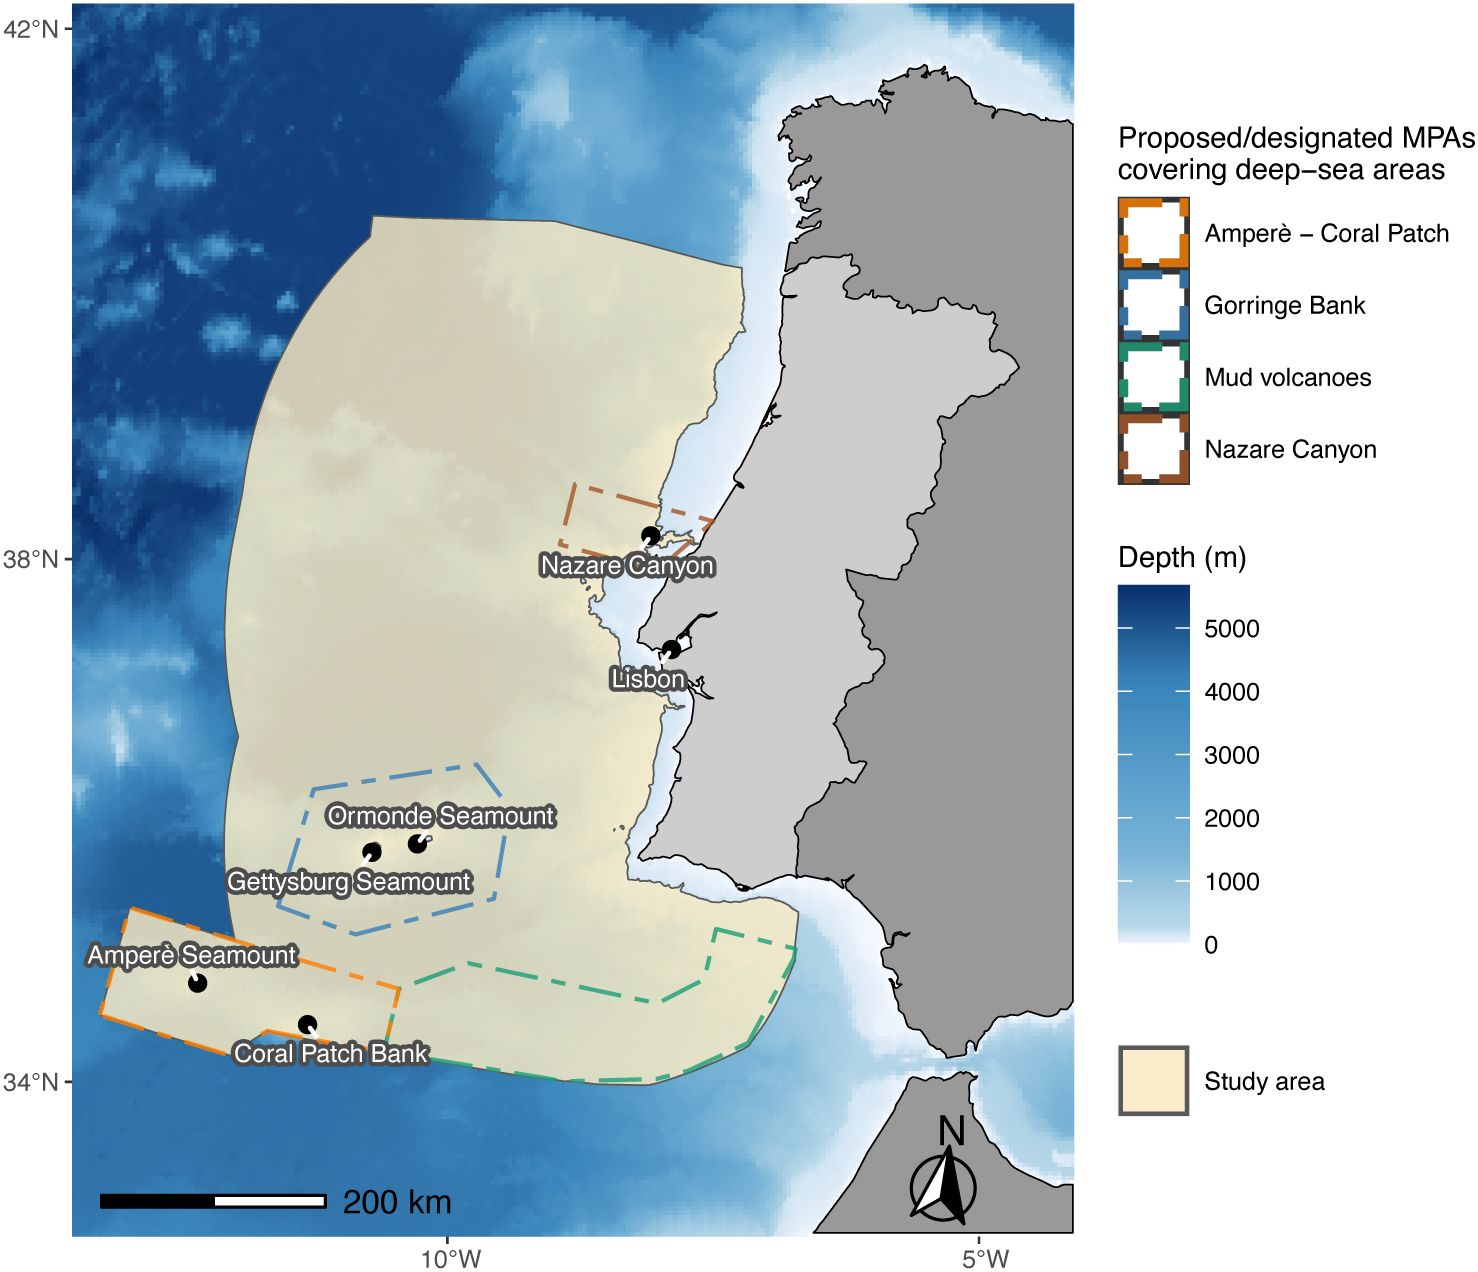
Figure 1. Map of the study area, encompassing the Mainland component of the Portuguese Exclusive Economic Zone (EEZ) beyond the 200-meter depth. Dashed lines indicate the spatial limits of four proposed or designated MPAs which include deep-sea areas: Amperè-Coral Patch (including portions of the Madeira Archipelago’s EEZ and the claimed Portuguese Extended Continental Shelf), Mud Volcanoes, Gorringe Bank, and the Nazare Canyon.
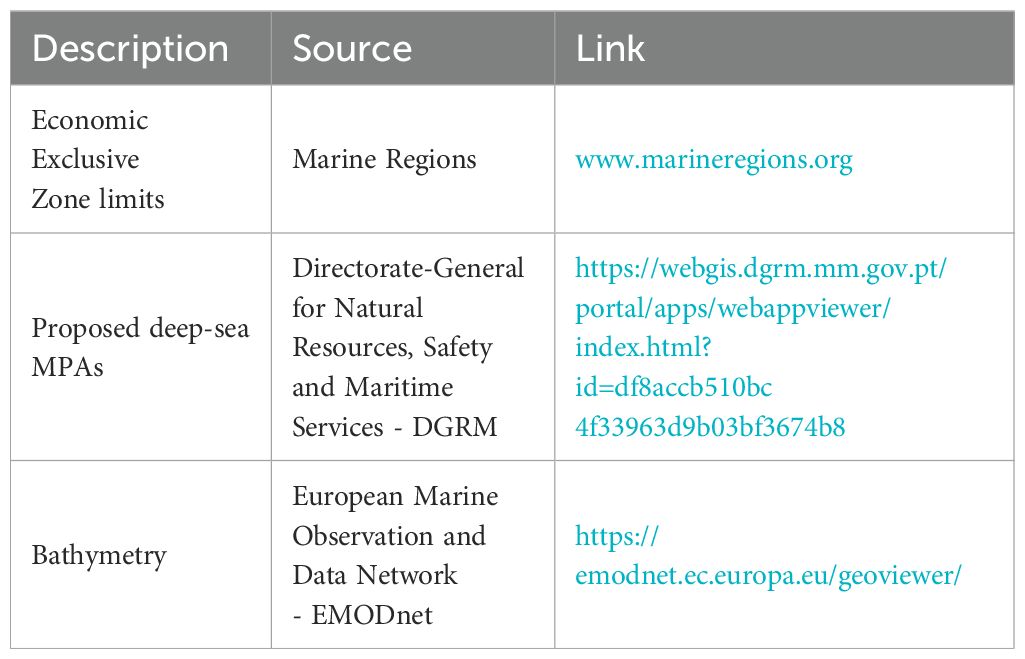
Table 1. Data sources for the spatial and political boundaries of the Portuguese Exclusive Economic Zone, proposed deep-sea marine protected areas (MPAs), and bathymetry considered in this study.
The CEA was limited to the seabed ecosystem components (i.e., benthic habitats) because the available data on human activities would not provide the depth ranges at which activities occurred for most of the datasets, requiring a different approach to discriminate the effects of the associated pressures across the different pelagic habitats. The list of human activities and pressures occurring or potentially occurring within the study area was derived from a subset of an existing database adapted from Borgwardt et al. (2019).
Data processing and analysis were conducted using QGIS 3.34 (QGIS.org, 2023) and the packages raster (Hijmans, 2024) and sf (Pebesma, 2018) for R (R Core Team, 2024). Data visualization was produced using the R packages ggplot2 (Wickham, 2016), ggOceanMaps (Vihtakari, 2024), ggalluvial (Brunson, 2020) and ggrepel (Slowikowski, 2024).
2.1 Ecosystem component
Ecosystem component data layers were generated from the most updated version of EMODnet broad-scale seabed habitat map for Europe (version 2023). Habitat descriptions were derived from the EUNIS 2022 full description, or from other unpublished classifications where EUNIS 2022 was not applicable as specified in Mickaël et al. (2023). We rasterized the EC spatial data into a 3 x 3 km grid, calculating the proportion of EC coverage area (ranging from 0 to 1) within each grid cell for all ECs present in the cell. This means that within the same area (i.e., grid cell) information for multiple ECs can be available, although it is separated in different data layers, one for each ecosystem component.
2.2 Human activities
Data on human activities were compiled using multiple data sources (Supplementary Table S1) drawing on the best available open-access information. When information of human activities was available for more than one year, we calculated the average across the entire time range, except for climate change. We should also mention here that this study considered the recent past to select data for mapping only “current” activities. However, the term “recent past” encompasses a broad timeframe, especially considering the slow dynamics of deep-sea environments and the poor temporal resolution of the information available. Original datasets were processed into a raster format with 3 x 3 km resolution prior to CEA analysis as detailed in the sub-sections below. A summary of processing steps is listed in Table 2. Due to the lack of detailed information to differentiate between specific primary activities (e.g., general vs. operational), the same indicator of activity intensity (e.g., average annual fishing hours) was used for each grouped primary activity (e.g., fishing).
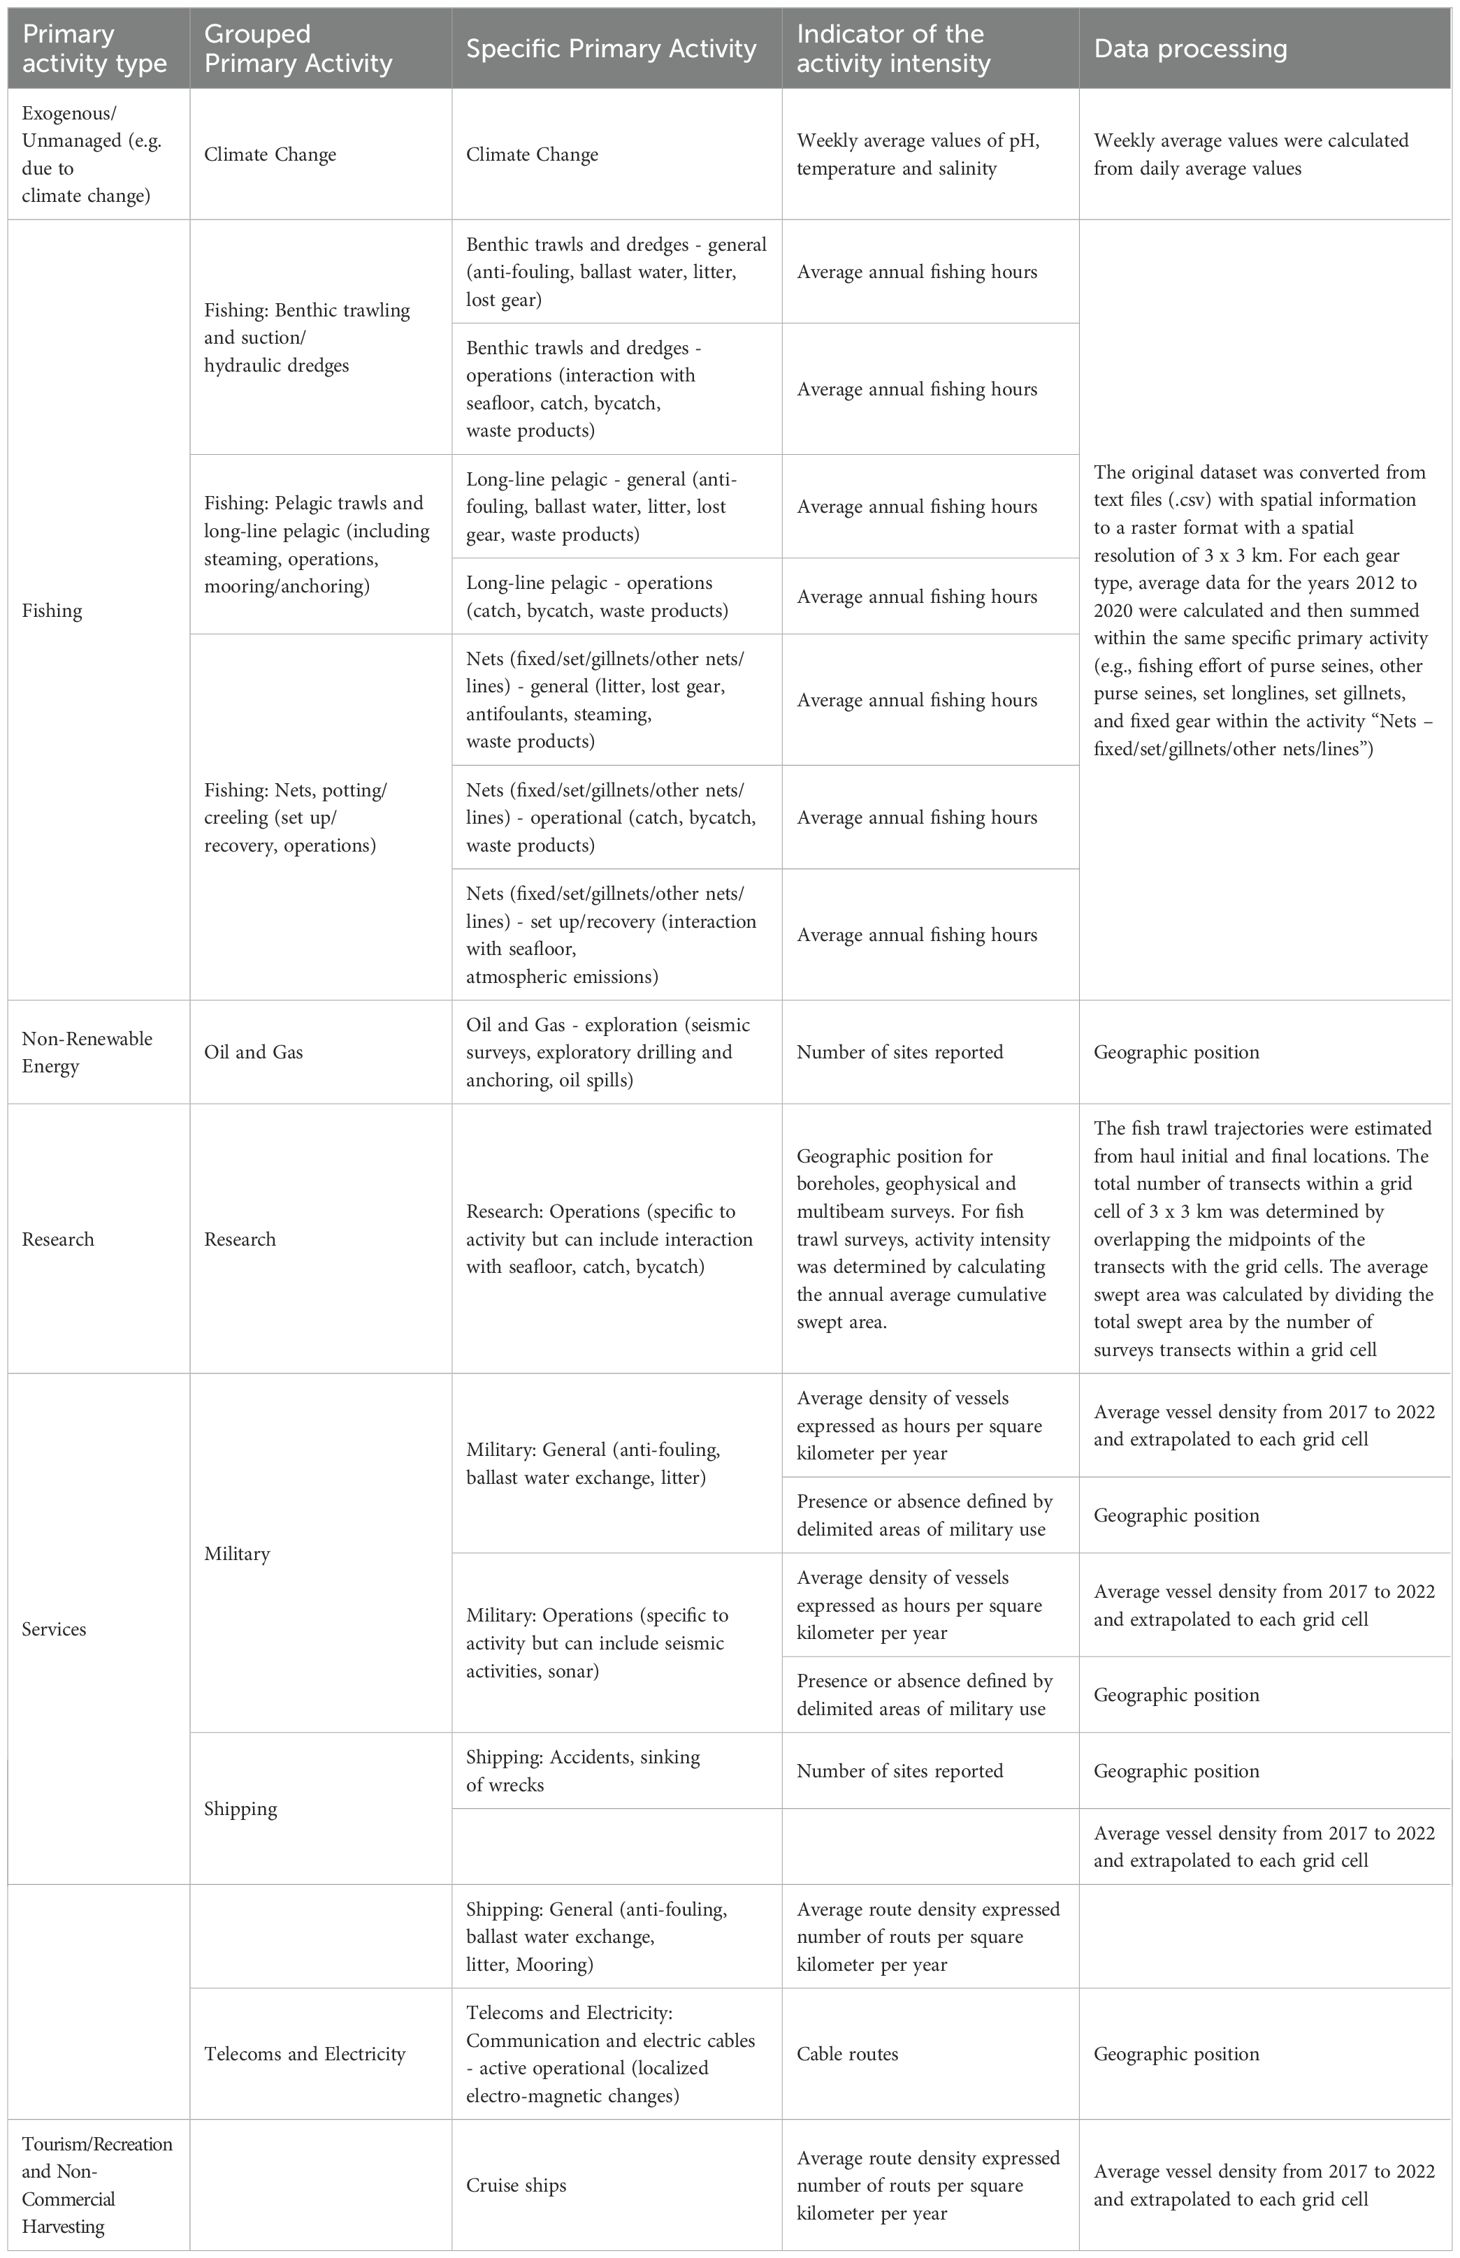
Table 2. List of data layers on human activities considered in the study and indicators of activity intensity, along with details on the data processing to generate the respective activity layer.
2.2.1 Fishing
To assess the fishing activities footprint, we used data from Global Fishing Watch, which is based on AIS-derived fishing effort and vessel presence datasets (Souza et al., 2016; Kroodsma et al., 2018). These datasets cover the period from 2012 to 2020 and allowed to estimate fishing intensity for various fleets: net and fixed gear (including purse seines, set longlines, gillnets, and fixed gear), as well as pelagic longlines and benthic trawlers. We assumed the available data on trawling fishing effort from the Global Fishing Watch database corresponds to benthic trawls within the study area. This decision was based on the locations with identified fishing activity and the composition of the current Portuguese fishing fleet (Campos et al., 2021). The original datasets are provided at a 0.01-degree grid resolution and represent the hours of fishing effort by gear type for each year. We aggregated this data into a 3 x 3 km resolution data layer based on fishing gear and year, and then calculated the fishing intensity for each gear type by averaging the available information across years. Finally, this information was summed whenever more than one gear type contributed to a specific primary activity to produce a single data layer of the activity intensity (e.g., Nets – fixed/set/gillnets/other nets/lines, Supplementary Table S1).
2.2.2 Non-renewable energy - oil and gas
Information on the intensity of oil and gas activities was obtained from the Directorate-General for Energy and Geology (DGEG), namely data on seismic survey, piston core samples, and survey/drilling operations. Given the absence of current hydrocarbon exploitation activities within the study area, only proxies for the intensity of oil and gas exploration activity were generated. Due to the absence of data regarding sound propagation resulting from 2D seismic surveys, important for CEA (Carroll et al., 2017), this information was not considered when generating the data layer representing the intensity of oil and gas exploration.
2.2.3 Research
To estimate the intensity of the Research activities in the study area data was sourced from SeaDataNet - Pan-European Infrastructure for Ocean and Marine Data Management (Schaap and Lowry, 2010), EMODnet - European Marine Observation and Data Network and DATRAS, the online database of trawl surveys of the International Council for the Exploration of the Sea (ICES). From SeaDataNet, we extracted information available for the years between 2014 and 2023, licensed under Creative Commons Attribution 4.0 International, and directed toward the deep-sea floor sampling or mapping, which included only data for multibeam surveys. The data extracted from EMODnet included information on boreholes and geophysical survey lines. As with 2D seismic surveys for oil and gas exploration, no data was available on sound propagation for the geophysical and multibeam survey, therefore this information was not included in the data layer generated to represent the intensity of the Research activity. For the data extracted from DATRAS, since exact trajectories were unavailable, estimated survey trajectories were determined using the start and end locations of the hauls. As swept area values are provided by transect, the midpoint of each transect was used to calculate the activity intensity of fishing trawlers within the intersected 3 x 3 km grid cell. When multiple transects intersected the same grid cell, the cumulative swept area was estimated and divided by the total number of transects. The Research activity intensity layer was constructed by determining the total area affected within each grid cell, after merging potential overlapping areas.
2.2.4 Services
Human activities related to Services identified in the study area include Shipping, Telecommunications and Energy activities, and Military operations. Shipping activity intensity was calculated by summing the routes density of tankers and cargo ships. The original routes density datasets, derived from AIS data, were extracted from the EMODnet database for the years 2019 to 2023 at a 1 km resolution. These data were subsequently aggregated to a 3 x 3 km resolution and expressed as a yearly average of vessel routes per square kilometer. Information for shipwrecks location was also available. Information regarding Telecommunications and Energy activities was obtained by combining data from schematic and actual submarine cable routes. When actual route information was available, it replaced the closest schematic route. The area of coverage in each grid cell was used to encode the intensity of the impacts resulting from this activity. For Military activities, data layers were derived from polygons delineating military areas. Given the intermittent nature of activities within these areas, the derived data layer was encoded as presence-absence information with low confidence. Additionally, information on vessel density related to military and law enforcement vessels extracted from EMODnet was aggregated into a 3 x 3 km grid data layer and encoded as the annual average number of hours per square kilometer.
2.2.5 Tourism - commercial cruises
As for Shipping activities, data on Commercial cruises were obtained from EMODnet. The intensity of related activities was assessed by calculating the routes density of vessel of passenger ships. This density was determined by calculating the average routes density for the years 2019 to 2023, measured as total number per square kilometer per year, and aggregated into a 3 x 3 km resolution data layer.
2.2.6 Climate change
Climate change was the only exogenous activity assessed for its pressures in this study. Data on daily average ocean conditions for seawater temperature, salinity and pH were extracted from the Copernicus Marine Environment Monitoring Service (CMEMS, Supplementary Table S1) for the period between 1993 and 2021. The data include information for 50 unevenly distributed depth layers, ranging from near the sea surface to a depth of 5698 meters. We then calculated weekly averages from this data to derive the pressure layers (see section 2.3.5).
2.3 Pressures
Pressures were broadly categorized into five groups: Physical Change, Biological Disturbance, Chemical Changes, Chemical and Other Pollution, Energy and Exogenous/Unmanaged Processes (Supplementary Table S2). They can originate from single or multiple activities and there is often lack of information to accurately measure pressure magnitude or spatial distribution, leaving little alternative but to use human activity information as proxies of pressures. In this study, pressure layers were estimated from single or multiple datasets on human activities, each capturing distinct aspects of the same pressure, while some activities could contribute to more than one pressure layer. Moreover, the datasets available within each activity were included in the data aggregation process to generate the pressure indicator layer only if deemed adequate for estimating pressure intensity. Similarly to the activities, the derived layers for pressures reflect the recent past pressures footprint (generally from 2012 onwards), i.e., pressures that are no longer acting or stopped long time ago (e.g., associated deployment stage of a given activity such as cables) were not considered.
To estimate the pressure intensity resulting from activities where only geographic location was available (e.g., point data, cable routes), buffers were applied to estimate the area potentially affected. For piston core samples and survey/drilling operations associated with Oil and Gas exploration, buffers of 10 centimeters and 25 meters (Eastwood et al., 2007) were defined, respectively. For each borehole related to Research activities, a 12.5 cm buffer was defined to estimate the potential impact area (Todd, 2017). The pressures exerted by Telecommunications and Energy activities in the study area were estimated by defining a buffer area of 1.5 meters around the cable locations (HELCOM, 2023). For the shipwrecks we used a 1000 m buffer area around wreck locations to determine the affected area (Lonsdale et al., 2020). Finally, to account for the uncertainty level in the spatial prevalence of the military activity resulting from the dataset defining military areas, the contribution of this dataset to pressure layers was weighted by a factor of 0.5 (Andersen et al., 2013).
All pressure data layers were normalized before use in the CEA analysis to ensure consistent comparability across layers on a 0-1 scale. The normalized pressure layers represent the relative spatial distribution of pressure within the study area. For pressure layers influenced by activities quantified using different metrics, we normalized the individual activity data layers before aggregation, then summed them and renormalized to obtain the final pressure layer (Halpern et al., 2009). Pressure layers were not log-transformed prior to normalization as in Halpern et al. (2008), to avoid enhancing the relative impact of low-intensity pressures (Hammar et al., 2020). Activities with negligible contribution within the study area for a given pressure were omitted from the data aggregation process to produce the pressure data layers (Supplementary Table S2).
2.3.1 Pressure inducing physical change
To generate the pressure layer ‘Abrasion/damage’, data on trawling fishing and research activity intensity was used. For the pressure layer ‘Artificialization of habitat’, datasets for submarine cables and shipwrecks were considered. Datasets contributing to each of these pressure layers were merged to avoid spatial overlap and then intersected with a 3 x 3 km grid to calculate the affected area within each cell. Finally, the pressure layers generated for “Changes in Siltation”, and “Smothering” were originated from activities with intensities measured using different metrics (Supplementary Table S2). Therefore, each dataset was normalized, and the layers were subsequently summed and renormalized to create the final pressure layer. No pressure layer was generated for ‘Barriers to species movement,’ ‘Death or Injury by Collision,’ or ‘Selective Extraction of Non-Living Resources: Substrate (e.g., gravel, mineral resources)’ due to their lack of relevance for benthic habitats, insufficient data, or the minor scale of impact in the study area, given the spatial resolution of this study.
2.3.2 Chemical changes, chemicals and other pollutants
The impacts resulting from “Changes in input of organic matter” were estimated based primarily in fishing specific primary activities. Fish discards and the deleterious effects of fishing gear on benthic communities, including injury and mortality, can lead to localized organic enrichment of the seabed (Clark et al., 2016). Data on the operations of benthic trawls, longline pelagic gear, and nets/fixed gears were aggregated to estimate the change in organic matter input resulting from these activities. For this pressure, information from research operations resulting from fishing surveys was also considered. The sources of “Introduction of Synthetic Compounds” and “Introduction of Non-Synthetic Compounds” in the deep sea are multiple (e.g., fishing, maritime traffic, waste disposal, and accidental spillage). For these pressure layers, information from multiple activities was considered, namely fishing activities, shipping and military operations. The pressure layer “Litter” resulted from the aggregation of activities from fisheries, military operations, shipping and commercial cruises. Given their nature and the spatial resolution of this study, the contribution of activities with available data that could result in the “Introduction of Radionuclides” and “N&P Enrichment” was assumed to be negligible.
2.3.3 Energy
Operational power and telecommunication cables equipped with power relays, generate electromagnetic changes in their surroundings. Localized electric and magnetic fields can influence the behavior and migration patterns of species such as elasmobranchs, potentially affecting actions like attraction, repulsion, feeding, and orientation (Hermans et al., 2024). However, the available information for the study area only reports the cables as communication cables, without specifying any energy transmission. Consequently, we did not consider the pressure ‘electromagnetic changes’ in our analysis. Likewise, the pressure resulting from ‘Noise (Underwater and Other)’ was omitted from the analysis due to the lack of publicly available data on noise propagation. Sound propagation in water is not linear, instead sound waves are subject to reflection, refraction, and diffraction, altering their trajectory (Erbe et al., 2022). While vessel routes density can provide information on noise energy emission, this data is inadequate for assessing the impacts of underwater noise at the seabed. Nonetheless, increasing levels of underwater noise generated by human activities have negative consequences for marine life. Noise disrupts critical behaviors such as communication, navigation, and feeding, and induce high levels of stress in organisms including whales, dolphins, fish, and invertebrates (Duarte et al., 2021).
2.3.4 Biological disturbance
The pressure layers for “Extraction of flora and/or fauna” and “Translocations of species (native or non-native)” were derived from aggregated data on benthic trawling, fisheries utilizing nets and fixed gears, and fishing surveys conducted in the context of research. For the pressure layer “Introduction of Microbial Pathogens,” information was aggregated from benthic trawling, fisheries using nets and fixed gears, and longline fisheries as a result of gear loss and discharge. Additionally, fishing surveys and information on military activity were also included. The “Introduction of non-indigenous species” into the marine environment is facilitated primarily by maritime traffic (Katsanevakis et al., 2023), through ships’ ballast water tanks and hull biofouling. Given that this study focuses on the pressures impact on the seafloor below 200 meters depth resulting from human activities, the impact of the introduction of non-indigenous species was considered negligible.
2.3.5 Exogenous/unmanaged processes: temperature, salinity and pH changes
Changes in sea water conditions due to climate change were determined following the method described in Halpern et al., 2008 to calculate a metric of change. To establish a baseline for seawater temperature and salinity levels, we calculated the long-term weekly average for each grid cell within each depth layer using data spanning 1993 to 2021 (i.e., 1515 weeks). We then determined the number of weeks where the anomaly in each variable (i.e., the difference between the weekly average and the long-term weekly average) exceeded the standard deviation for each location (i.e., grid cell) and week of the year. To quantify change over time, we then compared the frequency of positive anomalies between the recent period (2016-2021, 315 weeks) and the early period (1993-1998, 315 weeks). For pH, we employed a similar approach but compared the frequency of negative anomalies (decrease of pH level) between the two periods. Finally, for each variable, data were extrapolated onto the study area’s bathymetry at a 3 x 3 km resolution by matching cell grid depths to the closest available depth layer within the variable’s dataset, resulting in a continuous representation of near-seafloor conditions.
2.4 Overall impact risk for the study area
The interplay among human activities (A), pressures (P), and ecosystem components (EC) has typically been conceptualized within linkage-based frameworks, facilitating the identification and analysis of impact chains (Knights et al., 2013, 2015). For the activities and pressures with available data, we weighted each APEC chain following the SCAIRM approach (Piet et al., 2023) to estimate the overall Impact Risk by EC. The spatial extent of a pressure was determined by the relative overlap of an activity with the total area of each ecosystem component within the study area. Frequency was estimated as the average number of events per year co-occurring with each EC (e.g., average number of trawl passages/fishing sets per year), using the indicator of the pressure intensity and information from literature (Supplementary Table S3). Magnitude was calculated based on the average pressure intensity within the EC. The value used to define the highest magnitude of a pressure (maximum), necessary to standardize the parameter for calculating the IR, was determined based on the pressure indicator. For indicators based on areas, we used the average area impacted in the EC divided by the total area of the EC. For pressures measured in hours, we used the total number of hours in a year to standardize the magnitude value. For exogenous pressures, we average by the total number of weeks in a 6-years period. For vessels/routes density, we used the maximum density recorded in each EC over the analysis period. Finally, for the military area, defined as presence or absence, we set the magnitude as low to account for the uncertainty of the pressure proxy (magnitude set at 0.01; adverse effects expected but ≤ 1% of maximum).
Dispersal, hazard, behavior, and recovery time were defined using information estimated by expert judgment for the North Sea (Piet et al., 2023). Some degree of interchangeability in the values of these parameters can be expected between regions for the same pressures and ecosystem components, although some differences may exist. The impact risk score (0-1) represents the likelihood that an ecosystem component status or function will decrease by a certain proportion because of a pressure. In this work, the impact risk score was not spatially explicit determined, therefore it does not account for the spatial variability within ecosystem components identified in the study area. This risk score is presented as a complimentary information to the spatially explicit CEA (next section).
2.5 Spatial distribution of combined effects
For the CEA we applied the algorithm developed by Halpern et al. (2008), considering additive effects of multiple pressures. A vulnerability score was used to weight the potential impact of the pressure on a given ecosystem component (Supplementary Table S4). The vulnerability scores represent the relative impact of anthropogenic activities on an ecosystem component when both are present and were selected from Halpern et al. (2007). Considering that, the classification of ecosystem components differed from the original source of the vulnerability scores, we adopted the closest available classification. This correspondence was established based on the bathymetric distribution and substrate type of the EC. For example, “Atlantic upper bathyal rock” was classified as equivalent to ‘Hard slope’ in the original source of the vulnerability scores. For ECs classified as ‘seabed’ in the EUNIS, we assumed they were dominated by soft substrate due to their location (e.g., abyssal plains). Similarly, for pressures, we selected the vulnerability scores that most closely matched the related pressure. For example, for changes in salinity levels, we used the vulnerability scores for “thermal change”, while for litter, we adopted the scores estimated for “Pollution input: trash, urban runoff”. When multiple activities contributed to a single pressure, the vulnerability scores were averaged within each ecosystem component to obtain a single vulnerability value to that particular pressure.
The combined effect in each grid cell was calculated by multiplying the intensity of each pressure by the proportion of the ecosystem component’s coverage area (ranging from 0 to 1) and the vulnerability of the respective EC to the pressure being analyzed. We then sum the individual pressure impact scores for each grid cell to obtain the combined effect score.
2.5.1 Uncertainty and sensitivity analyses
To quantify the uncertainty in the estimates of the spatial combined effect assessment and the sensitivity of the model to various settings, we used the open-source software EcoImpactMapper (Stock, 2016). These analyses were based on seven factors related to modelling assumptions and user options: (1) missing data, (2) vulnerability score errors, (3) multiple pressure effect model: additive, antagonistic, dominant, (4) mean or sum over habitats, (5) reduced spatial resolution, (6) improved pressure resolution, and (7) ecological thresholds instead of linear responses of EC to increasing pressure. Uncertainty analysis was conducted using Monte Carlo simulations with 2500 interactions by randomly varying the seven factors. The output of this analysis estimates for each EC and pressure the percentage of simulation runs where each term was among the largest and smallest contributors to overall combined effect scores. Moreover, the simulations help identify areas consistently classified with high and low combined effect scores, using this information to recognize ‘hot spots’ and ‘cold spots’ of combined effect (e.g., Murphy et al., 2024). Finally, a sensitivity analysis was conducted to identify the factors that most influence the combined effect model outputs. The sensitivity analysis was based on the elementary effects method (Morris, 1991), as adapted by Stock and Micheli, 2016. A total of 1000 runs with random factor starting points were conducted. The absolute values of the elementary effects from these runs were then averaged for ecosystem components and for pressures to calculate the metric ‘mu*’, where higher mu* values indicate greater importance of the factor on the estimate of the combined effect model.
3 Results
The study area (i.e., the seafloor below the 200 m depth) includes 92% of the seabed area of the Mainland Portugal EEZ. The combined effect of endo- and exogenic pressures was assessed for a total of 15 benthic ECs (Supplementary Figure S1). Abyssal benthic habitats were the most representative ECs, accounting for 85% of the total area (Table 3), followed by Atlantic lower bathyal seabed (approximately 7%). The remaining ECs together occupy less than 8% of the study area.
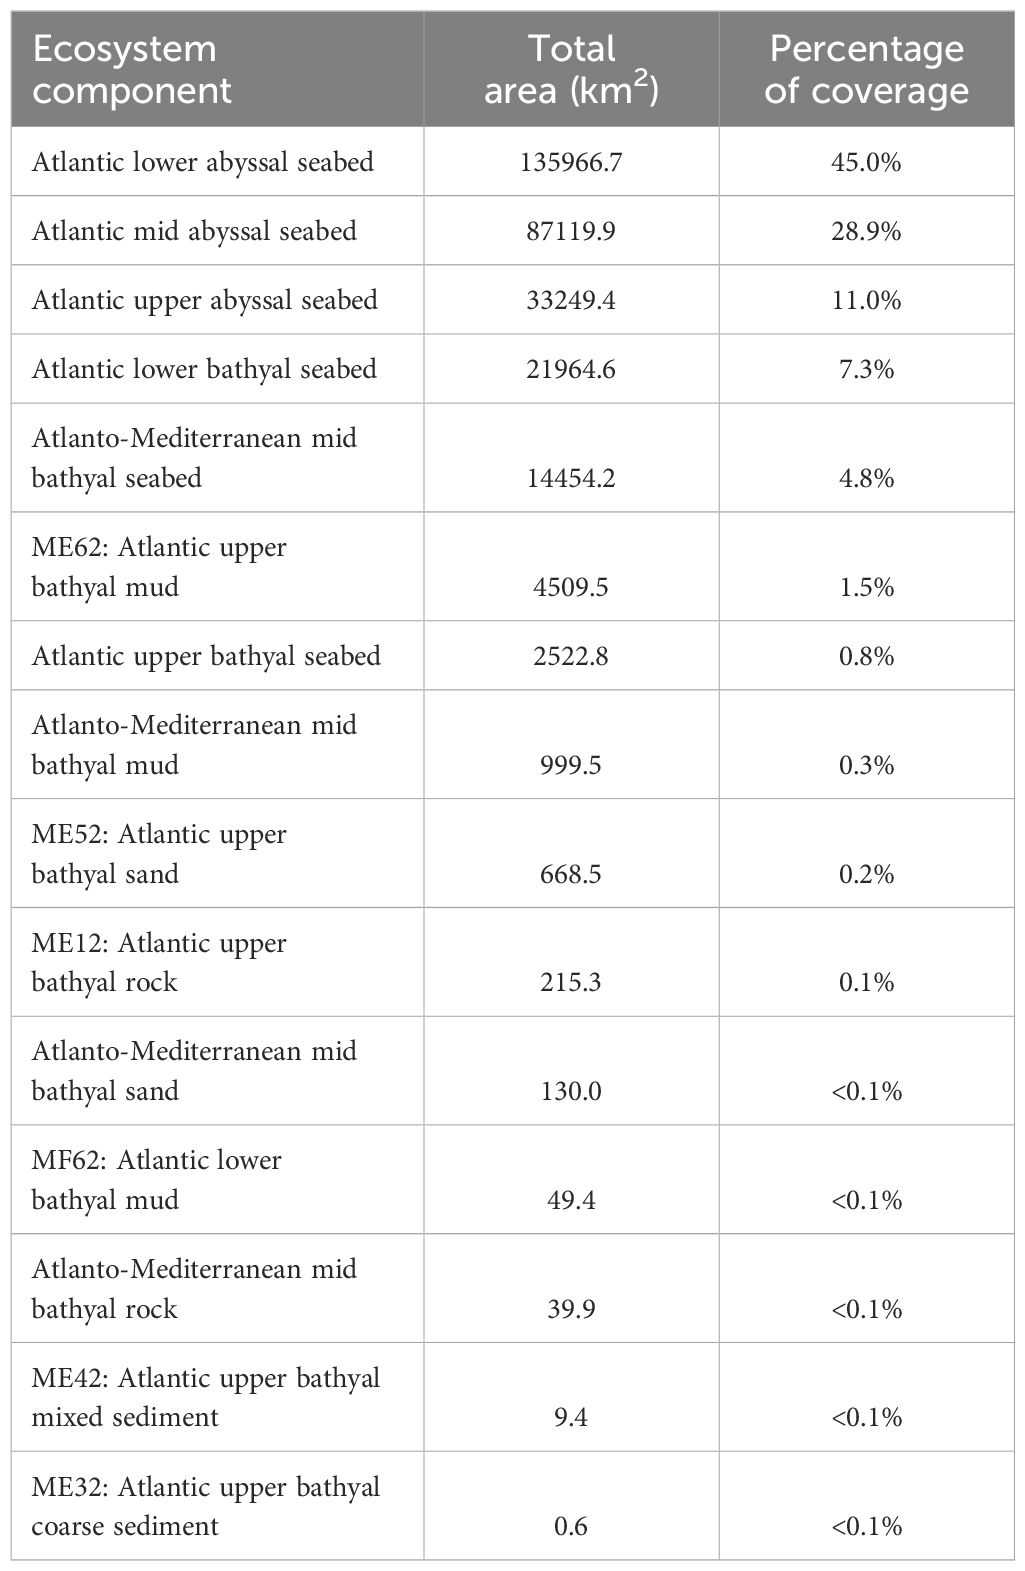
Table 3. Total area of each ecosystem component identified within the study area, below 200 meters depth.
3.1 Activities
From a total of 47 specific primary activities identified as occurring or potentially occurring within the study area, we were able to compile information for 16 (Supplementary Figures S2–S8). The temporal coverage of the datasets used varied depending on the data source. The oldest data refers to 1969 while the most recent records extend to 2023. The oldest records included in the study concerns to seismic survey and boreholes related to oil and gas exploration and research activities. Nevertheless, most of the information is related to the period from 2000 onwards. The most widespread activities in the study area, based on the number of affected cells, are marine traffic (with shipping virtually present everywhere – in 100% of the grid cells – followed by tourism cruises recorded in 81.2% of the study area) and longline fishing (83.7%). The least dispersed activities are shipwrecks (0.4%) and fish surveys (0.4%).
Fishing intensity varied across gear types. Benthic trawls and dredges had the highest fishing intensity (up to approximately 975 average annual hours per km² per year), predominantly in the southern part of mainland Portugal, followed by nets and fixed gears (up to 300 average annual hours per km² per year), concentrated more in the center-northeast of the study area. Pelagic longlines had the lowest fishing intensity recorded (up to around 55 hours, Supplementary Figure S2); however, this fishery is more dispersed across the study area. The most intense pelagic longline fishing activity occurred around the Gettysburg and Ormonde seamounts (Gorringe Bank) and the Ampère Seamount within the Ampère-Coral Patch MPA.
Oil and gas exploration operations concentrated along the continental slope while research activity was more spread throughout the study area. Regarding oil and gas exploration, 61 piston cores and survey operations were identified, affecting less than 0.008 km² of the study area. Additionally, information about six transects of 3D seismic surveys covering approximately 8532 km² (about 3% of the study area) was compiled as well as data about 1047 transects of 2D seismic surveys. However, the total affected area for the 2D surveys could not be estimated. The negligible area affected by these operations or the unsuitable format of the available information to derive adequate proxies of pressures caused by these activities led to the exclusion of information about oil and gas exploration from the estimation of activity intensity and associated pressures and consequently from the CEA. This limitation was also observed for some of the datasets related to research operations. Information about 686 boreholes, representing an affected area smaller than 0.001 km², 23 geophysical survey lines and seven multibeam surveys was collected but not considered in the CEA. The exception was the data from fishing trawling surveys, which was used to estimate the intensity of research operations in the study area. On average, around 19 km² was swept annually.
Within the activities identified for Services and Tourism, shipping and commercial cruises have maximum route densities of 4059 and 76 per km2 per year, respectively. These activities were mostly concentrated along the continental slope and more offshore areas along the western coast of mainland Portugal, while in the southern part of the study area, shipping and cruise traffic began to diverge towards the Strait of Gibraltar. For military activity, the vessel density follows a similar spatial pattern to shipping, although at lower densities (maximum density 0.06 average hours per km² per year) and more concentrated in areas closer to territorial waters. Finally, the submarine cable routes cross the study area in various directions, converging in the region closer to Lisbon and Setúbal.
Regarding climate change, the overall variation in average seafloor conditions for salinity and temperature (°C) in the study area was greater during the early period (1993-1998) compared to the recent period (2016-2021, Figure 2). When comparing the two periods for areas where anomalies were detected (Supplementary Figure S9), there is no clear trend in the salinity and temperature weekly averages over time, with differences observed between periods ranging from -0.014 to 0.033, and -0.082 to 0.131, respectively (Figure 2). Conversely, a clear decreasing trend in average pH was observed over time, becoming more pronounced when comparing the two periods, with differences between weekly averages ranging from 0.003 to 0.008. If considering the overall spatial variation for the entire study area, then more clear trends are detected for the three parameters. When analyzing the variation of each variable at the grid cell scale, the differences in the mean weekly averages between the two periods become more pronounced. Salinity and pH present an overall decreasing trend, varying respectively from -1.840 to 0.423, and from -0.082 to 0.019 (Figures 3A, B), while temperature shows increasing trends, with differences ranging from -3.880 to 5.320°C (Figure 3C). During the early period (1993-1998), 45.6% of grid cells displayed at least one week with a positive salinity anomaly that exceeded the standard deviation for a given week of the year. This proportion increased slightly to 48.4% in the recent period (2016-2021). For temperature, 52.9% of cells exhibited at least one week with a positive anomaly exceeding the standard deviation in the early period, decreasing slightly to 51.0% in the period between 2016 and 2021. With respect to pH, the frequency of cells with at least one week with a negative anomaly exceeding the standard deviation increased from 43.9% in the early period to 52.9% in the recent period.
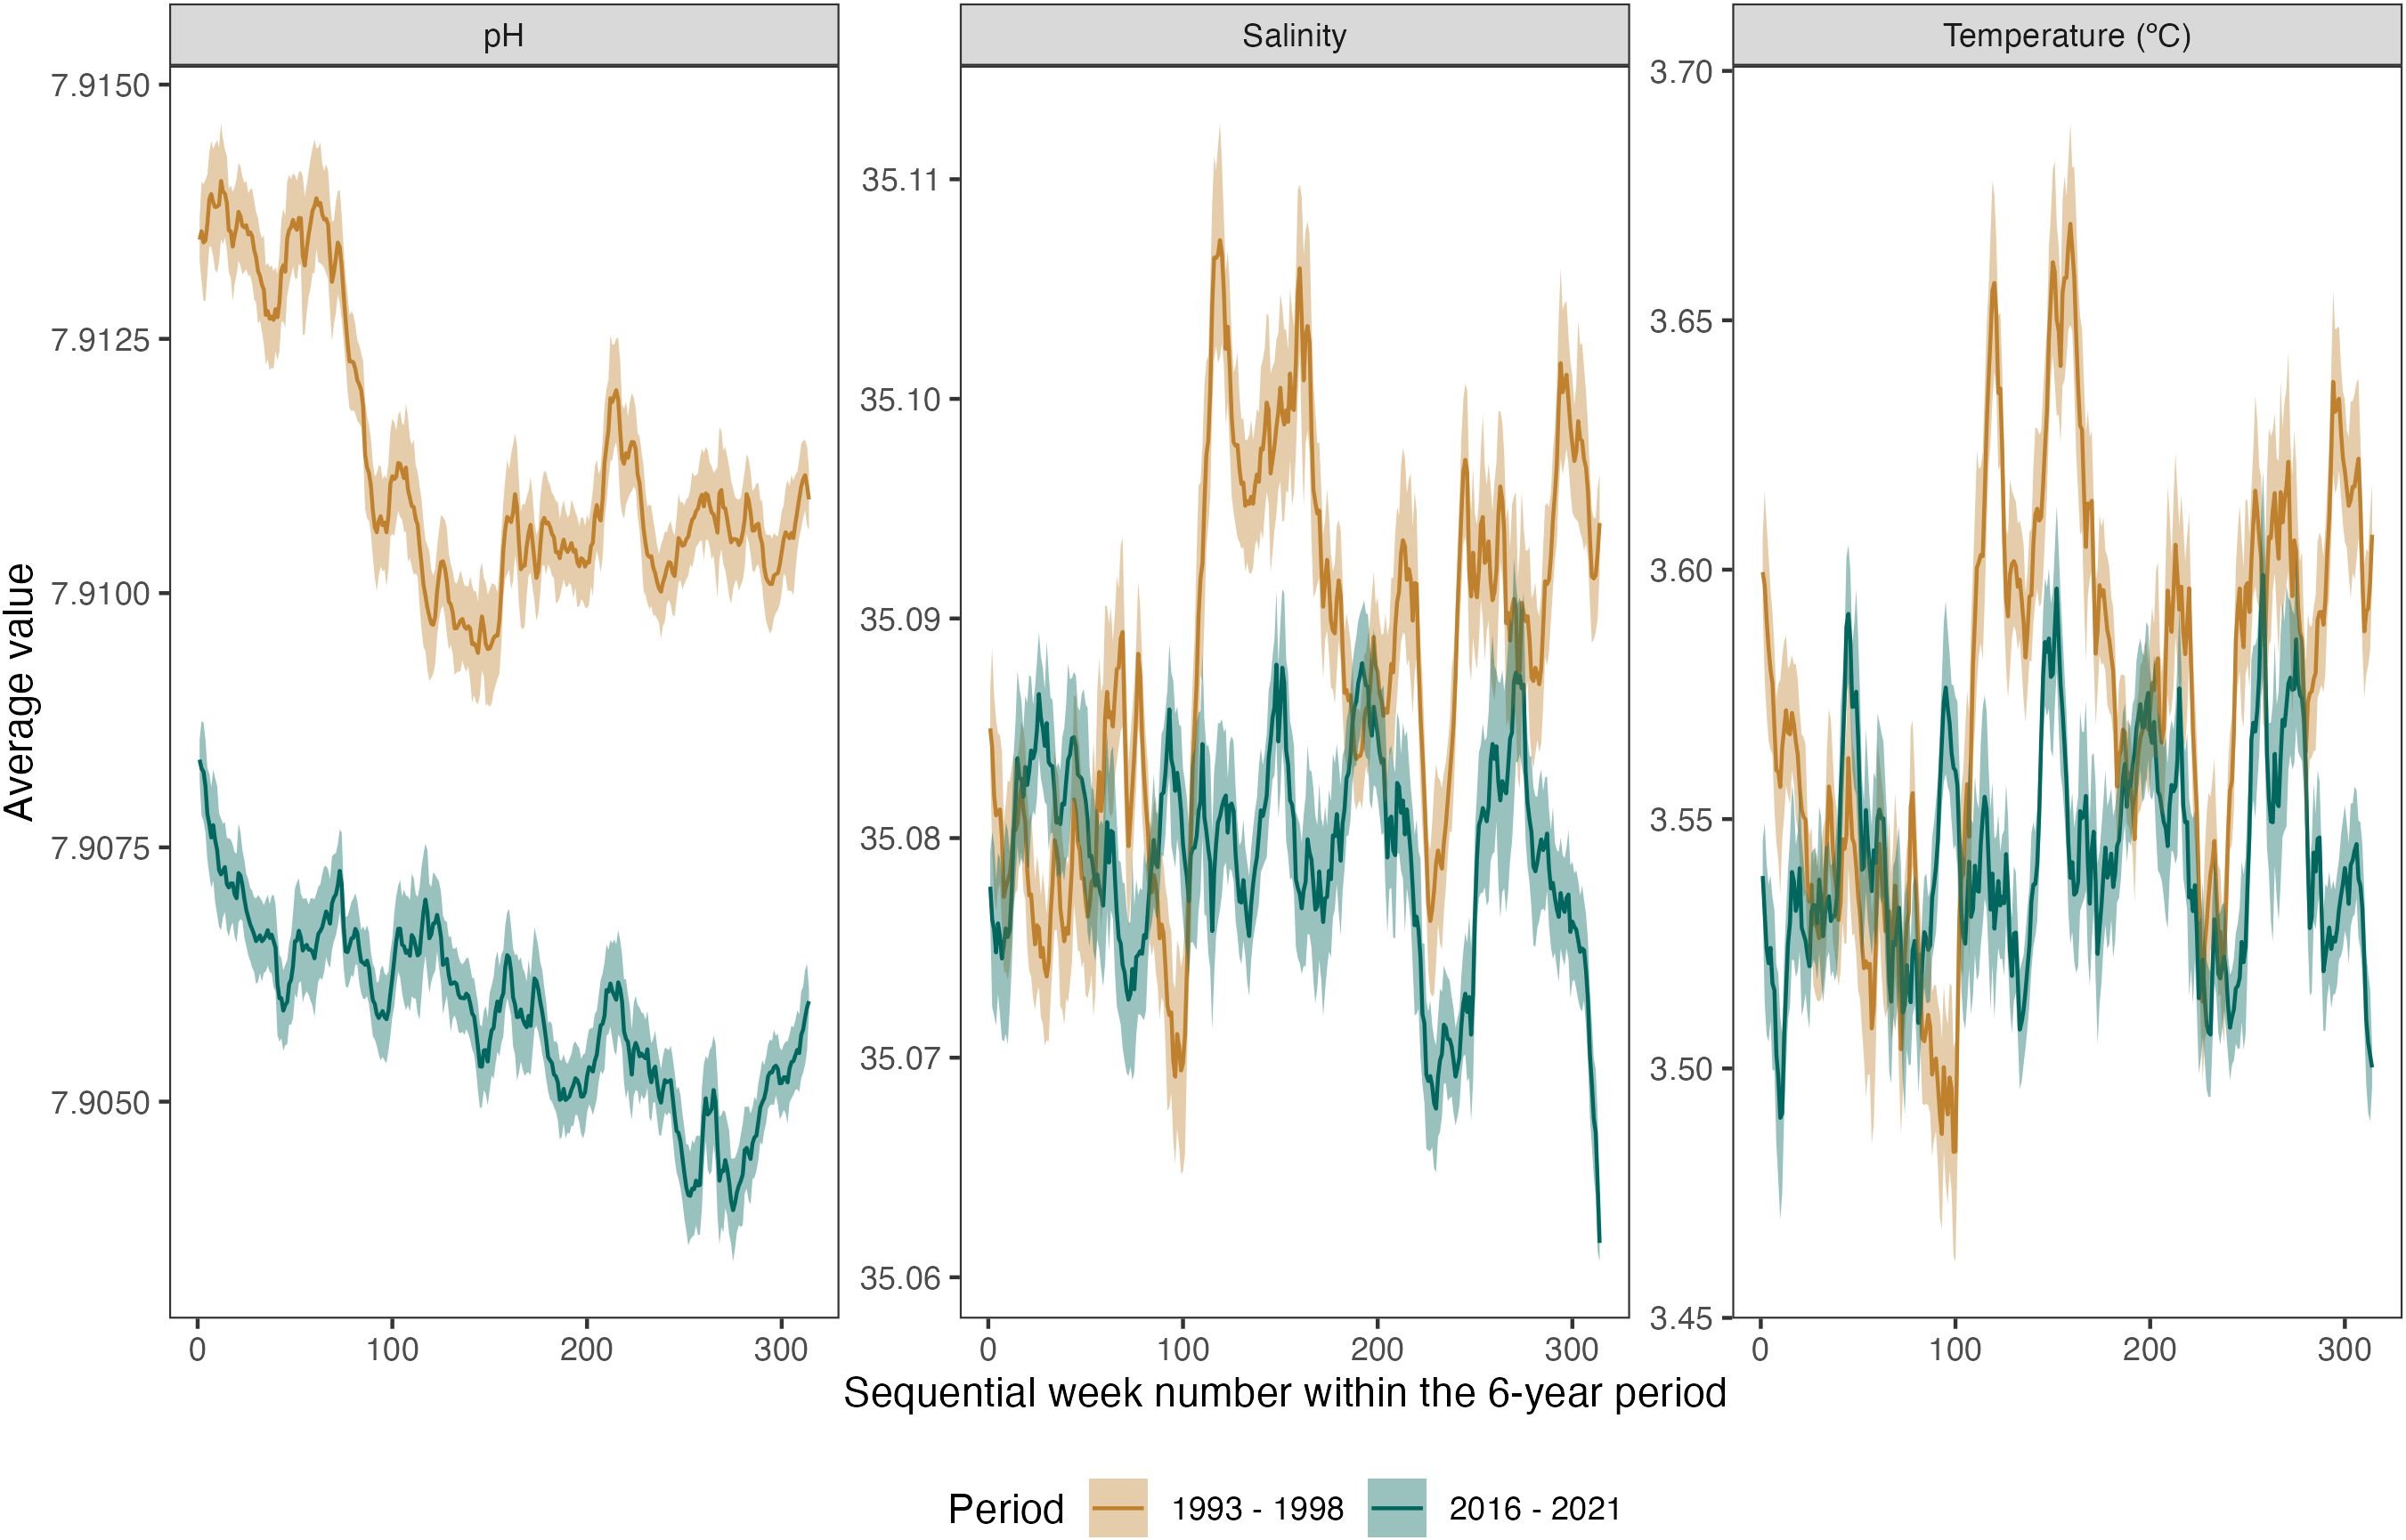
Figure 2. Average pH, salinity, and temperature (°C) at near seafloor conditions for the early (1993-1998, brown line) and recent (2016-2021, green line) periods. This analysis was based on grid cells where anomalies – positive for salinity and temperature, negative for pH – exceed one standard deviation at least once in the analysed period. The shaded areas indicate the standard deviation from the mean.
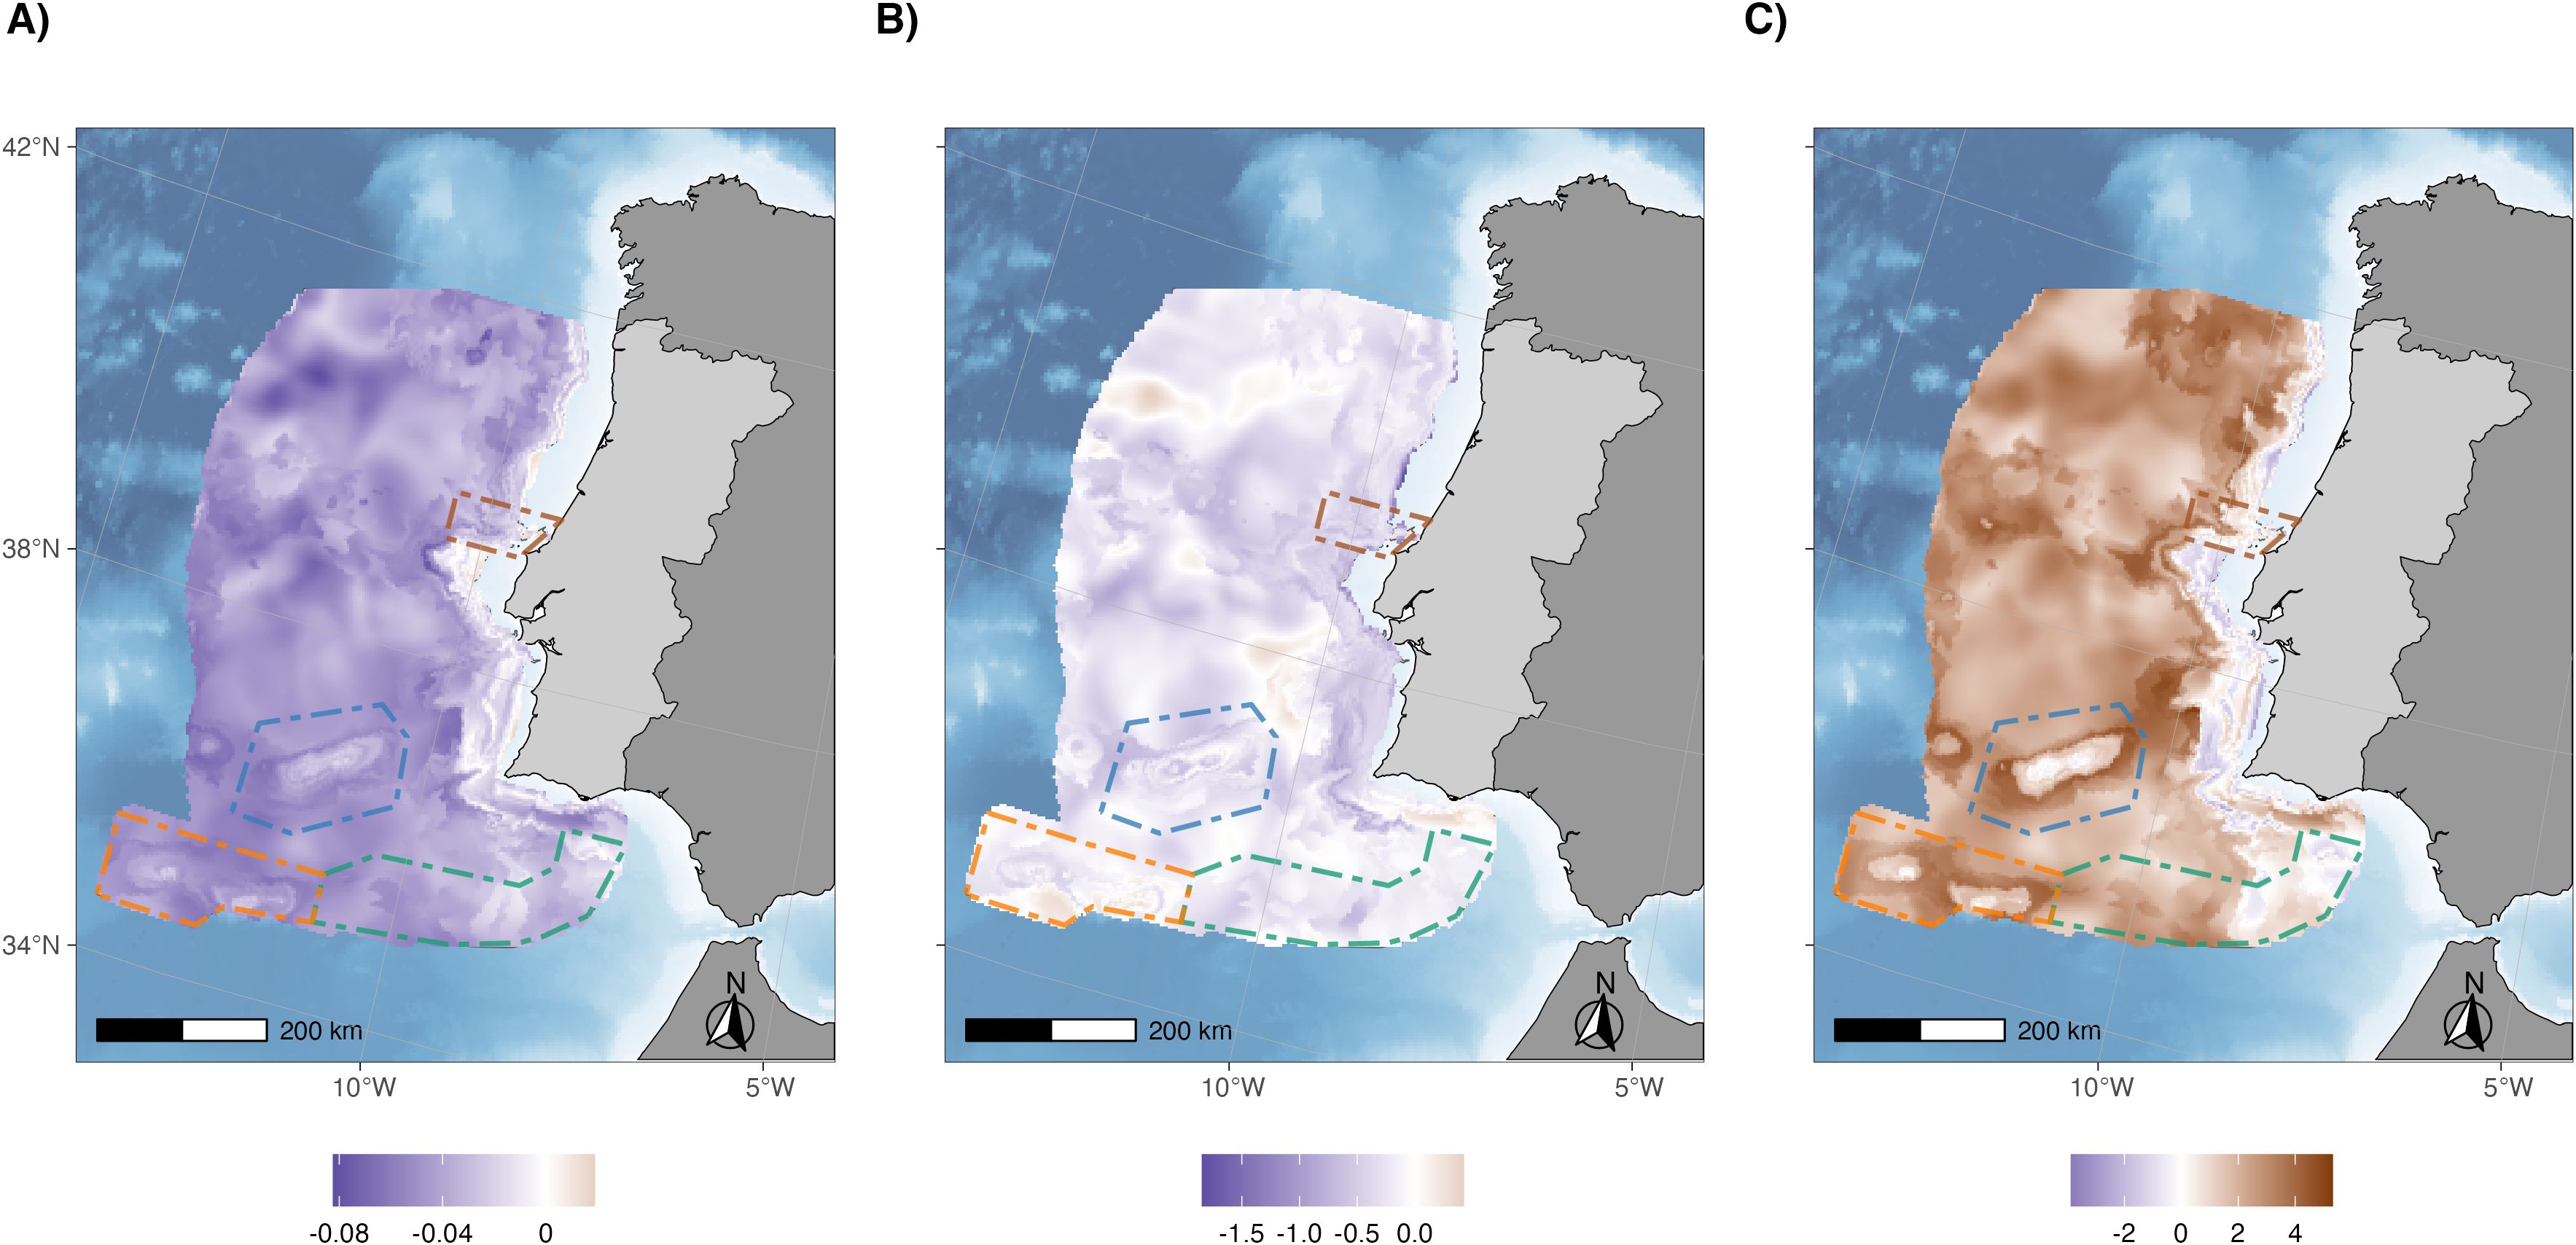
Figure 3. Spatialised differences in the mean weekly average (n = 315 weeks per cell) seafloor conditions for (A) pH, (B) salinity, and (C) temperature (°C) between the two 6-year periods: 2016-2021 vs. 1993-1998. Greater differences between means are represented by darker shades.
3.2 Pressures
Pressure layers were generated for 14 out of the 27 pressures identified as occurring or potentially occurring within the study area (Figure 4; Supplementary Figures S9–S12). Based on the linkage framework of activities-pressures-ecosystem components, only the pressures related to changes in salinity, temperature and pH were fully represented, encompassing contributions from all the relevant specific primary activities that lead to them. For other pressures, data on contributing activities was either partly available or not used due to result in an inadequate proxy for pressure intensity. Hence, the overall characterization of pressures distribution and intensity in the study area is underestimated and only partially mapped.
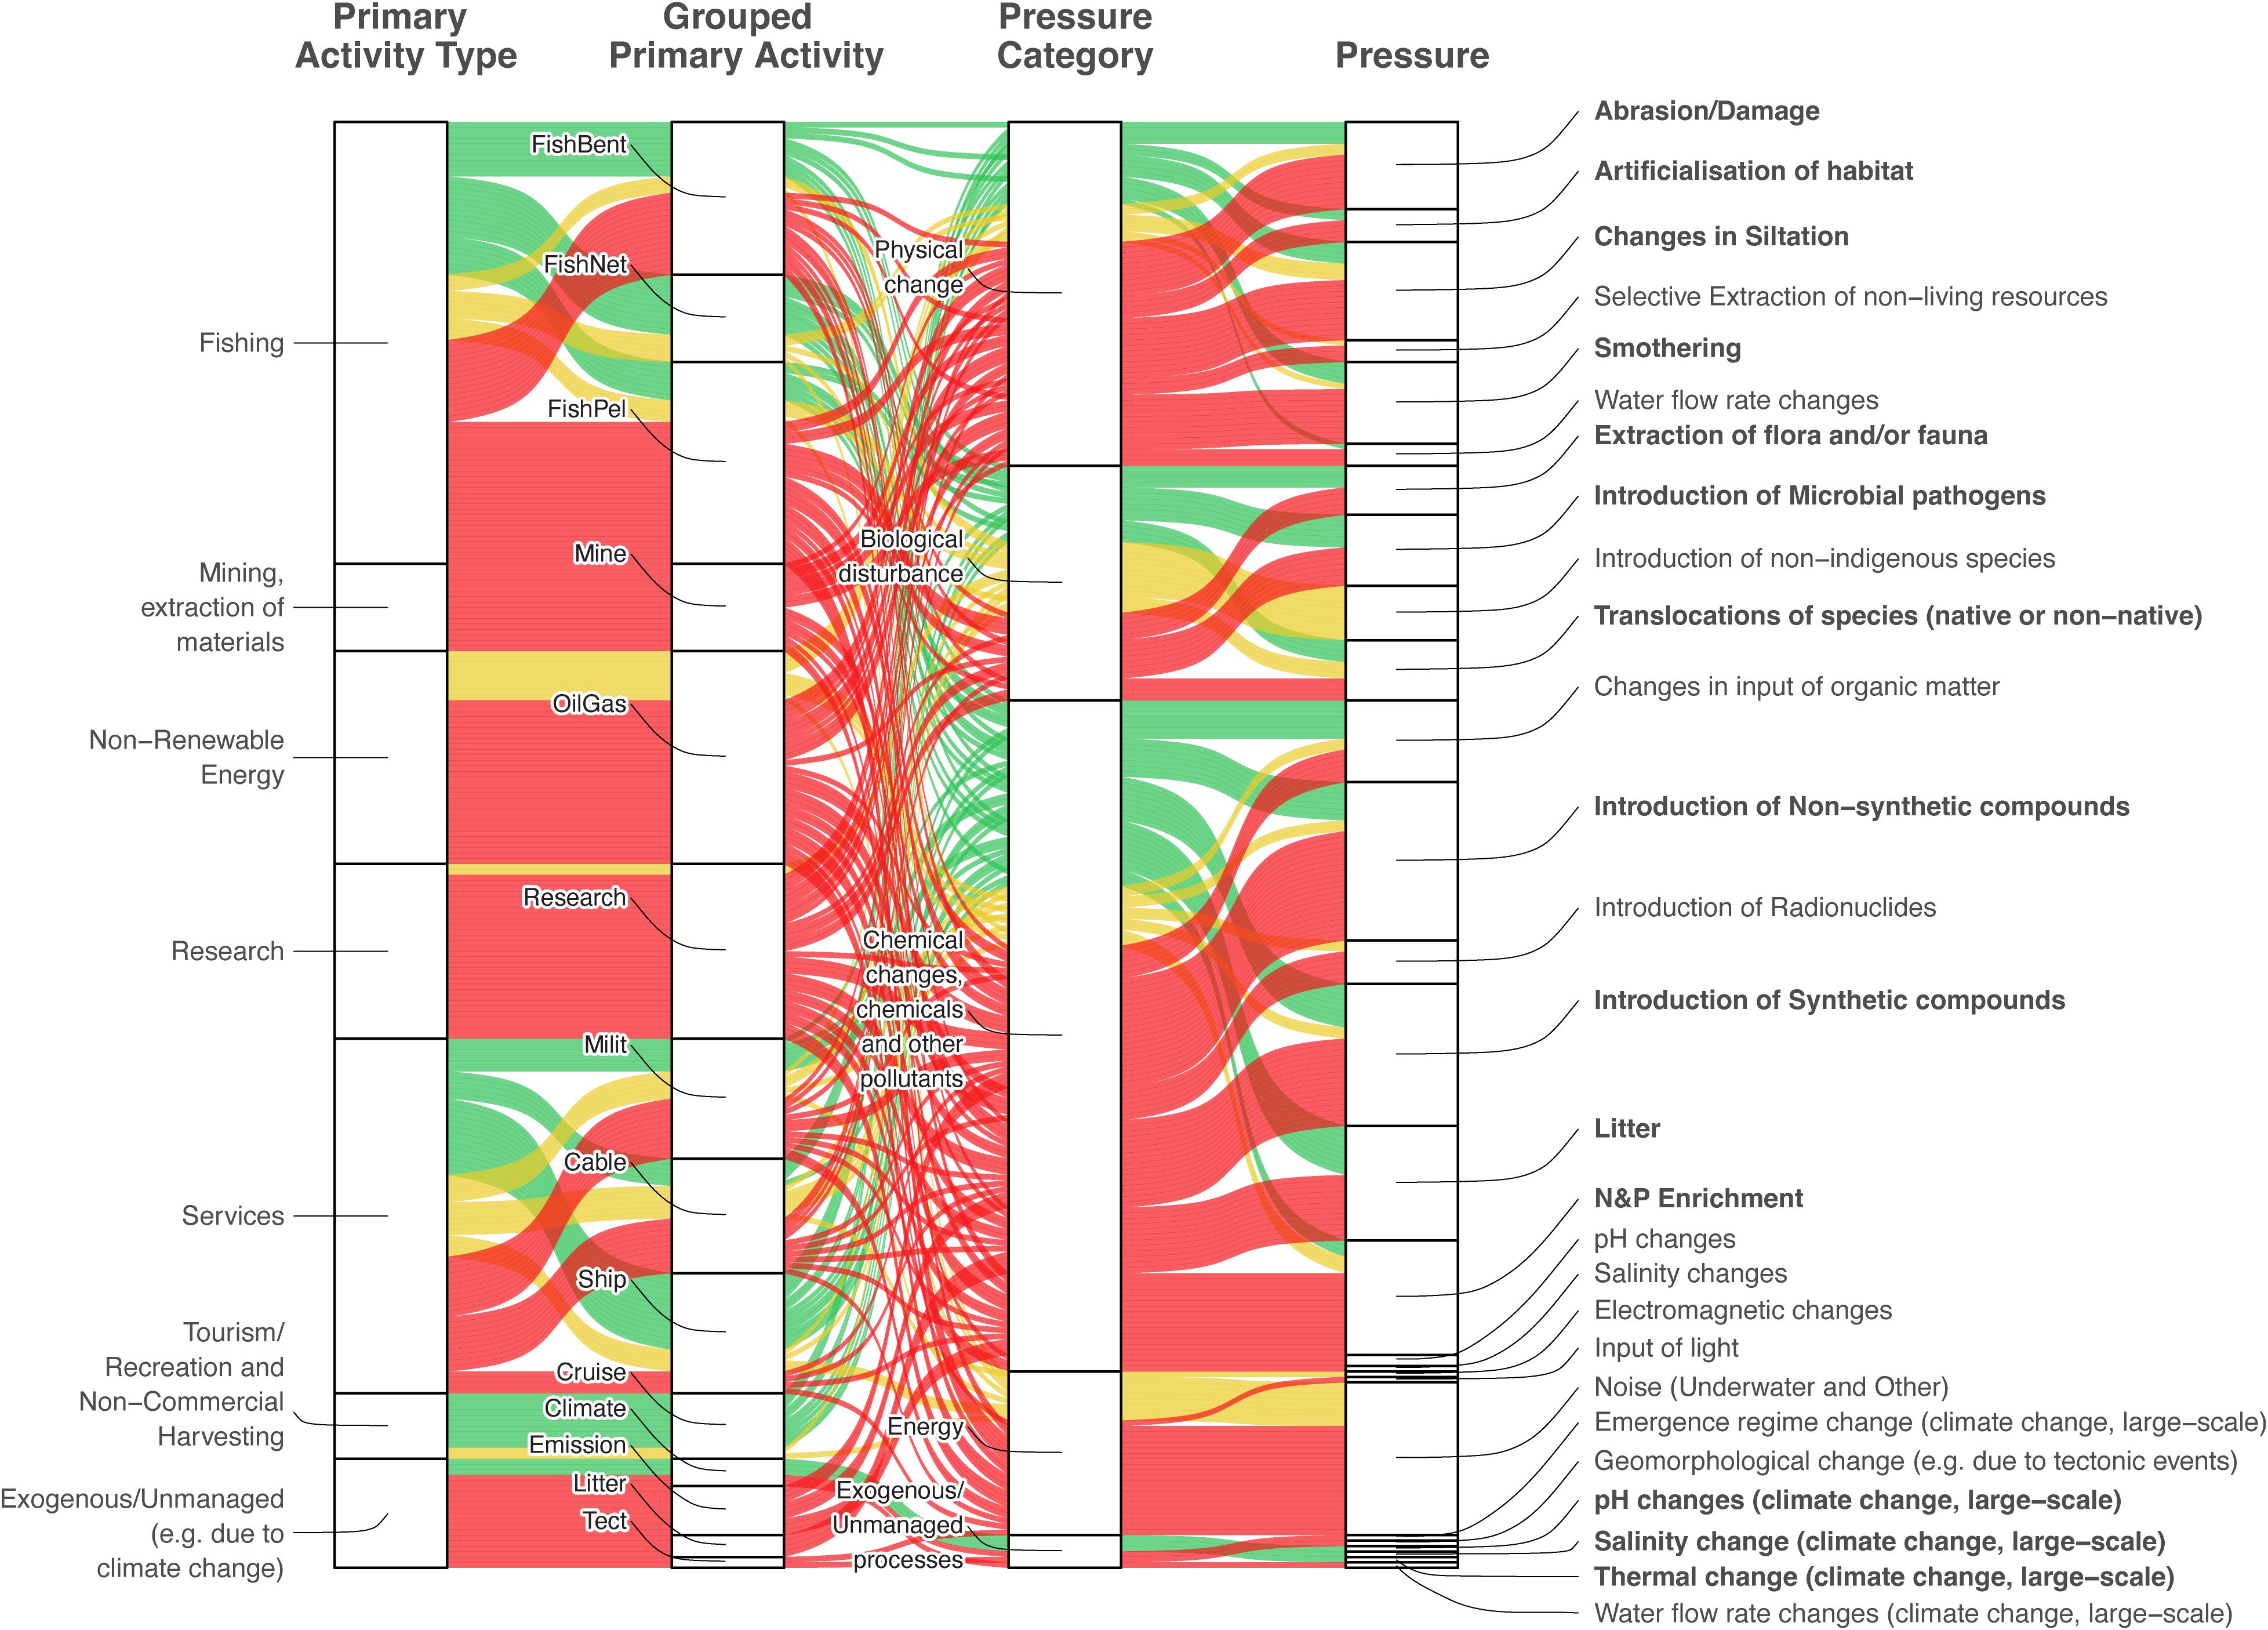
Figure 4. Sankey diagram representing the linkage framework of activities occurring or with potential to occur within the study area and resulting pressures. The height of the strata (white boxes) indicates the number of activities represented within each activity/pressure category. Red flows represent activities for which there is no information available. Yellow flows represent linkages with available information on activities but considered inappropriate proxies for estimating the resulting pressures or deemed negligible within the study area. Green flows indicate linkages included in the combined effect assessment. Pressure names in bold indicate the pressures for which data layers were generated. FishBent, Benthic trawls and dredges; FishNet, Nets (fixed/set/gillnets/other nets/lines); FishPel, Long-line pelagic; Milit, Military; Tect, Tectonics events.
The most widespread pressures in the study area, based on the number of affected grid cells, were related to chemical changes, chemicals and other pollutants: litter affects virtually the entire study area (100%), followed by the introduction of synthetic (88.2%) and non-synthetic compounds (87.9%). Additionally, the introduction of microbial pathogens (biological disturbances) was also considerably widespread, impacting 87.9% of the study area. Conversely, the less widespread pressures identified were abrasion and damage (6.2%; physical disturbance) and salinity changes (9.8%; climate change).
3.3 Combined effect assessment
3.3.1 Overall impact risk for the study area
The overall IR calculated using SCAIRM for the study area identified activities related to fisheries, military operations, shipping, and climate change as the main sources of impact (Figure 5). Impact Risk from endogenic pressures decreases with depth, whereas IR from exogenous pressures tends to increase with depth, representing the pressures contributing most to the IR at the abyssal level. Activities related to military operations and shipping, which are the main pressures contributing to the IR at the bathyal level (Supplementary Figure S13), primarily cause chemical changes, pollutants, and other contaminants. These are followed by benthic trawling and dredging operations, where their contribution to the IR results largely from the abrasion and damage of ECs. On the other hand, the exogenous pressure contributing most to the IR in the ECs results from changes in pH. Excluding climate change, the primary activity type contributors to the overall IR in the study area are Services (55.7%) and fisheries (13.9%). The top three pressures affecting the study area in terms of aggregated IR are litter (44.1%), changes in pH (29.4%), and introduction of non-synthetic compounds (9.2%). The pressures of less concern include salinity changes due to climate change, translocation of species and artificialization of habitat. The average value of IR aggregated by ecosystem components was 0.424 ± 0.266 (mean ± standard deviation). The ecosystem component under the highest IR is the ME32 - Atlantic upper bathyal coarse sediment (0.966), particularly due to risk of impact resulting from litter and introduction of non-synthetic compounds while the least impacted is the Atlantic mid abyssal seabed (0.097), primarily affected by changes in pH level.
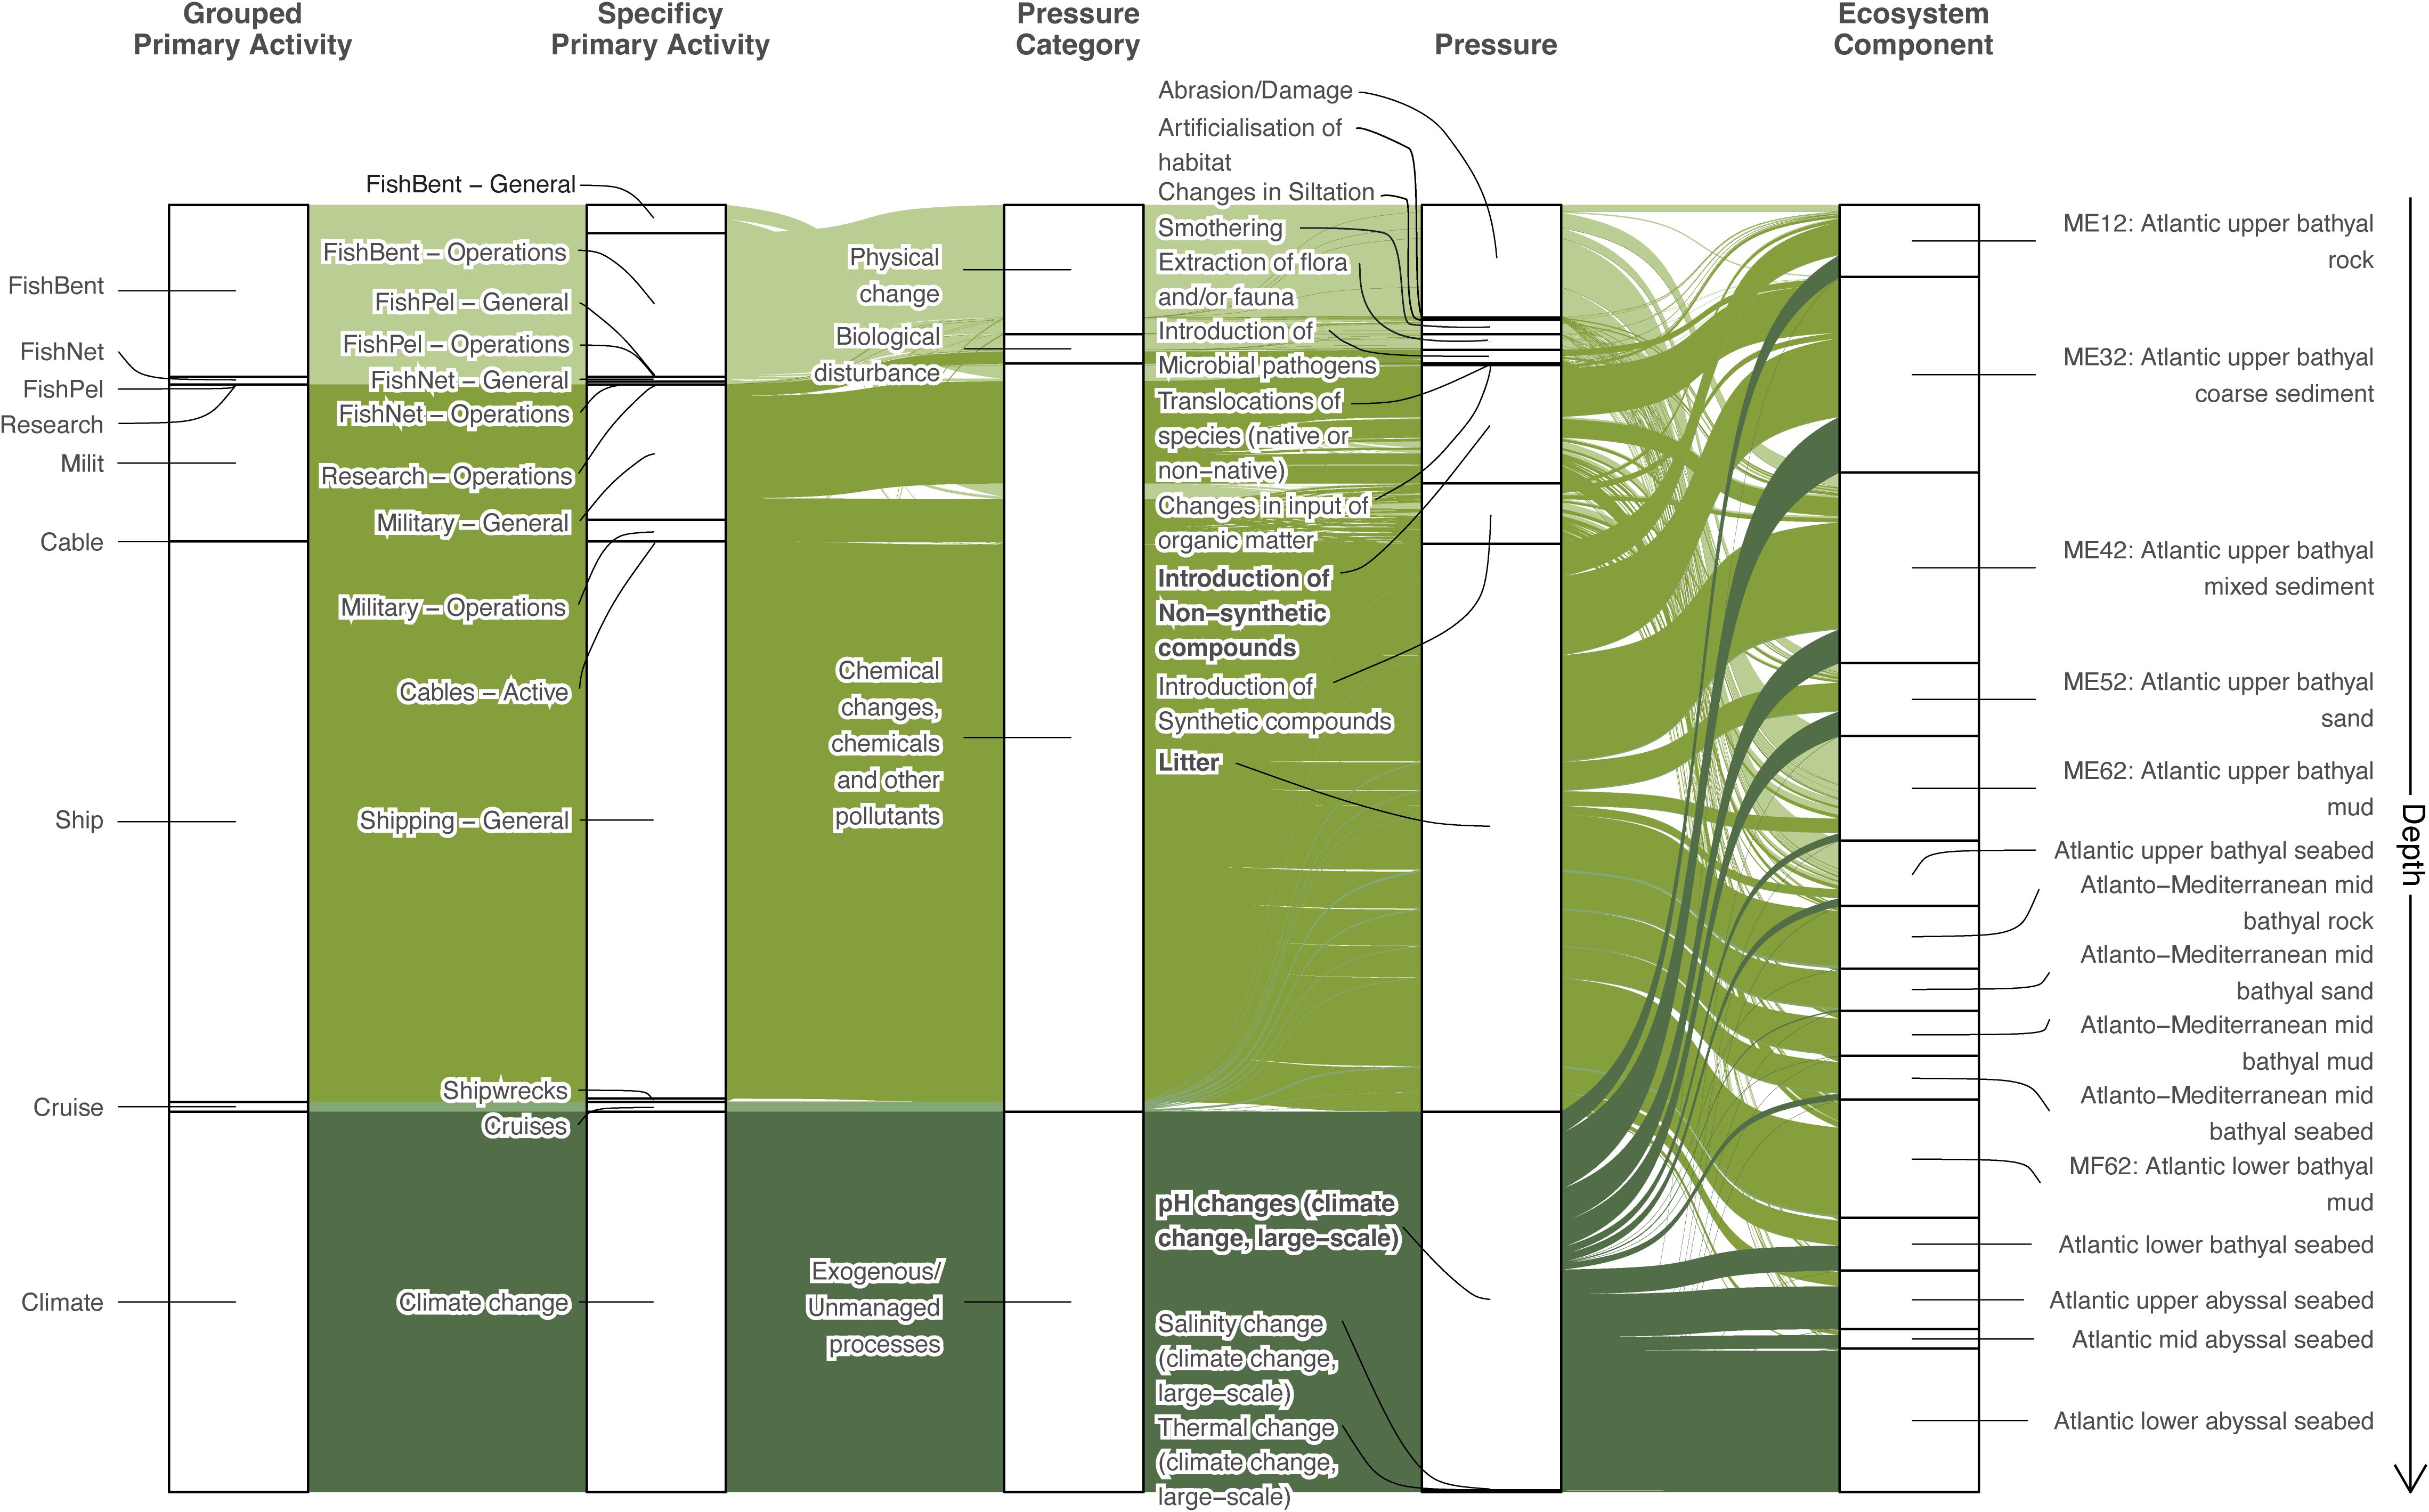
Figure 5. Sankey diagram representing the impact chains of activities, resulting pressures and ecosystems components affected weighted according to the Impact Risk (IR) calculated using SCAIRM. The different shades of green group impact chains within the same group of primary activities. The height of the strata (white boxes) corresponds to the value of the aggregated IR. The top three pressures, based on aggregated IR, are highlighted in bold. FishBent, Benthic trawls and dredges; FishNet, Nets (fixed/set/gillnets/other nets/lines); FishPel, Long-line pelagic; Milit, Military.
3.3.2 Spatial explicit assessment of combined effect
When analyzing the combined effects on the scale of grid cells, changes in pH levels were again identified as among the most important pressures affecting the study area (Supplementary Table S5). Pressures related to chemical changes, chemicals, and other pollutants were also identified as a major pressure class affecting deep-sea ecosystems, with litter assuming the position of the second most relevant pressure. The physical disturbance resulting from changes in siltation was identified as the third most relevant. Changes in salinity levels and artificialization were once again identified as among the least relevant pressures impacting the study area.
The combined effect score (CES) in the study area varied from nearly zero to 15.20 (1.09 ± 1.13, mean ± standard). High-intensity effects were mostly found on the edges of the continental shelf, especially in the south areas located closer to the mainland (Figure 6A). Based on the third quartile of distribution of the CES, the combined effect score was generally below 2.5 (Supplementary Figure S14). When standardized by the area covered by benthic habitats, the ecosystem component with the highest average effect score identified was the Atlantic upper bathyal mixed sediment (CES = 3.12), while the Atlantic mid abyssal seabed had the lowest (CES = 0.06). The shallower benthic habitats were consistently ranked among the most impacted in the study area, in all tested scenarios of the uncertainty analysis (Figure 6B), namely the Atlantic upper bathyal coarse sediment, mixed sediment and rock (>77% of Monte Carlo simulation runs, Supplementary Table S6). Conversely, the more remote Atlantic mid and upper abyssal seabed were among the least impacted ECs (>98% of Monte Carlo simulation runs) with a substantial area defined within the proposed deep-sea MPAs (Figure 6B). When vulnerability of the ecosystem components is ignored in the calculation of the combined effect score, the overall spatial pattern remains consistent (Figure 6C). However, the change in the magnitude of the CES could approach 50%, with larger differences observed in the shallower ECs (Figure 6D). Overall, the combined effect on benthic habitat results from multiple pressures with relatively balanced contributions (Figure 7). However, as depth increases, the number of these pressures decreases, while the contribution of pressures related to climate change and chemical changes, chemicals and other pollutants gains more influence.
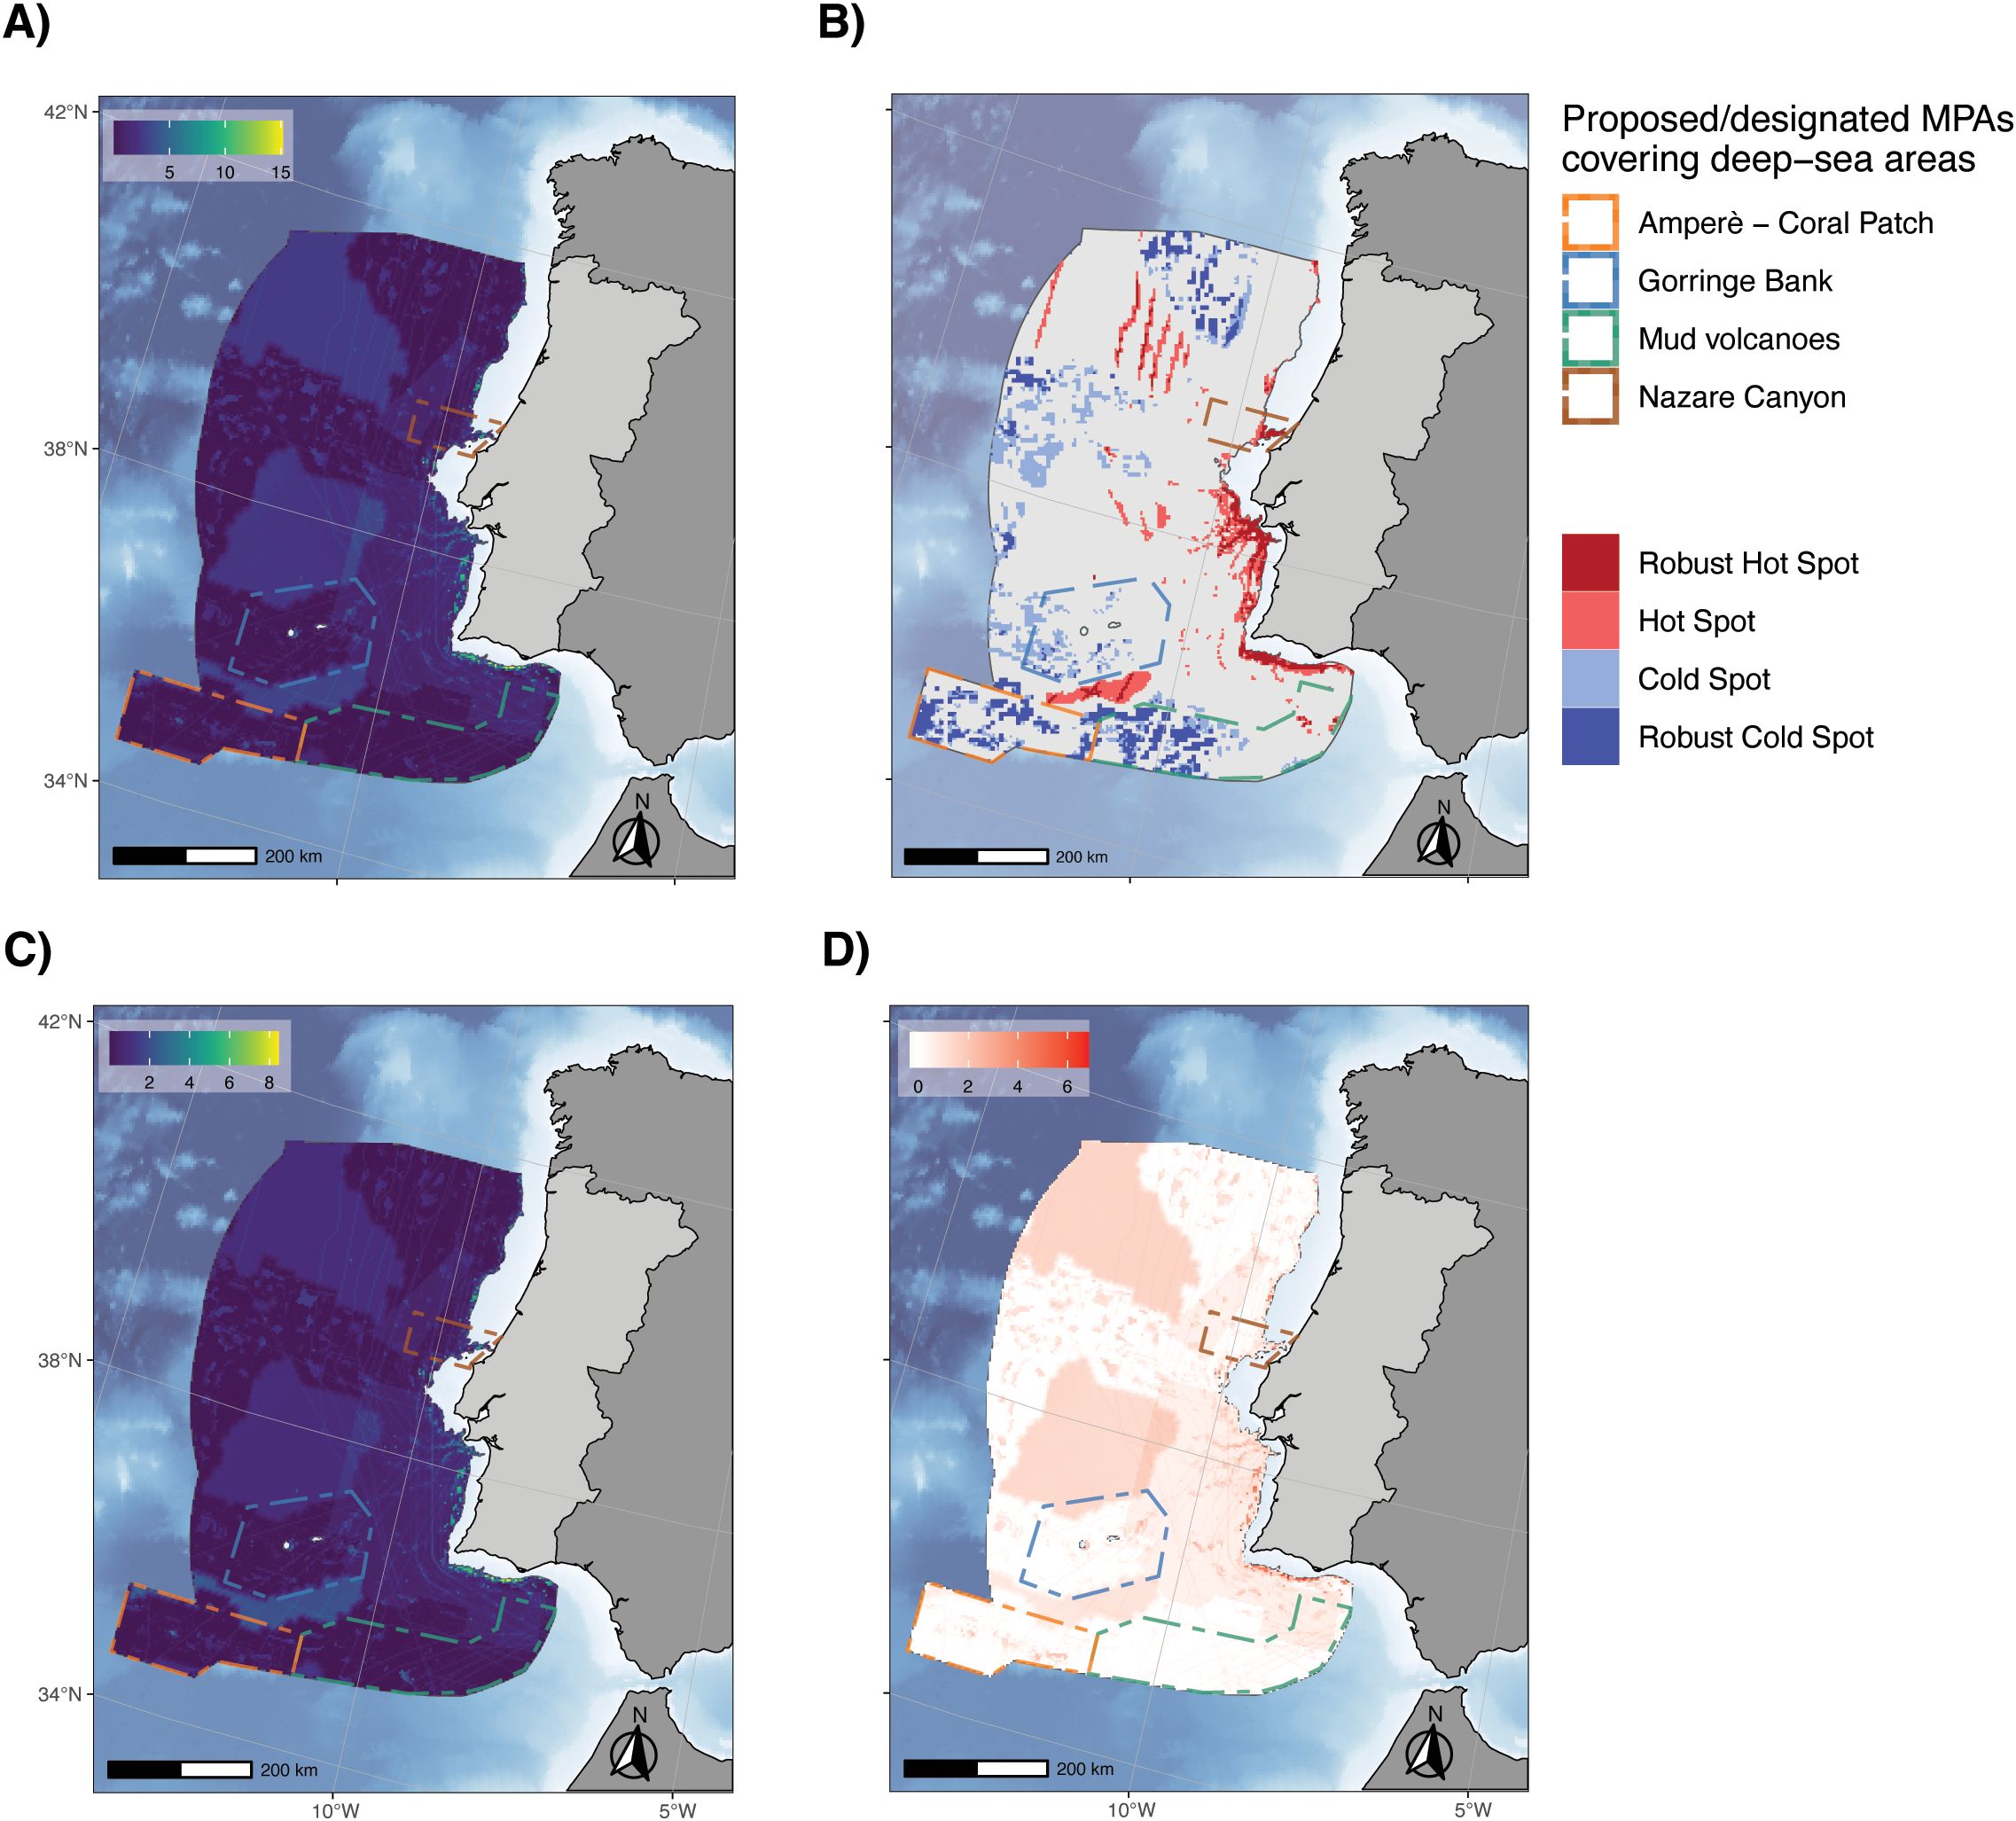
Figure 6. (A) Distribution of combined effects across the study area, with warmer colours indicating higher combined effects. (B) Hot and cold spots areas of combined effects (CE): hot spots (red shades) represent regions in the combined effect map with CE scores in the top 25th percentile of the combined effects and were identified in at least 75% of 1000 Monte Carlo simulations. Robust hot spots are those consistently appearing in the top 25th percentile in at least 90% of simulations. Cold spots (blue shades) represent areas in the bottom 25th percentile of CE scores, also detected in at least 75% of simulations, while robust cold spots are consistently identified in the bottom 25th percentile in at least 90% of simulations. (C) Distribution of combined effects ignoring the vulnerability of ecosystem components to pressures. (D) Map showing differences in CE scores between CEA outputs, with and without accounting for ecosystem vulnerability to pressures.
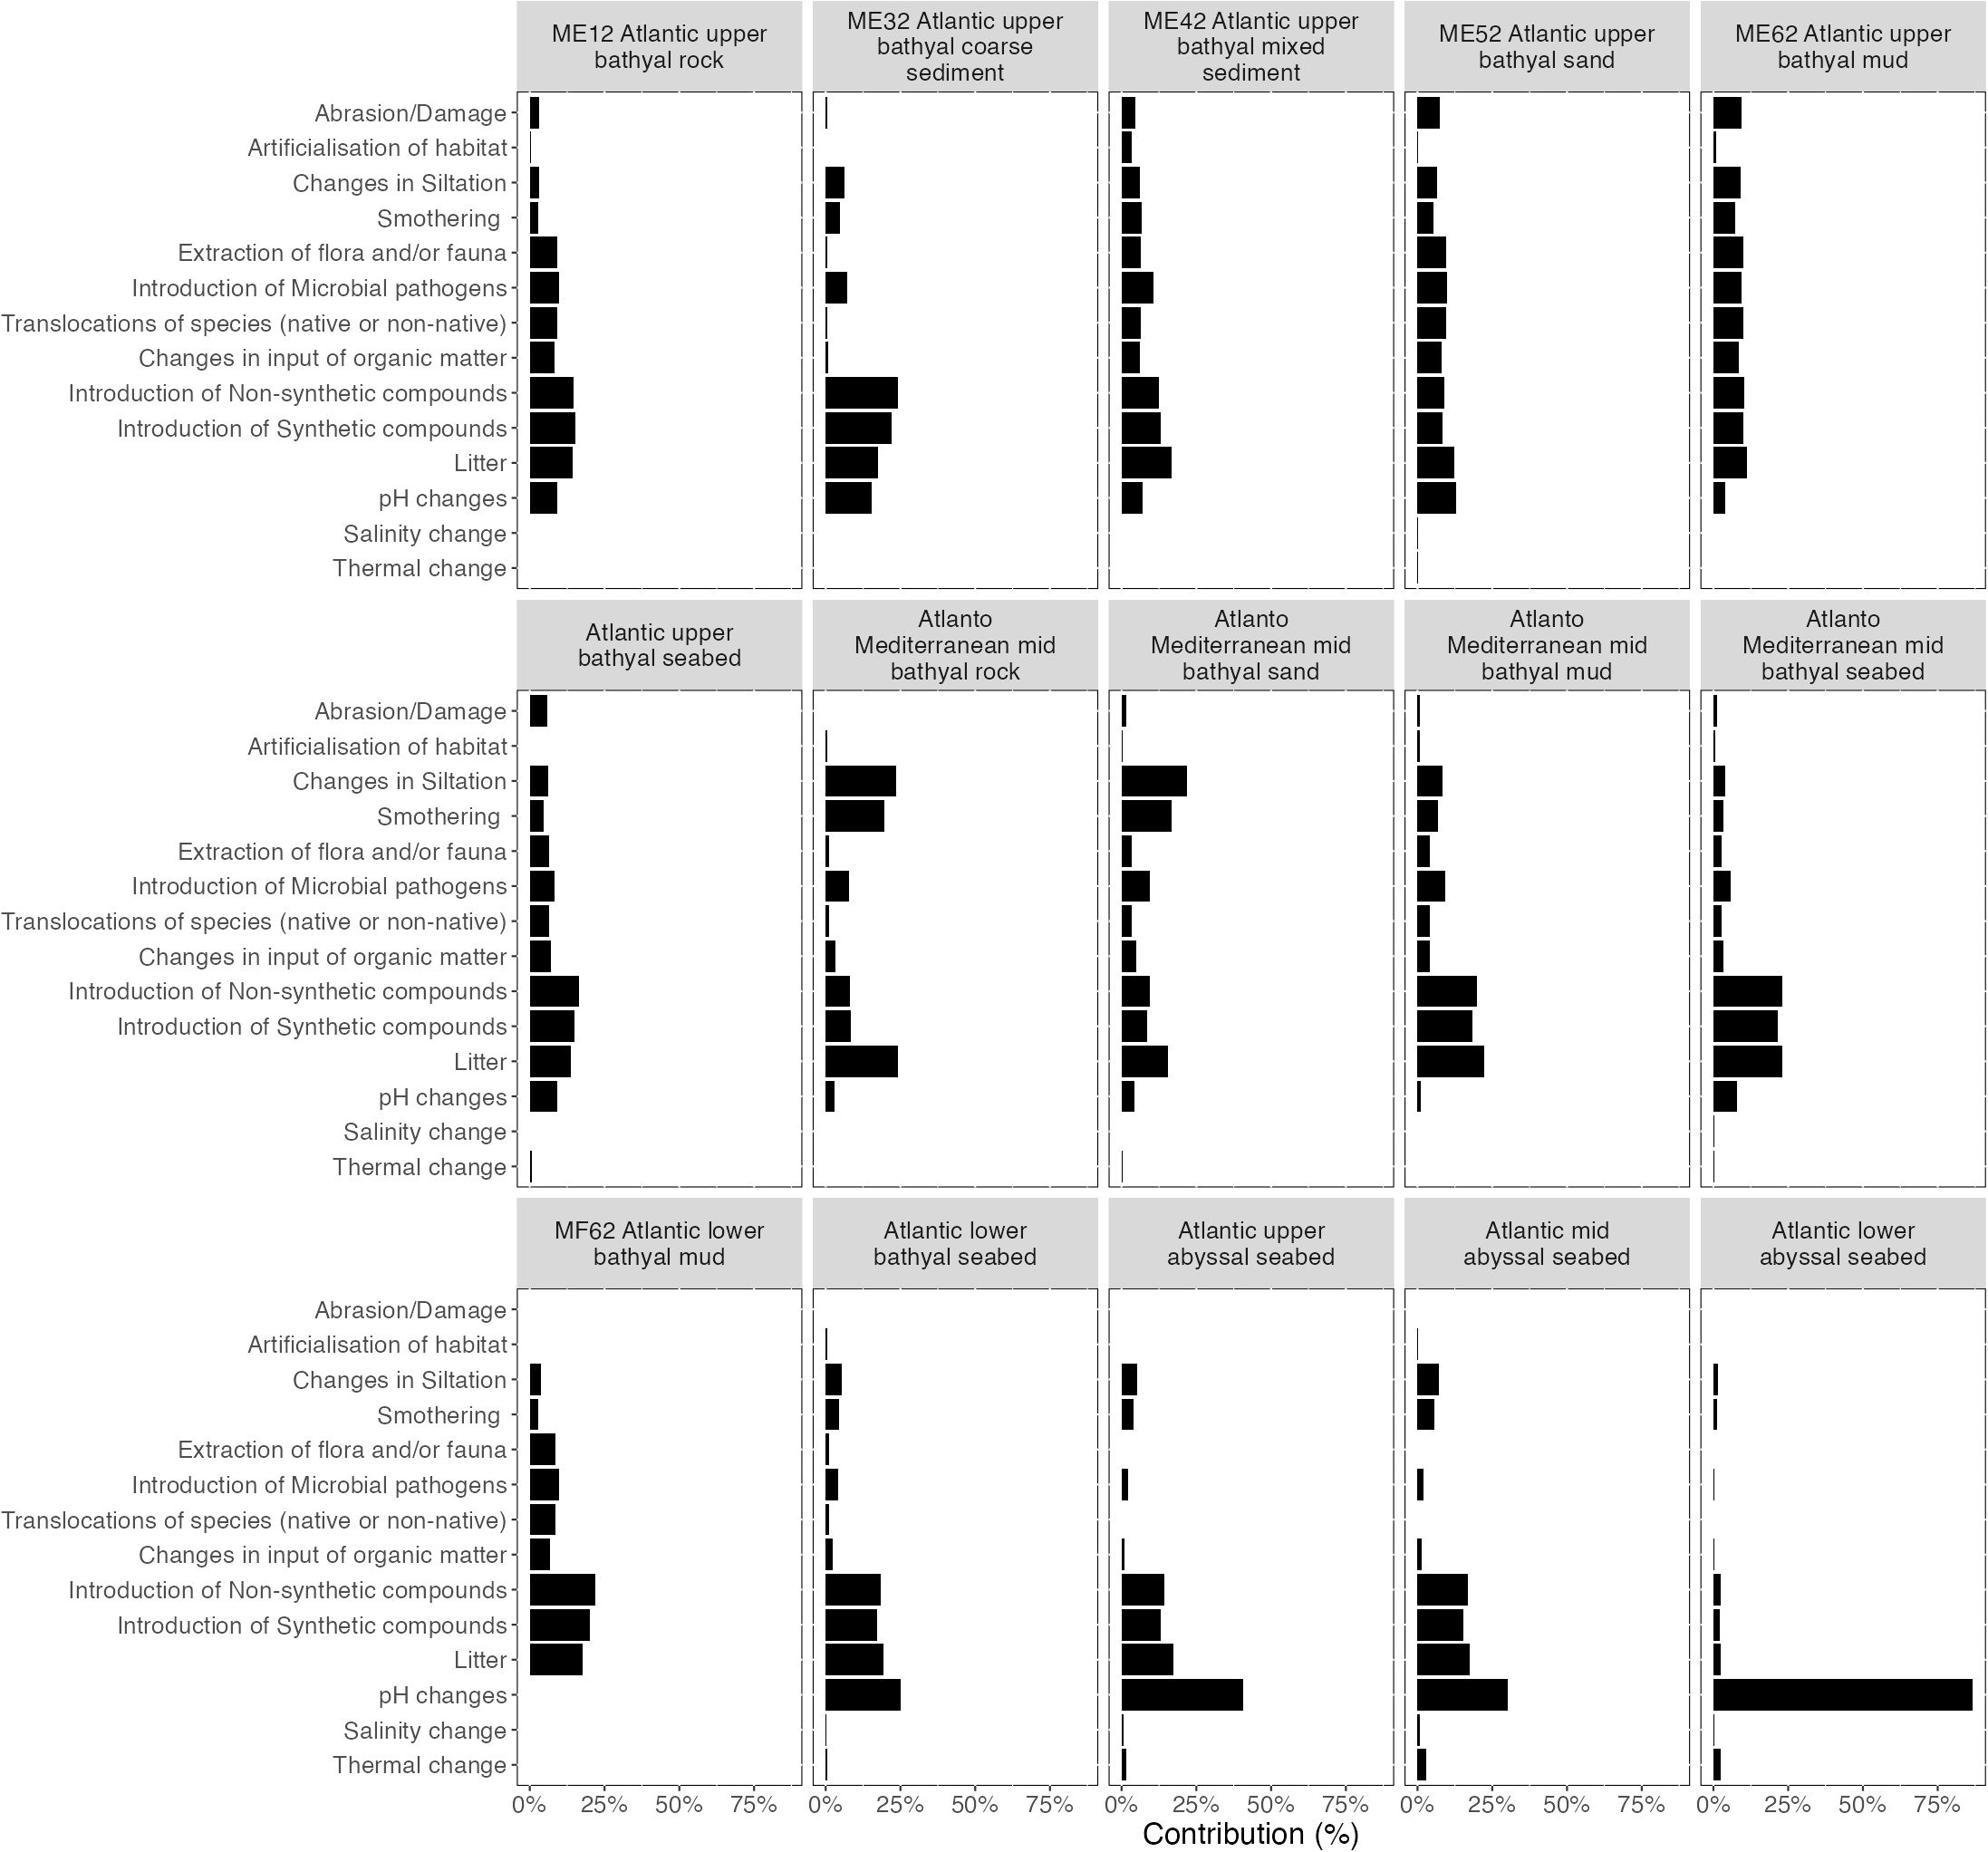
Figure 7. Relative contribution of pressures (measured by the number of grid cells affected within the total number of cells impacted) to the combined effect by ecosystem component.
The sensitivity analysis averaged over all ecosystem components and pressures highlighted that, of all the factors tested, the output of the CEA is less influenced by the type of aggregation process chosen (i.e., using the sum of impacts on all ecosystem components in a grid cell or the mean of impacts, Figure 8). Factors such as the use of finer resolution of the pressures data, the type of cumulative model applied (i.e., additive or antagonistic), or the omission of pressures from the model, showed greater influence on the CEA output. However, their influence was lower compared to the impact of assuming linear responses of ecosystem components to increasing pressures rather than ecological thresholds. For the ECs, sigma* values were higher than mu* values, indicating that the effects of these factors on CEA output depended on the values of other factors and the stochastic elements of the model.
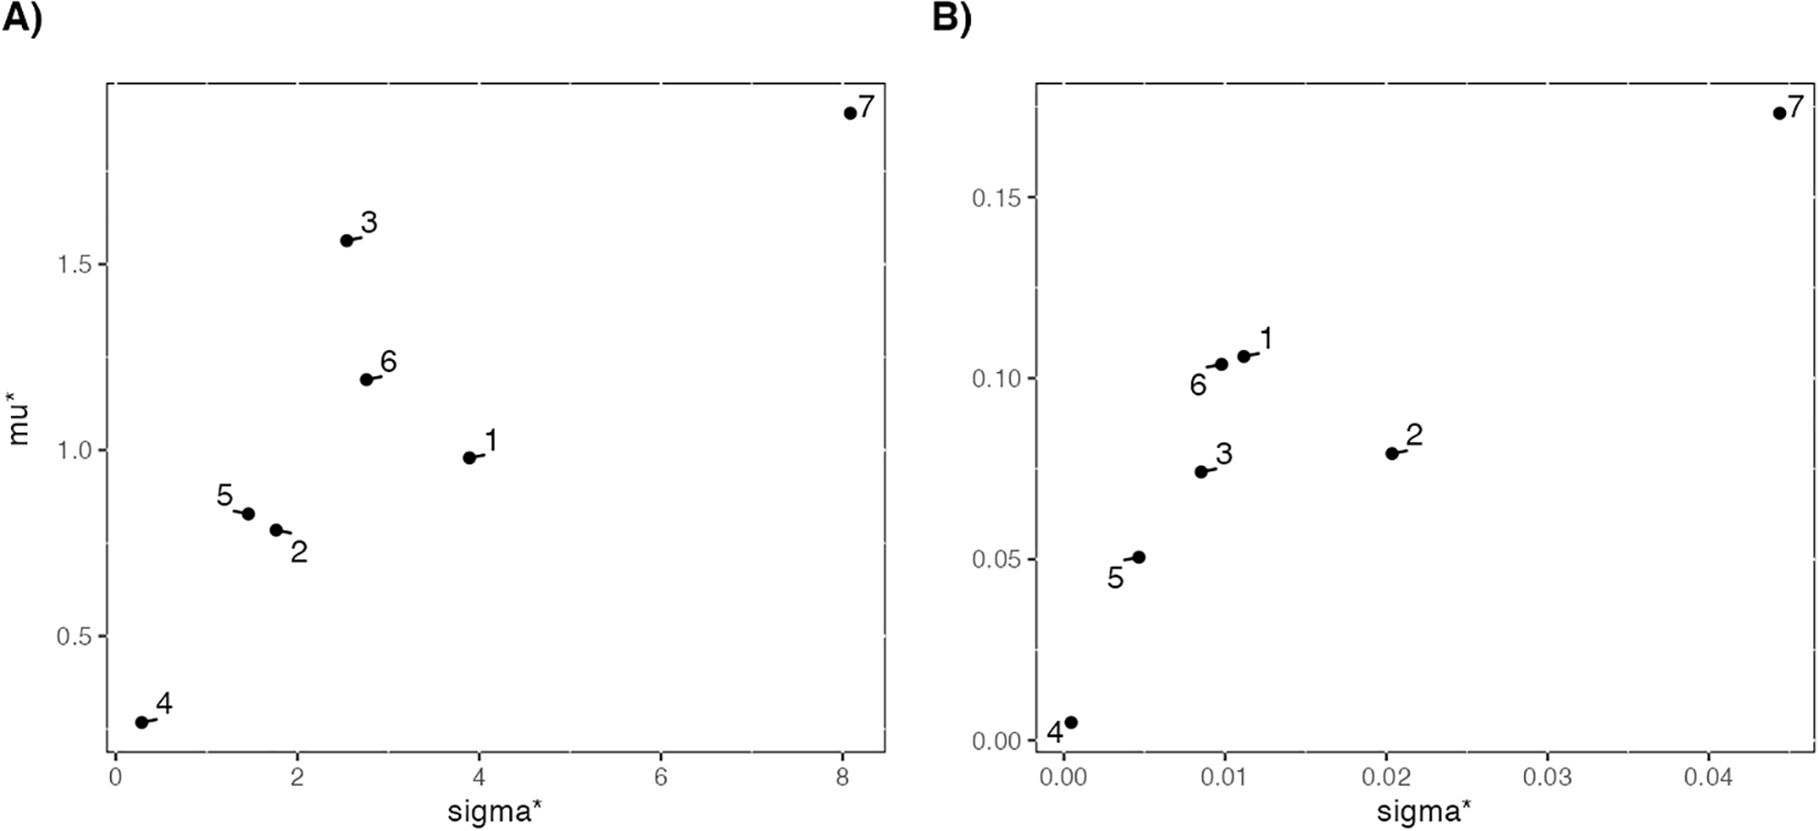
Figure 8. The most influential factor for the ranks of (A) ecosystem components and (B) pressures from most to least impacted according to the sensitivity analysis based on the adjusted elementary effects method. Comparison of the mean elementary effect (mu*, a measure of a factor’s overall effect on a model output) and the sigma*, a measure of how much the factor’s effect depends on interactions with other factors and random components in the model. 1, missing data; 2, vulnerability score errors; 3, multiple pressure effect model: additive, antagonistic, dominant; 4, mean or sum over habitats; 5, reduced spatial resolution; 6, improved pressure resolution; 7, ecological thresholds.
4 Discussion
Our understanding of deep-sea ecosystems and their response to anthropogenic pressures remains limited. However, the extensive coverage of deep-sea ecosystems within the European EEZs requires a comprehensive assessment of threats to mitigate pressures and achieve an environmental status aligned with the objectives of the EU Marine Strategy. We mapped multiple pressures occurring in deep-sea areas of the Mainland Portuguese EEZ to identify where they are most pronounced. This information indicates where protection and pressure mitigation measures are most needed and where the ecosystems components are under higher risk of being in poorer conditions.
In the study area, fisheries (i.e., trawling, nets and fixed gear, longlines), shipping, and military operations dominate the bathyal level, contributing primarily to physical disturbances on deep-sea benthic habitats and chemical changes and pollution. Trawling is a well-known threat to benthic habitats. Despite being less prevalent in terms of area coverage in the study area compared to other activities, its negative effects on the benthic ecosystem can be severe. In heavily fished areas, it can lead to the loss of up to 95% of large sessile fauna in heavily fished areas compared to unfished areas (Koslow et al., 2000), reshaping the seabed and provoking sedimentological changes (Durán et al., 2023). These disturbances affect not only the seabed integrity but also the ecosystems functioning (Ramalho et al., 2020) with significant consequences for the GES of the ecosystems (Ramalho et al., 2017; Paradis et al., 2021). Longlines, nets, and traps are less harmful fishing methods for deep-water habitats. However, the amount of lost fishing gear, especially gillnets, is a major problem as they can continue to kill for extended periods. Fisheries were also determined as the primary source of marine litter, for instance, in seamounts present in the study area (Vieira et al., 2015). The amount of litter produced is reportedly different across fishing gear types (Richardson et al., 2022). For instance, according to Eurostat, between 2012 and 2019, the average number of vessels operating trawls in Portugal Mainland was 127. Assuming an average loss of fishing gear of 2120.98 m² for bottom trawls annually per vessel (Richardson et al., 2022), the estimated amount of marine litter resulting solely from this activity in all study area would be 0.27 km². However, as the number of vessels operating in the area within the remaining gear types (i.e., fixed-nets and long-lines) could not be established, fishing hours per cell was the common indicator available across gear types used as proxy for litter pressure derived from fishing activities. Future attempts to generate pressure layers, integrating literature-based information, will enhance future CAE by more accurately representing pressure intensity and combined effects. In addition, when selected indicators reflect more accurately the amount of pressure (e.g., litter) produced by each of the specific activities, they will also support a more efficient evaluation of the impact of the measures implemented to reduce that pressure in the marine environment.
In abyssal areas, exogenous/unmanaged processes related to climate change are the most widespread. These processes led to changes in pH over large areas and, to a lesser extent, changes in water temperature and salinity. Climate change is recognized as one of the top pressures on deep water habitats in regions like the Scotian Shelf in Atlantic Canada and the area influenced by the California Current, due to the widespread distribution and high vulnerability of many ecosystems (Halpern et al., 2009; Murphy et al., 2024). Changes in water conditions near the seafloor, including temperature and pH, can directly impact deep-sea organisms by altering their metabolism and body structure (Sweetman et al., 2017), which can hinder the recovery of ecosystem components from pressures like physical damage. The observed decreasing trend in pH levels in the study area aligns with predictions that by 2100, the North Atlantic Ocean’s seafloor below 500 meters may experience a reduction in pH levels greater than 0.2 units (Gehlen et al., 2014). This decrease in pH causes a rise of the carbonate compensation depth (CCD) submerging important geomorphological features, such as canyons and seamounts, below the CCD (Harris et al., 2023). In our study area several of these features are included in proposed or designated MPAs that will not be effective in protecting from climate change, but may minimize the compounded effects with other pressures. In this study, we examined positive salinity anomalies under the assumption that increased salinity poses a higher risk to biological communities. However, the limited understanding of deep-sea ecosystems constrains our ability to accurately assess the impacts of salinity changes (Röthig et al., 2023). Given the overall decreasing trend in this parameter in the study area over time, future assessments may also consider negative anomalies in their analysis.
Although mapped, some activities were only partially represented in this study due to a lack of data or their low frequency. In this study, research activities are one of those examples although a large fraction of the study area remains essentially unexplored (Stratoudakis et al., 2019). Moreover, except for fisheries-related research, research activities generally cause localized impacts of a few square meters (Benn et al., 2010). Other activities that might result in considerable impacts on deep-sea benthic habitats are related to oil and gas operations. Currently, no exploitation rights have been granted in Portugal due to uncertainties related to the economic viability of the operations and public opposition to these activities. No changes on this situation are foreseen (DGEG; Pinto and Castro, 2021) consequently, it is not anticipated that this activity will pose a threat to the benthic ecosystem within the study area in the future. Conversely, the exploitation of mineral resources on the deep seafloor has received increased attention worldwide in recent years (Levin et al., 2020). In the mainland component of the Portuguese EEZ, the presence of Fe-Mn crusts rich in cobalt are reported from seamounts and polymetallic nodules in abyssal areas, although the latter have not been explored for this purpose (Madureira and Ribeiro, 2023). The Portuguese authorities have called for a moratorium on mining in the Area (the seabed and ocean floor and subsoil thereof, beyond the limits of national jurisdiction) but no clear position was yet taken regarding exploiting mineral resources in the seafloor under national jurisdiction. Consequently, potential pressures resulting from these activities, currently absent in the study area, could become threats in the future.
4.1 Combined effect assessment
Overall, the results of the CEA for the entire study area were comparable to the assessment of combined effect at the grid cell scale. However, some differences arise regarding the ecosystem components potentially under higher threat. SCAIRM identifies examples both of bathyal and abyssal ECs among the most impacted, while when using the combined effect score at the grid cell scale, the habitats potentially more impacted are located at the bathyal area. These differences arise from the method used to calculate pressure effects on ecosystem components. The SCAIRM approach we applied estimates the IR for the total area of the EC. For ecosystem components in the bathyal zone with relatively large areas but activities concentrated in specific locations (e.g., benthic trawling), SCAIRM reduces the estimated overall effect of related pressures and tends to attribute more weight to pressures that are widespread.
The spatially explicit CEA identified areas in the bathyal zone, closer to the 200 m bathymetric contour and extending from the Lisbon region to the south, as the most impacted. These areas are near shallower waters where a higher concentration of human activities occurs along Mainland Portugal’s EEZ (Fernandes et al., 2017). All the three categories of endogenic pressures considered are present in this area (i.e., physical change, biological disturbance, chemical changes, chemical and other pollution). Notably, for most bathyal habitats, no single pressure truly stands out from the others. This could result from multiple factors, including the clustered distribution of human activities, limitations due to poor habitat mapping and the partial availability of information on activities contributing to each pressure. As we move deeper, some pressures gain relevance, particularly those related to physical disturbances (e.g., changes in siltation, smothering) and chemical changes and pollution (e.g., introduction of synthetic compounds and litter). For abyssal benthic habitats, the dominance of some pressures is more evident, particularly the change in pH levels, and again litter and introduction of synthetic compounds. The reduction or absence of the effects of other pressures at abyssal depths can be explained by the distance of these habitats (hundreds of kilometers) from where most human activities take place. However, and despite that this CEA focused on the benthic components of the deep-sea, we cannot disregard the cascade effects from pressures harassing the pelagic environment, particularly those capable of disrupting benthic-pelagic coupling of critical processes such as e.g., nutrient cycling or energy transfer across food webs (Graf, 1989; Griffiths et al., 2017). Such pressures may have indirect implications to the deep seafloor components (Zhulay et al., 2023; Wurz et al., 2024), through impacts on the water column biotopes or pelagic processes and should be integrated in future assessments.
In addition to the distribution of pressures, the spatial variation in combined effects is also largely influenced by the distribution and relative vulnerability of marine ecosystems (Halpern et al., 2009). The most sensitive ECs occur in the bathyal zone, where the pressure intensity is also higher. Ecosystem components already affected by multiple endogenic pressures face an increased risk of further negative impacts from climate change (Levin, 2019). However, in the study area, the overlap between endogenic and exogenic pressures seems limited so far and synergistic effects have not been considered in this assessment. Vulnerability of the ecosystems to pressures is an important component of the approaches applied here, the SCAIRM (Piet et al., 2023) and the CEA using the Halpern et al. (2008) method. Both methods rely on expert judgement-based criteria to distinguish between degrees of vulnerability as characterized by complimentary elements (e.g., hazard - negligible to highly lethal, behavioral - likelihood of interaction based on avoidance response, time to recovery (ranging, from example from up to a year to over a century). Grasping how hazardous a pressure can be, its functional impact and how resistant are deep-sea communities or creating expectations about behavioral responses of yet unknow species and entire ecosystems let alone their recovery times, calls for highly conservative and precautionary use of vulnerability or sensitivity scores in deep-sea CEA studies (Smith et al., 2020). The poor resolution of global deep-sea environments habitat mapping, which this study so well illustrates, reflects the poor knowledge of deep-sea communities’ composition and distribution, and in this context, discriminating and prioritizing based on ecosystems’ vulnerability becomes even more challenging.
4.2 Implications for policy
Ensuring the sustainable use of the deep sea is a complex endeavor, given the uncertainty surrounding how deep-sea ecosystems will respond to exo- and endogenic pressures and the consequent implications for the ecosystem services and functions they provide (Armstrong et al., 2019). Achieving this objective is even more challenging when confronted with potentially competing business and policy objectives. Our results provide a snapshot of the recent impacts of multiple pressures, excluding older historical effects and omitting human activities for which data were insufficient, lacking or their presence is limited in space. This baseline serves as a reference point for comparing future combined effect assessments in the study area. As new data become available, these results must be continuously refined to reflect the evolving state of the ecosystem components and address the objectives of the MSFD. The areas identified with higher combined effects should be considered as priority locations for additional research and may require conservation/restoration actions. For instance, the area between 200 and 500 meters depth from the Lisbon region to the south of mainland Portugal is among the most intensively fished in European waters by trawling fleets (Bueno-Pardo et al., 2017; Eigaard et al., 2017). Currently, measures like the European Council EC Regulation 2016/2336, which prohibits bottom trawling below 800 meters for vessels targeting deep-sea fish species, do not protect these highly impacted locations. On the other hand, the decreasing trend in the intensity of human activities and resulting pressures as depth increases suggests that remote areas are potentially in better condition than those closer to the mainland, as observed for deep-sea areas in contiguous Spanish waters (Kazanidis et al., 2020). However, is important to note that the comparison of the combined effects is relative within the study area and not necessary reflect the real state of the ecosystem component (Micheli et al., 2013).
The results presented herein might also contribute to achieve the Aichi and the Kunming-Montreal Global Biodiversity Framework targets of the Convention on Biological Diversity by supporting targeted conservation measures. Of the four proposed or designated deep-sea MPAs, three are consistently classified as cold spots of combined effects. Additionally, these areas experience relatively low levels of exogenic pressures, which are particularly challenging to mitigate, compared to other pressures in the study region. These results indicate that these areas may be among the most suitable for effectively protecting deep-sea benthic habitats in the Portuguese Mainland EEZ. The Nazaré Canyon MPA, however, in its portion that is closer to the shore, is consistently classified as hot spot of combined effects. Considering the role of submarine canyons as transport pathways of litter and chemical pollution from the shelf to the deep-sea, this process deserves especial attention in the next steps of the implementation of this MPA. Similar hot spots of combined effects have been detected in the areas of Cascais, Lisbon and Setúbal canyons. As recognized by the designation of the West Iberian Canyons EBSA (CBD, 2019), these are important areas for the maintenance of biological diversity and ecosystem processes. EBSAs do not confer management obligations, but they do highlight areas where additional management measures may be appropriate. Our results contribute to prioritizing precautionary efforts and to the design of activity-specific management zones, both within and outside MPAs. Nevertheless, several other points need to be considered when defining Area-Based Management Tools, including MPAs, such as ensuring the representativeness of geomorphic features and benthic habitats (Fischer et al., 2019). The current resolution of deep-sea benthic habitat poorly represents the study area’s habitat diversity (e.g., occurrences of cold-water coral and sponge aggregations), due to the lack of biological and ecological data. Addressing this gap is crucial to support the conservation of deep-sea habitats and enhance future CEAs.
4.3 Sources of uncertainty
The reliability of CEA results heavily depends on the quality and accuracy of the underlying data (Halpern and Fujita, 2013; Stock and Micheli, 2016; Korpinen et al., 2021). Data on the distribution of human activities and ecosystem components at appropriate spatiotemporal scales is a fundamental requirement (Solaun et al., 2021). This study is a case study constrained by data limitations. While some data is available, it may not be sufficient to fully characterize all activities and pressures identified or with potential to occur within the study area. Also, ecosystem components within the study area are poorly mapped. The largest proportion of the study area has been classified solely based on bathymetry to distinguish between EC, while the substrate classification has been simplified to ‘seabed’. Vulnerable marine ecosystems like habitat-forming species are not identified in the study area using the most recently available EUSeaMap, despite the known presence of VMEs indicators such as deep-sea sponge aggregations, cold-water corals (ICES, 2020). Hence, the low spatial resolution of deep-sea benthic habitat mapping limits our ability to accurately identify and assess the risk of pressure effects. This gap can be partially overcome in the future with more survey effort and ecological modeling techniques (e.g., Morato et al., 2020). Regarding human activities, the AIS data, for example, are a valuable source for mapping the potential fishing footprint, but they may not fully capture the total extent of the activity or all shifts in fishing locations over time (Morgan and Baco, 2021). The same issues apply to pressures; for instance, in addition to the intensity of various human activities (e.g., maritime traffic, fishing), topography (e.g., the presence of submarine canyons) and oceanography determine the concentration of litter in the deep sea (Mordecai et al., 2011; Mecho et al., 2020). Nevertheless, the estimated spatial distribution of combined effects on benthic habitats is expected to accurately represent the actual conditions. Human activities should generally be more concentrated in the shallowest areas and become more diffuse as they extend into deeper regions.
In this study, the overlap of human activities with ecosystem components was used as the baseline to define a proxy for pressures. To reduce the uncertainty of this type of proxies, future studies might also include dispersal/diffusion models to better estimate the pressure extension and intensity in the study area (Loiseau et al., 2021). The sensitivity analysis identified the omission of pressures from the model as a major factor influencing the CEA output. The omission of pressures from the CEA may lead to the misrepresentation of key drivers, resulting in the underestimation of the overall effect score and limiting the effectiveness of mitigation measures. One pressure considered important in marine ecosystems is underwater noise. However, it was not possible to include this pressure in this assessment due to the lack of studies on underwater noise propagation. Nevertheless, despite the potential for widespread underwater noise pollution along major shipping routes, the impact on deep-sea benthic organisms may be limited (Glover and Smith, 2003). Vulnerability scores are a fundamental part of the CEA approach. Evaluating potential negative impacts of multiple human-induced pressures on deep-sea ecosystems depend primary on expert knowledge (e.g., Teck et al., 2010). Nevertheless, expert knowledge is also subject to uncertainty when estimating the sensitivity of ECs to a given pressure. This uncertainty should be considered during the CEA and can be addressed by estimating score ranges based on different sensitivity scenarios to improve the reliability of assessment results and their use for management (e.g., Jones et al., 2018). However, the sensitivity of CEA results to different vulnerability scores was not a major influence in this study. Finally, because pressures often impact ecosystem components in non-linear ways causing cascading effects within ecosystems, approaches based linear models may oversimplify or underestimate the consequences of such impacts (Griffiths et al., 2024). We tested the effect of changing the nature of the pressure effect (i.e., additive, antagonistic, dominant) on the CEA results. The sensitivity analysis identified this factor as the second most influential for the ranking of the ECs. Assuming the interactions among pressures as solely additive may lead, for instance, to an underestimation of combined effects compared to synergistic interactions, potentially resulting in misleading management decisions and increasing risks to ecosystems. Although accounting for the nature of interactions between pressures is crucial to estimate their effect on EC, its implementation remains difficult (Hodgson et al., 2019). Methods based on tipping point detection could help overcome this limitation. However, their application, especially in the deep sea, is hindered by the scarcity of long-term datasets (Orejas et al., 2020). These datasets are essential for comparing current conditions to baseline data and identifying trends over time.
4.4 The way forward
Addressing the multiple pressures on the deep sea requires effective conservation and management measures. However, significant knowledge gaps and governance challenges hinder our ability to adequately manage these pressures and ensure GES of deep-sea ecosystems (Johnson et al., 2018). We identified the improvement of benthic habitat mapping as a primary need to enhance the assessment of cumulative effects in deep-sea ecosystems. The characteristics of deep-sea benthic habitats, such as their low resilience to impact, combined with the absence of baseline information (i.e., habitat distribution, vulnerability and ecosystem responses to pressure effects) and the lack of long-term data series to evaluate trends, hampers the effective assessment of the environmental status of the deep sea. Enhancing international scientific collaboration through global initiatives like Challenger 150 (Howell et al., 2020) and fostering industry partnerships is therefore essential to address this limitation through monitoring, evaluation and adaptative management. Another important limitation to the application of the methodology followed in this study originates from the availability and quality of data related to activities and pressures, which affect, for instance, the development of more suitable pressure proxies. The continued provision of open-access databases with quality-assured, standardized, and harmonized marine data (e.g., EMODnet, European Atlas of the Seas) is crucial for future attempts to assess the combined effect of human activities and the ecological status of deep-sea ecosystems. Also, the development and increasing availability of global numerical ocean models with high temporal resolution provide valuable hindcast information to estimate climate change trends for various dynamic ocean variables, including those not covered in this study but having a significant impact on marine ecosystems (e.g., dissolved oxygen). This approach is not limited to open ocean areas but can also be applied to coastal marine ecosystems where regional ocean models are available. These models typically offer higher spatial resolution and better representations of ocean conditions, enabling the assessment of combined effects derived from climate change on shallow marine ecosystems. The spatial resolution used in CEA is ultimately determined by the quality of the available data and its relevance to the geographical scope of the assessment. Nevertheless, integration with spatial scales of higher or lower spatial resolution is technically feasible, supporting its application in localized assessments (e.g., management plans for specific Marine Protected Areas) or regional frameworks, such as within the scope of the OSPAR Regional Sea Convention and the North-East Atlantic Ocean marine region under the MSFD.
Data availability statement
The pressures dataset presented in this study is available in online repositories. The names of the repository/repositories and accession number(s) can be found below: https://doi.org/10.5281/zenodo.14941432. The original data underlying the pressures dataset were provided by multiple sources cited in the manuscript, including the SeaDataNet Pan-European infrastructure for ocean and marine data management (https://www.seadatanet.org), EMODnet (http://emodnet.ec.europa.eu) and Copernicus Marine Services (https://data.marine.copernicus.eu/products).
Author contributions
FM: Conceptualization, Data curation, Formal Analysis, Investigation, Methodology, Software, Visualization, Writing – original draft, Writing – review & editing. AH: Conceptualization, Formal Analysis, Funding acquisition, Investigation, Project administration, Resources, Validation, Visualization, Writing – original draft, Writing – review & editing. HT: Conceptualization, Formal Analysis, Funding acquisition, Investigation, Methodology, Project administration, Resources, Validation, Visualization, Writing – original draft, Writing – review & editing.
Funding
The author(s) declare that financial support was received for the research and/or publication of this article. The authors thank the GES4SEAS (Achieving Good Environmental Status FOR maintaining ecosystem SErvices, by ASsessing integrated impacts of cumulative pressures) project, funded by the European Union under the Horizon Europe Programme (grant agreement no. 101059877, www.ges4seas.eu; doi: 10.3030/101059877) and the BioProtect (Advancing area-based management tools to accelerate the protection and restoration of marine biodiversity across the European sea basins) project, funded by the European Union under Horizon Europe Programme (grant agreement no.101157341, www.bioprotect-project.eu; doi: 10.3030/101157341). The authors also acknowledge FCT/MCTES for the financial support to CESAM (UID Centro de Estudos do Ambiente e Mar (CESAM) + LA/P/0094/2020) through national funds. HT thanks FCT Fundação para a Ciência e Tecnologia, I.P. support through reference https://doi.org/10.54499/2022.08095.CEECIND/CP1720/CT0017.
Conflict of interest
The authors declare that the research was conducted in the absence of any commercial or financial relationships that could be construed as a potential conflict of interest.
The author(s) declared that they were an editorial board member of Frontiers, at the time of submission. This had no impact on the peer review process and the final decision.
Generative AI statement
The author(s) declare that no Generative AI was used in the creation of this manuscript.
Publisher’s note
All claims expressed in this article are solely those of the authors and do not necessarily represent those of their affiliated organizations, or those of the publisher, the editors and the reviewers. Any product that may be evaluated in this article, or claim that may be made by its manufacturer, is not guaranteed or endorsed by the publisher.
Supplementary material
The Supplementary Material for this article can be found online at: https://www.frontiersin.org/articles/10.3389/fmars.2025.1532964/full#supplementary-material
References
Andersen J. H., Stock A., Mannerla M., Heinänen S., Vinther M. (2013). Human uses, pressures and impacts in the eastern North Sea (DCE – Danish Centre for Environment and Energy: Aarhus University). Available at: http://www.dmu.dk/Pub/TR18.pdf (Accessed February 6, 2024).
Armstrong C. W., Vondolia G. K., Foley N. S., Henry L.-A., Needham K., Ressurreição A. (2019). Expert assessment of risks posed by climate change and anthropogenic activities to ecosystem services in the deep North Atlantic. Front. Mar. Sci. 6. doi: 10.3389/fmars.2019.00158
Batista M. I., Henriques S., Pais M. P., Cabral H. N. (2014). Assessment of cumulative human pressures on a coastal area: Integrating information for MPA planning and management. Ocean Coast. Manage. 102, 248–257. doi: 10.1016/j.ocecoaman.2014.09.020
Benn A. R., Weaver P. P., Billet D. S. M., van den Hove S., Murdock A. P., Doneghan G. B., et al. (2010). Human activities on the deep seafloor in the North East Atlantic: an assessment of spatial extent. PloS One 5, e12730. doi: 10.1371/journal.pone.0012730
Borgwardt F., Robinson L., Trauner D., Teixeira H., Nogueira A. J. A., Lillebø A. I., et al. (2019). Exploring variability in environmental impact risk from human activities across aquatic ecosystems. Sci. Total Environ. 652, 1396–1408. doi: 10.1016/j.scitotenv.2018.10.339
Borja A., Elliott M., Teixeira H., Stelzenmüller V., Katsanevakis S., Coll M., et al. (2024). Addressing the cumulative impacts of multiple human pressures in marine systems, for the sustainable use of the seas. Front. Ocean Sustain. 1. doi: 10.3389/focsu.2023.1308125
Brunson J. C. (2020). ggalluvial: layered grammar for alluvial plots. J. Open Source Software 5, 2017. doi: 10.21105/joss.02017
Bueno-Pardo J., Ramalho S. P., García-Alegre A., Morgado M., Vieira R. P., Cunha M. R., et al. (2017). Deep-sea crustacean trawling fisheries in Portugal: Quantification of effort and assessment of landings per unit effort using a Vessel Monitoring System (VMS). Sci. Rep. 7, 40795. doi: 10.1038/srep40795
Campos A., Henriques V., Erzini K., Castro M. (2021). Deep-sea trawling off the Portuguese continental coast—-Spatial patterns, target species and impact of a prospective EU-level ban. Mar. Polic. 128, 104466. doi: 10.1016/j.marpol.2021.104466
Carroll A. G., Przeslawski R., Duncan A., Gunning M., Bruce B. (2017). A critical review of the potential impacts of marine seismic surveys on fish & invertebrates. Mar. pollut. Bull. 114, 9–24. doi: 10.1016/j.marpolbul.2016.11.038
CBD (2019). Report of the regional workshop to facilitate the description of Ecologically or Biologically Significant marine areas in the North-East Atlantic Ocean. (Stockholm: Convention on Biological Diversity). Available at: https://www.cbd.int/doc/c/7d96/2418/5a119cb332dbc741312d97b6/ebsa-ws-2019-01-04-en.pdf.
Clark M. R., Althaus F., Schlacher T. A., Williams A., Bowden D. A., Rowden A. A. (2016). The impacts of deep-sea fisheries on benthic communities: A review. ICES J. Mar. Sci. 73, i51–i69. doi: 10.1093/icesjms/fsv123
Duarte C. M., Chapuis L., Collin S. P., Costa D. P., Devassy R. P., Eguiluz V. M., et al. (2021). The soundscape of the Anthropocene ocean. Science 371, eaba4658. doi: 10.1126/science.aba4658
Dunn D. C., Ardron J., Bax N., Bernal P., Cleary J., Cresswell I., et al. (2014). The Convention on Biological Diversity’s Ecologically or Biologically Significant Areas: Origins, development, and current status. Mar. Polic. 49, 137–145. doi: 10.1016/j.marpol.2013.12.002
Durán R., Puig P., Paradis S., Guillén J., Palanques A., Iacono C. L., et al. (2023). Long-term morphological and sedimentological changes caused by bottom trawling on the northern Catalan continental shelf (NW Mediterranean). Front. Mar. Sci. 10. doi: 10.3389/fmars.2023.1270485
Eastwood P. D., Mills C. M., Aldridge J. N., Houghton C. A., Rogers S. I. (2007). Human activities in UK offshore waters: an assessment of direct, physical pressure on the seabed. ICES J. Mar. Sci. 64, 453–463. doi: 10.1093/icesjms/fsm001
Eigaard O. R., Bastardie F., Hintzen N. T., Buhl-Mortensen L., Buhl-Mortensen P., Catarino R., et al. (2017). The footprint of bottom trawling in European waters: distribution, intensity, and seabed integrity. ICES J. Mar. Sci. 74, 847–865. doi: 10.1093/icesjms/fsw194
Elliott M. (2011). Marine science and management means tackling exogenic unmanaged pressures and endogenic managed pressures – A numbered guide. Mar. pollut. Bull. 62, 651–655. doi: 10.1016/j.marpolbul.2010.11.033
Elliott M., Burdon D., Atkins J. P., Borja A., Cormier R., de Jonge V. N., et al. (2017). And DPSIR begat DAPSI(W)R(M)!” - A unifying framework for marine environmental management. Mar. pollut. Bull. 118, 27–40. doi: 10.1016/j.marpolbul.2017.03.049
Erbe C., Duncan A., Vigness-Raposa K. J. (2022). “Introduction to sound propagation under Water,” in Exploring Animal Behavior Through Sound: Volume 1. Eds. Erbe C., Thomas J. A. (Cham, Switzerland: Springer), 185–216. doi: 10.1007/978-3-030-97540-1_6
European Commission (2008). Directive 2008/56/EC of the European Parliament and of the Council of 17th June 2008 establishing a framework for community action in the field of marine environmental policy (Marine Strategy Framework Directive). Available online at: https://eur-lex.europa.eu/legal-content/EN/TXT/PDF/?uri=CELEX:32008L0056 (Accessed June 11, 2024).
Fernandes M., da L., Esteves T. C., Oliveira E. R., Alves F. L. (2017). How does the cumulative impacts approach support Maritime Spatial Planning? Ecol. Indic. 73, 189–202. doi: 10.1016/j.ecolind.2016.09.014
Fischer A., Bhakta D., Macmillan-Lawler M., Harris P. (2019). Existing global marine protected area network is not representative or comprehensive measured against seafloor geomorphic features and benthic habitats. Ocean Coast. Manage. 167, 176–187. doi: 10.1016/j.ocecoaman.2018.10.001
Fraschetti S., Pipitone C., Mazaris A. D., Rilov G., Badalamenti F., Bevilacqua S., et al. (2018). Light and shade in marine conservation across European and contiguous seas. Front. Mar. Sci. 5. doi: 10.3389/fmars.2018.00420
Galparsoro I., Connor D. W., Borja Á., Aish A., Amorim P., Bajjouk T., et al. (2012). Using EUNIS habitat classification for benthic mapping in European seas: Present concerns and future needs. Mar. pollut. Bull. 64, 2630–2638. doi: 10.1016/j.marpolbul.2012.10.010
Gehlen M., Séférian R., Jones D. O. B., Roy T., Roth R., Barry J., et al. (2014). Projected pH reductions by 2100 might put deep North Atlantic biodiversity at risk. Biogeosciences 11, 6955–6967. doi: 10.5194/bg-11-6955-2014
Glover A. G., Smith C. R. (2003). The deep-sea floor ecosystem: current status and prospects of anthropogenic change by the year 2025. Environ. Conserv. 30, 219–241. doi: 10.1017/s0376892903000225
Graf G. (1989). Benthic-pelagic coupling in a deep-sea benthic community. Nature 341, 437–439. doi: 10.1038/341437a0
Griffiths J. R., Kadin M., Nascimento F. J. A., Tamelander T., Törnroos A., Bonaglia S., et al. (2017). The importance of benthic–pelagic coupling for marine ecosystem functioning in a changing world. Glob. Change Biol. 23, 2179–2196. doi: 10.1111/gcb.13642
Griffiths L. L., Williams J., Buelow C. A., Tulloch V. J., Turschwell M. P., Campbell M. D., et al. (2024). A data-driven approach to multiple-stressor impact assessment for a marine protected area. Conserv. Biol. 38, e14177. doi: 10.1111/cobi.14177
Grorud-Colvert K., Sullivan-Stack J., Roberts C., Constant V., Costa B., Pike E. P., et al. (2021). The MPA Guide: A framework to achieve global goals for the ocean. Science 373, eabf0861. doi: 10.1126/science.abf0861
Halpern B. S., Fujita R. (2013). Assumptions, challenges, and future directions in cumulative impact analysis. Ecosphere 4, 1–11. doi: 10.1890/es13-00181.1
Halpern B. S., Kappel C. V., Selkoe K. A., Micheli F., Ebert C. M., Kontgis C., et al. (2009). Mapping cumulative human impacts to California Current marine ecosystems. Conserv. Lett. 2, 138–148. doi: 10.1111/j.1755-263x.2009.00058.x
Halpern B., Selkoe K. A., Micheli F., Kappel C. V. (2007). Evaluating and ranking the vulnerability of global marine ecosystems to anthropogenic threats. Conserv. Biol. 21, 1301–1315. doi: 10.1111/j.1523-1739.2007.00752.x
Halpern B. S., Walbridge S., Selkoe K. A., Kappel C. V., Micheli F., Agrosa C. D., et al. (2008). A global map of human impact on marine ecosystems. Science 319, 948–952. doi: 10.1126/science.1149345
Hammar L., Molander S., Pålsson J., Crona J. S., Carneiro G., Johansson T., et al. (2020). Cumulative impact assessment for ecosystem-based marine spatial planning. Sci. Total Environ. 734, 139024. doi: 10.1016/j.scitotenv.2020.139024
Harris P. T., Westerveld L., Zhao Q., Costello M. J. (2023). Rising snow line: Ocean acidification and the submergence of seafloor geomorphic features beneath a rising carbonate compensation depth. Mar. Geol. 463, 107121. doi: 10.1016/j.margeo.2023.107121
HELCOM (2023). HELCOM Thematic assessment of spatial distribution of pressures and impacts 2016- 2021. Baltic Sea Environment Proceedings 189 (Helsinki, Finland: Helsinki Commission – HELCOM).
Hermans A., Winter H. V., Gill A. B., Murk A. J. (2024). Do electromagnetic fields from subsea power cables effect benthic elasmobranch behavior? A risk-based approach for the Dutch Continental Shelf. Environ. pollut. 346, 123570. doi: 10.1016/j.envpol.2024.123570
Hijmans R. J. (2024). “raster: geographic data analysis and modeling,” in R package version 3.6-30. Available at: https://CRAN.R-project.org/package=raster (Accessed October 3, 2024).
Hilmi N., Sutherland M., Farahmand S., Haraldsson G., Doorn E., Ernst E., et al. (2023). Deep sea nature-based solutions to climate change. Front. Clim. 5. doi: 10.3389/fclim.2023.1169665
Hodgson E. E., Halpern B. S., Essington T. E. (2019). Moving beyond silos in cumulative effects assessment. Front. Ecol. Evol. 7. doi: 10.3389/fevo.2019.00211
Howell K. L. (2010). A benthic classification system to aid in the implementation of marine protected area networks in the deep/high seas of the NE Atlantic. Biol. Conserv. 143, 1041–1056. doi: 10.1016/j.biocon.2010.02.001
Howell K. L., Hilário A., Allcock A. L., Bailey D. M., Baker M., Clark M. R., et al. (2020). A blueprint for an inclusive, global deep-sea ocean decade field program. Front. Mar. Sci. 7. doi: 10.3389/fmars.2020.584861
ICES (2020). Vulnerable Marine Ecosystems (VME) (Copenhagen, Denmark: International Council for the Exploration of the Sea). Available at: https://vme.ices.dk (Accessed January 26, 2024).
Johnson D., Ferreira M. A., Kenchington E. (2018). Climate change is likely to severely limit the effectiveness of deep-sea ABMTs in the North Atlantic. Mar. Polic. 87, 111–122. doi: 10.1016/j.marpol.2017.09.034
Jones A. R., Doubleday Z. A., Prowse T. A. A., Wiltshire K. H., Deveney M. R., Ward T., et al. (2018). Capturing expert uncertainty in spatial cumulative impact assessments. Sci. Rep. 8, 1469. doi: 10.1038/s41598-018-19354-6
Jouffray J.-B., Blasiak R., Norström A. V., Österblom H., Nyström M. (2020). The blue acceleration: the trajectory of human expansion into the ocean. One Earth 2, 43–54. doi: 10.1016/j.oneear.2019.12.016
Katsanevakis S., Olenin S., Puntila-Dodd R., Rilov G., Stæhr P. A. U., Teixeira H., et al. (2023). Marine invasive alien species in Europe: 9 years after the IAS Regulation. Front. Mar. Sci. 10. doi: 10.3389/fmars.2023.1271755
Kazanidis G., Orejas C., Borja A., Kenchington E., Henry L.-A., Callery O., et al. (2020). Assessing the environmental status of selected North Atlantic deep-sea ecosystems. Ecol. Indic. 119, 106624. doi: 10.1016/j.ecolind.2020.106624
Knights A. M., Koss R. S., Robinson L. A. (2013). Identifying common pressure pathways from a complex network of human activities to support ecosystem-based management. Ecol. Appl. 23, 755–765. doi: 10.1890/12-1137.1
Knights A. M., Piet G. J., Jongbloed R. H., Tamis J. E., White L., Akoglu E., et al. (2015). An exposure-effect approach for evaluating ecosystem-wide risks from human activities. ICES J. Mar. Sci. 72, 1105–1115. doi: 10.1093/icesjms/fsu245
Korpinen S., Laamanen L., Bergström L., Nurmi M., Andersen J. H., Haapaniemi J., et al. (2021). Combined effects of human pressures on Europe’s marine ecosystems. Ambio 50, 1325–1336. doi: 10.1007/s13280-020-01482-x
Koslow J. A., Boehlert G. W., Gordon J. D. M., Haedrich R. L., Lorance P., Parin N. (2000). Continental slope and deep-sea fisheries: implications for a fragile ecosystem. ICES J. Mar. Sci. 57, 548–557. doi: 10.1006/jmsc.2000.0722
Kroodsma D. A., Mayorga J., Hochberg T., Miller N. A., Boerder K., Ferretti F., et al. (2018). Tracking the global footprint of fisheries. Science 359, 904–908. doi: 10.1126/science.aao5646
La Bianca G., Rees S., Attrill M. J., Lombard A. T., McQuaid K. A., Niner H. J., et al. (2023). A standardised ecosystem services framework for the deep sea. Front. Mar. Sci. 10. doi: 10.3389/fmars.2023.1176230
Levin L. (2019). Sustainability in deep water: the challenges of climate change, human pressures, and biodiversity conservation. Oceanography 32, 170–180. doi: 10.5670/oceanog.2019.224
Levin L. A., Amon D. J., Lily H. (2020). Challenges to the sustainability of deep-seabed mining. Nat. Sustain. 3, 784–794. doi: 10.1038/s41893-020-0558-x
Loiseau C., Thiault L., Devillers R., Claudet J. (2021). Cumulative impact assessments highlight the benefits of integrating land-based management with marine spatial planning. Sci. Total Environ. 787, 147339. doi: 10.1016/j.scitotenv.2021.147339
Lonsdale J.-A., Nicholson R., Judd A., Elliott M., Clarke C. (2020). A novel approach for cumulative impacts assessment for marine spatial planning. Environ. Sci. Polic. 106, 125–135. doi: 10.1016/j.envsci.2020.01.011
Madureira P., Ribeiro L. P. (2023). “Marine mineral resources,” in Portugal and the constitution for the oceans: the United Nations Convention on the Law of the Sea 40 years later. Eds. Kowalski M., Antunes J. G. (Lisboa, Portugal: Instituto Diplomático do Ministério dos Negócios Estrangeiros & Universidade Autónoma de Lisboa). doi: 10.26619/978-989-9002-26-5
Mecho A., Francescangeli M., Ercilla G., Fanelli E., Estrada F., Valencia J., et al. (2020). Deep-sea litter in the Gulf of Cadiz (Northeastern Atlantic, Spain). Mar. pollut. Bull. 153, 110969. doi: 10.1016/j.marpolbul.2020.110969
Micheli F., Halpern B. S., Walbridge S., Ciriaco S., Ferretti F., Fraschetti S., et al. (2013). Cumulative human impacts on Mediterranean and Black Sea marine ecosystems: Assessing current pressures and opportunities. PloS One 8, e79889. doi: 10.1371/journal.pone.0079889
Mickaël V., Benjamin S., Ashley C., Emily T., Sofia W., Eva E., et al. (2023). EUSeaMap 2023, A European broad-scale seabed habitat map, Technical Report. Ref. EASME/EMFF/2020/3.1.11/Lot3/SI2.843624 – EMODnet Thematic Lot n° 3 – Seabed Habitats - D1.15 (Brest, France: EMODnet). doi: 10.13155/97116
Morato T., Irusta J. M. G., Carrió C. D., Wei C.-L., Davies A. J., Sweetman A. K., et al. (2020). Climate-induced changes in the suitable habitat of cold-water corals and commercially important deep-sea fishes in the North Atlantic. Glob. Change Biol. 26, 2181–2202. doi: 10.1111/gcb.14996
Mordecai G., Tyler P. A., Masson D. G., Huvenne V. (2011). Litter in submarine canyons off the west coast of Portugal. Deep Sea Res. II: Top. Stud. Oceanogr. 58, 2489–2496. doi: 10.1016/j.dsr2.2011.08.009
Morgan N. B., Baco A. R. (2021). Recent fishing footprint of the high-seas bottom trawl fisheries on the Northwestern Hawaiian Ridge and Emperor Seamount Chain: A finer-scale approach to a large-scale issue. Ecol. Indic. 121, 107051. doi: 10.1016/j.ecolind.2020.107051
Morris M. D. (1991). Factorial sampling plans for preliminary computational experiments. Technometrics 33, 161–174. doi: 10.1080/00401706.1991.10484804
Murphy G. E. P., Stock A., Kelly N. E. (2024). From land to deep sea: A continuum of cumulative human impacts on marine habitats in Atlantic Canada. Ecosphere 15. doi: 10.1002/ecs2.4964
O’Hagan A. M. (2020). “Ecosystem-based management (EBM)and ecosystem services in EU law, policyand governance,” in Ecosystem-Based Management, Ecosystem Services and Aquatic Biodiversity. Eds. O’Higgins T. G., Lago M., DeWitt T. H. (Cham, Switzerland: Springer), 353–372. doi: 10.1007/978-3-030-45843-0_18
Orejas C., Kenchington E., Rice J., Kazanidis G., Palialexis A., Johnson D., et al. (2020). Towards a common approach to the assessment of the environmental status of deep-sea ecosystems in areas beyond national jurisdiction. Mar. Polic. 121, 104182. doi: 10.1016/j.marpol.2020.104182
Paradis S., Goñi M., Masqué P., Durán R., Arjona-Camas M., Palanques A., et al. (2021). Persistence of biogeochemical alterations of deep-sea sediments by bottom trawling. Geophys. Res. Lett. 48. doi: 10.1029/2020gl091279
Paulus E. (2021). Shedding light on deep-sea biodiversity—A highly vulnerable habitat in the face of anthropogenic change. Front. Mar. Sci. 08. doi: 10.3389/fmars.2021.667048
Pebesma E. (2018). Simple features for R: standardized support for spatial vector data. R J. 10, 439. doi: 10.32614/rj-2018-009
Piet G., Grundlehner A., Jongbloed R., Tamis J., de Vries P. (2023). SCAIRM: A spatial cumulative assessment of impact risk for management. Ecol. Indic. 157, 111157. doi: 10.1016/j.ecolind.2023.111157
Pinto B., Castro P. (2021). Contesting political decisions involving environmental issues: A case study in Portugal based on the press about offshore oil and gas drilling. Front. Mar. Sci. 8. doi: 10.3389/fmars.2021.684753
QGIS.org (2023). QGIS Geographic Information System (QGIS Association). Available at: http://www.qgis.org (Accessed January 17, 2024).
Ramalho S. P., Lins L., Bueno-Pardo J., Cordova E. A., Amisi J. M., Lampadariou N., et al. (2017). Deep-sea mega-epibenthic assemblages from the SW Portuguese margin (NE Atlantic) subjected to bottom-trawling fisheries. Front. Mar. Sci. 4. doi: 10.3389/fmars.2017.00350
Ramalho S. P., Lins L., Soetaert K., Lampadariou N., Cunha M. R., Vanreusel A., et al. (2020). Ecosystem functioning under the influence of bottom-trawling disturbance: an experimental approach and field observations from a continental slope area in the West Iberian Margin. Front. Mar. Sci. 7. doi: 10.3389/fmars.2020.00457
Ramirez-Llodra E. (2020). “Chapter 2 deep-sea ecosystems: biodiversity and anthropogenic impacts,” in The Law of the Seabed (Leiden, The Netherlands: Brill | Nijhoff), 36–60. doi: 10.1163/9789004391567_004
R Core Team (2024). R: A Language and Environment for Statistical Computing (R Foundation for Statistical Computing). Available at: http://www.R-project.org/ (Accessed January 17, 2024).
Richardson K., Hardesty B. D., Vince J., Wilcox C. (2022). Global estimates of fishing gear lost to the ocean each year. Sci. Adv. 8, eabq0135. doi: 10.1126/sciadv.abq0135
Rodrigues A. R., Floeter S. R., Gomes V., Ferrari D. S., Giglio V. J., Silva F. C., et al. (2023). Integrated ecosystem assessment around islands of the tropical South Mid-Atlantic Ridge. Front. Mar. Sci. 10. doi: 10.3389/fmars.2023.1001676
Röthig T., Trevathan-Tackett S. M., Voolstra C. R., Ross C., Chaffron S., Durack P. J., et al. (2023). Human-induced salinity changes impact marine organisms and ecosystems. Glob. Change Biol. 29, 4731–4749. doi: 10.1111/gcb.16859
Schaap D. M. A., Lowry R. K. (2010). SeaDataNet – Pan-European infrastructure for marine and ocean data management: unified access to distributed data sets. Int. J. Digit. Earth 3, 50–69. doi: 10.1080/17538941003660974
Slowikowski K. (2024). ggrepel: Automatically Position Non-Overlapping Text Labels with “ggplot2”. R package version 0.9.6. Available online at: https://CRAN.R-project.org/package=ggrepel (Accessed September 30, 2024).
Smith C. J., Papadopoulou K.-N., Barnard S., Mazik K., Elliott M., Patrício J., et al. (2016). Managing the marine environment, conceptual models and assessment considerations for the European marine strategy framework directive. Front. Mar. Sci. 3. doi: 10.3389/fmars.2016.00144
Smith C. R., Tunnicliffe V., Colaço A., Drazen J. C., Gollner S., Levin L. A., et al. (2020). Deep-sea misconceptions cause underestimation of seabed-mining impacts. Trends Ecol. Evol. 35, 853–857. doi: 10.1016/j.tree.2020.07.002
Solaun O., Sagarminaga Y., Menchaca I., Galparsoro I. (2021). Spatial overlap between human activities and seabed habitats in European Seas: Insights into EMODnet’s data for management purposes. Mar. Polic. 130, 104551. doi: 10.1016/j.marpol.2021.104551
Souza E. N., Boerder K., Matwin S., Worm B. (2016). Improving fishing pattern detection from satellite AIS using data mining and machine learning. PloS One 11, e0158248. doi: 10.1371/journal.pone.0158248
Stelzenmüller V., Coll M., Mazaris A. D., Giakoumi S., Katsanevakis S., Portman M. E., et al. (2018). A risk-based approach to cumulative effect assessments for marine management. Sci. Total Environ. 612, 1132–1140. doi: 10.1016/j.scitotenv.2017.08.289
Stock A. (2016). Open source software for mapping human impacts on marine ecosystems with an additive model. J. Open Res. Softw. 4, e21. doi: 10.5334/jors.88
Stock A., Micheli F. (2016). Effects of model assumptions and data quality on spatial cumulative human impact assessments. Glob. Ecol. Biogeogr. 25, 1321–1332. doi: 10.1111/geb.12493
Stratoudakis Y., Hilário A., Ribeiro C., Abecasis D., Gonçalves E. J., Andrade F., et al. (2019). Environmental representativity in marine protected area networks over large and partly unexplored seascapes. Glob. Ecol. Conserv. 17, e00545. doi: 10.1016/j.gecco.2019.e00545
Sweetman A. K., Thurber A. R., Smith C. R., Levin L. A., Mora C., Wei C.-L., et al. (2017). Major impacts of climate change on deep-sea benthic ecosystems. Elem. Sci. Anth. 5, 4. doi: 10.1525/elementa.203
Teck S. J., Halpern B. S., Kappel C. V., Micheli F., Selkoe K. A., Crain C. M., et al. (2010). Using expert judgment to estimate marine ecosystem vulnerability in the California Current. Ecol. Appl. 20, 1402–1416. doi: 10.1890/09-1173.1
Thurber A. R., Sweetman A. K., Narayanaswamy B. E., Jones D. O. B., Ingels J., Hansman R. L. (2014). Ecosystem function and services provided by the deep sea. Biogeosciences 11, 3941–3963. doi: 10.5194/bg-11-3941-2014
Todd E. (2017). JOIDES Resolution (JR) research vessel (Integrated Ocean Drilling Program (IODP). Available online at: https://joidesresolution.org/how-does-the-jr-actually-drill-a-hole-into-the-seafloor/ (Accessed June 3, 2024).
Vasquez M., Allen H., Manca E., Castle L., Lillisi H., Agnesih S., et al. (2021). EUSeaMap 2021. A European broad-scale seabed habitat map. Ref. D1.13 EASME/EMFF/2018/1.3.1.8/Lot2/SI2.810241– EMODnet Thematic Lot n° 2 – Seabed Habitats EUSeaMap 2021 - Technical Report (Brest, France: EMODnet). doi: 10.13155/83528
Vieira R. P., Raposo I. P., Sobral P., Gonçalves J. M. S., Bell K. L. C., Cunha M. R. (2015). Lost fishing gear and litter at Gorringe Bank (NE Atlantic). J. Sea Res. 100, 91–98. doi: 10.1016/j.seares.2014.10.005
Vihtakari M. (2024). ggOceanMaps: Plot Data on Oceanographic Maps using “ggplot2”. R package version 2.2.0. Available online at: https://mikkovihtakari.github.io/ggOceanMaps/ (Accessed September 30, 2024).
Wurz E., Olsen L. M. B., Busch K., Ulvatn T., Rapp H. T., Osinga R., et al. (2024). Adverse effects of crushed seafloor massive sulphide deposits on the boreal deep-sea sponge Geodia barretti Bowerbank 1858 and its associated fauna. Deep Sea Res. Part: Oceanogr. Res. Pap. 208, 104311. doi: 10.1016/j.dsr.2024.104311
Keywords: combined effect assessment, human activities, climate change, data-poor, deep sea, benthic habitats
Citation: Matos FL, Hilário A and Teixeira H (2025) Impact chains for the deep seafloor: assessing pressures footprint under limited knowledge and uncertainty. Front. Mar. Sci. 12:1532964. doi: 10.3389/fmars.2025.1532964
Received: 22 November 2024; Accepted: 10 March 2025;
Published: 28 March 2025.
Edited by:
Chiara Piroddi, Joint Research Centre (Italy), ItalyReviewed by:
Maria Gabriela Palomo, Independent Researcher, Ciudad de Buenos Aires, ArgentinaMarco Palma, European Commission, Italy
Copyright © 2025 Matos, Hilário and Teixeira. This is an open-access article distributed under the terms of the Creative Commons Attribution License (CC BY). The use, distribution or reproduction in other forums is permitted, provided the original author(s) and the copyright owner(s) are credited and that the original publication in this journal is cited, in accordance with accepted academic practice. No use, distribution or reproduction is permitted which does not comply with these terms.
*Correspondence: Fábio L. Matos, Zm1hdG9zQHVhLnB0