 Muhammad Mohsin
 Hengbin Yin
 Ana Mehak
- 1College of Economics, Jiujiang University, Jiujiang, China
- 2School of Finance and Trade, Wenzhou Business College, Wenzhou, China
- 3Department of International Trade, Sung Kyun Kwan University, Seoul, Republic of Korea
Risk perception is crucial for making effective fisheries management strategies. However, this role of risk perception needs to be addressed, particularly in developing countries. Published literature documents such a scenario in the case of Pakistan, which results in a decreased economic contribution to the fisheries sector. Despite its importance, the role of risk perception in managing the fisheries sector is absent in online scientific studies. The present study strives to address this research void by analyzing survey-based data collected through snowball sampling between May 2022 and October 2024. Multivariate analysis, viz., Structure Equation Modeling (SEM), was done through Statistical Package for Social Sciences (SPSS) as well as Analysis of Moment Structures (AMOS). Cronbach’s alpha values for all constructs were above 0.6, with the highest being 0.962 for policies and regulations risk, confirming data reliability. Confirmatory Factor Analysis (CFA) indices, including Comparative Fit Index (CFI) (0.933) and Tucker-Lewis index (TLI) (0.916), indicated a good model fit, with acceptable construct reliability (CR) and Average Variance Extracted (AVE) values. SEM showed that economic risk (estimate = -0.425, p = 0.000), environmental risk (estimate = -0.251, p = 0.007), and consumption risk (estimate = -0.265, p = 0.000) negatively impacted performance, while policies and regulations risk (estimate = -0.113, p = 0.121) and infrastructure and logistics risk (estimate = -0.073, p = 0.411) were insignificant. Risk perception was a significant mediator of performance, with varying effects across Sindh and Balochistan. According to the survey participants, there is a dire need to increase levels of fisheries risk perception, which can be achieved through properly designed capacity-building and incentive-based management techniques. Furthermore, this study discusses the practical implications and limitations.
1 Introduction
A primary objective of managing fisheries risks is to ensure food security and economic viability (McClanahan et al., 2015). Fisheries management relies on specific regulations to safeguard the sector from various deleterious risks (Martinet et al., 2016). The first step in formulating regulation is the perception of risk. Risk perception refers to the cognitive opinion of the stakeholders regarding various uncertain risks associated with the fisheries sector. A fundamental element of fisheries risk management is the perception of risk (Le and Cheong, 2010; Joffre et al., 2018). Risk management ensures sustainable long-term utilization of fishery resources and ecosystem conservation (Sethi, 2010). Several federal and provincial laws in Pakistan strive to address the risks the fisheries sector faces. This sector accounts for about 0.4% of the country’s GDP and provides income for more than 3 million individuals (Noman et al., 2022; Mehak et al., 2023). It provides vital protein, fatty acids and vitamin sources to people. This sector also generates export earnings by trading fishery products such as prawns, shrimps, and fish fillets to various world countries (Jawaid et al., 2019). However, this sector’s contribution is far less than its potential (Rehman et al., 2019). Published literature demonstrates that the fisheries sector faces many risks in Pakistan, including overexploitation, pollution, environmental degradation, legislative shortcomings, and lack of coordination between different regulatory bodies (Noman et al., 2022).
Improving risk management in the fisheries sector heavily depends on how people perceive and assess risks (Chen et al., 2021). Therefore, acknowledging risks through risk perception is necessary to form an effective management plan. Stakeholders’ risk perception guides managers in making informed and effective management decisions. Thus, adaptive strategies can be formed to encounter risks. Getting stakeholders involved in the risk appraisal framework develops trust through cooperation between different counterparts in the fisheries industry, making it possible to achieve common goals. Hence, risk perception forms the basis of risk management (Sethi, 2010; Soma et al., 2018; Jones and Seara, 2020). Risk perception acts as a filter highlighting significant risks to be prioritized for mitigation (Lambert et al., 2001). The cognitive evaluation of risks through a risk perception mechanism enables an organization to formulate purposefully designed targeted strategies (Hodgson et al., 2019; Woods et al., 2022). Unfortunately, even though there is a significant impact of risk perception in the risk management process, it is generally ignored to be included in the risk mitigation plan. There is a distinct tendency for this to happen in developing countries, where a lack of risk perception usually leads to ineffective management strategies (Hebbsale and Shivamurthy, 2021; dos Santos et al., 2024). In contrast, scientific studies in these countries related to risk perception and its mediating effect on the association between fisheries risk management and awareness of risk are rare (Mehak et al., 2023).
The occurrence of risks in the presence of management regulations raises several questions about the performance of the existing management regime in Pakistan (Mohsin et al., 2017; Raza et al., 2022). Additionally, the published literature reveals that the fishing industry is confronted with a wide range of risks, including economic, management, environmental, and more. Each of these main risk categories contains specific sub-risks, which add to the complexity and uncertainty that impact the sector’s sustainability and operations (Mohsin et al., 2021; Mehak et al., 2023). Two logical questions concerning this situation include: 1) What are the main risk types and sub-types hampering Pakistan’s fisheries sector, and how do they influence performance? 2) Can the relationship between risk management initiatives and performance outcomes be mediated by the perception of fisheries risk? Published literature related to fisheries mainly documents the biological management of fishery resources and some other aspects such as pollution, environmental change, fisheries’ relationship, etc (Khan and Khan, 2011; Nazeer et al., 2016; Kalhoro et al., 2024). However, categorizing fisheries’ risks, their performance impact, and their risk awareness still need to be clarified. The present study aims to address this research void. Following are the objectives of this study: 1) classify the main and sub-risks encountered by the fisheries. 2) Examine the interplay between the risks associated with fisheries and their overall performance. 3) Determine how awareness of risk affects risk performance.
Various statistical routines can be employed to evaluate multiple variables’ relationship and mediating role. However, multivariate analysis is a famous method utilized to detect cause-and-effect relationships between the individual components of data sets by analyzing the data from multiple sources and combining them into a single data set. In terms of multivariate analysis, both sampling methodology along with the research objective are crucial in determining how the analysis is conducted (Byrne, 2001; Narayanan, 2012). A multivariate analysis is a method of analyzing large amounts of data to simplify it while preserving meaningful information, which is helpful for interpretation if the data is complex. By using this method, variables are grouped according to their characteristics. The reliability of this method can be demonstrated by the fact that it is often used to test specific hypotheses. A particular factor can also be tested for its influence or impact on another (Gallagher et al., 2008; Silva et al., 2021). Employing multivariate analysis has several advantages. Multivariate analysis is a powerful technique for analyzing data because it considers many factors at once. Several independent variables are considered to determine the factor that influences the dependent variable (Nunkoo and Ramkissoon, 2012; Quijano et al., 2023). Structural Equation Modeling (SEM) is a specialized multivariate analysis which is ideal for analyzing the complex relationships between various risk types and fisheries performance (Gu et al., 2023; Robotham et al., 2019). It allows for examining both direct and indirect effects, particularly how risk perception mediates the relationship between risk management and performance. SEM’s ability to handle multivariate data and validate constructs through Confirmatory Factor Analysis (CFA) ensures robust and reliable findings. This approach provides valuable insights for policy development, guiding more effective fisheries management strategies based on empirical evidence (Zhang et al., 2025; Capmourteres and Anand, 2016; Gu et al., 2023). Thus, SEM is particularly suitable for addressing research questions.
This study uses robust analytical techniques and data from a variety of stakeholders to evaluate risk perception as a mediating factor between performance and risk management. This would help in formulating appropriate policies to manage fisheries. In Pakistan, the United Nations’ sustainable development goals (SDG) serve as a framework for formulating its strategic management plans (Kaczan and Patil, 2020). This study is especially pertinent to the two key Sustainable Development Goals. The first is Goal 2 (Zero Hunger) and the second is Goal 14 (Life Below Water). Without food security, Pakistan, the 6th largest populated nation, cannot reach SGD 2 till 2030. The sustainability of fisheries resources is crucial for attaining SDG 14 along with improving fisheries exports. Thus, SGD 2 and SDG 14 are interconnected. This study contributes to achieving these SDGs by highlighting the role of risk perception in fisheries management, which has been largely overlooked in previous research. It uses SEM to analyze how different risks impact fisheries performance in Pakistan. Unlike earlier studies focused on biological aspects, this study emphasizes stakeholders’ risk perceptions and their influence on management decisions. The findings offer valuable insights for improving fisheries policies, thereby enhancing food security and marine resource sustainability.
2 Review of literature and development of the hypothesis
2.1 Economic risks
The viability and revenue of the fisheries industry are substantially impacted by fluctuations in seafood prices (Dahl and Oglend, 2014). Changes in demand and supply are a primary cause of seafood price swings, which impede the fisheries sector’s performance (Samy-Kamal, 2021; Surathkal et al., 2017). Consumer behavior coupled with market structure account for the main drivers of demand shifts that affect stakeholder income and the sustainability of the fishing sector (Little et al., 2018). The erratic nature of demand poses challenges in formulating comprehensive marketing strategies, leading to less than optimal performance in the fisheries sector (Prosperi et al., 2019; Salas and Gaertner, 2004). Every fisheries-related business, regardless of its size, faces a range of challenges, including limited funding, insufficient funding, or inadequate levels of financial management literacy (Parappurathu et al., 2019; Muddassir et al., 2019). Growth in Pakistan’s fisheries industry is being hampered by higher tariffs (Mohsin et al., 2024).
Hypothesis 1 (H1). Economic risks affect performance of the fisheries sector in Pakistan.
2.2 Environmental risks
Climate change, rising temperatures, fish migrations, alterations in current patterns, and variations in salinity induce a cascading effect on fisheries. Typhoons, cyclones, and floods harm coastal aquaculture, causing market instability and economic losses (Khan et al., 2016; Yadav et al., 2024). Reductions in capture productivity resulting from overexploitation has adverse economic implications (Colloca et al., 2017). Furthermore, the overexploitation of fishery resources is linked to environmental degradation, especially when big fishing vessels, such as trawlers, are employed (Pipitone and Colloca, 2018; Hiddink et al., 2011). Changes in salinity levels disrupt aquatic habitats, making them unsuitable for marine life (Röthig et al., 2023). Pakistan’s fisheries sector faces significant challenges, including destructive fishing techniques, exceeding capture limits, and excessive bycatch (Noman et al., 2022). Polluted water makes it difficult for fish to spawn, which diminishes biomass output in subsequent generations, lowering catch numbers and economic gain (Hamaguchi, 2024; Hall et al., 2000; Hamilton et al., 2016). Environmental disruption reduces steady fish supply to the market and raises market uncertainty (Fleming et al., 2014).
Hypothesis 2 (H2). Environmental risks affect performance of the fisheries sector in Pakistan.
2.3 Policies and regulations risks
Poor policy implementation and insufficient monitoring systems are the biggest obstacles faced by the fisheries sector in Pakistan (Noman et al., 2022). Inconsistent regulations and a lack of departmental cooperation are limiting the development of the fishing sector (Ullah et al., 2021). Stakeholder participation is critical for effective fisheries policy decisions (Pita et al., 2010; Mackinson et al., 2011; Mohsin et al., 2022). Additionally, in order to revitalize the fisheries industry in Pakistan, it is imperative that trade policies be brought up to date and that new trade agreements be negotiated (Yeo and Deng, 2019).
Hypothesis 3 (H3). Policies and regulations risks affect performance of the fisheries sector in Pakistan.
2.4 Consumption risks
Non-compliance issues and consumer dissatisfaction are impacting consumption as well as fisheries trade (Masakure et al., 2009; Mohsin et al., 2024). Consumers are unaware of the full benefits of consuming fish, as well as the products made from it (Carlucci et al., 2015; Ueland et al., 2012). Moreover, the cultural and dietary preferences of the consumers play a major role in abruptly changing the market structure (Saidi et al., 2023; Mitra et al., 2021). Decreased fish consumption in the low-income class due to price fluctuation affects stakeholders’ income. Poor product quality and consumer dissatisfaction make the fisheries sector vulnerable to degradation (Carlucci et al., 2015; Rebezov et al., 2021). In Pakistan, fish market dynamics are heavily affected by the seasonal cycle of fish availability, which peaks in the winter season and falls in the summer season (Paudel et al., 2020). Thus, domestic and international supply chains continuously face inconsistency issues.
Hypothesis 4 (H4). Consumption risks affect the performance of the fisheries sector in Pakistan.
2.5 Infrastructure and logistics risks
A significant portion of the fisheries products get spoiled on the way due to the lack of a swift transport system and cold storage facilities (Jan et al., 2014). This results in decreased market demand and increased waste. In the presence of an inefficient transport system, meeting international market standards becomes very difficult (Luqman et al., 2024; Mohsin et al., 2024). Quality and safety issues, limited market access, and low export competitiveness are the biggest challenges confronted by the fishing industry (Rehman et al., 2019; Masakure et al., 2011). The operational efficiency of the production plants in Pakistan is low, resulting in decreased productivity and financial losses (Noman et al., 2022; Mehak et al., 2023). The fisheries sector struggles to prosper due to market uncertainty, as well as infrastructure and technology problems (Bradley et al., 2019). Poor marketing strategies, in conjunction with traceability issues, affect the market competitiveness of the fisheries products of Pakistan (Hobbs et al., 2023; Khan and Khan, 2011). In Pakistan’s fisheries industry supply chain risks are made worse by seasonal changes in fish availability. This makes it hard to meet market needs and disrupts both local and international trade. Poor infrastructure and slow logistics also cause delays and reduce the quality and profits of the industry (Paudel et al., 2020; Mehak et al., 2023).
Hypothesis 5 (H5). Infrastructure and logistics risks affect performance of the fisheries sector in Pakistan.
3 Materials and methods
3.1 Framework of study
We conducted this study in an orderly manner (Figure 1). During the first phase, a comprehensive bibliographical review was done. It helped to identify research gaps and formulate research objectives and hypotheses. During the second phase, risks were classified into two tiers according to the explanations and guidelines of Gray et al. (2010) as well as Tingley et al. (2010). Several stakeholders were consulted and this list was modified to ensure risk prevelence. In this list, the first tier consisted of five main risks, followed by 23 sub-risks in the second tier (Figure 2). Study variables’ operational definitions are given in Appendix 1. During the third phase, a questionnaire was prepared for the purpose of obtaining statistics according to the proposed hypotheses (Appendix 2). This questionnaire was discussed and reviewed by five professors working in the fisheries management field and by stakeholders. It was ensured that the questionnaire contained relevant questions and was designed appropriately for the research. A pretesting of questionnaire was carried out by involving 26 respondents. During the pretesting, reliability was assessed by calculating Cronbach’s alpha (CA) for all constructs, ensuring values above 0.6. Moreover, construct validity was tested through exploratory factor analysis (EFA). It was ensured that the questions were grouped appropriately under their respective constructs.
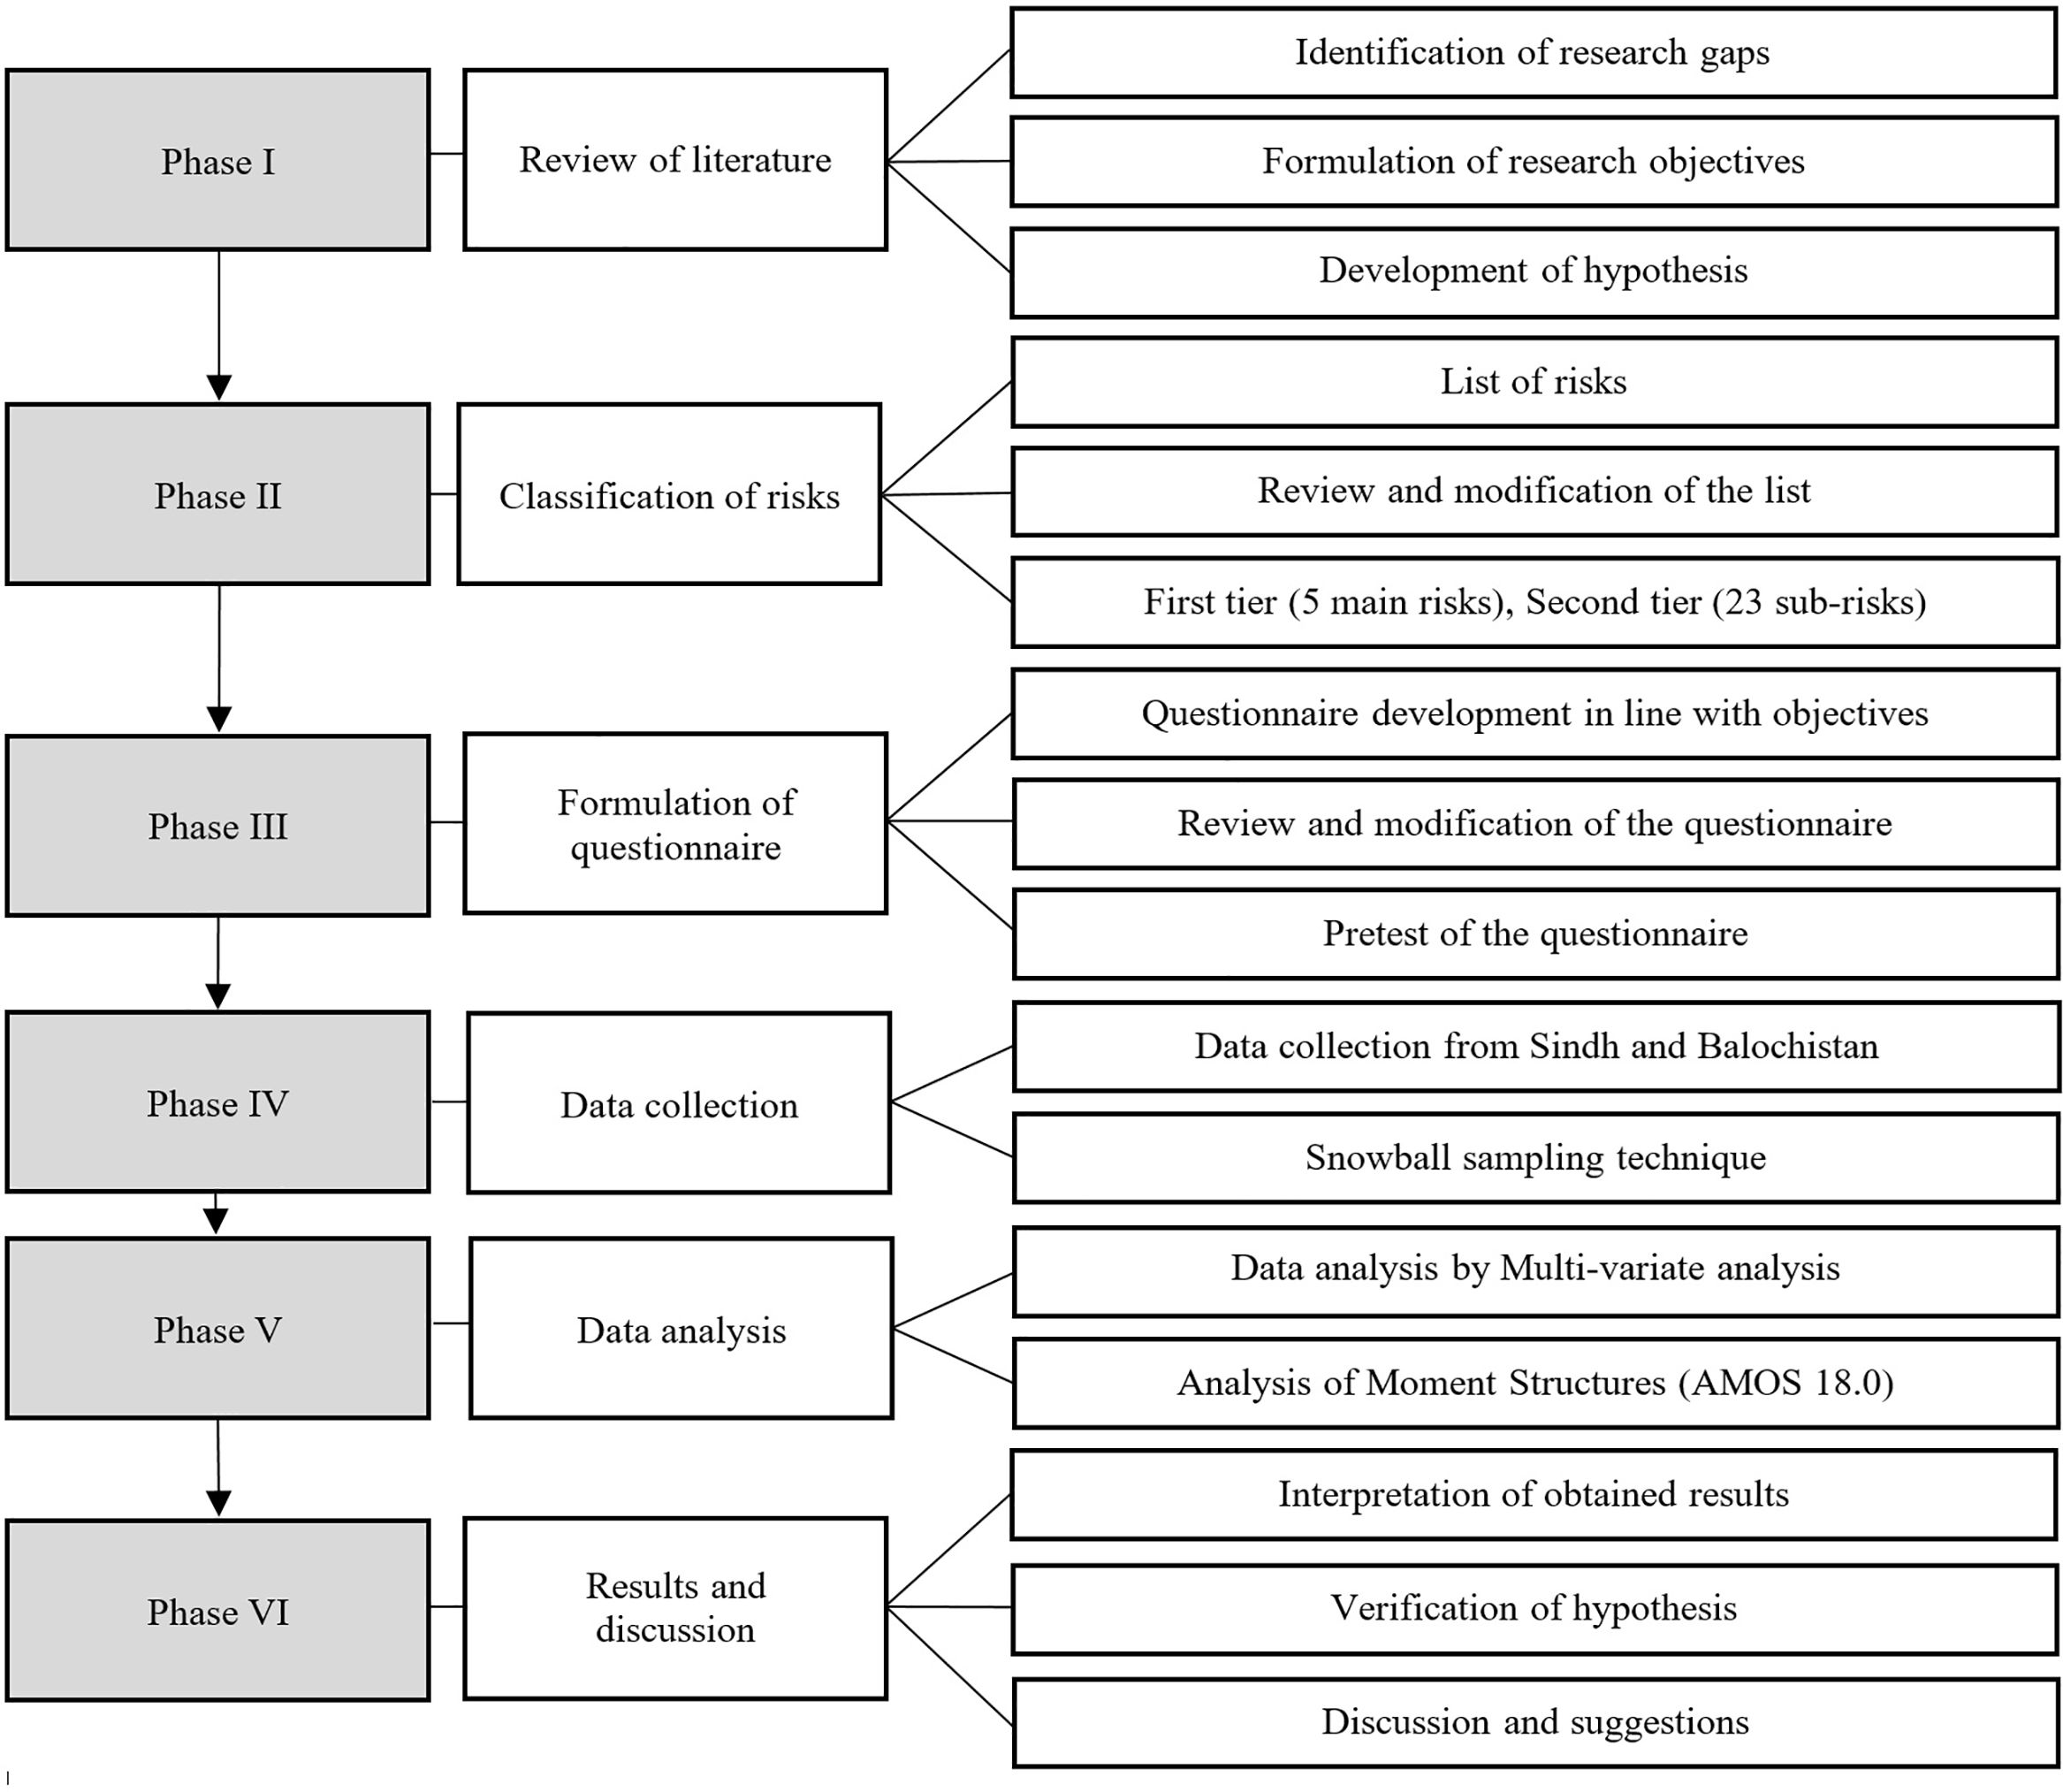
Figure 1. Framework of study.
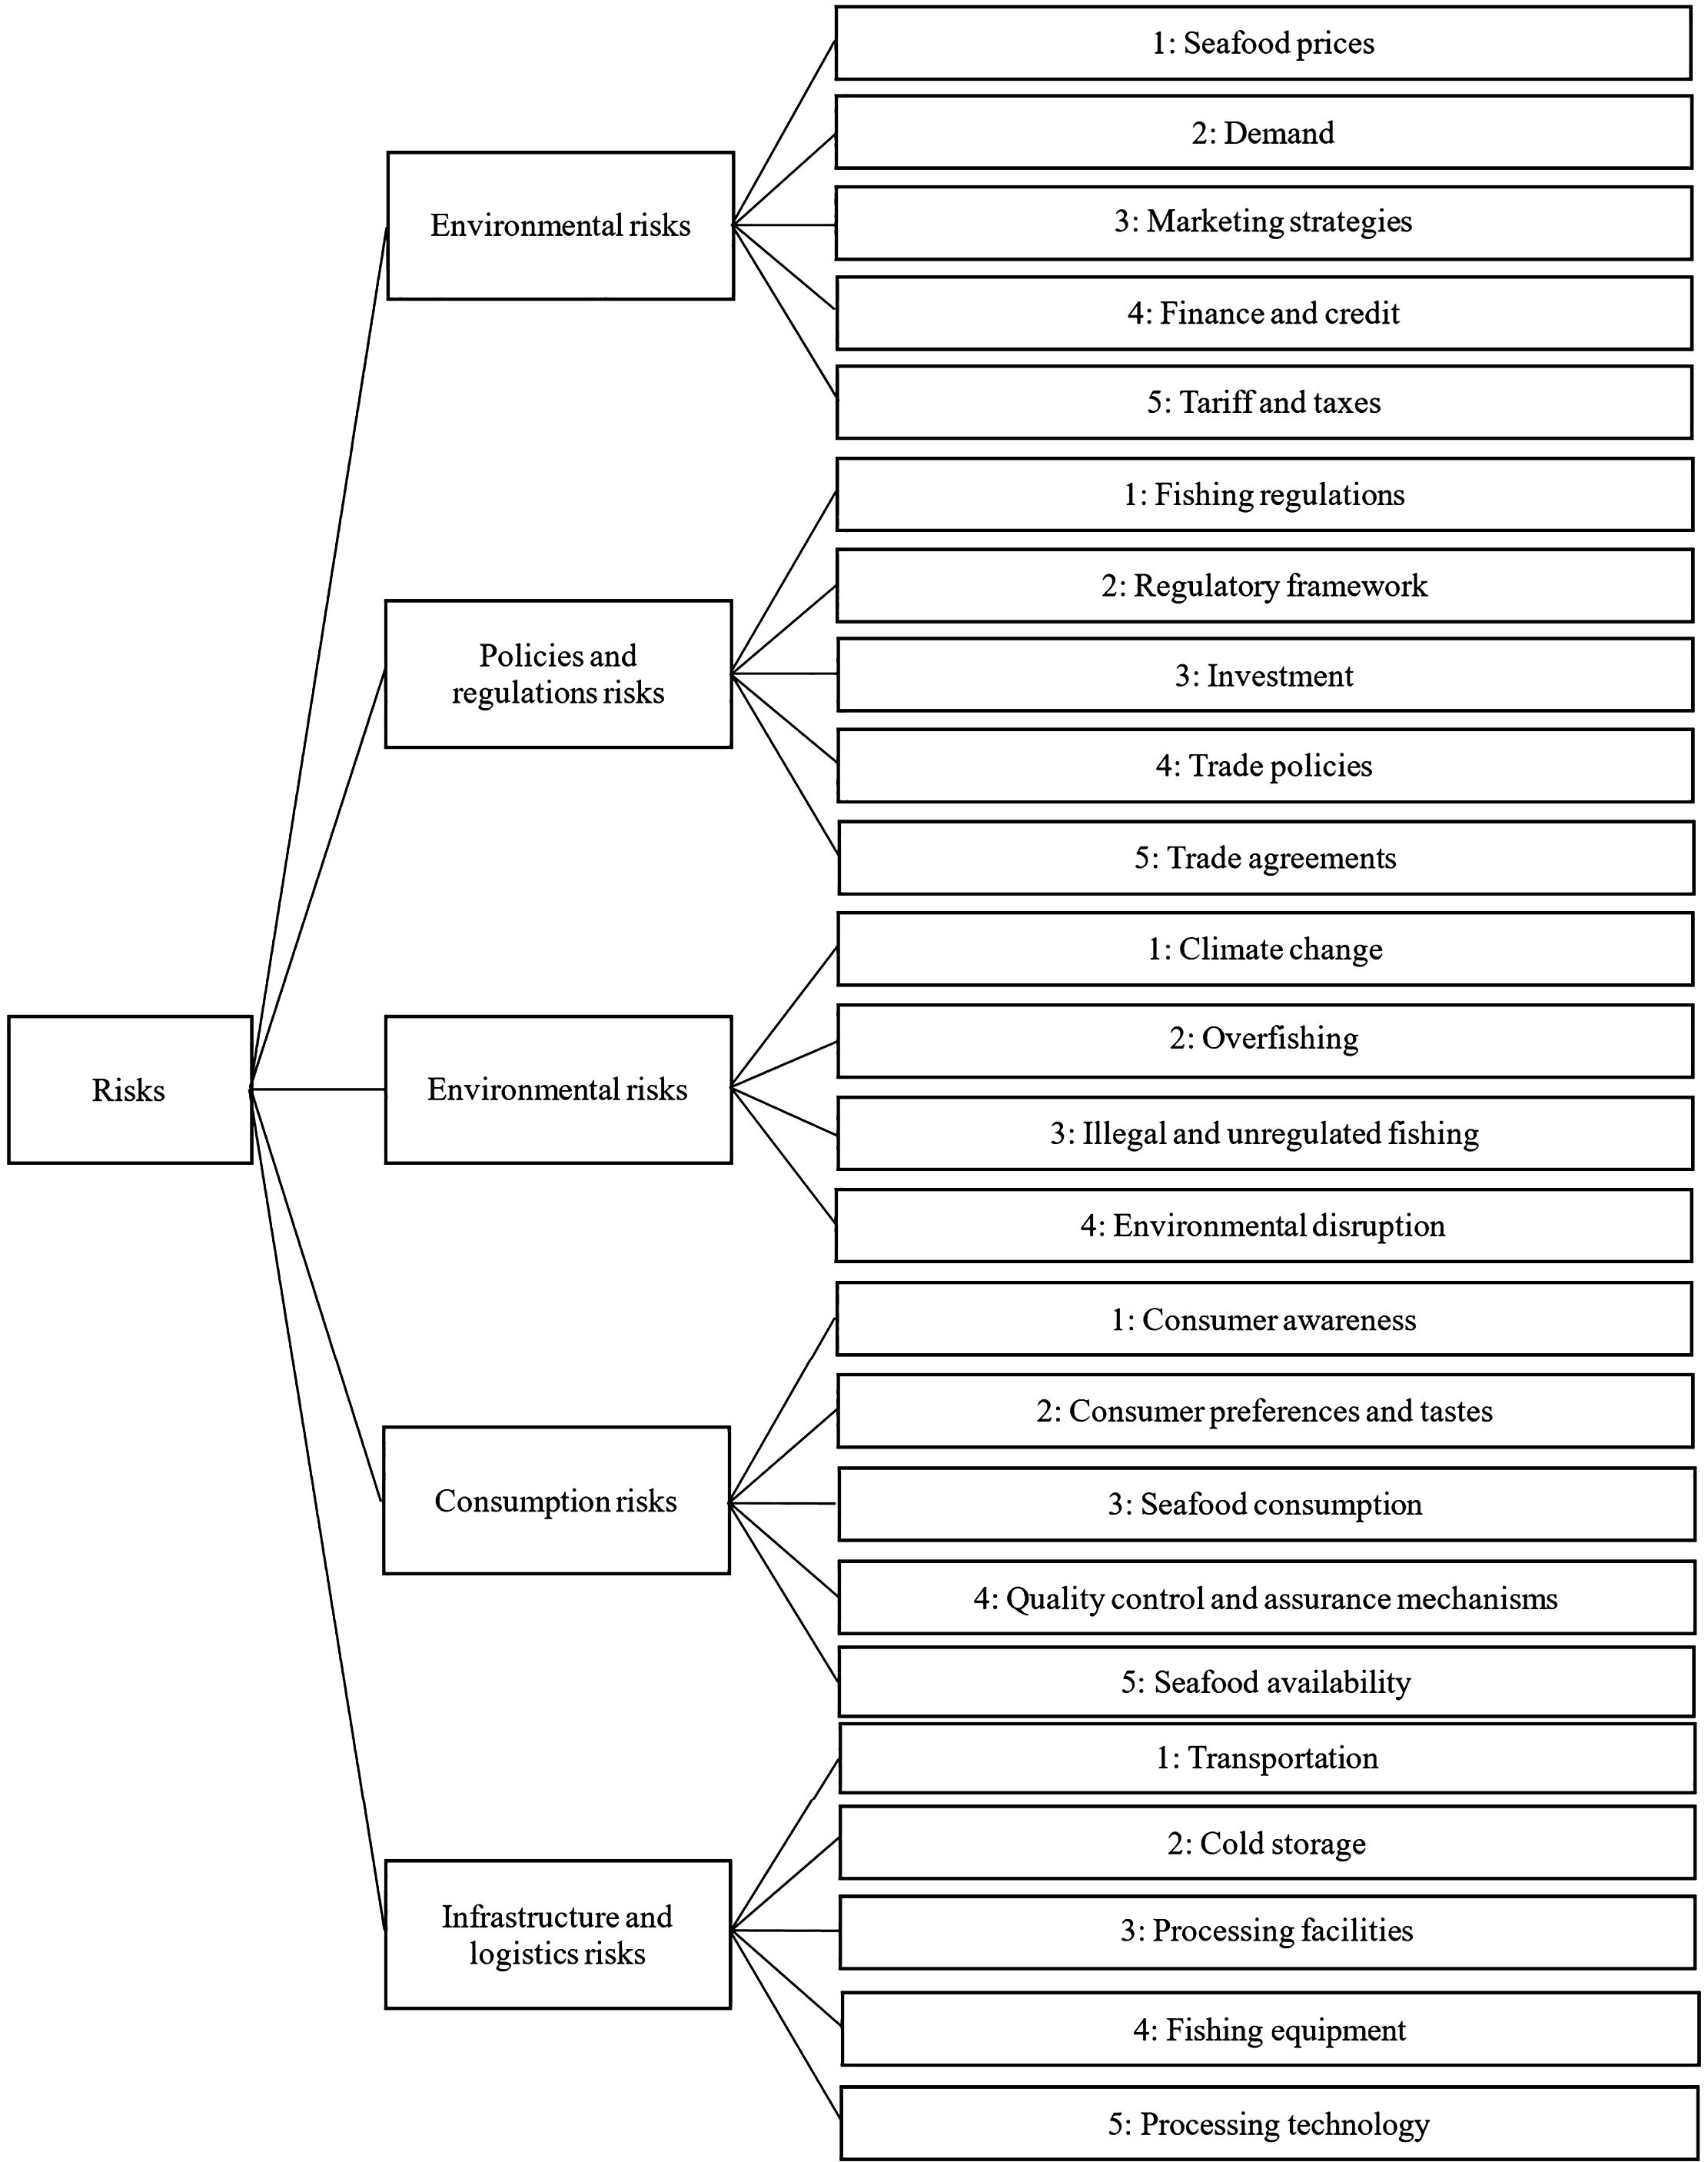
Figure 2. Risk hierarchy.
During the fourth phase, data was collected from two coastal provinces of Pakistan, i.e., Sindh and Balochistan. The snowball sampling technique was employed to seek potential and reliable respondents. It is important to mention that snowball sampling can introduce selection bias because it relies on participants referring others within their own networks. This limits the generalizability of the results as the sample may not represent the broader population of fisheries stakeholders. Additionally snowball sampling can overrepresent certain subgroups such as those with stronger ties to the industry while underrepresenting marginalized groups. As a result the findings may be less applicable to a wider more diverse population. However, these limitations are inherent in any statistical method and do not imply that the technique should be abandoned. In fact, snowball sampling is a widely used and effective method for collecting survey data (Noy, 2008; Emerson, 2015; Tubbs and Berggren, 2024). During the fifth phase, reliable statistical approaches such as multi-variate analysis were applied to the data to get dependable results. During the sixth phase, results were interpreted, and conclusions were drawn.
3.2 Data collection
The present research examined how risk factors affect fisheries performance in Pakistan. Additionally, it evaluated the implications of risk perception within the risk control framework. A questionnaire survey was conducted to collect data from May 2024 to October 2024. From Sindh, three coastal districts were selected, viz., Sujawal, Thatta, and Karachi, whereas from Balochistan, two coastal districts, viz., Lasbela and Gwadar, were chosen for data collection (Figure 3). Coastal districts of Sindh and Balochistan were chosen for data collection where the fisheries industry is predominantly concentrated. As a result, they provide a comprehensive representation of the Pakistani fisheries sector. As aforementioned, a wide range of stakeholders were surveyed to obtain questionnaire feedback. An aggregate of 982 participants filled out the questionnaires and were therefore deemed worthy of statistical assessment. First, stakeholder groups were contacted to determine their availability. Afterwards, personal interviews were conducted to gather data. It was attempted to collect data after stakeholder meetings or gatherings. Before the distribution of printed copies of survey forms, the purpose of the questionnaire survey was explained. Every survey respondent was urged to provide accurate answers to every question. Data was collected by telephone in some cases as well. It is important to note that respondent characteristics, such as gender, can lead to biased data. However, discussing this bias is beyond the scope of this study.
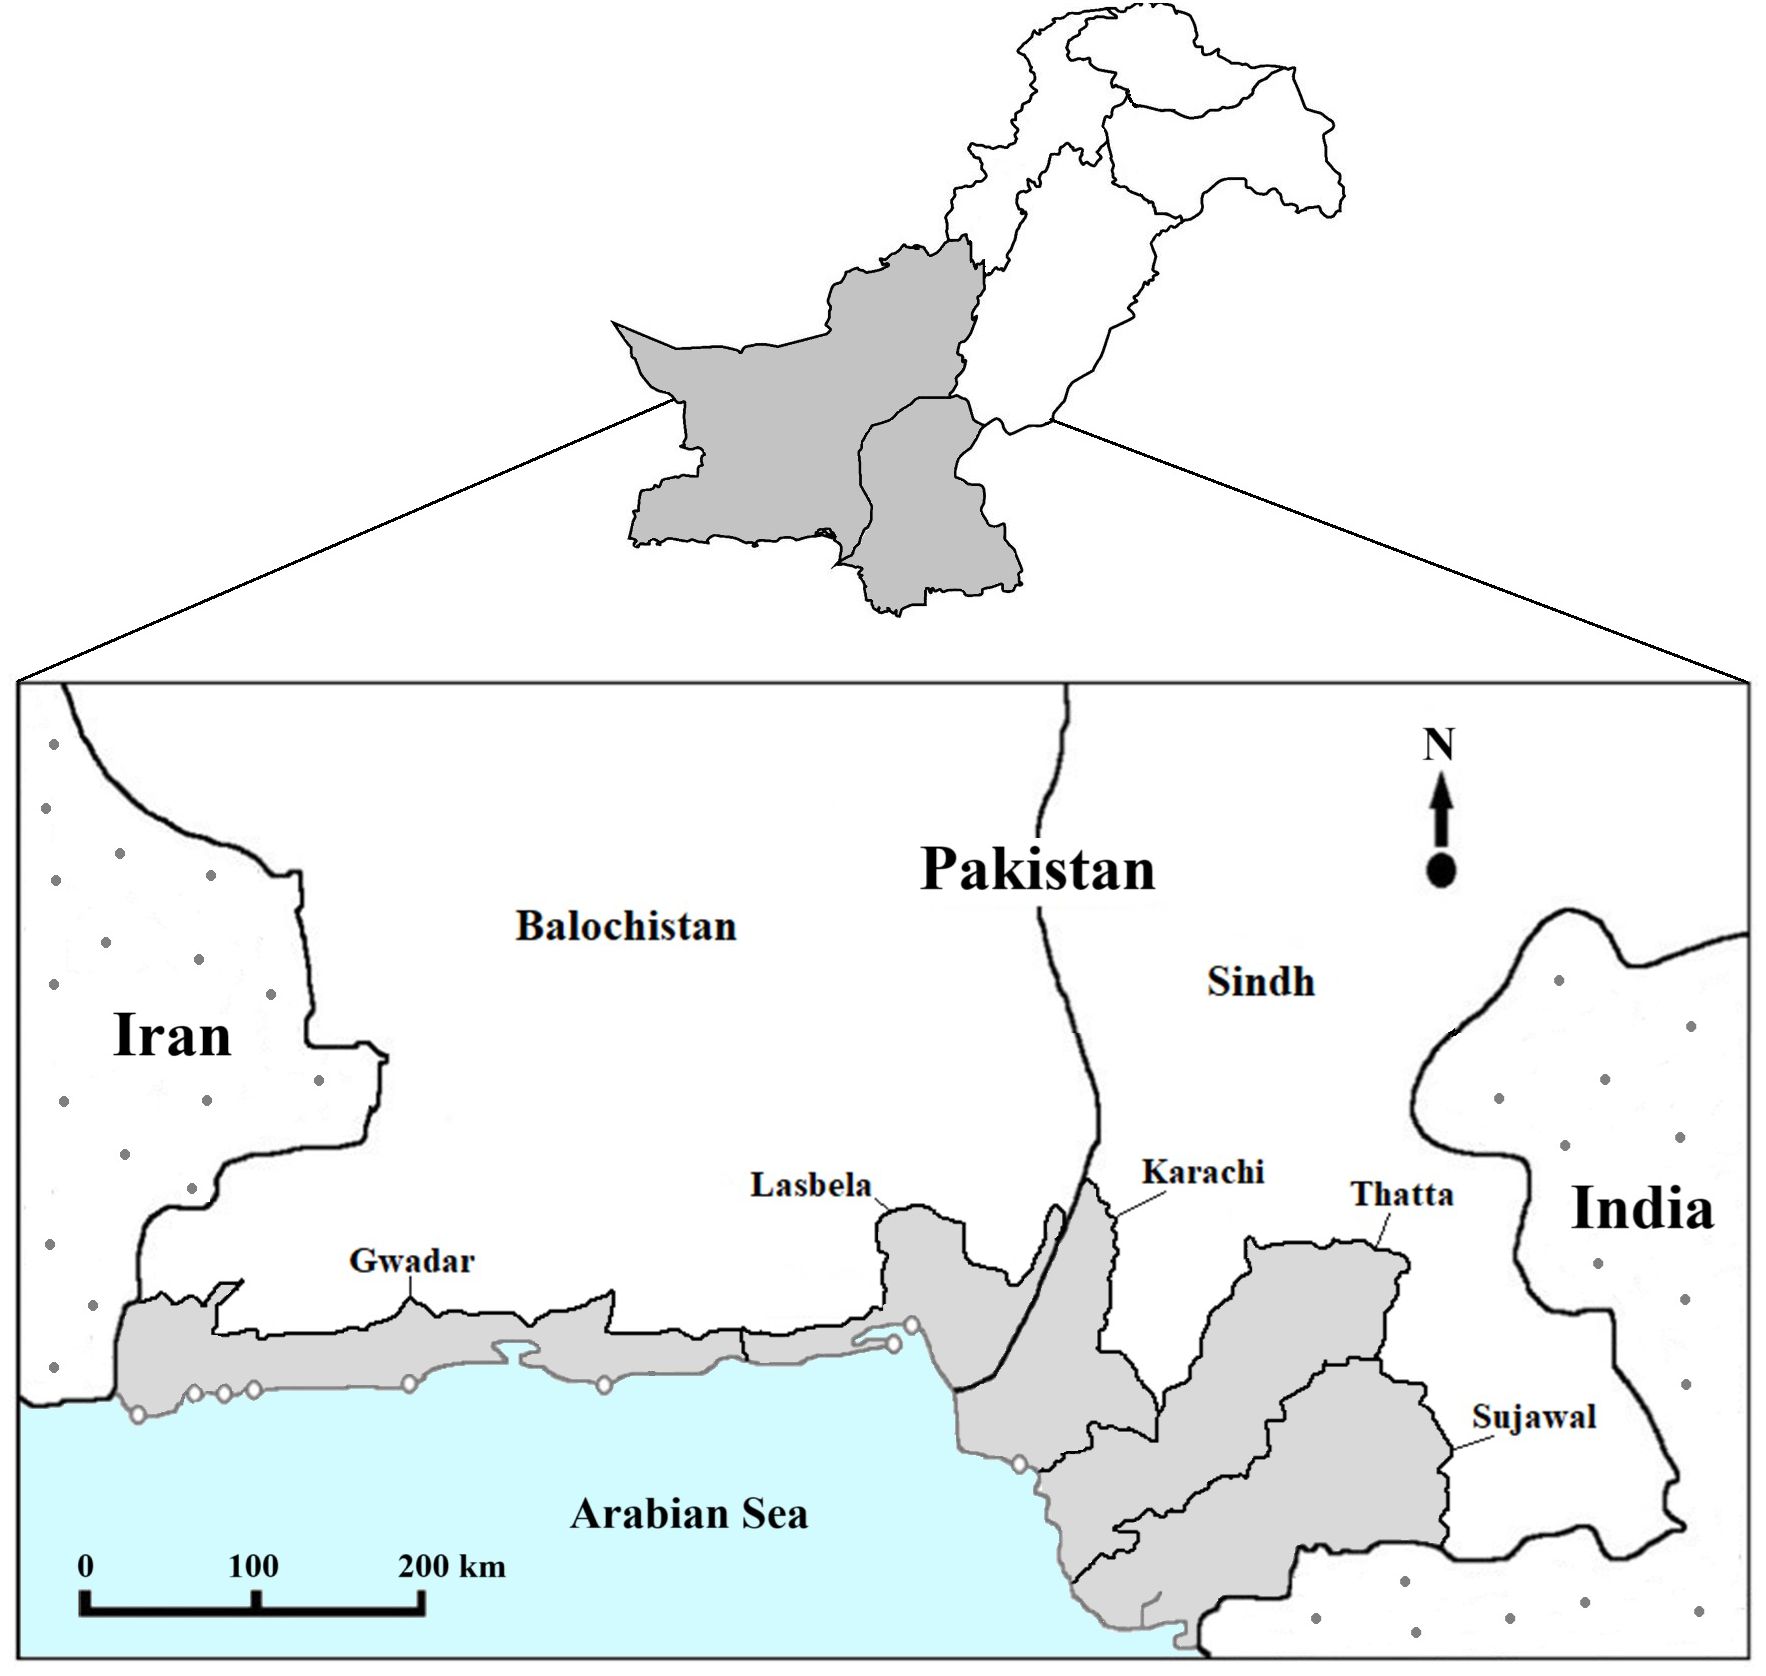
Figure 3. Data collection locations in Sindh and Balochistan.
3.3 Data analysis
Two statistical programs, AMOS 18.0 and SPSS 18.0, were used to analyze collected data and verify the hypotheses established statistically. Inferential and descriptive statistics are the two main statistical techniques used to analyze data. The SPSS 18.0 program was employed to perform a frequency analysis, reliability check, EFA, and random sample t-test, whereas CFA was executed employing the AMOS 18.0 program. This model’s appropriateness and hypothesis verification were assessed using SEM estimates. This model not only estimates independent and dependent variable relationships, but this can also estimate the causal relationship between various dependent variables. SEM is a multivariate analysis consisting of confirmatory factor assessment and regression evaluation.
Further, analytical analyses can be performed with correlations between exogenous variables as well as correlations of errors between endogenous variables. A study that should be carried out individually can be performed simultaneously using one research model (Mirrasooli et al., 2019). SEM has the advantage of showing either direct effects or indirect effects across variables with causal relationships. It can grasp a more meaningful causal relationship by incorporating direct, indirect, and total effects at once (Gallagher et al., 2008). AMOS proposes several indicators to check whether data fits the model. The number of fit measures is around 20 (Amadu et al., 2021; Narayanan, 2012; Byrne, 2001; Zhang et al., 2022). This study used three matrix models to represent SEM. The first matrix is mathematically defined as follows (Equation 1):
In the above matrix, ξ represents exogenous and η denotes endogenous variables used in the study. All of the main risks, including economic risks, policy and regulation risks, environmental risks, consumption risks, and infrastructure and logistics risks, are exogenous, while their corresponding sub-risks are considered endogenous. Γ and B represent the coefficients of variables. The second matrix model or the measurement model can be expressed as below (Equation 2):
In this equality, the measurement of all the endogenous variables is represented by Y. In addition, Coefficients of correlation between endogenous variables and their corresponding measured variables are denoted by Λy. ϵ stands for all those errors that occur during this method. The third matrix model can be represented as follows (Equation 3):
In the above mathematical expression, the calculation of all exogenous variables is given by X. Here, Λx denotes the correlation coefficient between exogenous variables as well as corresponding measured variables. δ represents all errors during this algorithm (Narayanan, 2012; Shek and Yu, 2014).
4 Results
4.1 Profile of survey respondents
The essential features of the survey respondents are covered in detail in Table 1. Regarding the state of their relationships, 211 respondents (21.5%) were single, while 771 (78.5%) were married together. On the other hand, 899 respondents (91.5%) were male, and 83 respondents (8.5%) were female. The age distribution of the respondents was as follows: 208 (21.2%) were between the ages of 25 and 34, 630 (64.1%) were between the ages of 35 and 54, and 144 (14.7%) were between the ages of 55 and 65. Of the people who answered, 149 (15.2%) had only gone to elementary school, 636 (64.7%) had gone from secondary school to master’s degree, and 197 (20.1%) had PhDs. Of the total respondents, 491 (50%) were from Sindh and 491 (50%) were from Balochistan. Out of the total number of responders, 182 (18.5%) had 5~9 years of experience, 581 (59.2%) had 10~14 years, and 219 (22.3%) had 15 years or more. Concerning the stakeholder coalition among the respondents, 303 (30.8%) were fishermen, 177 (18%) were employees of fishing firms, 174 (17.7%) were members of public or private organizations, 138 (14.1%) were researchers, and 190 (19.4%) were customers who were adequately informed.
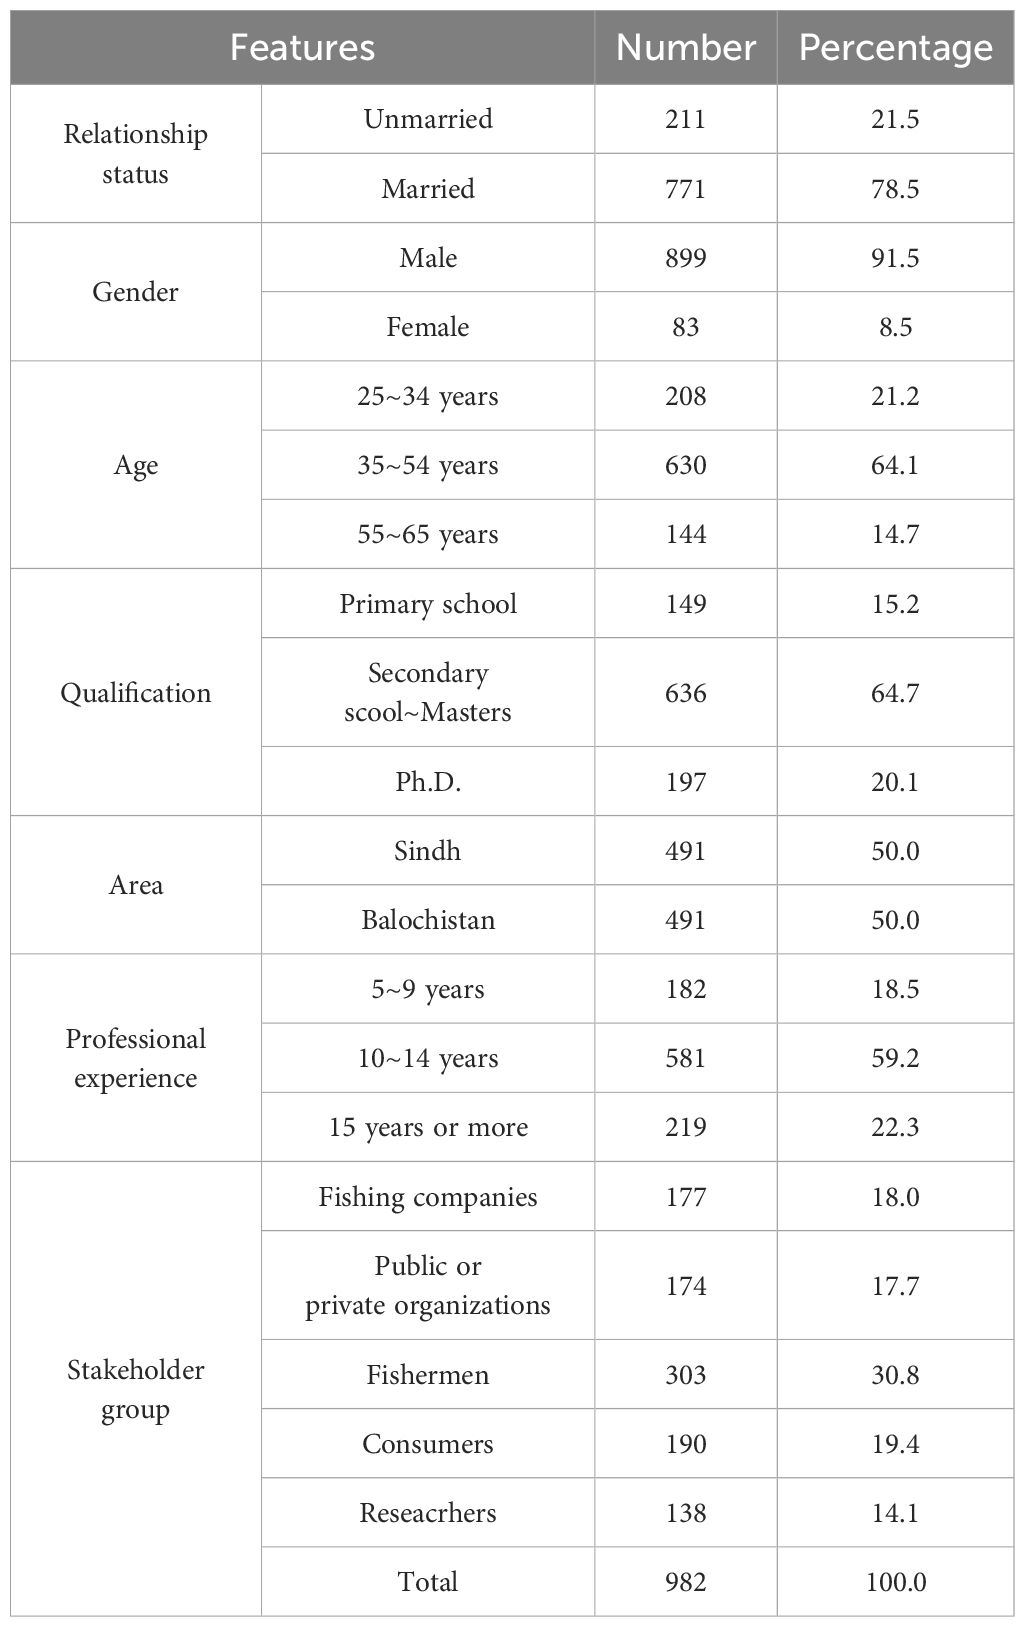
Table 1. Survey participant’s portfolio.
4.2 Validation of relaibility
A reliability test was conducted to confirm the dependability of the data. The findings of this test are detailed in Table 2. 4 questions were included in economics risks, and the estimated value of CA was 0.945. Besides, policies and regulations risk comprised five questions and a computed value of CA 0.962. In addition, environmental risk contained four questions, and the calculated value of CA was 0.914. Moreover, consumption risk included five questions; the CA accessed value was 0.937. Likewise, infrastructure and logistics risk consisted of 5 questions, and the estimated value of CA was 0.943. Furthermore, the performance comprised four questions, and the calculated value of CA was 0.872. There were 27 questions, and their computed value of CA was 0.981. It should be noted that CA estimates for all constructs were well above 0.6, validating the data’s reliability (El-Sheikh et al., 2017).
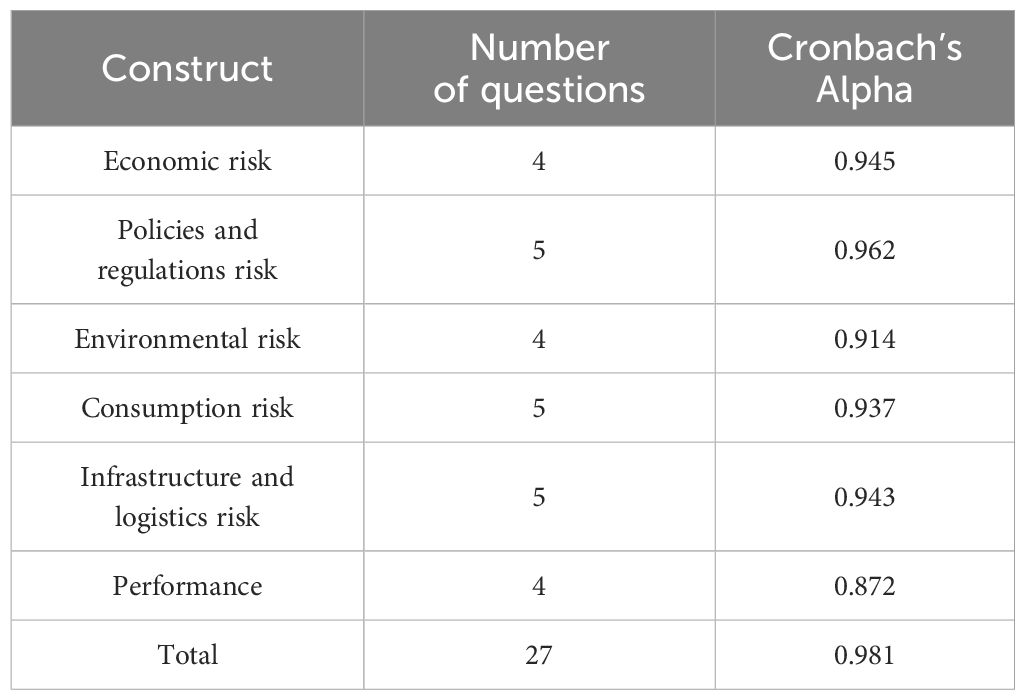
Table 2. Validation of reliability.
4.3 Confirmatory factor analysis
Estimates of CFA are given in Table 3. Many indices representing the goodness of model fit were calculated. These indices included ‘Chi-square’ (x2) (984.547), ‘Normed Fit Index’ (NFI) (0.873), ‘Goodness of Fit Index’ (GFI) (0.831), ‘Root Mean Square Residual’ (RMR) (0.031), ‘Incremental Fit Index’ (IFI) (0.952), ‘Adjusted Goodness of Fit Index’ (AGFI) (0.814), ‘Comparative Fit Index’ (CFI) (0.933), and ‘Tucker-Lewis index’ (TLI) (0.916). These indices confirmed that the data fit the model well and are acceptable for further analysis. It is essential to mention that computed values of ‘Construct Reliability’ (CR) were higher than the standard acceptable value of 0.70. Moreover, the ‘Average Variance Extracted’ AVE estimates were also higher than 0.05, the standard value. Thus, all CFA estimates were acceptable and representative (El-Sheikh et al., 2017).
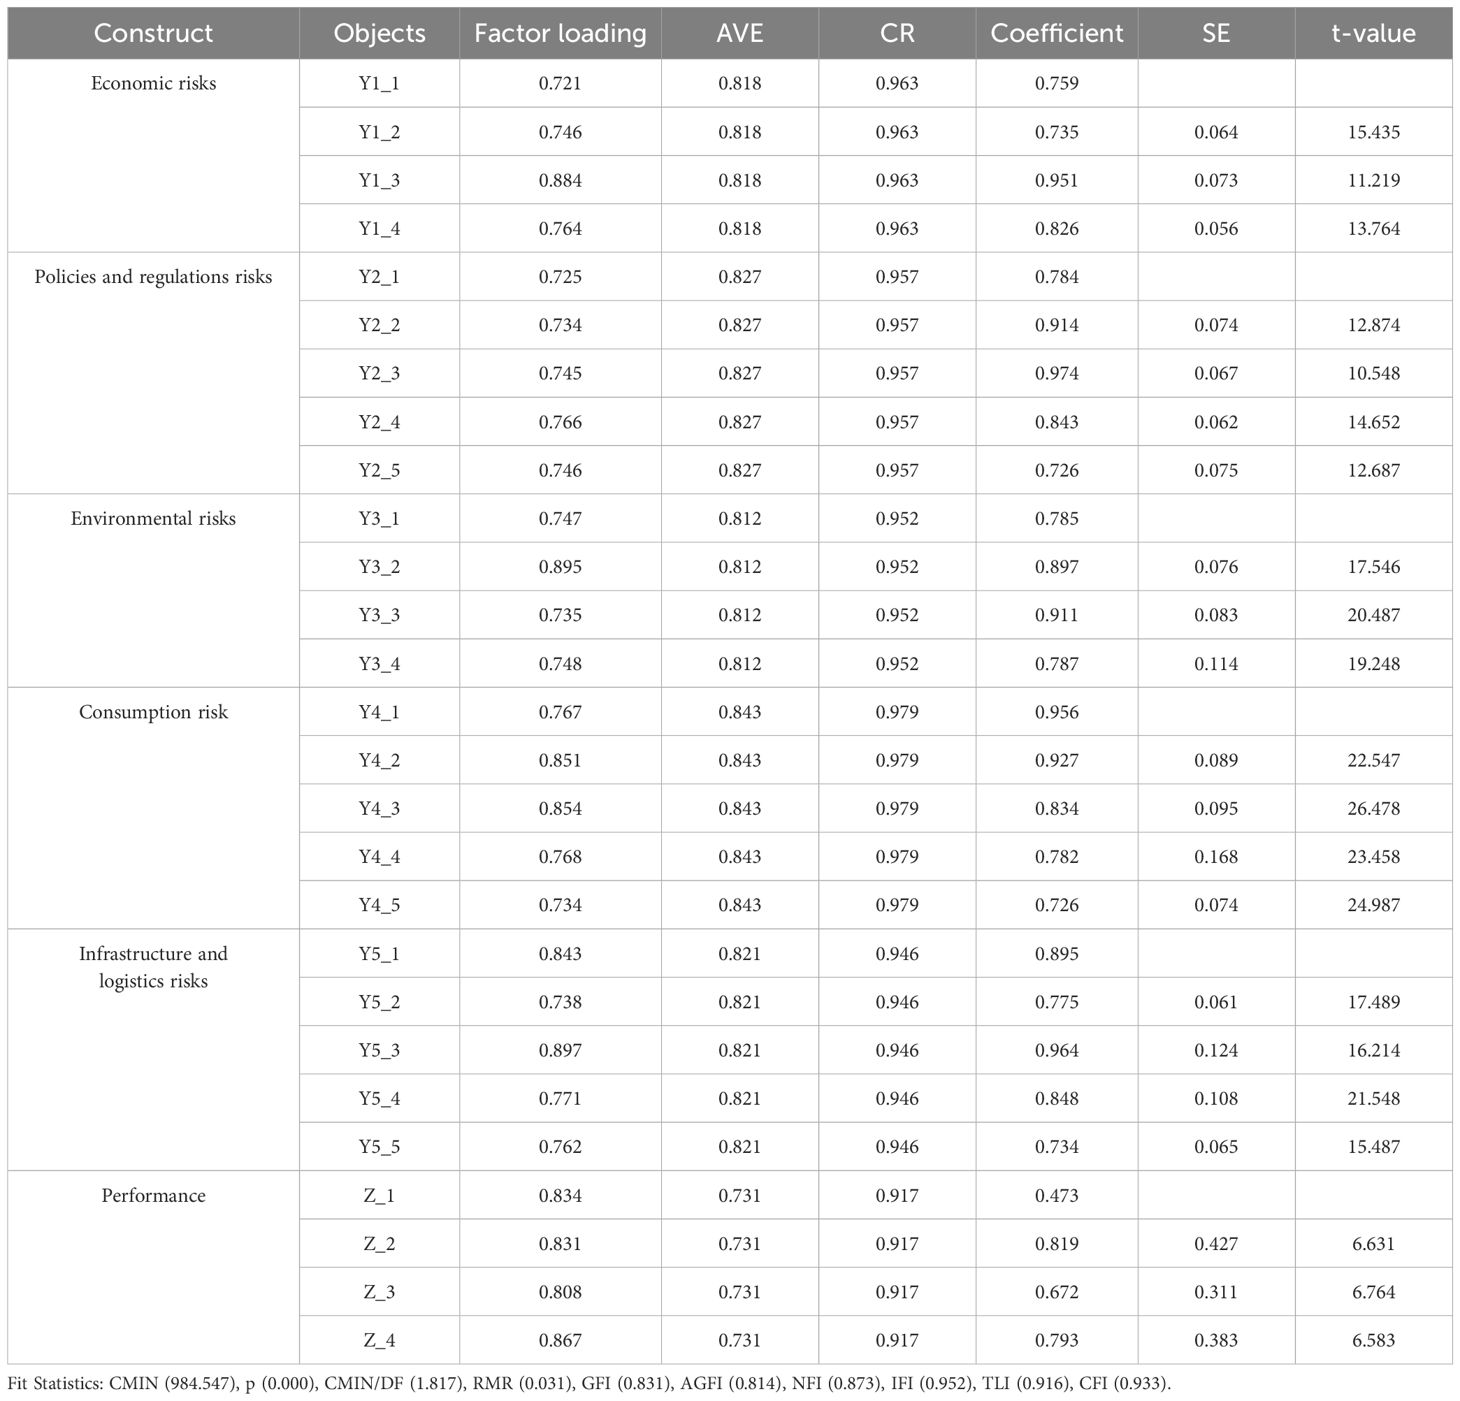
Table 3. Confirmatory factor analysis.
4.4 Correlation between constructs
Table 4 lists the correlation results between all the constructs used in this analysis. Negative signs indicate a negative relationship between constructs, whereas their values indicate correlation strength. The acceptable discriminant accuracy of all the variables is shown by the fact that all of the calculated AVE values are greater than squared correlations.
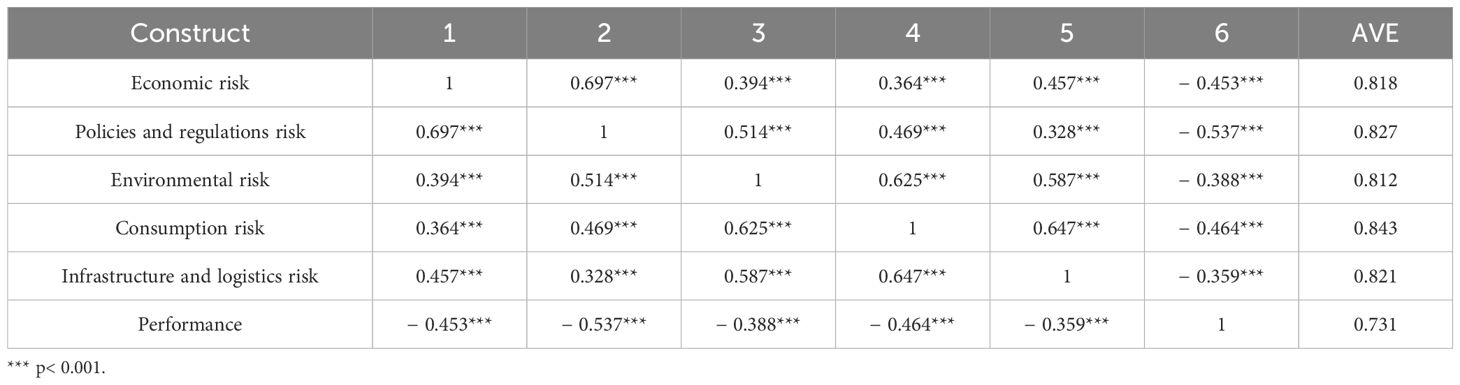
Table 4. Matrix representing correlation between constructs.
4.5 Validation of structure equation modeling
Statistical indices such as RMR, CFI, CMIN/DF signpost structure fitting of equation modeling approach (El-Sheikh et al., 2017). In some circumstances, NFI is capable of producing more accurate estimations, particularly when complex equation frameworks are applied. In such cases, considering the CFI index is more suitable. Based on standard criteria, all of the index values were found to be valid. This means that the model structure can be trusted (Table 5).

Table 5. Validation of structure equation modeling.
4.6 Estimates of structure equation modeling
Using the structure equation modeling technique, two models, free and constraint, were evaluated. These models verified the mediating effect of risk perception on fisheries sector performance in Sindh and Balochistan. For the free model, x2 and DF were estimated at 2017.634 and 971, whereas these indices for the constrained model were calculated as 2033.472 and 978, in that order. The estimate of x2 in the free model was lower than the constrained model by 15.838. Thus, the free model performed well as a lower value of x2 can offset DF. Moreover, it was found that risk perception profoundly impacts performance (Table 6).

Table 6. Estimates of structure equation modeling.
4.7 Model-wide direct effects
Table 7 illustrates the direct effects of all constructs on performance and determines the acceptance of the proposed hypothesis. H1 was accepted as an economic risk (estimate = −0.425 and p = 0.000) and showed a noteworthy negative impact on the performance of the fisheries sector. Likewise, environmental risk (estimate = −0.251 and p = 0.007) and consumption risk (estimate = −0.265 and p = 0.000) also significantly affected performance. Considering these results, H3 and H4 were accepted. Conversely, policies and regulations risk (estimate = −0.113 and p = 0.121) and infrastructure and logistics risk (estimate = −0.073 and p = 0.411) were insignificant. In the light of these estimates, H2 and H5 were rejected.
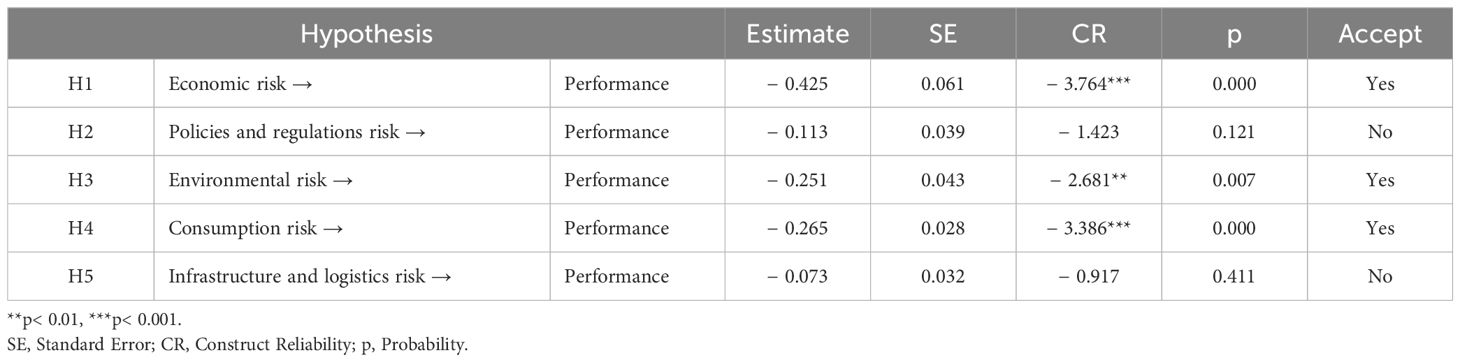
Table 7. Model-wide direct effects.
4.8 The mediating effect of risk perception
A comparison of estimates for Sindh and Balochistan is presented in Table 8. Estimates differ between both provinces. This discrepancy suggests that risk perception acts as a mediating factor, influencing the relationship between various risks and performance outcomes in both provinces. In Sindh, the economic risk has a significant negative impact on performance (Estimate = −0.363, CR = −2.399**), while in Balochistan, it positively influences performance (Estimate = 0.274, CR = 2.732**). Policies and regulations risk was found to have no significant effect on performance in Sindh (Estimate = 0.019, CR = 0.182), but in Balochistan, it negatively affects performance (Estimate = −0.359, CR = −3.384**). Environmental risk significantly impacts performance in Sindh (Estimate = 0.374, CR = 3.107***) but has no significant effect in Balochistan (Estimate = −0.146, CR = −1.345*). Both consumption risk and infrastructure and logistics risk do not significantly influence performance in either region, except for infrastructure and logistics risk in both Sindh (Estimate = 0.386, CR = 2.919, ***) and Balochistan (Estimate = 0.511, CR = 3.412***) where positive significant impacts on performance are observed (Figures 4, 5). Summary of all results for quick reference is given in Table 9.
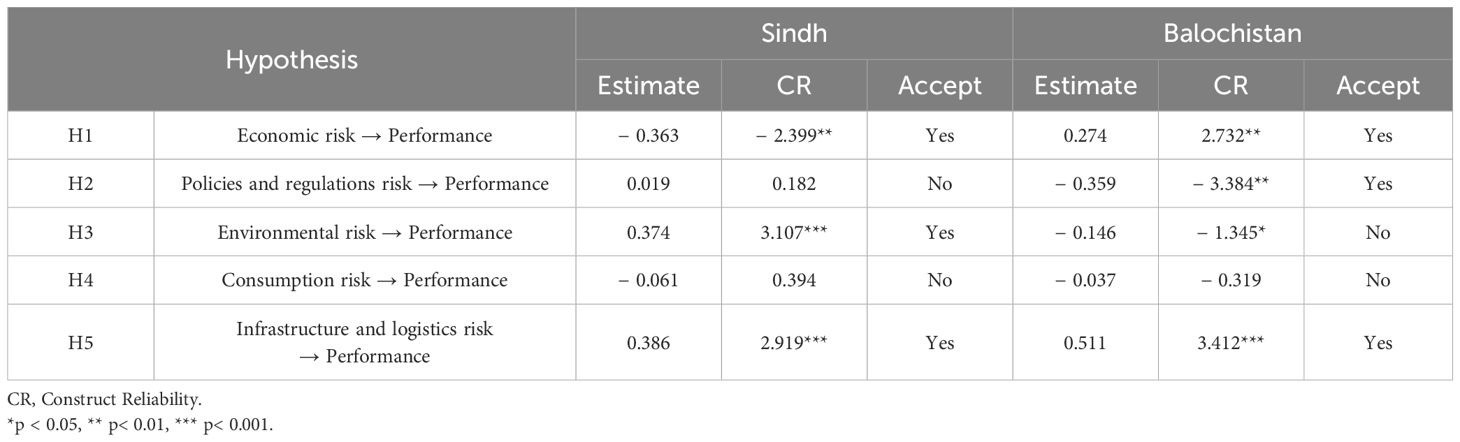
Table 8. Mediating effect of risk percpetion in Sindh and Balochistan.
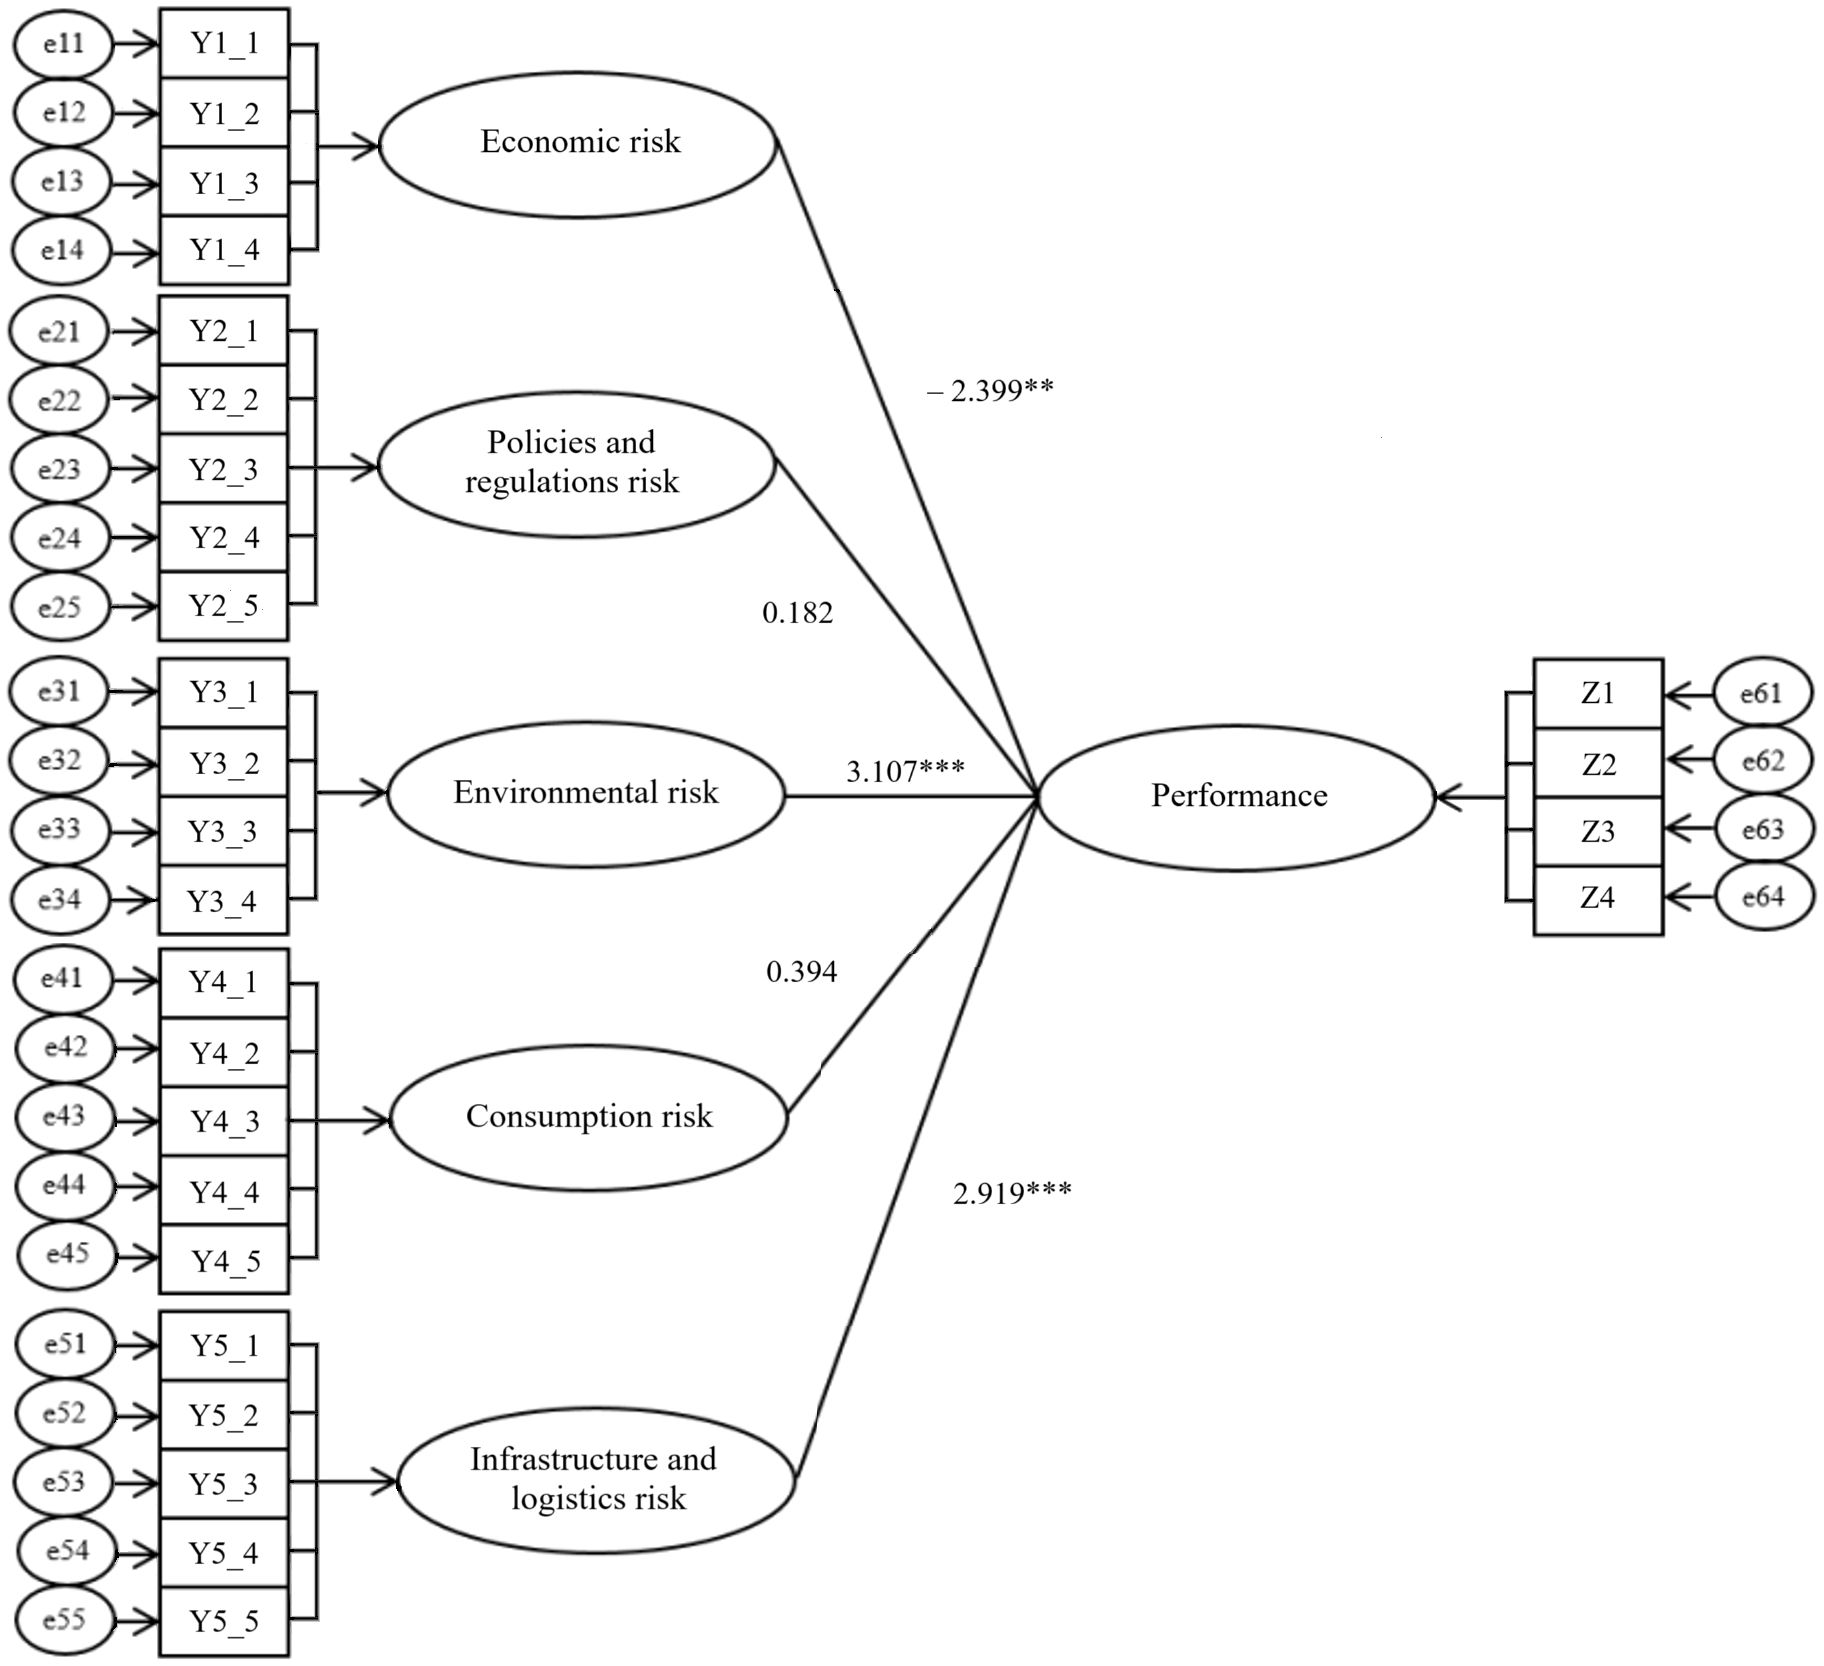
Figure 4. Path diagram for Sindh. ** p< 0.01, *** p< 0.001.
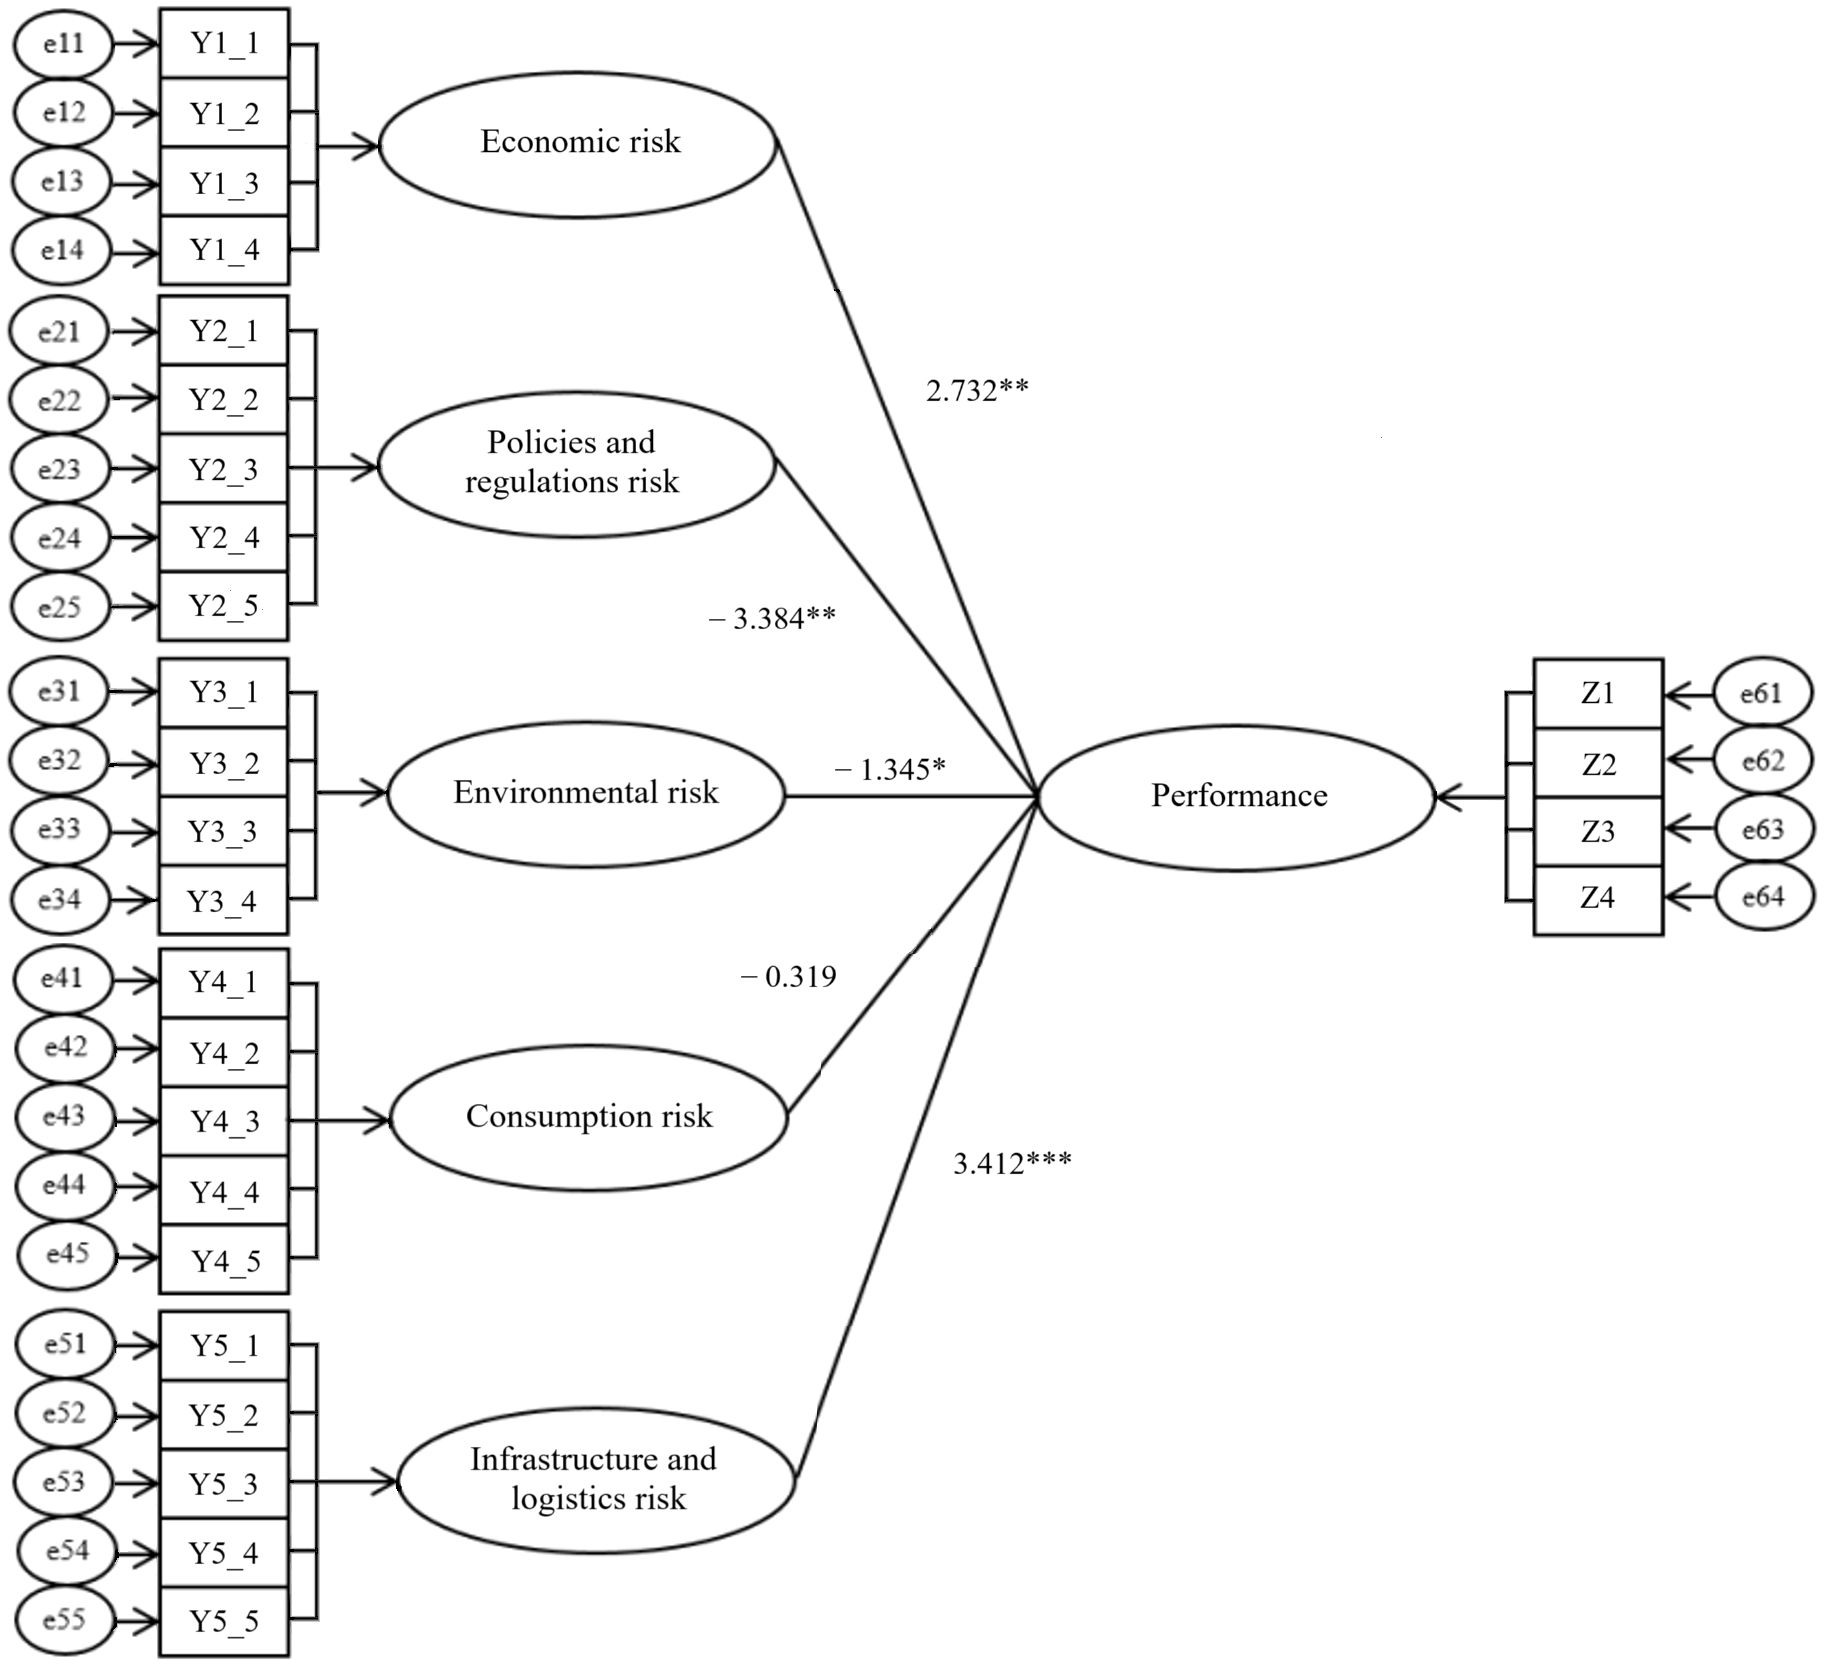
Figure 5. Path diagram for Balochistan. *p < 0.05, ** p< 0.01, *** p< 0.001.
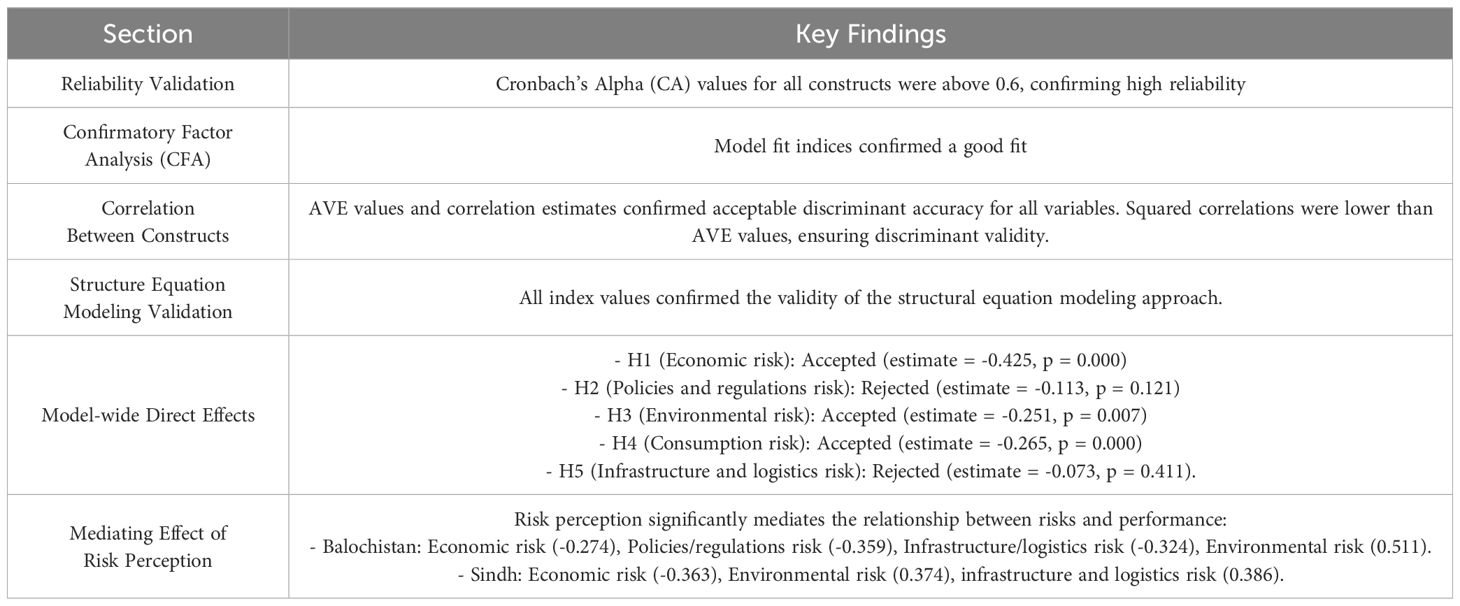
Table 9. Summary table.
5 Discussion
The study examined the interaction between various risks and performance, as well as the role of risk perception as a mediating factor. By employing SEM, several significant results are obtained that can provide evidence-based targeted interventions to improve the fisheries sectors in Pakistan’s economy. First, the Pakistani fisheries sector faces multifaceted risks that are categorized into five major types: economic risks, management risks, environmental risks, consumption risks, and infrastructure and logistics risks. This conclusion aligns with existing literature that identifies the fisheries industry as susceptible to various risks (Noman et al., 2022; Mehak et al., 2023). Second, there is an inverse relationship between types of risks and their impact on performance. Several scientific studies contradict this study’s findings (Sethi, 2010; Moore et al., 2021). However, impact magnitude varies between risks. Third, risk perception strongly influences risk-performance relationships. The available online literature appraises the mediation effect of risk (Hebbsale and Shivamurthy, 2021; Mohsin et al., 2024).
Fisheries management is a methodical science that entails several processes, beginning with gathering and analyzing data and culminating with the suggestion of several different risk mitigation strategies (Pita et al., 2010). A crucial element in this process is the selection of stakeholders, as all management outcomes will depend on their advice. It is better to seek opinions from multiple stakeholders. The data collected from different stakeholders produces more reliable results because it better represents various sector sections (Berghofer et al., 2008; Msomphora, 2015). This study collected data from multiple stakeholders and found that fisheries are exposed to several types of risks. Data analysis revealed that all types of risks harm performance, with management risks having the most significant adverse effect. The published literature can verify this finding (Williams et al., 2011; Gourguet et al., 2014). Several studies declare Pakistani fisheries a victim of overexploitation (Mohsin et al., 2017; Raza et al., 2022). Despite having various catch regulations, actual control over overexploitation has yet to be successful. The lack of effective implementation of fisheries law in Pakistan is also an obstacle to achieving the required management targets. This situation is further amplified by the operational issues and high discard rate (Noman et al., 2022). Moreover, effective fisheries management is impossible due to Pakistan’s prevailing data-limited situation (Raza et al., 2023).
Many areas have examined how risk perception affects the link between risk management and culminating risks (Brender and Markov, 2013; Wachinger et al., 2013; Jia et al., 2020). However, Pakistani fisheries are never accessed in this context. The difference in the results between Sindh and Balochistan and the mediation effect, is presented in Table 8. Online literature documents that increased risk perception raises a positive link between risk performance and its management (Sethi, 2010; Joffre et al., 2018). Since risk perception forms the basis for formulating regulations and enhances general awareness of risks, thus it is the first step to counter risks (Bergfjord, 2009). Risk management strategies are generally designed to mitigate environmental and operational risks in fisheries (Roux et al., 2022; Obeng et al., 2022). However, the effectiveness of these strategies depends on how stakeholders perceive the risks involved. If risk perception is misaligned even well-designed risk management strategies may fail to achieve desired outcomes. Capacity building can help align perceptions with actual risks and enhance compliance and effectiveness (Roux et al., 2022; Obeng et al., 2022; Soma et al., 2018; Jean-Jules and Vicente, 2021; Pomeroy et al., 2016). This could result in targeted management actions thereby improving both risk management and risk performance in fisheries.
Hypothesis H2, which proposed that policies and regulations risks affect the performance of Pakistan’s fisheries sector, was rejected due to a p-value of 0.121, higher than the 0.05 threshold. This suggests no significant relationship between policies and regulations risks and performance. One possible explanation is that policies and regulations in Pakistan’s fisheries sector may not be strongly enforced or perceived as major risks by stakeholders. Additionally, other risks, such as environmental or economic factors, might overshadow the influence of policies and regulations. Similarly, Hypothesis H5, which proposed that infrastructure and logistics risks affect performance, was also rejected, with a p-value of 0.411, much higher than the 0.05 threshold. This indicates that infrastructure and logistics risks did not significantly affect performance. A possible reason is that while such issues may exist, stakeholders may not perceive them as critical, or other more immediate risks, like environmental or economic factors, may have a stronger impact on performance in Sindh and Balochistan. These findings contradict previous literature that emphasized the importance of policies, regulations, and infrastructure in fisheries performance (Sethi, 2010; Moore et al., 2021; Williams et al., 2011; Gourguet et al., 2014). The results suggest that local factors and regional contexts in Sindh and Balochistan influence how risks are perceived and managed, highlighting the need to tailor risk management strategies to specific areas.
83% of the survey respondents mentioned low levels of perception of risks related to the fisheries. They suggested training, reward system and implementation of evaluation systems to enhance performance. Various international agencies, such as FAO, have launched projects to train fishermen. Survey respondents also mentioned increasing the effectiveness and efficiency of the training. An incentive-based system is an effective way to increase organizational performance and is successful around the globe (Meirinhos et al., 2023). Such a system can be introduced in Pakistan with modifications after their detailed pros and cons studies. The biggest challenge is the successful implementation of existing management policies. For this, fishery officers can be trained. In addition, the coordination between various departments can be increased to improve performance. Establishing specialized fishery police and courts can be very helpful in this regard (Fenichel et al., 2008; Johnson and Welch, 2009).
5.1 Limitations of the study
This study has several limitations. Such as various stakeholder groups within the fisheries sector have been surveyed to examine risk perception. This type of analysis is often limited because it only provides a snapshot of how different stakeholder groups view their fisheries. If this is the case, the study may only prove helpful for a limited period. Moreover, there is possibility of biasness in the data due to the use of snowball sampling technique, where initial respondents can influence the selection of subsequent participants, potentially limiting the diversity of perspectives. Additionally, the reliance on self-reported data may introduce response bias, as participants may feel inclined to provide socially desirable answers rather than their true perceptions. The use of a single methodological approach, namely the questionnaire survey, could limit the study’s ability to capture a broader range of insights, as it might not account for other qualitative factors that could emerge from in-depth interviews or ethnographic methods. Thus, the data may not truly represent entire fisheries sector. In addition, geographical scope of this study may limit the applicability of the findings of this study to the other regions of the country. Since, the data was collected during specific time period therefore temporal variations in the perceptions of the stakeholders may occur during other times in a year. Furthermore, the complexity of SEM may limit its ability to fully capture multifaceted nature of the risks. Moreover, there may a cultural and social biasness which can effect risk perception leading to less significant conclusions.
5.2 Practical implications
This study presents multiple practical implications that could guide fisheries policy decisions in Pakistan and other similar developing nations. A better understanding of risks and risk perceptions can be used to develop risk control and communication strategies. By combining various risk theories with the existing risks, further targeted efforts could provide more insight into people’s definition of fisheries risk. As a major food supply, improving fisheries performance would help achieve SDG 2. Furthermore, the development of resilient and sustainable fisheries plays a crucial role in the attainment of SDG 14 (Life Below Water). By defining risks and determining their impact on fisheries performance, better management policies may be developed, leading to objective-based sustainable growth. Additionally, the results of this study reveal important information that may enhance fisheries’ socioeconomic features by reducing risks. Some of the risks investigated, including environmental risk, are crucial for developing proactive management strategies and improving fisheries performance because they address environmental concerns and the impact of climate change. Moreover, greater risk awareness might result in the conservation of fishery resources, safeguarding their sustainable utilization.
5.3 Policy recommendations
Based on the findings of this study several policy recommendations can be offered. First, the study suggests that capacity-building and incentive-based fisheries management techniques are key to improving fisheries performance. This has been clearly demonstrated by major fish producers like China, Indonesia, and India, where these methods have successfully enhanced their fisheries (Tang and Tang, 2006; Bailey et al., 2016; Sun et al., 2017; Huang and He, 2019). Second, there is a dire need to enhance fisheries risk perception which can be achieved through tailored training programs. Third, stakeholders can be motivated toward adopting sustainable practicing by implementing incentive-based management system. Fourth, fisheries law enforcement is very important to control illegal practices and ensure compliance with the regulations. Fifth, in order to achieve evidence-based management a comprehensive and reliable data collection system should be developed. Sixth, stakeholders must be encouraged to participate in the decision-making process. Last but not least, a strict evaluation system must be employed to evaluate interventions and navigate mangement strategies.
6 Conclusion
In Pakistan, the fisheries sector confronts several risks, encompassing economic, policies and regulations, environmental, consumption, and infrastructure and logistics risks. These risks have varied degrees of adverse impacts on the fisheries’ performance. Inadequate management measures and passive implementation of existing regulations are fundamental factors contributing to the presence of these risks. Fisheries sector is primarily exposed to policy and regulations risk, followed by environmental and economic risks. It is important to note that risk perception plays a crucial role in determining the relationship between fisheries performance as well as its management. Conversely, the significantly lower levels of risk perception related to infrastructure and logistics risk, as well as policies and regulations risk, are observed to hinder the performance of the fisheries sector. Therefore, enhancing stakeholders’ risk perception through capacity building is essential for boosting fisheries performance, which can contribute to achieving SDG 2 and SDG 14.
Future studies may be carried out by broadening geographic regions and increasing data scale, especially focusing on the inland areas of Pakistan. This will provide a more thorough understanding of the risk perceptions held by stakeholders throughout the entire landscape of Pakistan. By including a particular group of stakeholders, individual risks can be examined in greater detail to provide a more profound knowledge from the management perspective. The impact of technological innovations on enhancing stakeholders’ risk perception presents a compelling avenue for future exploration. Furthermore, various management models can be analyzed to identify the most effective approach for enhancing risk perception.
Data availability statement
The original contributions presented in the study are included in the article/Supplementary Material. Further inquiries can be directed to the corresponding author.
Author contributions
MM: Formal Analysis, Methodology, Software, Writing – review & editing. HY: Funding acquisition, Resources, Supervision, Writing – review & editing. AM: Conceptualization, Investigation, Project administration, Writing – original draft.
Funding
The author(s) declare that financial support was received for the research and/or publication of this article. This research was Funded by International Business(YLKC1904); Key Research Bases and Backbone Talent Projects in Wenzhou in 2021(21QN12); and Oujiang Youth Special Project for Philosophy and Social Sciences Planning in Wenzhou City (Grand number: 16).
Conflict of interest
The authors declare that the research was conducted in the absence of any commercial or financial relationships that could be construed as a potential conflict of interest.
Generative AI statement
The author(s) declare that no Generative AI was used in the creation of this manuscript.
Publisher’s note
All claims expressed in this article are solely those of the authors and do not necessarily represent those of their affiliated organizations, or those of the publisher, the editors and the reviewers. Any product that may be evaluated in this article, or claim that may be made by its manufacturer, is not guaranteed or endorsed by the publisher.
Supplementary material
The Supplementary Material for this article can be found online at: https://www.frontiersin.org/articles/10.3389/fmars.2025.1533220/full#supplementary-material
References
Amadu I., Armah F. A., Aheto D. W., Adongo C. A. (2021). A study on livelihood resilience in the small-scale fisheries of Ghana using a structural equation modelling approach. Ocean Coast. Manage. 215, 105952. doi: 10.1016/j.ocecoaman.2021.105952
Bailey M., Miller A. M., Bush S. R., van Zwieten P. A., Wiryawan B. (2016). Closing the incentive gap: the role of public and private actors in governing Indonesia’s tuna fisheries. J. Environ. Policy Plan. 18, 141–160. doi: 10.1080/1523908X.2015.1063042
Bergfjord O. J. (2009). Risk perception and risk management in Norwegian aquaculture. J. Risk Res. 12, 91–104. doi: 10.1080/13669870802488941
Berghofer A., Wittmer H., Rauschmayer F. (2008). Stakeholder participation in ecosystem-based approaches to fisheries management: a synthesis from European research projects. Mar. Pol. 32, 243–253. doi: 10.1016/j.marpol.2007.09.014
Bradley D., Merrifield M., Miller K. M., Lomonico S., Wilson J. R., Gleason M. G. (2019). Opportunities to improve fisheries management through innovative technology and advanced data systems. Fish Fish. 20, 564–583. doi: 10.1111/faf.12361
Brender N., Markov I. (2013). Risk perception and risk management in cloud computing: results from a case study of Swiss companies. Int. J. Inform. Manage. 33, 726–733. doi: 10.1016/j.ijinfomgt.2013.05.004
Byrne B. M. (2001). Structural equation modeling with AMOS, EQS, and LISREL: comparative approaches to testing for the factorial validity of a measuring instrument. Int. J. Test. 1, 55–86. doi: 10.1207/S15327574IJT0101_4
Capmourteres V., Anand M. (2016). Assessing ecological integrity: a multi-scale structural and functional approach using Structural Equation Modeling. Ecol. Indic. 71, 258–269. doi: 10.1016/j.ecolind.2016.07.006
Carlucci D., Nocella G., De Devitiis B., Viscecchia R., Bimbo F., Nardone G. (2015). Consumer purchasing behaviour towards fish and seafood products. Patterns and insights from a sample of international studies. Appetite 84, 212–227. doi: 10.1016/j.appet.2014.10.008
Chen J. L., Hsiao Y. J., Yip K. K. (2021). Risk management of marine capture fisheries under climate change: taking into consideration the effects of uncertainty. Sustainability 13, 3892. doi: 10.3390/su13073892
Colloca F., Scarcella G., Libralato S. (2017). Recent trends and impacts of fisheries exploitation on Mediterranean stocks and ecosystems. Front. Mar. Sci. 4. doi: 10.3389/fmars.2017.00244
Dahl R. E., Oglend A. (2014). Fish price volatility. Mar. Resour. Econ. 29, 305–322. doi: 10.1086/678925
dos Santos A. O., Oliveira C. D. L., de Oliveira Junior J. G. C., da Silva Batista V. (2024). Factors influencing risk perception of inshore and offshore artisanal fishers in a marine protected area in Brazil. Fish. Manage. Ecol. 31, e12666. doi: 10.1111/fme.12666
El-Sheikh A. A., Abonazel M. R., Gamil N. (2017). A review of software packages for structural equation modeling: a comparative study. Appl. Math. Phys. 5, 85–94. doi: 10.12691/amp-5-3-2
Emerson R. W. (2015). Convenience sampling, random sampling, and snowball sampling: how does sampling affect the validity of research? J. Visual Impair. Blind. 109, 164–168. doi: 10.1177/0145482x1510900215
Fenichel E. P., Tsao J. I., Jones M. L., Hickling G. J. (2008). Real options for precautionary fisheries management. Fish Fish. 9, 121–137. doi: 10.1111/j.1467-2979.2007.00270.x
Fleming A., Hobday A. J., Farmery A., van Putten E. I., Pecl G. T., Green B. S., et al. (2014). Climate change risks and adaptation options across Australian seafood supply chains–a preliminary assessment. Clim. Risk Manage. 1, 39–50. doi: 10.1016/j.crm.2013.12.003
Gallagher D., Ting L., Palmer A. (2008). A journey into the unknown; taking the fear out of structural equation modeling with AMOS for the first-time user. Mark. Rev. 8, 255–275. doi: 10.1362/146934708X337672
Gourguet S., Thebaud O., Dichmont C., Jennings S., Little L. R., Pascoe S., et al. (2014). Risk versus economic performance in a mixed fishery. Ecol. Econ. 99, 110–120. doi: 10.1016/j.ecolecon.2014.01.013
Gu Y., Wang L., Lyu S., Dong J., Liu B., Wang X. (2023). Assessing potential driving factors of the ecosystem service value of mariculture shellfish in China using a structural equation modeling approach. Front. Mar. Sci. 10. doi: 10.3389/fmars.2023.1232211
Hall M. A., Alverson D. L., Metuzals K. I. (2000). By-catch: problems and solutions. Mar. pollut. Bull. 41, 204–219. doi: 10.1016/S0025-326X(00)00111-9
Hamaguchi Y. (2024). Impacts of polluted water discharged by the fishing-related industry on fisheries resources and economic development in an R&D-based growth model. Sustain. Environ. 10, 2385711. doi: 10.1080/27658511.2024.2385711
Hamilton P. B., Cowx I. G., Oleksiak M. F., Griffiths A. M., Grahn M., Stevens J. R., et al. (2016). Population-level consequences for wild fish exposed to sublethal concentrations of chemicals–a critical review. Fish Fish. 17, 545–566. doi: 10.1111/faf.12125
Hebbsale M. V. K., Shivamurthy M. (2021). Factor influencing fishery-based farmers’ perception and their response to climate-induced crisis management. Environ. Dev. Sustain. 23, 11766–11791. doi: 10.1007/s10668-020-01141-x
Hiddink J. G., Johnson A. F., Kingham R., Hinz H. (2011). Could our fisheries be more productive? indirect negative effects of bottom trawl fisheries on fish condition. J. Appl. Ecol. 48, 1441–1449. doi: 10.1111/j.1365-2664.2011.02036.x
Hobbs J. E., Khorana S., Yeung M. T. (2023). Moving beyond least developed country status: challenges to diversifying Bangladesh’s seafood exports. Aquac. Econ. Manage. 27, 498–522. doi: 10.1080/13657305.2022.2162624
Hodgson E. E., Essington T. E., Samhouri J. F., Allison E. H., Bennett N. J., Bostrom A., et al. (2019). Integrated risk assessment for the blue economy. Front. Mar. Sci. 6. doi: 10.3389/fmars.2019.00609
Huang S., He Y. (2019). Management of China’s capture fisheries: review and prospect. Aquac. Fish. 4, 173–182. doi: 10.1016/j.aaf.2019.05.004
Jan A., Hasan Z., Shah H., Ullah R., Ahmad I., Younas M. (2014). An investigation of the bacterial flora causing spoilage of fishes at board fish market, Peshawar, Pakistan. Pakistan J. Zool 46, 1371–1375.
Jawaid S. T., Siddiqui M. H., Atiq Z., Azhar U. (2019). Fish exports and economic growth: the Pakistan’s experience. Glob. Bus. Rev. 20, 279–296. doi: 10.1177/0972150918825422
Jean-Jules J., Vicente R. (2021). Rethinking the implementation of enterprise risk management (ERM) as a socio-technical challenge. J. Risk Res. 24, 247–266. doi: 10.1080/13669877.2020.1750462
Jia L., Qian Q. K., Meijer F., Visscher H. (2020). Stakeholders’ risk perception: a perspective for proactive risk management in residential building energy retrofits in China. Sustainability 12, 2832. doi: 10.3390/su12072832
Joffre O. M., Poortvliet P. M., Klerkx L. (2018). Are shrimp farmers actual gamblers? an analysis of risk perception and risk management behaviors among shrimp farmers in the Mekong Delta. Aquaculture 495, 528–537. doi: 10.1016/j.aquaculture.2018.06.012
Johnson J. E., Welch D. J. (2009). Marine fisheries management in a changing climate: a review of vulnerability and future options. Rev. Fish. Sci. 18, 106–124. doi: 10.1080/10641260903434557
Jones K., Seara T. (2020). Integrating stakeholders’ perceptions into decision-making for ecosystem-based fisheries management. Coast. Manage. 48, 275–288. doi: 10.1080/08920753.2020.1773211
Kaczan D. J., Patil P. G. (2020). Potential development contribution of fisheries reform: evidence from Pakistan. J. Environ. Dev. 29, 275–305. doi: 10.1177/1070496520925878
Kalhoro M. A., Liu Q., Zhu L., Jiang Z., Liang Z. (2024). Assessing fishing capacity of two tuna fish species using different time-series data in Pakistan, Northern Arabian Sea. Estuar. Coast. Shelf Sci. 299, 108692. doi: 10.1016/j.ecss.2024.108692
Khan S. R., Khan S. R. (2011). Fishery degradation in Pakistan: a poverty–environment nexus? Can. J. Dev. Stud. 32, 32–47. doi: 10.1080/02255189.2011.576140
Khan M. A., Khan J. A., Ali Z., Ahmad I., Ahmad M. N. (2016). The challenge of climate change and policy response in Pakistan. Environ. Earth Sci. 75, 1–16. doi: 10.1007/s12665-015-5127-7
Lambert J. H., Haimes Y. Y., Li D., Schooff R. M., Tulsiani V. (2001). Identification, ranking, and management of risks in a major system acquisition. Reliab. Eng. Syst. Saf. 72, 315–325. doi: 10.1016/S0951-8320(01)00009-6
Le T. C., Cheong F. (2010). Perceptions of risk and risk management in Vietnamese catfish farming: an empirical study. Aquacul. Econ. Manage. 14, 282–314. doi: 10.1080/13657305.2010.526019
Little D. C., Young J. A., Zhang W., Newton R. W., Al Mamun A., Murray F. J. (2018). Sustainable intensification of aquaculture value chains between Asia and Europe: a framework for understanding impacts and challenges. Aquaculture 493, 338–354. doi: 10.1016/j.aquaculture.2017.12.033
Luqman M., Hassan H. U., Ghaffar R. A., Bilal M., Kanwal R., Raza M. A., et al. (2024). Post-harvest bacterial contamination of fish, their assessment and control strategies. Braz. J. Biol. 84, e282002. doi: 10.1590/1519-6984.282002
Mackinson S., Wilson D. C., Galiay P., Deas B. (2011). Engaging stakeholders in fisheries and marine research. Mar. Pol. 35, 18–24. doi: 10.1016/j.marpol.2010.07.003
Martinet V., Pena-Torres J., De-Lara M., Ramirez C. H. (2016). Risk and sustainability: assessing fishery management strategies. Environ. Resour. Econ. 64, 683–707. doi: 10.1007/s10640-015-9894-0
Masakure O., Cranfield J., Henson S. (2011). Factors affecting the incidence and intensity of standards certification evidence from exporting firms in Pakistan. Appl. Econ. 43, 901–915. doi: 10.1080/00036840802600103
Masakure O., Henson S., Cranfield J. (2009). Standards and export performance in developing countries: evidence from Pakistan. J. Int. Trade Econ. Dev. 18, 395–419. doi: 10.1080/09638190902986538
McClanahan T., Allison E. H., Cinner J. E. (2015). Managing fisheries for human and food security. Fish Fish. 16, 78–103. doi: 10.1111/faf.12045
Mehak A., Mu Y., Mohsin M., Zhang X. C. (2023). MCDM-Based ranking and prioritization of fisheries’ risks: a case study of Sindh, Pakistan. Sustainability 15, 8519. doi: 10.3390/su15118519
Meirinhos G., Cardoso A., Neves M., Silva R., Rego R. (2023). Leadership styles, motivation, communication and reward systems in business performance. J. Risk Fin. Manage. 16, 70. doi: 10.3390/jrfm16020070
Mirrasooli E., Ghorbani R., Gorgin S., Aghilinejhad S. M., Jalali A. (2019) Factors associated with illegal fishing and fisher attitudes toward sturgeon conservation in the southern Caspian Sea. Mar. Pol. 100, 107–115. doi: 10.1016/j.marpol.2018.11.028
Mitra S., Khatun M. N., Prodhan M. M. H., Khan M. A. (2021). Consumer preference, willingness to pay, and market price of capture and culture fish: do their attributes matter? Aquaculture 544, 737139. doi: 10.1016/j.aquaculture.2021.737139
Mohsin M., Hengbin Y., Hua L. (2021). Accessing the risks faced by Baluchistan fisheries, Pakistan by using analytic hierarchy process (AHP) approach. J. Anim. Plant Sci. 31, 1987–1396. doi: 10.36899/JAPS.2021.5.0340
Mohsin M., Hengbin Y., Luyao Z., Rui L., Chong Q., Mehak A. (2022). An application of multiple-criteria decision analysis for risk prioritization and management: a case study of the fisheries sector in Pakistan. Sustainability 14, 8831. doi: 10.3390/su14148831
Mohsin M., Mu Y., Memon A. M., Kalhoro M. T., Shah S. B. H. (2017). Fishery stock assessment of Kiddi shrimp (Parapenaeopsis stylifera) in the Northern Arabian Sea coast of Pakistan by using surplus production models. Chin. J. Oceanol. Limnol. 35, 936–946. doi: 10.1007/s00343-017-6096-3
Mohsin M., Yin H., Mehak A. (2024). Sustainable solutions: exploring risks and strategies in Pakistan’s seafood trade for marine conservation. Front. Mar. Sci. 11. doi: 10.3389/fmars.2024.1420755
Moore J. W., Connors B. M., Hodgson E. E. (2021). Conservation risks and portfolio effects in mixed-stock fisheries. Fish Fish. 22, 1024–1040. doi: 10.1111/faf.12567
Msomphora M. R. (2015). Stakeholder participation and satisfaction in the process of developing management plans: the case of Scottish Inshore Fisheries Groups. Ocean Coast. Manage. 116, 491–503. doi: 10.1016/j.ocecoaman.2015.09.015
Muddassir M., Noor M. A., Ahmed A., Aldosari F., Waqas M. A., Zia M. A., et al. (2019). Awareness and adoption level of fish farmers regarding recommended fish farming practices in Hafizabad, Pakistan. J. Saudi Soc Agric. Sci. 18, 41–48. doi: 10.1016/j.jssas.2016.12.004
Narayanan A. (2012). A review of eight software packages for structural equation modeling. Am. Stat. 66, 129–138. doi: 10.1080/00031305.2012.708641
Nazeer S., Hashmi M. Z., Malik R. N. (2016). Spatial and seasonal dynamics of fish assemblage along river Soan, Pakistan and its relationship with environmental conditions. Ecol. Indic. 69, 780–791. doi: 10.1016/j.ecolind.2016.05.034
Noman M., Mu Y. T., Nisar U., Mohsin M., Memon A. M. (2022). Constraint analysis of major problems facing the marine fisheries sector in accordance with the national fisheries policy of Pakistan. Indian J. Geo-Mar. Sci. 51, 94–103. doi: 10.56042/ijms.v51i01.40322
Noy C. (2008). Sampling knowledge: the hermeneutics of snowball sampling in qualitative research. Int. J. Soc Res. Methodol. 11, 327–344. doi: 10.1080/13645570701401305
Nunkoo R., Ramkissoon H. (2012). Structural equation modelling and regression analysis in tourism research. Curr. Issues Tourism. 15, 777–802. doi: 10.1080/13683500.2011.641947
Obeng F., Domeh V., Khan F., Bose N., Sanli E. (2022). Analyzing operational risk for small fishing vessels considering crew effectiveness. Ocean Eng. 249, 110512. doi: 10.1016/j.oceaneng.2021.110512
Parappurathu S., Ramachandran C., Baiju K. K., Xavier A. K. (2019). Formal versus informal: insights into the credit transactions of small-scale fishers along the south west coast of India. Mar. Pol. 103, 101–112. doi: 10.1016/j.marpol.2019.02.032
Paudel S., Koprowski J. L., Cove M. V. (2020). Seasonal flow dynamics exacerbate overlap between artisanal fisheries and imperiled Ganges River dolphins. Sci. Rep. 10, 18798. doi: 10.1038/s41598-020-75997-4
Pipitone V., Colloca F. (2018). Recent trends in the productivity of the Italian trawl fishery: the importance of the socio-economic context and overexploitation. Mar. Pol. 87, 135–140. doi: 10.1016/j.marpol.2017.10.017
Pita C., Pierce G. J., Theodossiou I. (2010). Stakeholders’ participation in the fisheries management decision-making process: fishers’ perceptions of participation. Mar. Pol. 34, 1093–1102. doi: 10.1016/j.marpol.2010.03.009
Pomeroy R., Parks J., Courtney K., Mattich N. (2016). Improving marine fisheries management in Southeast Asia: results of a regional fisheries stakeholder analysis. Mar. Pol. 65, 20–29. doi: 10.1016/j.marpol.2015.12.002
Prosperi P., Kirwan J., Maye D., Bartolini F., Vergamini D., Brunori G. (2019). Adaptation strategies of small-scale fisheries within changing market and regulatory conditions in the EU. Mar. Pol. 100, 316–323. doi: 10.1016/j.marpol.2018.12.006
Quijano D., Salas S., Monroy-García C., Dreyfus-León M., Torrres-Irineo E. (2023). Identifying fisheries operations in tropical multispecies fisheries: a comparative analysis of multivariate approaches and neural networks. Fish. Res. 263, 106692. doi: 10.1016/j.fishres.2023.106692
Raza H., Liu Q., Alam M. S., Han Y. (2022). Length based stock assessment of five fish species from the marine water of Pakistan. Sustainability 14, 1587. doi: 10.3390/su14031587
Raza H., Liu Q., Hanif M. T., Han Y. (2023). Stock evaluation of the data-limited fisheries: a case study of five major commercially important fishes from the western Indian Ocean, Pakistan. Pak. J. Zool. 55, 1099–1108. doi: 10.17582/journal.pjz/20211108201136
Rebezov M., Farhan J. C. M., Mehmood T., Khaliq A., Tanweer S., Semenova A., et al. (2021). Novel techniques for microbiological safety in meat and fish industries. Appl. Sci. 12, 319. doi: 10.3390/app12010319
Rehman A., Deyuan Z., Hena S., Chandio A. A. (2019). Do fisheries and aquaculture production have dominant roles within the economic growth of Pakistan? a long-run and short-run investigation. Br. Food J. 121, 1926–1935. doi: 10.1108/BFJ-01-2019-0005
Robotham H., Bustos E., Ther-Rios F., Avila M., Robotham M., Hidalgo C., et al. (2019). Contribution to the study of sustainability of small-scale artisanal fisheries in Chile. Mar. Pol. 106, 103514. doi: 10.1016/j.marpol.2019.103514
Röthig T., Trevathan-Tackett S. M., Voolstra C. R., Ross C., Chaffron S., Durack P. J., et al. (2023). Human-induced salinity changes impact marine organisms and ecosystems. Glob. Change Biol. 29, 4731–4749. doi: 10.1111/gcb.16859
Roux M. J., Duplisea D. E., Hunter K. L., Rice J. (2022). Consistent risk management in a changing world: risk equivalence in fisheries and other human activities affecting marine resources and ecosystems. Front. Clim. 3. doi: 10.3389/fclim.2021.781559
Saidi A., Cavallo C., Del Giudice T., Vecchio R., Cicia G. (2023). Consumer preferences for finfish: a systematic literature review. Food Qual. Prefer. 105, 104786. doi: 10.1016/j.foodqual.2022.104786
Salas S., Gaertner D. (2004). The behavioural dynamics of fishers: management implications. Fish Fish. 5, 153–167. doi: 10.1111/j.1467-2979.2004.00146.x
Samy-Kamal M. (2021). Prices in the Egyptian seafood market: insights for fisheries management and food security. Fish. Res. 233, 105764. doi: 10.1016/j.fishres.2020.105764
Sethi S. A. (2010). Risk management for fisheries. Fish Fish. 11, 341–365. doi: 10.1111/j.1467-2979.2010.00363.x
Shek D. T., Yu L. (2014). Confirmatory factor analysis using AMOS: a demonstration. Int. J. Disabil. Hum. Dev. 13, 191–204. doi: 10.1515/ijdhd-2014-0305
Silva L. C., Lopes B., Pontes M. J., Blanquet I., Segatto M. E., Marques C. (2021). Fast decision-making tool for monitoring recirculation aquaculture systems based on a multivariate statistical analysis. Aquaculture 530, 735931. doi: 10.1016/j.aquaculture.2020.735931
Soma K., Nielsen J. R., Papadopoulou N., Polet H., Zengin M., Smith C. J., et al. (2018). Stakeholder perceptions in fisheries management-sectors with benthic impacts. Mar. Pol. 92, 73–85. doi: 10.1016/j.marpol.2018.02.019
Sun C. H. J., Chiang F. S., Guillotreau P., Squires D., Webster D. G., Owens M. (2017). Fewer fish for higher profits? price response and economic incentives in global tuna fisheries management. Environ. Resour. Econ. 66, 749–764. doi: 10.1007/s10640-015-9971-4
Surathkal P., Dey M. M., Engle C. R., Chidmi B., Singh K. (2017). Consumer demand for frozen seafood product categories in the United States. Aquac. Econ. Manage. 21, 9–24. doi: 10.1080/13657305.2017.1265020
Tang C. P., Tang S. Y. (2006). Democratization and capacity building for environmental governance: managing land subsidence in Taiwan. Environ. Plann. A. 38, 1131–1147. doi: 10.1068/a37375
Tubbs S., Berggren P. (2024). Questionnaire surveys to investigate marine mammal fisheries bycatch: systematic review and best practice. Front. Mar. Sci. 11. doi: 10.3389/fmars.2024.1481840
Ueland Ø., Gunnlaugsdottir H., Holm F., Kalogeras N., Leino O., Luteijn J. M., et al. (2012). State of the art in benefit–risk analysis: consumer perception. Food Chem. Toxicol. 50, 67–76. doi: 10.1016/j.fct.2011.06.006
Ullah Z., Wu W., Wang X. H., Pavase T. R., Shah S. B. H., Pervez R. (2021). Implementation of a marine spatial planning approach in Pakistan: an analysis of the benefits of an integrated approach to coastal and marine management. Ocean Coast. Manage. 205, 105545. doi: 10.1016/j.ocecoaman.2021.105545
Wachinger G., Renn O., Begg C., Kuhlicke C. (2013). The risk perception paradox–implications for governance and communication of natural hazards. Risk Anal. 33, 1049–1065. doi: 10.1111/j.1539-6924.2012.01942.x
Williams A., Dowdney J., Smith A. D. M., Hobday A. J., Fuller M. (2011). Evaluating impacts of fishing on benthic habitats: a risk assessment framework applied to Australian fisheries. Fish. Res. 112, 154–167. doi: 10.1016/j.fishres.2011.01.028
Woods P. J., Macdonald J. I., Baroarson H., Bonanomi S., Boonstra W. J., Cornell G., et al. (2022). A review of adaptation options in fisheries management to support resilience and transition under socio-ecological change. ICES J. Mar. Sci. 79, 463–479. doi: 10.1093/icesjms/fsab146
Yadav N. K., Patel A. B., Singh S. K., Mehta N. K., Anand V., Lal J., et al. (2024). Climate change effects on aquaculture production and its sustainable management through climate-resilient adaptation strategies: a review. Environ. Sci. pollut. R. 1–21:31731–31751. doi: 10.1007/s11356-024-33397-5
Yeo A. D., Deng A. (2019). The trade policy effect in international trade: case of Pakistan. J. Econ. Struct. 8, 43. doi: 10.1186/s40008-019-0169-8
Zhang Z., Yang W., Ding J., Sun T., Liu H., Liu C. (2022). Identifying changes in China’s Bohai and Yellow Sea fisheries resources using a causality-based indicator framework, convergent cross-mapping, and structural equation modeling. Environ. Sustain. Ind. 14, 100171. doi: 10.1016/j.indic.2022.100171
Keywords: risk perception, sustainable fisheries, SEM, fisheries performance, coastal fisheries
Citation: Mohsin M, Yin H and Mehak A (2025) Assessing the impact of risk perception on fisheries performance: a structural equation modeling approach in coastal fisheries. Front. Mar. Sci. 12:1533220. doi: 10.3389/fmars.2025.1533220
Received: 23 November 2024; Accepted: 25 March 2025;
Published: 22 April 2025.
Edited by:
Just T. Bayle-Sempere, University of Alicante, SpainReviewed by:
Francisco Arreguin-Sanchez, Centro Interdisciplinario de Ciencias Marinas (IPN), MexicoTaner Yildiz, Istanbul University, Türkiye
Copyright © 2025 Mohsin, Yin and Mehak. This is an open-access article distributed under the terms of the Creative Commons Attribution License (CC BY). The use, distribution or reproduction in other forums is permitted, provided the original author(s) and the copyright owner(s) are credited and that the original publication in this journal is cited, in accordance with accepted academic practice. No use, distribution or reproduction is permitted which does not comply with these terms.
*Correspondence: Hengbin Yin, MjAxOTAyNTFAd3piYy5lZHUuY24=