 Liru Chen
 Yihang Zhang2
 Yanwen Tan
 Abdelrahman Ali
- 1Department of Agriculture and Forestry Economics, School of Economics and Management, South China Agricultural University, Guangzhou, China
- 2College of Mathematics and Informatics, South China Agricultural University, Guangzhou, China
- 3Department of Agricultural Economics, Faculty of Agricultural, Fayoum University, Fayoum, Egypt
Introduction: The discharge of nuclear wastewater (NW) poses significant environmental, economic, and geopolitical risks, impacting marine ecosystems, global fisheries trade, and public health. Japan's decision to release NW has triggered international responses, including seafood import restrictions and inspections.
Methods: This study simulates the short-term (ST) and long-term (LT) effects of NW on global fisheries trade under various scenarios using complex network analysis and maximum entropy modeling.
Results: Simulation outcomes suggest that in the ST scenario, China’s aquatic exports may decrease by 9.11 million tons, followed by Japan with 2.09 million tons. Import reductions for China, the U.S., and Japan could reach $1403M, $1310M, and $1046M, respectively. In the LT scenario, Japan’s exports may fall by $1791M, with China and Chile losing $1321M and $1306M. The U.S. may cut imports by $2521.9M (7.98%), China by 10.06%, and Japan by 7.20%. Smaller-importer nations are also notably impacted.
Discussion: These projections highlight NW’s wide-ranging trade effects, though real-world outcomes will depend on evolving factors. Ongoing monitoring and adaptive trade policies are crucial to mitigate impacts on seafood trade, food security, and economic stability. The results offer strategic guidance for policymakers and industry stakeholders.
1 Introduction
On March 11, 2011, a tsunami caused by a magnitude nine earthquake on the Pacific Ocean floor triggered the Fukushima nuclear accident in Japan. After the Fukushima nuclear accident, many radioactive nuclides leaked into the environment, impacting regions worldwide through atmospheric and oceanic circulation (Koo et al., 2014; Ten Hoeve and Jacobson, 2012; Wu et al., 2023). As the total amount of continuously generated NW gradually approached the upper limit of existing storage capacity (1.37 million tons), on April 13, 2021 the Japanese government announced that it would discharge the post-Fukushima nuclear accident wastewater (referred to as Fukushima NW) into the Pacific Ocean by a 40-year discharge plan (Normile, 2021). This decision has sparked global concerns regarding its environmental, economic, and geopolitical implications, including potential harm to marine ecosystems, food safety risks, and disruptions to international trade. The Fukushima NW officially began discharging into the ocean on August 24, 2023. The decision to discharge NW generates many considerations, including the environmental and socio-political context (international environmental policy and trade regulations) surrounding this decision. This move will inevitably cause harm to the marine environment and marine life in many countries1 (Chang et al., 2024). AQs are an essential source of animal protein, account for 15 percent of the animal protein supply, reaching over 50 percent in several countries in Asia and Africa (FAO, 2024). Non-high-income countries generally rely more heavily on proteins from aquatic animal foods compared with high-income countries. In 2022, fisheries and aquaculture production reached an all-time high of 223.2 million tonnes, worth a record USD 472 billion. Aquatic products continue to be one of the most traded food commodities, involving over 230 countries and territories and generating a record USD 195 billion in 2022 considering all aquatic products. That year, it represented over 9.1 percent of total agricultural trade (excluding forest products). In countries and territories such as the Faroe Islands, Maldives and Seychelles, however, it accounted for over 30 percent of total merchandise trade.
At present, not only does the discharge of NW have an impact on the trade of AQs, but marine pollution is also widespread and worsening (Landrigan et al., 2020). The outbreak of COVID-19 has restricted the circulation and supply of major AQs in the world’s production, import, and export countries (Liu et al., 2021a). In March 2022, the Russia-Ukraine conflict broke out, exacerbating the turbulence in the AQ market (Jagtap et al., 2022). Given the growing demand for seafood (FAO, 2024), and increasing trade uncertainties, understanding the potential reconfiguration of global AQ trade is essential. This study aims to assess the short-term (ST) and long-term (LT) trade impacts of NW discharge using a trade redistribution model based on complex network methods. However, it is crucial to acknowledge that these simulations reflect one plausible outcome among an infinite range of potential scenarios. Realized impacts will depend on evolving trade policies, market responses, and environmental monitoring. Therefore, three key questions guide this research: 1) What are the current characteristics of global AQ trade? 2) How can the trade of AQs between countries be reconfigured after the supply risk of AQs caused by NW occurs? 3) What short-term and long-term impacts will it have on China and other major core trading countries? By addressing these questions, this study provides valuable insights into potential trade disruptions and highlights the need for continuous monitoring and adaptive policy measures to mitigate risks associated with NW discharge.
2 Literature review
2.1 Impact of nuclear wastewater
There are many potential impacts of NW discharge, as nuclear contaminants can affect marine ecosystems and human health. On August 24, 2023, the Japanese government officially launched the discharge of NW into the sea, and its impact has received widespread attention from all walks of life (Liang et al., 2024). The National Oceanographic Laboratory Association opposed the plan, citing “the lack of sufficient and accurate scientific data to support Japan’s safety claims” (Normile, 2023). Greenpeace is concerned that Japan’s “Advanced Liquid Processing System (ALPS)” will have difficulty completely treating radioactive substances such as strontium 90, carbon 14, cesium 137, iodine-129, and cobalt-60 in NW, which “easily accumulate in the food chain” and may harm human health over time due to their cumulative intake1 (Chang et al., 2024). At present, this event has been studied by many scholars, some of them discussing the potential economic impacts of Japan’s NW discharge from the perspectives of regional economies and economic losses (Kenta Tanaka and Shunsuke Managi, 2016, Wu et al., 2023). Some scholars discuss the violation of international environmental law and nuclear safety related laws by NW discharge from a judicial perspective (Chang et al., 2024; Meng and Wang, 2023), and discuss how interested countries and groups can effectively defend their rights through legal channels (Chen and Xu, 2022; Fu and Li, 2024).
However, few scholars have explored the trade impact of Japanese NW discharge; a secondary effect stemming from the direct impacts on the marine environment and marine life, which in turn affects the production and trade of aquatic products in various countries. Dadakas and Tatsi (2021) used a gravity model and Poisson Pseudo Maximum Likelihood estimator to assess impact of the Fukushima accident on agricultural trade flows. However, the study overlooked the impact of pollutants on other countries, and their temporal diffusion which will directly affect the production of aquatic products. Nuclear pollutants may reach the northeast Pacific Ocean within one year2, and will cover almost the entire North Pacific in more than three years, and cover the entire Pacific Ocean in ten years (Liu et al., 2022). Although the impact of nuclear pollutants on fishery production is still uncertain, after the accident at the Fukushima Daiichi Nuclear Power Plant (FDNPP) in Japan on March 11, 2011, scientists tracked and studied fish in the nearby waters. From April 2011 to April 2012, more than 40% of fish were found to have radiation levels exceeding Japanese regulatory limits (Buesseler, 2012). Five years later, 0.05% of samples in the area exceeded this limit (Wada et al., 2016). There is therefore a factual basis for assuming a decrease in AQ production due to NW release. Any triggering of relevant international agreements, such as the United Nations Convention on the Law of the Sea could have significant implications for the management of marine pollution and international trade for Japan and other coastal countries.
2.2 Reactions of various countries to the discharge of nuclear wastewater
NW discharge has an impact on AQ trade not only through the potential for radiation contamination levels exceeding regulatory thresholds, but also through consumers’ preferences over affected or potentially affected aquatic products and individual countries’ efforts to protect their consumers. According to the empirical research of McKendree et al. (2013), 30% of survey respondents reduced their consumption of seafood after the Fukushima nuclear power plant accident, and more than 50% of respondents believed that the nuclear disaster had posed a risk to consumer health in Asia. Many governments and citizen groups took strong measures based on these concerns. The General Administration of Customs of China enacted a complete suspension of Japanese AQ imports to the Chinese Mainland. Hong Kong and Macao have banned imports of AQs from 10 prefectures in Japan3. Malaysia implements Level 4 inspection on high-risk food imported from Japan4. The 18-nation Pacific Islands Forum has long expressed concerns about the possible impact of NW on the fishing industry (McCurry, 2023). In addition, citizens in both Japan and South Korea, as well as South Korean lawmakers, have strongly protested these releases5 (Li and Li, 2022). According to a Gallup poll conducted in June 2023, 78% of South Korean respondents said they were very or somewhat concerned about the possible damage to marine life (McCurry, 2023). Although there is no exact data on the scientific impact of NW, these negative public opinions will affect the consumption of AQs (Wang et al., 2022), which in turn will affect the trade pattern of AQ. Wang et al. (2022) found that public opinion on Japan’s actions affect not only the trade volume of Japanese AQs, but also volumes of both imports and exports of Japan’s trading partners. Combined with the current status of China’s AQ industry and foreign trade competitiveness, the discharge of NW will promote China’s AQ exports (Hai, 2021). The economic impact also varies across countries, with negative impacts on Japan and the United States contrasted against increased demand for exports benefitting China, India, Indonesia, as examples (Wu et al., 2023). However, compared with AQ, terrestrial animal protein production systems have lower efficiency, exacerbating land use tension (Napier et al., 2020), threatening nutritional security, and expanding greenhouse gas emissions (Zhang et al., 2023). A few studies believe the discharge of NW will have multiple negative impacts, including the potential to shift demand towards terrestrial animal protein production systems with lower efficiency and exacerbating land use tensions (Napier et al., 2020), threatening nutritional security, and expanding greenhouse gas emissions (Zhang et al., 2023). Assessing ST and LT production impacts on AQ trade can provide a clearer understanding of potential impact of Japan’s discharge of NW on major trade partners.
3.2 Social network and entropy maximization method
Scholars are increasingly applying social network methods to study structural changes in the global trade network after large shocks (Gutiérrez-Moya et al., 2021; Kosztyán et al., 2024). Understanding the characteristics of the current global AQ trade pattern is the foundation for grasping the impact of nuclear waste discharge. Although a broad range of methodologies to model trade exist, including agent-based or dynamic system approaches, we employed the maximum entropy method to understand the trade impact without making too many assumptions. Agent-based modelling is challenged by difficulties in model construction, verification, validation, computation, and generalization of findings (An et al., 2021). Complex networks (CN) are a very effective tool for studying international trade flows and the stability of trade network structure (Allard et al., 2017; Serrano and Boguná, 2003). Gephart and Pace (2015) used CN methods to analyze the structure and evolution of AQ trade from 1994 to 2012, including quantifying indicators of AQ globalization, changes in bilateral trade flows, changes in centrality, and comparing AQ trade networks with agricultural and industrial trade networks. This provides a reference for further research in this article, which expands the period to 2000-2022, updates the latest trade status of nodes, analyzes the evolution characteristics of network structure since the 21st century, and analyzes the characteristics of AQ trade in response to shocks. The discharge of NW has brought new shocks to the trade relations of AQ trading countries. For reconstructing the trade relations between countries after changes in supply, the maximum entropy method can accurately provide the most uniform and least risk-predicted probability distribution, which is also the most objective allocation for participating countries (Wang et al., 2021). The maximum entropy method analyzes system risks by reconstructing unknown network connections (Ikeda and Watanabe, 2017), and trade across participating countries is assessed utilizing a uniform distribution to minimize the subjective assumptions around trade linkages after changes in supply distributions (Wang et al., 2021). Recent studies that integrate maximum-entropy and econometric approaches in gravity models, providing a more nuanced understanding of trade networks (Di Vece et al., 2022). Here, reallocation is assessed by constructing a network using the degrees and strengths of participating AQ trading countries with minimal assumptions on unknown information. The reallocation model uses trade weights to evenly distribute risk across trading partners, achieving the minimum global supply risk.
This article constructs an AQ trade distribution model based on the global AQ trade network and the principle of maximum entropy. It simulates the possible trade reallocation among countries under the ST and LT impacts of NW, helping trading countries understand potential impacts from Japan’s discharge and formulate corresponding trade strategies.
3 Methodology and data sources
3.1 Data sources
This study analyzes the world AQ trade system using data from the United Nations Trade Database from 2000 to 2022. AQs include two categories: primary products and finished products. According to the Harmonized System classification method in the United Nations Trade Database, AQs are defined as follows: 0301 (Fish; live), 0302 (Fish; fresh or chilled, excluding fish fillets and other fish meat of heading 0304), 0303 (Fish; frozen, excluding fish fillets and other fish meat of heading 0304), 0304 (Fish fillets and other fish meat (whether or not minced); fresh, chilled or frozen), 0305 (Fish; dried, salted or in brine; smoked fish, whether or not cooked before, or during the smoking process), 0306 (Crustaceans; in shell or not; in shell, steamed or boiled, whether or not chilled), 0307 (Molluscs; whether in shell or not; smoked molluscs), 0308 (Aquatic invertebrates other than crustaceans and molluscs; smoked aquatic invertebrates other than crustaceans and molluscs), 0309 (Flours, meals and pellets of fish, crustaceans, molluscs and other aquatic invertebrates, fit for human consumption), 1603 (Extracts and juices of meat, fish or crustaceans, molluscs or other aquatic invertebrates), 1604 (Prepared or preserved fish; caviar and caviar substitutes prepared from fish eggs), and 1605 (Crustaceans, molluscs and other aquatic invertebrates). The data mainly focuses on import data, which measures trade volume based on the cost, insurance, and freight price. However, when import data is missing, export data is used as a supplement. To ensure network connectivity while basing simulations on the broadest definition of global trade, the analyses removed isolated nodes: that is, countries with no trade connections. The annual number of countries or regions is 236-242, covering almost all countries. To link the analysis to the impact of nuclear waste, this study obtains data on total aquatic production, marine catch, and marine aquaculture from the FAO Fisheries and Aquaculture FishStat database for each country.
3.2 Model description and scenario assumption
The basic structure of the global aquatic product trade network (AQTN) model can be abstracted as the connections between various economic participants. Each node in the network represents a country or region, and network links are weighted in a directed manner, representing the import (export) amount between countries. In this article, the trade amount (in US $) is used as the trade flow, and the link has direction and weight. The direction represents the import and export relationship, and the weight represents the import and export amount of aquatic products. In the model matrix, rows represent exporting countries and columns represent importing countries. Here, W is defined as a weight matrix, where the elements Wij represent the export value of aquatic products from country i to country j. An adjacency matrix A is constructed by setting Aij = 1 if Wij >0 and Aij=0 if Wij=0.
3.2.1 Network node centrality measurement
In a network, the weighted degree refers to the sum of the weights of all edges connected to a node. In a trade network, it can be used to measure the importance of a country. In-degree (() and out-degree () respectively represent the number of countries from which a country imports and the number of countries to which it exports. In-strength () and out-strength () represent the import volume and export volume of a country, respectively.
The Betweenness Centrality metric of a node captures the role of an economy in connecting other economies in the network by measuring the number of shortest paths through a node. For a trade network of the same product, the greater the number of intermediate positions a participant has between other nodes, the more diverse groups it connects, and it plays an essential bridging role in the flow of the product. High betweenness centrality indicates that the country is a powerful mediating node for trade change information in the market, occupying a central position in the network (Ren et al., 2021). The greater the betweenness centrality of a node, the stronger the mediating role of the trading country, and the higher its control over the trade network (Brandes, 2001). The normalized betweenness centrality is given by Equation 1 (Brandes, 2001):
Among them, is the number of shortest paths between nodes i and j through node u, and B is the number of shortest paths between i and j. The higher the intermediacy centrality, the more intermediary transactions the relevant economy will adopt (Sun et al., 2022).
Authority centrality and hub centrality are also widely used in the network. This article uses the weighted hyperlink-induced topic search (WHITS) algorithm (Deguchi et al., 2014; Liu et al., 2021b), which incorporates both trade weights and trade directions, to calculate the authority centrality and hub centrality of each country in the AQ trade network, and to measure the important exporting countries and important importing countries in the global AQ trade. The algorithm is developed based on the HITS algorithm.
According to the definition of the HITS algorithm (Kleinberg, 1999), the authority vector is: , and the hub vector is: , which are constrained by the following iterative formula definition:
Where A is the adjacency matrix, t is the number of iterations, and where c(t) and d(t) are normalization factors to make the sums of all elements become unity, which make Equation (5) hold true:
The initial values of iteration are and . From the formula, it can be seen that the HITS authority vector is the eigenvector of matrix ; similarly, the HITS hub vector y is the eigenvector of matrix .
The weighted HITS hub centrality and weighted HITS authority centrality are defined in the same way, except that the weighted matrix W replaces the adjacency matrix A in Equations 2, 3.
The importance of nodes calculated by the HITS algorithm for trading countries is not directly proportional to their corresponding import and export shares, but is jointly influenced by the country’s import and export shares and the structure of world trade (Deguchi et al., 2014). The use of authority values and hub values to assess the importance of nodes in complex directed networks can be visually understood as the importance of a country not only reflected in its own supply or consumption capacity but also in the supply or consumption capacity of its trading partners. In other words, a country with a higher authority centrality indicates that while it imports a large amount of AQ, its source countries also export a large amount of AQs to many other countries. To some extent, this can be understood as the country not only being a large “consumer” in the global AQ market but also having its consumption needs more easily guaranteed. Similarly, a country with a higher hub centrality indicates that while it exports a large amount of AQ, its export destinations also import many AQs to many other countries. That is, the country not only has strong supply capacity but also a strong demand from its export destinations.
3.2.2 Network centrality measurement
The density of a network (Wasserman and Faust, 1994) is defined as the number of actual connections divided by the number of possible connections in the network. In a trade network, it can be used to measure the degree of connection between nodes in the network.
The clustering coefficient of a network is defined as the average value of the clustering coefficients of all nodes. For a simple unweighted network, the clustering coefficient of node i reflects the ratio of the number of triangles formed through node i to the number of all possible connections (Watts and Strogatz, 1998), as shown in Equation 5. That is the degree to which a node’s partners are themselves partners (Zhou et al., 2020). In this article, based on a weighted perspective, we use the weighted clustering coefficient (WCC) to measure the degree of close connections between countries in the aquatic product AQ trade network. The geometric mean of the edge weights of the subgraph (Onnela et al., 2005) is used to define the weighted clustering coefficient of node i and the weighted clustering coefficient WCC of the entire network, as shown in Equations 6 and 7:
Where, is the number of triangles formed through the node i, is the number of nodes connected to the node i, n is the number of network nodes, edge weight is normalized by the maximum weight in the network, and .
3.2.3 Construction of AQ trade reallocation model
Coming to the physics-inspired approaches to international trade, the application of maximum entropy is increasing (Jaynes, 1982; Cimini et al., 2019; Parisi et al., 2020), it allows for purely structural network properties to be constrained in order to derive the maximally unbiased probability distribution compatible with those properties (Di Vece et al., 2022). It can be understood to a certain extent as the lower limit of the impact of shocks on trade without taking any measures, which also has certain reference significance for policy makers.
To model the reallocation of AQ trade, this analysis assumes that every country participating in AQ trade will follow the existing trade patterns to the extent possible, as the existing trade model may be the best choice for different countries based on their national conditions and trade policies. Therefore, according to the principle of maximum entropy, there are no subjective assumptions, and the import and export capabilities of countries are fixed, and the trade relations between countries are fixed. Based on meeting the above conditions, reasonable resource reallocation strategies are provided for countries participating in global AQ trade. In this case, the loss of global AQ trade is minimized, and the global trade after reallocation is the most stable.
Suppose that the total export volume of a country is Ei and the total import volume is Ii. On this basis, the entropy of the configuration is maximized using bilateral trade volumes between countries (Wang et al., 2021; Wilson, 1969), see Equation (8):
Where is a constant; that is the first half of Equation 9 is a constant. Therefore, a convex objective function can be obtained:
Under the constraints ; ; ; >0;if , then the entropy-maximized is also 0, and the entropy value S is maximized. These constraints not only control the actual supply and demand capabilities of each country’s AQ, but also limit countries that do not have trade links in practice, and no trade linkage will be created through entropy maximization.
However, this trade network has a certain degree of sparsity. To improve the accuracy of the reconstruction, this article applies the concept of Lasso (Least Absolute Shrinkage and Selection Operator) (Breiman, 1995; Hastie et al., 2009) to modify the objective function (10). At this point, our problem can be expressed as maximizing the objective function g, see Equation (10).
where is a control parameter.
In short, under the condition that the proportion of each country’s exports, imports, and global trade in the AQ trade network is fixed, the trade relationship between countries can be optimized by see Eqution (11):
In the constraint Equations 12–16, is the ratio of the total global trade volume of country i’s exports to country j, or the ratio of country j’s imports from country i to the total global trade volume. represents the proportion of a country’s total exports to the total world trade volume, represents the proportion of a country’s total imports to the total world trade volume, and is the estimated .
3.2.4 Scenario assumptions for short-term and long-term demand reduction
This article argues that the discharge of Japanese NW mainly affects the world’s AQ demand by reducing consumption of seafood in the corresponding contaminated areas, and decline supply of aquaculture production and marine capture production. Given the existing research conclusion that the discharge of Japanese NW will cover almost the entire North Pacific after 1200 days, and almost the entire Pacific Ocean will be affected by these pollutants on Day 3600 (Liu et al., 2022), this article sets the ST and LT impact time at three years and ten years respectively and assumes that the discharge of NW will only affect the fishery production of countries in the Pacific waters. Therefore, in the SL, countries that carry out fishery production in the North Pacific6 will be affected, and in the long run, the fishery production of the entire Pacific Ocean will be affected by pollutants.
For the impact on production, some scholars have assumed that the global final demand for Japanese AQs will decrease by 66.2% within two years based on the proportion of the output value of marine fisheries in the polluted waters in Japan’s total fishery output value (Wu et al., 2023). This assumption can be considered as the worst case scenario for the impact of NW discharge on the country’s AQ exports. Existing research has found that consumers’ subjective awareness will lead them to reduce their consumption of seafood products that may be contaminated by nuclear radiation, even if scientific testing suggests that seafood is safe (Dharmadji et al., 2024). In order to set a more reasonable assumption, this article combines consumer preferences on this basis. That is, based on empirical research by McKendree et al., 30% of respondents said that they reduced their consumption of seafood after the Fukushima nuclear power plant accident, and more than 50% of respondents believed that the Japanese nuclear disaster posed a risk to consumers’ health from Asian seafood (McKendree et al., 2013). Therefore, to a certain extent, it can be considered that 30% of marine products from polluted waters will be resisted by consumers, which will reduce their imports.
3.2.4.1 Short-term scenario assumption
Scenario 1 (S1): In the short term (about three years), assuming that 30% of the marine fishery production in the polluted sea area accounts for the proportion of the total AQ output of the country, it is equivalent to the reduction in AQ exports of the North Pacific marine operation countries (10 countries or regions except Japan). As Japan is the closest country to the discharge outlet, the concentration of pollutants near its sea area will be the highest. Therefore, assuming that 60% of the marine fishery production in the polluted sea area accounts for the proportion of Japan’s total AQ output, it is equivalent to the reduction in Japan’s AQ exports.
From the current AQ production structure perspective, the global AQ output reached 181.96 million tons in 2021, of which 114.48 million tons were produced from marine fishing and aquaculture, accounting for 62.91% of the total output, Table 1.

Table 1. Global aquatic product production structure in 2021 (10000 tons).
The production of marine products from fishing and aquaculture in the North Pacific is 42.837 million tons, accounting for 37.42% of global marine AQs from 11 regions. Among them, the production of AQs in the Chinese Mainland from the North Pacific is the largest, reaching 30.3745 million tons, accounting for 97.55% and 47.34% of China’s marine and total AQs, respectively. Next are Russia, Japan, the United States, and South Korea, all accounting for over 50% of their total North Pacific AQs.
Under the setting of scenario 1, without considering price inflation, the global AQ supply will decrease by 8145.73 million US $ (nominal value, same below), Table 2.
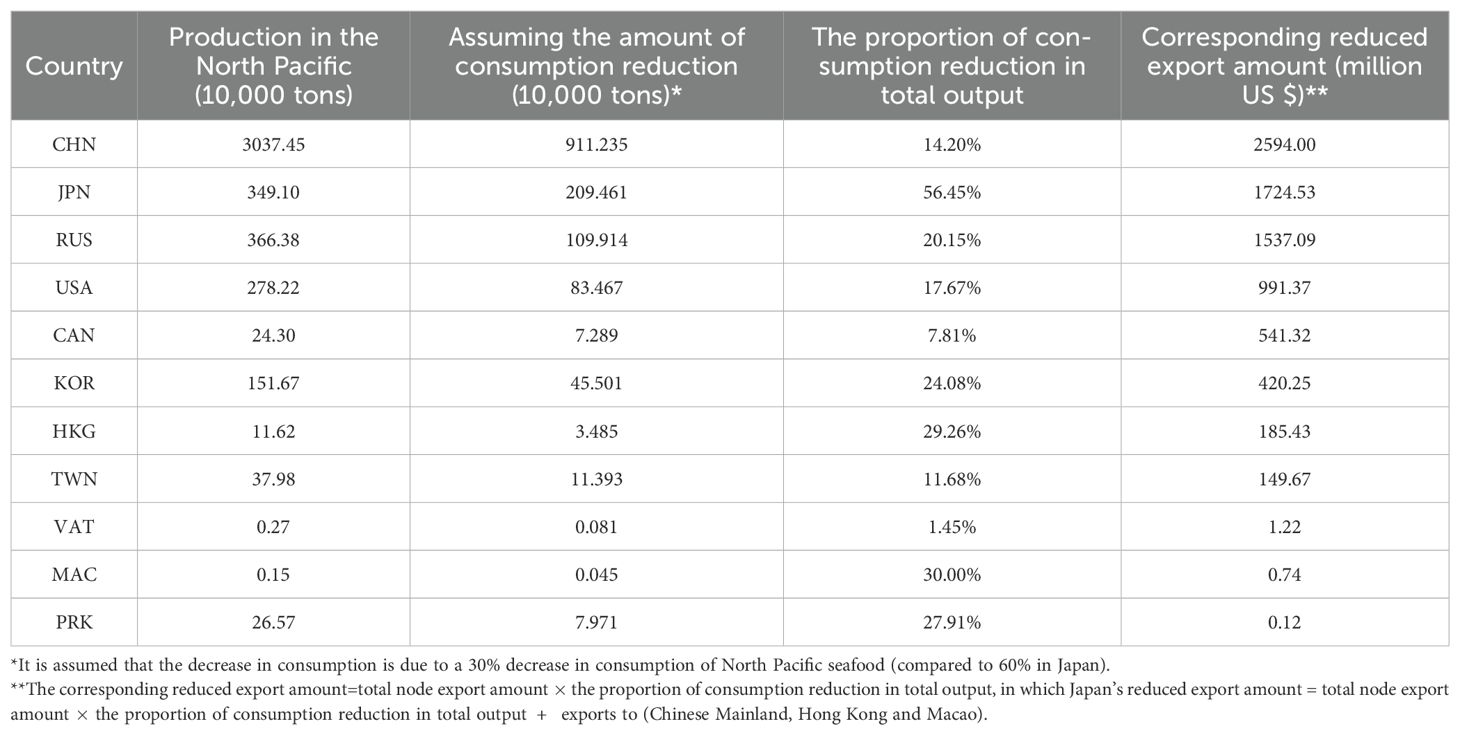
Table 2. Export reduction of seafood producing countries in the North Pacific (S1).
3.2.4.2 Long-term scenario assumption
Scenario 2 (S2): In the long term (10 years), Japan’s NW will spread throughout the Pacific Ocean. Considering the further dilution of NW, it is assumed that the reduction in AQ exports from the 2 marine operation countries in the entire Pacific Ocean (60 countries or regions except Japan) is 15% of the total AQ output of the affected sea area. However, the impact on Japan is still 60% of the total AQ output of the affected sea area, because according to Japan’s emission plan, its emission time will last for at least 30 years, so the concentration near Japanese waters will be higher than other places in the next 30 years.
The production of marine fishing and aquaculture products from the Pacific Ocean is 76.33 million tons, accounting for 66.68% of global marine AQ. These products come from 61 countries or regions. Among them, the output of AQs from Chinese Mainland’s marine fishing and aquaculture in the Pacific Ocean is the highest, 30.915 million tons, accounting for 48.18% of the output of AQs in Chinese Mainland in 2021, followed by Indonesia, Peru, Vietnam and Russia. Among the top ten countries in the Pacific seafood production, except Chinese Mainland, the Pacific seafood production of other countries accounts for more than half of the total seafood production. However, from the perspective of output, China has the largest seafood production affected by NW discharge (see Figure 1 below).

Figure 1. Top 10 Pacific seafood producing countries (or Regions) in the world.
Under the setting of S2, the global supply of seafood will decrease by US $10476.68 million in ten years, of which Japan has the largest export decrease at US $1791.32, followed by Chinese Mainland, whose export volume will decrease by US $1321.02 million, which is smaller than the short-term export volume. Once again, countries such as Chile, Germany, and Vietnam saw a decrease in their export values of $1306.33 million, $1204.67 million, and $946.33 million, respectively (Table 3).
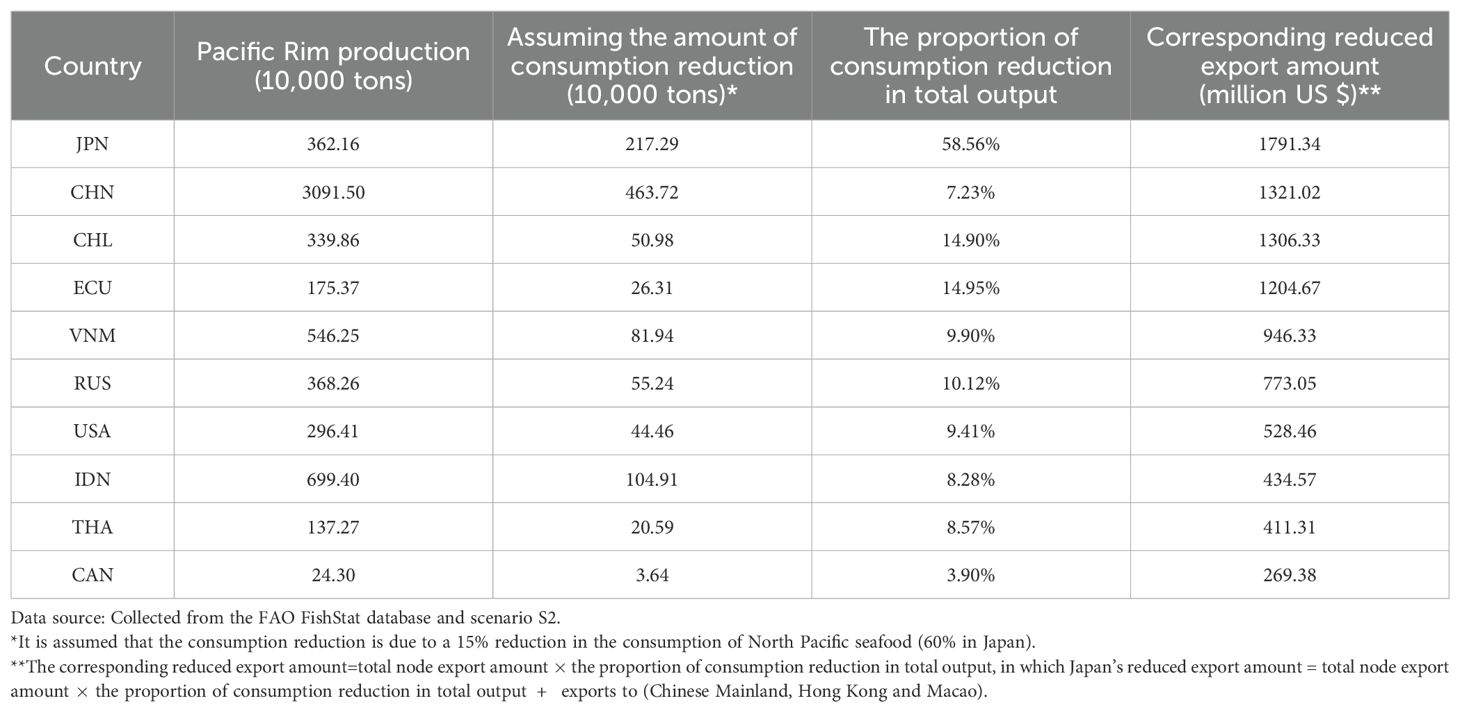
Table 3. Top 10 Pacific countries producing seafood before the decrease in exports (S2).
Whether in S1 or S2, Japan is the country with the main decrease in aquatic product exports. It has far-reaching economic consequences beyond direct trade losses. The seafood industry in Japan employed over 123100 workers in 2022 (Statistics Bureau, 2024), and reductions in exports could lead to job losses, wage cuts, and financial strain on coastal communities heavily dependent on fisheries. Furthermore, disruptions in supply chains may force businesses to seek alternative markets or adjust production strategies, potentially increasing operational costs. The decline in exports to key markets like China and South Korea could also lead to shifts in regional seafood trade patterns, with competitors such as Norway or Chile filling supply gaps.
4 Results and discussion
4.1 Important AQs trading countries
The analysis results show that from the perspective of unweighted export and entry of AQs trade network, the Chinese Mainland has the largest number of export contact countries in 2022, with 182 export countries or regions, followed by France, the United Kingdom, the Netherlands and India, while Hong Kong and Macao have 52 and 15 export destinations respectively. The United States has the most diverse sources of imports, with up to 157 sources, followed by Canada and France. Hong Kong ranks fourth in the world in terms of the number of countries that import AQs, reaching 133, while Macau and the Chinese Mainland have made progress at 97 and 93, respectively, ranking 21st and 26th globally. This indicates that Hong Kong and Macau are important pivot points for the diversified development of China’s AQ imports. The data from the weighted trade network of AQs shows that China, Norway, Chile, India, Canada, Spain, the United States, the Netherlands, Sweden, and Denmark are the top ten global exporters of AQ, with the largest importing country being the United States, followed by China, Japan, and Spain, as shown in Figure 2.
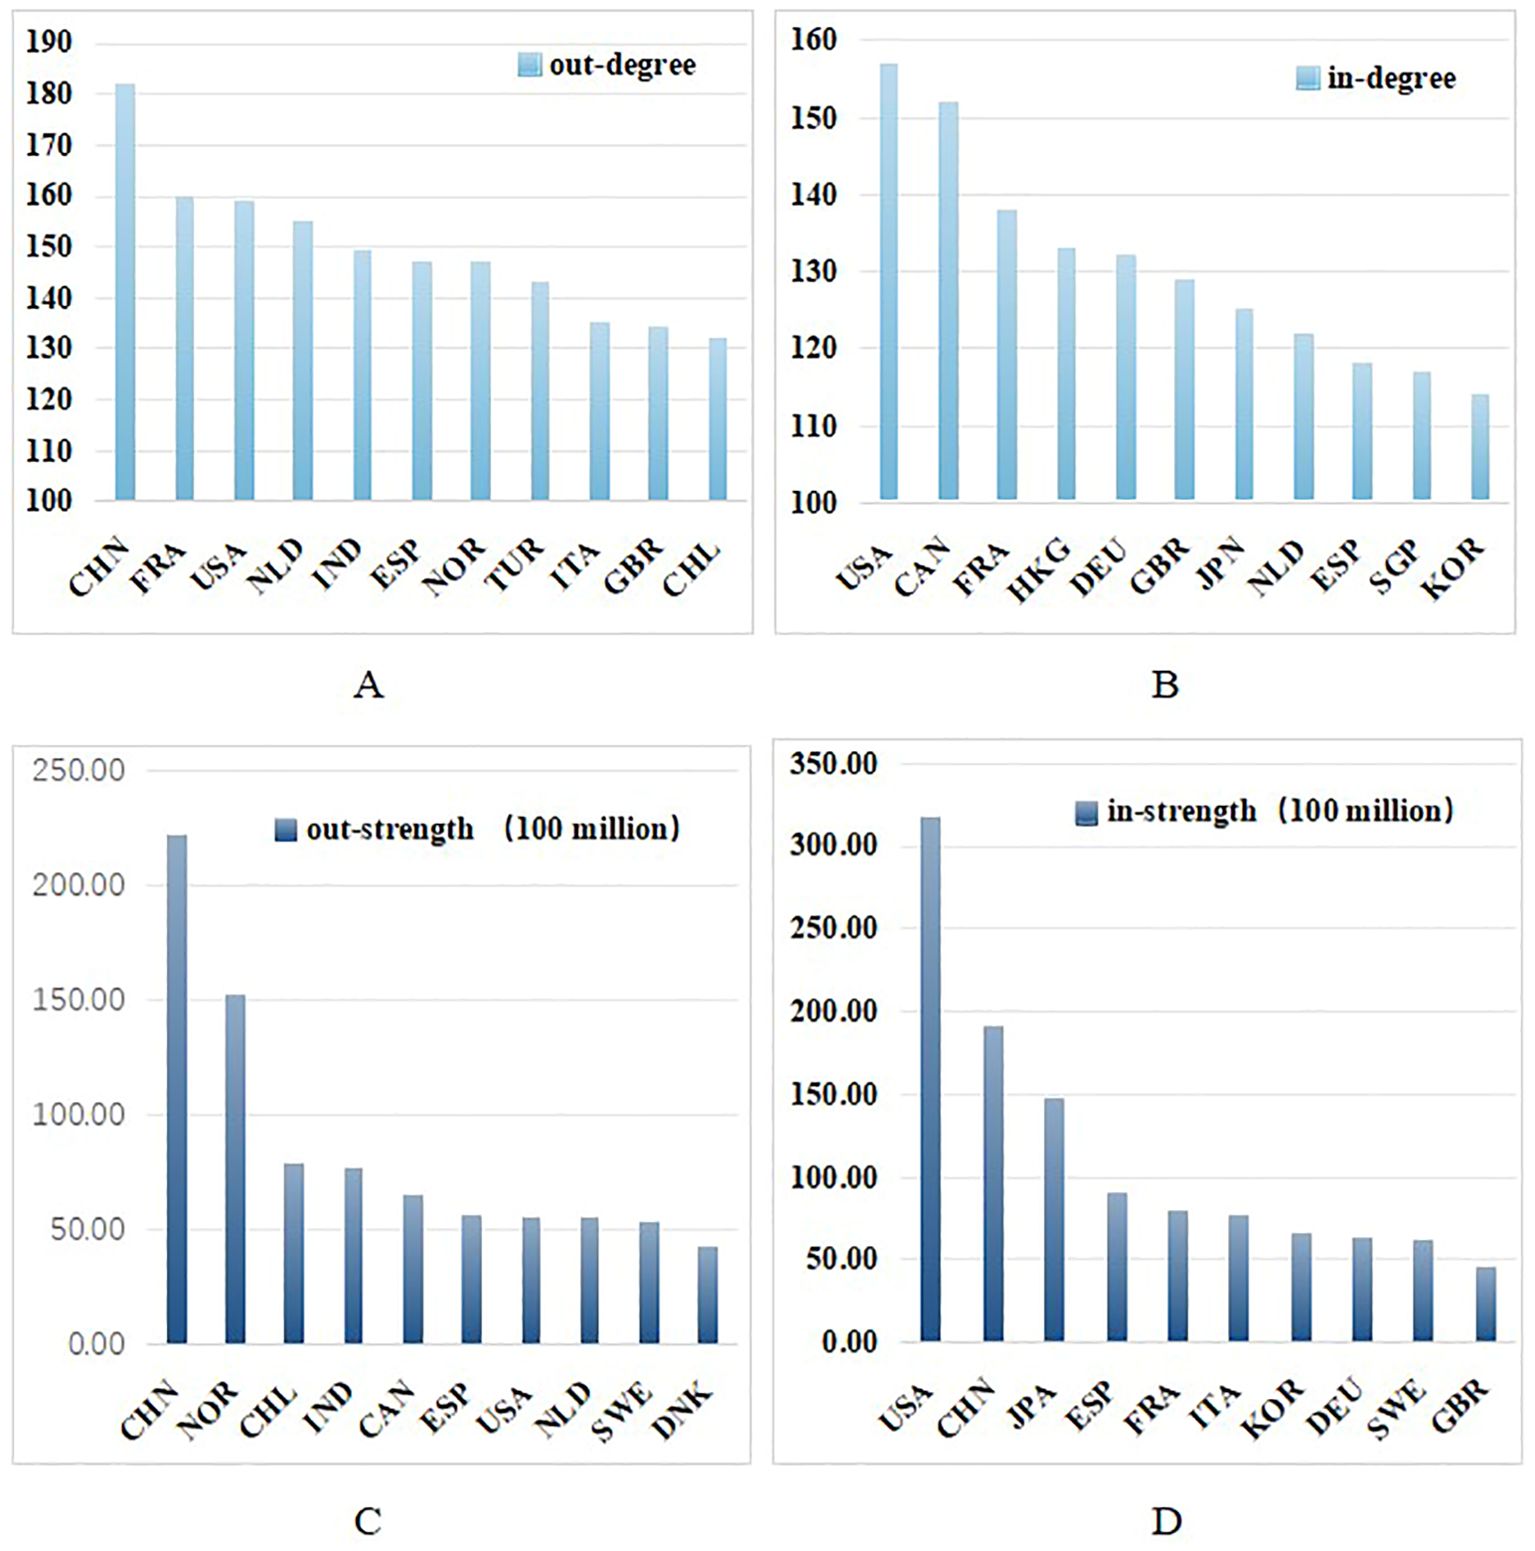
Figure 2. Top 10 countries in import and export of aquatic products in 2022. [(A) Top 10 countries with export connections; (B) Top 10 countries with import contacts; (C) Top 10 countries in terms of export value; (D) Top 10 countries in terms of import value].
As presented in Table 4, the betweenness centrality ranks highest for the Unted States, Canada, France, the Netherlands, and Germany while the Chinese Mainland and Hong Kong rank eight and fifteenth, respectively. These countries have a large amount of information flow in the global AQ trade network, and they are more likely to play the role of trade adjustment intermediary countries when trade changes. For reference, the United States’ highest ranked betweenness centrality is three times larger than Singapore, which ranks 12th.
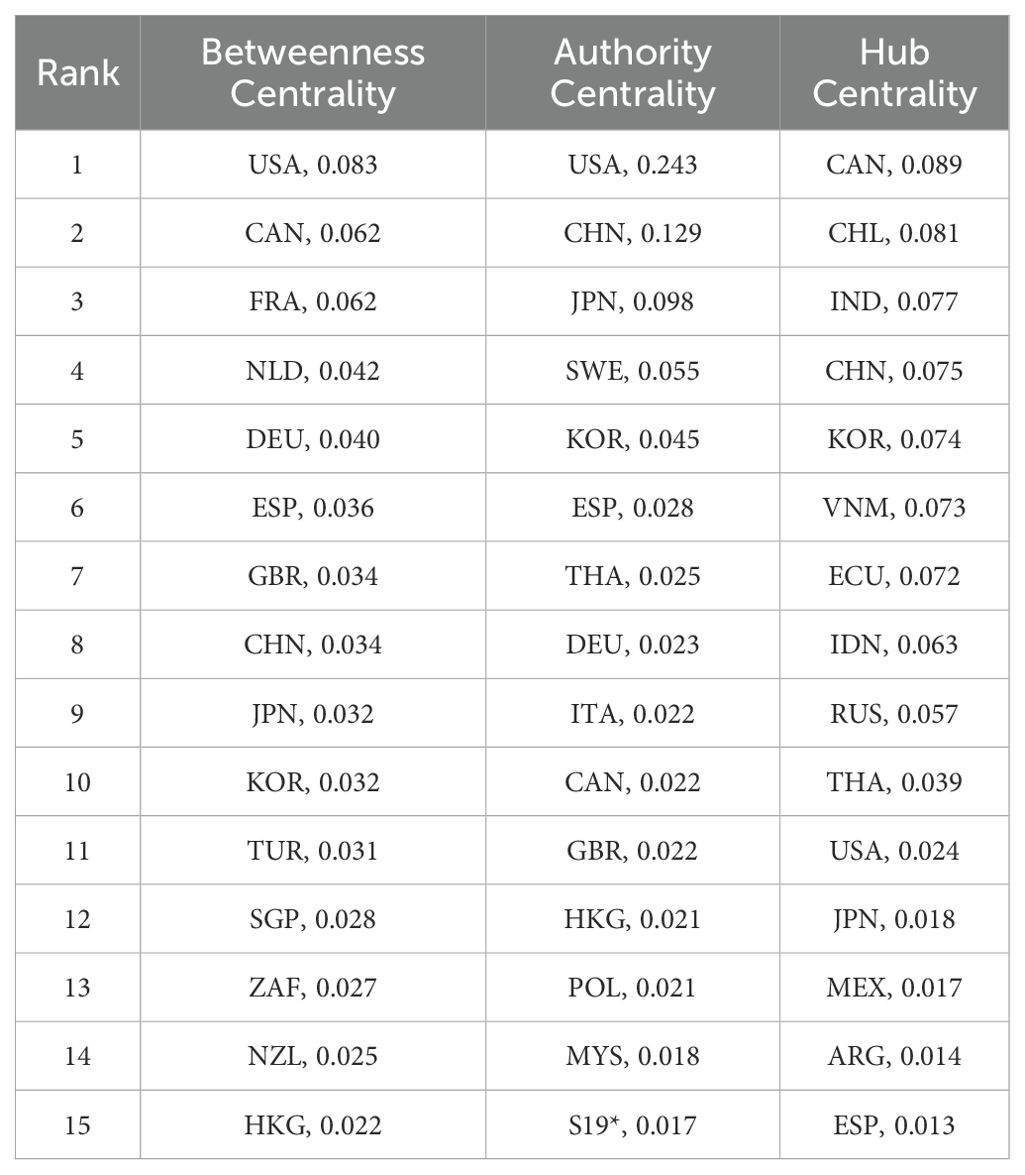
Table 4. Global core trading countries in 2022.
Regarding the supply and consumption status of AQ, the United States, Chinese Mainland, Japan and other regions are essential “consumers” of imports. They are not only big importers, but also the supply capacity of their import source countries is strong, and consumer demand is satisfied through robust supply linkages. Canada, Chile, India, Chinese Mainland and other regions are important exporters. Although Canada and Chile rank fifth and third in the global export share, they are in a special position because of their relationship with the United States. Although China’s export volume of AQs is large, it ranks third due to its exports are through relatively weak linkages to other countries. It confirms that weighted HITS authority and hub values can reflect the fact that the structure of the world trade network influences a node.The authoritative center value of the United States, at 0.243, is nearly ten times that of Germany. Although both countries are important consumer countries in the top ten globally, their importance and status differ significantly. Compared to others, the difference in central values among the top fifteen hub nodes is relatively small, indicating a greater disparity in the importance of consumption among each node.
4.2 Features of aquatic product trade network
Since the 21st century, ties between countries engaged in global AQ trade have been growing: from 8245 in 2000 to 10237 in 2018. After the outbreak of the COVID-19, the trade links of AQs have dropped sharply to 9724. After the outbreak of the Russia-Ukraine conflict in 2022, the trade links have again dropped significantly to 8424. It can be seen that the impact of the COVID-19 plus the Russia-Ukraine conflict has had a significant impact on the trade links of AQs (Jagtap et al., 2022). The results of the network tightness index also support the growing tightness of the trade network of AQs, but under the dual impact of COVID-19 and the Russia-Ukraine conflict, the links between nodes have become loose. From the perspective of the development of a network clustering coefficient, based solely on trade connections, global AQ trade continues to strengthen regional trade. However, considering the weight of trade volume, this trend was broken after 2018. The reversal of this development model may have been affected by the trade friction between China and the United States, and global AQ trade has shifted towards a direction of continuous globalization, which will continue to strengthen in 2021 and 2022. Therefore, to a certain extent, the trade network of AQs can be considered globalized when subjected to external shocks, when the trade clustering coefficient degree loosens (Table 5).
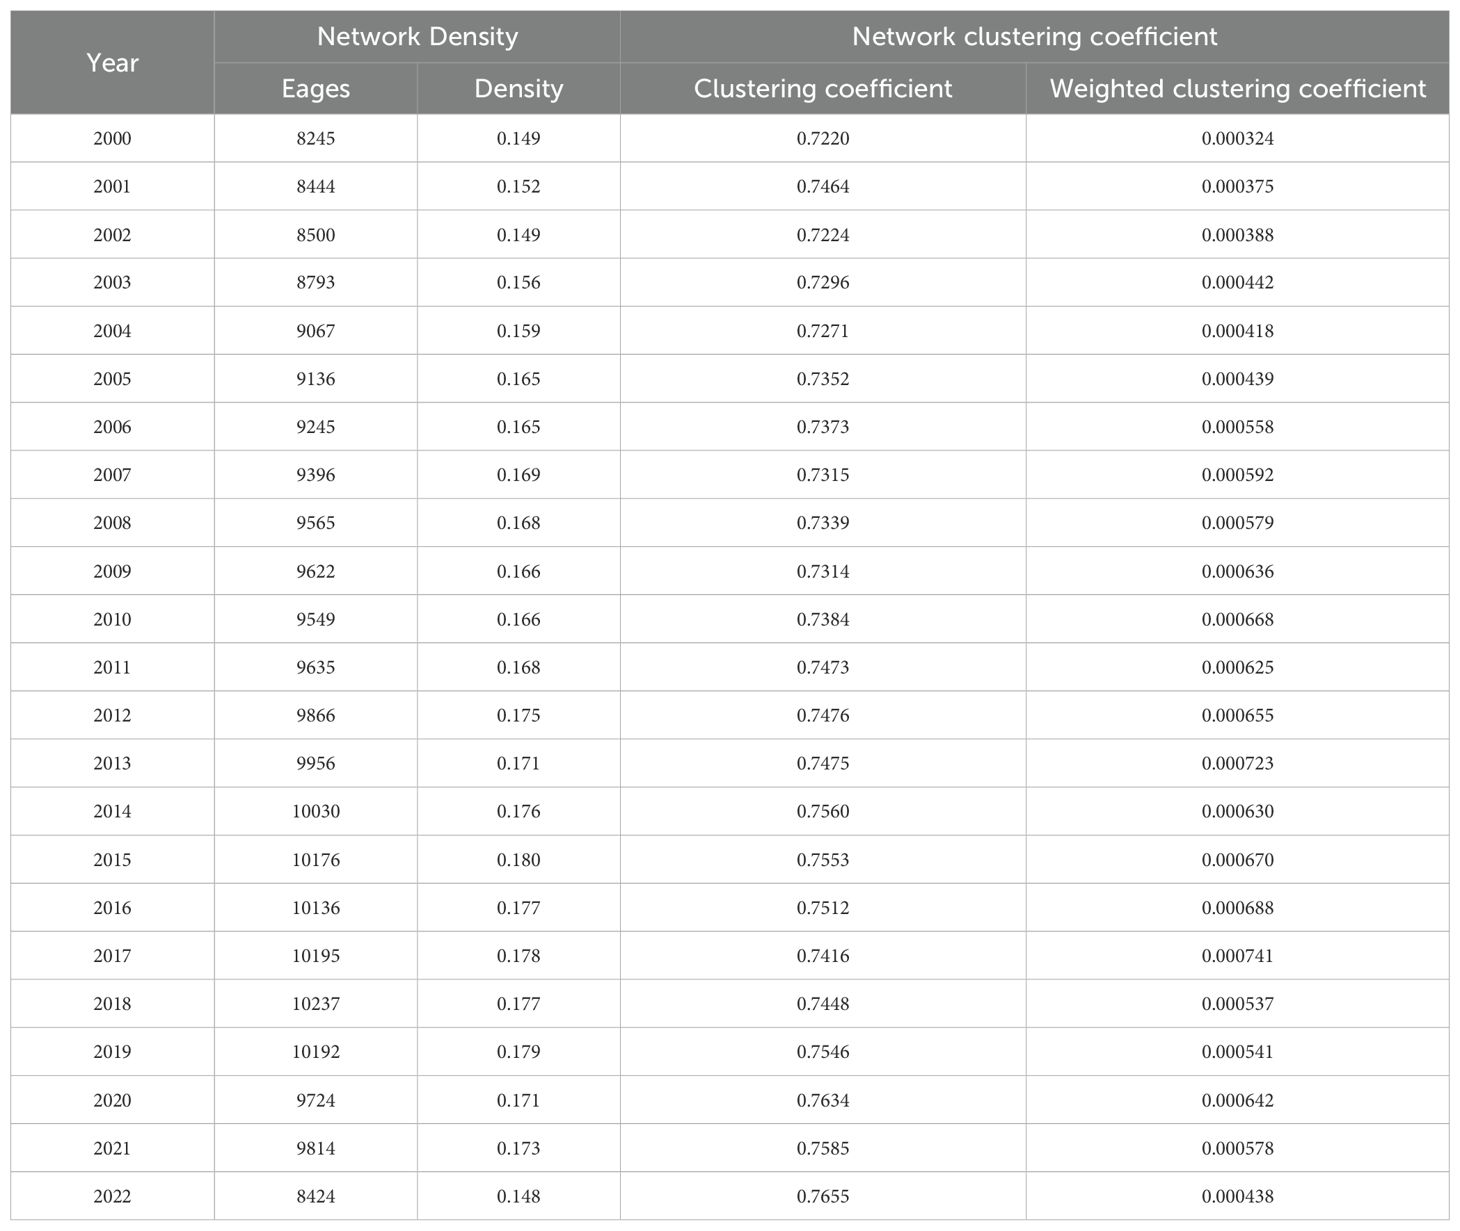
Table 5. Development Trend of Aquatic Product Trade Network.
4.3 Impact of nuclear wastewater discharge on global aquatic product trade
To highlight the changes in major trading countries and major trading relationships, this article retains the 2022 AQ trade network of the top 95% of trade flows, which includes 132 countries. In order to more accurately measure trade changes, the parameters β in Equation 12 are adjusted before simulation to obtain the trade flow between countries that are closest to the true trade under maximum entropy. This reduces the variation in transaction volume caused by the original maximum entropy of trade. Therefore, after calculating the maximum entropy value of the original data, the trade flow after maximizing entropy is used as the original data for analysis of transaction redistribution under different scenarios. Through regression analysis and comparison of bilateral trade relationships and β models, when β is 0.01 (with 10,000 iterations), the entropy maximization redistribution of trade relationships is closest to the true trade value (Figure 3).
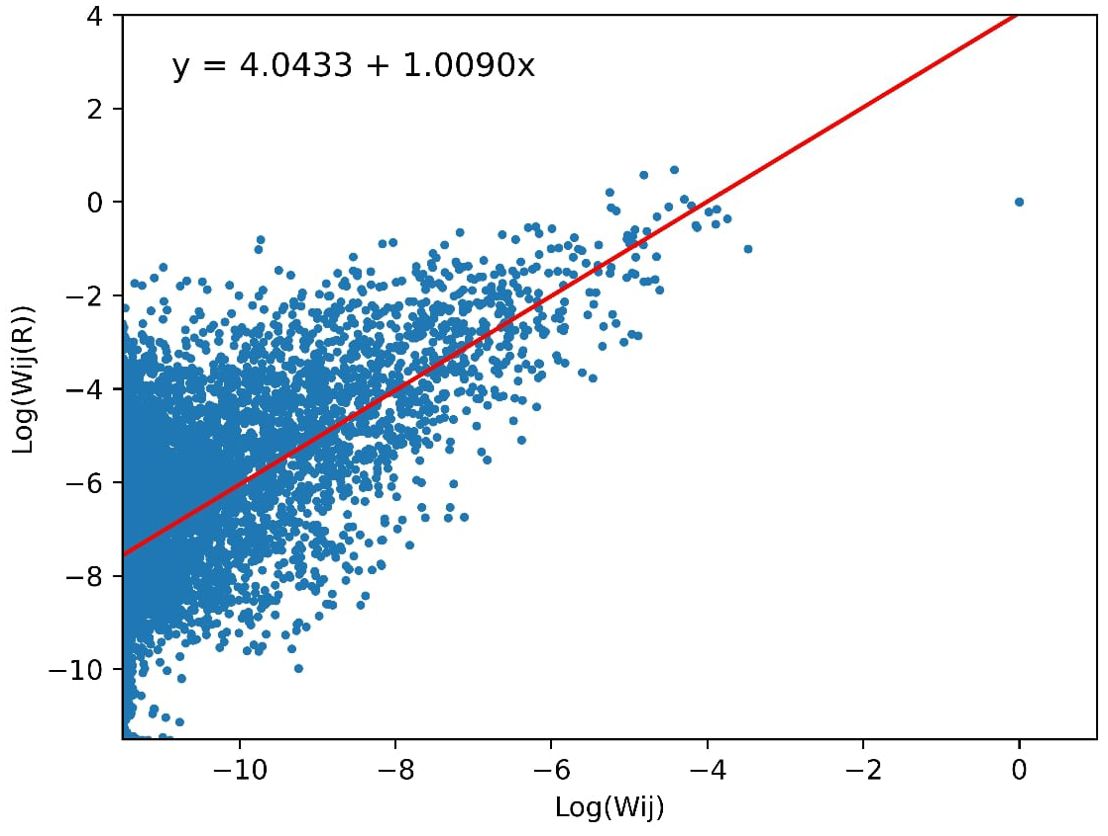
Figure 3. Scatter plot of actual trade volume and trade volume maximized by entropy in various countries.
Therefore, from a global perspective, based on the previously constructed AQ redistribution model, we can obtain the optimal redistribution strategy for global AQ trade after any country experiences supply risks or inter-state changes in trade levels. This article takes the practical impact of China’s comprehensive suspension of imports of Japanese AQs, as well as the scenario impact of the proportion of marine AQs in the AQs of major trading countries on supply, correspondingly reducing exports, and further analyzing the short- and long-term effects on the production of AQs in various countries as an example, to analyze how to redistribute global AQs to reduce losses caused by risks (Chang et al., 2024).
4.3.1 China bans the trade reallocation of Japanese aquatic products import
China’s unilateral ban on Japanese AQ imports, implemented in 2023, can be viewed as a lower bound on trade impacts stemming from NW discharges. In 2022, the Chinese Mainland, Hong Kong and Macao imported US $109 million of AQs from Japan, accounting for only 4.50% of China’s total AQ imports and 37.69% of Japanese AQs, the maximum entropy model estimated that global trade volume of AQs decreased by 0.62%, and national trade patterns will remain basically unchanged. Comparing the results to Figure 2d, decrease in import volume presented in Table 6 are consistent with the weighted import rankings. From a global perspective, the AQ trade market avoids the chaos caused by concentrated supply gaps (Liang et al., 2024). Under this scenario, the trade of AQs after redistribution is relatively stable.
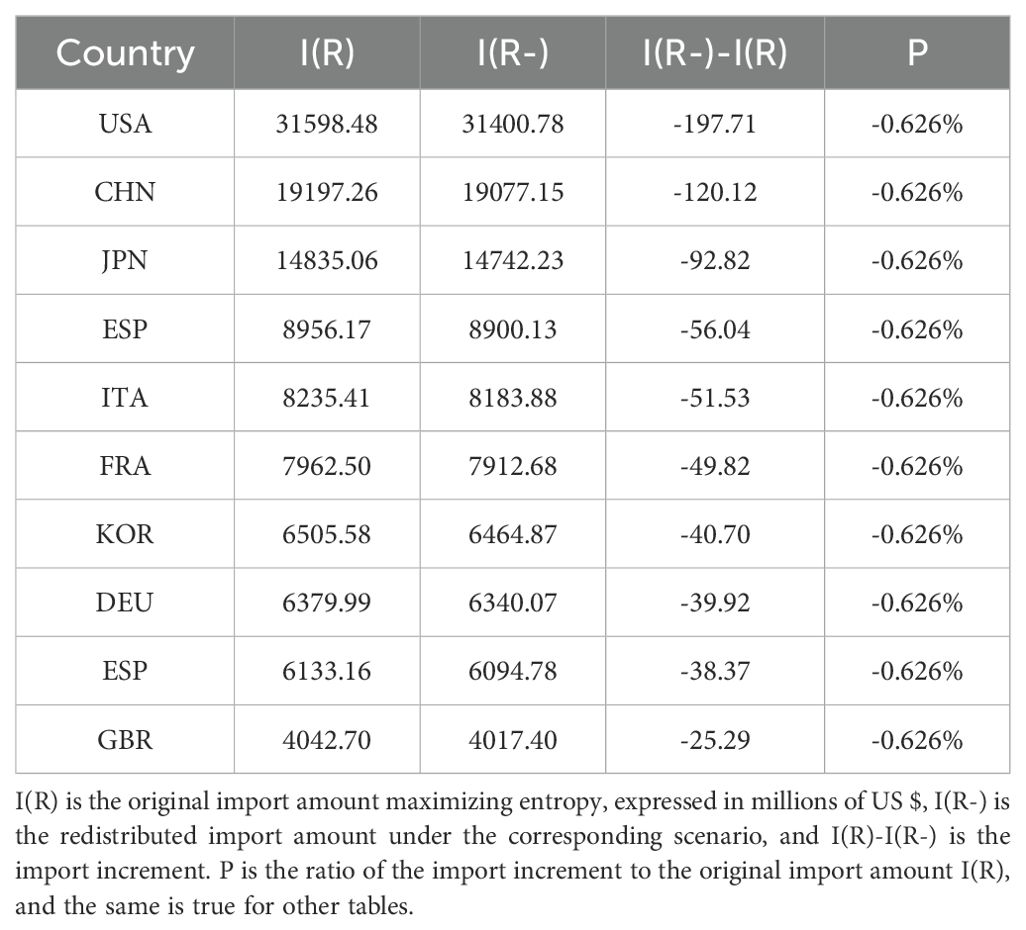
Table 6. Top 10 countries with decreased import volume after China banned the import of Japanese aquatic products (Million US $).
As presented in Table 7, after banning the import of Japanese AQs, China will increase its imports from Norway, Vietnam, Chile, Germany, Russia and India, with the increase accounting for about 1.3% of the original import volume.
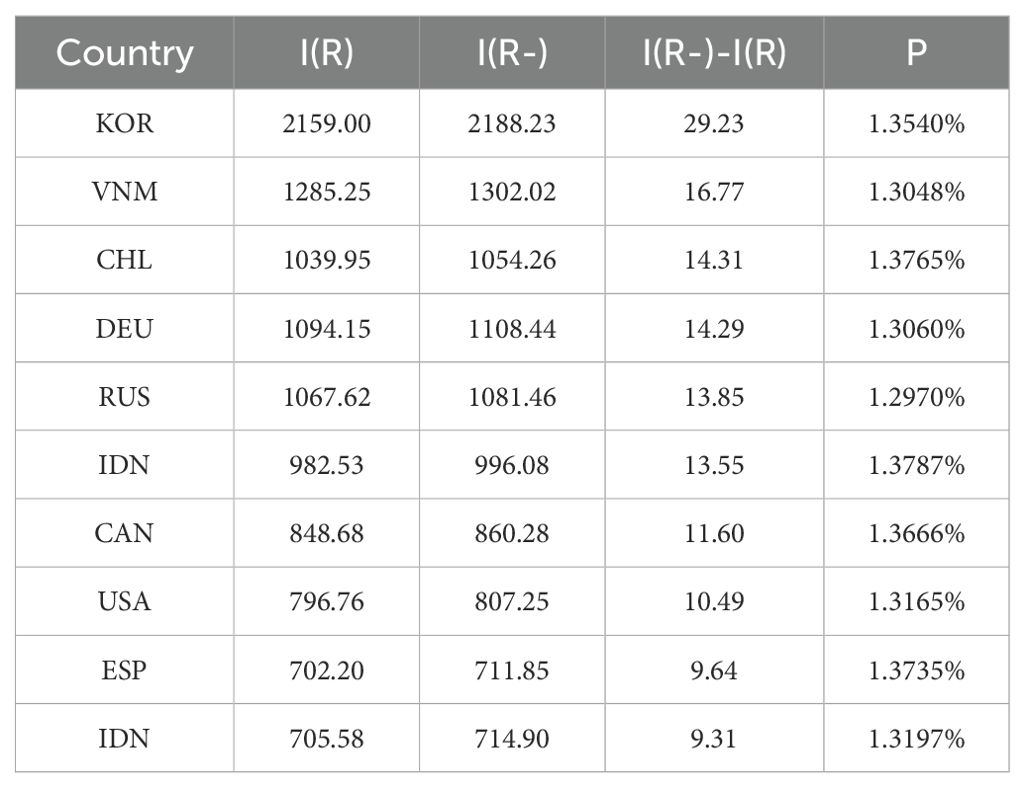
Table 7. Increase in import from other countries after China bans import of Japanese AQs (Million US $).
4.3.2 Short-term scenario impact
The short-term simulation indicates that the biggest decrease in imports will be in the Chinese Mainland, with the import volume decreasing by 1403.39 million US $, accounting for 7.31% of the original total import volume, followed by the United States, Japan, South Korea, and Hong Kong, with the import volume decreasing by 1310.19 million US $, 1046.47 million US $, 721.80 million US $ and 614.70 million US $, accounting for 4.15%, 7.05%, 11.10% and 17.65% of the original total import volume respectively (Table 8).
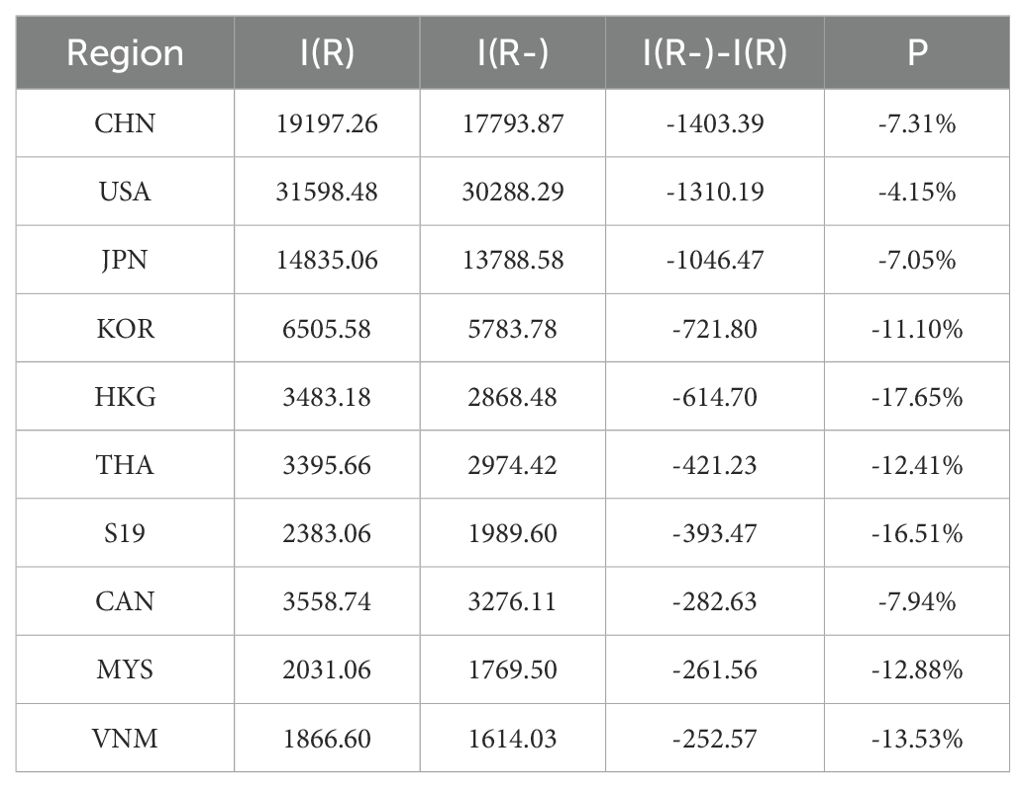
Table 8. Top 10 Countries or Regions with the Most Reduced Imports (S1) (Million US $).
The import reduction, as a proportion of the total original imports, characterizes the degree to which a node is affected by NW. The three nodes with the highest proportional reduction, Tanzania, Fiji, and Rwanda, are all small countries facing reductions of more than 18%, with Tanzania especially impacted at a 44.44% reduction. Hong Kong and Macao ranked fourth and ninth, respectively (Table 9).
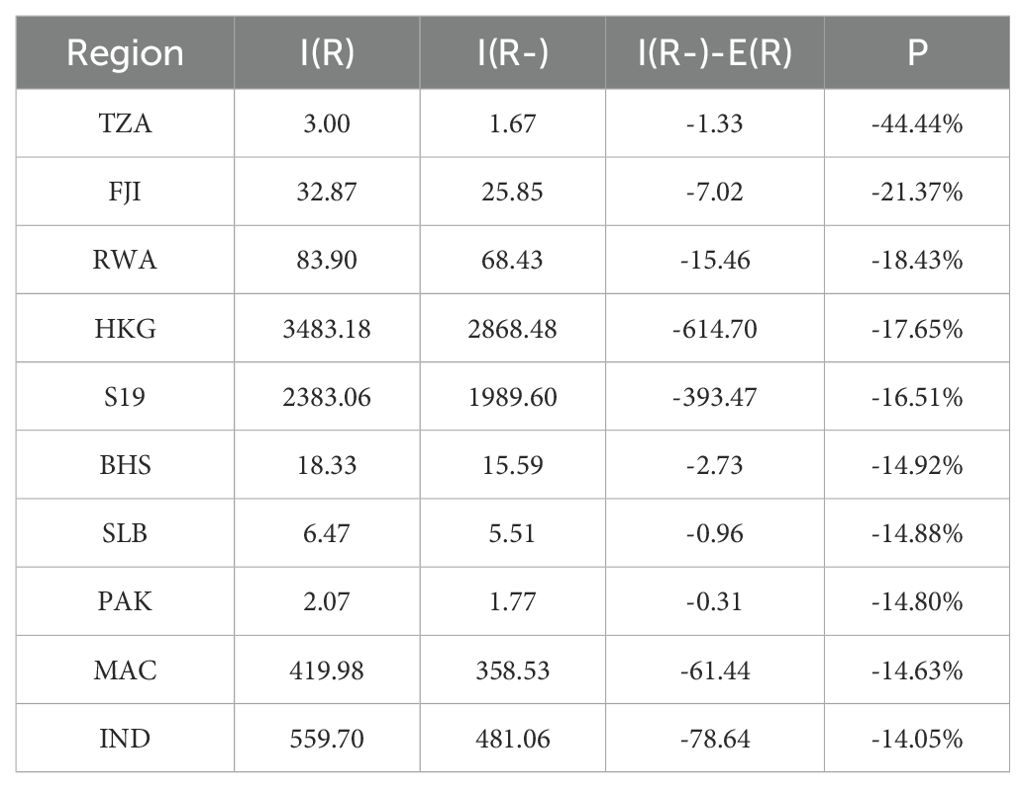
Table 9. Top 10 countries with the largest reduction in import volume (S1) (Million US $).
As shown in Table 10, Chinese Mainland, Hong Kong and Macao are subject to different degrees of import reductions across source nodes. For the Chinese mainland, banning Japanese imports reduces imports from major sources (original import volume more than US $5 million), including Hong Kong, South Korea, Russia, and the United States by more than 20%. Unlike Chinese Mainland, Hong Kong’s imports from Thailand, Indonesia, and Vietnam have decreased by over 10%; Malaysia, Norway, and Australia also influence the changes in the import structure of Macau.
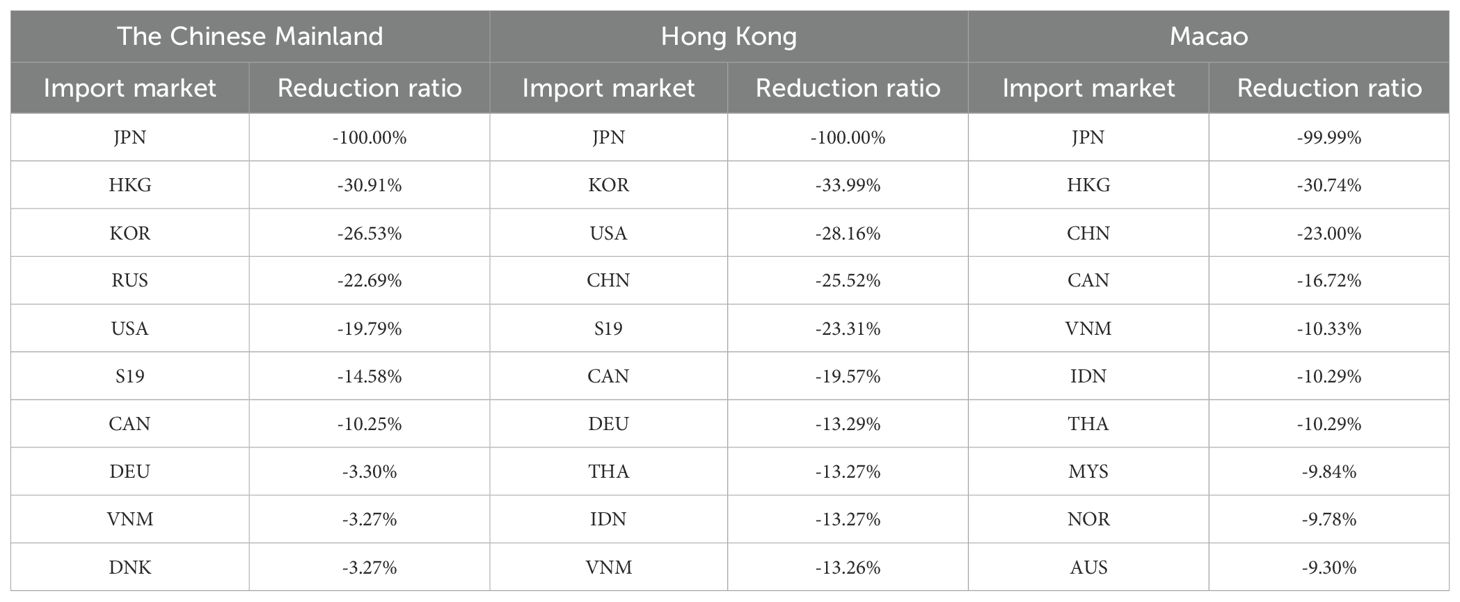
Table 10. Structure of China’s import reduction (S1).
4.3.3 Long-term impact results
As time goes by, the entire Pacific will be affected. Different from the ST impacts, the United States faces the largest reduction in imports under the LT simulation, with a US $2521.93 million decrease accounting for 7.98% of total original imports. The Chinese mainland, Japan, South Korea, Hong Kong and other regions in China continue to face significant reductions in imports of over US $1930.67 million, US $1068.59 million, US $614.88 million and US $564.10 million, respectively, accounting for 10.06%, 7.20%, 9.45% and 16.20% of the original total imports (see Table 11). Under the short-term impact, the import shortages in Chinese Mainland and Hong Kong decreased by $140.39 million and $614.70 million, respectively. Under the long-term impact, the import shortages were $1930.67 million and $564.10 million, far below the further decrease in imports into the United States.
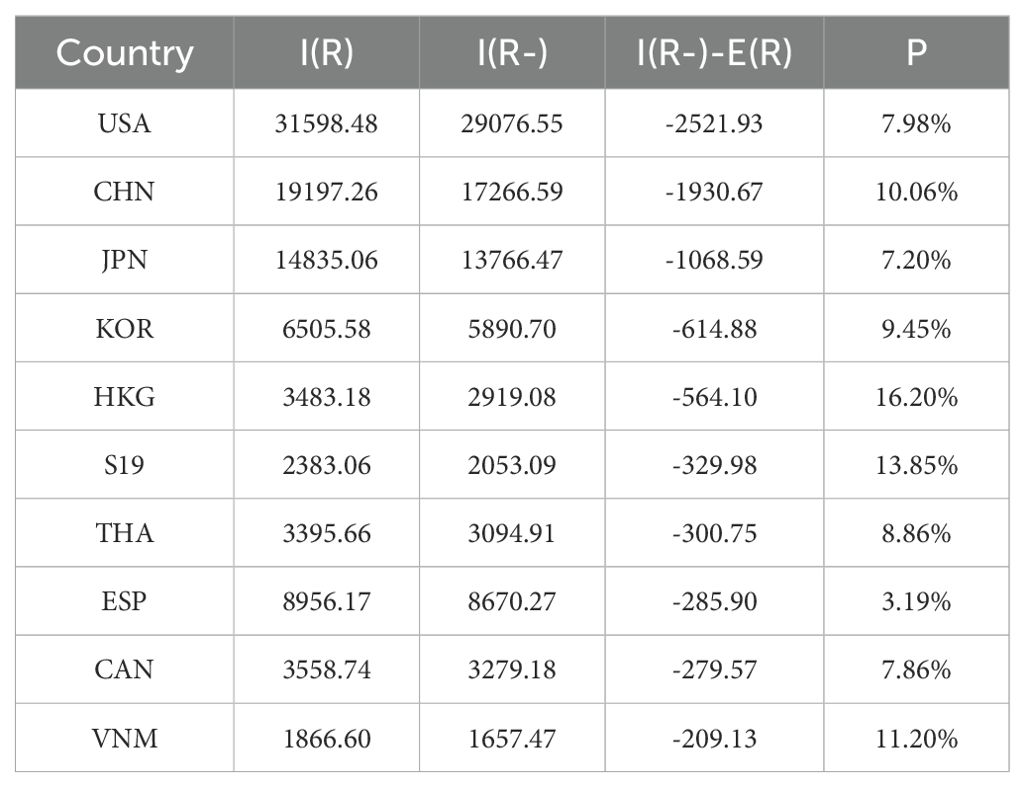
Table 11. Top 10 countries with the largest reduction in imports (S2) (Million US $).
In terms of the degree of reduction, Tanzania, Fiji, Hong Kong and Rwanda still have the highest proportional decrease of imports in in the world. However, the proportion of the reduction is lower than the proportion of short-term impact. In addition, unlike the ST simulation, Argentina, Singapore, and Vietnam face steeper declines in imports of AQs under the LT scenario, with a decrease of 12.75%, 12.60%, and 11.20%, respectively (see Table 12).
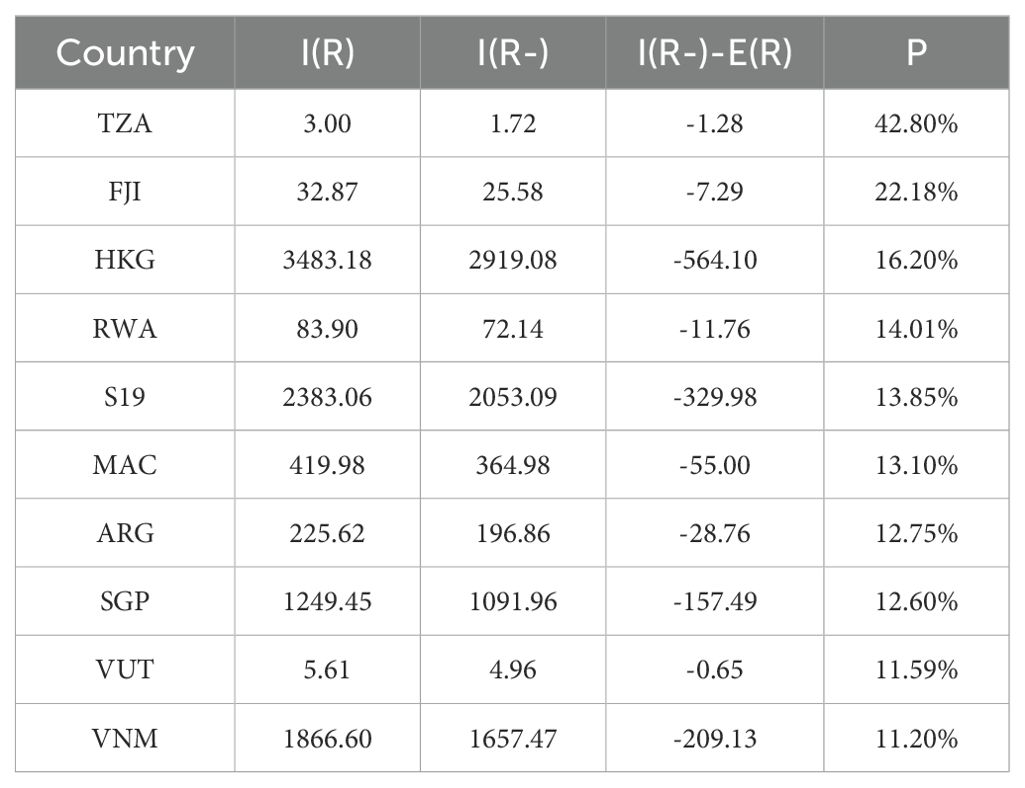
Table 12. Top 10 countries with the largest reduction in import volume (S2) (Million US $).
As shown in Table 13, under the long-term impact of NW discharge, the degree of node reduction of China’s main import sources (original import volume more than US $5 million) has also changed. The reduction of AQ imports from New Zealand, Chile, Peru and the Philippines to China will further expand, and the reduction of trade flows between Chinese Mainland, Hong Kong and Macao will be alleviated.
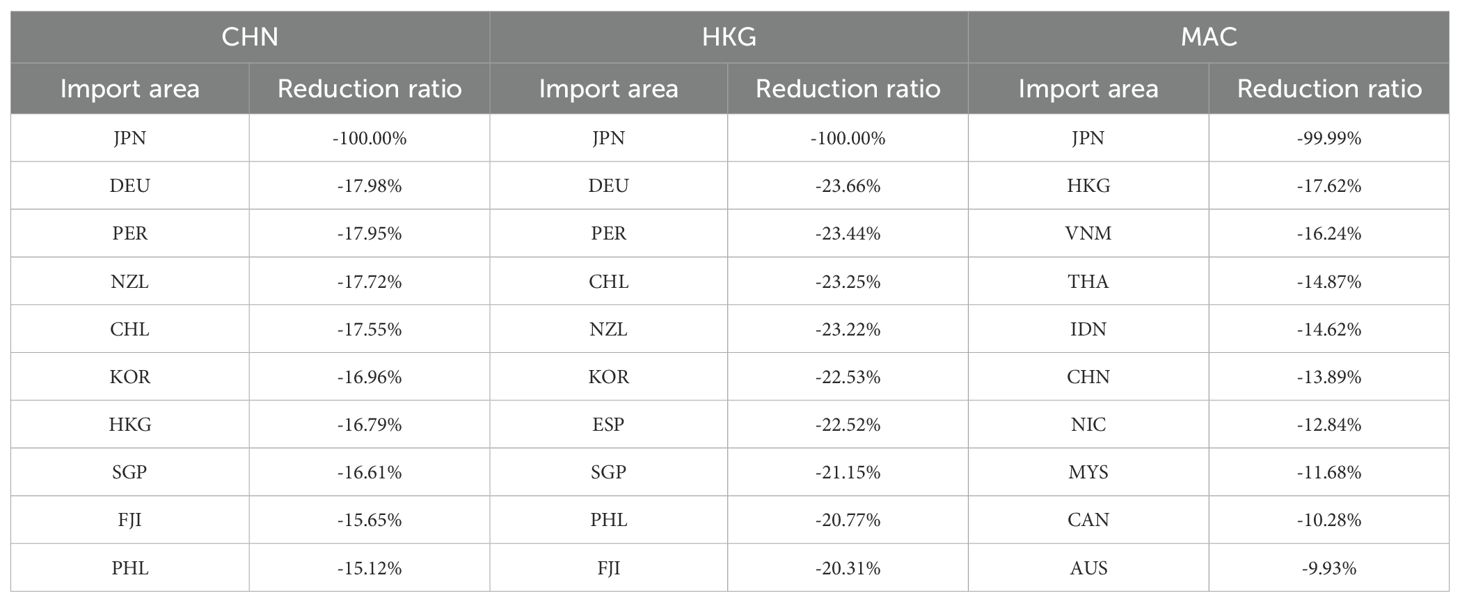
Table 13. Structure of China’s import reduction (S2).
Globally, countries with import reductions exceeding 10% of total original imports in both the ST and LT simulations are mostly small importers (see Figure 4 below). In terms of the reduction ratio, small countries with low consumption of AQs are relatively more severely affected by the discharge of NW.
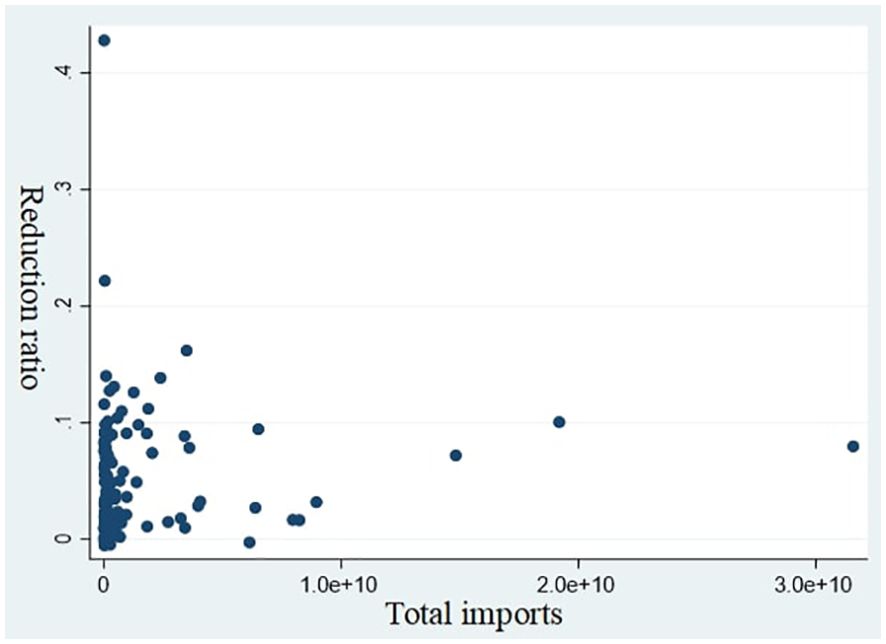
Figure 4. Scatterplot of the imports reduction percentage in relation to the total imports at each node for S1 and S2.
5 Conclusion
Since the 21st century, the global AQ trade network has expanded rapidly, with increasing connectivity among countries. The network’s structure has evolved toward a more community-like formation, where tightly connected subgroups of countries engage in more intensive trade among themselves. The discharge of Japan’s NW will affect both major trading countries of AQs and small trading countries.
Faced with Japan’s discharge of NW, China’s ban on importing Japanese aquatic products is a basic fact that has already occurred. The maximum entropy model estimates that China’s restrictive measures will lead to a 0.62% decrease in global AQ trade volume, and the national trade pattern will remain basically unchanged. Under further assumptions, the production of marine fisheries in over 60 countries or regions will be affected by Japan and sewage discharge, and the trade pattern of AQs has been forced to adjust. Under the assumed ST (three years) simulation, the export of AQs in the Chinese Mainland decreased the most, followed by Japan, Russia, and the United States. The largest decrease in imports is also in the Chinese Mainland, followed by the United States, Japan, South Korea and Hong Kong, while the largest decrease in imports is in Tanzania, Fiji and Rwanda. In the long run, the global supply of seafood is projected to decrease by US $10476.68 million. Different from the ST simulation, Japan’s exports are expected to decrease the most under the LT (ten years) simulation, followed by Chinese Mainland, Chile and Germany. In terms of imports, the United States is projected to experience the largest decline, while Chinese Mainland, Japan, South Korea and Hong Kong are still the regions where the import volume decreases significantly. Moreover, under the LT simulation of NW discharge, Argentina, Singapore and Vietnam’s imports of AQs will decline more steeply than in the ST scenario. Whether in the long or short term, countries with a reduction in imports accounting for more than 10% of their original total imports are mostly small importing countries, which are relatively more severely impacted. It is important to note that these projections represent just one of many possible outcomes. The actual long-term trade impacts will depend on a variety of factors.
The conclusions above are subject to significant situational assumptions, and there is a lack of precise scientific research on negative public opinion and actual reduced consumption. Moreover, they do not take into account the economic capacity and consumption expectations of various countries, and may differ from the actual impact. However, if consumers reduce their consumption of AQs in areas affected by pollutants, it will inevitably have an impact on the areas covered by pollutants. In this regard, the monitoring of marine pollution discharges by international institutions, along with mechanisms to mitigate any ensuing damages, should be expanded in the future. In addition, inspection systems should be strengthened to prevent public consumption of contaminated seafood.
6 Policy implications
This study offers significant recommendations and policy implications for future research or policymakers engaged in global seafood trade and environmental management. Based on the research findings, this article proposes the following suggestions and recommendations: To ensure fair and effective monitoring of ocean contamination, a strengthened multi-pronged approach is necessary. Existing international institutions, such as the International Atomic Energy Agency (IAEA) and the Food and Agriculture Organization (FAO), already play key roles in monitoring radiation levels and seafood safety. Enhancing their cooperation with national agencies and regional bodies could improve real-time data-sharing, joint inspections, and legal enforcement mechanisms. One potential avenue is the establishment of a Pacific Ocean Seafood Safety Coalition (POSSC), comprising countries engaged in marine fishing or aquaculture in the Pacific Ocean, such as Indonesia, Peru, Vietnam, the United States, the Philippines, and South Korea. This coalition could complement existing efforts by focusing on regional coordination of monitoring efforts and data transparency. Additionally, reinforcing international agreements such as the United Nations Convention on the Law of the Sea (UNCLOS) could provide a stronger legal framework for addressing marine pollution concerns. Any amendments should balance environmental accountability with the economic realities of global seafood trade. From a regulatory perspective, existing trade mechanisms, including World Trade Organization (WTO) dispute resolution processes, provide avenues for nations to protect their citizens from potentially harmful imports and seek compensation when necessary. Countries can also implement voluntary trade-based enforcement mechanisms, such as industry-led certification programs or enhanced transparency in seafood sourcing, which could help address consumer concerns about contamination risks. A key step toward stronger environmental governance is enhancing international monitoring capabilities. The International Atomic Energy Agency (IAEA), in collaboration with the FAO, already conducts seafood radiation testing and monitoring. Expanding these initiatives to include standardized radiation testing protocols for seafood exports could further improve confidence in global seafood safety. Additionally, greater transparency in public reporting of monitoring results—potentially through the UN Environment Programme (UNEP) or other international bodies—could strengthen trust in seafood trade. Beyond regulatory measures, public perception and market dynamics also play a role. Even when scientific assessments deem seafood safe, consumer concerns may persist, influencing trade patterns. This could lead to market-driven adjustments, such as increased demand for sustainability certifications or stricter traceability requirements. As consumer preferences evolve, trade agreements will need to incorporate environmental and sustainability considerations, balancing scientific assessments, regulatory measures, and market confidence to ensure long-term stability in global seafood trade. Ultimately, global seafood trade must adapt to the broader challenge of ocean pollution by integrating scientific monitoring, international legal frameworks, and sustainable trade practices.
7 Limitations of the study and recommendations for future research
The current study faced some limitations that might affect the interpretation of findings, such as the model’s assumptions being too broad and difficult to incorporate too many practical measures. Moreover, the data used is based on (2000-2022) and during this period COVID-19 has impacts on global trade as well as the negative impacts of the current geopolitical conflicts such as ongoing Russia-Ukraine conflict and its impacts on the trade of seafood. The research does not fully account for ongoing geopolitical shifts, such as the U.S.-China trade war, which has played a significant role in reshaping global trade patterns. Given Japan’s strong alliance with the United States, there is potential for Japan to redirect a portion of its seafood exports to the U.S. or other alternative markets to offset the losses caused by China’s import ban. Furthermore, geopolitical tensions may influence trade policies, including tariff adjustments, trade agreements, or government subsidies aimed at stabilizing Japan’s seafood sector. Historical trade adjustments suggest that when facing trade restrictions from China, countries have often sought new export destinations. For example, during the U.S.-China trade war, U.S. soybean exports shifted to other markets, such as the EU and Southeast Asia, to mitigate losses. A similar pattern could emerge in Japan’s seafood trade, with Japan increasing seafood exports to the U.S. and potentially strengthening partnerships with countries in Europe and Southeast Asia. Future research should incorporate these evolving trade relations. In the future, other proposed strategies for addressing these negative impacts on the seafood global value chain (supply, demand and prices) should receive more investigation and analysis, which are crucial for environmental and economist researchers and policymakers to understand these dynamic impacts on the stakeholders and consumers to be able to minimize the impacts of contaminated water on the environment and international trade of seafood. Future studies should consider the broader socio-economic implications of ocean contamination including discussing the potential impacts on employment, local economies, or food security in affected regions. By focusing on other related aspects, future studies are essential for a comprehensive understanding of the issue to a wider audience, including policymakers, industry leaders, and community stakeholders.
Data availability statement
The raw data supporting the conclusions of this article will be made available by the authors, without undue reservation.
Author contributions
LC: Conceptualization, Data curation, Formal Analysis, Investigation, Methodology, Software, Validation, Visualization, Writing – original draft, Writing – review & editing. YZ: Conceptualization, Data curation, Formal Analysis, Investigation, Methodology, Software, Validation, Visualization, Writing – original draft, Writing – review & editing. YT: Conceptualization, Formal Analysis, Funding acquisition, Methodology, Project administration, Resources, Supervision, Validation, Visualization, Writing – original draft, Writing – review & editing. AA: Conceptualization, Data curation, Formal Analysis, Investigation, Methodology, Software, Supervision, Validation, Visualization, Writing – original draft, Writing – review & editing.
Funding
The author(s) declare that financial support was received for the research and/or publication of this article. This paper is the initial results of The National Natural Science Foundation of China, Project: The Economic Transformation and the Development of Regional Agricultural Products Value Chain of ASEAN and China (71961147002) and the Major Projects of the National Social Science Foundation of China, project: Research on the paths and policies to ensure the stable and safe supply of grain and important agricultural products (23&ZD121).
Acknowledgments
We thank to the reviewers for their valuable help in improving the manuscript.
Conflict of interest
The authors declare that the research was conducted in the absence of any commercial or financial relationships that could be constructed as a potential conflict of interest.
Generative AI statement
The author(s) declare that no Generative AI was used in the creation of this manuscript.
Publisher’s note
All claims expressed in this article are solely those of the authors and do not necessarily represent those of their affiliated organizations, or those of the publisher, the editors and the reviewers. Any product that may be evaluated in this article, or claim that may be made by its manufacturer, is not guaranteed or endorsed by the publisher.
Footnotes
- ^ Greenpeace East Asia. "A Quick Read on the radioactive water in Fukushima-What makes it different." 2021, https://www.greenpeace.org/eastasia/blog/6540/a-quick-read-on-the-radioactive-water-in-fukushima-what-makes-it-different/.
- ^ Ngo-Hoang, Dai-Long, Introduce the Negative Influence in Vietnam if Japan Discharges the Nuclear Sewage to Pacific (June 4, 2021). Available at SSRN: https://ssrn.com/abstract=3867877 .
- ^ The Paper, https://www.thepaper.cn/newsDetail_forward_24340202 , Accessed 14 May 2024.
- ^ The star, https://asianews.network/malaysias-health-ministry-to-inspect-high-risk-food-products-imported-from-japan/#:~:text=PETALING%20JAYA%20%E2%80%93%20The%20Health%20Ministry,Dr%20Muhammad%20Radzi%20Abu%20Hassan . Accessed 14 May 2024.
- ^ Nevada Public Radio, https://www.npr.org/2023/07/09/1186677021/japan-fukushima-nuclear-plant-wastewater-release , Accessed 14 May 2024.
- ^ “The definition of the region refers to the main fishing areas classified by the FAO”. https://www.fao.org/cwp-on-fishery-statistics/handbook/general-concepts/main-water-areas/en/
References
Allard A., Serrano M.Á., García-Pérez G., Boguñá M. (2017). The geometric nature of weights in real complex networks. Nat. Commun. 8, 14103. doi: 10.1038/ncomms14103
An L., Grimm V., Sullivan A., Turner B. II, Malleson N., Heppenstall A., et al. (2021). Challenges, tasks, and opportunities in modeling agent-based complex systems. Ecol. Model. 457, 109685. doi: 10.1016/j.ecolmodel.2021.109685
Brandes U. (2001). A faster algorithm for betweenness centrality. J. Math. sociology 25, 163–177. doi: 10.1080/0022250X.2001.9990249
Breiman L. (1995). Better subset regression using the nonnegative garrote. Technometrics 37, 373–384. doi: 10.1080/00401706.1995.10484371
Buesseler K. O. (2012). Fishing for answers off Fukushima. Science 338, 480–482. doi: 10.1126/science.1228250
Chang Y.-C., Zhao X., Jian A., Tan Y. (2024). Frontier issues in international ocean governance: Japan’s discharge of nuclear contaminated water into the sea. Mar. pollut. Bull. 198, 115853. doi: 10.1016/j.marpolbul.2023.115853
Chen X., Qi X. (2022). Reflections on international dispute settlement mechanisms for the Fukushima contaminated water discharge. Ocean & Coastal Management 226, 106278.
Cimini G., Squartini T., Saracco F., Garlaschelli D., Gabrielli A., Caldarelli G. (2019). The statistical physics of real-world networks. Nat. Rev. Phys. 1, 58. doi: 10.1038/s42254-018-0002-6
Dharmadji J. S., Prasetyo Y. T., Daniel A., Lin H. M., Cahigas M. M. L., Nadlifatin R., et al. (2024). Willingness to eat seafood among Taiwanese after the 2023 Fukushima radioactive water release: An extended Theory of Planned Behavior approach. Nuclear Engineering and Technology, 103282.
Dadakas D., Stavroula T. (2021). Global agricultural trade impact of the 2011 triple disaster in Japan: a gravity approach. Australian J Agricultural and Resource Economics 65 (4), 937-72.
Deguchi T., Takahashi K., Takayasu H., Takayasu M. (2014). Hubs and authorities in the world trade network using a weighted HITS algorithm. PloS One 9, e100338. doi: 10.1371/journal.pone.0100338
Di Vece M., Garlaschelli D., Squartini T. (2022). Gravity models of networks: integrating maximum-entropy and econometric approaches. Phys. Rev. Res. 4, 033105. doi: 10.1103/PhysRevResearch.4.033105
Fu B., Heran L. (2024). Marine environmental governance for nuclear pollution: from the perspective of China's response to Japan's Fukushima nuclear wastewater discharge. Marine Policy 167, 106242.
Gephart J. A., Pace M. L. (2015). Structure and evolution of the global seafood trade network. Environ. Res. Lett. 10, 125014. doi: 10.1088/1748-9326/10/12/125014
Gutiérrez-Moya E., Adenso-Díaz B., Lozano S. (2021). Analysis and vulnerability of the international wheat trade network. Food Secur. 13, 113–128. doi: 10.1007/s12571-020-01117-9
Hai G.-J. (2021). “New impacts and countermeasures of nuclear waste water discharge from Japan on China’s aquatic products trade,” in Book New impacts and countermeasures of nuclear waste water discharge from Japan on China’s aquatic products trade (Les Ulis, France: EDP Sciences), 02033.
Hastie T., Tibshirani R., Friedman J. H., Friedman J. H. (2009). The elements of statistical learning: data mining, inference, and prediction (New York: Springer).
Ikeda Y., Watanabe T. (2017). “Who buys what, where: Reconstruction of the international trade flows by commodity and industry,” in Book Who buys what, where: Reconstruction of the international trade flows by commodity and industry (Cham: Springer), 657–670.
Jagtap S., Trollman H., Trollman F., Garcia-Garcia G., Parra-López C., Duong L., et al. (2022). The Russia-Ukraine conflict: Its implications for the global food supply chains. Foods 11, 2098. doi: 10.3390/foods11142098
Kleinberg J. M. (1999). Authoritative sources in a hyperlinked environment. J. ACM (JACM) 46, 604–632. doi: 10.1145/324133.324140
Koo Y.-H., Yang Y.-S., Song K.-W. (2014). Radioactivity release from the Fukushima accident and its consequences: A review. Prog. Nucl. Energy 74, 61–70. doi: 10.1016/j.pnucene.2014.02.013
Kosztyán Z. T., Kiss D., Fehérvölgyi B. (2024). Trade network dynamics in a globalized environment and on the edge of crises. J. Cleaner Production 465, 142699. doi: 10.1016/j.jclepro.2024.142699
Landrigan P. J., Stegeman J. J., Fleming L. E., Allemand D., Anderson D. M., Backer L. C., et al. (2020). Human health and ocean pollution. Ann. Global Health 86, 151. doi: 10.5334/aogh.2831
Li G., Li Z. (2022). “Reaction of Japanese media to discharging Fukushima nuclear waste water into ocean and the analysis—taking relevant reports of Japanese media as examples,” in Book Reaction of Japanese media to discharging Fukushima nuclear waste water into ocean and the analysis—taking relevant reports of Japanese media as examples (IOP Publishing), 012004.
Liang X., Yang S., Lou Z., Ali A. (2024). The impact of Japan’s discharge of Nuclear-Contaminated water on aquaculture production, trade, and food security in China and Japan. Sustainability 16, 1285. doi: 10.3390/su16031285
Liu Y., Guo X.-Q., Li S.-W., Zhang J.-M., Hu Z.-Z. (2022). Discharge of treated Fukushima nuclear accident contaminated water: macroscopic and microscopic simulations. Natl. Sci. Rev. 9, nwab209. doi: 10.1093/nsr/nwab209
Liu J., Li X., Dong J. (2021b). A survey on network node ranking algorithms: Representative methods, extensions, and applications. Sci. China Technological Sci. 64, 451–461. doi: 10.1007/s11431-020-1683-2
Liu J. J., Zhang J. Y., Chen J. (2021a). Analysis of the impact of the new crown pneumonia epidemic on the international supply chain of aquatic products and the safe supply situation of aquatic products in China. World Agric. (01), 20–27.
McCurry J. (2023). Fukushima water discharge approved. Lancet 402, 277–278. doi: 10.1016/S0140-6736(23)01511-8
McKendree M. G., Ortega D. L., Widmar N. O., Wang H. H. (2013). Consumer perceptions of seafood industries in the wake of the deepwater horizon oil spill and Fukushima Daiichi nuclear disaster. Michigan State University, Department of Agricultural. Food, and Resource Economics, (155582).
Meng L., Wang X. (2023). Legal responses to Japan’s fukushima nuclear wastewater discharge into the sea—from the perspective of China’s right-safeguarding strategies. Heliyon 9 (5).
Napier J. A., Haslam R. P., Olsen R.-E., Tocher D. R., Betancor M. B. (2020). Agriculture can help aquaculture become greener. Nat. Food 1, 680–683. doi: 10.1038/s43016-020-00182-9
Normile D. (2023). Despite opposition, Japan may soon dump Fukushima wastewater into the Pacific. Science 379 (321.10), 1126.
Onnela J.-P., Saramäki J., Kertész J., Kaski K. (2005). Intensity and coherence of motifs in weighted complex networks. Phys. Rev. E 71, 065103. doi: 10.1103/PhysRevE.71.065103
Parisi F., Squartini T., Garlaschelli D. (2020). A faster horse on a safer trail: Generalized inference for the efficient reconstruction of weighted networks. New J. Phys. 22, 053053. doi: 10.1088/1367-2630/ab74a7
Ren S., Li H., Wang Y., Guo C., Feng S., Wang X. (2021). Comparative study of the China and US import trade structure based on the global chromium ore trade network. Resour. Policy 73, 102198. doi: 10.1016/j.resourpol.2021.102198
Serrano M. A., Boguná M. (2003). Topology of the world trade web. Phys. Rev. E 68, 015101. doi: 10.1103/PhysRevE.68.015101
Sun X., Shi Q., Hao X. (2022). [amp]]lsquo;Supply crisis propagation in the global cobalt trade network. Resources Conserv. Recycling 179, 106035. doi: 10.1016/j.resconrec.2021.106035
Statistics Bureau. (2024). “Statistical Handbook of Japan,” Chapter 5 Agriculture, Forestry, and Fisheries. Japan: 61.
Tanaka K., Shunsuke M. (2016). Impact of a disaster on land price: evidence from Fukushima nuclear power plant accident. The Singapore Economic Review. 61 (01), 1640003.
Ten Hoeve J. E., Jacobson M. Z. (2012). Worldwide health effects of the Fukushima Daiichi nuclear accident. Energy Environ. Sci. 5, 8743–8757. doi: 10.1039/c2ee22019a
Wada T., Fujita T., Nemoto Y., Shimamura S., Mizuno T., Sohtome T., et al. (2016). Effects of the nuclear disaster on marine products in Fukushima: An update after five years. J. Environ. radioactivity 164, 312–324. doi: 10.1016/j.jenvrad.2016.06.028
Wang X., Li H., Zhu D., Zhong W., Xing W., Wang A. (2021). Research on global natural graphite trade risk countermeasures based on the maximum entropy principle. Resour. Policy 74, 102367. doi: 10.1016/j.resourpol.2021.102367
Wang M., Tan Z., Liu J., Chen J. (2022). Analyzing the impact of Fukushima nuclear wastewater discharge on seafood trade with gravity model. Ocean Coast. Manage. 230, 106302. doi: 10.1016/j.ocecoaman.2022.106302
Wasserman S., Faust K. (1994). Social network analysis: Methods and applications. Cambridge University Press. 177-198
Watts D. J., Strogatz S. H. (1998). Collective dynamics of ‘small-world’networks. Nature 393, 440–442. doi: 10.1038/30918
Wilson A. G. (1969). The use of entropy maximising models, in the theory of trip distribution, mode split and route split. J. Transport Economics Policy 3, 108–126.
Wu X., Zhang Y., Feng X. (2023). The impact of Japanese nuclear wastewater discharge into the sea on the global economy: Input-output model approach. Mar. pollut. Bull. 192, 115067. doi: 10.1016/j.marpolbul.2023.115067
Zhang D., Chen B., Hubacek K., Meng J., Sun M., Mao J., et al. (2023). Potential impacts of Fukushima nuclear wastewater discharge on nutrient supply and greenhouse gas emissions of food systems. Resources Conserv. Recycling 193, 106985. doi: 10.1016/j.resconrec.2023.106985
Keywords: Fukushima nuclear wastewater, complex network, trade redistribution, maximum entropy principle, seafood simulation, Japanese radioactive pollution
Citation: Chen L, Zhang Y, Tan Y and Ali A (2025) Modelling the future of aquatic products’ trade under marine pollution by Japan’s nuclear wastewater. Front. Mar. Sci. 12:1534786. doi: 10.3389/fmars.2025.1534786
Received: 26 November 2024; Accepted: 13 March 2025;
Published: 07 April 2025.
Edited by:
Geret Sean DePiper, Northeast Fisheries Science Center (NOAA), United StatesReviewed by:
Ming Wang, Dalian Maritime University, ChinaWei Guo, Chinese Academy of Agricultural Sciences, China
Copyright © 2025 Chen, Zhang, Tan and Ali. This is an open-access article distributed under the terms of the Creative Commons Attribution License (CC BY). The use, distribution or reproduction in other forums is permitted, provided the original author(s) and the copyright owner(s) are credited and that the original publication in this journal is cited, in accordance with accepted academic practice. No use, distribution or reproduction is permitted which does not comply with these terms.
*Correspondence: Yanwen Tan, dGFueXdAc2NhdS5lZHUuY24=