Abstract
This study employs reanalysis data published by ECMWF to investigate the impact of ocean waves on cold tongues in the southern hemisphere. Based on the global sea surface temperature (SST) patterns, the scope of the cold tongue is defined in this paper. Compared to Ekman transport, wave transport dominates and plays a critical role in the cold tongue region. This study analyzes the characteristics of cold tongues across the three major ocean, with a primary focus on the Pacific cold tongue, which serves as the most representative region. Analysis of the relationship between meridional wave transport and SST in the southeastern Pacific cold tongue indicates a lagged negative correlation between abnormal SST and meridional wave-induced water transport from high latitudes. Specifically, negative SST anomalies in the Pacific cold tongue occur 3~4 months after a positive anomaly in northward cold-water transport from high latitudes. Meridional wave transport between 30°S and 38°S has a significant cooling effect on SST in the cold tongue region, with the strongest cooling observed along the northeastern coastline. Additionally, the combined effects of northward and westward water transport result in a distinct temperature gradient in the western cold tongue. These findings highlight the connection between wave-induced transport and the cold tongue, providing a novel perspective for exploring the causes of SST anomalies.
1 Introduction
Ocean cold tongues represent a phenomenon of sea surface temperature (SST) anomalies, which are influenced by processes such as heat flux at the ocean-atmosphere interface, oceanic advective heat transport, upwelling, and convection-induced vertical mixing (Zhang et al., 2022b). Numerous studies have demonstrated that the formation and evolution of cold tongues result from the combined effects of multiple oceanic processes. Wyrtki (1981) pointed out that the formation of equatorial cold tongues is partially the result of upwelling. To compensate for the divergence of water caused by Ekman transport, upwelling brings cold deep water to the surface sea, leading to a decrease in SST (Zhang et al., 2022a). Moum et al. (2013) and Planton et al. (2017) highlighted that vertical mixing processes in the ocean play a controlling role in the seasonal cooling of the equatorial Pacific and Atlantic cold tongues, respectively. As noted by Wang et al. (2017), wind-driven wave upwelling plays a crucial role in modulating the annual cycle of SST in the cold tongue of the eastern equatorial Atlantic. When studying the SST variation of equatorial undercurrent in cold tongue, Hormann and Brandt (2007) proposed that the existing observational data are insufficient to adequately close the mixed layer heat budget within the cold tongue region. This observation underscores the need for further research into the complex factors influencing SST variability in the cold tongue, an area that remains underexplored and warrants continued investigation.
Wave-induced Stokes drift (SD) refers to the net displacement of fluid particles along the direction of wave propagation, which causes water transport in the same direction as the waves (Stokes, 1847). At the sea surface, SD is primarily driven by wind waves, while vertically integrated transport is dominated by swells (Carrasco et al., 2014). Previous studies have shown that global Stokes transport can reach up to 50% of Ekman transport (McWilliams and Restrepo, 1999; Bi et al., 2012). Although Ekman transport, driven by wind stress, occurs only in the shallow surface layer of the ocean, it plays a critical role in maintaining the global heat balance (Alexander and Scott, 2008). Consequently, the influence of wave transport on oceanic heat balance cannot be overlooked.
McWilliams and Restrepo (1999) elucidated the dynamical and thermodynamical driving effects of waves on circulation from a transport perspective. Wu et al. (2008) further studied the role of waves in driving ocean circulation from an energy perspective. Zhang et al. (2014) introduced advection heat transport effect induced by SD into the ocean mixed-layer temperature equation and found its contribution to mixed-layer temperature changes to be comparable in magnitude to that of advection. El Niño constitutes a significant area of oceanic research. Studies have shown that during the period of El Niño, northward wave transport anomalies in the South Pacific increase, with wave-induced cool water transport from high latitudes helping restore abnormal SST to normal levels (Li et al., 2021). Beyond the South Pacific, subsequent research has also established strong links between wave transport anomalies in the North Indian Ocean and North Pacific with large-scale ocean-atmosphere climate variability (Li et al., 2022a; Zhang et al., 2023b). These findings all underscore the significant dynamical and thermodynamical impacts of wave on the ocean system (Li et al., 2025).
According to the results of the ocean general circulation models (OGCMs), Song et al. (2012) demonstrated that wave-induced mixing directly cools SST, with significant impacts in the eastern ocean basins. The enhanced First Institute of Oceanography Earth System Model (FIO-ESM) 2.0 model, incorporating effects of SD on air-sea momentum and heat flux, as well as wave-induced processes such as sea spray, effectively corrected the overly warm SST biases along the Pacific and Atlantic eastern coasts seen in version 1.0 (Bao et al., 2020). These findings highlight the critical role of wave processes in influencing SST variations along the eastern ocean boundaries, a region that serves as a key control area for cold tongue development.
The Southern Ocean serves as the primary source region for swells that influence the wave climate of the Pacific, Atlantic, and Indian Oceans (Young et al., 2020; Li et al., 2021, 2022; Casas-Prat et al., 2024). Ocean waves might influence SST in cold tongue, with typical cold tongue areas in the Southern Hemisphere often dominated by high-latitude swells (Chen et al., 2002), Particularly, the formation of the southeast Pacific swell pools are primarily influenced by northward swell waves from the Southern Ocean (Zhang et al., 2023a). However, current research lacks direct connections between meridional wave-induced transport and the cold tongue in the Southern Hemisphere. This study aims to establish such a connection by investigating wave-driven water transport and its influence on cold tongues in the mid- and low-latitude regions of various oceans. Section 2 outlines the data and methods used (Equations 1–6), while Sections 3 analyze the characteristics of the global ocean and wave-driven transport, focuses on the relationship between wave transport and the southeastern Pacific cold tongue, where the influence of waves is more pronounced. The key conclusions and discussion of this paper are given in Section 4.
2 Dataset and methods
2.1 Dataset
The oceanic and wind field data used in this study are derived from the ERA5 reanalysis datasets provided by the European Centre for Medium-Range Weather Forecasts (ECMWF). It integrates model simulations and observational data into a comprehensive and globally consistent dataset (Hersbach et al., 2020; Li et al., 2022b). The data span the period from 1950 to 2019, with a temporal resolution of monthly averages. The oceanic variables include SST, surface SD velocity, and wave period, with a spatial resolution of 0.5°×0.5°, while the wind field data, representing wind speed at 10 meters above the sea surface, have a spatial resolution of 0.25°×0.25°.
2.2 Calculation of water transport
2.2.1 Wave-induced transport
Due to the water depth being significantly greater than the wavelength, the deep water assumption is applied to the sea area studied in this paper. With the deep-water assumption, the SD velocity at different depths is expressed as (Tamura et al., 2012):
where, z is depth, is the surface SD velocity, represents the depth affected by SD, where =1/2k and k is the wave number. Based on the dispersion relationship under the deep-water assumption, , the wave number k can be expressed as , ω is the frequency of wave, g is the gravitational acceleration. Thus, the formula for wave-induced water transport derived from SD can be expressed as (Li et al., 2021):
2.2.2 Ekman transport
Under deep-water conditions, the Ekman transport can be expressed as:
where, represents the Coriolis parameter, and φ represents latitudes, ρ represents the density of the ocean (1025kg/m³), Wx and Wy represent the velocity components of Ekman transport when the wind is oriented along the east-west and north-south directions, and represent the wind stress components in the east-west and north-south directions, respectively, can be expressed as:
is the atmospheric density (1.225kg/m³), is the wind speed at 10 meters above the sea surface, is the drag coefficient, taken as (Wu, 1982).
2.3 Linear regression
The basic form of the linear regression model is (Montgomery and Peck, 1992):
Where y is the dependent variable, x is the independent variable, is the intercept term, is the regression coefficient, which represents the average effect of each unit increase in x on the dependent variable y, is the random error term.
Before performing the regression analysis, the data were standardized, as , where is the mean of the datasets, σ is the standard deviation of the datasets, Z is the standardized value.
If necessary, hypothesis testing can be conducted on the calculated results. In this study, results that are statistically significant over the 95% confidence level were retained.
3 Results
SST is primarily influenced by solar radiation and generally exhibits a zonal distribution, decreasing from low latitudes to high latitudes. However, along the eastern boundaries of the global Ocean in the tropical and subtropical regions, isotherms tilt towards the lower latitudes, and the SST in these areas is significantly lower than in other regions at the same latitude. Bjerknes (1969) was the first to highlight this anomaly in sea surface temperature and referred to it as the cold tongue. In this study, the eastern ocean regions of the southern hemisphere are divided into three regions as cold tongue areas of the Pacific, Atlantic, and Indian Oceans. As shown in Figure 1, they are (a) (3°S~30°S, 70°W~105°W), (b) (10°S~30°S, 15°W~15°E), and (c) (20°S~30°S, 90°E~110°E), and each region is studied separately, and in the three cold tongue regions, the maximum SST differences at the same latitude can reach up to 8°C, 9°C and 1°C.
Figure 1
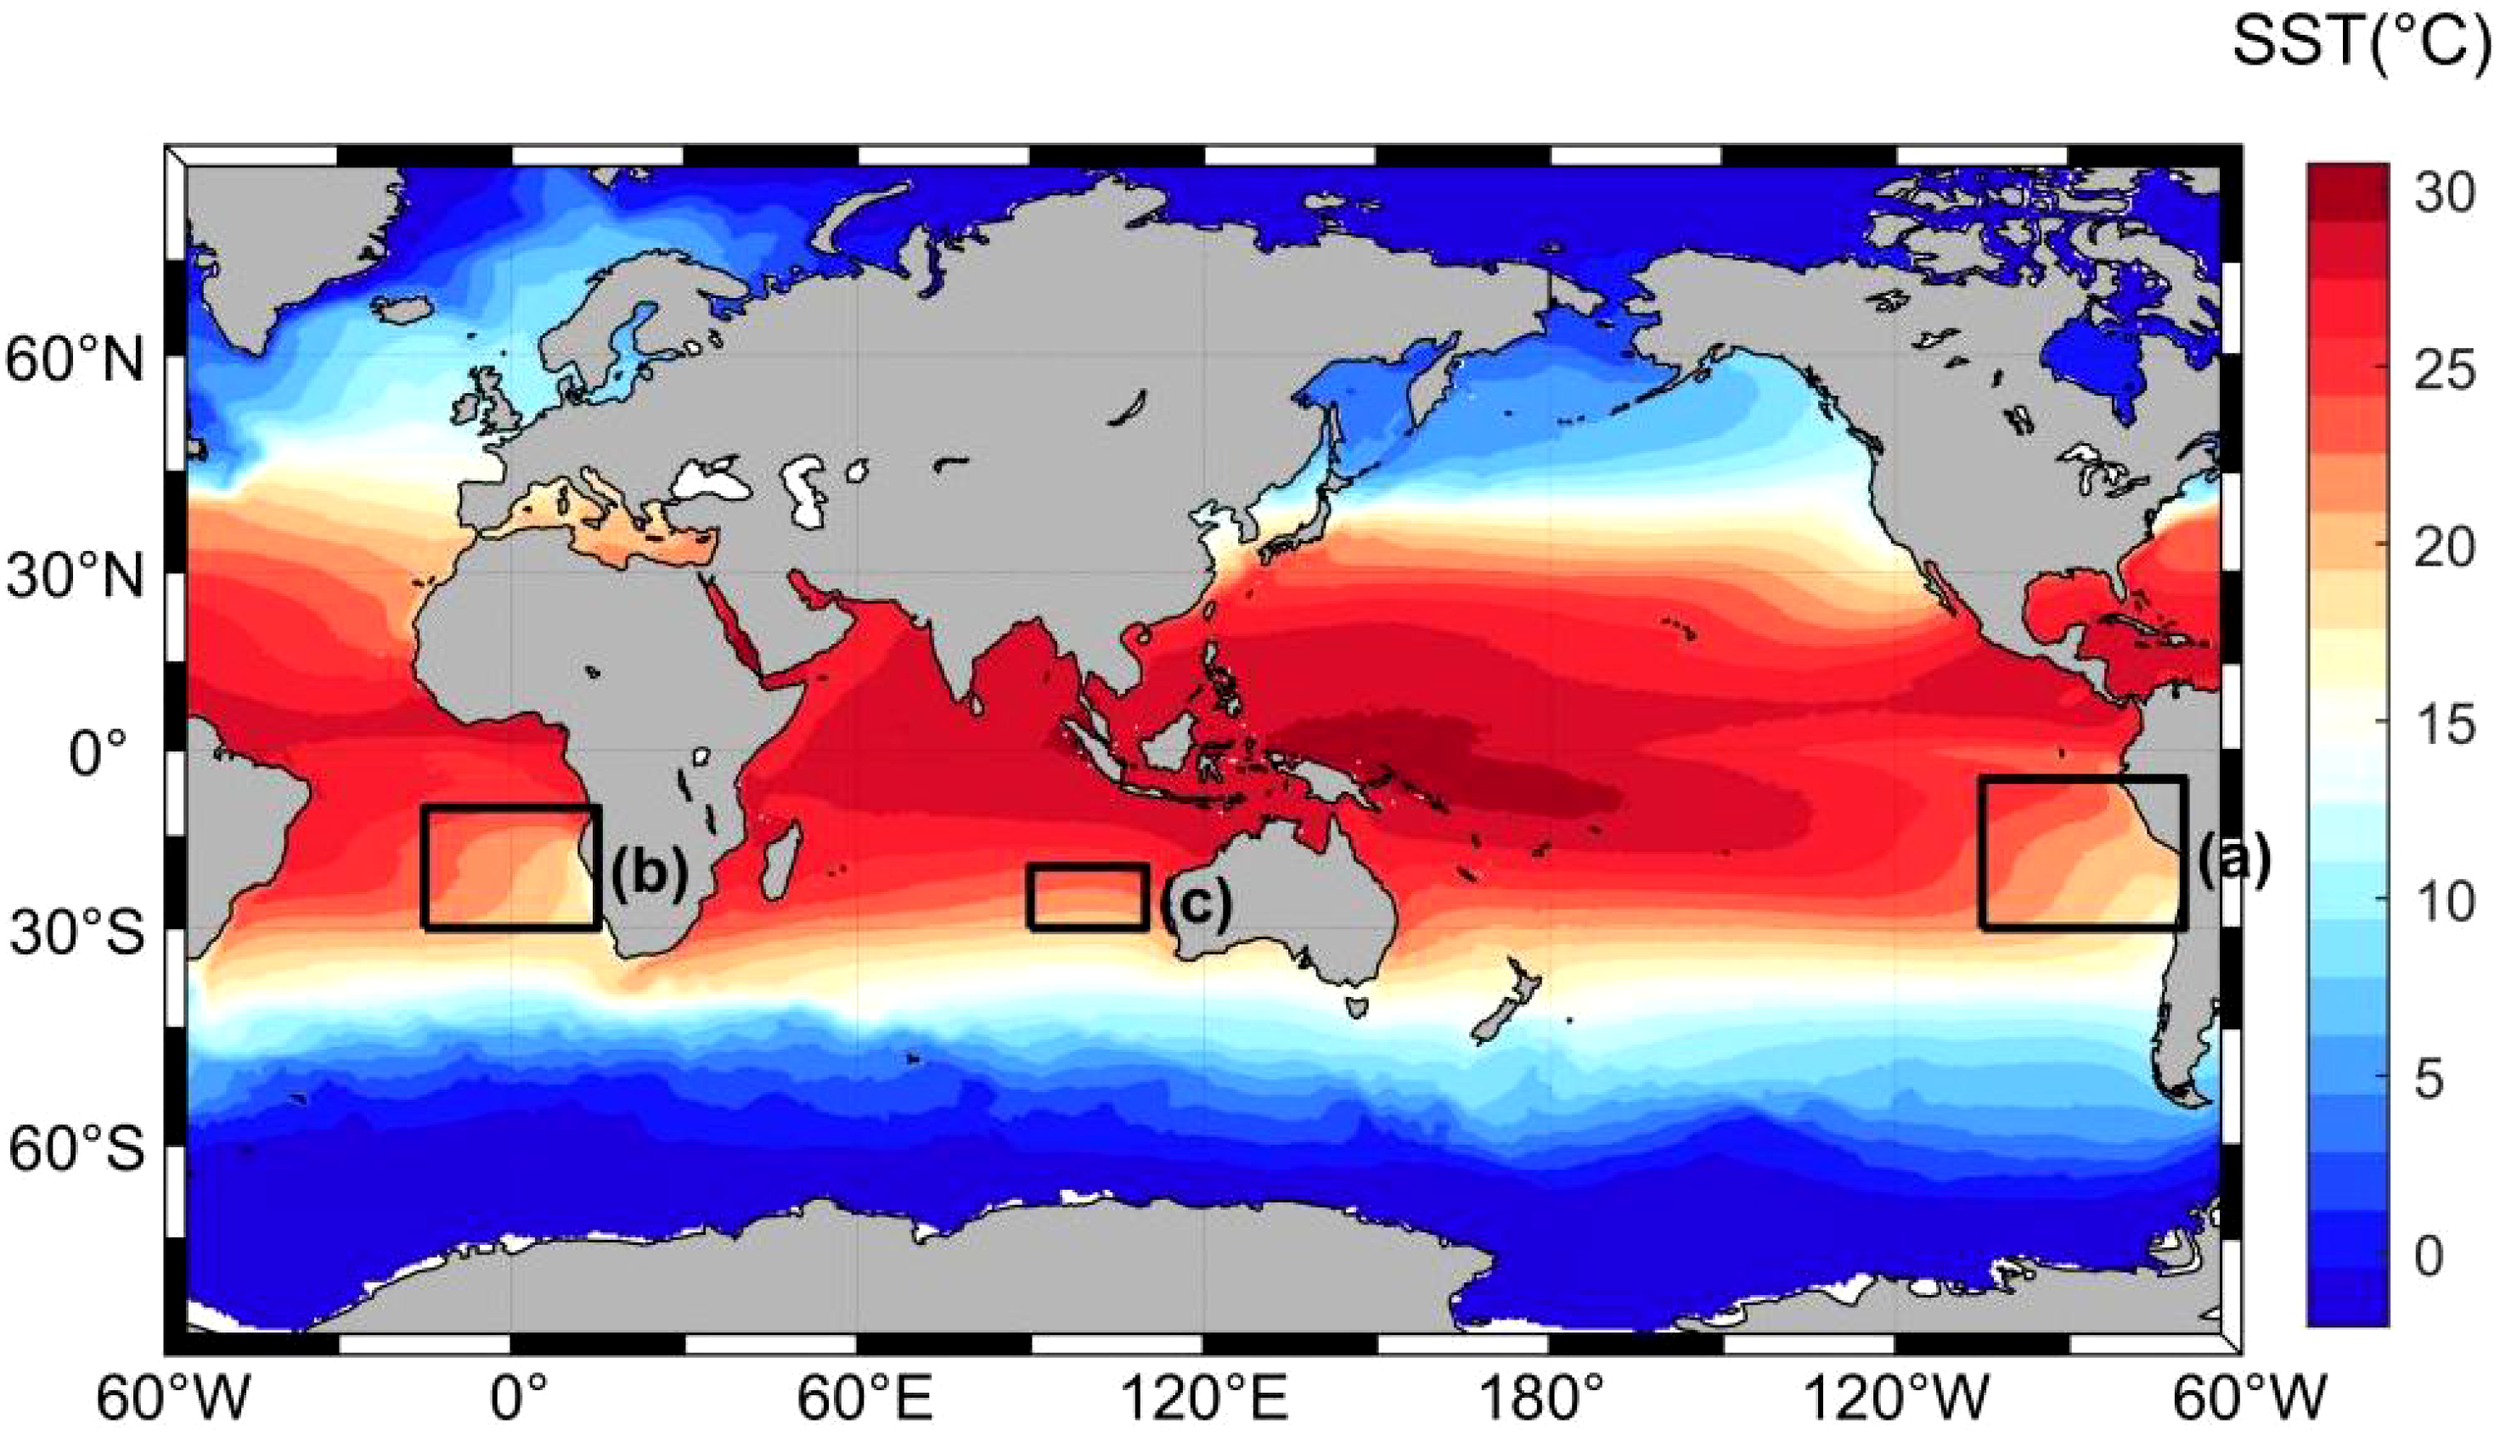
Spatial distribution of mean SST over 70 years, with regions (a–c) representing the cold tongue regions in the Pacific, Atlantic, and Indian Oceans, respectively.
To preliminarily establish the connection between wave-driven transport and SST, the correlation coefficients between SD and SST were calculated, with the results illustrated in Figure 2. In the tropical Pacific and Atlantic, SST exhibits a positive correlation with the zonal SD, with the strongest relationship observed in the central equatorial Pacific, where the correlation coefficient reaches a maximum of 0.7. This positive correlation indicates that an intensification of eastward SD corresponds to an increase in SST. Conversely, in the mid- to high-latitude regions, SST demonstrates a negative correlation with zonal SD.
Figure 2
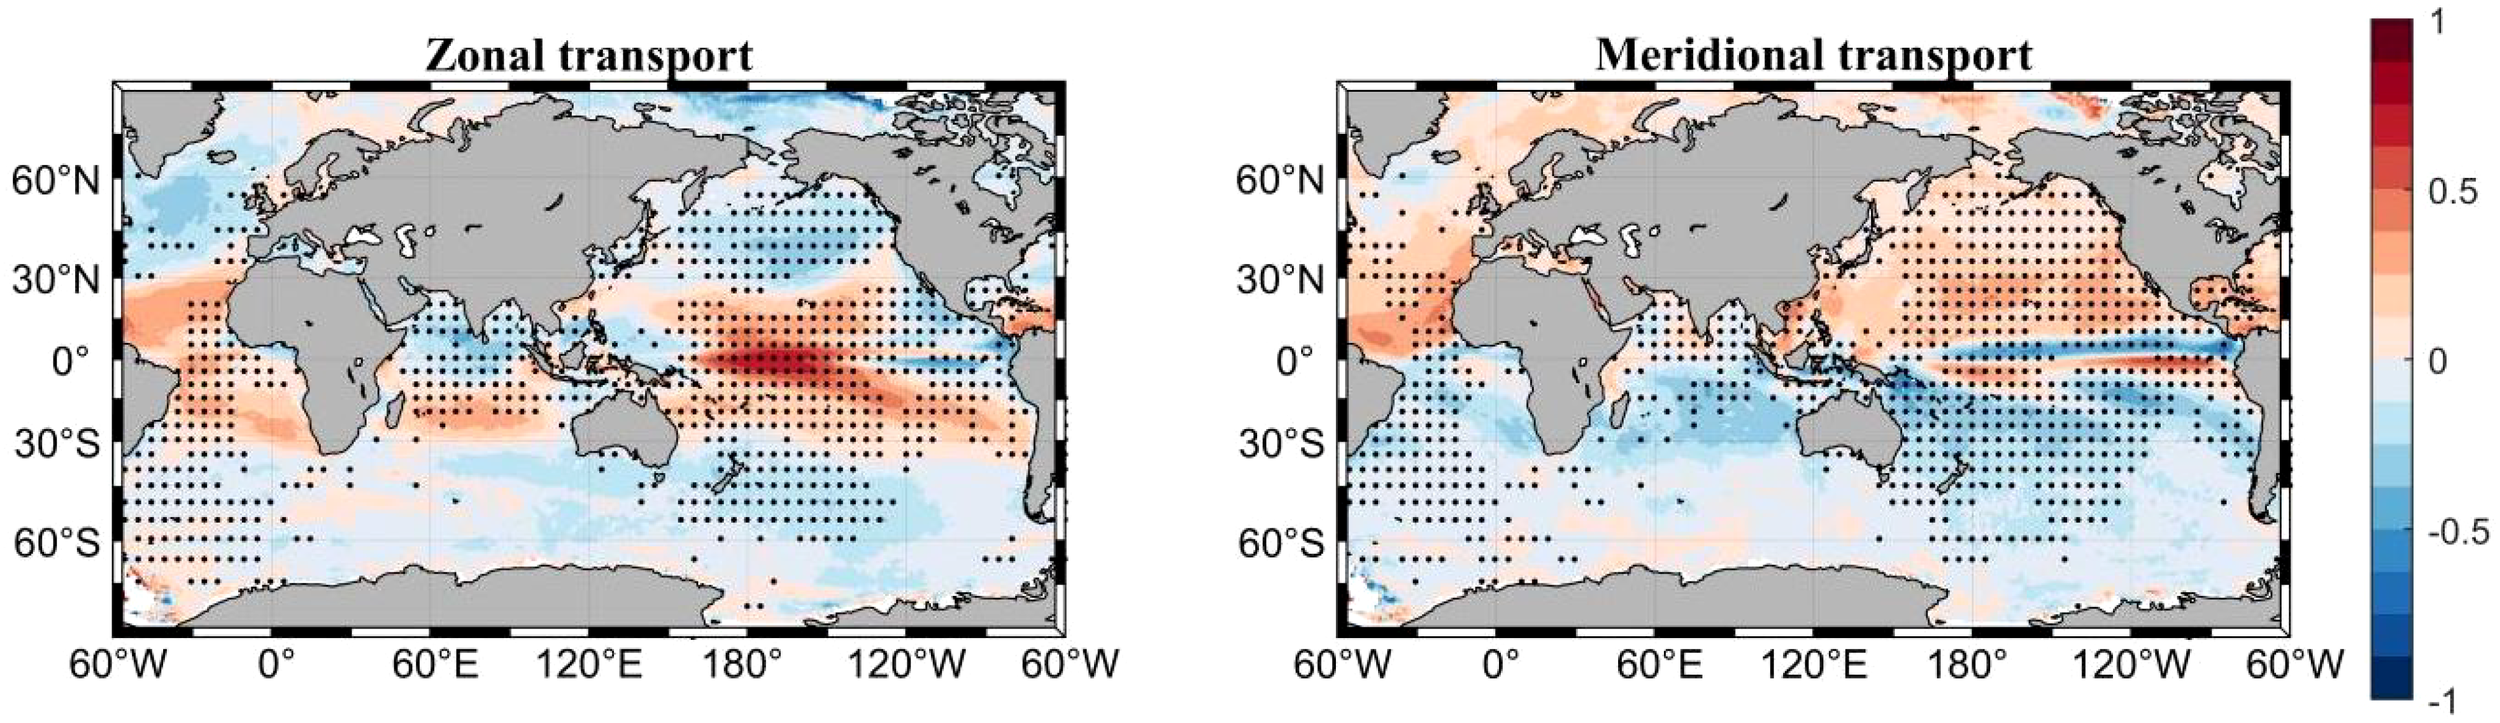
Spatial distribution of the correlation coefficients between monthly anomalies of SD velocity and SST. The left side panel represents the zonal correlation, while the right side panel represents the meridional correlation (black dots indicate regions that are statistically significant over the 95% confidence level).
In the Northern Hemisphere, the relationship between meridional SD and SST is predominantly positive, with negative correlations restricted to a few localized areas near the equator. In contrast, the Southern Hemisphere is characterized by a predominantly negative correlation, such that an increase in northward water transport is associated with a decrease in SST. Previous research has shown that during El Niño events, the meridional SD within the Pacific swell regions strengthen northward transport, transporting colder water into tropical oceans. This process induces cooling in these areas and contributes to the accelerated dissipation of El Niño events (Zhang et al., 2023b). These findings demonstrated the critical role of the meridional SD in the South Pacific in modulating SST in low-latitude regions.
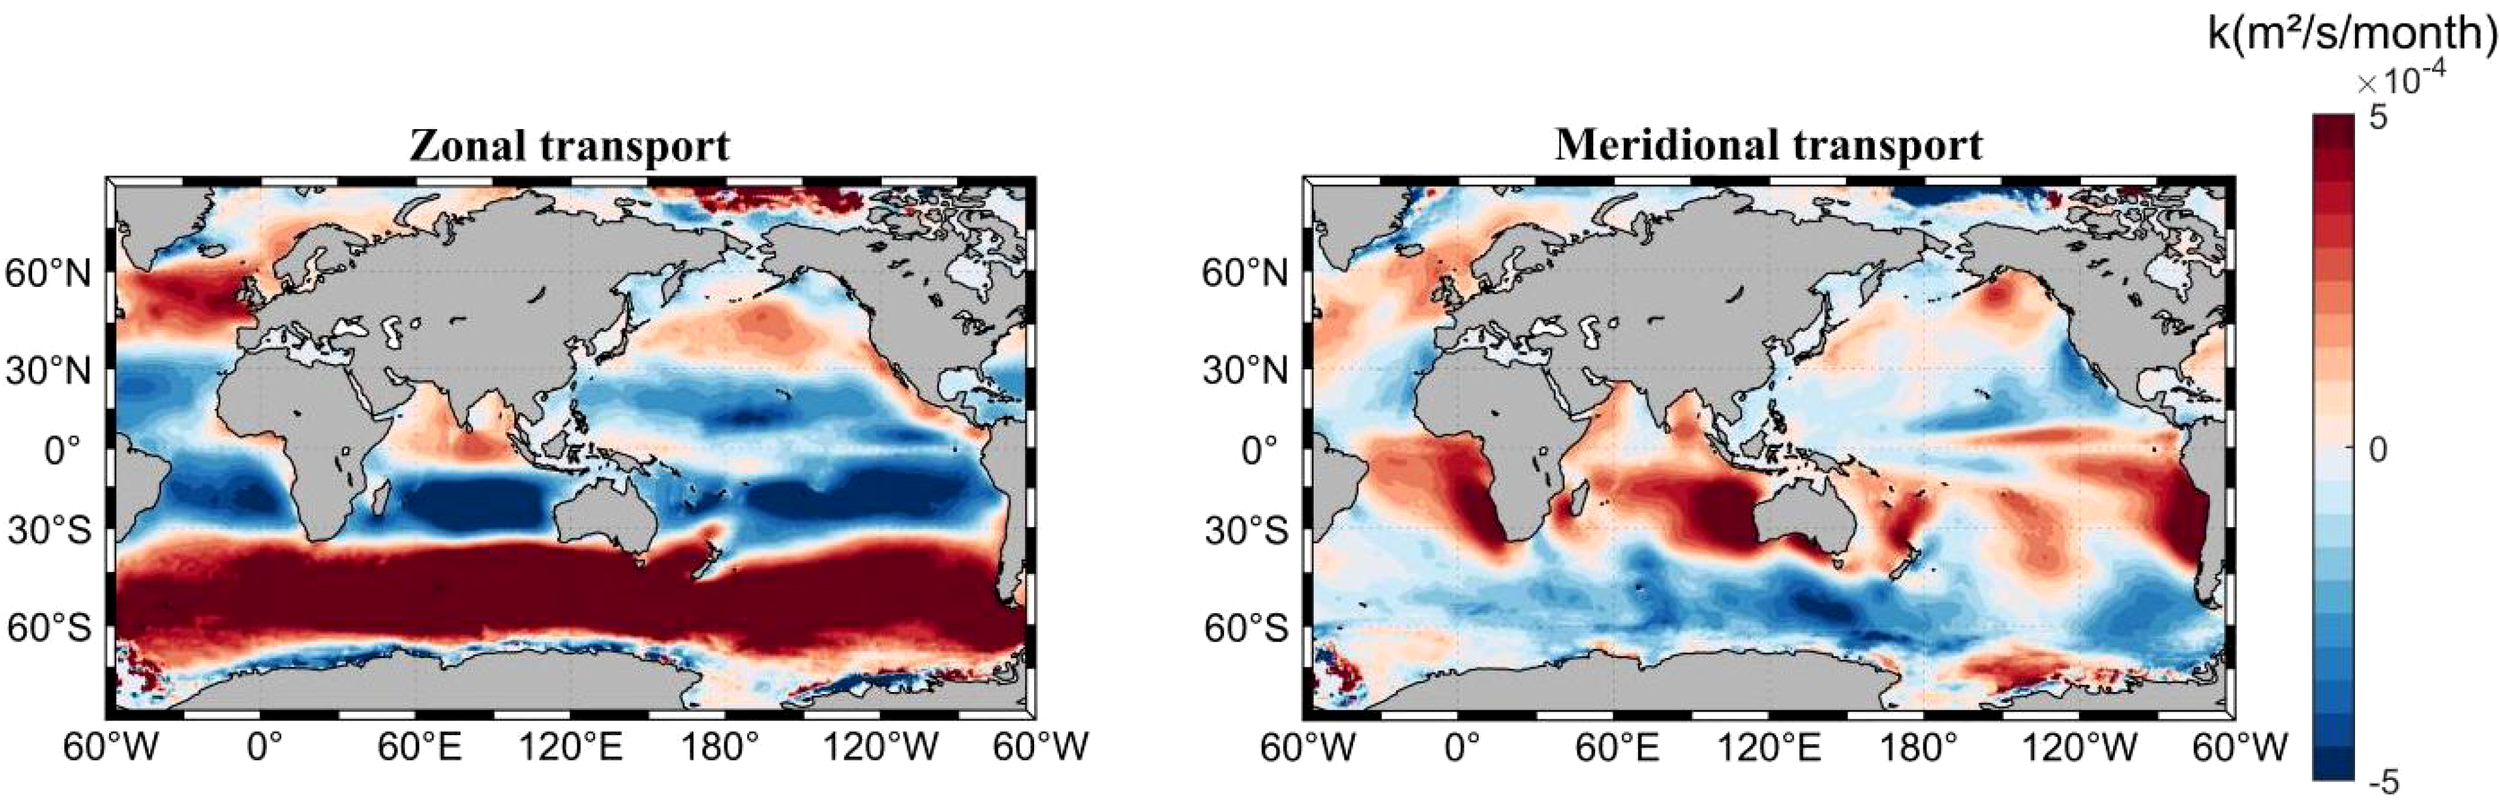
Based on the spatial distribution of the 70-year mean wave transport as shown in Figure 3, zonal transport is characterized by strong west-to-east movement in the high-latitude regions of global ocean under the influence of westerly winds. Conversely, in the mid- to low-latitude regions of both hemispheres, trade winds drive east-to-west transport, except in the North Indian Ocean, where monsoonal dynamics result in west-to-east transport (Schott et al., 2009).
Figure 3
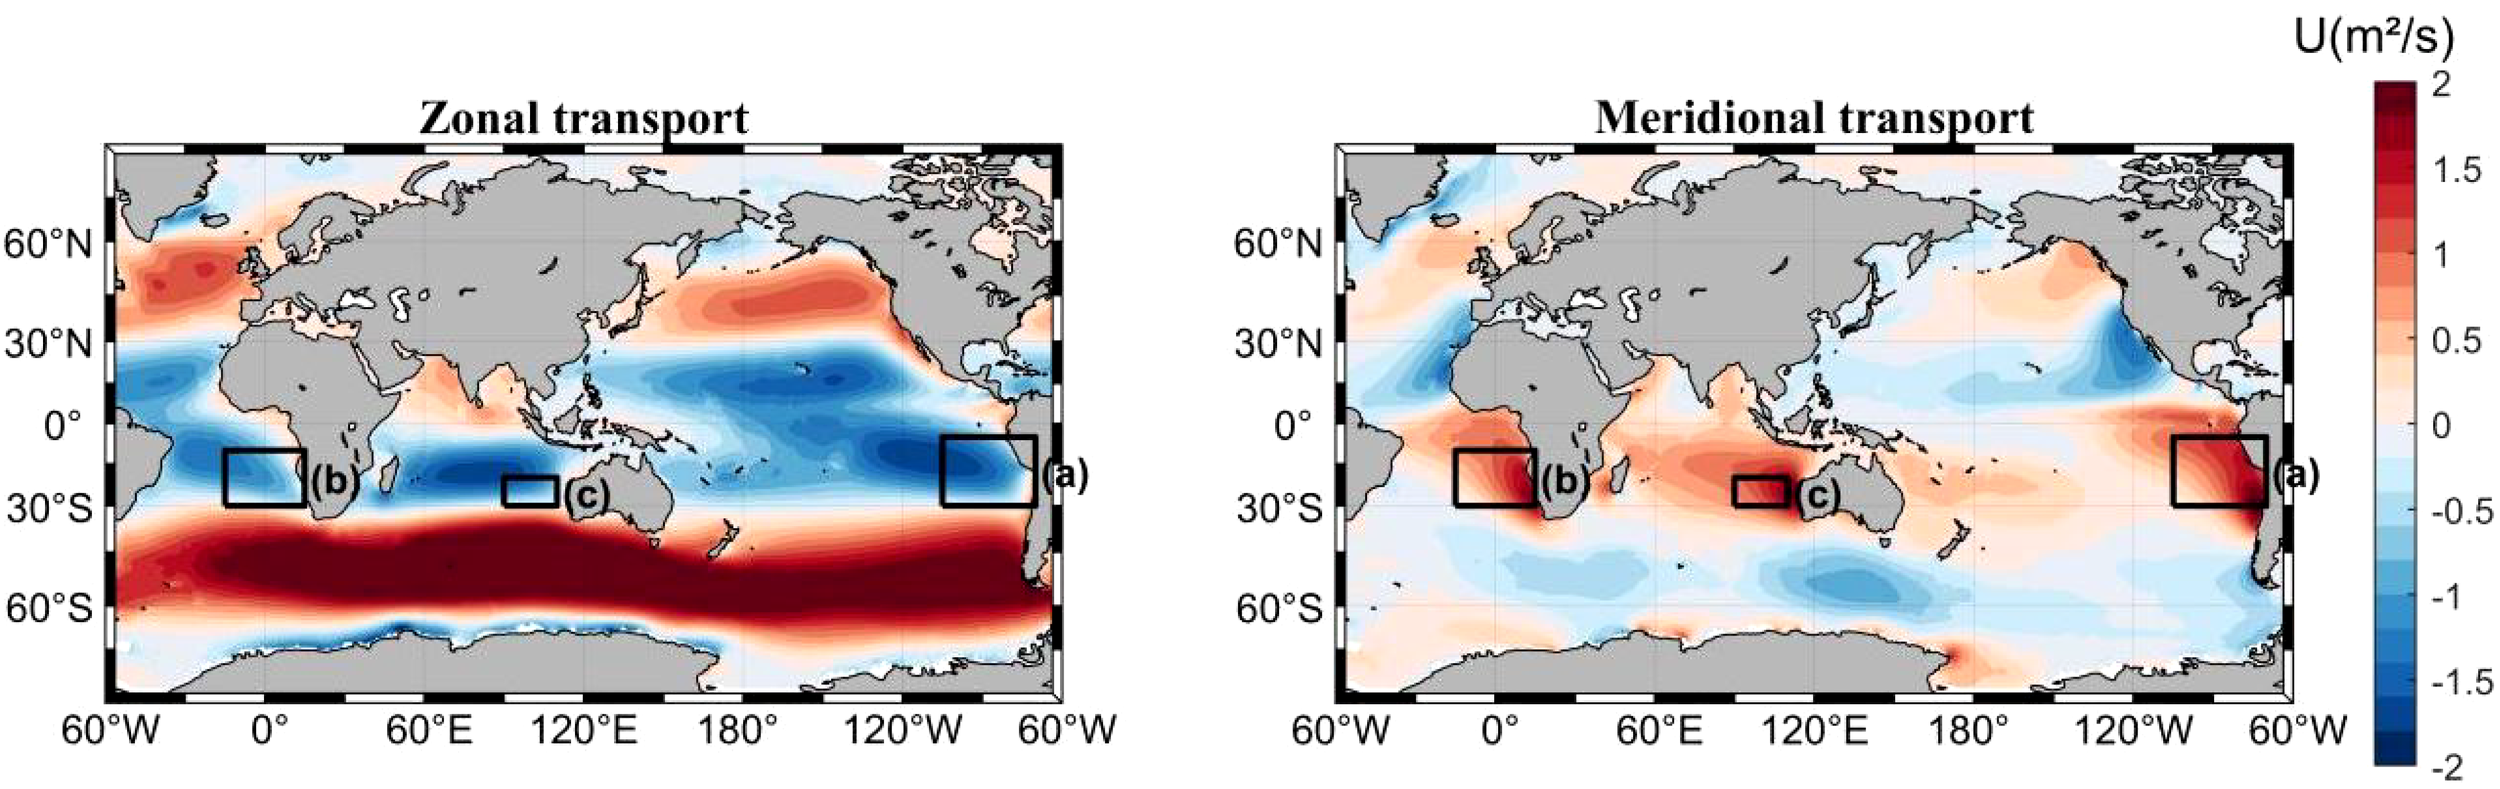
Spatial distribution of wave-driven water transport, with regions (a), (b), and (c) representing the cold tongue regions in the Pacific, Atlantic, and Indian Oceans. The left side panel represents the zonal transport, while the right side panel represents the meridional transport (positive values represent eastward transport and northward transport).
The mean meridional wave transport reveals a predominant flow from higher to lower latitudes along the eastern ocean boundaries in the tropical and subtropical oceans, which corroborates with previous results (Li et al., 2021, 2022a). In contrast, in high-latitude areas of the Northern Hemisphere, transport shifts from lower to higher latitudes along the eastern boundaries. In the cold tongue, meridional transport is primarily south-to-north, with the transport intensity being greater in the nearshore sea areas.
As shown in Figure 1, the SST gradient near the coastal zones in the cold tongue regions is more pronounced. In the cold tongue regions of Pacific, Atlantic, and Indian Ocean, the proportion of areas experiencing northward transport respectively accounts for 88.37%, 94.08%, and 100% of the total cold tongue area, according to the 70-year average results. The maximum northward transport rates in these regions reach 2.12 m²/s, 1.88 m²/s, and 1.85 m²/s, respectively.
Considering the zonal and meridional wave-driven transport patterns, it is evident that the majority of water transported meridionally within the cold tongue regions originates from the Southern Ocean. The northward wave transport conveys cold water from higher latitudes to lower latitudes, where it interacts with the local SST, resulting in a cooling effect on the SST.
Given the significant role of Ekman transport in oceanic heat transport, we conducted a comparative analysis of the 70-year mean differences between wave transport and Ekman transport (calculated as the absolute value of wave transport minus the absolute value of Ekman transport) yields, the results shown in Figure 4. For zonal transport, wave transport dominates on a global scale, with only a few narrow regions along the ocean boundaries in the tropical oceans where Ekman transport exceeds wave transport. This can also be accord with the computational results obtained by Bi et al. (2012) and make a greater focus on exploring the spatial patterns of the two transport. In the Pacific cold tongue region, the average difference between zonal wave transport and Ekman transport reaches 0.50 m²/s, with wave transport surpassing Ekman transport in 60.72% of the cold tongue area. Similarly, in the Atlantic and Indian Ocean cold tongue regions, the average differences are 0.26 m²/s and 0.53 m²/s, respectively, with wave transport prevailing in 66.61% and 81.84% of their respective cold tongue regions. For meridional transport, Ekman transport dominates in low-latitude regions, whereas wave transport significantly exceeds Ekman transport along the eastern boundaries of the tropical and subtropical oceans. Within the Pacific, Atlantic, and Indian Ocean cold tongue regions, the average differences between meridional wave and Ekman transport are 0.19 m²/s, 0.37 m²/s, and 0.87 m²/s, respectively, with wave transport dominating in 49.55%, 68.13%, and 95.12% of the respective cold tongue areas. Thus, given the critical role of Ekman transport in maintaining the thermal balance of ocean (Alexander and Scott, 2008), the heat redistribution induced by wave transport is also likely to have a significant impact on SST, warranting further investigation.
Figure 4
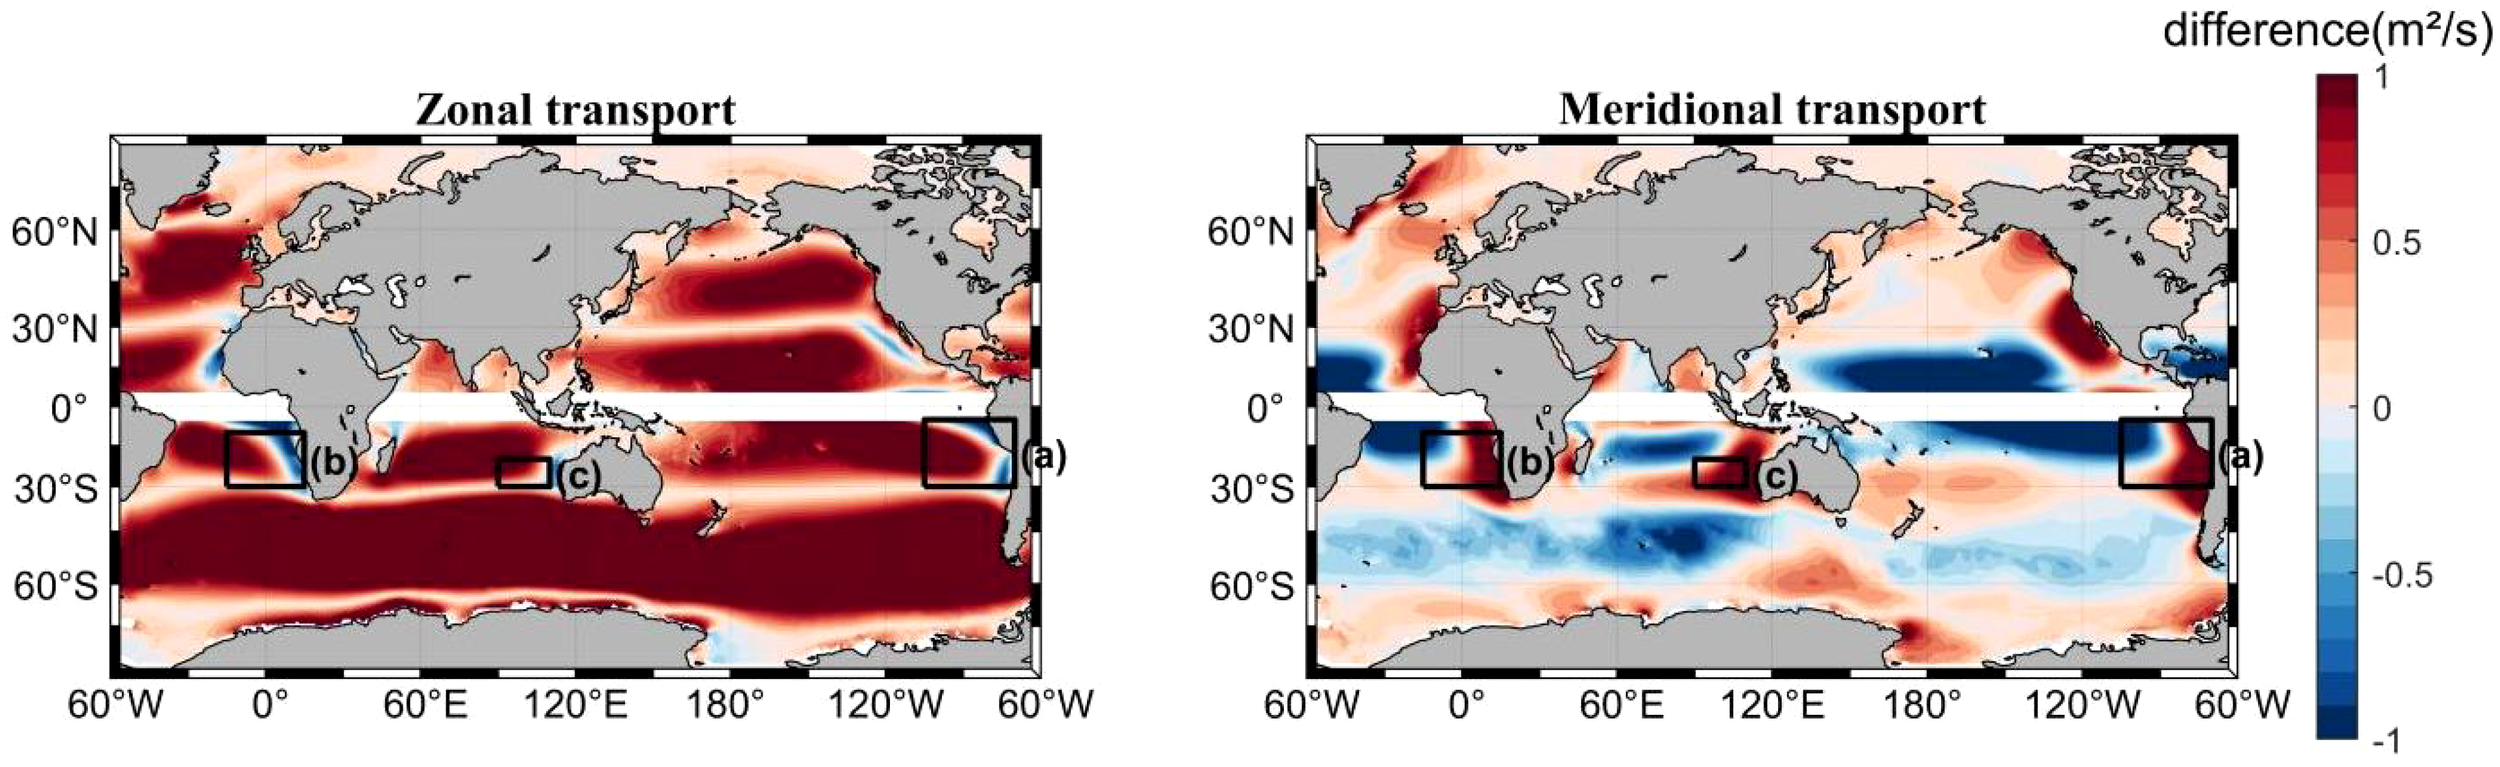
Spatial distribution of the difference between wave transport and Ekman transport, with regions (a), (b), and (c) representing the cold tongue regions in the Pacific, Atlantic, and Indian Oceans. The left side panel represents the zonal transport, while the right side panel represents the meridional transport (positive values indicate greater wave-induced water transport).
After removing the global warming trend, the spatial distribution of the long-term trends in wave transport are shown in Figure 5. For zonal transport, an increasing trend in eastward transport is observed in Southern Ocean, whereas most subtropical and tropical oceans exhibit an increase trend of westward transport. The only exception is the northern Indian Ocean, where eastward wave transport is intensifying influenced by monsoon. Regarding meridional transport, a notable enhancement in northward transport is evident along the southeastern coasts of the Pacific and Atlantic Oceans. In the South Atlantic and South Indian Oceans, this trend extends from the eastern boundaries to the central ocean, with the strongest intensification occurring near the boundaries. Additionally, regions such as the Sea of Japan, high-latitude areas of the Atlantic, and parts of the central and eastern South Pacific also show a strengthening of northward transport over the past 70 years.
Figure 5
Long-term trend of wave transport. The left side panel represents the zonal transport, while the right side panel represents the meridional transport (positive values indicate an increase in eastward and northward transport).
To investigate the causes of these trends, Figure 6 presents the long-term changes in wind fields as a reference. The results indicate a significant increase in wind speeds over the Southern Ocean, the southeastern oceanic boundaries, and the equatorial Pacific Ocean, which is consistent with the findings of previous studies (Liu et al., 2023a; Young et al., 2011). The analysis reveals that the spatial and temporal trends in wave-induced water transport align closely with those of wind speed, both of which have been adjusted to remove the global warming trend. Both wave transport and wind velocity exhibit a marked trend of zonal intensification trend within the Southern Ocean. This indicates that the long-term variability in wave-driven transport is primarily governed by changes in wind fields, which aligns with the perspective that sustained year-round strong westerly winds lead to a sustained, year-round intense wave climate in Southern Ocean (Casas-Prat et al., 2024; Liu et al., 2024).
Figure 6
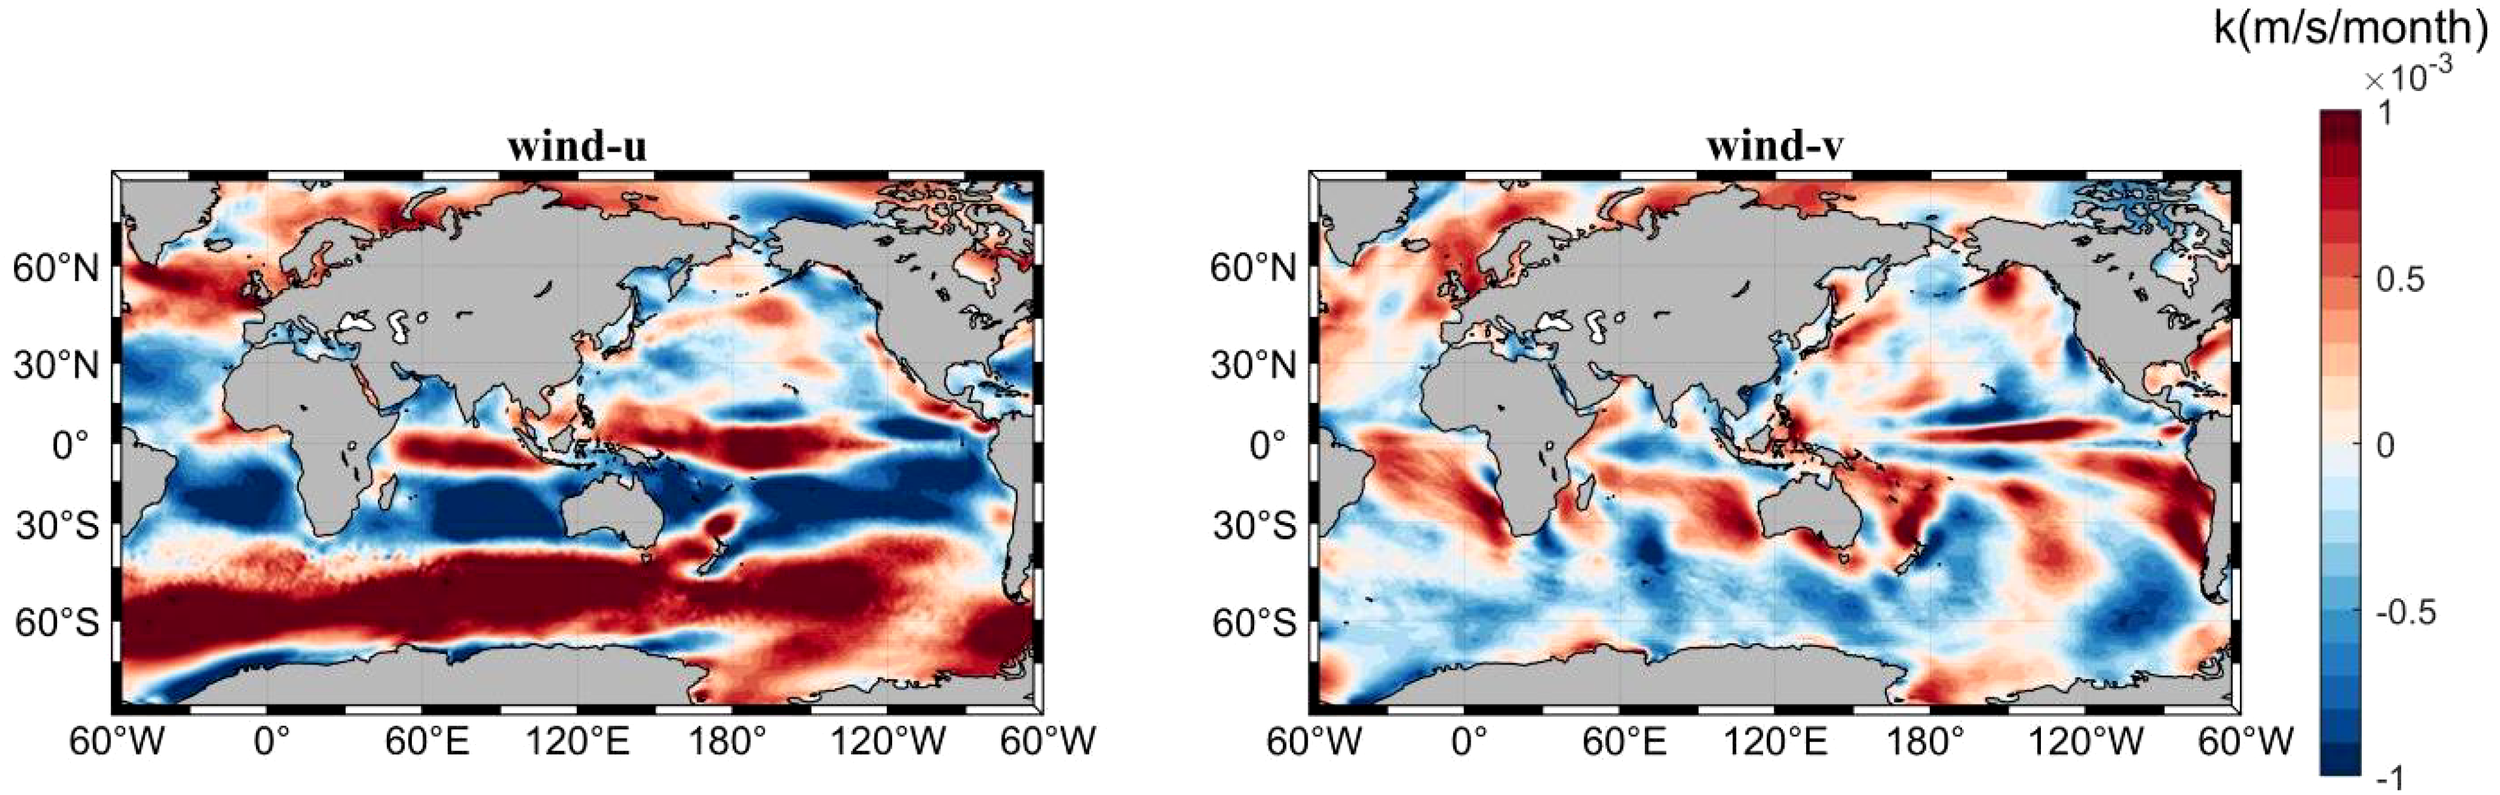
Long-term trend of wind speed. The left panel side represents the zonal wind, while the right side panel represents the meridional wind (positive values indicate an increase in eastward and northward wind speed).
Above findings indicate that northward wave transport is notably significant in the cold tongue regions. However, as illustrated Figure 2, little significant correlation between SD and SST anomalies is observed in the cold tongue regions of the Atlantic and Indian Oceans. In the subsequent analysis, we further observed that the cold tongues in the Atlantic and Indian Oceans exhibit a less pronounced response to meridional wave transport, as demonstrated by the results in Figures 7, 8. This aligns with the earlier finding of a weak correlation between SST and SD in these regions. As Figure 7 shown, strong cooling effects are only observed in the nearshore areas from 20°S to 30°S in the cold tongue region of Atlantic, where isotherm slopes are most pronounced.
Figure 7
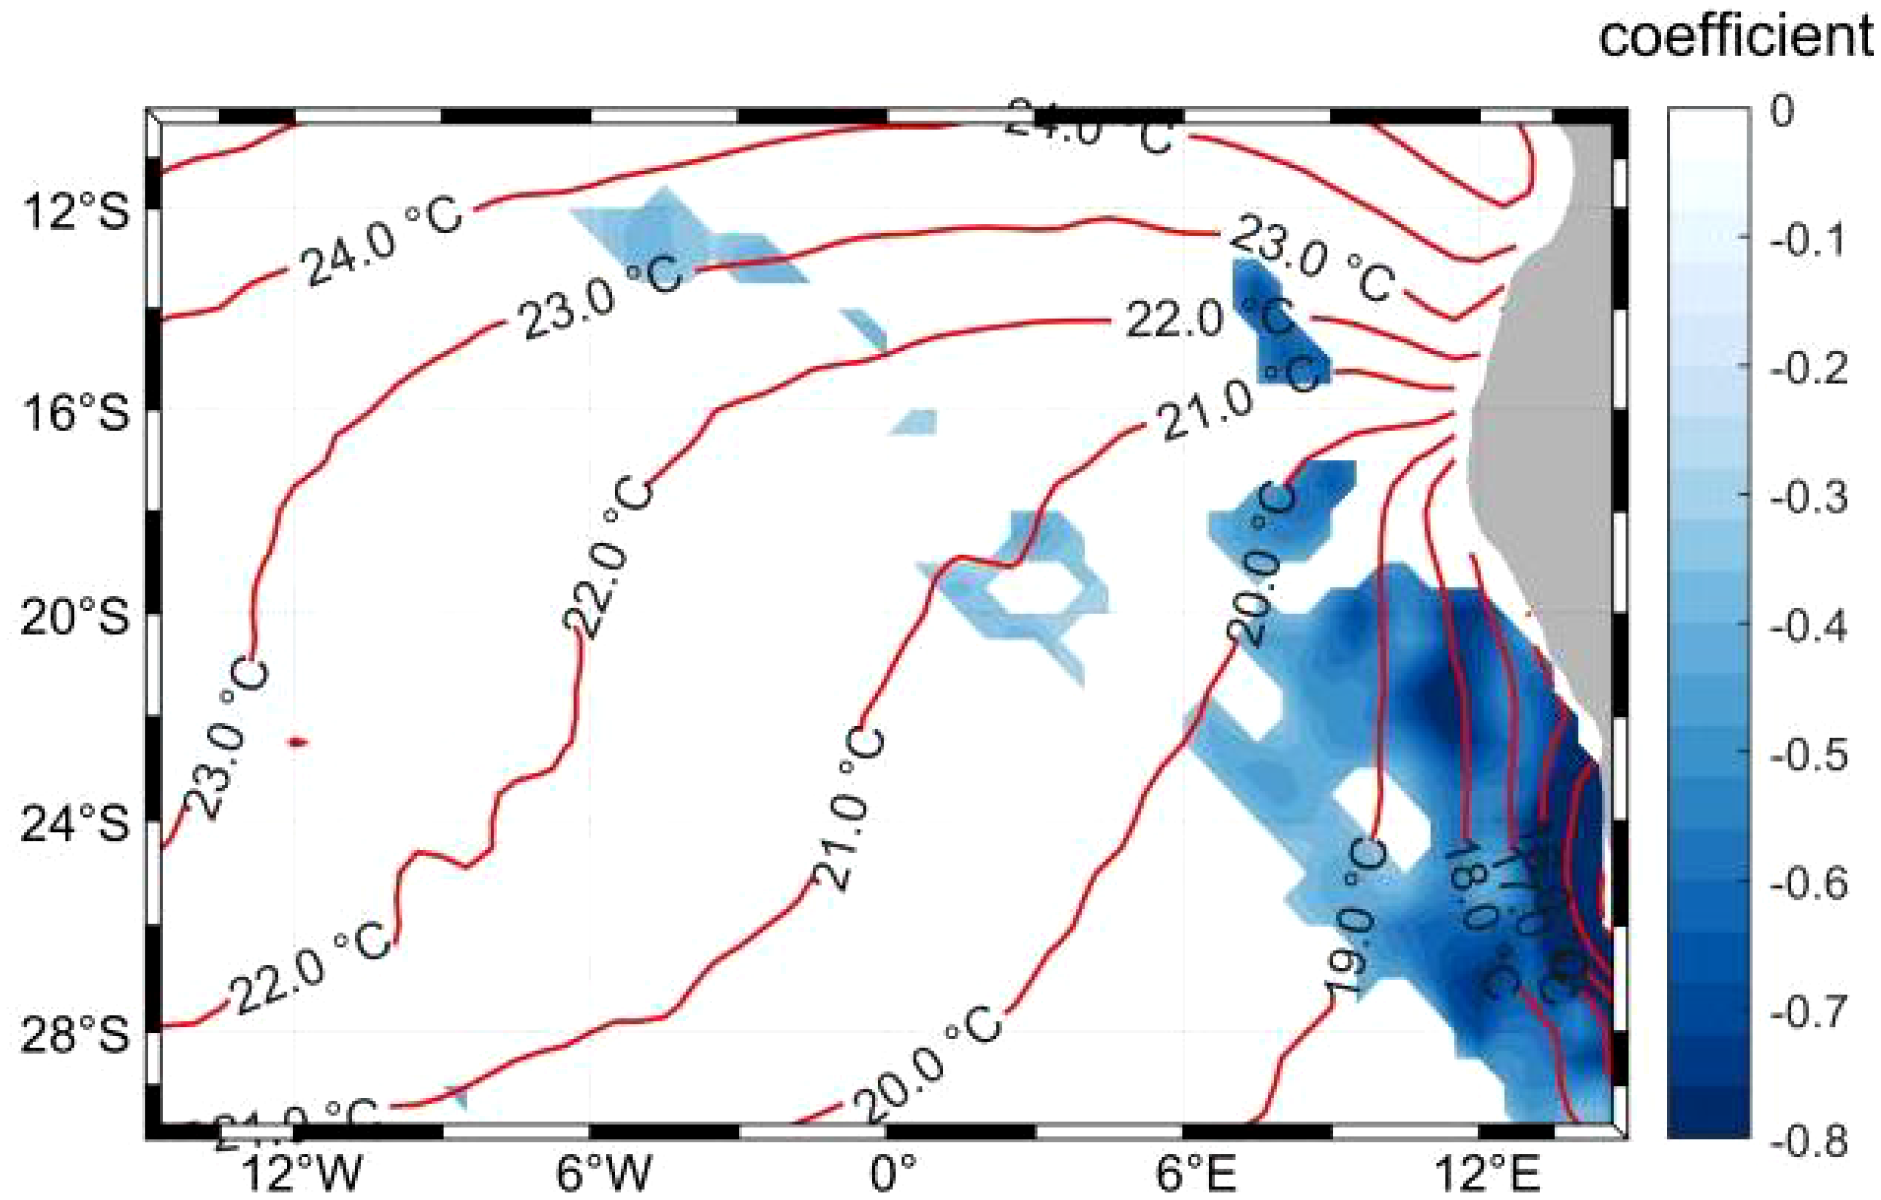
Spatial distribution of regression coefficients between meridional wave transport across 34°S latitude and SST in the Atlantic cold tongue region (contour lines represent the 70-year mean SST; shaded areas indicate regions statistically significant over the 95% confidence level).
Figure 8
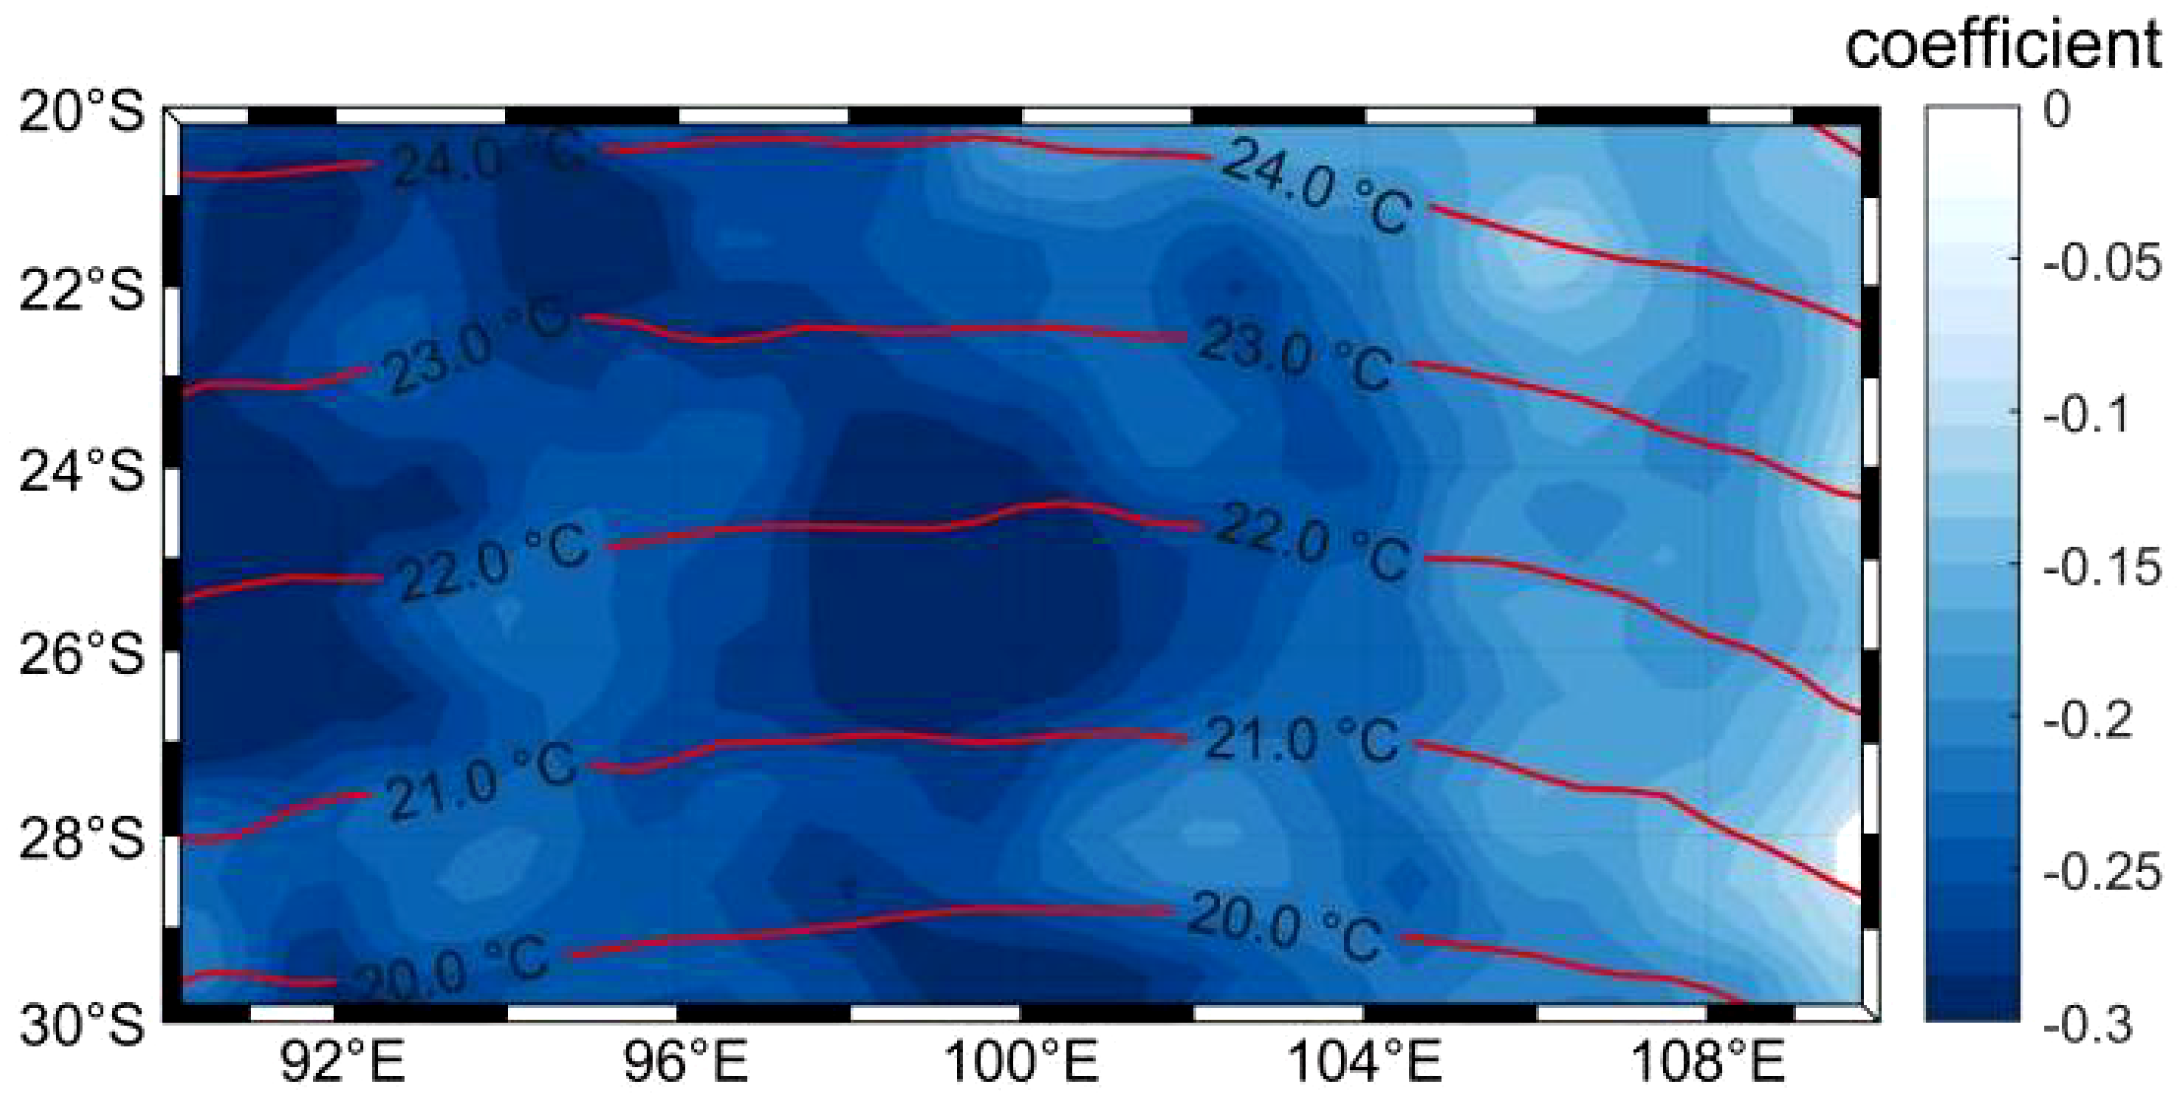
Spatial distribution of regression coefficients between meridional wave transport across 30°S latitude and SST in the cold tongue region of Indian Ocean (contour lines represent the 70-year mean SST; shaded areas indicate regions statistically significant over the 95% confidence level).
In the Indian Ocean, Figure 8 shows that the cooling effect of meridional water transport on SST is more pronounced in the central and western parts of the cold tongue. In contrast, while the temperature gradient is relatively strong on the eastern side of the cold tongue, the contribution of water transport in this region is not significant.
Consequently, the following discussion will primarily focus on the more representative Pacific cold tongue region. This does not suggest that the influence of wave-driven transport on SST is exclusive to the Pacific; rather, the oceanic dynamics in the Atlantic and Indian Oceans are more complex. A detailed discussion of the Atlantic and Indian Ocean cold tongues will be presented in Section 4.
To analyze the temporal and latitudinal variations of SST anomalies and meridional wave transport anomalies in the Pacific cold tongue region, zonal averages were computed across different latitudes within the longitudinal extent of the cold tongue. Li et al. (2021) identified a 5-year period of significant wave height in the South Pacific wavefield, and our results in Figure 9 indicates that anomalies of both SST and wave transport show a periodic variation on a timescale of 3~5a, which approaches to the period of ENSO. For instance, during significant positive wave transport anomaly events, such as those observed from 1953~1955 and 1972~1975, an increase in northward transport in mid- to high-latitude regions led to greater advection of cold water from high latitudes to low. Consequently, substantial negative SST anomalies were recorded in the 0°~25°S and 0°~32°S regions during 1954~1956 and 1973~1976, respectively, and the SST anomaly decreased by more than 0.5°C.
Figure 9
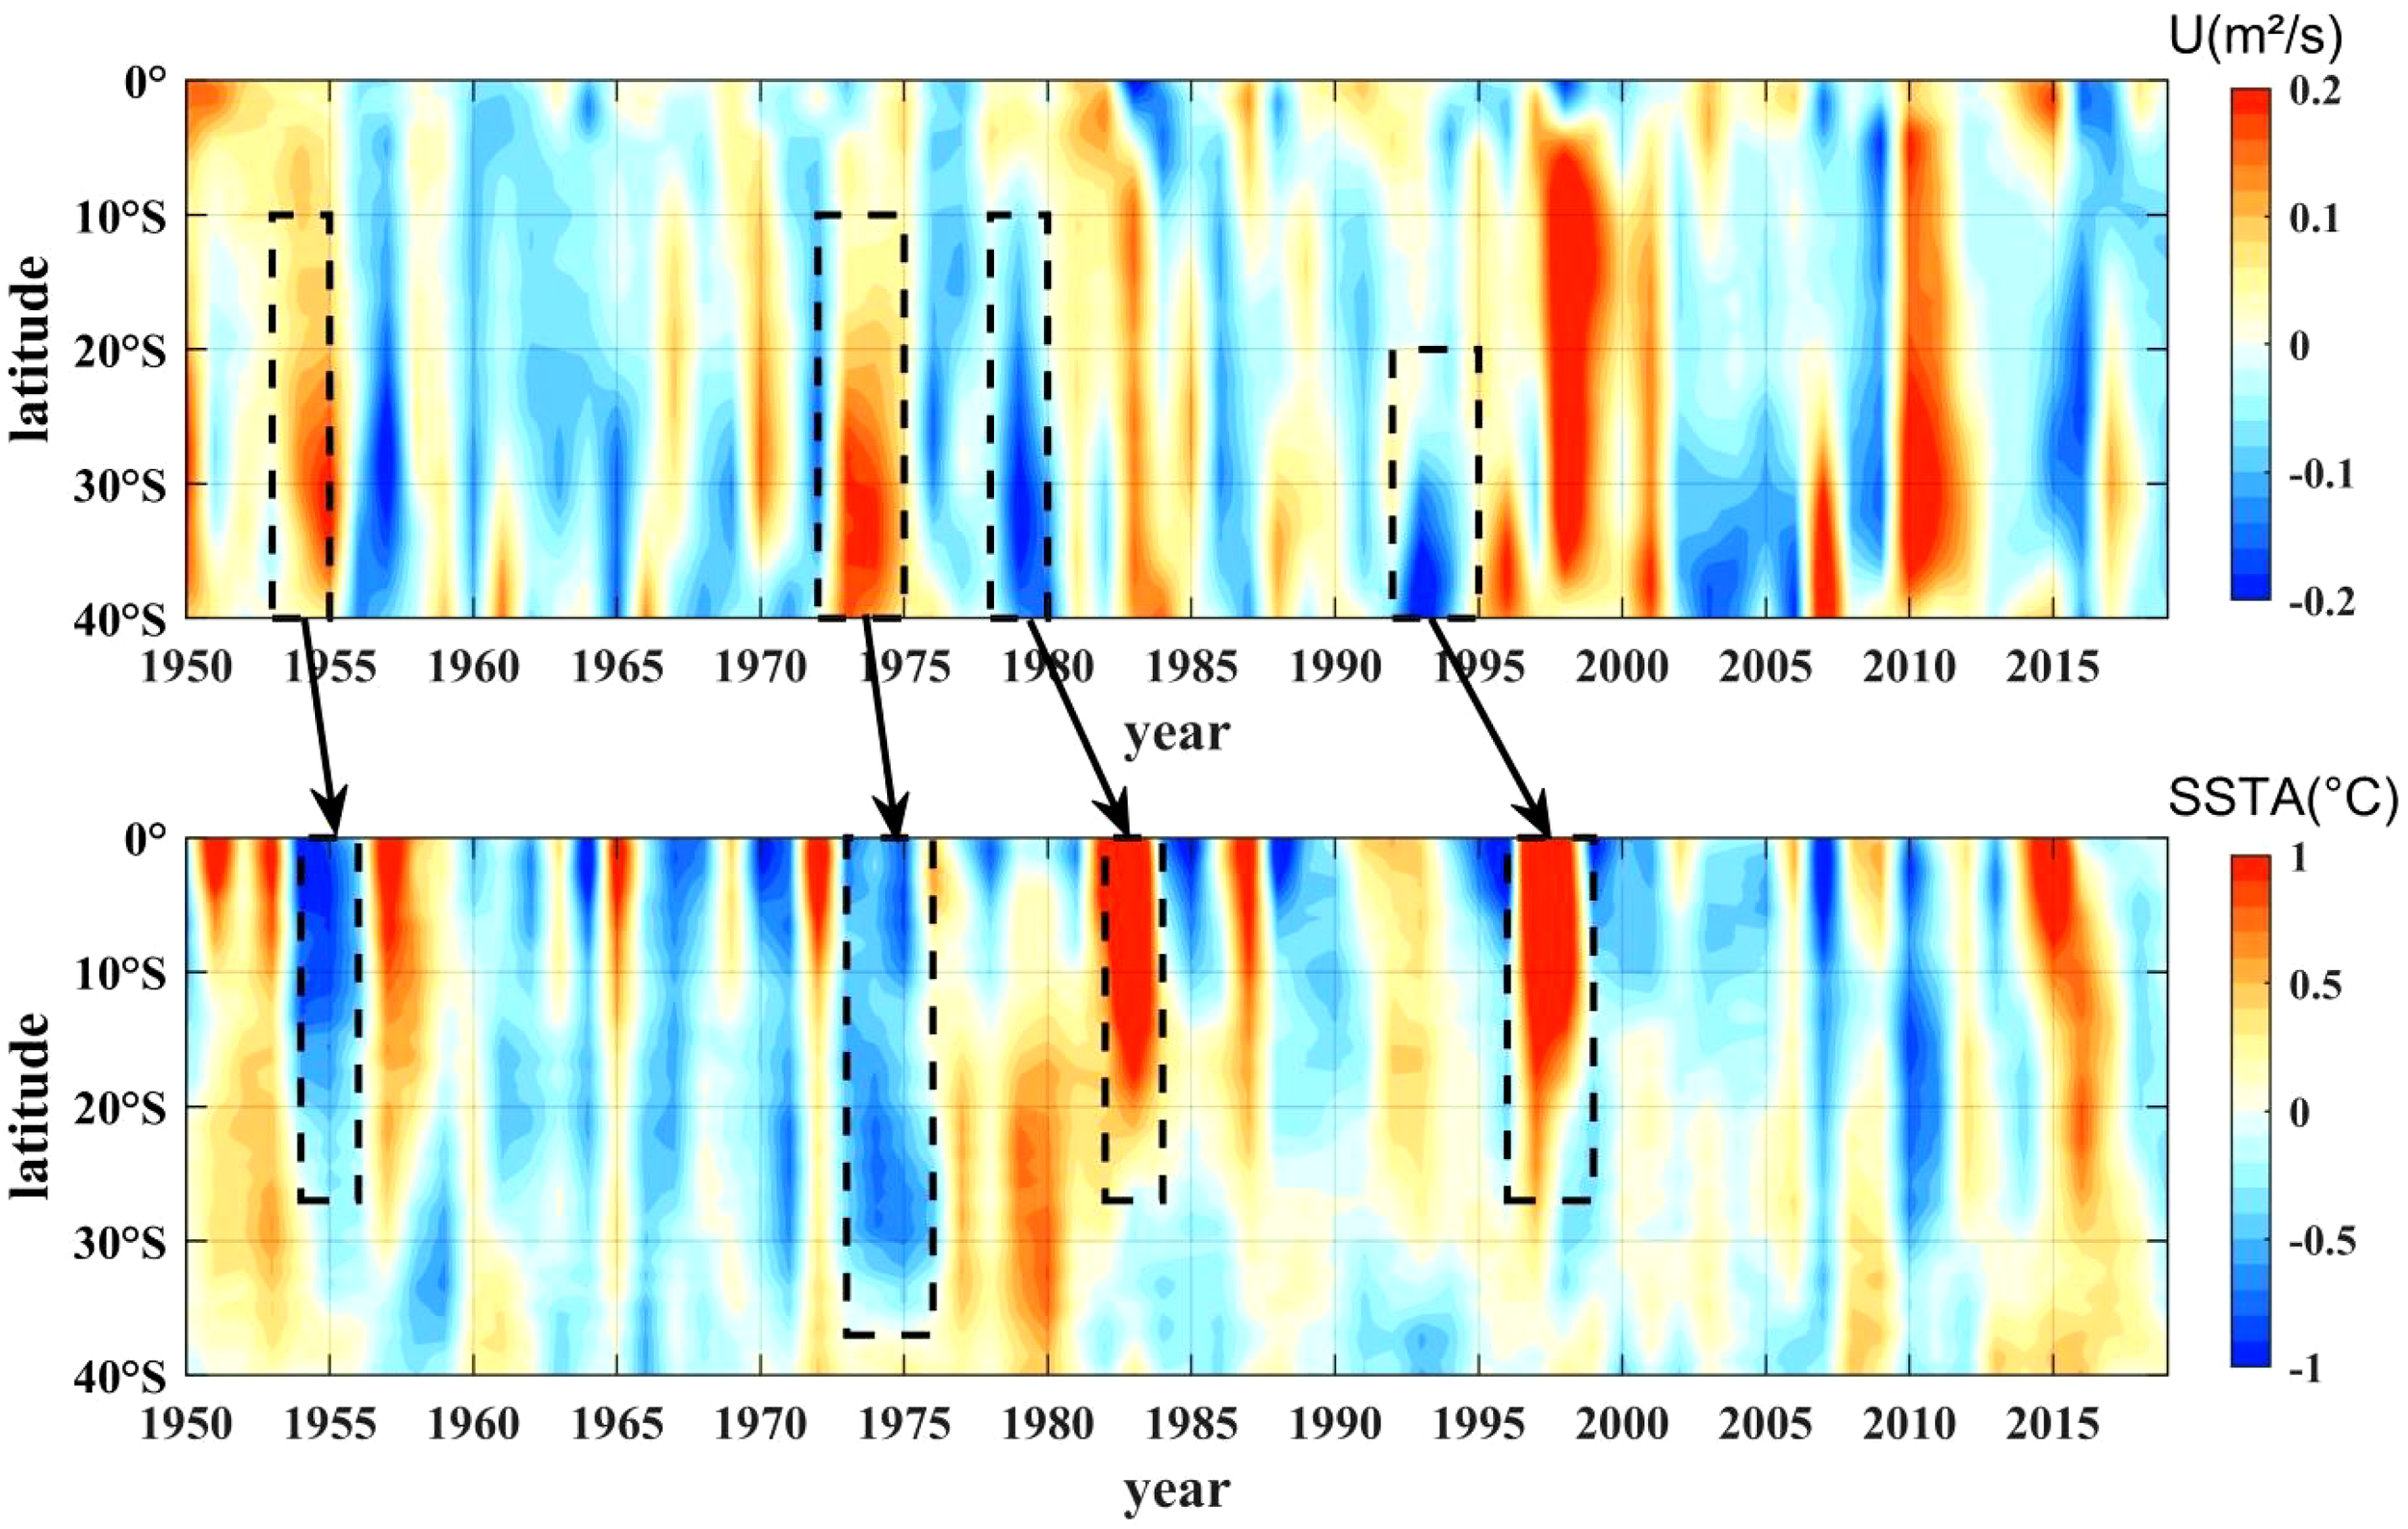
Temporal and latitudinal variation of meridional wave-induced water transport anomalies (the upper panel) and SST anomalies (the lower panel) in the cold tongue region. Positive SST anomalies indicate abnormally high temperatures, while positive transport anomalies indicate increased northward transport.
Conversely, during periods of significant negative meridional transport anomalies, such as 1978~1980 and 1992~1995, the reduced northward transport of cold water resulted in positive SST anomalies in subsequent years, notably 1982~1984 and 1996~1999, and the maximum value of SST anomaly reached 1°C.
To more clearly visualize the interannual variability of SST anomalies and wave-driven transport anomalies, Figure 10 presents the annual mean time series of SST anomalies in the Pacific cold tongue region (28°S~30°S, 75°W~105°W) and meridional wave transport anomalies across the section (30°S, 75°W~105°W). The variation in SST within the cold tongue region generally exhibits a negative correlation with the meridional water transport anomalies across the selected section. Notably, after periods of increased northward water transport anomalies in 1954~1955, 1969~1971, 1972~1975, 1983~1985, 1998~1999, and 2010~2012, negative SST anomalies were observed in the cold tongue region. During periods of pronounced wave-driven transport anomalies, such as 1972~1975 and 2010~2012, the maximum cold SST anomalies reached approximately 0.6°C. This suggests that the increased northward water transport brought more cold water into the low-latitude regions, mixing with local surface water and leading to a decrease in SST. Conversely, during the periods of reduced northward water transport anomalies, such as 1956~1958, 1976~1980, 1992~1995, 2007~2009, and 2013~2016, positive SST anomalies were observed in the Pacific cold tongue region. When wave-driven transport exhibited significantly low anomalies during 1976~1980, the corresponding SST anomalies reached a maximum low of approximately 0.8°C.
Figure 10
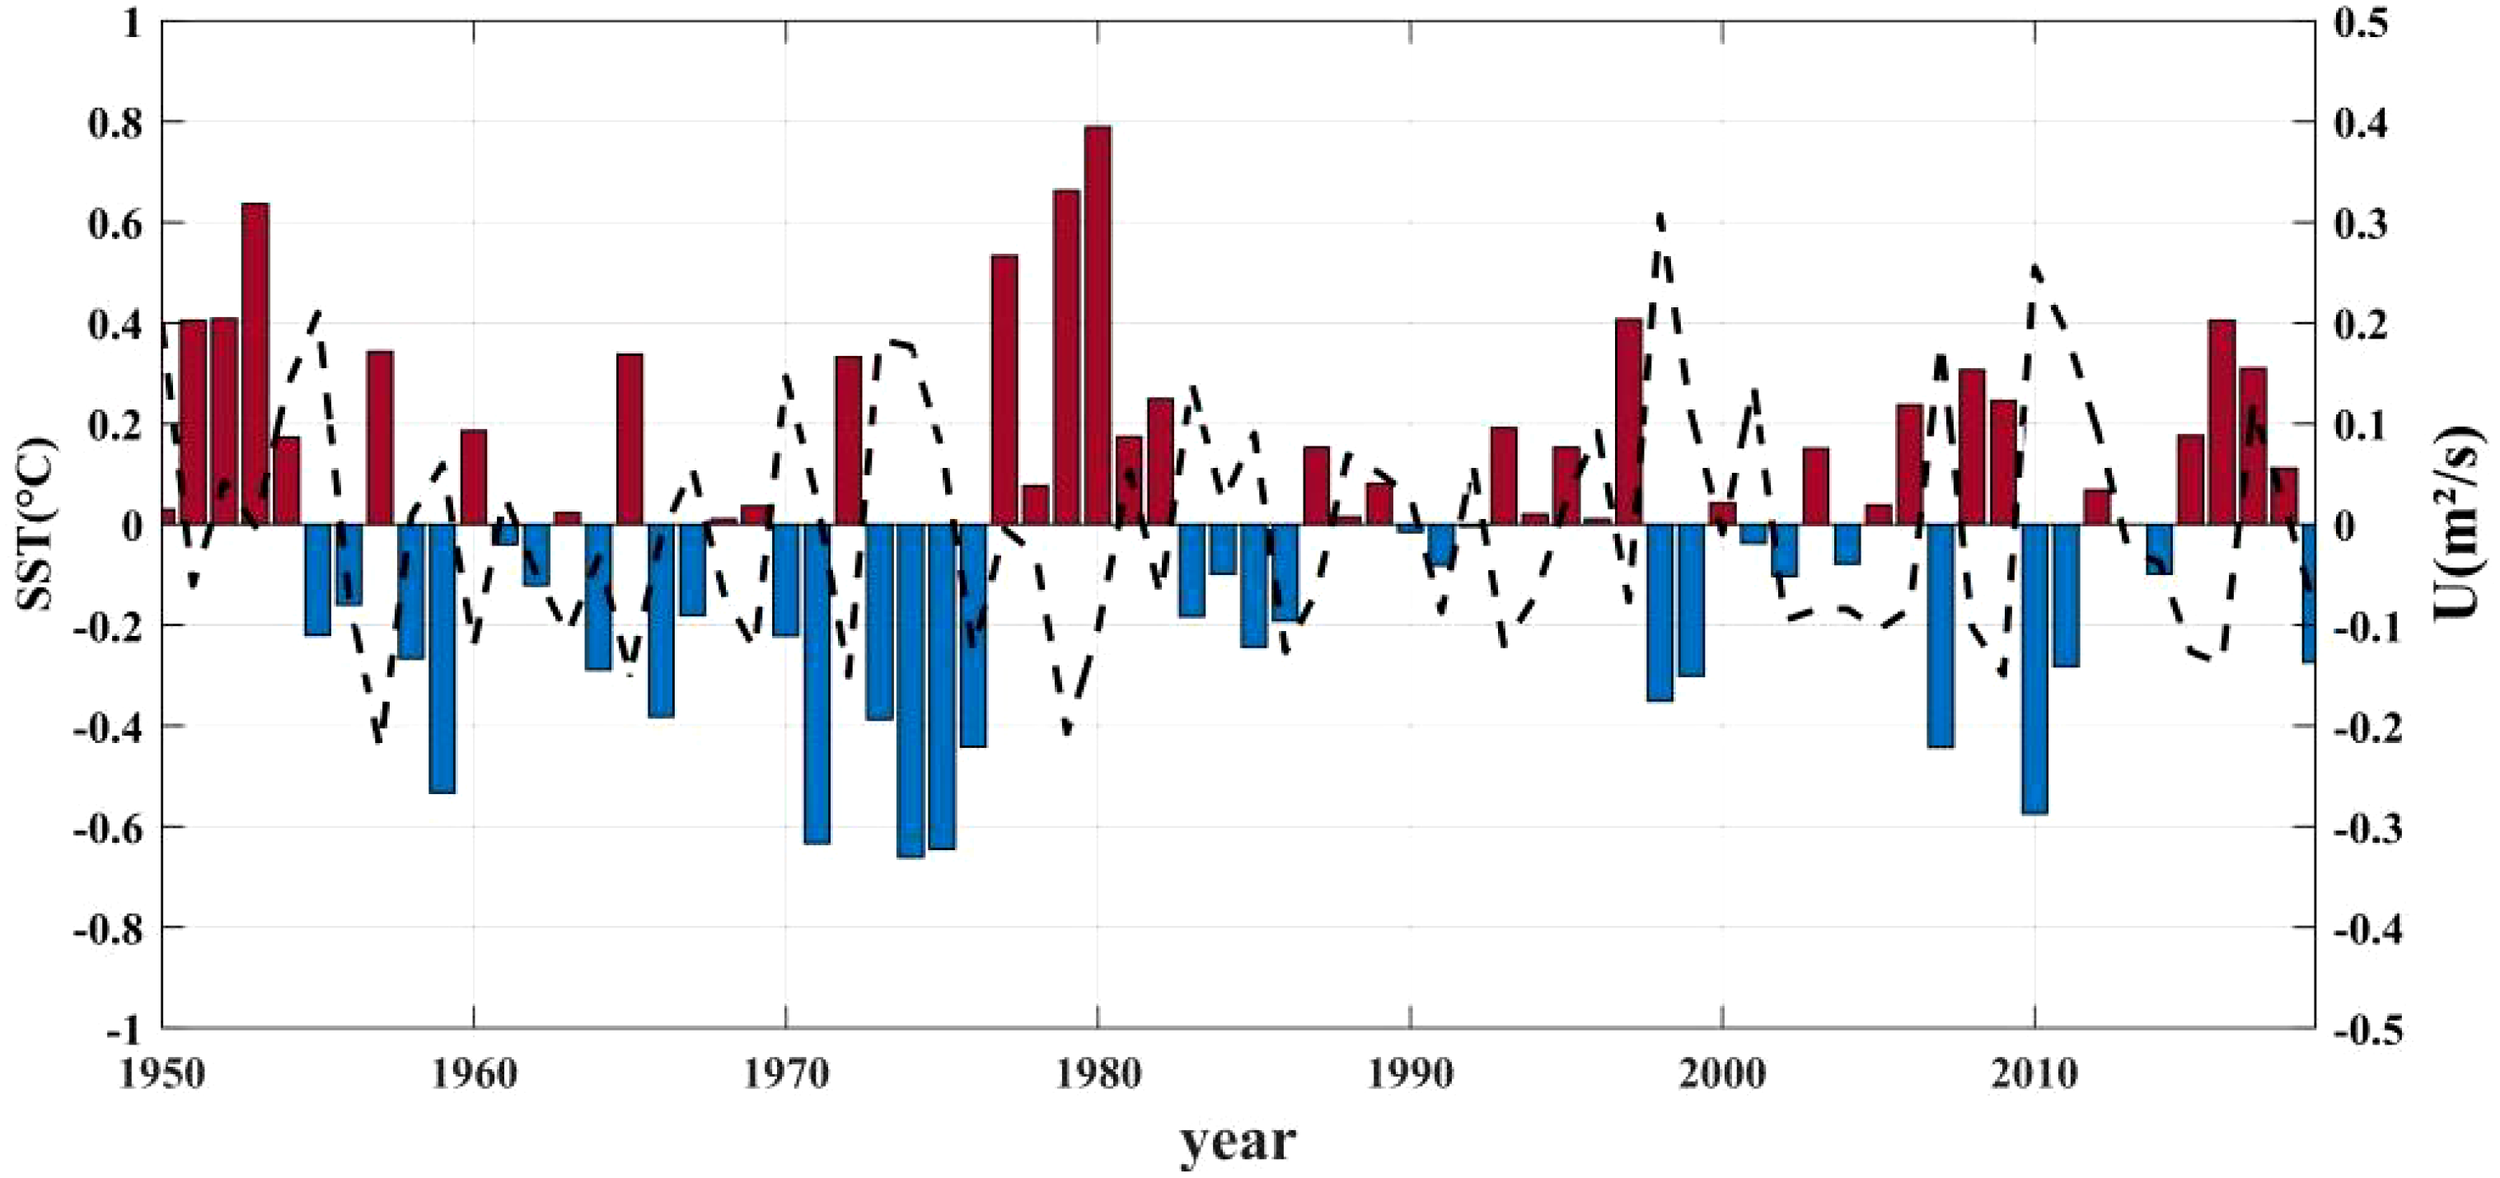
Time series of annual mean SST anomalies in the Pacific cold tongue (28°S~30°S, 75°W~105°W) and meridional wave-driven water transport anomalies across the section (30°S, 75°W~105°W). The shaded areas represent SST anomalies; the dashed line represents the changes in northward water transport anomalies.
Based on the interannual variability analysis presented in Figures 9 and 10, a decrease in SST in low-latitude regions occurs 1~2 years lag to an increase in northward wave-driven transport from high-latitude regions corresponds to, highlighting a lagged negative correlation between the two.
To quantify the relationship between wave-induced water transport and SST in the cold tongue region, monthly SST values across the section (22°S, 75°W~105°W) and monthly meridional wave transport from different latitudes from 24°S to 39°S were selected. The lead-lag correlation coefficients between these variables were calculated, as shown in Figure 11; Table 1. The results indicate that SST anomalies generally lag-behind meridional water transport anomalies by approximately 3~4 months, with negative correlation coefficients, suggesting a cooling effect of meridional water transport on SST. This finding is consistent with the negative correlation observed in Figure 9 between meridional wave transport at high latitudes and SST anomaly at low latitudes, thereby corroborating the conclusion, and further refines the temporal characteristics of the lagged effects. As latitude increases, the lag time between SST anomalies and meridional water transport anomalies also increases. From 24°S to 33°S, the absolute value of the correlation coefficient increases with latitude, reaching a maximum value of 0.531 at 33°S, with a lag time of 3 months. However, as latitude continues to increase, the lag time extends, and the absolute value of the correlation coefficient gradually decreases, reaching a lag time of 4 months and a correlation coefficient of 0.381 at 39°S.
Figure 11
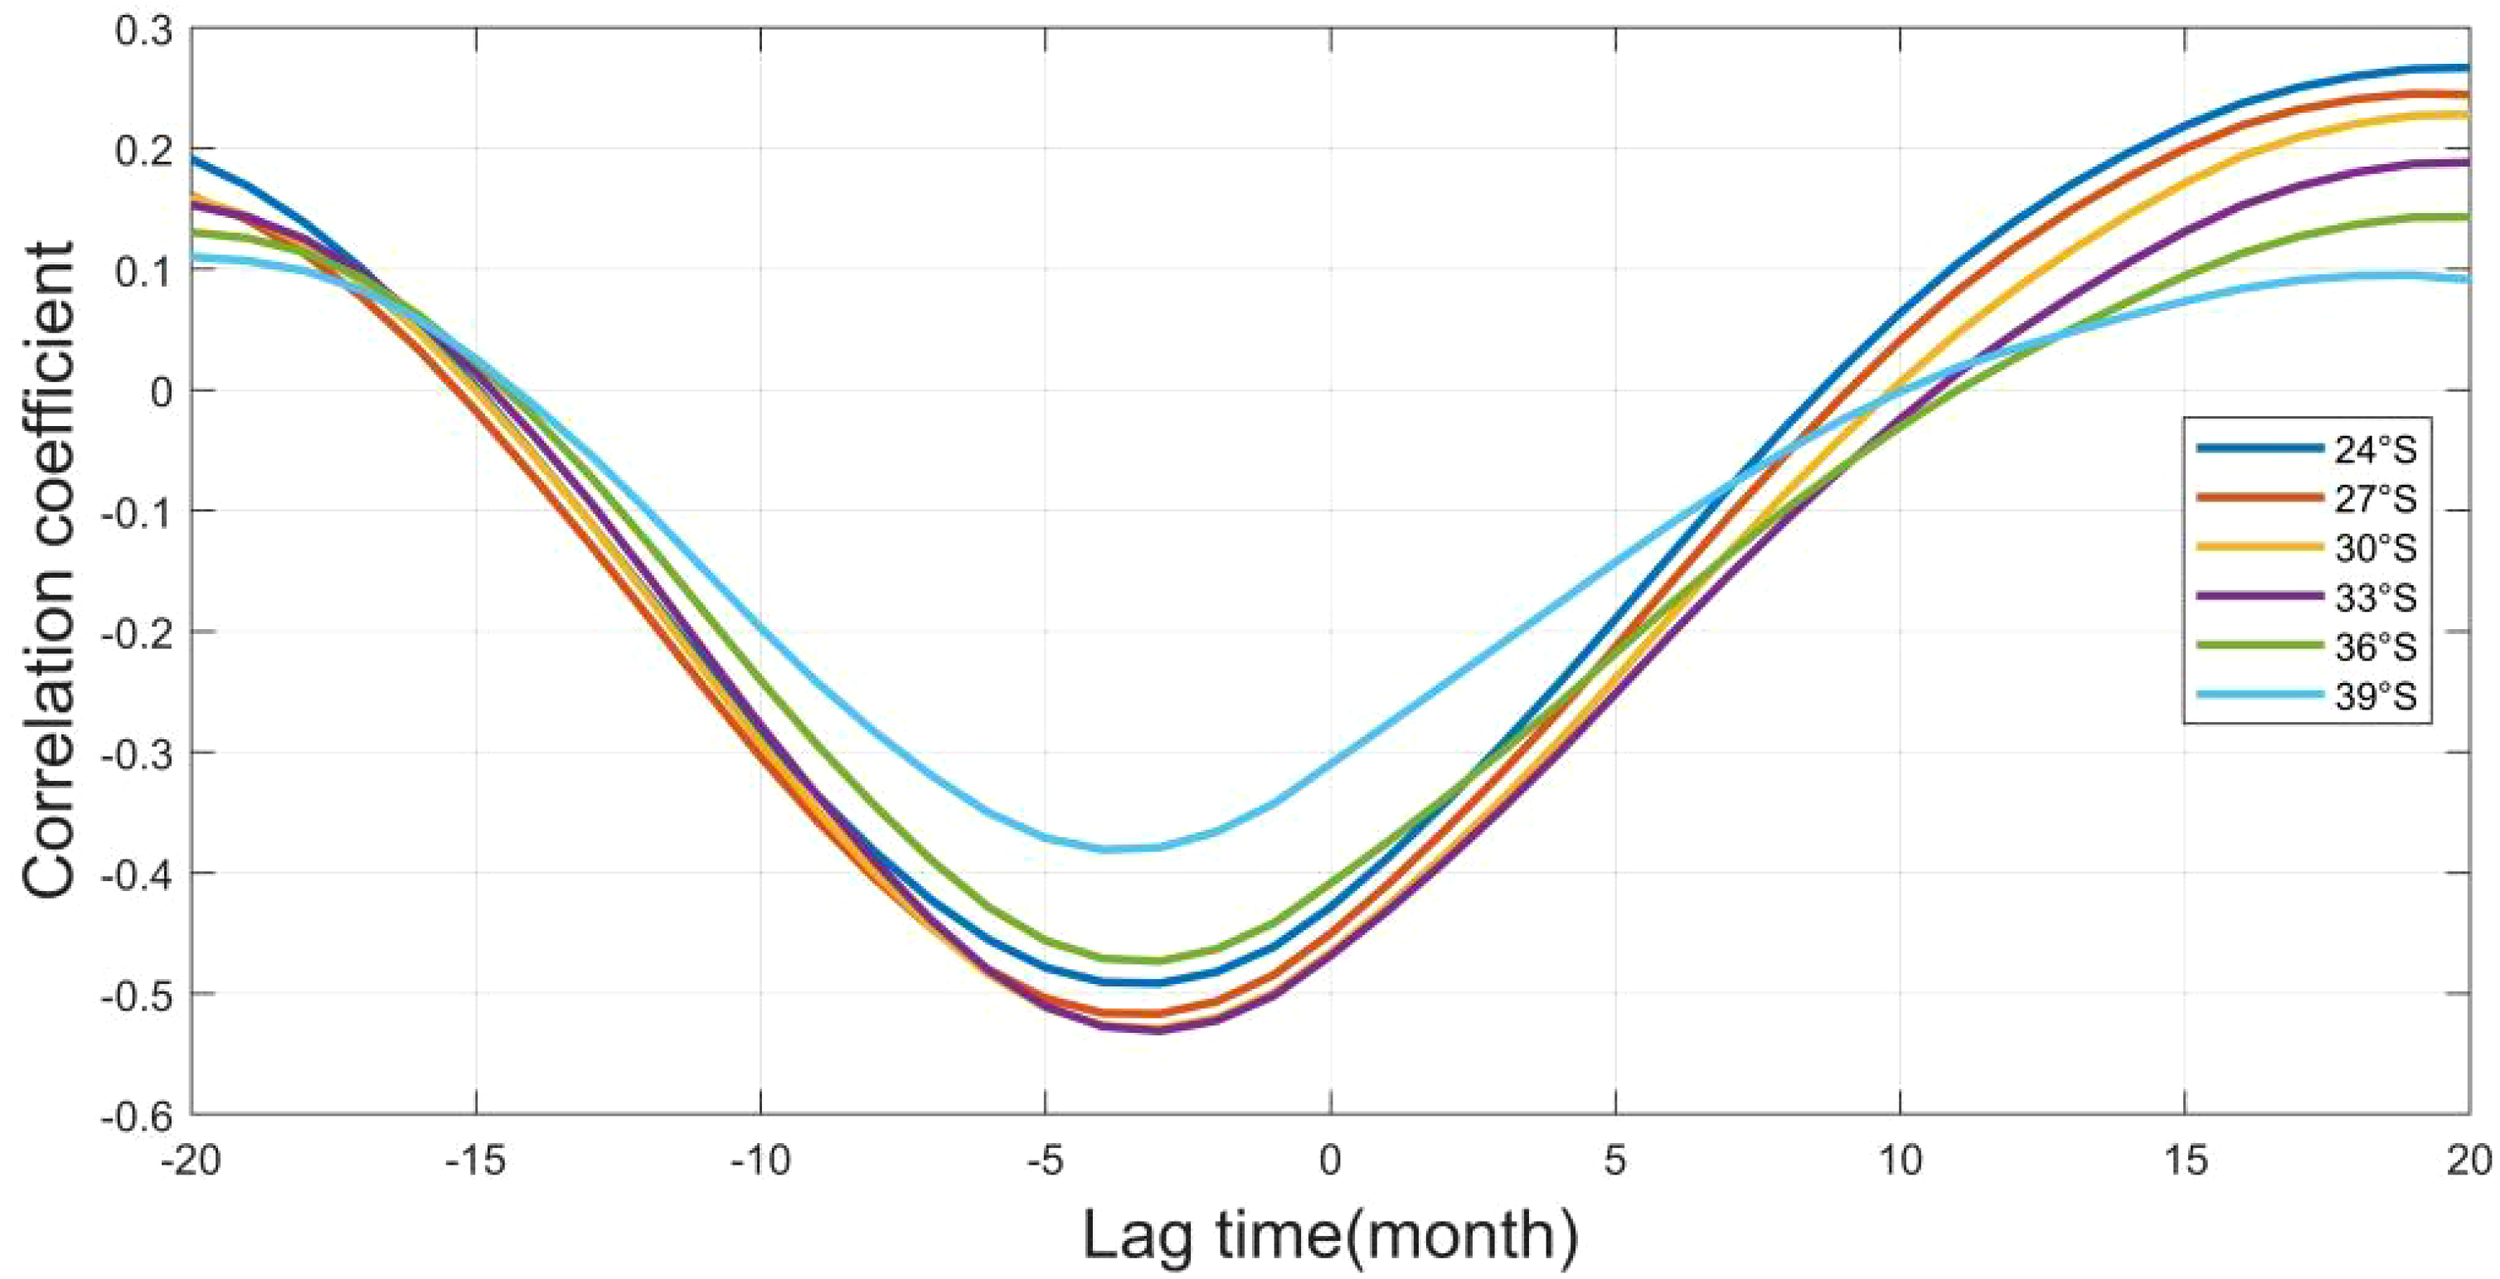
Lead-lag correlation between monthly SST anomalies at the cross-section (22°S, 75°W~105°W) and meridional wave-induced water transport anomalies across different latitudes in the Pacific cold tongue region.
Table 1
| Latitude | Lag time (month) | Correlation coefficient |
|---|---|---|
| 24°S | 3 | -0.492 |
| 27°S | 3 | -0.517 |
| 30°S | 3 | -0.530 |
| 33°S | 3 | -0.531 |
| 36°S | 3~4 | -0.473 |
| 39°S | 4 | -0.381 |
Maximum absolute values of the lead-lag correlation coefficients between monthly SST anomalies in the Pacific cold tongue region (22°S, 75°W~105°W) and monthly meridional wave transport anomalies across different latitude sections, along with corresponding lag times.
To explore the cooling effects of meridional water transport across different latitudes on SST in the cold tongue region, the spatial distribution of the regression coefficients between meridional water transport through latitude sections from 30°S to 38°S and SST in the cold tongue region was plotted (only showing regions statistically significant over the 95% confidence level). As shown in Figure 12, the regression analysis of meridional transport at different latitudes which are at south of the cold tongue and SST in the cold tongue region indicates that the regression coefficients are all negative, meaning that meridional water transport at different latitudes has a cooling effect on SST at all locations within the cold tongue region. The larger absolute value of the regression coefficient, the stronger contribution of meridional water transport to SST cooling at that location. As latitude increases, the effect of meridional transport on SST gradually shifts southward. This also corresponds to the results shown in Figure 11, where the influence of wave-driven transport across a given latitude on the cold tongue SST gradually diminishes with increasing latitude. The strongest cooling effect of meridional transport on SST occurs along the northeastern boundary of the cold tongue region, where the isotherms are more notably slanted than in other regions. The cooling effect of meridional transport results in significantly lower SST in this region compared to other areas at the same latitude, and the maximum SST difference at the same latitude in this region is approximately 6~7°C. According to the spatial distribution of wave transport, it is evident that along the eastern boundary of the cold tongue region, both northward and westward water transports are relatively large. As it shown in Figure 2, both of meridional and zonal SD present a negative correlation with SST. Therefore, due to the combined effect of meridional and zonal transports, cold waters from higher latitudes accumulate westward, leading to a region in the western part of the cold tongue where the cooling effect of meridional transport is more significant, with noticeably slanted isotherms. Furthermore, within the latitude range of 30°S to 38°S, the impact of meridional transport on SST in the cold tongue region diminishes from northeast to southwest. In the cold tongue region, there is an area extending from the northwest to the southeast where the regression results cannot pass the 95% confidence test. Codron (2011) used a slab ocean model to calculate the Ekman heat transport in the ocean, revealing a heating effect in this area. This may explain why the regression relationship between SST and wave-driven water transport does not pass the 95% confidence test in this region.
Figure 12
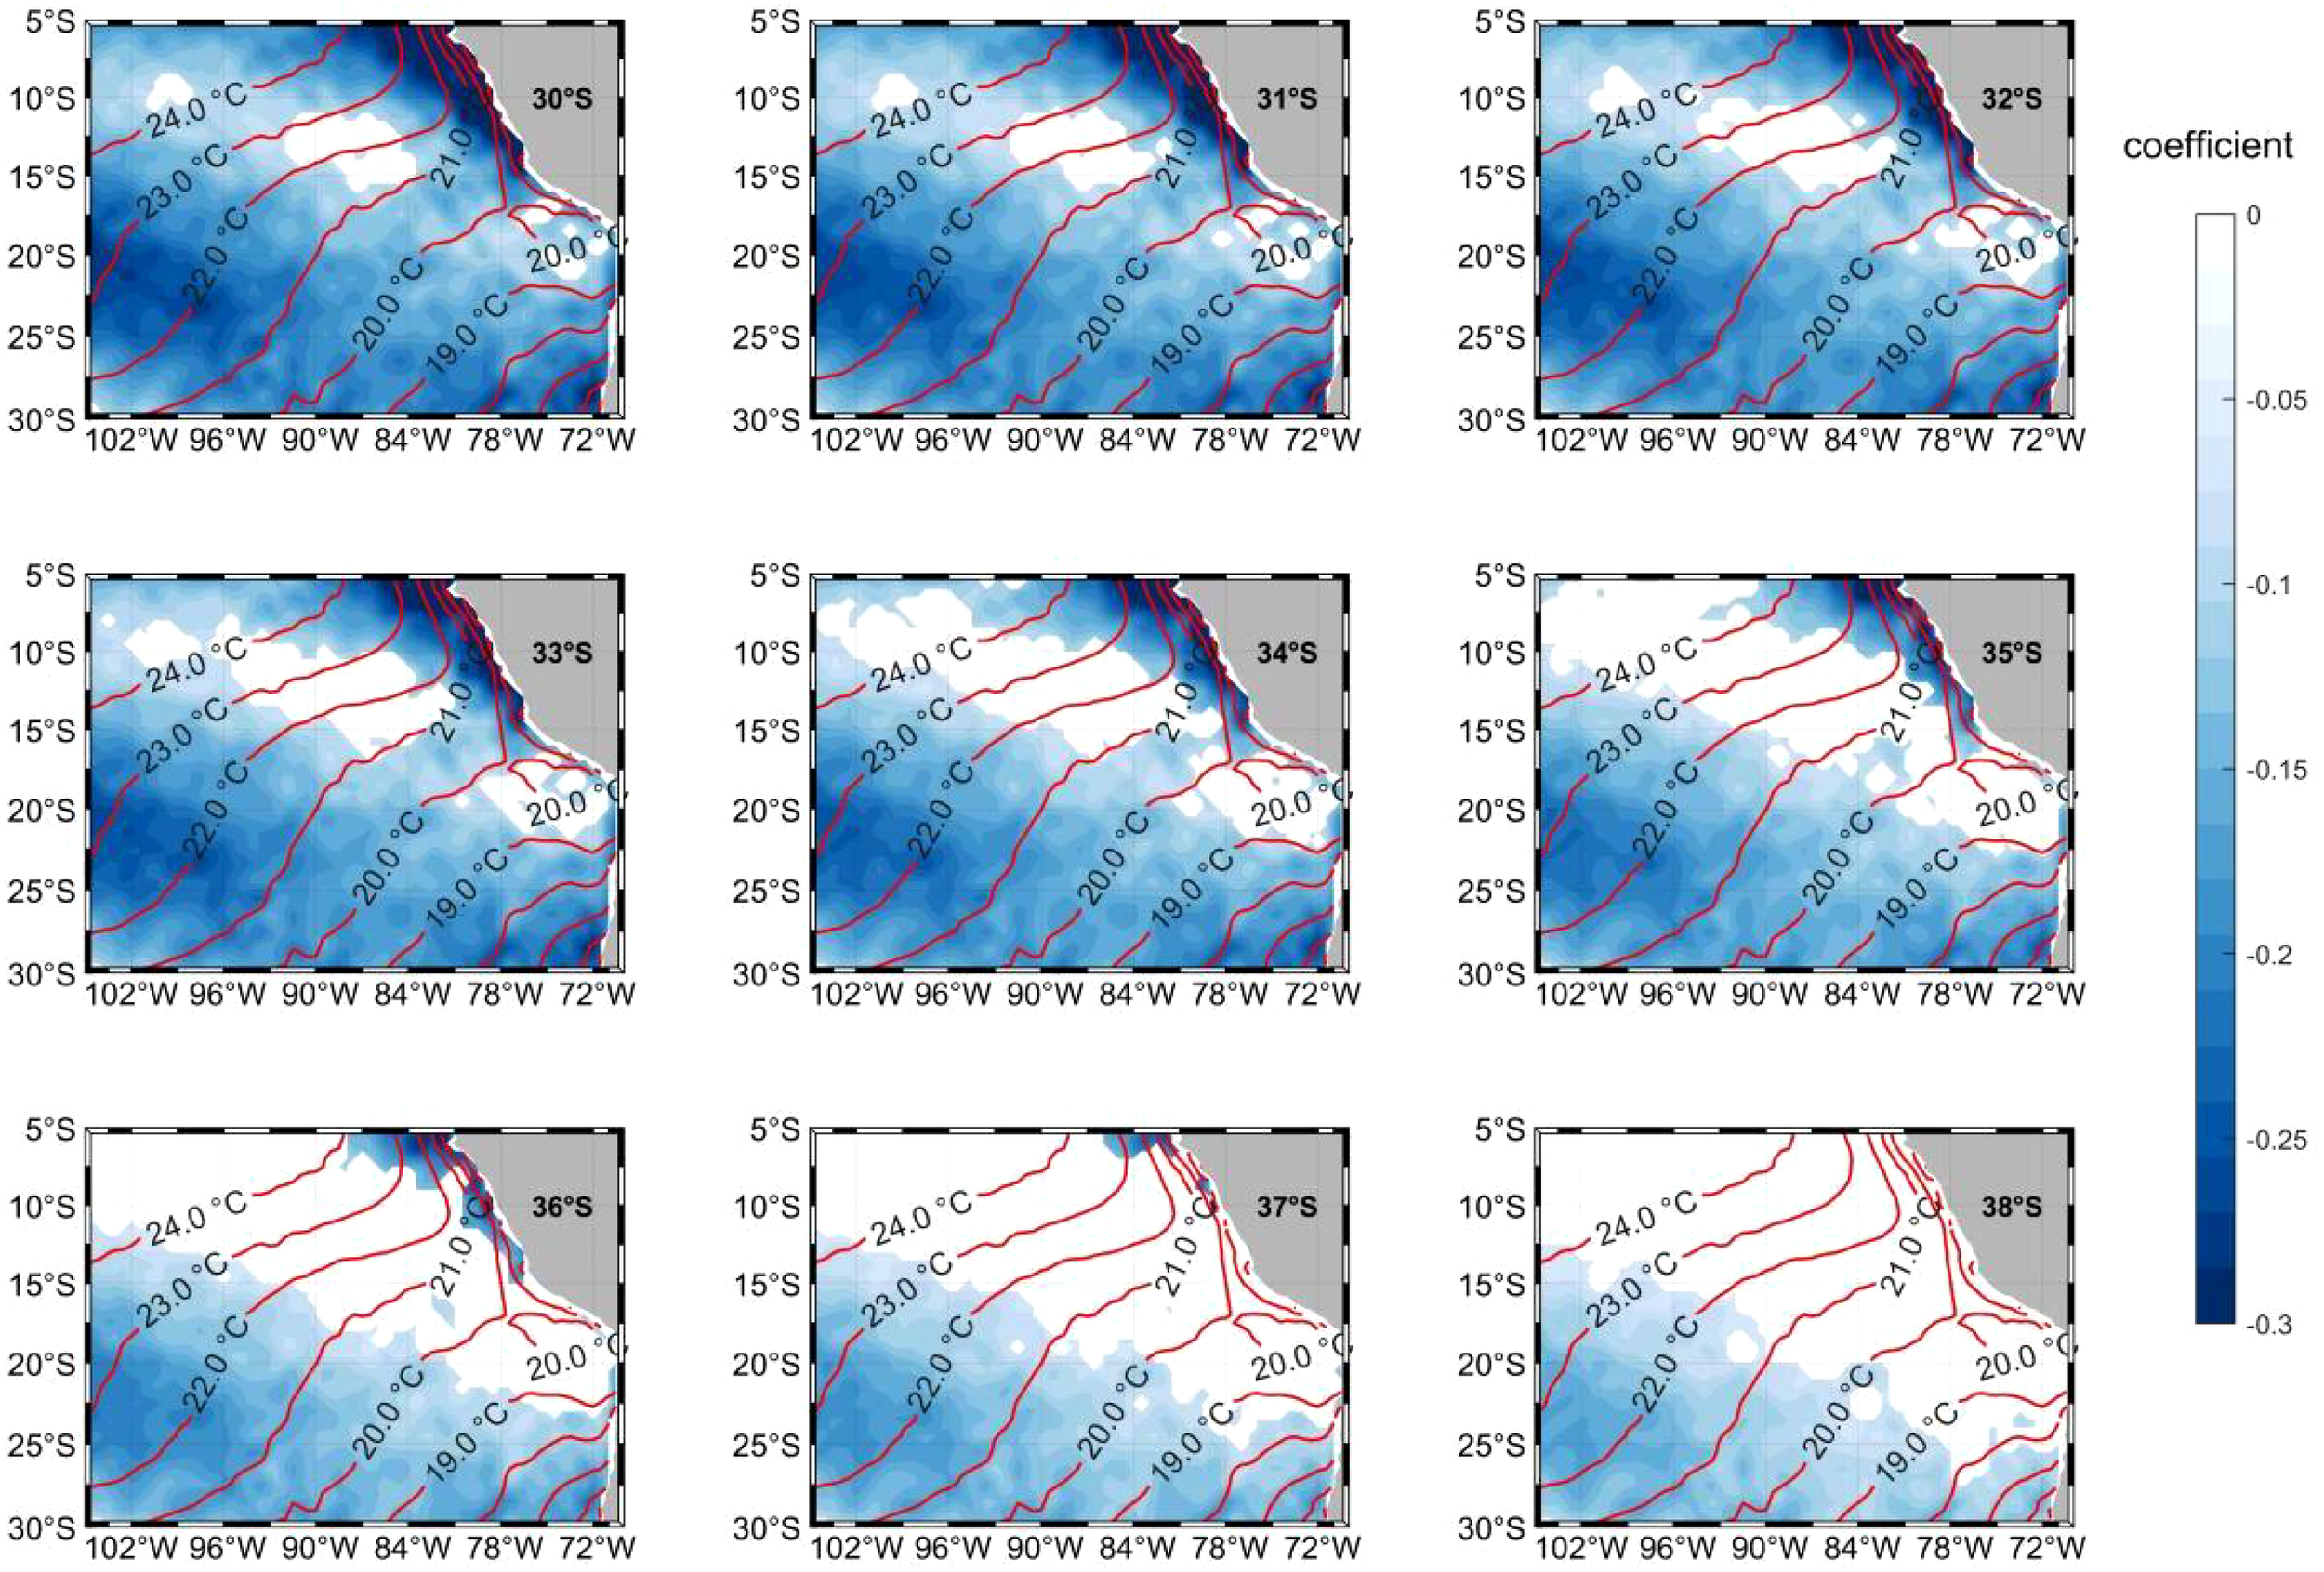
Spatial distribution of regression coefficients between meridional wave transport across different latitudes and SST in the Pacific cold tongue region (contour lines represent the 70-year mean SST; shaded areas indicate regions statistically significant over the 95% confidence level).
4 Discussion
Wave transport plays an important role on SST in cold tongue regions by compared with Ekman transport, and establish an explicit negative correlation exists between SST and northern water transport from higher latitudes. SST anomalies in the cold tongue region consistently lag behind anomalies in meridional water transport by approximately 3~4 months. This indicates that the northward transport of cold water effectively reduces temperatures in the region, specially, meridional water transport across different latitudinal sections from 30°S to 38°S significantly contributes to SST cooling in the cold tongue region. The extent of influence shifts southward and diminishes as latitude increases. Notably, the strongest cooling effect occurs along the northeastern coastline of the cold tongue, where SST is substantially lower than that of other areas at the same latitude. The above results indicate that northward-propagating waves originating from the high-latitude regions of the Southern Ocean exert a cooling effect on the SST in the mid- to low-latitude regions of the southeastern Pacific. This finding also corroborates the conclusion that high-latitude oceanic climate variability can influence low-latitude regions through meridional processes on short-interannual time scales (Servain et al., 1999). Li et al. (2021) demonstrated that wave-driven transport in the Southern Ocean can restore anomalous SST in tropical oceans to normal levels. Building on this research, the present study further explores the impact of northward wave-driven transport from the Southern Ocean on SST in the eastern mid- to low-latitude ocean regions, thereby enriching the understanding of the large-scale effects of wave. However, we observed that the meridional wave-induced transport in the Atlantic and Indian Oceans does not exhibit the obvious correlation with the SST in cold tongue regions as observed in the Pacific Ocean.
In the Atlantic, eastward-propagating equatorial waves extend toward the African coast, where the signal splits into two distinct poleward branches along the coastline before reflecting westward (Hormann and Brandt, 2007). Both the southward-flowing African coastal current and westward-propagating waves contribute to ocean variability in the low-latitude southeastern Atlantic. These findings explain the reasons why the results presented in Figure 7, which shows that the cooling effect of waves on SST is not particularly pronounced in low-latitude regions. Instead, statistically significant cooling effects are observed near the Southern Ocean, where topographic constraints are minimal, and waves originating from the Southern Ocean have a greater influence.
In the Indian Ocean, the presence of monsoons gives rise to a complex circulation system. The Leeuwin Current, an eastern boundary current in the Indian Ocean (Schott et al., 2009), originates in the tropics and transports warm, low-salinity water southward along the coast of Western Australia (Waite et al., 2007). Additionally, prevailing monsoon winds blow primarily northwestward over the eastern Indian Ocean (Semedo et al., 2011), potentially altering the direction of wave-driven transport and preventing it from propagating along the coast. This results in the accumulation of cooling effects toward the central ocean, consistent with the pattern observed in Figure 8.
Due to the complex oceanic processes in these two basins, we cannot directly apply the research methodology used for the Pacific cold tongue, and thus, the results are not presented in this paper. However, this does not imply that wave-driven transport has no influence on cold tongue SST in the Atlantic and Indian Oceans. Based on the considerable role of wave transport in these two cold tongue regions presented in Figures 3, 4, we suppose that wave-driven transport may contribute to SST in these regions, though further investigation is required to confirm this relationship.
Our study relies on ERA5 reanalysis data. Based on this data, trends in wave transport and wind speed were analyzed and shown in Figures 5, 6. Although the results are generally consistent with previous studies (Casas-Prat et al., 2024; Liu et al., 2023a, 2024; Young et al., 2011), there are perhaps some limitations in the results obtained due to the effect of wave data assimilation in the ERA5 data (Liu et al., 2023b).
It has been proved that low-latitude climate oscillations, such as ENSO, modulates the ocean wave in Southern Ocean, through the action of atmospheric circulation (Liu et al., 2023a), and northward wave transport from Southern Ocean affect low-latitude SST anomalies (Li et al., 2021). As shown in Figure 9, the year of occurrence of the northward wave transport anomalies is associated with significant ENSO events, and after the wave transport anomaly occurred, the low-latitude SST also showed anomalous values. This seems that there is a closed loop between long-term climate variability and wave transport, also provides a new perspective that long-term climate oscillations may ultimately have an influence on cold tongue at low latitudes by influencing wave transport.
In summary, this study investigated the effect of wave-induced transport on cold tongue, highlighting a connection between wave-induced transport and the South Pacific cold tongue. These findings offer a new perspective for understanding the causes of global SST anomalies and the large-scale effects of ocean waves. Future work will quantify the impact of wave-induced transport on SST in the three major cold tongue regions using numerical models and aims to enhance the understanding of wave-induced transport effects on SST in the Pacific cold tongue region while filling the research gap concerning the Atlantic and Indian Ocean.
Statements
Data availability statement
Publicly available datasets were analyzed in this study. This data can be found here: European Centre for Medium-Range Weather Forecasts (ECMWF)https://cds.climate.copernicus.eu/.
Author contributions
YW: Conceptualization, Investigation, Visualization, Writing – original draft, Writing – review & editing. KW: Formal Analysis, Funding acquisition, Project administration, Writing – review & editing. RL: Conceptualization, Writing – review & editing. WZ: Writing – review & editing. XD: Writing – original draft. LL: Methodology, Writing – review & editing.
Funding
The author(s) declare that financial support was received for the research and/or publication of this article. This research was funded by the National Natural Science Foundation of China under grant numbers 42176018, U20A2099 and 41976017. This work is also supported by the National Key Research and Development Program of China (2022YFC3105002 and 2023YFC3107803).
Acknowledgments
We appreciate the reviewers for their comments and suggestions, which helped to improve the quality of this manuscript.
Conflict of interest
The authors declare that the research was conducted in the absence of any commercial or financial relationships that could be construed as a potential conflict of interest.
Generative AI statement
The author(s) declare that no Generative AI was used in the creation of this manuscript.
Publisher’s note
All claims expressed in this article are solely those of the authors and do not necessarily represent those of their affiliated organizations, or those of the publisher, the editors and the reviewers. Any product that may be evaluated in this article, or claim that may be made by its manufacturer, is not guaranteed or endorsed by the publisher.
References
1
Alexander M. A. Scott J. D. (2008). The role of ekman ocean heat transport in the northern hemisphere response to ENSO. J. Clim21, 5688–5707. doi: 10.1175/2008jcli2382.1
2
Bao Y. Song Z. Qiao F. (2020). FIO-ESM version 2.0: model description and evaluation. J. Geophys. Res. Oceans125, e2019JC016036. doi: 10.1029/2019JC016036
3
Bi F. Wu K. Zhang Y. (2012). The effect of Stokes drift on Ekman transport in the open sea. Acta Oceanol. Sin.31, 12–18. doi: 10.1007/s13131-012-0249-1
4
Bjerknes J. (1969). Atmospheric teleconnections from the equatorial pacific. Mon. Weather Rev.97, 163–172. doi: 10.1175/1520-0493(1969)097<0163:ATFTEP>2.3.CO;2
5
Carrasco A. Semedo A. Isachsen P. E. Christensen K. H. Saetra Ø. (2014). Global surface wave drift climate from ERA-40: the contributions from wind-sea and swell. Ocean Dyn64, 1815–1829. doi: 10.1007/s10236-014-0783-9
6
Casas-Prat M. Hemer M. A. Dodet G. Morim J. Wang X. L. Mori N. et al . (2024). Wind-wave climate changes and their impacts. Nat. Rev. Earth Environ.5, 23–42. doi: 10.1038/s43017-023-00502-0
7
Chen G. Chapron B. Ezraty R. Vandemark D. (2002). A global view of swell and wind sea climate in the ocean by satellite altimeter and scatterometer. J. Atmos. Ocean. Technol.19, 1849–1859. doi: 10.1175/1520-0426(2002)019<1849:AGVOSA>2.0.CO;2
8
Codron F. (2011). Ekman heat transport for slab oceans. Clim. Dyn.38, 379–389. doi: 10.1007/s00382-011-1031-3
9
Hersbach H. Bell B. Berrisford P. Hirahara S. Horányi A. Muñoz-Sabater J. et al . (2020). The ERA5 global reanalysis. Q. J. R. Meteorol. Soc146, 1999–2049. doi: 10.1002/qj.3803
10
Hormann V. Brandt P. (2007). Atlantic Equatorial Undercurrent and associated cold tongue variability. J. Geophys. Res. Oceans.112. doi: 10.1029/2006JC003931
11
Li S. Babanin A. Liu Q. Liu J. Li R. Voermans J. (2025). Effect of ocean surface waves on sea ice using coupled wave-ice-ocean modelling. Ocean Model.196, 102540. doi: 10.1016/j.ocemod.2025.102540
12
Li R. Wu K. Li J. Akhter S. Dong X. Sun J. et al . (2021). Large-scale signals in the south pacific wave fields related to ENSO. J. Geophys. Res. Oceans126. doi: 10.1029/2021jc017643
13
Li R. Wu K. Li J. Dong X. Sun J. Zhang W. et al . (2022a). Relating a large-scale variation of waves in the Indian ocean to the IOD. J. Geophys. Res. Oceans127. doi: 10.1029/2022jc018941
14
Li R. Wu K. Zhang W. Dong X. Lv L. Li S. et al . (2022b). Analysis of the 20-year variability of ocean wave hazards in the northwest pacific. Remote Sens.15, 2768. doi: 10.3390/rs15112768
15
Liu J. Li R. Li S. Meucci A. Young I. R. (2024). Increasing wave power due to global climate change and intensification of Antarctic Oscillation. Appl. Energy.358, 122572. doi: 10.1016/j.apenergy.2023.122572
16
Liu J. Meucci A. Young I. R. (2023a). A comparison of multiple approaches to study the modulation of ocean waves due to climate variability. J. Geophys. Res.: Oceans128, e2023JC019843. doi: 10.1029/2023JC019843
17
Liu J. Meucci A. Young I. R. (2023b). Projected 21st century wind-wave climate of bass strait and south-east Australia: comparison of EC-earth3 and ACCESS-CM2 climate model forcing. J. Geophys. Res.: Oceans128, e2022JC018996. doi: 10.1029/2022JC018996
18
McWilliams J. C. Restrepo J. M. (1999). The wave-driven ocean circulation. J. Phys. Oceanogr.29, 2523–2540. doi: 10.1175/1520-0485(1999)029<2523:TWDOC>2.0.CO;2
19
Montgomery D. C. Peck E. A. (1992). Introduction to linear regression analysis. Appl. Stat.32.
20
Moum J. N. Perlin A. Nash J. D. McPhaden M. J. (2013). Seasonal sea surface cooling in the equatorial Pacific cold tongue controlled by ocean mixing. Nature500, 64–67. doi: 10.1038/nature12363
21
Planton Y. Voldoire A. Giordani H. Caniaux G. (2017). Main processes of the Atlantic cold tongue interannual variability. Clim. Dyn50, 1495–1512. doi: 10.1007/s00382-017-3701-2
22
Schott F. A. Xie S.-P. McCreary J. P. Jr. (2009). Indian Ocean circulation and climate variability. Rev. Geophys.47. doi: 10.1029/2007RG000245
23
Semedo A. Sušelj K. Rutgersson A. Sterl A. (2011). A global view on the wind sea and swell climate and variability from ERA-40. J. Clim.24, 1461–1479. doi: 10.1175/2010JCLI3718.1
24
Servain J. Wainer I. McCreary J. P. Jr. Dessier A. (1999). Relationship between the equatorial and meridional modes of climatic variability in the tropical Atlantic. Geophys. Res. Lett.26, 485–488. doi: 10.1029/1999GL900014
25
Song Z. Qiao F. Song Y. (2012). Response of the equatorial basin-wide SST to non-breaking surface wave-induced mixing in a climate model: An amendment to tropical bias. J. Geophys. Res. Oceans117. doi: 10.1029/2012jc007931
26
Stokes G. G. (1847). “On the theory of oscillatory waves,” in Transactions of the Cambridge Philosophical Society, vol. 8. .
27
Tamura H. Miyazawa Y. Oey L. Y. (2012). The Stokes drift and wave induced-mass flux in the North Pacific. J. Geophys. Res. Oceans117. doi: 10.1029/2012jc008113
28
Waite A. M. Thompson P. A. Pesant S. Feng M. Beckley L. E. Domingues C. M. et al . (2007). The Leeuwin Current and its eddies: An introductory overview. Deep-Sea Res. Pt. II54, 789–796. doi: 10.1016/j.dsr2.2006.12.008
29
Wang L.-C. Jin F.-F. Wu C.-R. Hsu H.-H. (2017). Dynamics of upwelling annual cycle in the equatorial Atlantic Ocean. Geophys. Res. Lett.44, 3737–3743. doi: 10.1002/2017GL072588
30
Wu J. (1982). Wind-stress coefficients over sea surface from breeze to hurricane. J. Geophys. Res.87, 9704–9706. doi: 10.1029/JC087iC12p09704
31
Wu K. Yang Z. Liu B. Guan C. (2008). Wave energy input into the Ekman layer. Sci. China Ser. D Earth Sci.51, 134–141. doi: 10.1007/s11430-007-0147-0
32
Wyrtki K. (1981). An estimate of equatorial upwelling in the Pacific. J. Phys. Oceanogr.11, 1205–1214. doi: 10.1175/1520-0485(1981)011<1205:AEOEUI>2.0.CO;2
33
Young I. R. Fontaine E. Liu Q. Babanin A. V. (2020). The wave climate of the southern ocean. J. Phys. Oceanogr.50, 1417–1433. doi: 10.1175/JPO-D-20-0031.1
34
Young I. R. Zieger S. Babanin A. V. (2011). Global trends in wind speed and wave height. Science332, 451–455. doi: 10.1126/science.1197219
35
Zhang W. Li R. Zhu D. Zhao D. Guan C. (2022a). An investigation of impacts of surface waves-induced mixing on the upper ocean under typhoon megi, (2010). Remote Sens.15, 1862. doi: 10.3390/rs15071862
36
Zhang X. Wang Z. Wang B. Wu K. Han G. Li W. (2014). A numerical estimation of the impact of Stokes drift on upper ocean temperature. Acta Oceanol. Sin.33, 48–55. doi: 10.1007/s13131-014-0507-5
37
Zhang X. Wu K. Li R. Li D. Zhang S. Zhang R. et al . (2023a). Analysis of the interannual variability of pacific swell pools. J. Mar. Sci. Eng.11, 1883. doi: 10.3390/jmse11101883
38
Zhang X. Wu K. Li R. Zhang S. Zhang R. Liu J. et al . (2023b). Relationship between large-scale variability of north pacific waves and El Niño-Southern oscillation. J. Mar. Sci. Eng.11, 1848. doi: 10.3390/jmse11101848
39
Zhang W. Zhang J. Liu Q. Sun J. Li R. Guan C. (2022b). Effects of surface wave-induced mixing and wave-affected exchange coefficients on tropical cyclones. Remote Sens.15, 1594. doi: 10.3390/rs15061594
Summary
Keywords
wave transport, stokes drift, cold tongue, sea surface temperature, Ekman transport
Citation
Wang Y, Wu K, Li R, Zhang W, Dong X and Lyu L (2025) Impact of meridional wave-induced transport on sea surface temperature in mid -low latitude cold tongues. Front. Mar. Sci. 12:1535962. doi: 10.3389/fmars.2025.1535962
Received
28 November 2024
Accepted
18 April 2025
Published
08 May 2025
Volume
12 - 2025
Edited by
David Rivas, Center for Scientific Research and Higher Education in Ensenada (CICESE), Mexico
Reviewed by
Jin Liu, The University of Melbourne, Australia
Zhaohui Wang, University of New South Wales, Australia
Updates
Copyright
© 2025 Wang, Wu, Li, Zhang, Dong and Lyu.
This is an open-access article distributed under the terms of the Creative Commons Attribution License (CC BY). The use, distribution or reproduction in other forums is permitted, provided the original author(s) and the copyright owner(s) are credited and that the original publication in this journal is cited, in accordance with accepted academic practice. No use, distribution or reproduction is permitted which does not comply with these terms.
*Correspondence: Rui Li, rui.li.4@unimelb.edu.au
Disclaimer
All claims expressed in this article are solely those of the authors and do not necessarily represent those of their affiliated organizations, or those of the publisher, the editors and the reviewers. Any product that may be evaluated in this article or claim that may be made by its manufacturer is not guaranteed or endorsed by the publisher.