 Jan Tiede
 Joshua Leon Lovell
 Christian Jordan
 Armin Moghimi
 Torsten Schlurmann
- Ludwig-Franzius-Institute, Leibniz University Hanover, Hanover, Germany
Understanding beach dynamics and the long-term evolution of beach nourishment projects is critical for sustainable coastal management, particularly in the face of rising sea levels and increasingly variable storm climates. This study examines the development of a large-scale sand nourishment (600,000 m³) in the southwestern Baltic Sea over 25 months (October 2021–November 2023) using UAV-derived digital surface models (DSMs) and machine learning (ML). High-frequency, multi-temporal UAV surveys enabled detailed analyses of the development of the nourished beach and dune. Results revealed that the volumetric impact of the 100-year flood in October 2023 was comparable to the cumulative effects of the October 2022–January 2023 storm season. This demonstrates that both episodic extreme events and the cumulative impacts shape the morphological evolution of the nourishment. The study also highlights sediment transport reversals under easterly winds, promoting longer-term stability by retaining sediment within the system. By standardizing volumetric analyses using tools equipped with ML, this research provides actionable insights for adaptive management and establishes a framework for comparable, accurate assessments of nourishment lifetime. In particular, these methods efficiently capture subtle variations in coastline orientation, wave incidence angles, and resulting alongshore beach dynamics, offering valuable insights for optimizing nourishment strategies. These findings underscore the importance of continuous, high-resolution monitoring in developing sustainable strategies for storm-driven erosion and sea level rise.
1 Introduction
Nourishments are a central element of coastal protection strategies that include an ecosystem-beneficial approach (Dean, 2002; Bird and Lewis, 2015; Staudt et al., 2021). These practices aim to counteract sediment loss in coastal zones by adding sand through nourishment projects and installing additional structures – especially groins, which have long been deployed as essential technical infrastructure, to stabilize the sand in the system. Nourishments are often considered environmentally friendly and adaptable to rising sea levels, whereas hard coastal structures (e.g., dikes and seawalls) do not have these advantages (Schoonees et al., 2019). However, some studies challenge this notion, arguing that direct disturbances from excavation, sediment plumes, and increased turbidity during dredging harm marine organisms and reduce light penetration in the water column (Bell et al., 2015; Jones et al., 2016). Mielck et al. (2019) further indicated that there have been considerable alterations in the original sediment composition before and after dredging activities. Despite these concerns, Cheong et al. (2013) argue that ecological engineering approaches (e.g., beach nourishments) are qualitatively superior in future coastal protection practices since they are proven as flexible, adaptive and effective against uncertain environmental loads on coastlines in a changing climate. Recently, the objectives of beach nourishments have expanded from merely combating erosion to ensuring public safety, supporting recreational activities, and conserving ecological health (De Schipper et al., 2020). These diverse functions underscore the increasing importance of nourishments and highlight the need for high-resolution assessments to understand the small-scale processes shaping both the subaerial and subaqueous portions of the beach profile. Unmanned Aerial Vehicles (UAV) photogrammetry, with its high spatial resolution and capacity to capture centimeter-scale data critical for resolving small-scale beach dynamics and long-term coastal evolution (Gonçalves and Henriques, 2015). A thorough understanding of the performance and degradation of nourished beaches and dunes is essential for preserving coastal resources, ensuring fiscal responsibility in adaptation efforts, and protecting vulnerable communities from the escalating threats of storms and sea level rise (SLR).
Recent research on the development of nourished beaches and dunes under storm impact has shed light on the complex processes of beach dynamics. These studies mainly focus on understanding the morphological changes and natural responses of nourished beach and dune systems to dynamic forces like storms and SLR. Researchers mostly employ a combination of field measurements (Gijsman et al., 2019), remote sensing (RS) techniques (Vandebroek et al., 2017), and numerical modeling (Huisman et al., 2019) to analyze the temporal evolution of beach nourishments, capturing the erosion and deposition processes that shape the beach profile. While morphodynamic models effectively replicate alongshore sediment transport statistics, they need further refinement to capture finer details. In this study, we focus on the Baltic Sea, which is particularly sensitive to variations in wind and wave direction. Due to the complex interactions between wind, waves, and beach dynamics, it is challenging to accurately model these sensitivities (Deng et al., 2017b; Soomere and Viška, 2014). Field measurements can provide high spatial resolution data, but they are typically limited to specific locations and time intervals, requiring considerable time and resources. Numerical modeling can also yield high-resolution data; however, its accuracy depends on the quality of input parameters and calibration data, and it often demands significant computational effort. In contrast, airborne/space-borne RS systems provide large-scale, continuous data coverage with varying temporal and spatial resolutions, allowing for more efficient and extensive monitoring of coastal dynamics (Müller et al., 2016; Masria, 2024). Among these systems, UAVs have proven particularly valuable, providing high-resolution data and frequent observations ideal for monitoring coastal areas (Mancini et al., 2013; Turner et al., 2016). For instance, Casella et al. (2020) utilized UAVs to monitor the evolution of nourished beaches on the German barrier island Sylt in the North Sea. Therefore, UAV photogrammetry, with its high spatial resolution and capacity to capture centimeter-scale data critical for resolving small-scale beach dynamics and long-term coastal evolution, is a valuable tool to support the design and execution of beach nourishments while also assisting in the development of sustainable, resilient coastal management strategies. A thorough understanding of the performance and degradation of nourished beaches and dunes is essential for preserving coastal resources, ensuring fiscal responsibility in adaptation efforts, and protecting vulnerable communities from the escalating threats of storms and sea-level rise.
To capture small-scale beach dynamics and the complex, long-term evolution of beach nourishments, the existence of high-resolution data - ideally with centimeter-scale accuracy - is paramount. Despite the limited availability of metocean forcing data with a high spatial resolution, understanding the probable impacts of nourishment over extended periods remains essential. This is where UAVs can play a transformative role by providing high-resolution, frequent, and cost-effective data collection. In general, processing and analyzing UAV data streams can enhance predictions of sediment transport and morphological changes over time.
The extensive volume and complexity of UAV data, however, necessitates advanced processing techniques to extract valuable insights from high-resolution coastal observations (Nex et al., 2022). Techniques like computer vision (CV) and machine learning (ML) are key in turning this data into actionable intelligence, thus boosting monitoring and predictive capabilities for beach nourishment projects. Recent studies have used the extensive archives of Landsat and Sentinel-2 satellite imagery to map shoreline positions and facilitate long-term, large-scale assessments of shoreline morphology (Bishop-Taylor et al., 2021; Tiede et al., 2023). However, these assessments are limited to two-dimensional (2D) analysis, lacking the volumetric perspective essential for understanding cross-shore and longshore beach dynamics. Assessing the volumetric changes in beach nourishment areas is complex, as the available sand volume acts as a buffer against storm-induced erosion that are degraded far from uniformly distributed forcings and processes. Tools like Sandpyper (Pucino et al., 2021) leverage ML techniques to rapidly process and segment large data sets while removing erroneous measurements. This approach allows the rapid and objective identification of even small-scale morphological changes, enabling precise quantification of sediment volumes and the discrimination of the underlying forcing drivers. This shift toward 3D data and ML integration represents a significant advancement, providing deeper insights into volumetric changes and helping to refine coastal management strategies. In the long-term, integrating these tools could significantly enhance monitoring, forecasting, and adaptive coastal management strategies, particularly in areas where traditional data collection is challenging or limited.
This study investigates a 600,000 m³ sand nourishment project in the southwestern Baltic Sea, a region where coastal protection depends heavily on nourished dunes. The primary aim is to monitor morphological changes using UAV-derived digital surface models (DSMs) of the recent nourishment and to assess the impact of specific weather events and metocean forcing on beach dynamics. Multi-temporal UAV surveys were conducted over a 25-month period (October 2021 to November 2023), providing a comprehensive dataset for evaluating both short-term and long-term changes. The processing of these data is supported by machine learning techniques enabling precise quantification of sediment volumes. In addition, long-term trends in the degradation process of nourishment are assessed, thereby contributing to a more complete understanding of the evolution of nourished dunes in the region.
2 Materials and methods
2.1 Study site
The study area is located along the southwestern Baltic Sea, where coastal protection primarily relies on nourished dunes (Figure 1). A dataset of dune heights from the coastal authority (StALU) indicates a range from 1.86 m to 9.20 m above MSL, with an average height of approximately 4.70 m. This variation highlights the diverse morphology of dunes, which play a crucial role in coastal protection. The dunes are mostly vegetated with marram grass (Ammophila arenaria), a key species that stabilizes the sand and enhances dune resilience against erosion (StALU, 2021).
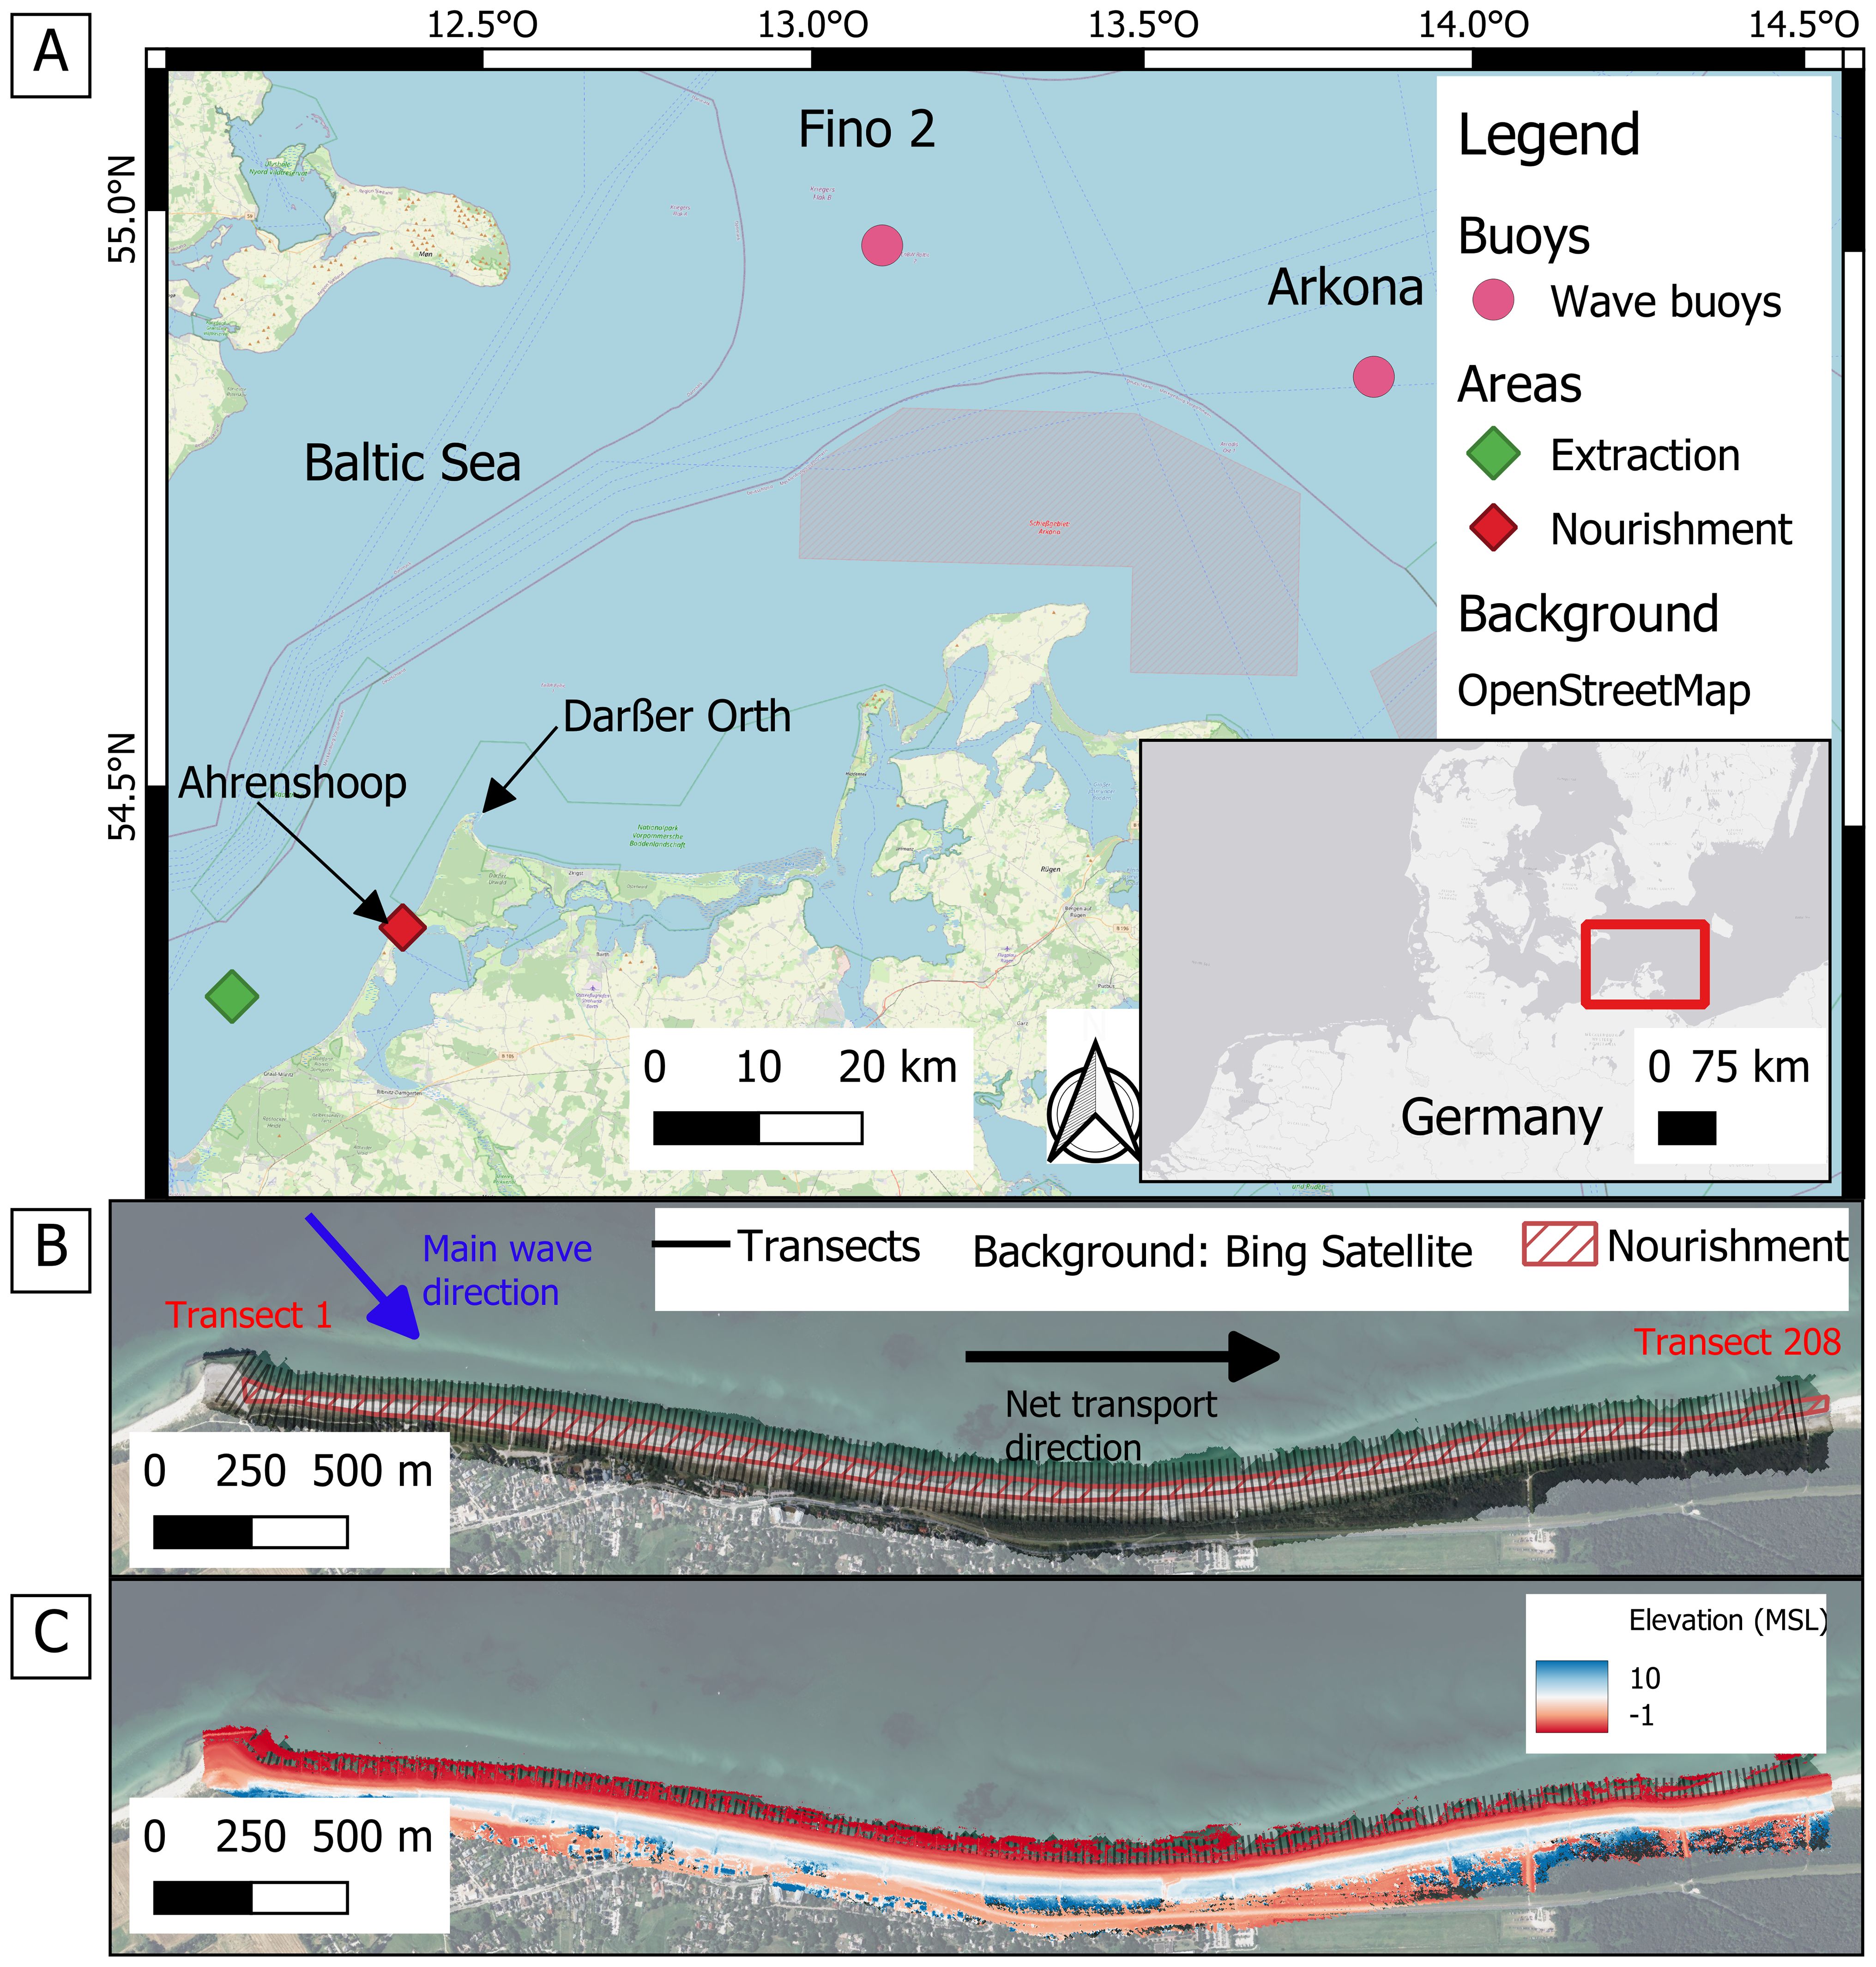
Figure 1. Overview of the study area. (A) Map showing the locations of the extraction and nourishment areas, along with the nearest wave buoys. (B) Map highlighting the locations of the transects used for profile extraction, with a UAV-derived orthomosaic as the background. (C) Example of a DSM generated from UAV photogrammetry, dated April 13, 2023. Adapted from Tiede et al. 2024.
Erosion dominates much of the Baltic Sea coastline, with government analyses indicating that 65% of the shore is eroding, 13% is accreting, and 22% remains stable (StALU, 2021). On average, the coastline has retreated by 0.35 m/year over the past century, with localized erosion rates reaching up to 2.1 m/year. The sediment transport system in the southern Baltic Sea is primarily driven by westerly winds, which induce eastward movement along the coast, while secondary transport influenced by easterly and northerly winds becomes critical during storm surges that intensify erosion on dunes and cliffs (Harff et al., 2017). The critical role of storm surges and sediment composition in dune stability (Kaehler et al., 2022), and the combined effects of glacio-isostatic adjustments, eustatic sea-level rise, and sediment dynamics (Harff et al., 2017). Seasonal variations in wave heights further complicate coastal defense strategies (Suursaar et al., 2006; Madsen et al., 2015; Weisse et al., 2021). Erosion is concentrated during winter storm events, while summer conditions allow for partial beach profile restoration; however, the net effect remains erosional (Soomere, 2011; Björkqvist et al., 2018).
The specific study site is the beach-dune system in front of Ahrenshoop, a village near Rostock, situated on a narrow land spit between the Baltic Sea and a brackish inland bay (Figure 1). This approximately 1 km wide strip is protected by a 5.5 km dune system and a 3.74 km dike, with the southern part transitioning into a cliffed coast and the northern part forming part of a nature reserve that extends to the sand spit of Darßer Ort. Oriented NE-SW over roughly 4 km, the area exhibits diverse geomorphology and varying susceptibility to erosion. Measurements between Warnemünde and Ahrenshoop indicate that 65% of waves originate from the W–WNW direction, with significant storms arriving from the WNW (Kortekaas et al., 2010). A typical beach profile is illustrated in Figure 2.
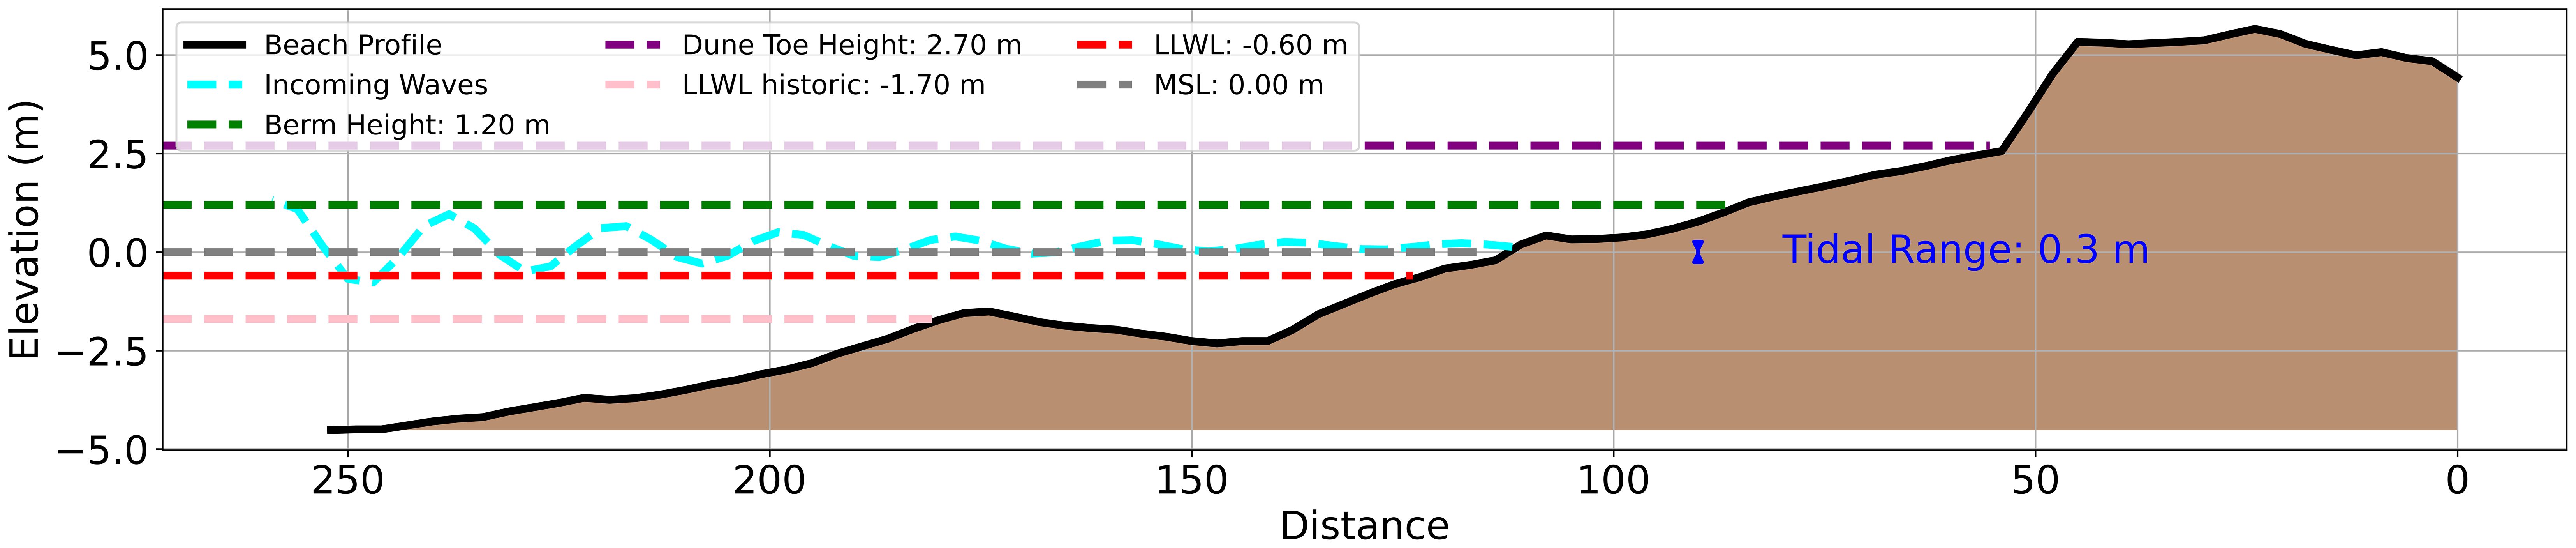
Figure 2. Beach profile near transect no. 150, surveyed in February 2022. LLWL: lowest low water level. Figure adapted from Tiede et al. (2024).
Nourishments are implemented every 3–6 years along this coastal stretch, based on observed erosion and expert judgment. Since 1990, nine nourishments have been carried out over a 3 km stretch, using sand volumes ranging from 15,221 m³ to 600,000 m³ (averaging about 350,000 m³) to offset erosion rates of approximately 0.6 m/year (StALU, 2021). Effective nourishment requires optimizing sand use to balance the natural sediment supply from cliffs while minimizing environmental impacts, particularly given restrictions on sand extraction due to environmental regulations and concerns over unexploded ordnance (UXO) (Reckermann et al., 2022).
The most recent nourishment examined in this study involved the addition of 600,000 m³ of sand to the beach and dune system at Ahrenshoop, with the dune crest height designed to reach 5 m. The beach slope was specified as 0.05 [-], while the seaward dune slope was assigned a value of 0.33 [-]. The nourishment led to significant changes in sediment characteristics: the mean grain size of the beach sediment decreased from 0.33 ± 0.09 mm to 0.27 ± 0.01 mm, and the sorting grade shifted from 1.23 ± 0.37 to 1.389 ± 0.46, indicating a slight reduction in sediment uniformity (Glueck and Schubert, 2024). To stabilize the dunes and promote sediment retention, over 50,000 m² of marram gras (Ammophila arenaria) was planted following the nourishment.
2.2 Workflow
The ML-supported workflow to observe the beach volume changes began with UAV-based image acquisition, capturing high-resolution aerial data of the study area. These images were then processed with Metashape to generate DSMs and orthophotos. A co-alignment technique (Cook and Dietze, 2019) was applied to align multiple surveys consistently, improving the accuracy of change detection across different time steps.
We utilized the open-source Sandpyper tool (https://github.com/npucino/sandpyper) to process the dataset, following a series of processing steps detailed below (Figure 3). In QGIS, shoreline polygons, water and shore masks, and Limit of Detection (LoD) transects were created to define key spatial boundaries. To analyze beach dynamics, transects were defined along the shoreline, uniformly spaced at 20 m intervals and oriented perpendicular to the coast. Figure 1B provides an overview of the transects, while Figure 4 offers a detailed view. Each transect extends from the dune, across the beach, and into the water. In a later machine learning step, vegetation, the swash zone, and other obstacles are removed from the computation. The beach width, measured from the shoreline to the dune toe, is approximately 40 m, while the distance from the dune toe to the crest ranges from 15 to 25 m, and elevation values are extracted from the DSMs to produce cross-sectional representations of the beach profile. During the extraction of elevation and RGB values along the defined transects, the data is projected on to a straight line to compute the alongshore distance.
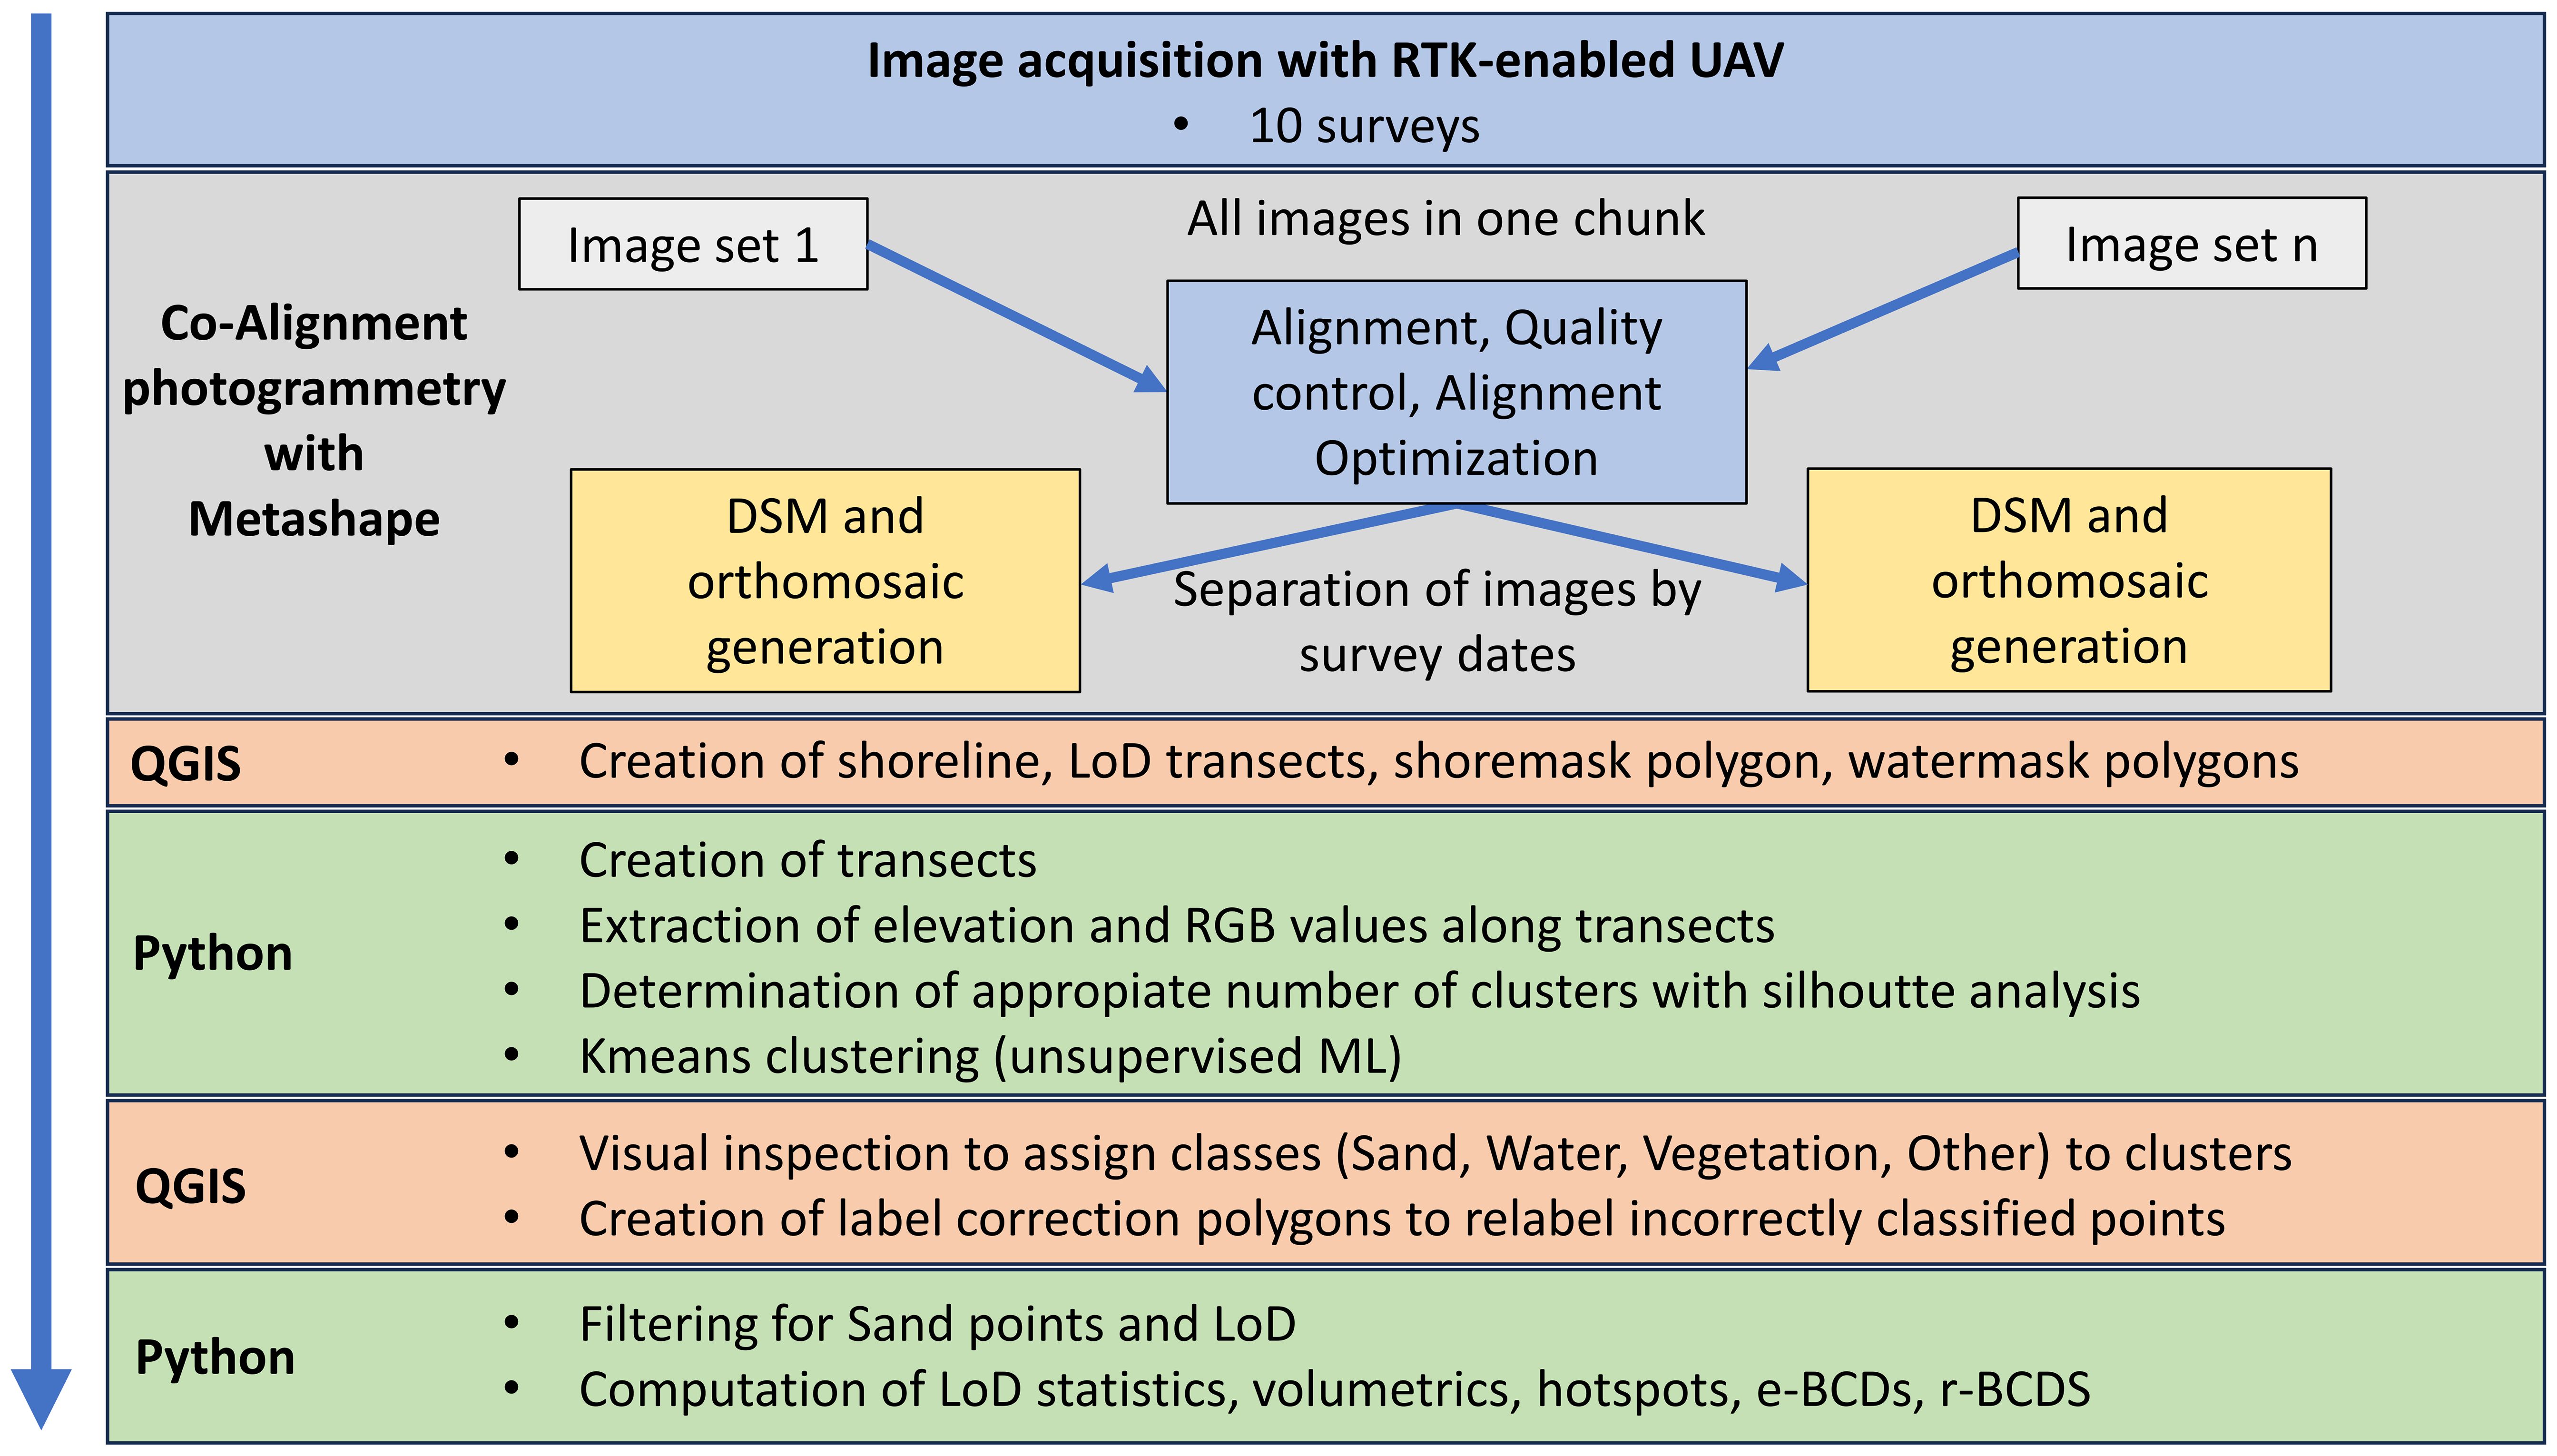
Figure 3. Workflow illustrating data processing steps utilizing Metashape, QGIS, and Python for analysis with ML and visualization.
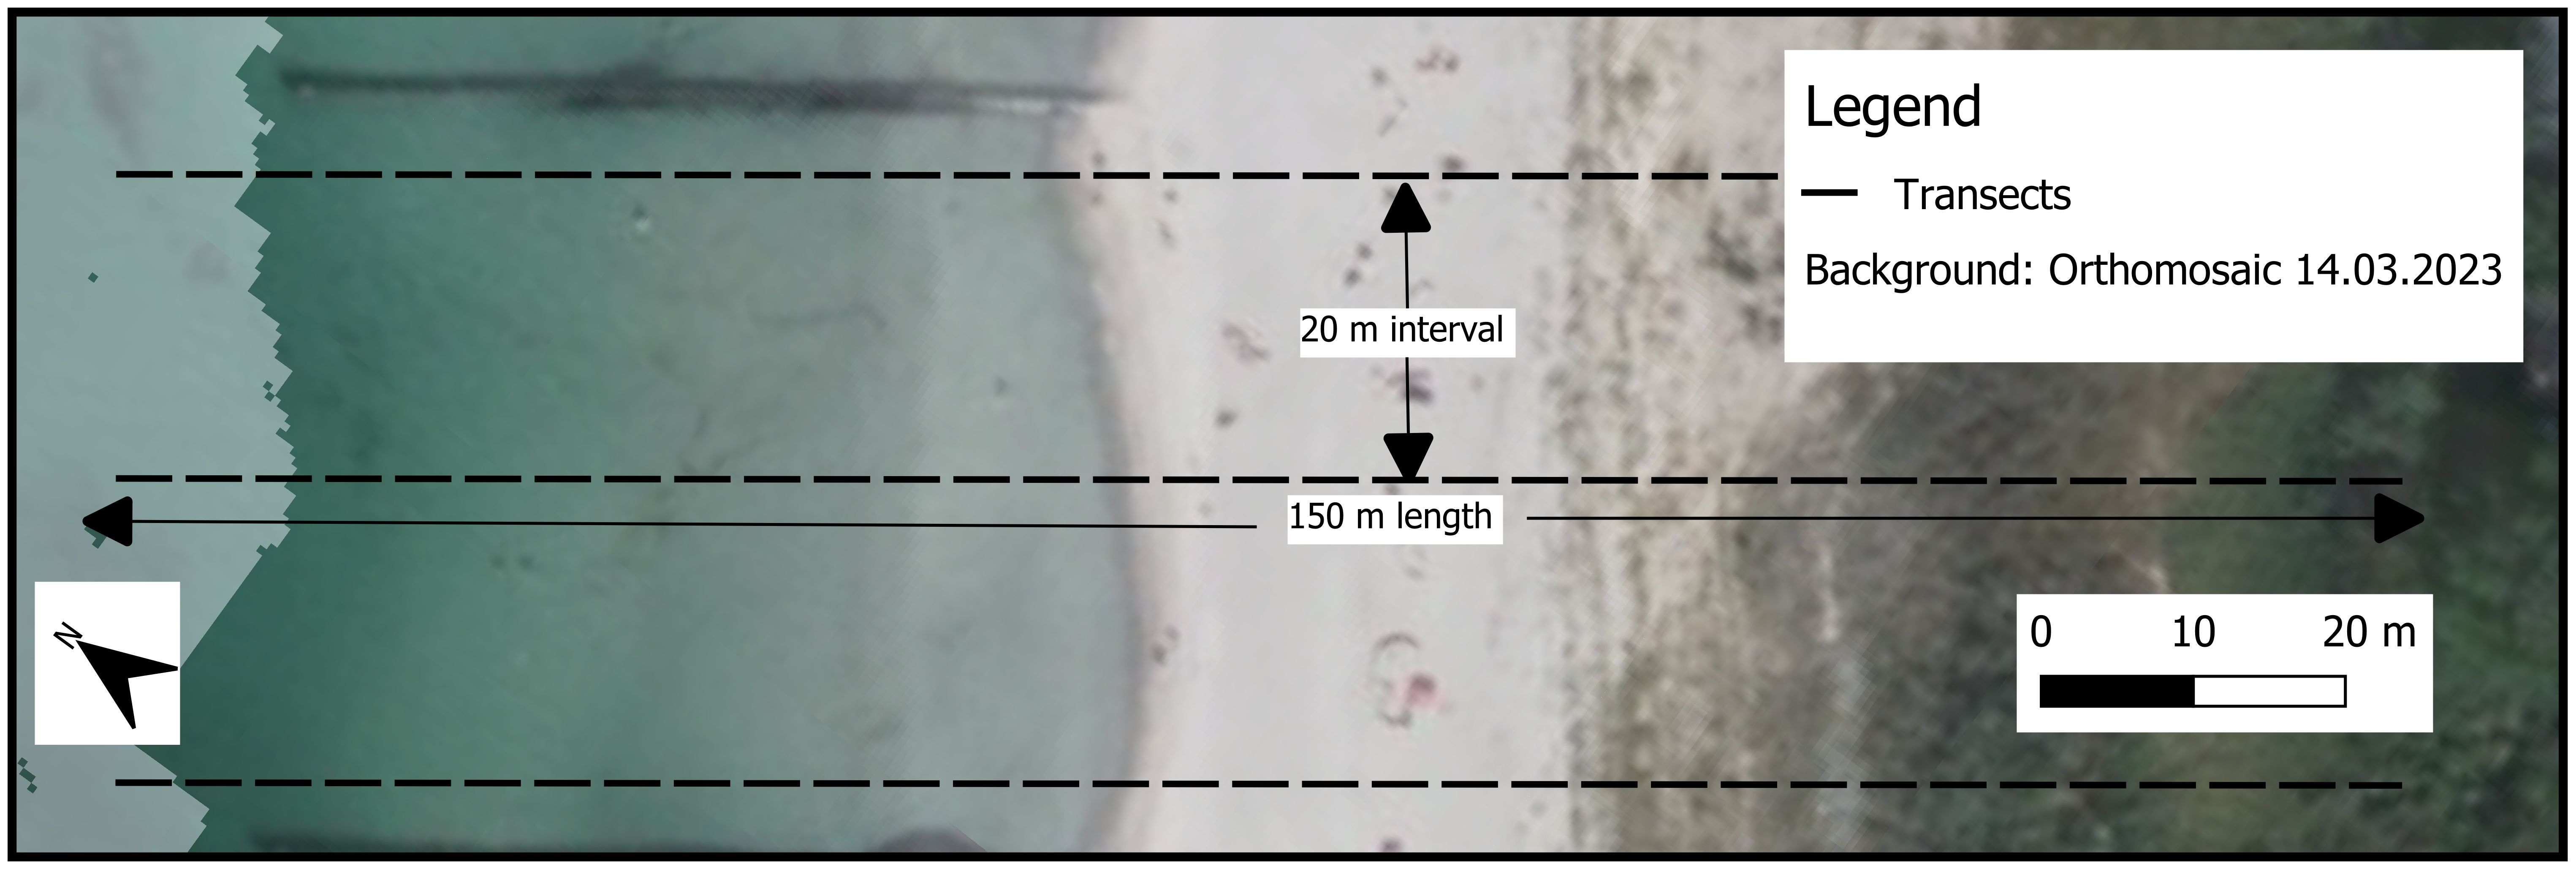
Figure 4. Transect definition along the coastline in the study area.
A critical step involved quality control, where erroneously labeled points were identified and corrected to maintain data reliability. Following this, statistical analyses and volumetric computations were performed, focusing exclusively on sand points to capture beach dynamics accurately. The extracted elevation values were compared across survey periods to track morphological changes over time. Heatmaps were generated to visualize elevation differences, offering detailed spatial representations of erosion and deposition patterns.
We present the results of this section as follows:
● A characterization of the general volume trend across the entire study area, providing an overall perspective.
● An analysis of the volume change across four distinct segments, offering insights into alongshore variability.
● Heatmaps depicting the volumetric change between each survey. These heatmaps constitute the core findings, illustrating changes at each elevation point along the transects between successive surveys, as well as the evolution of the net volume along the alongshore distance.
In addition, a spatial autocorrelation analysis using the Local Moran’s I statistic was conducted to identify statistically significant hotspots of erosion and deposition. A spatial weight matrix, based on a 35-meter radial distance, defined spatial neighborhoods across the transects. This ensured the inclusion of points from adjacent transects (transects were spaced every 20 m along the beach), even when their orientation caused them to diverge at an angle, while keeping the focus on the point of interest.
To systematically interpret these changes, two distinct Beachface Cluster Dynamics (BCD) indices, developed by Pucino et al. (2021) are derived: Empirical Beachface Cluster Dynamics (e-BCD) and Residual Beachface Cluster Dynamics (r-BCDs). We present the r-BCDs as the end result of our workflow to give an impression of the long-term development of the nourished beach and dune. In effect, the r-BCD provides an estimate of the future sediment budget by characterizing the dominant trends of erosion and deposition observed throughout the survey period, which can be extrapolated into the future provided that metocean conditions remain similar. This index is derived from the steady-state probability vector of a discrete Markov chain model, which assesses the likelihood of transitions between different elevation change states.
To gain an initial understanding of the overall morphological development, the volume difference (m³/m) is computed and visualized for each transect. Additionally, to evaluate how the beach responds to incoming waves, the beach slope is calculated and displayed. Here, the beach slope is defined as the elevation difference between the lowest point in the transect (approximately 0.1 m above MSL) and the dune toe, which is visually identified in each DSM. Moreover, wave data collected from an offshore buoy is displayed and also integrated into the heatmaps to illustrate the metocean conditions during the survey.
2.3 Acquisition of DSMs and orthophotos
Data in the form of DSMs and orthophotos were acquired using a UAV (DJI Phantom P4 RTK), which provides high-precision topographic data (Forlani et al., 2018). Figure 5 provides a UAV-based aerial perspective, highlighting the study area and elements of the nourishment construction process. An overview of the survey timeline and storms impacting nourishment is depicted in Figure 6. The survey timeline was designed to monitor the nourishment during and after implementation, with a focus on capturing morphological changes across different seasonal conditions. It aimed to cover storm-intensive autumn and winter periods, when erosion events are more frequent, as well as calmer summer periods, which contribute to beach recovery. The exact survey dates were partly determined by the weather conditions permitting flights. The study incorporated multiple workflows, including repeat flights with oblique camera angles (30°from nadir) and the co-alignment technique (Cook and Dietze, 2019). This approach aligns images from multiple surveys into a unified dataset before dividing them into their respective survey dates for further processing. This workflow ensures high vertical accuracy, surpassing the limitations often encountered even with RTK-equipped UAVs (Nota et al., 2022). Details on the processing workflow and achieved accuracy can be found in Tiede et al. (2024).
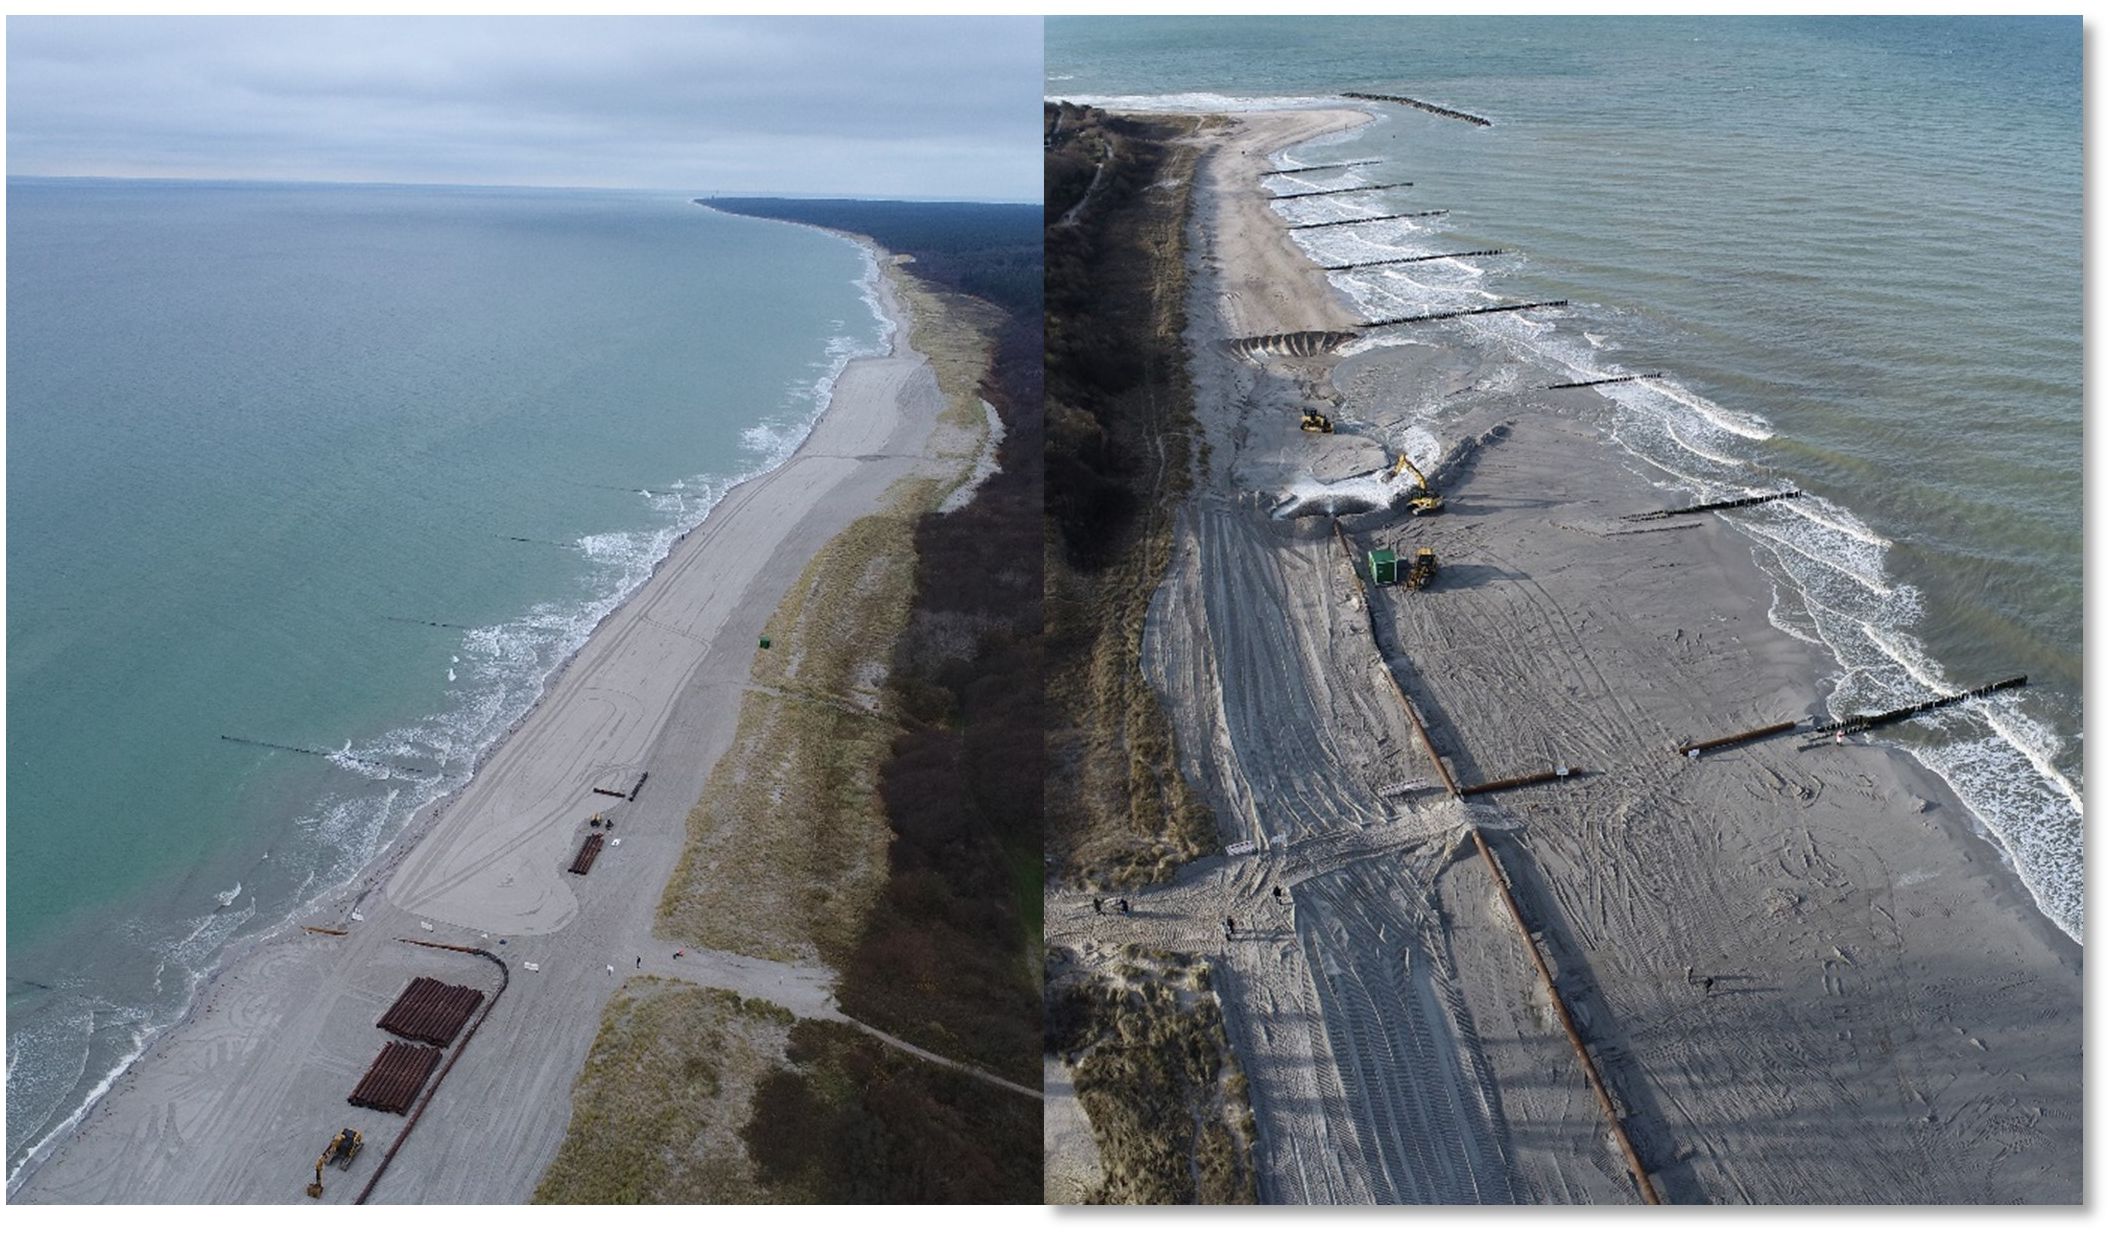
Figure 5. Impressions from the sand nourishment process at the study site near Ahrenshoop. The left image depicts the initiation of the nourishment process, featuring the nature protection area in the background and the construction site in the foreground. The right image illustrates the final stages of the nourishment process, near the breakwater situated to the south of the study area.
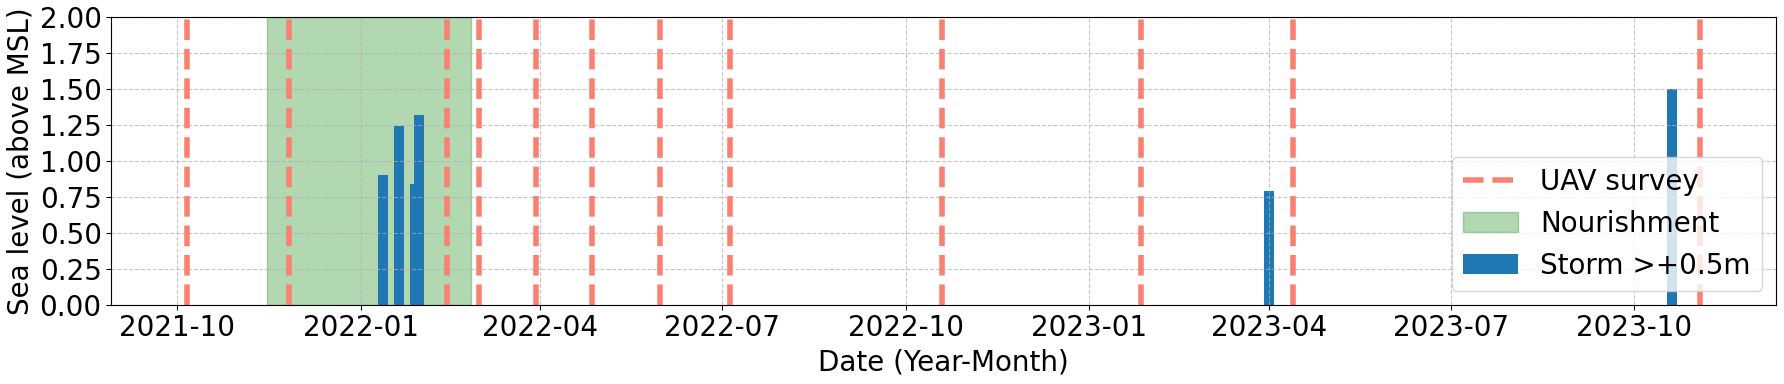
Figure 6. Timeline of the UAV surveys. The vertical red lines indicate survey dates, the shaded green area represents the nourishment period, and blue bars denote significant storms, with bar height corresponding to the recorded maximum water levels during these events.
We aimed to conduct UAV flights in wind conditions below 10 m/s, as recommended by the manufacturer, to ensure flight stability and data accuracy. Low wave activity was also desirable, as clear, undisturbed water allows photogrammetric processing to capture depth information, enabling the generation of a DEM that extends into the shallow nearshore bathymetry (David et al., 2021). However, since a consistently low-wave environment was not always achievable, the swash zone was typically mapped at approximately 0.1 m above MSL, as this was the lowest elevation where all DSMs provided comparable data. Additionally, we prioritized flights during low tide to maximize exposure of the intertidal zone, although the tidal range of approx. 0.3 m in the Baltic Sea is far lower compared to the North Sea and therefore the impact is not as high as in other areas. Furthermore, we prioritized morning flights, as the rising sun casts more pronounced shadows on the beach, which enhances image alignment on homogenous surfaces like sandy shorelines (Contreras-de-Villar et al., 2021). Details on the flight parameters can be found in Supplementary Table 3 of the Supplementary Materials.
2.4 Wave data
Wave data used in this study were sourced from the offshore FINO2 and Arkona buoys, operated by the Federal Maritime and Hydrographic Agency (BSH). Located about 40 km from the study site (Figure 1), these buoys provide quality-controlled in situ wave measurements, accessible through the BSH open data portal. The wave conditions at the buoys for westerly winds are representative of those at Ahrenshoop due to the open fetch, allowing waves to develop and reach the shore with full energy. In contrast, during easterly storms, this is not the case, as Ahrenshoop is sheltered from the east (Kortekaas et al., 2013). For these specific conditions, wave data gained from the buoy measurements may therefore overestimate wave conditions at the shoreline.
2.5 Limit of detection
In order to produce accurate volume estimations, we calculated the so-called limit of detection (LoD) (Grottoli et al., 2021; Wang et al., 2024). This threshold represents the minimum elevation change that can be reliably detected. In our analysis, observations below this limit are excluded from the calculations. To compute the LoD from the multitemporal UAV-derived elevation data, a DSM of Difference (DoD) is calculated by subtracting elevation values between consecutive DSMs, highlighting areas of potential change. Stable features, such as roads or roofs, which are expected to remain unchanged over time, are used as calibration zones to estimate noise. Vector lines for elevation extraction were manually digitized across these zones, creating checkpoints at 0.1 m intervals. These are referred to as LoD transects.
In these stable zones, elevation differences are quantified to determine noise levels, using either the standard deviation (std) or the Normalized Median Absolute Deviation (nmad) error. The nmad, a reliable measure for non-normal distributions (Höhle and Höhle, 2009), is given by:
where Δh represents observed elevation differences in stable zones. Which error metric is to be used for each time step is determined by carrying out a Shapiro-Wilkinson normality test, a D’Agostino-Pearson normality test and a visual normality check with histograms and Q-Q plots. If the null hypothesis of normality is rejected in all of these tests, nmad is employed as the LoD. If the null hypothesis fails to be rejected or the data is visually assessed to be normal, std is employed as the LoD.
This threshold distinguishes significant changes from noise. Applying this LoD across the DoD allows only elevation changes above the threshold to be considered meaningful, with smaller variations treated as noise and filtered out. This approach supports reliable detection of topographic changes over time, suitable for dynamic environments like beaches and dunes.
2.6 Behavioral dynamics
To analyze the temporal and spatial dynamics of the beach face, two novel indices were introduced by the creators of Sandpyper: the e-BCD and the r-BCD. Empirical beach face cluster dynamics indices (e-BCDs) quantify both the significance (absolute value) and the primary directional trend (positive or negative score) of behavioral changes between erosion and deposition. These indices summarize the beach dynamics for the entire monitoring period, providing an overview of the dominant trends in beach face changes during the observation timeframe. The dominant trends are divided into the following four classes: erosional, recovery, depositional, and vulnerability. They are based on first-order transition matrices, so in essence they allow to assess how probable it is that a beach behavior changes from being accretive to erosive, erosive to accretive or maintaining the same behavior. Also, the significance of the change is observed (e.g., a transition from light to medium erosive tendencies). Erosional represents the likelihood of the beach behavior to continue to be erosive once it is in an erosive state. Recovery reflects the regain of sediment in previously eroded areas, as it represents the likelihood of the beach behavior to change from erosive to accretive. Depositional represents the likelihood of an accretive beach behavior to continue to be accretive and captures the accumulation of new sediment within the system, marked by sustained positive elevation changes that suggest active sediment transport to specific areas. Vulnerability represents the likelihood of accretive beach behavior to change to erosive behavior and measures the beach’s susceptibility to future erosion or its potential failure to recover, encompassing sediment deficits, low recovery efficiency, or regions at persistent risk. These classes are quantified using indices that track their magnitude and trends over time, offering a comprehensive framework to understand and manage coastal processes effectively.
The occurrence of a transition between a class is expressed as a discrete Markov process:
Where is a vector of valid elevation points and M are the states (i.e. Δh magnitude classes) at time t.
The transition properties are then computed as:
Where represents the number of transitions from an initial state i to j, where m is the total number of possible states.
First the e-BCDs are computed for every class in a separate sub-matrix:
weights the transition according to its magnitude:
The r-BCDs represent the expected sediment budget when the same erosional/depositional dynamics as e-BCDs are projected over infinite time steps (steady-state). In other words, they represent the probability of what the sediment budget is likely to be in the future and, as such, describe the underlying tendency during the entire survey period. These indices, derived from discrete Markov chain models, assess the probabilities of transitions between different states of elevation change. The e-BCD was calculated by dividing the transition matrix into sub-matrices representing various beach face behaviors, while the r-BCD was derived from the steady-state probability vector, indicating the long-term erosional or depositional tendencies of the beach face.
2.7 Mean elevation change
Volumetric computations and MEC computations were performed. Subaerial changes across sites and times were compared using the MEC, as outlined below. These computations consistently incorporate all sandy points along the entire transect, encompassing both the beach and dune areas.
3 Results
3.1 General volume trend
Figure 7 shows the changes in elevation over time at Ahrenshoop, computed as MECs. The sharp rise in elevation observed in early 2022 corresponds to the nourishment that added approximately 39,085 m³ of sediment between November 26, 2021, and February 13, 2022. During the same period, a volume of 3,337 m³ was eroded, resulting in a net total volume change of 35,748 m³.
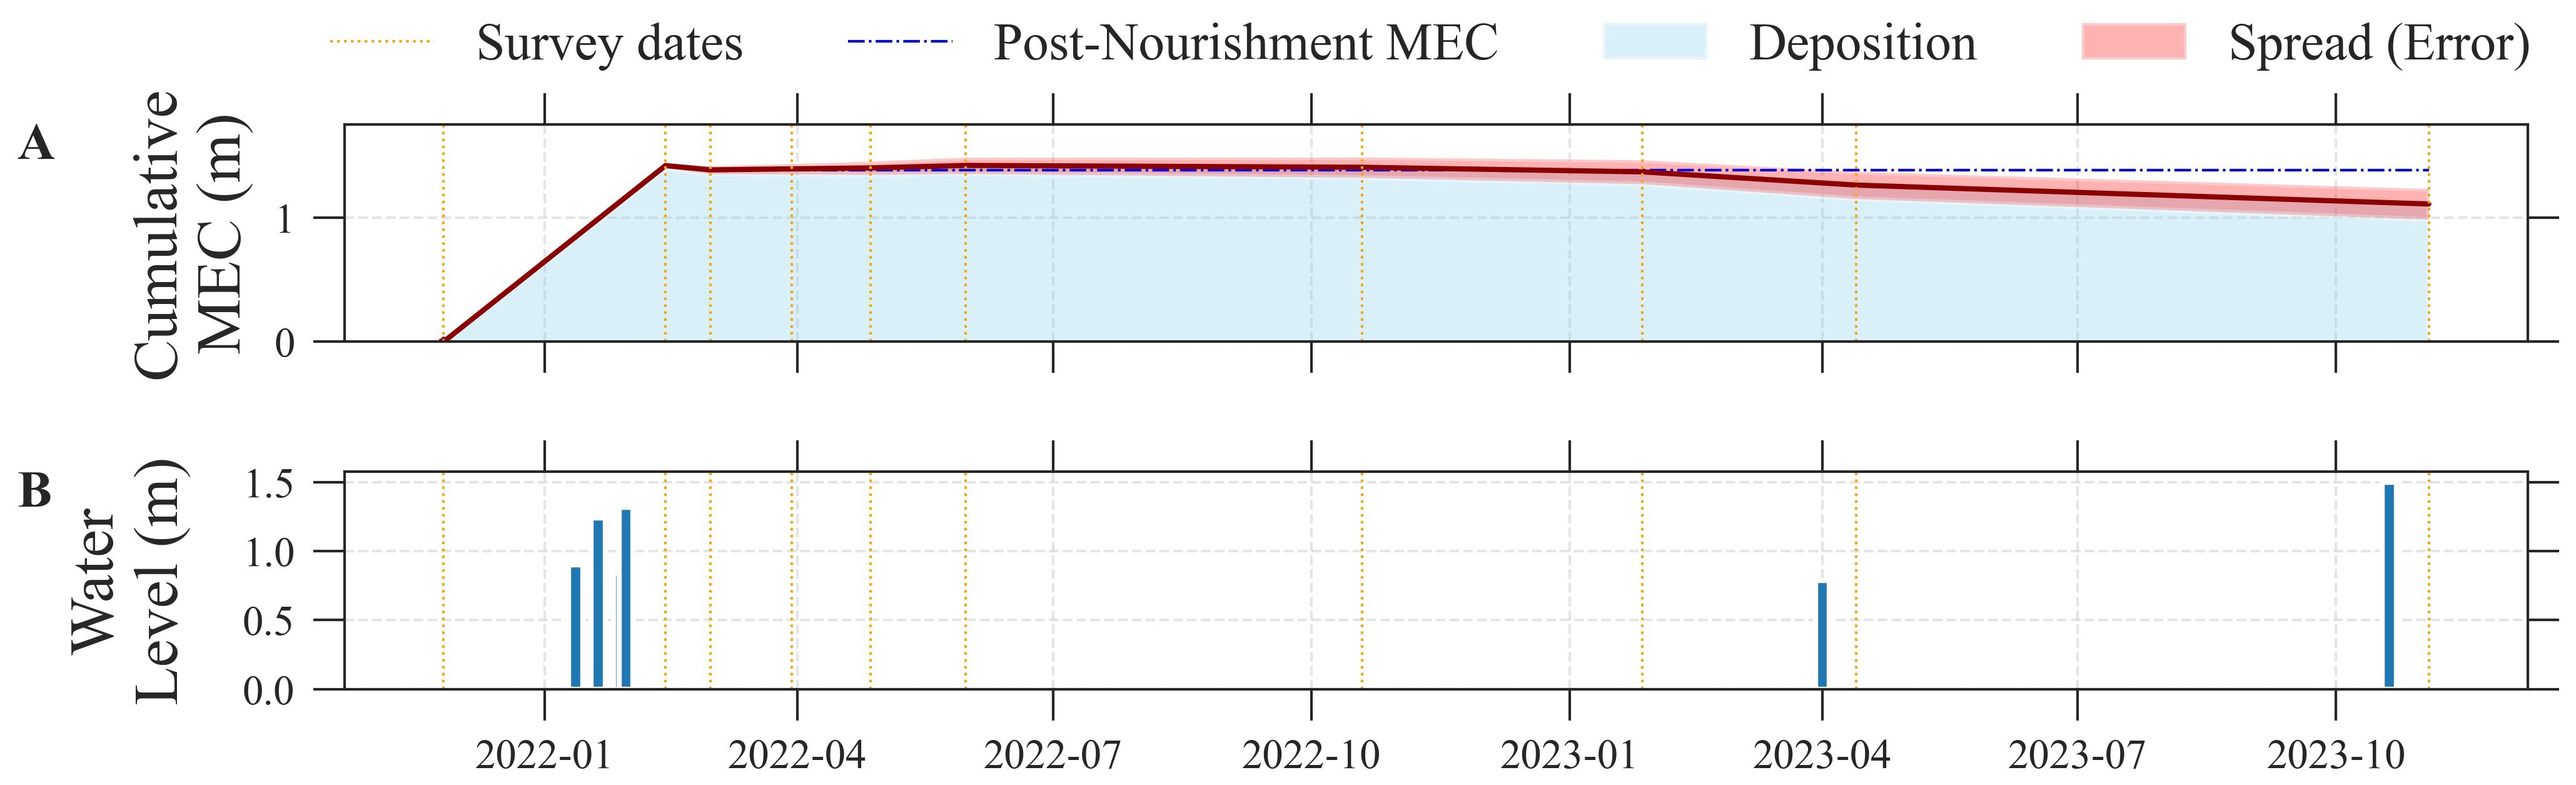
Figure 7. (A) MEC of the beach-dune volumes. Note that in this plot, the survey of the nourishment from the 26.11.2021 is included in the volumes. (B) Bar plot of water level heights during storms (defined as events with >+0.5 m water level).
Throughout most of 2022, the beach system remained relatively stable. Between February 13, 2022, and March 1, 2022, the total volume of sediment deposited was 7,201 m³, while the total volume eroded was 6,659 m³, leading to a net volume change of 542 m³. Similarly, from April 27, 2022, to May 31, 2022, the total volume deposited was 4,725 m³, with a total eroded volume of 4,548 m³, resulting in a net volume change of 178 m³. The most significant volume gain after the initial nourishment occurred between May 31, 2022, and October 19, 2022, with a total volume of 8,842 m³ deposited and 4,452 m³ eroded, yielding a net volume change of 4,390 m³. However, beach dynamics began to shift in late 2022. Between October 19, 2022, and January 27, 2023, the total volume deposited was 3,170 m³, while the total volume eroded was 10,318 m³, resulting in a significant net volume loss of 7,147 m³.
In late October 2023, a major storm on October 23 contributed to further sediment loss. Between April 13, 2023, and November 3, 2023, the total deposited volume was 9,184 m³, while the total eroded volume reached 12,475 m³, resulting in a net volume loss of 3,291 m³ during this period.
By the end of the survey period, approximately 92% of the original nourishment volume remained at Ahrenshoop. This figure takes into account processes such as aeolian transport and cross-shore redistribution, where sediment is moved inland, offshore, or along the beach face.
3.2 Segmented volume trend
Transects 1-40 (Figure 8A) exhibited high variability early in the record, with alternating phases of erosion and deposition. As the study progressed, variability decreased, and values clustered around zero, indicating relatively stable conditions. Toward the end of the observation period, variability increased again, with values ranging between -25 m³/m and +7 m³/m. The mean volumetric change at the end reached -10 m³/m, reflecting a shift toward net erosion and substantial sediment loss in this southern section. Transects 41-100 (Figure 8B) initially showed low variability, with values near zero or slightly negative, suggesting modest net sediment changes. Between July and November 2022, variability increased as some transects experienced moderate erosion while others showed signs of deposition. By the end of the record, values ranged from -20 m³/m to +5 m³/m, with a mean of -10 m³/m, marking a transition to significant net sediment loss. Transects 101-135 (Figure 8C) remained relatively stable for much of the study period, with low variability and minimal net sediment change. Toward the end, negative outliers appeared, indicating episodic erosion. The final mean reached -4 m³/m, with values ranging from -10 m³/m to +3 m³/m, suggesting that this portion of the beach maintained a more balanced sediment budget with smaller deviations from neutral. Transects 136-208 (Figure 8D) followed a similar pattern, showing mostly limited fluctuations throughout the study. By the end, minor erosional events were observed, but occasional positive values suggested partial recovery. The mean volumetric change at the end was -2 m³/m, with a range of -8 m³/m to +3 m³/m, highlighting the relative stability of this northernmost sector compared to the greater variability seen in the southern and midsections.
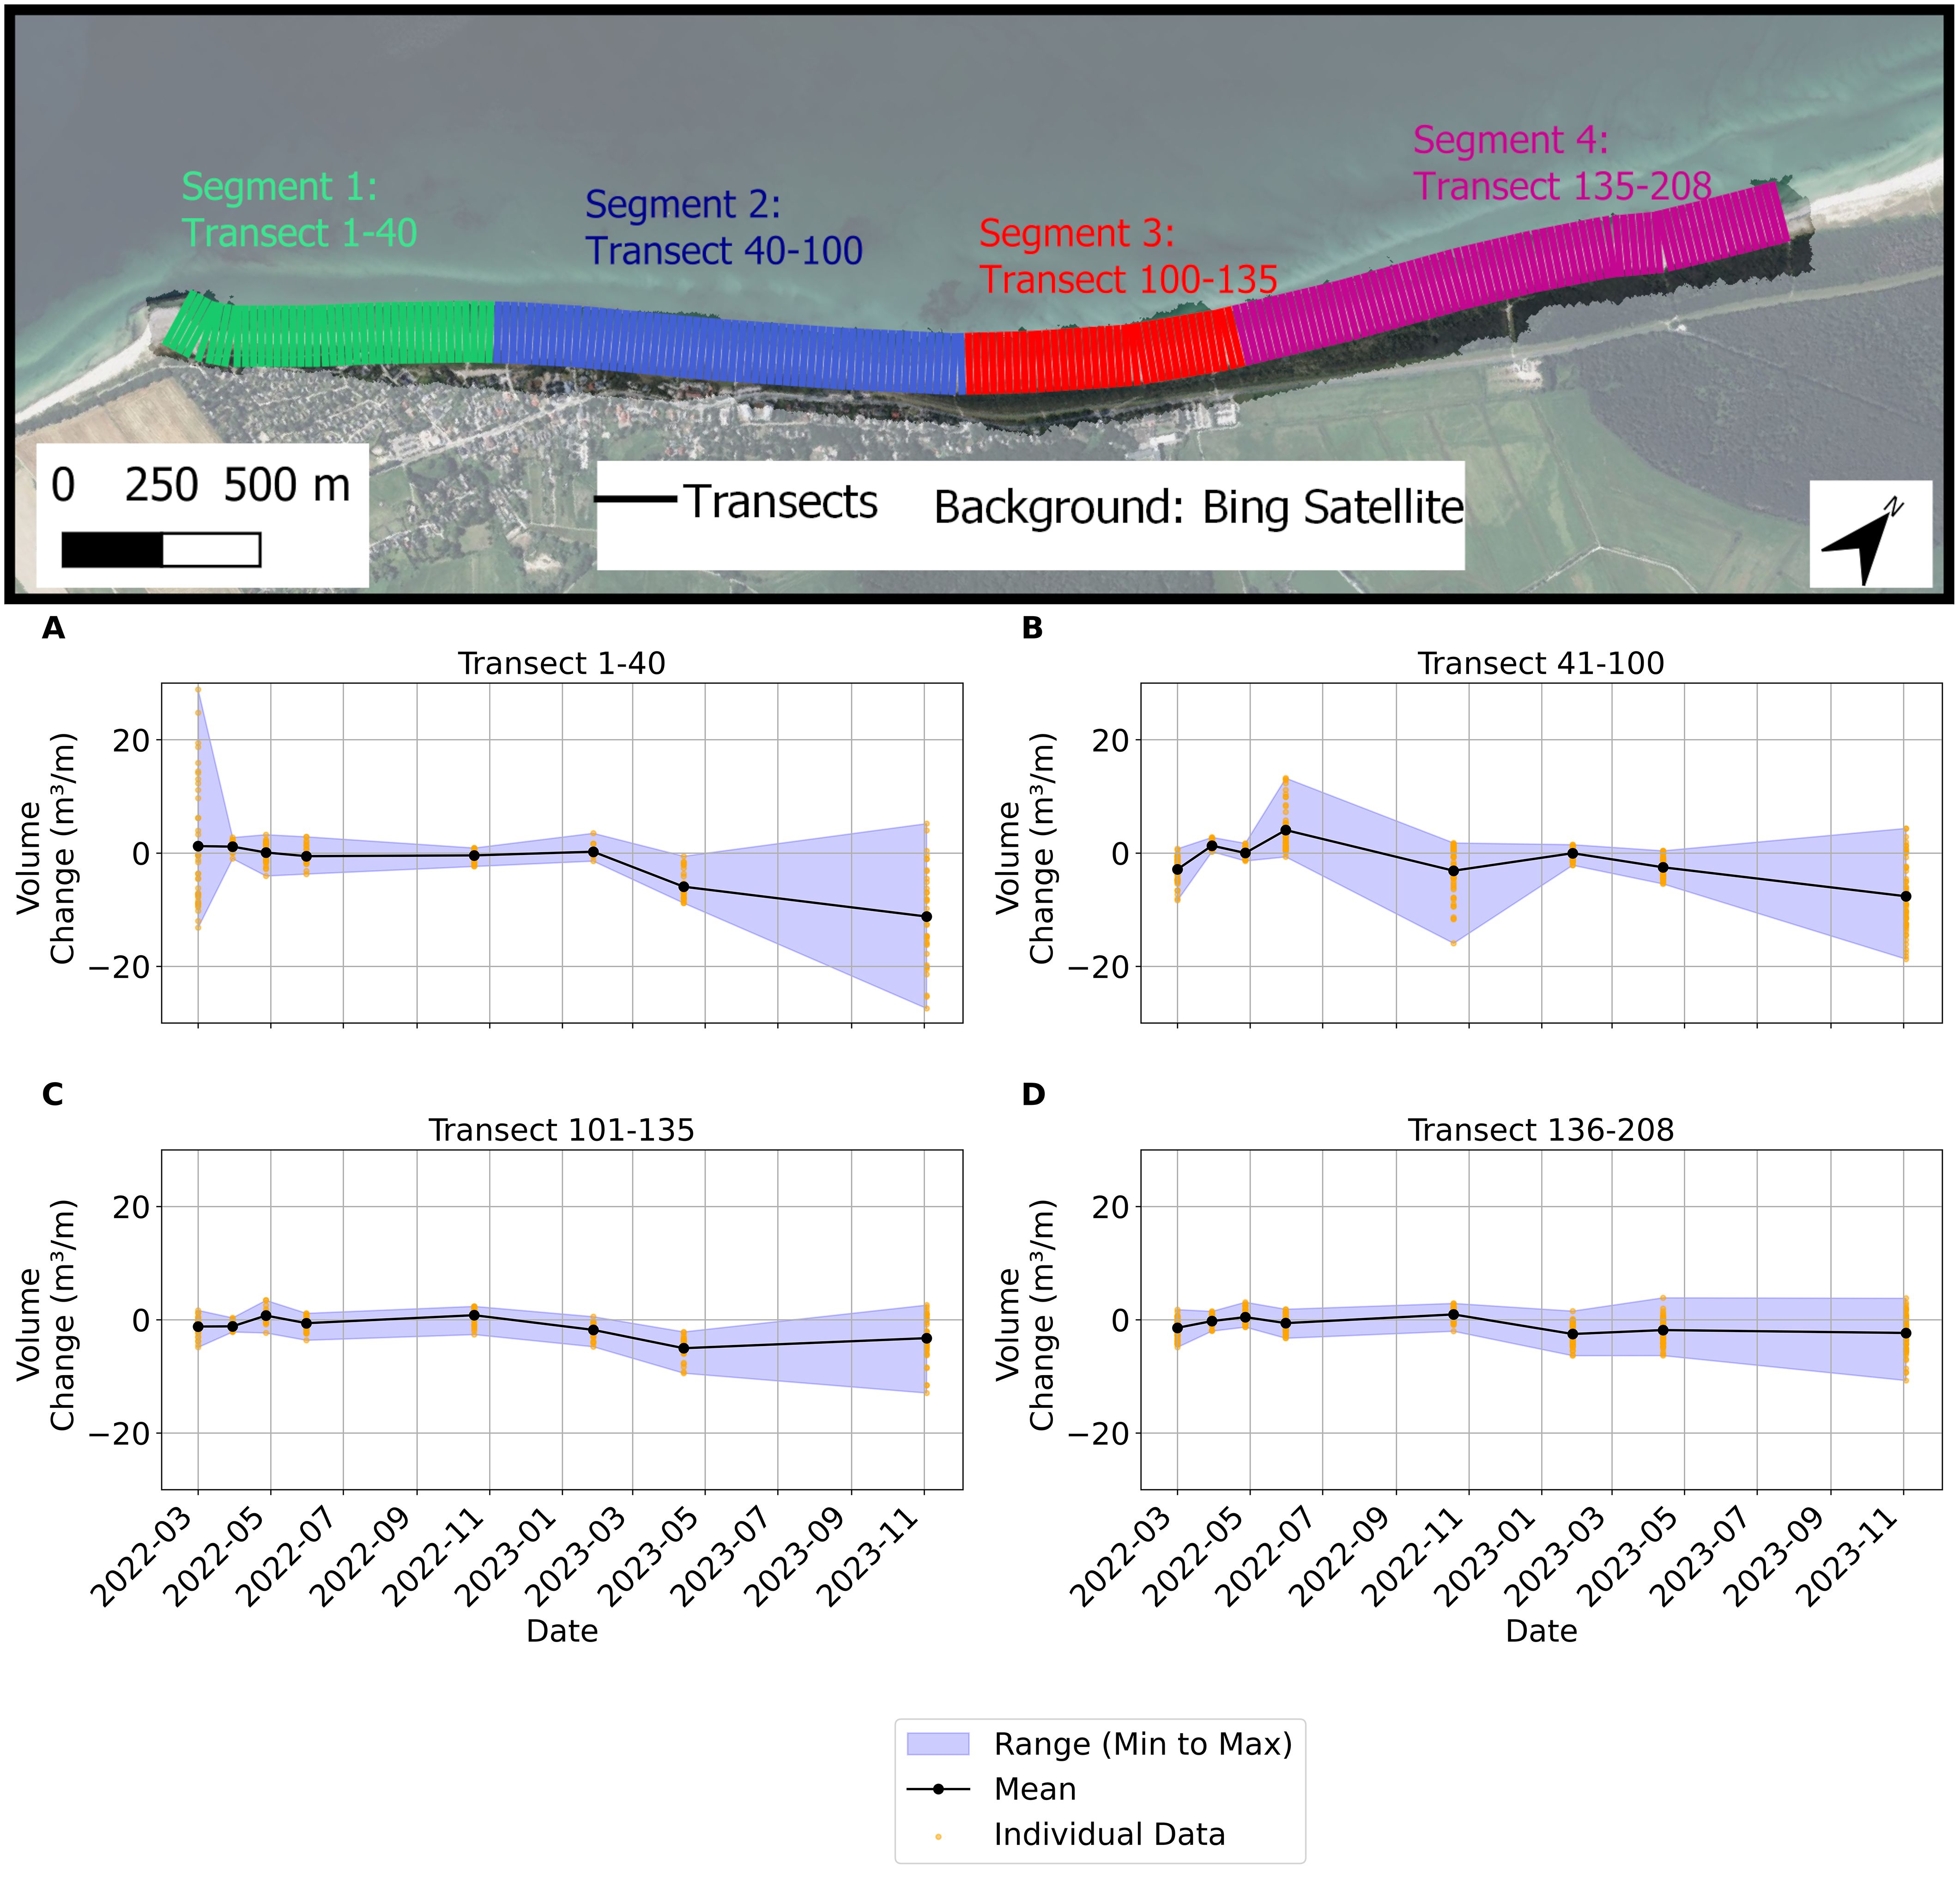
Figure 8. Temporal variations in volume in four segments (top panel) along the study area. The segments are chosen as to show segments of the beach that behave in a similar fashion. The orange dots represents the observed values in each transect, the black line is the mean of all transects and the blue envelope shows the range of the data.
In summary, the four panels illustrated a gradient from persistent losses in the southern portion (Panel A) to more mixed conditions in the middle and north (Panels B, C, and D). All zones exhibited at least some erosional impact during severe events, yet the ability to regain sediment afterward was markedly lower in the southern section.
3.3 Heatmaps of change
From February 2022 to March 2022 (Figure 9A), the beach experienced the final phase of the nourishment operation. This is evident in the substantial deposition in the southwestern section, from 0 to 400 m alongshore. Beyond this, widespread sediment redistribution occurred, with sand being eroded and likely transported offshore to develop the beach slope and offshore sandbars. During this interval, 8,951 m³ of sediment was deposited, while 15,415 m³ was eroded, resulting in a net erosion of 6,464 m³. While minor localized erosion is present, the overall changes were relatively small. Storms on 28 January 2022, with significant wave heights of 2.7 m and a surge level of 0.84 m, and 30 January 2022, with significant wave heights of 4.65 m and a surge level of 1.32 m, likely drove much of this offshore redistribution.
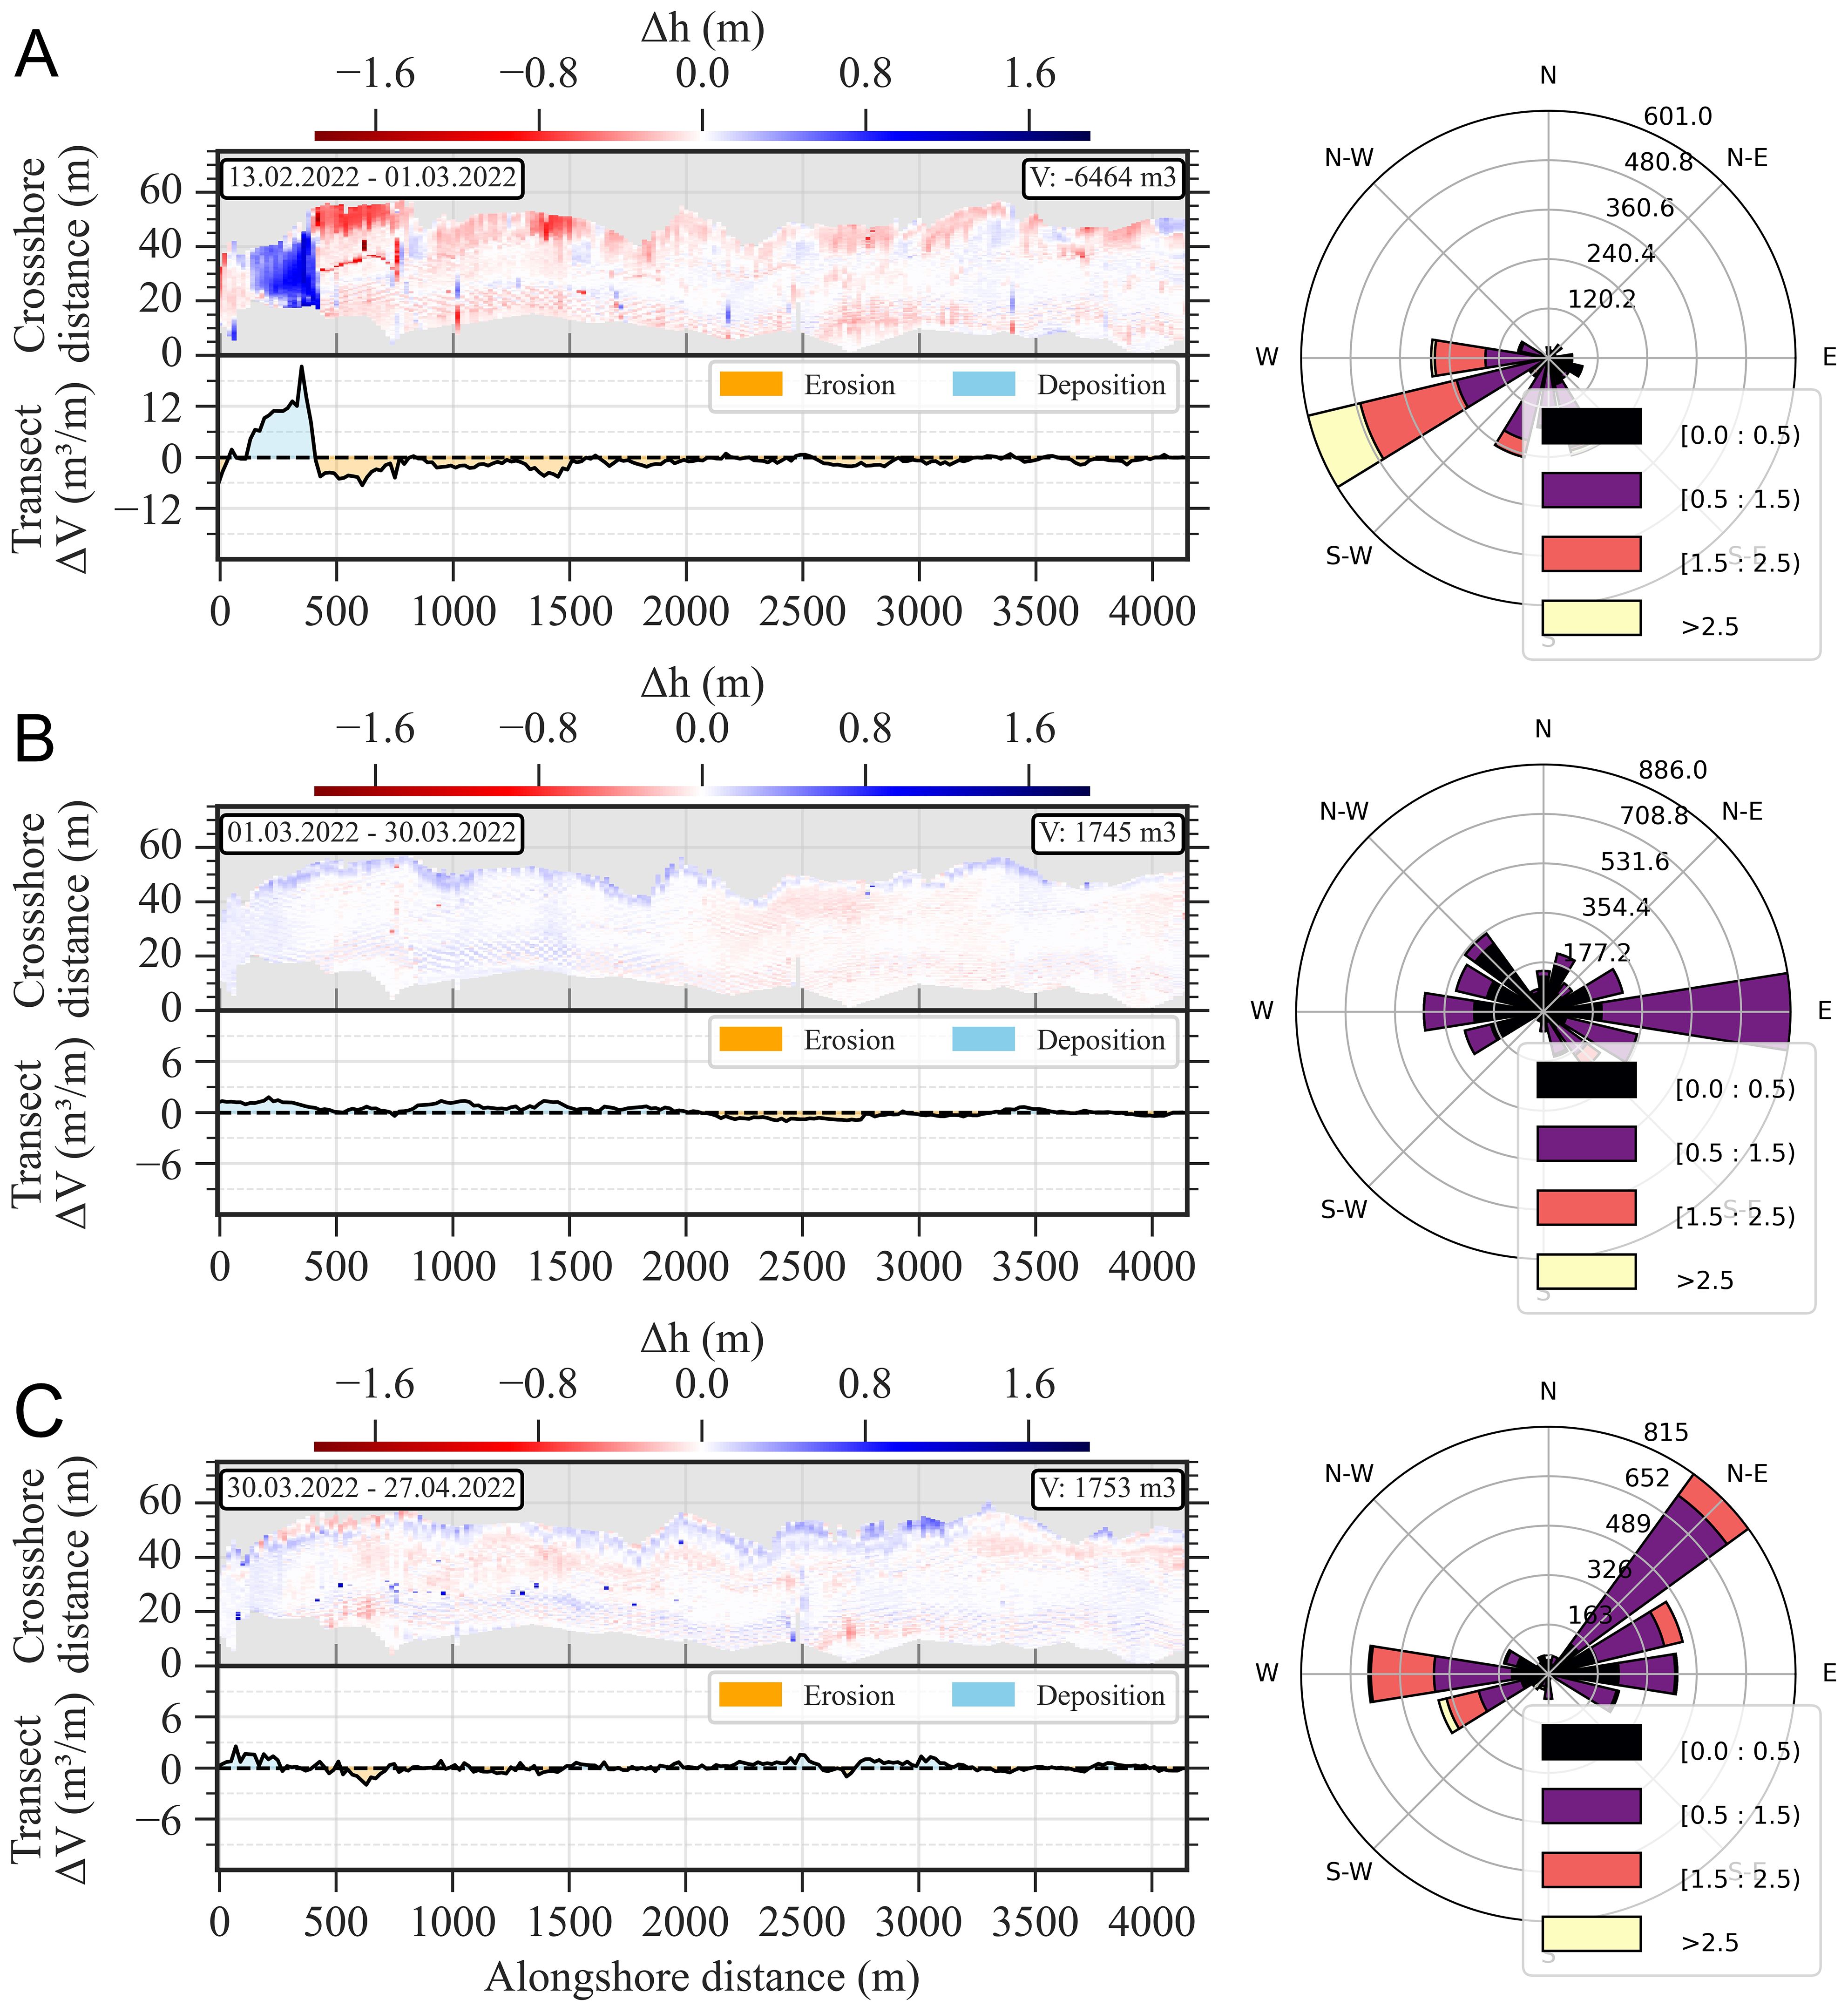
Figure 9. Heatmaps of elevation changes for (A) 13 February 2022 to 1 March 2022, (B) 1 March 2022 to 30 March 2022, and (C) 30 March 2022 to 27 April 2022. In each subfigure, the top panel shows the spatial distribution of elevation changes (the heatmap), and the bottom panel summarizes the net change over each transect. The right panel depicts wave conditions recorded between the respective survey periods. Note that these wave measurements originate from an offshore buoy located about 30 km north of the study area.
From the beginning of March 2022 to the end of March 2022 (Figure 9B), deposition dominated, with sediment accumulation along much of the profile, particularly in the southwestern beach sections. Conversely, localized erosion occurred in the northeastern beach, possibly influenced by fluvial processes or wave refraction. This period saw a net volume gain of 1,745 m³, with 7,342 m³ of sediment deposited and 5597 m³ eroded. The calmer conditions during this interval allowed for gradual recovery and sediment deposition on the foreshore near the swash zone. The influence of easterly storms during this time is reflected in the localized deposition along the shoreline, especially near the break water at the south-western end of the study area.
From March 2022 to April 2022 (Figure 9C), beach dynamics became more heterogeneous, with a mixed pattern of erosion and deposition. The southwestern beach experienced erosion, while deposition occurred along the northeastern beach and dune. A net gain of 1,753 m³ was observed, with 9,859 m³ of sediment deposited and 8,106 m³ eroded. Moderate waves from the northeast likely contributed to localized foreshore erosion in the southwestern portion of the study area, whereas higher-energy waves (significant wave height >2.5 m) from the southwest further eroded the upper foreshore. Overall, calm wave conditions for the majority of the survey period promoted swash-zone accretion along the foreshore.
From April 2022 to May 2022 (Figure 10A), more distinct patterns of alongshore redistribution emerged. Strong deposition occurred in the southwestern beach sections, while erosion affected the northeastern beach and dune. Alternating bands of erosion and deposition suggested the influence of longshore drift, as sediment was transported alongshore in response to wave-driven currents. During this period, 10,395 m³ of sediment was deposited and 7,217 m³ eroded, resulting in a net gain of 3,177 m³. The westerly waves likely contributed to sand accumulation in the foreshore to the north-east of the study area. The deposition near 1000 m alongshore distance extends over the entire beach profile from the water to the dune crest. We could not identify the reason for this, though webcam images showed that during this time heavy machinery was on the beach, possibly redistributing sand.
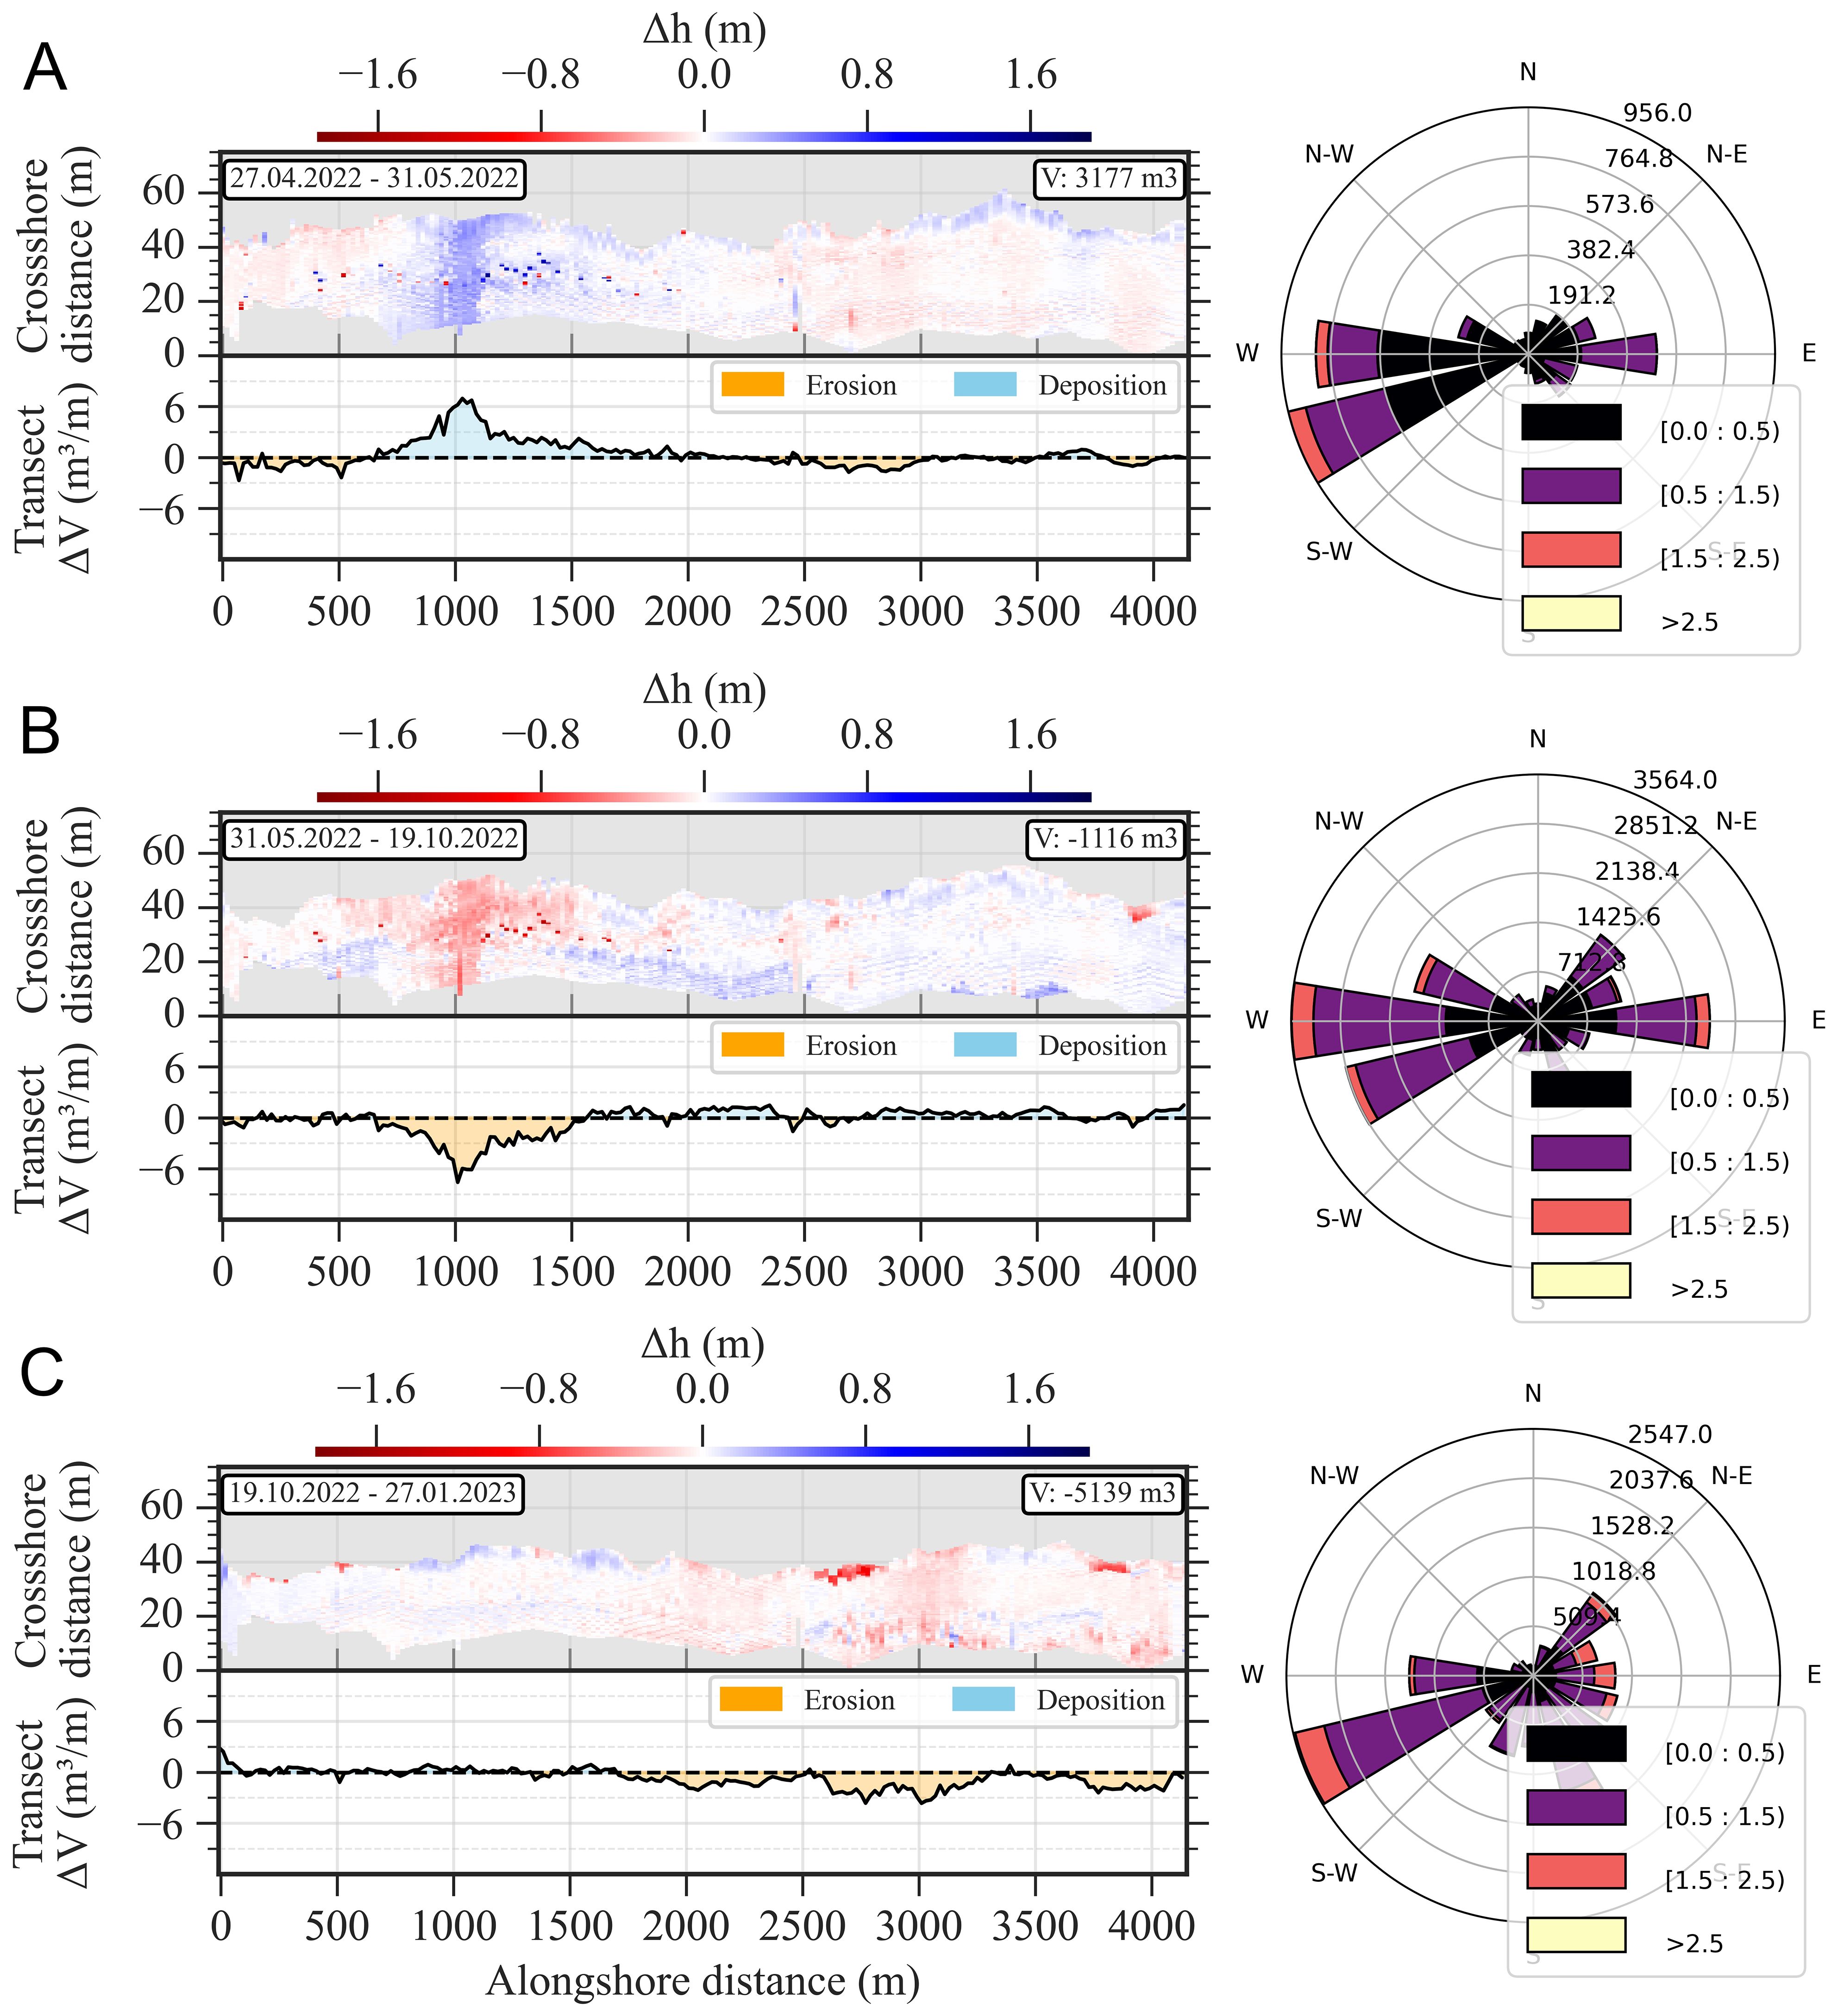
Figure 10. Heatmaps of elevation changes for (A) 27 April 2022 to 31 May 2022, (B) 31 May 2022 to 19 October 2022, and (C) 19 October 2022 to 27 January 2023. In each subfigure, the top panel shows the spatial distribution of elevation changes (the heatmap), and the bottom panel summarizes the net change over each transect. The right panel depicts wave conditions recorded between the respective survey periods. Note that these wave measurements originate from an offshore buoy located about 30 km north of the study area.
From May 2022 to October 2022 (Figure 10B), a reversal of trends occurred, with erosion dominating the southwestern beach and deposition dispersed across the northeastern sections. A net volume loss of 1,116 m³ was observed, with 7988 m³ of sediment deposited and 9,105 m³ eroded. The storm on 20 October 2022, with a significant wave height of 3.94 m and a surge level of 1.50 m, had a significant impact, particularly in the southwestern section, where westerly waves caused cross-shore transport and dune erosion. Conversely, deposition in the northeastern sections reflected the shielding effect of the beach orientation from direct wave impacts.
From October 2022 to January 2023 (Figure 10C), significant erosion occurred, particularly along the northeastern sections of the beach and nearshore zones. Minor deposition was visible in the southwestern shoreline, suggesting sediment redistribution from eroded areas. This period saw a net volume loss of 5,139 m³, with 3,359 m³ of sediment deposited and 8,499 m³ eroded. The storm on 1 April 2023, with significant wave heights of 2.45 m and a surge level of 0.79 m, presumably was a main driver leading to these patterns, with westerly wave energy driving sediment offshore and intensifying dune erosion.
From January 2023 to April 2023 (Figure 11), a major storm event drove extensive erosion along the dune and upper beach, with sand transported offshore to reinforce the sandbar. The net volume loss was 12,154 m³, with 20,594 m³ of sediment deposited and 8,439 m³ eroded. This redistribution reflected the influence of the storm on 1 April 2023, which generated significant cross-shore sediment transport due to its westerly wave direction. The beach experienced pronounced sediment loss from the upper profile, while offshore areas received substantial deposition.
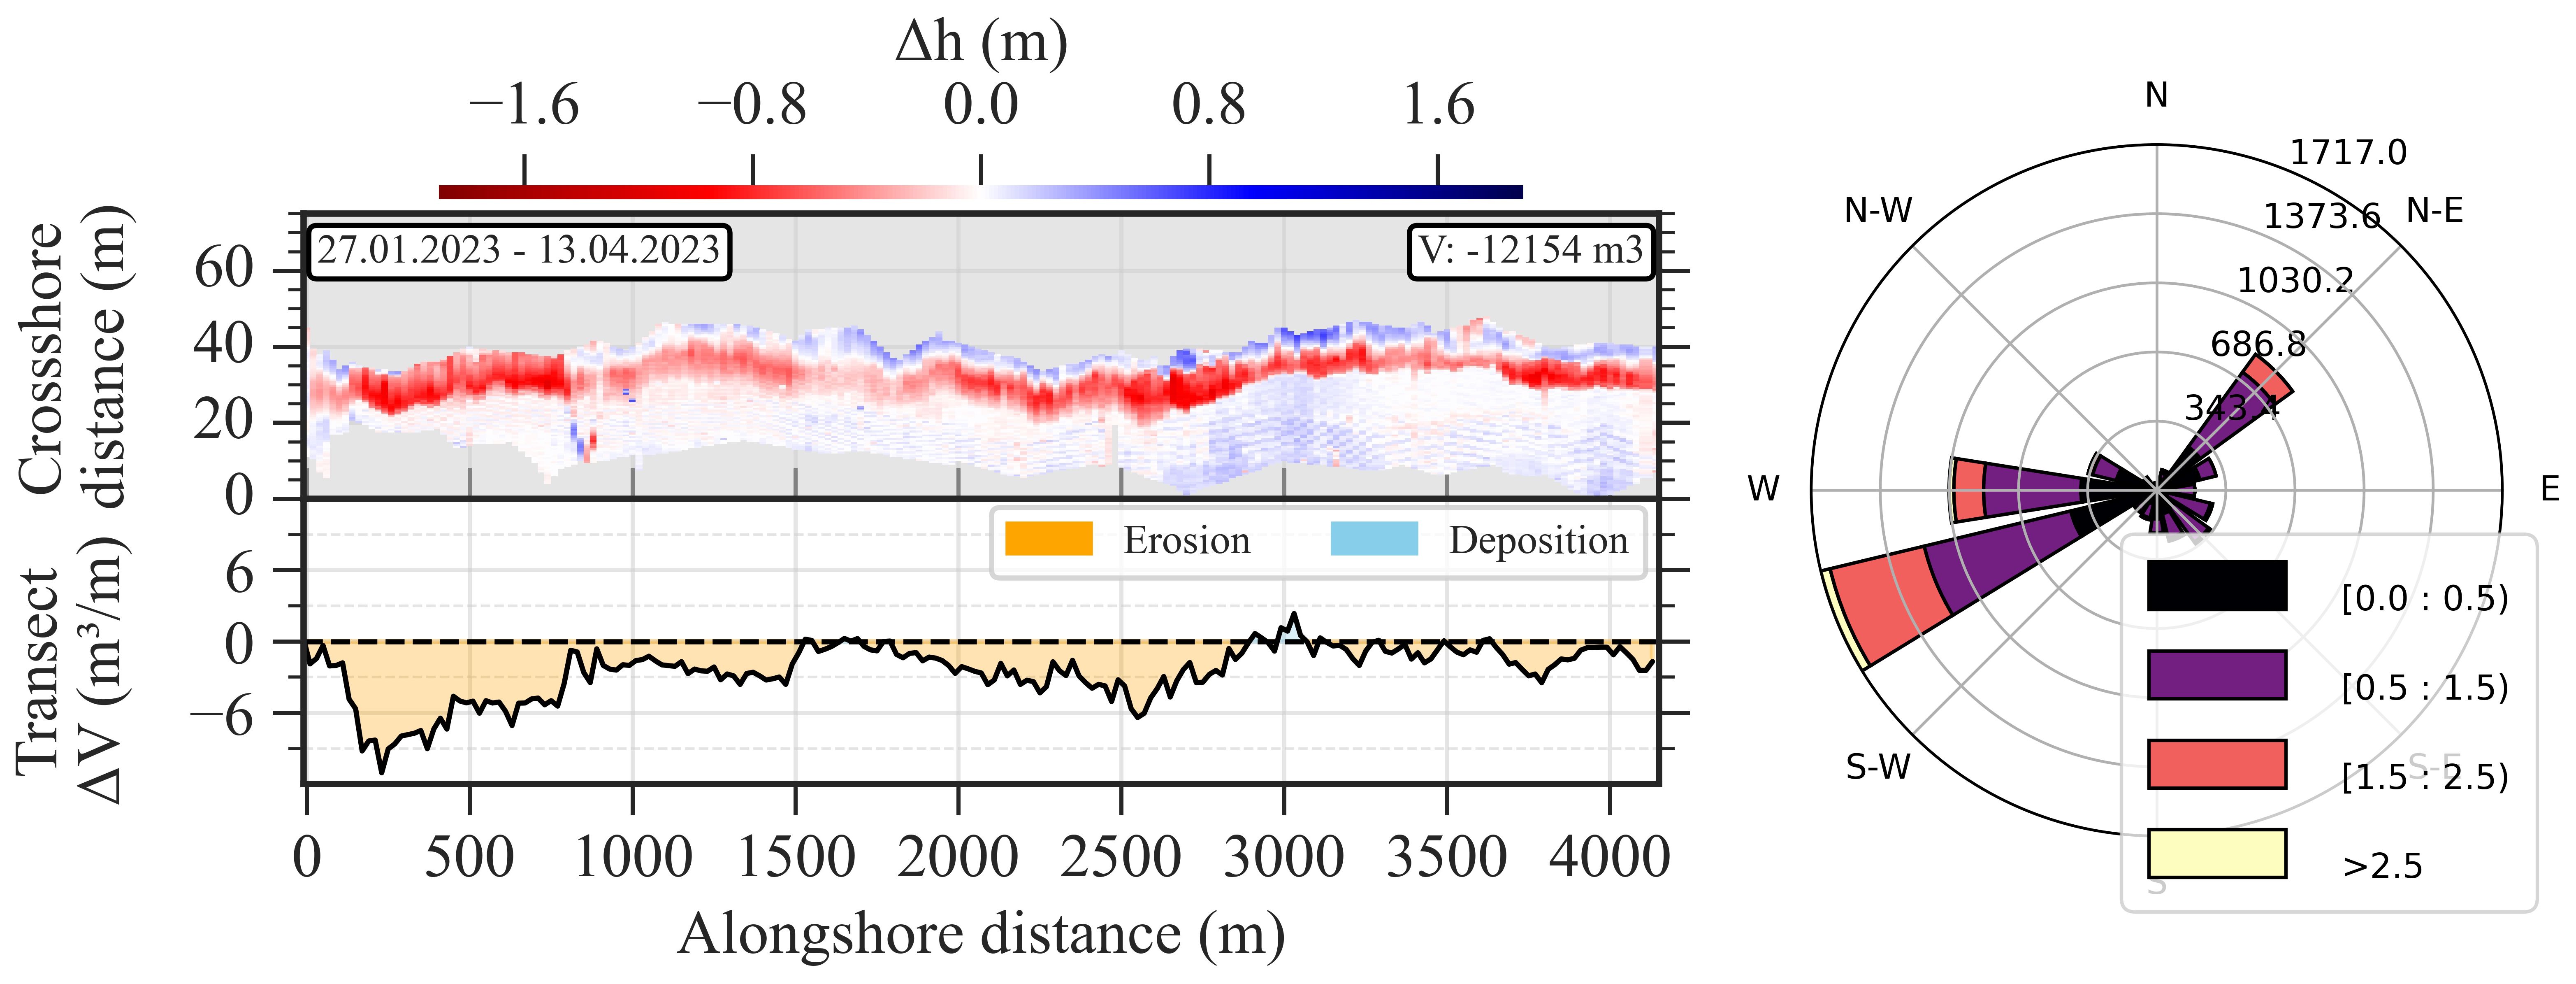
Figure 11. Heatmaps of elevation changes from 27 January 2023 to 13 April 2023. The top panel shows the spatial distribution of elevation changes (the heatmap), and the bottom panel summarizes the net change over each transect. The right panel depicts wave conditions recorded between the respective survey periods. Note that these wave measurements originate from an offshore buoy located about 30 km north of the study area.
From April 2023 to November 2023 (Figure 12), the largest erosional impact was observed, coinciding with the 100-year flood event in October 2023, with significant wave heights of 3.94 m and a surge level of 1.50 m. Extensive dune erosion and complex sediment redistribution patterns dominated, with sand transported from the dune to the beach in the southwestern sections and alternating erosion and deposition visible in the northeastern sections. This period showed a net volume loss of 19,439 m³, with 17,907 m³ of sediment deposited and 37,346 m³ eroded. The westerly storm during this period caused erosion in the south-western part, while areas shielded from direct wave action in the northeast saw some deposition. Based on photographic evidence, dune erosion appears to be driven primarily by storms originating in the east, whereas the high-energy waves from the west may be responsible for eroding the beach.
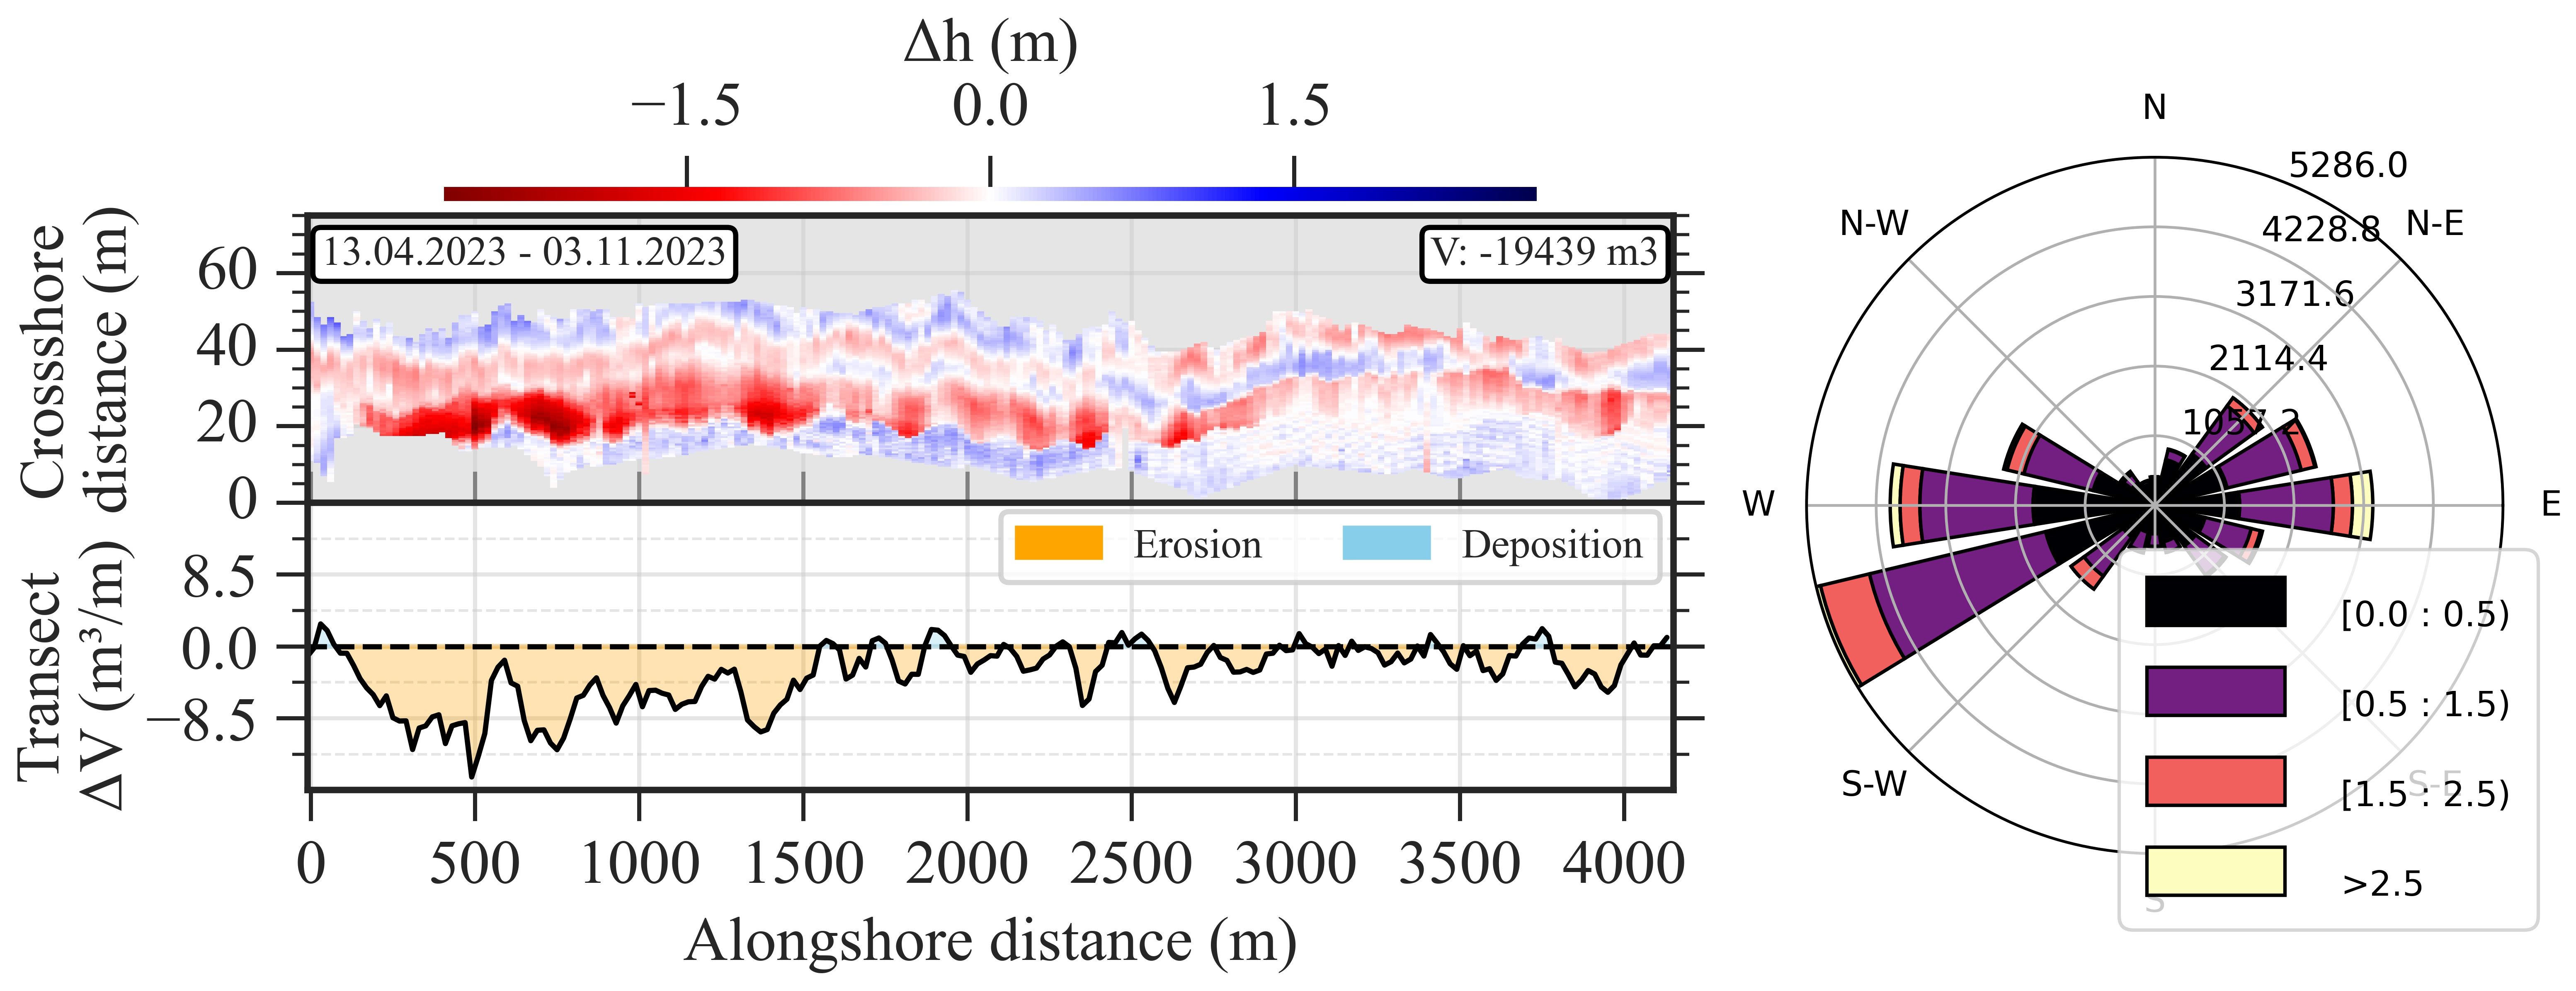
Figure 12. Heatmaps of elevation changes from 13 April 2023 to 03 November 2023. The top panel shows the spatial distribution of elevation changes (the heatmap), and the bottom panel summarizes the net change over each transect. The right panel depicts wave conditions recorded between the respective survey periods. Note that these wave measurements originate from an offshore buoy located about 30 km north of the study area.
The directional forcing of storms significantly influenced the beach dynamics of the beach and dune system. Westerly storms deliver high-energy waves onto the coast from the west, eroding dunes and the upper beach as waves run up the shore and then transport sediment seaward via undertow. This process is evident in the periods of February to March 2022, October 2022 to January 2023, January to April 2023, and April to November 2023, where substantial dune erosion and offshore deposition corresponded to high-energy westerly storm events. Conversely, easterly storms tended to generate onshore-directed wave energy, transporting sand toward the upper beach and dune toe and promoting localized deposition along the shoreline. This effect is most apparent from March 2022 to April 2022, where easterly waves facilitated beach accumulation. The alternating influence of these storm directions highlights the dynamic interplay of cross-shore and alongshore sediment transport processes in shaping the morphology of the beach-dune system.
3.4 Metocean conditions
Figure 13 provides an overview of the metocean conditions recorded during the survey period. In 2022, storm events were predominantly characterized by westerly wave conditions. On January 12, waves reached a maximum height of 1.38 m (average: 0.90 m; 25th quantile = 0.73 m, 50th quantile = 0.92 m, 75th quantile = 1.03 m) with a mean direction of 251°. The maximum water level recorded was 0.29 m, and the storm persisted for nearly 24 hours. On January 20, wave conditions intensified, peaking at 2.13 m (mean: 1.90 m; 25th quantile = 1.79 m, 50th quantile = 1.82 m, 75th quantile = 2.02 m) with a dominant direction of 298°. The water level reached 1.21 m, and the event lasted for 4.83 hours. By January 28, waves attained a maximum height of 2.77 m (average: 1.38 m; 25th quantile = 0.79 m, 50th quantile = 1.49 m, 75th quantile = 1.64 m) from a direction of 281°, with the storm enduring for 23.8 hours and a maximum water level of 0.98 m. On January 31, wave conditions were more variable, with heights up to 1.30 m (mean: 0.52 m; 25th quantile = 0.56 m, 50th quantile = 0.63 m, 75th quantile = 0.85 m) and a dominant direction of 184°, indicating a southerly influence. The water level peaked at 1.20 m, and the event lasted nearly 24 hours.
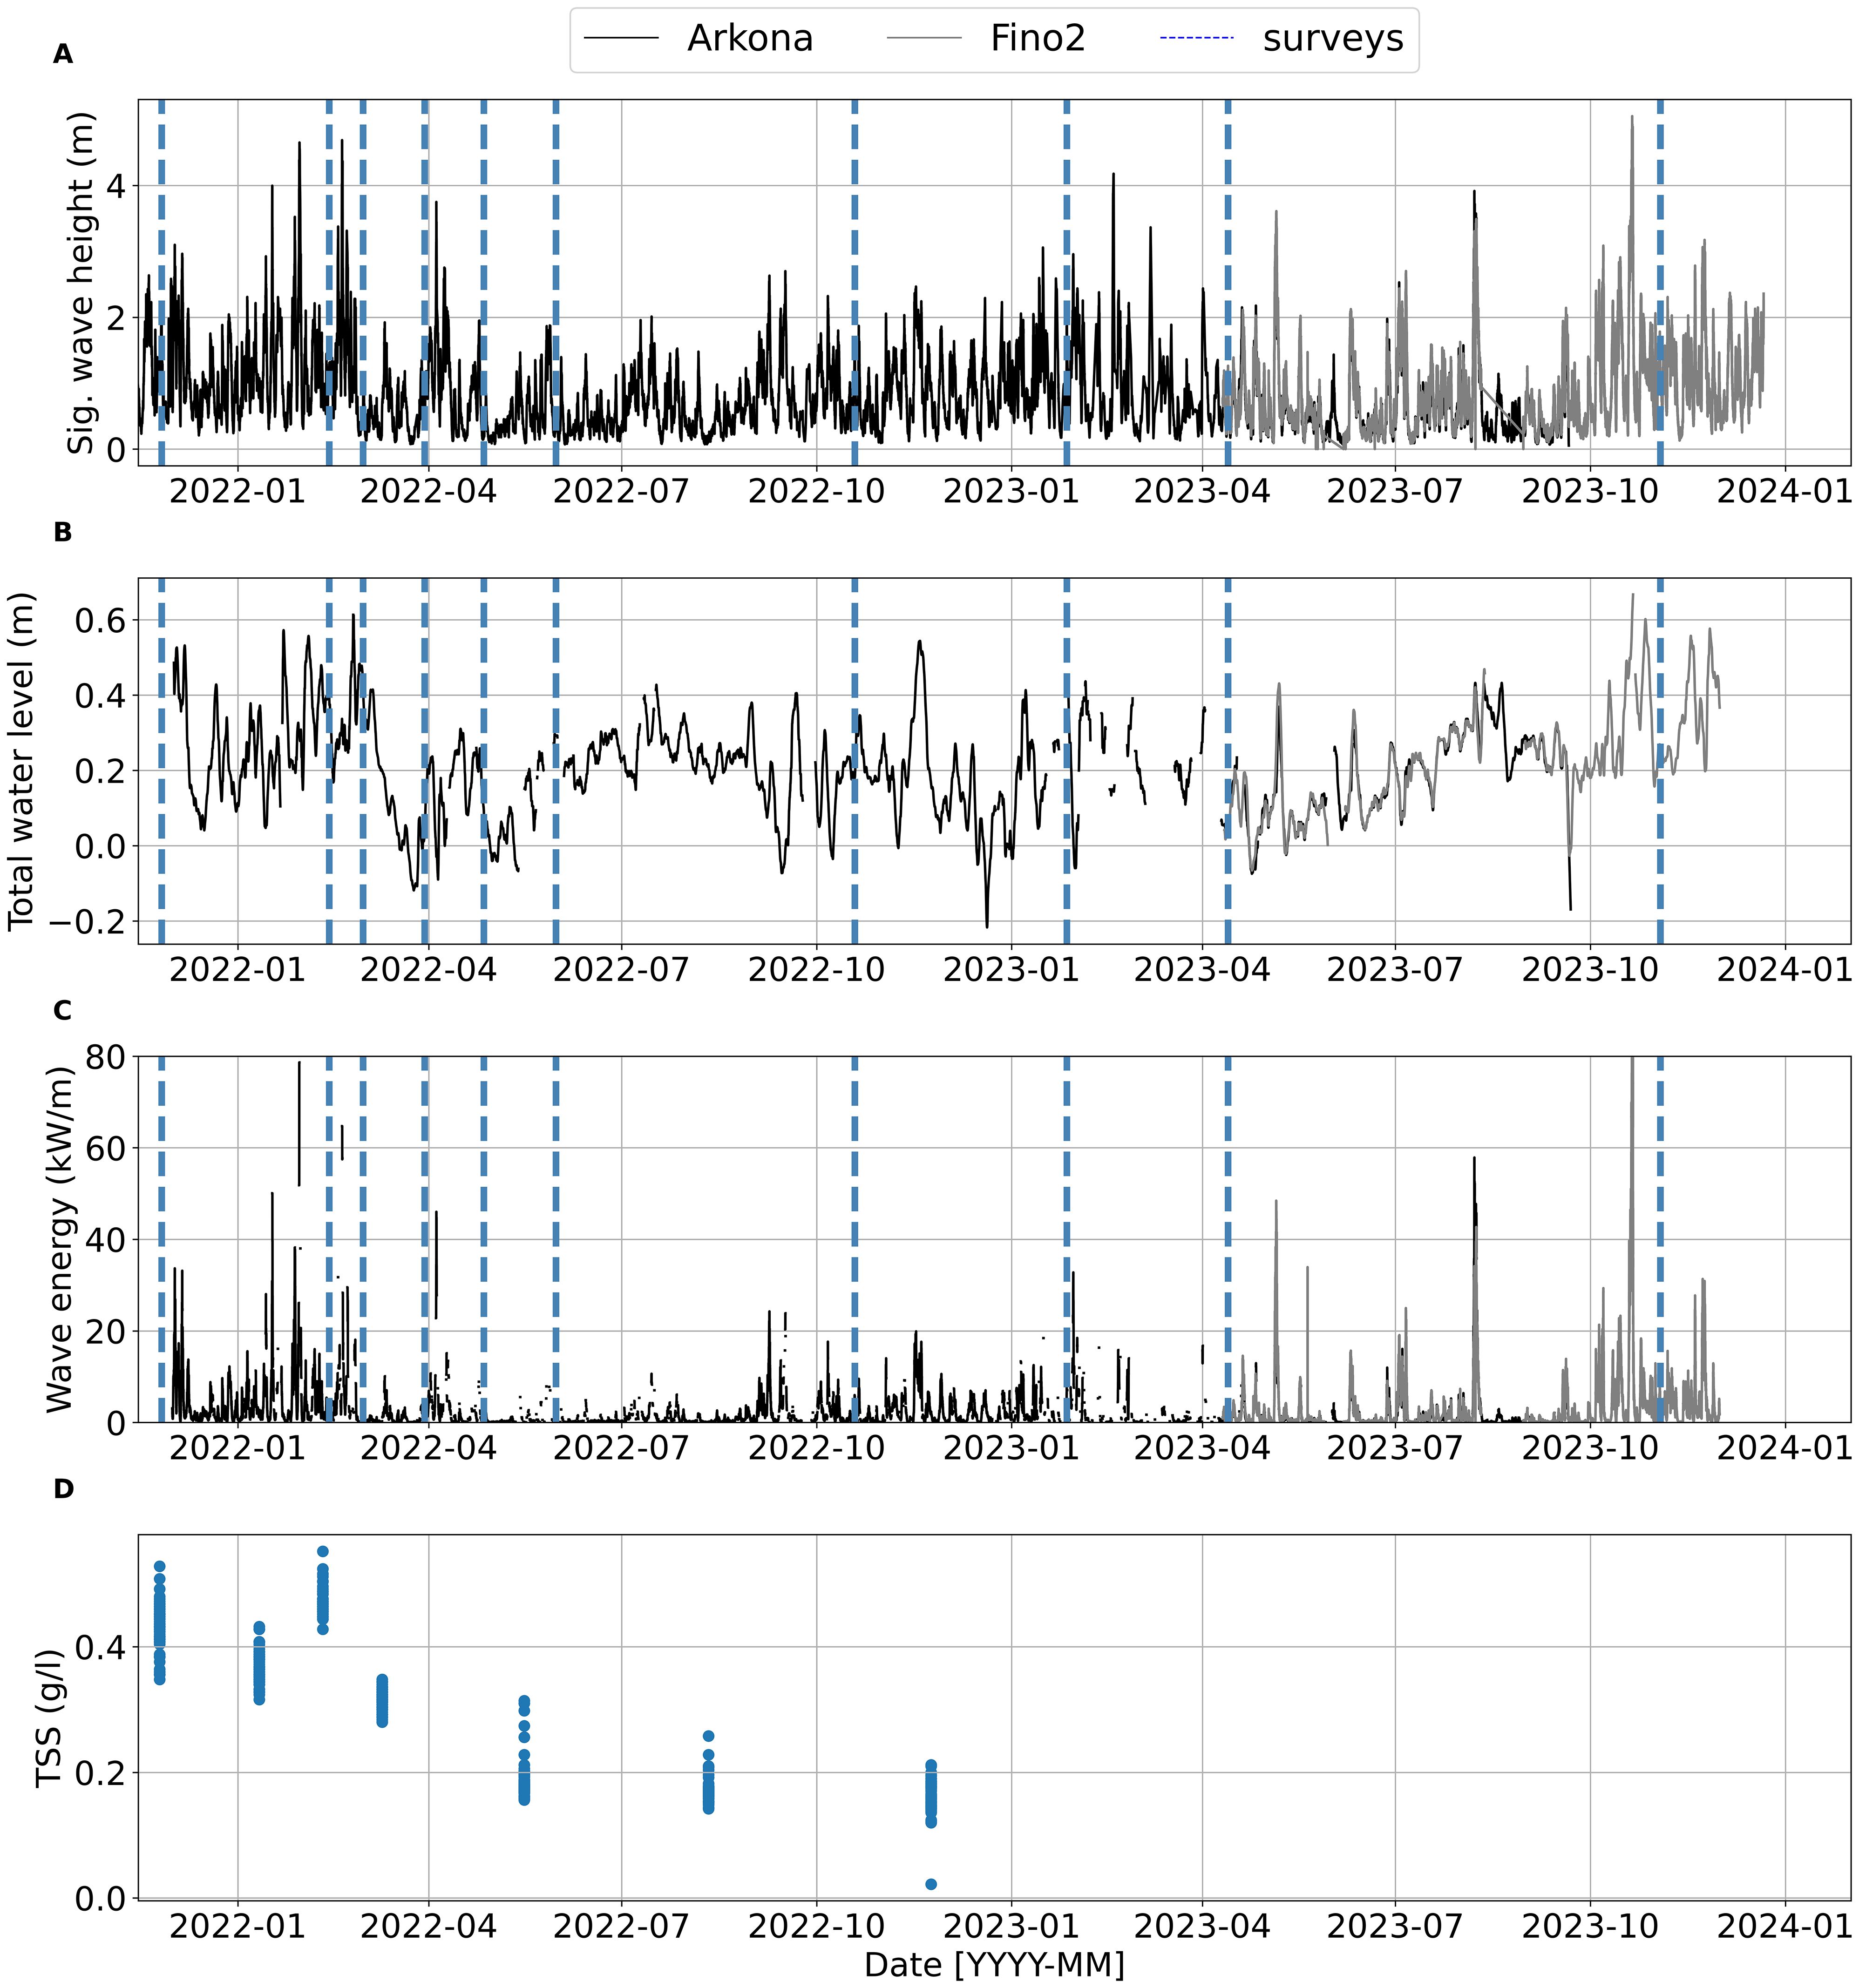
Figure 13. Environmental data (A–D): wave height, water levels, wave energy, and total suspended solids (TSS). Survey dates are marked by blue vertical dashed lines.
In 2023, storm events were marked by more easterly wave conditions. On April 1, waves reached a maximum height of 2.44 m (average: 2.21 m; 25th quantile = 2.14 m, 50th quantile = 2.19 m, 75th quantile = 2.24 m) from 37°, with a maximum water level of 0.93 m, and the event lasted approximately 13 hours. On October 20, wave conditions were more extreme, with a maximum height of 4.95 m (mean: 3.94 m; 25th quantile = 3.35 m, 50th quantile = 4.03 m, 75th quantile = 4.46 m) and a dominant direction of 92°, reflecting a strong easterly influence. The water level peaked at 1.79 m, and the storm persisted for about 24 hours.
Panel D tracks total suspended solids (TSS) levels, starting at elevated concentrations in early 2022, likely due to increased sediment resuspension presumably affected by significant winter storms. Following a nourishment event, TSS levels decrease and return to pre-nourishment levels approximately six months later, around mid-2023. This suggests that after the nourishment, the beach dynamics stabilized, and TSS concentrations reduced to typical background levels.
3.5 Observed volume and slope changes
Figure 14A presents the temporal and spatial evolution of beach volume differences (m³/m) from February 2022 to November 2023 along 4 km of coastline, sampled every 20 m (i.e., from 0 to about 4.16 km). In March 2022, remnants of an ongoing nourishment project were still apparent near 0.4 km, where localized deposition of up to approximately +6 m³/m tapered off toward surrounding areas. Subsequent months, until June 2022, were dominated by erosion (with many locations near –5 m³/m), although a notable depositional peak of about +16.2 m³/m emerges around 1.0 km in June. By November 2022, an erosional episode of about –17.9 m³/m again targeted the same vicinity (1.0 km), whereas the remainder of the coastline generally exhibited net deposition of +2 to +6 m³/m. Webcam images suggest anthropogenic intervention—such as sand redistribution by heavy machinery—may have contributed to this marked spatial contrast.
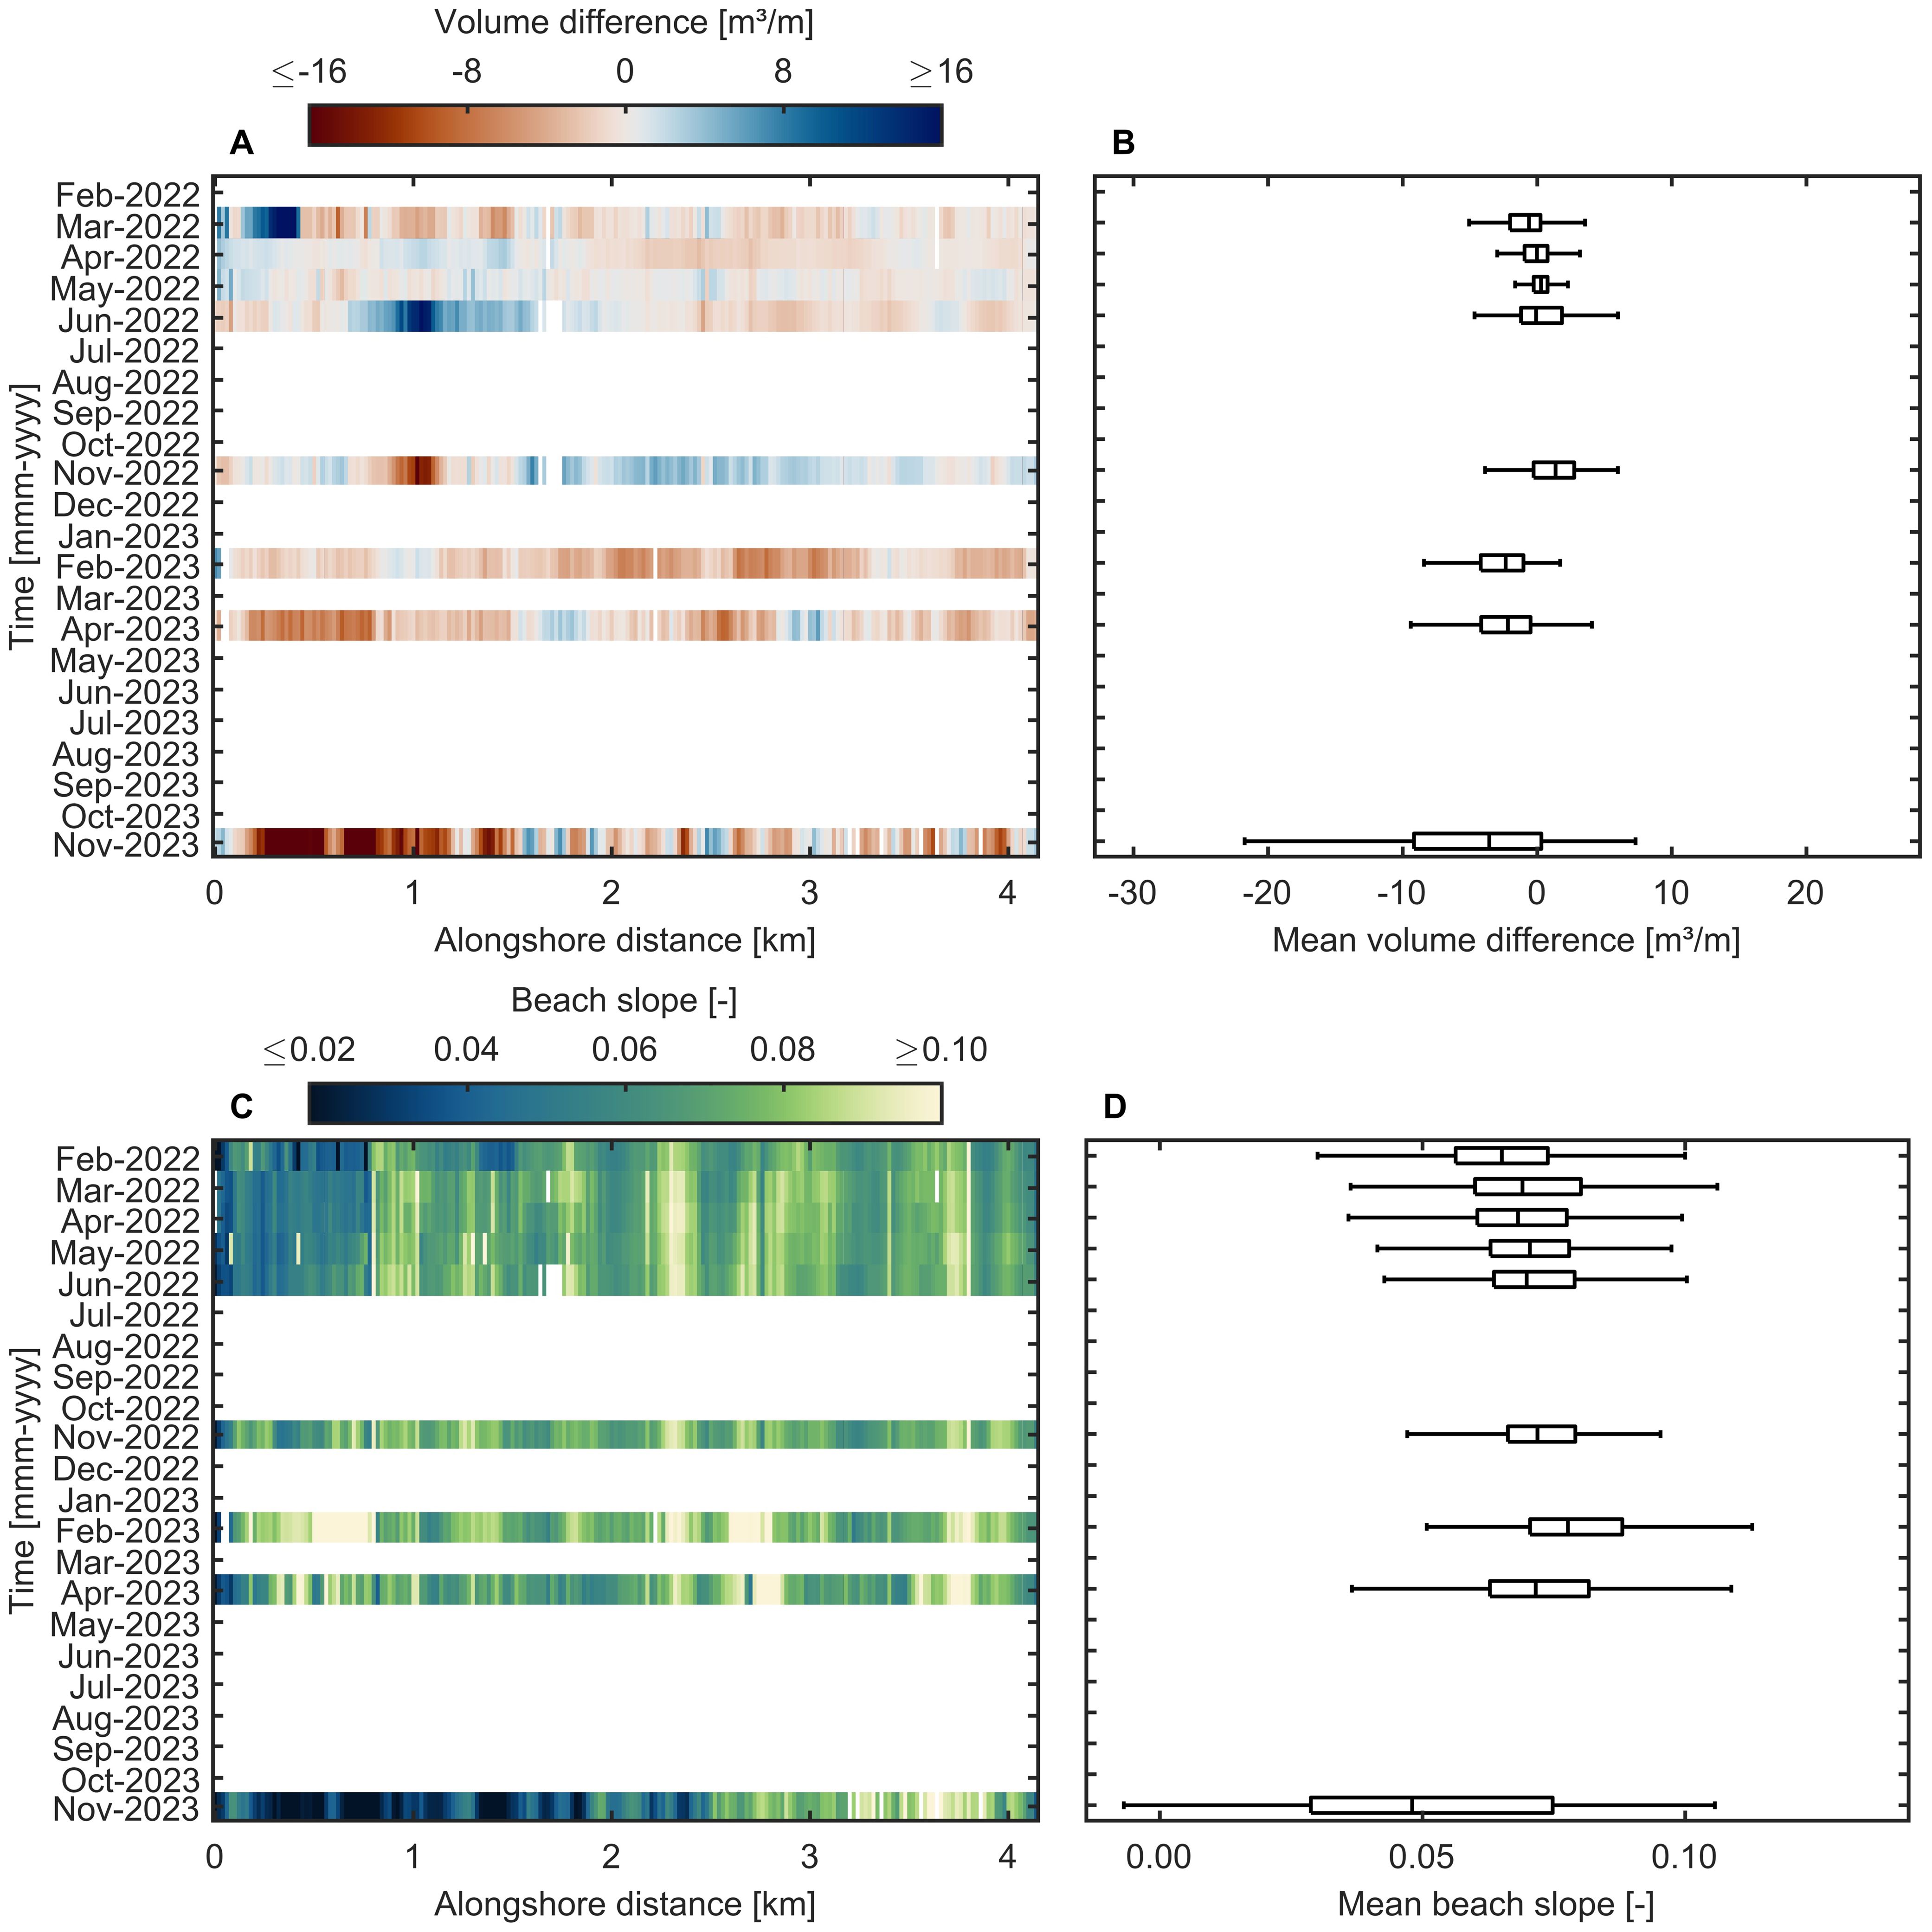
Figure 14. Temporal and spatial development of beach volume and slope across profiles from February 2022 to November 2023. (A) Heatmap of beach volume (m³/m) for profiles 1 to 208, highlighting changes in volume from each survey to the next. (B) Box plot of mean beach volume, showing variability, median, and trends in beach volume. (C) Heatmap of beach slope for profiles 1 to 208 (see. Figure 2), illustrating changes in slope over time. (D) Box plot of mean beach slope, indicating changes in median slope values and variability over the observation period.
Moving into 2023, the data revealed extensive erosion in February and April, with widespread values often dropping below –8 m³/m, likely triggered by high‐energy storm events. Mean volume differences approached –4 m³/m, and some areas dipped as low as roughly –15 m³/m. By November 2023, the shoreline experienced the most extreme conditions of the entire observation period: severe erosion (down to about –30 m³/m) concentrated between 0.1 km and 1.4 km, while a few sites farther downdrift showed localized deposition of up to approximately +10 m³/m. This highly uneven distribution yielded a standard deviation exceeding 6 m³/m—underscoring the intensifying spatial variability. Figure 14B corroborates that the overall spread in volume differences widens over time, culminating in November 2023 with the greatest divergence along the beach.
Turning to beach slopes, Figure 14C tracks their temporal and spatial evolution from February 2022 to November 2023 across the same 0 to 4.16 km stretch. In early 2022, slopes ranged from approximately 0.04 to 0.08 (mean near 0.06). By June 2022, sections around 0.8 km became slightly steeper (about 0.09), coinciding with the localized erosion and deposition patterns described above. November 2022 saw a narrower slope window (0.05–0.06) spanning nearly the entire shoreline, reflecting a relatively uniform state. However, by February 2023, several zones—particularly near 0.8 km, 2.8 km, and 3.6 km—showed much steeper slopes, reaching about 0.10, likely driven by localized high‐energy wave impacts. Although these peaks partially subsided in subsequent months, slope variability increased overall. By November 2023, a clear spatial partition emerged: from 0.0 km to about 2.4 km, the beach flattened substantially to around 0.02–0.04, while from about 2.4 km to 4.16 km, slopes remained between approximately 0.07 and 0.10. The accompanying box‐plot indicates that slope variability peaks at this final timestep, underscoring increasingly divergent behavior between flatter and steeper shoreline segments. Over the full period, beach slopes thus fluctuated between about 0.02 and 0.10, mirroring the evolving sediment dynamics observed in the volume‐change data.
3.6 Residual behavior dynamics
The plot of the r-BCDs for the beach and dune system reveals critical spatial patterns of erosion and deposition along the coastal stretch (Figure 15). In this analysis, red areas indicate erosion, and blue areas represent deposition. The r-BCD is utilized to analyze hotspot behavioral patterns in areas where precise wave data is unavailable, relying solely on topographic information. This method is grounded in the fundamental concept of morphodynamic feedback loops, which link processes and morphology. By deriving r-BCDs from high-frequency elevation changes, the approach captures the morphological variability of landforms shaped by the influence of locally active geomorphic processes.
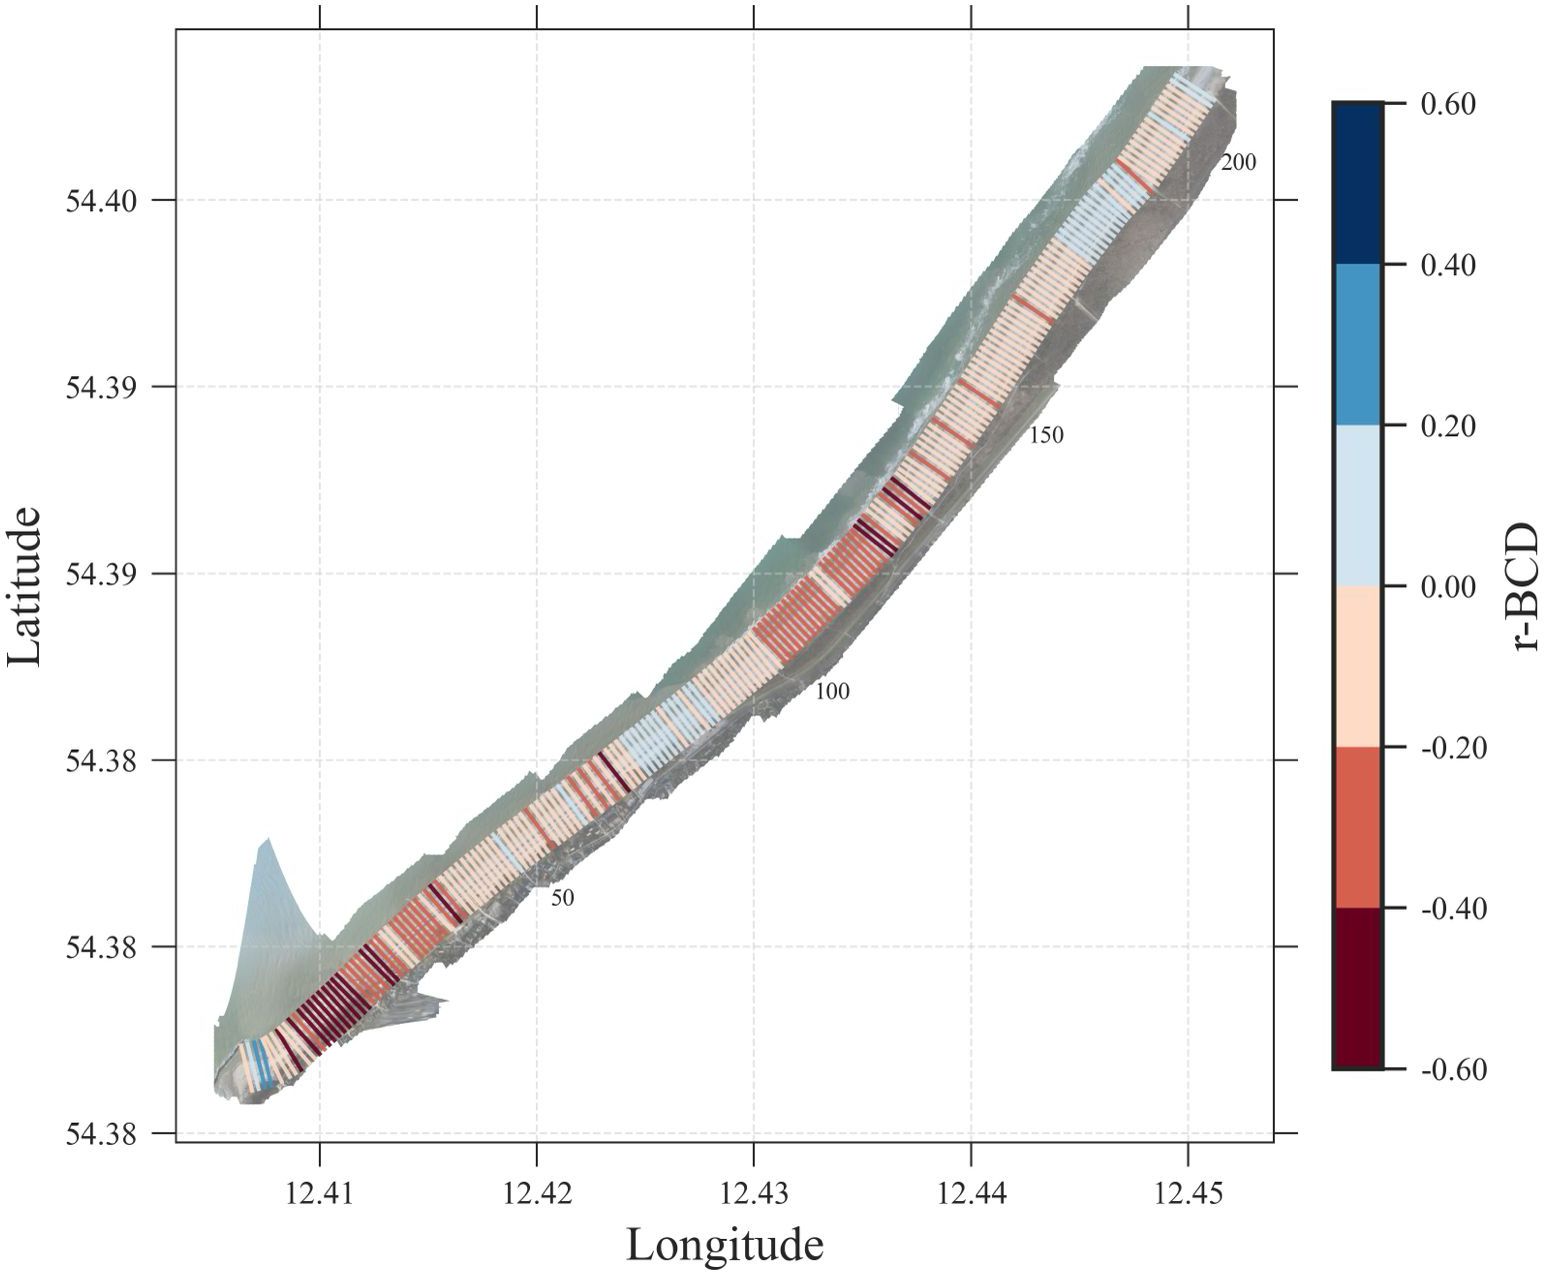
Figure 15. Visualization of beach profile dynamics over time (r-BCDs). The plot displays cross-shore transects extracted from multitemporal UAV-SfM datasets, illustrating changes in elevation profiles. Color gradients represent elevation differences, with warmer colors indicating areas of sediment accretion and cooler colors indicating erosion.
In Supplementary Figure 1, the orientation of the transects is plotted against the residuals to investigate potential relationships between these variables. The R² value from the regression analysis indicates a weak correlation between the orientation of the transects and the residual values. This suggests that while the orientation, which reflects the direction of wave attack, does have some influence on the beach dynamics, it is not the sole determining factor.
The weak correlation implies that other factors significantly contribute to the observed patterns. For example, the presence of groins and submerged breakwaters can play a critical role in modifying sediment transport and deposition patterns.
4 Discussion
4.1 Volumetric change
The morphodynamic evolution observed in the study area over the surveyed intervals (13.02.2022–01.03.2022) reveals sediment redistribution patterns that closely align with those documented in literature on nourished and natural beach systems. The data indicate alternating phases of accretion and erosion, which are primarily controlled by variations in wave energy and direction. The results are consistent with studies that have examined both subaerial and subaqueous beach changes following sand nourishments (Habel et al., 2016; Adell et al., 2024).
During the survey period 13.02.2022 to 01.03.2022—when the nourishment operation was still underway and had already been impacted by a storm—the beach experienced pronounced erosion. This strong erosion is consistent with literature findings (Elko and Wang, 2007), which report that storm-induced processes can lead to an adjustment of the beach slope toward a gentler profile as observed in our study area. Furthermore, the rapid redistribution of sand following these storm events likely contributed to the formation of offshore sandbars, as documented for Ahrenshoop (Tiede et al., 2024) and observed at nourished beaches e.g. along the Dutch coast at the Sand Engine (de Schipper et al., 2016) or at the Hondsbossche dune (Kroon et al., 2022).
Periods of moderate wave energy (01.03.2022 to 31.05.2022) coincided with net beach accretion, particularly in the lower foreshore and nearshore regions. This pattern has been widely reported in nourishment studies, where calm conditions favor onshore sediment migration leading to foreshore progradation (Mendes et al., 2021). The observed volumetric gains in these timesteps support the conclusion that lower-energy wave climates enable sediment retention and gradual incorporation of nourishment material into the natural system.
During the interval from 31.05.2022 to 19.10.2022, under moderate wave climate conditions, a similar pattern of foreshore accretion was observed in the northeastern part of the study area. At an alongshore distance of approximately 3800 m, downdrift erosion was evident from the groin field, consistent with (Bruun, 1995), who noted that man-made structures can inhibit longshore sediment transport.
The subsequent interval, from 19.10.2022 to 27.01.2023, exhibited pronounced erosion near the northeastern end of the study area. The erosive feature, an erosive spit located near the 3800 m transect, appears to be a continuation of the downdrift erosion observed in the previous time step. Its enhanced manifestation in this period is likely attributable to a more southerly (steeper) angle of wave attack, which increased the erosive impact in the downdrift zone (Lim et al., 2022).
Conversely, intervals dominated by higher-energy conditions (27.01.2023–03.11.2023) resulted in substantial erosion across the upper and lower foreshore, with localized accretion at the dune foot and offshore bar formations. This pattern is consistent with observations from large-scale nourishments, where storms drive rapid offshore transport and subaerial volume reduction (Kroon et al., 2022). In the present study, the negative sediment balance observed in dt6 and dt7 indicates that sediment was transported out of the surveyed domain, either offshore or downdrift. This agrees with Mendes et al. (2021), who documented longshore transport losses following extreme events, particularly during storm sequences that disrupted previous accretion phases. The more pronounced erosion in the southwest of the study area is likely due to downdrift erosion during westerly waves from the breakwater which blocks the alongshore sediment transport from the adjacent coastal section. This is also evident in the segmented plot of the volume development (Figure 8).
The spatial distribution of erosion and deposition from 13.04.2023 to 03.11.2023 further supports the role of storm-driven sediment redistribution. Alongshore segmentation of the erosion/accretion balance indicates that areas experiencing net volume loss in the lower beach correspond to adjacent dune accumulation, suggesting landward sediment transport under extreme conditions. This is in agreement with observations from previous studies, where nourishment material was rapidly reconfigured into nearshore bars, later enabling onshore migration under calmer conditions (Pinto et al., 2022). The alternating bands of erosion and accretion observed during the last 2 timesteps closely mirror the morphodynamic adjustments documented by Adell et al. (2024) following nourishment interventions. These patterns reflect the gradual evolution of the beach profile toward a gentler slope, achieved through the erosion of protruding sections and the infilling of depressions. In the present study, the last timestep (13.04.2024 to 03.11.2023) exhibited an extensive negative sediment balance, yet small-scale dune accretion in certain sectors suggests that not all sediment was permanently lost from the system. This finding aligns with Kroon et al. (2022), who noted that despite initial sediment losses following nourishment, the longer-term redistribution resulted in dune development and localized recovery in specific morphological units.
4.2 Implications
The observed trends highlight the importance of wave energy thresholds in determining whether nourished or naturally occurring sediment remains within a given coastal segment or is transported offshore or alongshore. The temporal variability in erosion and accretion patterns indicates that sediment retention is largely controlled by wave height variability, confirming previous studies that emphasize the dominance of high-energy events in dictating nourishment performance over short timescales (Mendes et al., 2021; Pinto et al., 2022). The findings suggest that while short-term monitoring can capture the immediate response of a nourished or natural beach to wave forcing, longer-term observations are required to fully assess whether sediment exported from the initial placement area is ultimately retained within the broader coastal system.
Our study integrates high-frequency topographic surveys with ML to derive r-BCDs, providing a more advanced understanding of beach nourishment dynamics than traditional methods. The r-BCD approach enables the identification of behavioral regimes and morphodynamic feedback loops, offering a comprehensive analysis of sediment transport patterns and their spatio-temporal evolution. Unlike many existing studies, which focus on immediate or short-term responses, our dataset spans multiple years, capturing a wide range of post-nourishment phases. This extended temporal scope allows us to examine not only the immediate adjustments following nourishment but also the longer-term morphodynamic adjustments that occur under varying environmental conditions. The ability to analyze both calm periods and storm-induced changes is particularly valuable for understanding the cumulative impacts of nourishment projects over time.
The inclusion of storms from differing directions further enhances the depth of our analysis. While many studies focus on specific hydrodynamic scenarios, such as Roberts and Wang (2012), who emphasized sediment transport in tidally influenced settings, our dataset captures the impacts of both easterly and westerly storms. This directional variability provides a more nuanced understanding of sediment redistribution processes, revealing the distinct roles that cross-shore and alongshore transport play under varying wave conditions. For example, the observed erosion patterns during westerly storms highlight the dominance of cross-shore sediment transport, while deposition trends during easterly storms emphasize the role of alongshore currents in redistributing sediment within the system. By integrating directional wave forcing into the analysis, our study addresses a critical gap in the literature, providing insights into the complex beach dynamics often overlooked in more localized assessments. Supplementary Figure 2 illustrates how two different segments of the same beach can exhibit starkly contrasting responses, despite being impacted by the same storm.
To investigate how the coastline orientation affects the incident wave angle and thus the vulnerability to storms, we computed the correlation of r-BCD values against the orientation of coastline. The resulting weak correlation implies that other factors significantly contribute to the observed patterns. For example, the presence of groins and submerged breakwaters can play a critical role in modifying sediment transport and deposition patterns (Nordstrom, 2014; Ostrowski et al., 2016; Saengsupavanich et al., 2022; Bosboom and Stive, 2023). These structures disrupt the natural flow of sediments, creating zones of erosion and deposition that are independent of the transect orientation (Choufu et al., 2019; Saengsupavanich et al., 2022). Additionally, local geomorphic features, sediment availability, and hydrodynamic conditions such as tidal currents and wave refraction may also influence the development of the residual values (Bosboom and Stive, 2023; Liu et al., 2025).
Additionally, the advanced analytical capabilities of ML allow us to identify subtle patterns in erosion and deposition across the full nourishment life cycle. By detecting shifts in behavioral regimes, r-BCD captures how different sections of the beach respond to environmental forcing, offering actionable insights for adaptive management. This is particularly relevant for assessing the effectiveness of nourishment projects, as the ability to link beach dynamics to specific hydrodynamic conditions enables the identification of areas that require targeted interventions. For instance, our analysis highlights the differential impacts of storms on various beach sections, emphasizing the importance of spatially tailored management strategies to enhance beach resilience.
5 Conclusion
In this study, a beach nourishment project was surveyed for approximately two years using a UAV. Subsequently, the volumetric changes in the nourished beach and dune, driven by severe single storm events and cumulative wave forcing, were examined. To support this analysis, a ML approach was used to process the datasets, ensuring a fast and reliable workflow that removes erroneous measurements and provides the data in a standardized format suitable for further statistical computations.
Comparisons between the 100-year flood event (October 2023) and the storm season (October 2022–January 2023) revealed that cumulative erosion from a storm season can be as large as the impact of a single extreme event. Even though the storm was extreme, its impact on the beach and dune system was comparable to the cumulative effects of the October–January storm season. These findings underscore the need for consistent monitoring to capture both gradual and sudden changes.
While sediment transport along the Baltic coast is predominantly in north-easterly direction, our results show that it can be reversed to the west during single storm events. This reversal in net transport direction can be beneficial, as it retains sediment within the study area, promoting longer-term stability in the coastal system. Such findings emphasize the value of combining high-frequency data collection with advanced analytical tools to understand the dynamic interplay of sediment transport processes under varying metocean forcing.
The presented methods enable detailed and efficient analyses of beach dynamics. In this study, the high spatial resolution effectively captures subtle variations in coastline orientation, their influence on wave incidence angles, and the resulting alongshore variability in beach dynamics. Future research can further refine these methods to comprehensively assess beach dynamics, providing valuable insights for coastal practitioners to optimize nourishment strategies.
Data availability statement
The datasets presented in this study can be found in online repositories. The names of the repository/repositories and accession number(s) can be found below: https://doi.org/10.5281/zenodo.14247159.
Author contributions
JT: Conceptualization, Data curation, Formal analysis, Investigation, Methodology, Project administration, Software, Validation, Visualization, Writing – original draft, Writing – review & editing. JL: Formal analysis, Methodology, Software, Validation, Visualization, Writing – review & editing. CJ: Visualization, Writing – review & editing. AM: Writing – review & editing. TS: Funding acquisition, Resources, Supervision, Writing – review & editing.
Funding
The author(s) declare that financial support was received for the research and/or publication of this article. This research was conducted as part of the joint research project ECAS-Baltic which was funded by the German Federal Ministry of Education and Research under the funding code 03F0860E.
Acknowledgments
We acknowledge the support of StALU in facilitating this research.
Conflict of interest
The authors declare that the research was conducted in the absence of any commercial or financial relationships that could be construed as a potential conflict of interest.
Generative AI statement
The author(s) declare that no Generative AI was used in the creation of this manuscript.
Publisher’s note
All claims expressed in this article are solely those of the authors and do not necessarily represent those of their affiliated organizations, or those of the publisher, the editors and the reviewers. Any product that may be evaluated in this article, or claim that may be made by its manufacturer, is not guaranteed or endorsed by the publisher.
Supplementary material
The Supplementary Material for this article can be found online at: https://www.frontiersin.org/articles/10.3389/fmars.2025.1537066/full#supplementary-material
References
Adell A., Kroon A., Almström B., Larson M., Hallin C. (2024). Observed beach nourishment development in a semi-enclosed coastal embayment. Geomorphology 462, 109324. doi: 10.1016/j.geomorph.2024.109324
Bell J. J., McGrath E., Biggerstaff A., Bates T., Bennett H., Marlow J., et al. (2015). Sediment impacts on marine sponges. Mar. pollut. Bull. 94, 5–13. doi: 10.1016/j.marpolbul.2015.03.030
Bird E., Lewis N. (2015). Beach renourishment (Cham: Springer International Publishing). doi: 10.1007/978-3-319-09728-2
Bishop-Taylor R., Nanson R., Sagar S., Lymburner L. (2021). Mapping Australia’s dynamic coastline at mean sea level using three decades of Landsat imagery. Remote Sens. Environ. 267, 112734. doi: 10.1016/j.rse.2021.112734
Björkqvist J.-V., Lukas I., Alari V., van Vledder G., Hulst S., Pettersson H., et al. (2018). Comparing a 41-year model hindcast with decades of wave measurements from the Baltic Sea. Ocean Eng. 152, 57–71. doi: 10.1016/j.oceaneng.2018.01.048
Bosboom J., Stive M. (2023). Coastal dynamics (Delft University of Technology,Delft, The Netherlands: TU Delft OPEN Publishing). doi: 10.5074/T.2021.001
Bruun P. (1995). The development of downdrift erosion. J. Coast. Res. 11, 1242–1257. Available at: https://www.jstor.org/stable/4298427.
Casella E., Drechsel J., Winter C., Benninghoff M., Rovere A. (2020). Accuracy of sand beach topography surveying by drones and photogrammetry. Geo-Mar Lett. 40, 255–268. doi: 10.1007/s00367-020-00638-8
Cheong S.-M., Silliman B., Wong P. P., van Wesenbeeck B., Kim C.-K., Guannel G. (2013). Coastal adaptation with ecological engineering. Nat. Clim Change 3, 787–791. doi: 10.1038/nclimate1854
Choufu L., Abbasi S., Pourshahbaz H., Taghvaei P., Tfwala S. (2019). Investigation of Flow, Erosion, and Sedimentation Pattern around Varied Groynes under Different Hydraulic and Geometric Conditions: A Numerical Study. Water 11, 235. doi: 10.3390/w11020235
Contreras-de-Villar F., García F. J., Muñoz-Perez J. J., Contreras-de-Villar A., Ruiz-Ortiz V., Lopez P., et al. (2021). Beach leveling using a remotely piloted aircraft system (RPAS): problems and solutions. J. Mar. Sci. Eng. 9, 19. doi: 10.3390/jmse9010019
Cook K. L., Dietze M. (2019). Short Communication: A simple workflow for robust low-cost UAV-derived change detection without ground control points. Earth Surface Dynamics 7, 1009–1017. doi: 10.5194/esurf-7-1009-2019
David C. G., Kohl N., Casella E., Rovere A., Ballesteros P., Schlurmann T. (2021). Structure-from-Motion on shallow reefs and beaches: potential and limitations of consumer-grade drones to reconstruct topography and bathymetry. Coral Reefs 40, 835–851. doi: 10.1007/s00338-021-02088-9
Deng J., Woodroffe C. D., Rogers K., Harff J. (2017). Morphogenetic modelling of coastal and estuarine evolution. Earth-Science Rev. 171, 254–271. doi: 10.1016/j.earscirev.2017.05.011
de Schipper M. A., de Vries S., Ruessink G., de Zeeuw R. C., Rutten J., van Gelder-Maas C., et al. (2016). Initial spreading of a mega feeder nourishment: Observations of the Sand Engine pilot project. Coast. Eng. 111, 23–38. doi: 10.1016/j.coastaleng.2015.10.011
De Schipper M., Ludka B., Raubenheimer B., Luijendijk A., Schlacher T. (2020). Beach nourishment has complex implications for the future of sandy shores. Nat. Rev. Earth Environ. 2, 70–84. doi: 10.1038/s43017-020-00109-9
Elko N. A., Wang P. (2007). Immediate profile and planform evolution of a beach nourishment project with hurricane influences. Coast. Eng. 54, 49–66. doi: 10.1016/j.coastaleng.2006.08.001
Forlani G., Dall’Asta E., Diotri F., Cella U. M. D., Roncella R., Santise M. (2018). Quality Assessment of DSMs Produced from UAV Flights Georeferenced with On-Board RTK Positioning. Remote Sens. 10, 311. doi: 10.3390/rs10020311
Gijsman R., Visscher J., Schlurmann T. (2019). The lifetime of shoreface nourishments in fields with nearshore sandbar migration. Coast. Eng. 152, 103521. doi: 10.1016/j.coastaleng.2019.103521
Glueck D., Schubert H. (2024). Suspended Particle Dynamics during Sand Nourishments and Storm Events: A Comparative Analysis. Sediment Transport Res. - Further Recent Adv. doi: 10.5772/intechopen.1004905
Gonçalves J. A., Henriques R. (2015). UAV photogrammetry for topographic monitoring of coastal areas. ISPRS J. Photogrammetry Remote Sens. 104, 101–111. doi: 10.1016/j.isprsjprs.2015.02.009
Grottoli E., Biausque M., Rogers D., Jackson D. W. T., Cooper J. A. G. (2021). Structure-from-motion-derived digital surface models from historical aerial photographs: A new 3D application for coastal dune monitoring. Remote Sens. 13, 95. doi: 10.3390/rs13010095
Habel S., Fletcher C. H., Barbee M., Anderson T. R. (2016). The influence of seasonal patterns on a beach nourishment project in a complex reef environment. Coast. Eng. 116, 67–76. doi: 10.1016/j.coastaleng.2016.06.006
Harff J., Deng J., Dudzińska-Nowak J., Fröhle P., Groh A., Hünicke B., et al. (2017). “What Determines the Change of Coastlines in the Baltic Sea?,“. Coastline Changes Baltic Sea South to East: Past Future Projection (Cham), 15–35. doi: 10.1007/978-3-319-49894-2_2
Höhle J., Höhle M. (2009). Accuracy assessment of digital elevation models by means of robust statistical methods. ISPRS J. Photogrammetry Remote Sens. 64, 398–406. doi: 10.1016/j.isprsjprs.2009.02.003
Huisman B. J. A., Walstra D.-J. R., Radermacher M., de Schipper M. A., Ruessink B. G. (2019). Observations and modelling of shoreface nourishment behaviour. J. Mar. Sci. Eng. 7, 59. doi: 10.3390/jmse7030059
Jones R., Bessell-Browne P., Fisher R., Klonowski W., Slivkoff M. (2016). Assessing the impacts of sediments from dredging on corals. Mar. pollut. Bull. 102, 9–29. doi: 10.1016/j.marpolbul.2015.10.049
Kaehler C., Cantré S., Schweiger C., Saathoff F. (2022). Dune Erosion at the German Baltic Coast—Investigation and Analysis of a Large-Scale Field Experiment Compared to Life Dunes. . J. Mar. Sci. Eng. 10, 1605. doi: 10.3390/jmse10111605
Kortekaas S., Bagdanaviciute I., Gyssels P., Huerta J. M. A., Héquette A. (2010). Assessment of the Effects of Marine Aggregate Extraction on the Coastline: an Example from the German Baltic Sea Coast. J. Coast. Res. SI 51, 205–214. doi: 10.2307/40928832
Kortekaas S., Bagdanavičiūtė I., Gyssels P., Huerta A., Hequette A. (2013). Assessment of the effects of marine aggregate extraction on the coastline: an example from the German Baltic Sea coast. J. Coast. Res. SI 51, 205–214. doi: 10.2307/40928832
Kroon A., De Schipper M., Vries S., Aarninkhof S. (2022). Subaqueous and subaerial beach changes after implementation of a mega nourishment in front of a sea dike. J. Mar. Sci. Eng. 10, 1152. doi: 10.3390/jmse10081152
Lim C., Hwang S., Lee J. (2022). An analytical model for beach erosion downdrift of groins: case study of Jeongdongjin Beach, Korea. Earth Surface Dynamics 10, 151–163. doi: 10.5194/esurf-10-151-2022
Liu S., Hu Z., Grandjean T. J., Wang Z. B., Van Zelst V. T. M., Qi L., et al. (2025). Dynamics and drivers of tidal flat morphology in China. Nat. Commun. 16, 2153. doi: 10.1038/s41467-025-57525-y
PubMed Abstract | PubMed Abstract | Crossref Full Text | Google Scholar
Madsen K. S., Høyer J. L., Fu W., Donlon C. (2015). Blending of satellite and tide gauge sea level observations and its assimilation in a storm surge model of the North Sea and Baltic Sea. J. Geophysical Res. (Oceans) 120, 6405–6418. doi: 10.1002/2015JC011070
Mancini F., Dubbini M., Gattelli M., Stecchi F., Fabbri S., Gabbianelli G. (2013). Using Unmanned Aerial Vehicles (UAV) for High-Resolution Reconstruction of Topography: The Structure from Motion Approach on Coastal Environments. Remote Sens. 5, 6880–6898. doi: 10.3390/rs5126880
Masria A. (2024). Bridging coastal challenges: The role of remote sensing and future research. Regional Stud. Mar. Sci. 73, 103502. doi: 10.1016/j.rsma.2024.103502
Mendes D., Pais-Barbosa J., Baptista P., Silva P. A., Bernardes C., Pinto C. (2021). Beach response to a shoreface nourishment (Aveiro, Portugal). J. Mar. Sci. Eng. 9, 1112. doi: 10.3390/jmse9101112
Mielck F., Hass H. C., Michaelis R., Sander L., Papenmeier S., Wiltshire K. H. (2019). Morphological changes due to marine aggregate extraction for beach nourishment in the German Bight (SE North Sea). Geo-Mar Lett. 39, 47–58. doi: 10.1007/s00367-018-0556-4
Müller G., Stelzer K., Smollich S., Gade M., Adolph W., Melchionna S., et al. (2016). Remotely sensing the German Wadden Sea—a new approach to address national and international environmental legislation. Environ. Monit Assess. 188, 595. doi: 10.1007/s10661-016-5591-x
Nex F., Armenakis C., Cramer M., Cucci D. A., Gerke M., Honkavaara E., et al. (2022). UAV in the advent of the twenties: Where we stand and what is next. ISPRS J. Photogrammetry Remote Sens. 184, 215–242. doi: 10.1016/j.isprsjprs.2021.12.006
Nordstrom K. F. (2014). Living with shore protection structures: A review. Estuarine Coast. Shelf Sci. 150, 11–23. doi: 10.1016/j.ecss.2013.11.003
Nota E. W., Nijland W., de Haas T. (2022). Improving UAV-SfM time-series accuracy by co-alignment and contributions of ground control or RTK positioning. Int. J. Appl. Earth Observation Geoinformation 109, 102772. doi: 10.1016/j.jag.2022.102772
Ostrowski R., Pruszak Z., Schönhofer J., Szmytkiewicz M. (2016). Groins and submerged breakwaters – new modeling and empirical experience. Oceanological Hydrobiological Stud. 45, 20–34. doi: 10.1515/ohs-2016-0003
Pinto C. A., Taborda R., Andrade C., Baptista P., Silva P. A., Mendes D., et al. (2022). Morphological development and behaviour of a shoreface nourishment in the portuguese western coast. J. Mar. Sci. Eng. 10, 146. doi: 10.3390/jmse10020146
Pucino N., Kennedy D. M., Carvalho R. C., Allan B., Ierodiaconou D. (2021). Citizen science for monitoring seasonal-scale beach erosion and behaviour with aerial drones. Sci. Rep. 11, 3935. doi: 10.1038/s41598-021-83477-6
Reckermann M., Omstedt A., Soomere T., Aigars J., Akhtar N., Bełdowska M., et al. (2022). Human impacts and their interactions in the Baltic Sea region. Earth System Dynamics 13, 1–80. doi: 10.5194/esd-13-1-2022
Roberts T. M., Wang P. (2012). Four-year performance and associated controlling factors of several beach nourishment projects along three adjacent barrier islands, west-central Florida, USA. Coast. Eng. 70, 21–39. doi: 10.1016/j.coastaleng.2012.06.003
Saengsupavanich C., Ariffin E. H., Yun L. S., Pereira D. A. (2022). Environmental impact of submerged and emerged breakwaters. Heliyon 8, e12626. doi: 10.1016/j.heliyon.2022.e12626
Schoonees T., Gijón Mancheño A., Scheres B., Bouma T. J., Silva R., Schlurmann T., et al. (2019). Hard structures for coastal protection, towards greener designs. Estuaries Coasts 42, 1709–1729. doi: 10.1007/s12237-019-00551-z
Staudt F., Gijsman R., Ganal C., Mielck F., Wolbring J., Hass H. C., et al. (2021). The sustainability of beach nourishments: a review of nourishment and environmental monitoring practice. J. Coast. Conserv. 25, 34. doi: 10.1007/s11852-021-00801-y
StALU (2021) Regelwerk Küstenschutz Mecklenburg-Vorpommern. Available at: https://www.stalu-mv.de/mm/Themen/K%C3%BCstenschutz/Regelwerk-K%C3%BCstenschutz-Mecklenburg%E2%80%93Vorpommern/ (Accessed September 7, 2024).
Soomere T., Viška M., Lapinskis J., Räämet A. (2011). Linking wave loads with the intensity of erosion along the coasts of Latvia. doi: 10.3176/eng.2011.4.06
Soomere T., Viška M. (2014). Simulated wave-driven sediment transport along the eastern coast of the Baltic Sea. J. Mar. Syst. 129, 96–105. doi: 10.1016/j.jmarsys.2013.02.001
Suursaar Ü., Kullas T., Otsmann M., Saaremäe I., Kuik J., Merilain M. (2006). Cyclone Gudrun in January 2005 and modelling its hydrodynamic consequences in the Estonian coastal waters. Boreal Environ. Res. 11, 143. http://www.borenv.net/BER/archive/pdfs/ber11/ber11-143.pdf.
Tiede J., Jordan C., Moghimi A., Schlurmann T. (2023). Long-term shoreline changes at large spatial scales at the Baltic Sea: remote-sensing based assessment and potential drivers. Front. Mar. Sci. 10. doi: 10.3389/fmars.2023.1207524
Tiede J., Jordan C., Siewert M., Sommermeier K., Schlurmann T. (2024). Evolution of beach profiles at the German Baltic Sea during and after large-scale beach nourishment: bar formation and sand redistribution. Front. Mar. Sci. 11. doi: 10.3389/fmars.2024.1473237
Turner I. L., Harley M. D., Drummond C. D. (2016). UAVs for coastal surveying. Coast. Eng. 114, 19–24. doi: 10.1016/j.coastaleng.2016.03.011
Vandebroek E., Lindenbergh R., Van Leijen F., De Schipper M., De Vries S., Hanssen R. (2017). Semi-automated monitoring of a mega-scale beach nourishment using high-resolution terraSAR-X satellite data. Remote Sens. 9, 653. doi: 10.3390/rs9070653
Wang H., Pang G., Yang Q., Long Y., Wang L., Wang C., et al. (2024). Effects of slope shape on soil erosion and deposition patterns based on SfM-UAV photogrammetry. Geoderma 451, 117076. doi: 10.1016/j.geoderma.2024.117076
Keywords: sand nourishments, machine learning, RTK-UAV, co-alignment, 100-year flood
Citation: Tiede J, Lovell JL, Jordan C, Moghimi A and Schlurmann T (2025) Assessment of sand nourishment dynamics under repeated storm impact supported by machine learning-based analysis of UAV data. Front. Mar. Sci. 12:1537066. doi: 10.3389/fmars.2025.1537066
Received: 29 November 2024; Accepted: 01 April 2025;
Published: 28 April 2025.
Edited by:
Natascia Pannozzo, Delft University of Technology, NetherlandsReviewed by:
Rik Gijsman, University of Twente, NetherlandsFilipe Galiforni-Silva, Delft University of Technology, Netherlands
Copyright © 2025 Tiede, Lovell, Jordan, Moghimi and Schlurmann. This is an open-access article distributed under the terms of the Creative Commons Attribution License (CC BY). The use, distribution or reproduction in other forums is permitted, provided the original author(s) and the copyright owner(s) are credited and that the original publication in this journal is cited, in accordance with accepted academic practice. No use, distribution or reproduction is permitted which does not comply with these terms.
*Correspondence: Jan Tiede, dGllZGVAbHVmaS51bmktaGFubm92ZXIuZGU=