 Xingong Ding
 Jiaqi Song1
 Xina Ji
- 1College of Economics and Management, Beibu Gulf University, Qinzhou, China
- 2College of International Economics and Trade, Ningbo University of Finance and Economics, Ningbo, Zhejiang, China
Air pollution caused by shipping-related activities has adversely affected public health and environmental quality in port cities. However, applying digital technologies offers new pathways to mitigate such pollution. Based on panel data from 52 coastal port cities in China from 2016 to 2020, this study employs a two-way fixed effects model to analyze the impact of the digital economy on shipping-related PM2.5 pollution. Additionally, a panel threshold model is used to examine the threshold effect of port size in the relationship between the digital economy and shipping-related pollution. Heterogeneity analysis is further conducted from two dimensions—vessel types and PM2.5 components—to explore the variations in the digital economy’s emission reduction effects. The results show that the development of the digital economy significantly reduces shipping-related PM2.5 pollution levels, and this emission reduction effect strengthens as port size expands. Furthermore, there are significant differences in the emission reduction effects across different vessel types and PM2.5 components. These findings contribute to understanding the mechanisms through which the digital economy mitigates shipping-related pollution and provide a scientific basis and policy support for promoting the green development of port cities and the shipping industry.
1 Introduction
Port cities along China’s coastline leverage their port advantages to develop export-oriented economies, leading to the country’s economic development—currently, their combined economic output accounts for over 60% of China’s total GDP (Cheng et al., 2022; Ma et al., 2025). However, maritime transport predominantly relies on fossil fuels, and port operations and logistics activities are often accompanied by increased energy consumption and pollutant emissions (Styhre and Winnes, 2019; Ismail et al., 2024). This results in significant potential environmental impacts from the shipping industry, with port cities bearing the brunt of these effects (Roberts et al., 2023). Among these negative impacts, air pollution caused by shipping-related activities poses the greatest threat (Roberts et al., 2023). For example, up to 25% of fine particulate matter (PM2.5) pollution in port areas worldwide can be attributed to emissions from shipping activities (Contini and Merico, 2021).
PM2.5 has become one of China’s most troubling air pollution issues in recent years (Fang and Yu, 2021). In 2015, PM2.5 was identified as the fifth leading cause of death, with 4.2 million fatalities attributed to PM2.5 exposure, accounting for 7.6% of global deaths (Wang et al., 2017). The shipping industry has exacerbated premature deaths related to air pollution among residents of port cities (Luo et al., 2024). Although China launched two phases of clean air initiatives (2013–2017 and 2018–2020) starting in 2013, significantly reducing PM2.5 concentrations, the levels still exceed the current World Health Organization guidelines by sixfold (Organization, 2021). Therefore, the regulation of shipping-related pollution remains crucial. To reduce emissions from ships, China’s Ministry of Transport has implemented the Emission Control Area (ECA) policy in major coastal regions since 2015, extending it to the entire territorial sea in 2019. Furthermore, the policy mandates a stricter limit on the sulphur content of fuel oil, reducing it from 0.5% to 0.1% starting in 2025 (Sun et al., 2020). Numerous studies have demonstrated the policy’s effectiveness in reducing shipping-related pollution. For instance, Weng et al. (2022) found that the implementation of China’s ECA policy led to a 31.24%–42.67% reduction in SOx emissions from merchant ships within the emission control areas. Zhou et al. (2023) further pointed out that by restricting the use of high-sulphur fuel, the policy has significantly improved air quality in the Shanghai region. In addition, to mitigate pollution emissions from port operations, the Chinese government has introduced supporting policies. In 2016, the State Council revised the “Atmospheric Pollution Prevention and Control Law,” requiring berthed ships to prioritize shore power usage. The “Special Action Plan for the Prevention and Control of Pollution from Ports and Ships” explicitly stipulates that major port terminals must have a certain proportion of shore power supply capacity (Du et al., 2019). Meanwhile, in the development of green ports, the China Ports and Harbors Association issued the “Guideline for Green Port Rating System (Trial Implementation),” providing standard guidance for the green development of ports (Chen and Pak, 2017). Relevant policies encourage shipping companies to switch fuels or use clean energy sources such as liquefied natural gas (LNG) and adopt new green technologies, such as installing exhaust gas cleaning systems (Sun et al., 2020). Despite the positive effects of these measures in reducing emissions from ports and ships, the continuous expansion of port economic activities makes it challenging to achieve long-term sustainable pollution control solely through traditional regulatory approaches. Moving forward, further reliance on innovative technologies and management models will be necessary to promote the reduction of shipping-related pollution.
Against this backdrop, the digital economy (DE) offers new ideas and feasible pathways for promoting the green development of the shipping industry. DE is a new green economic activity that relies on knowledge and information as key elements (Ma and Zhu, 2022; Yu et al., 2023). It uses information networks and digital technologies as its foundation, providing fresh momentum for intelligent environmental management (Rehman et al., 2021). Digital technologies such as big data, the Internet of Things (IoT), and artificial intelligence (AI) drive the development of the DE by modernizing production methods, penetrating various industries, optimizing energy structure and utilization efficiency, and promoting industrial upgrading (Li et al., 2021a; Li and Wang, 2022). As a traditional industry, the digital transformation of the shipping sector has become imperative (Xu et al., 2018). Digital transformation drives the shipping industry toward environmental sustainability, reducing its ecological impact (Zhang et al., 2024b). Against the Chinese government’s strong push to develop the DE, data resources are empowering the transportation sector and accelerating the digitalization of the shipping industry (Sun et al., 2022; Wang et al., 2023b). However, achieving goals such as smart green ports still faces technological advancements and infrastructure upgrade challenges (Poulsen et al., 2018). The current level of DE development in port cities is insufficient to support their construction fully.
In summary, advancing the development of the DE and reducing shipping-related pollution are critical for the high-quality development of port cities. However, the relationship between the level of DE development in port cities and shipping-related pollution remains inconclusive. Therefore, a comprehensive assessment and exploration of the impact of the DE on shipping-related pollution in port cities is of significant practical importance for achieving sustainable development.
Therefore, this study investigates the impact of the DE on shipping-related pollution (PM2.5) in port cities based on panel data from 52 coastal port cities in China from 2016 to 2020. It also considers the nonlinear relationship between the DE and shipping-related pollution caused by differences in port size. Additionally, the study conducts a heterogeneity analysis of vessel types and PM2.5 components and provides targeted recommendations.
This study makes several key contributions: First, it expands the research field on the impact of DE on air pollution. Previous studies examining the relationship between the DE and air pollution often overlooked shipping pollution, an important and unique source of emissions. This study addresses this gap by incorporating shipping pollution into the broader analysis of the DE’s impact on air pollution. Second, it identifies the DE as a new pathway for reducing shipping-related pollution. Existing research on shipping pollution generally does not consider the level of DE development in port cities. This study reveals that the development of the DE offers innovative solutions to mitigate shipping pollution. Finally, this study integrates DE and shipping-related pollution into a unified analytical framework, providing a scientific basis and policy support for achieving synergistic development between DE growth and shipping pollution reduction in port cities.
The remainder of this study is organized as follows: Section 2 provides a literature review. Section 3 describes the econometric model and data. Section 4 reports empirical results, including the baseline regression results, the threshold effect analysis based on port development levels, and the heterogeneity analysis results. Section 5 summarizes and discusses the findings, offers policy recommendations, and outlines the study’s limitations.
2 Literature review
2.1 Related research on air pollution from shipping
In recent years, the impact of shipping-related pollution on air quality and public health in port cities and coastal regions has become a key focus of research.
Firstly, a series of studies have shown that shipping significantly contributes to air pollution in port cities and coastal regions. Tang et al. (2020) investigated the impact of shipping on air quality in the Gothenburg region and found that shipping is a major source of air pollution in the area. Ramacher et al. (2020) further assessed the contribution of shipping to urban air pollution in Hamburg, Germany, focusing on NO2 and PM2.5. The study revealed that shipping contributes up to 60% and 40% of NO2 and PM2.5 concentrations, respectively, in port areas, and 20–30% in residential areas north of the port. In China, Wu et al. (2020) conducted an in-depth study on shipping-related pollution and their health risks in the coastal city of Xiamen. By collecting PM2.5 and PM10 particles and analyzing their chemical composition and sources, the study identified shipping-related pollution as one of the major contributors to PM2.5 and PM10. Emissions from the combustion of heavy fuel oil used by ships were found to have a significant impact on Xiamen’s air quality. Jiang et al. (2020) focused on the impact of shipping-related pollution on air quality in Europe, particularly changes in PM2.5 and ozone levels. The study found a sustained increase in ozone concentrations along shipping lanes, with an even more pronounced effect on PM2.5. Reducing shipping-related pollution was shown to significantly lower PM2.5 concentrations, improve air quality, and protect public health. Additionally, Russo et al. (2023) analyzed the future impact of shipping-related pollution on air quality from a European perspective. The study highlighted those pollutants such as NOx, PM and SOx released from ship engine combustion pose significant threats to air quality. However, the implementation of emission control policies can help reduce PM2.5 concentrations in regions with high shipping activity and significantly lower SO2 and NO2 emissions, providing crucial support for improving air quality.
Secondly, the health risks posed by shipping-related pollution have garnered increasing attention. Ytreberg et al. (2021), using shipping data from the Baltic Sea region, found that PM2.5 and NOx emitted by ships not only pose significant threats to public health but also contribute to regional eutrophication and chemical pollution, further intensifying stress on the Baltic Sea ecosystem. Mueller et al. (2023), through an assessment of 32 studies on the health burden of shipping-related air pollution, further confirmed that air pollutants from shipping and port emissions pose a significant threat to public health. Maritime transport has become one of the major global sources of air pollution and a key contributor to associated health risks. Nunes et al. (2021) evaluated the health impacts and associated external costs of ship-related air pollution on the Iberian Peninsula in 2015. The results showed that ship emissions significantly increased premature mortality rates. Specifically, PM2.5 emissions led to an average 7.7% increase in all-cause premature mortality, resulting in economic losses amounting to as much as 9.1 billion euros. Contini and Merico (2021), through a review of relevant studies, summarized the impacts of shipping-related pollution on local air quality and public health. The research highlighted that shipping-related pollution significantly affects air quality in port cities and coastal areas, exposing these regions to gaseous pollutants and respirable particulate matter, thereby adversely impacting the health of residents. Zhang et al. (2021) analyzed the health impacts of shipping-related pollution from a global perspective. The results showed that in 2015, shipping-related PM2.5 exposure led to 94,200 premature deaths worldwide, with 83% attributed to international shipping and 17% to domestic shipping. In China, domestic shipping accounted for as much as 44% of the associated deaths. Mwase et al. (2020) emphasized that strengthening sulfur emission limits can significantly reduce PM2.5 and sulfur dioxide emissions from shipping, thereby effectively lowering the risks of premature mortality, stroke, and ischemic heart disease associated with exposure to shipping pollution. According to a systematic review by (Kiihamäki et al., 2024), pollutants emitted from shipping activities, such as PM2.5, NOx and SOx, significantly deteriorate air quality and pose serious threats to public health. In particular, PM2.5 emissions from shipping are considered the primary factor contributing to the increase in premature mortality rates in coastal areas. Meanwhile, ozone and other pollutants have varying impacts on health, presenting diverse health risks. There are also studies analyzing shipping-related pollution from the perspective of ports. First, Xu et al. (2024b) examined the variations in sulfur oxides (SOx) concentrations in China’s coastal ports caused by shipping-related pollution. They also assessed the impact and mechanisms of port infrastructure on SOx concentrations. By clarifying the role of shipping-related pollution, their study provides decision-making support for the green development of ports. Second, Xu et al. (2024a) employed a slacks-based measure data envelopment analysis (SBM-DEA) model to evaluate the SOx emission efficiency of major European ports. Their findings indicate that more than half of these ports remain inefficient, primarily due to a lack of effective monitoring systems. The study offers detailed policy recommendations for ports with low efficiency.
Overall, existing studies have established that shipping-related emissions are a significant source of air pollution in port cities and coastal areas. Extensive research has quantified the contribution of shipping to pollutants such as PM2.5, NO2, SOx, and ozone, demonstrating their adverse impacts on urban air quality and public health. Studies have also shown that emission control measures can effectively mitigate these effects. However, current research primarily focuses on specific regions, pollutants, or short-term observations, with relatively limited attention given to the interplay between shipping-related pollution and broader economic and technological factors.
2.2 Related research on the relationship between the digital economy and PM2.5
Currently, research on the relationship between the digital economy (DE) and PM2.5 primarily focuses on various administrative regions in China. At the urban level, multiple studies have analyzed the impact of the DE on PM2.5 emissions using traditional regression models. Wu et al. (2022) conducted a study based on panel data from 285 prefecture-level cities in China and found that advancements in the DE significantly reduced urban PM2.5 emissions. Further analysis revealed that technological innovation serves as a critical mediating mechanism for the DE’s impact, while environmental information disclosure further amplifies its emission reduction effects. Sun et al. (2022) utilized data from 281 prefecture-level cities in China from 2011 to 2016 and found that the DE helps mitigate PM2.5 pollution. The study identified technological innovation as a significant mediating mechanism through which the DE influences PM2.5 pollution. Li et al. (2021b) analyzed the relationship between DE development and environmental quality, represented by PM2.5, using a sample of 217 cities in China from 2003 to 2018. By evaluating the coupling coordination degree between the DE system and the environmental system, the study found that their coordination degree exhibited a fluctuating upward trend over the study period. Furthermore, the empirical results demonstrated that the development of DE significantly reduces PM2.5 concentrations. Furthermore, Song et al. (2022) conducted a study based on data from 228 cities in China from 2015 to 2020, confirming the improvement effect of the DE on urban air quality and analyzing its heterogeneity. The findings demonstrated that the DE significantly reduces PM2.5 concentrations in the air and markedly improves urban air quality. Notably, the impact of DE on air quality improvement was particularly pronounced in regions with high levels of DE development, higher urbanization rates, and in large and medium-sized cities. Similarly, Wei et al. (2024) employed a spatial Durbin panel model and partial differential equations to analyze data from 275 cities in China from 2011 to 2020. The study found that the DE significantly reduces regional PM2.5 pollution through multidimensional pathways, including green production, resource optimization, and technological innovation. Moreover, the spatial spillover effect of the DE was found to be significantly stronger than its direct effect.
Some studies have explored the overall effects and temporal trends of the DE on PM2.5 emissions using provincial panel data. For instance, Wang and Ding (2023) analyzed the mechanisms of the DE’s impact on PM2.5 using a two-level stochastic frontier model with panel data from 30 provinces in China between 2011 and 2020. The results showed that the DE reduced actual PM2.5 emissions by an average of 0.15% through its emission reduction effect. Overall, the emission reduction effect dominated the DE’s influence on air pollution, with the net effect fluctuating over time. Additionally, some studies have utilized spatial models to examine the spatial spillover effects of the DE on PM2.5 pollution. Zhao et al. (2022) analyzed the impact of the DE on haze pollution and its underlying mechanisms using PM2.5 concentration data from the middle and lower reaches of the Yellow River region from 2011 to 2019. The results indicated that the DE has been increasing annually, while PM2.5 concentrations have been decreasing year by year, demonstrating a negative correlation between the DE and haze pollution.
Overall, the existing literature widely acknowledges that the digital economy can effectively reduce PM2.5 pollution by promoting technological innovation, optimizing resource allocation, and encouraging green production. Some studies also highlight the potential spillover effects of the digital economy in enhancing air quality across regions. However, most research in this area has focused on inland cities or administrative regions, largely overlooking the specific conditions of port cities and the distinct pollution sources they face—particularly shipping-related emissions.
2.3 Research gap
This study addresses several shortcomings in existing research: First, it incorporates the critical yet underexplored pollution source of shipping-related pollution into the analysis, examining the mechanisms through which the DE influences air pollution. In doing so, it fills a significant gap in literature. Second, in existing studies on shipping-related pollution, the level of DE development in port cities is often overlooked. This study innovatively reveals the potential pathways through which DE development mitigates shipping-related pollution. Finally, by constructing an integrated analytical framework that links the DE and shipping-related pollution, this study provides scientific evidence and practical guidance for port cities to effectively manage shipping-related pollution while advancing DE development.
3 Methodology and data
3.1 Econometric model
3.1.1 Benchmark regression model
To account for time-varying and time-invariant factors that may influence the estimation results, we constructed the following two-way fixed effects models as the baseline regression model to identify the emission reduction effect of the digital economy (DE) on shipping-related pollution. By incorporating individual fixed effects and time fixed effects, this model effectively controls for non-observed individual factors and time-invariant influences, thereby mitigating biases caused by omitted variables and enhancing the accuracy and effectiveness of the estimates (Liu, 2023; Xu et al., 2023; Zhang et al., 2023). Specifically, controlling for port city-level fixed effects eliminates the interference of regional factors that vary across port cities but remain constant over time (e.g., resource endowments of port cities) on shipping pollution. Meanwhile, controlling for year fixed effects accounts for omitted variables that change over time but are consistent across port cities (e.g., nationwide policy changes). In this study, the baseline regression model is expressed as follows:
where i represents port cities, t represents time, and the dependent variable denotes shipping-related pollution. The independent variable reflects the level of DE development in coastal cities. , , and are control variables, where represents the economic development level of coastal cities, denotes industrial structure, and reflects port size. , and are the corresponding coefficients. indicates city fixed effects, indicates time fixed effects, and indicates random disturbance terms.
3.1.2 Panel threshold model
Given the differences in port development levels across various port cities, the relationship between DE and shipping-related pollution may be nonlinear. To investigate the nonlinear impact of the DE on shipping-related pollution, this study employs the panel threshold model first proposed by Hansen (1999). This model not only effectively estimates the threshold value but also tests the significance of endogenous threshold characteristics (Feng et al., 2023).
Compared to traditional nonlinear research methods, the panel threshold model does not require a pre-specified nonlinear equation to describe the relationship between variables (Wang et al., 2023a). Instead, the number and value of the thresholds are entirely determined by the sample itself, avoiding distortions in research results caused by exogenously determined threshold variables (Li et al., 2022). In this study, port size is used as the threshold variable, and the single-threshold model is expressed as follows:
From an econometric perspective, a grouped panel regression model can accommodate two or more threshold values (Zhang and Xing, 2023). Based on the above equation, the expression of the double-threshold effect model is adjusted to:
where the threshold variable represents the port size, and denotes the threshold value. is the indicator function in the threshold regression model. represents a condition. When the condition is met, ; otherwise, .
3.1.3 Threshold effect test
Before estimating the panel threshold model, it is very important to conduct a threshold effect test to determine the specific value of the threshold (Wang and Li, 2021; Li et al., 2022; Wang et al., 2022). The optimal threshold estimate should adhere the principle of minimizing the sum of squared residuals (Wang et al., 2024b), and its expression is as follows:
where is the consistent estimate of , and represents the sum of squared residuals. The minimum sum of squared residuals must satisfy the condition is expressed as follows:
where T is the time duration, and N is the sample size.
After determining the threshold values, it is necessary to test the significance of the parameter estimates and the validity of the threshold (Wang and Wang, 2020; Wang et al., 2023a).
Testing the significance of parameter estimates helps determine the existence of a threshold effect. In a panel threshold model, the threshold divides the sample into different intervals. If the estimated parameters across these intervals differ significantly, it indicates that a panel threshold model is applicable. Conversely, if the parameters are consistent across intervals, it suggests the absence of a threshold effect, and a linear model is more appropriate.
To test the existence of a threshold effect, the null hypothesis and alternative hypothesis are proposed, using a single threshold as an example. The null hypothesis is , indicating that the model only exhibits a linear relationship and has no threshold effect. The alternative hypothesis is , suggesting a regime shift and the presence of a threshold effect. Next, the is used to test the null hypothesis, and its expression is as follows:
where represents the sum of squared residuals under the null hypothesis, represents the sum of squared residuals under the alternative hypothesis, and denotes the residual variance estimated under the null hypothesis.
To verify the validity of the threshold value, it is necessary to determine whether the estimated threshold value is consistent with the true threshold value . When identifying that the variable exhibits a threshold effect, a confidence interval for the threshold value must be constructed (Wang et al., 2024a). The null hypothesis is set as , with the alternative hypothesis being . The expression for the likelihood ratio statistic is as follows:
where represents the sum of squared residuals under the null hypothesis, while represents the sum of squared residuals under the alternative hypothesis. The distribution of the test statistic follows a non-standard normal distribution. When ( is the significance level), it indicates rejection of the null hypothesis, suggesting the presence of a threshold effect in the panel threshold model.
3.2 Variable selection and data sources
3.2.1 Dependent variable
The dependent variable in this study is the shipping-related fine particulate matter (PM2.5) and its major components in China’s coastal port cities, measured in micrograms per cubic meter (μg/m³). The data on shipping-related PM2.5 is derived from the findings of Luo et al. (2024).
Luo et al. (2024) combined high-frequency ship AIS (Automatic Identification System) data with the comprehensive Ship Technical Specifications Database (STSD), incorporating the policy context of China’s Domestic Emission Control Areas (DECA) and the global sulfur cap regulation. They developed a disaggregate dynamic method—the Shipping Emission Inventory Model (SEIM v2.0)—to calculate annual shipping emissions within 200 nautical miles of China’s mainland territorial sea baseline from 2016 to 2020. For a more detailed explanation of the calculation process, refer to Wang et al. (2021) and Luo et al. (2024).
Luo et al. (2024) provided high-quality emission inventory data that accurately measure the actual shipping-related pollution in Chinese port cities. Accordingly, we extracted the shipping-related pollution data for 52 coastal port cities in China from Luo et al. (2024) as the dependent variable for our study. It is worth noting that, based on the China Marine Economy Statistical Yearbook, there are 53 coastal cities in China. However, due to missing shipping-related pollution data for Zhanjiang City in Guangdong Province, this study includes only 52 coastal cities.
3.2.2 Independent variable
The independent variable is DE. DE is a novel economic model that relies on digital knowledge and information as its primary production factors, leverages digital technology as its core driving force, and utilizes modern information networks as a key platform. By deeply integrating digital technology with the real economy, it continuously enhances the digitalization level of the economy and society, promotes networked and intelligent development, and accelerates the transformation of economic development models and governance approaches (Zhao et al., 2022). Due to the complexity of the DE concept, many studies often construct a comprehensive indicator system to measure the development level of the DE (Li and Zhou, 2024). Following the methodologies of Hou et al. (2024a); Liu et al. (2024); Zhang et al. (2024a), this study establishes a DE evaluation indicator system, as shown in Table 1.
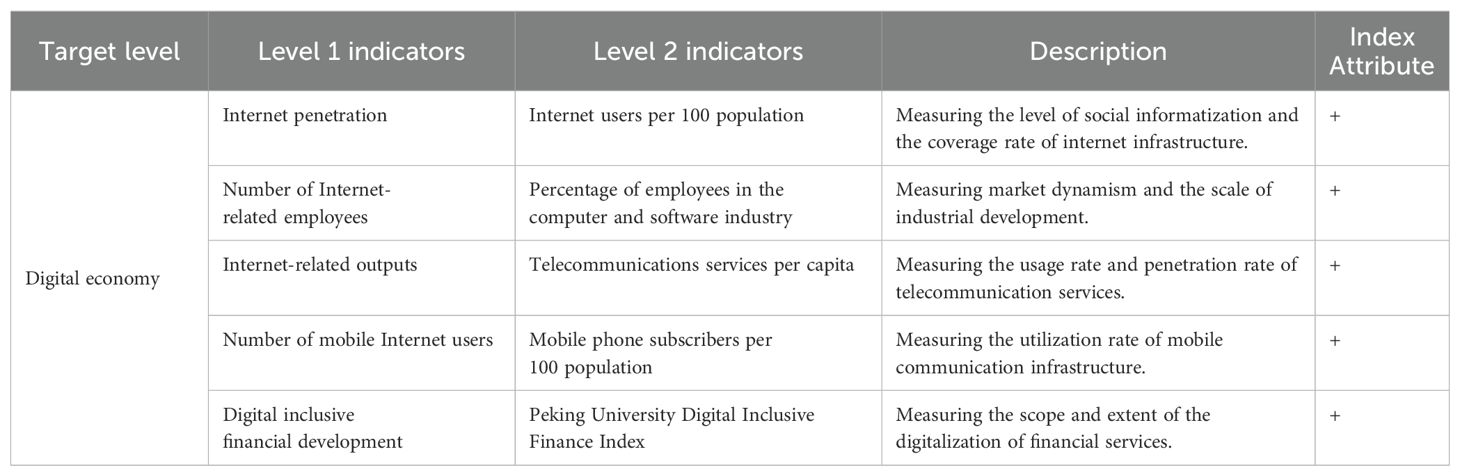
Table 1. Digital economy measurement system.
This study employs the entropy method to calculate the DE index for 52 port cities in China’s coastal regions from 2016 to 2020. This approach is an objective weighting technique that assigns weights based on the information content of the observed values for each indicator. And it eliminates the impact of subjective factors, ensuring that the evaluation results are more scientific, precise, and objective (Liu et al., 2023a, b).
The first step is to standardize the various indicators of the DE, the expression is as follows:
where is the indicator of each port city ; ; .
The second step is to calculate the weight of each indicator for each port city, the expression is as follows:
The third step is to calculate the information entropy, the expression is as follows:
The fourth step is to calculate the coefficient of variation for each indicator, the expression is as follows:
The fifth step is to normalize the coefficient of variation by calculating the weight proportion of each indicator’s coefficient of variation, the expression is as follows:
The sixth step is to calculate the digital economy index for each port city based on the weights, the expression is as follows:
3.2.3 Threshold variable
The threshold variable is port size. As hubs for transportation and logistics, ports not only drive urban development but also highlight the comparative advantages of port cities (Jiang et al., 2023). By facilitating the flow of capital and goods, ports reduce transaction costs while enhancing market connectivity, bringing significant social and economic benefits to port cities (Hou et al., 2024b). Port cargo throughput, which refers to the total volume of cargo handled by a port during a statistical period, is a key indicator for assessing a port’s operational capacity, production scale, and efficiency. It directly impacts a port’s international standing and competitiveness (Li et al., 2024). Accordingly, and following the studies of Ding and Choi (2024), this study selects port cargo throughput in coastal cities as a proxy variable to reflect port size.
3.2.4 Control variables
To eliminate biases caused by omitted variables, this study controls for other factors that may influence shipping pollution. The control variables include: (1) economic growth (PGDP), measured by per capita GDP; and (2) industrial structure (INS), measured by the ratio of the added value of the secondary industry to GDP. Additionally, in the bidirectional fixed effects model, port size (PORT) is also included as a control variable in the baseline regression model. The panel data cover 52 coastal cities in China from 2016 to 2020. The variable descriptions and data sources are shown in Table 2, while the descriptive statistics of the variables are presented in Table 3.

Table 2. Variables and data sources.
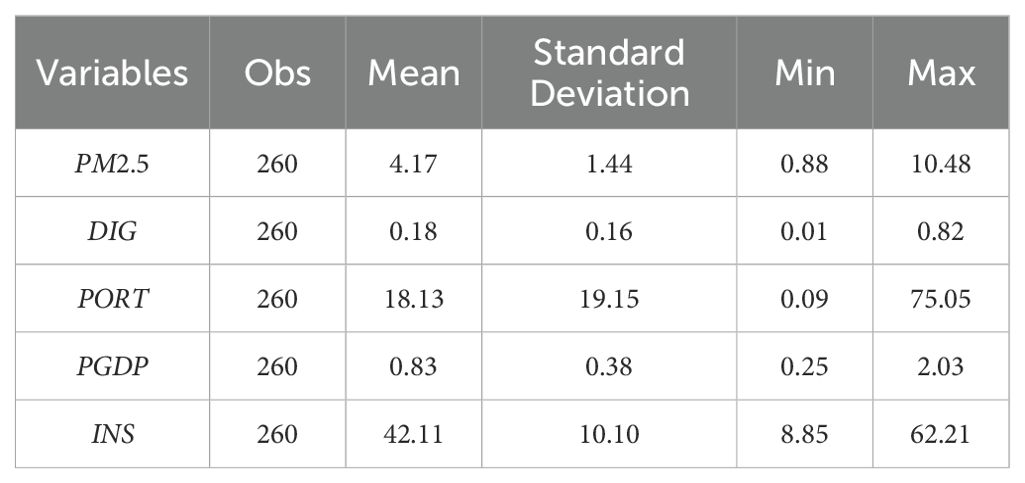
Table 3. Descriptive statistics of variables.
4 Results
4.1 Baseline regression results
Table 4 presents the impact of digital economy (DE) development levels in port cities on shipping-related pollution (PM2.5). Column (1) shows the results using city-fixed effects. Column (2) introduces control variables, and Column (3) further applies year-fixed effects. Our findings indicate that, across all estimators, DE development significantly reduces shipping-related pollution. We select Model (3) as the baseline model because the bidirectional fixed effects help mitigate the interference of omitted variables. Specifically, by controlling for city and year fixed effects, the model can effectively capture unobserved, time-invariant city-specific characteristics as well as time-varying shocks that may affect all port cities, such as nationwide policy implementations or technological advancements. Model (3) coefficient indicates that for every 0.01 increase in the DE index, the level of shipping-related pollution decreases by 0.03 μg/m³.
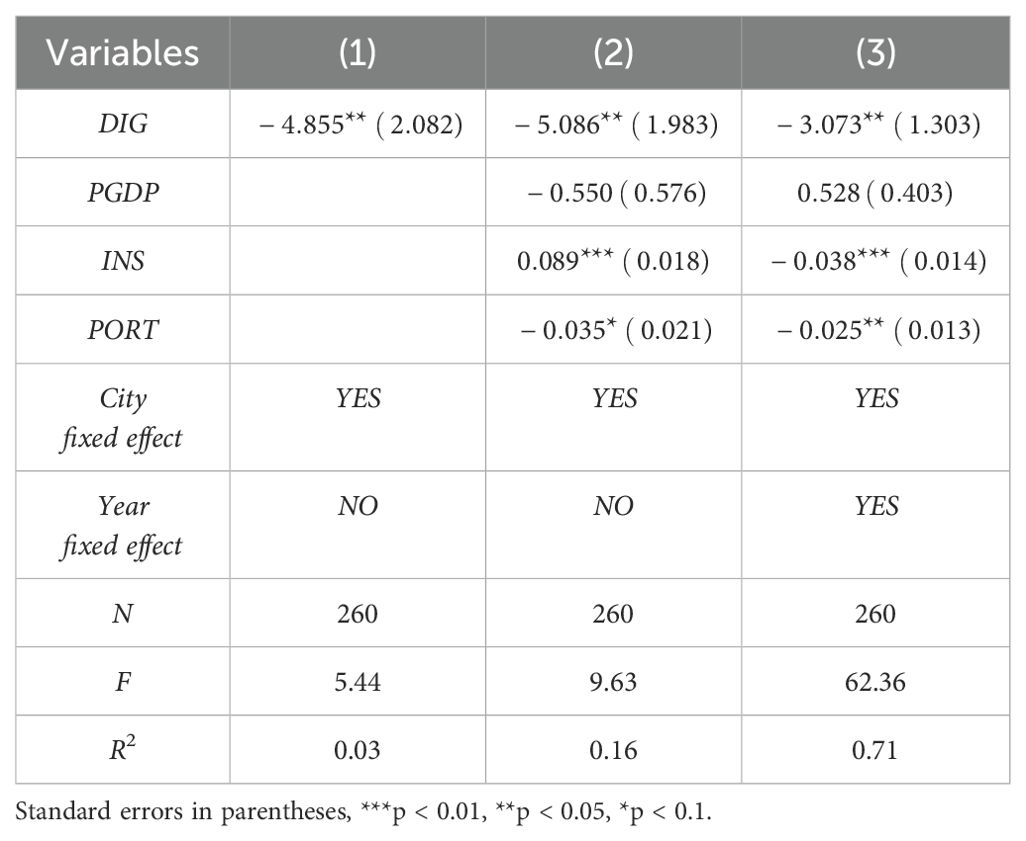
Table 4. Baseline regression results.
Our findings indicate that developing the DE significantly reduces shipping-related pollution levels in port cities. We believe that the DE drives the reduction of shipping-related pollution through two key aspects: the shipping industry and ports.
First, in terms of the shipping industry, the application of digital technologies enables the sector to save time and costs, thereby significantly enhancing transportation efficiency (Fruth and Teuteberg, 2017). This transformation is primarily reflected in several aspects: enhancing energy efficiency, reducing vessel emissions, exploring alternative fuel sources, optimizing shipping routes and speeds, and minimizing the environmental impact of the shipping industry (Jimenez et al., 2022). For example, adopting blockchain technology has facilitated the digitalization of documentation, significantly reducing emissions associated with traditional paper-based workflows and business processes (Pournader et al., 2020).
Second, in terms of ports, the adoption of digital and intelligent technologies can effectively enhance operational efficiency, reduce energy consumption, and decrease pollutant emissions (Wang et al., 2023b). For instance, using digital technologies in container and cargo handling facilities at ports facilitates faster and easier cargo loading and unloading, reducing port stay times and improving vessel efficiency, decreasing ship-related emissions (Agarwala et al., 2021). A case in point is the fourth phase of Shanghai Yangshan Port, which relies on a self-developed intelligent port management system to achieve fully automated operations, improving work efficiency by 30% and reducing energy consumption (Wang et al., 2023b). Furthermore, by optimizing port energy supply and management through digital technologies, ports can meet the energy demands of berthed ships while minimizing energy waste and pollutant emissions (Agarwala et al., 2021; Agarwala, 2022).
However, despite the penetration of digital technologies improving the technical level and efficiency of the shipping industry, achieving the goals of intelligence, greenness, and low-carbon development remains challenging. This is primarily due to limitations imposed by existing low-end hardware, which restricts the full potential of digital technologies (Jian et al., 2022). Therefore, advancing the green development of the shipping industry urgently requires comprehensive digital upgrades of related facilities and systems to overcome current technological bottlenecks and achieve higher environmental standards. Given the above context, port size must be considered when analyzing the DE’s impact on shipping-related pollution. Ports of different sizes vary in terms of resources, technology, and management levels, which may influence the DE’s effectiveness in reducing shipping-related pollution (Xu et al., 2024b). Therefore, we will next employ a panel threshold regression method, using port size as the threshold variable, to further explore the mechanisms through which the DE affects shipping-related pollution.
4.2 Threshold effect analysis
Table 5 reports the results of the panel threshold effect test. After repeated sampling and 300 iterations, we find that the F-test for the threshold effect and the bootstrapped p-value indicate that the null hypothesis of no threshold effect is rejected at the 5% significance level. This suggests that when port size (PORT) is used as the threshold variable, there is a significant single threshold effect in the impact of the DE on shipping-related pollution. Therefore, a single-threshold model should be adopted.
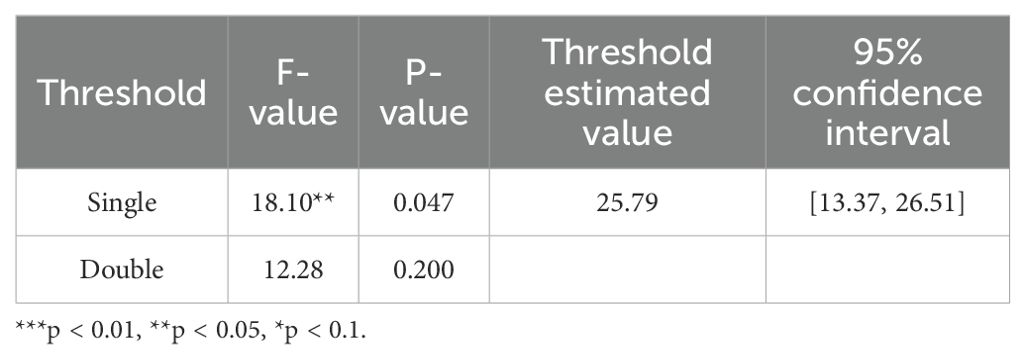
Table 5. Threshold existence test (Threshold variables: PORT).
We performed regression estimation using the single-threshold model, with the results presented in Table 6. The findings indicate that when PORT is below 25.79, the impact of the digital economy on shipping-related pollution is significantly negative at the 1% level, with a coefficient of -3.557. When PORT exceeds 25.79, the negative impact of the digital economy on shipping-related pollution becomes even stronger, with a coefficient of -4.931, which is also statistically significant at the 1% level.
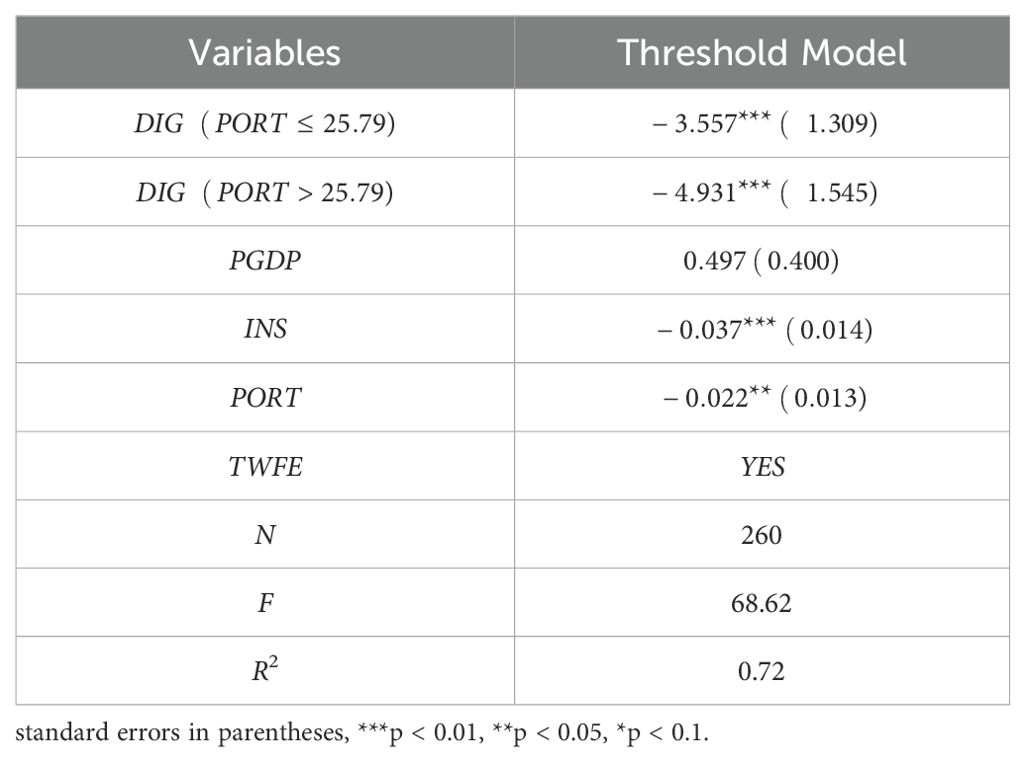
Table 6. Results of the panel threshold model.
The results indicate that as port size increases, the role of the DE in mitigating shipping-related pollution becomes more pronounced. Large ports typically possess greater resources, more advanced technology, and higher management standards, providing favorable conditions for applying digital technologies.
Therefore, the higher the level of the DE in port cities and the larger the port size, the better the conditions and capacity to advance digital innovation and develop smart green ports, thereby more effectively reducing shipping-related pollution. Enhancing digitalization lowers costs and energy consumption and enables real-time monitoring, early warning systems, and intelligent management, driving the green and sustainable development of ports (Zhang et al., 2024b).
4.3 Heterogeneity analysis
4.3.1 Heterogeneity of vessel types
The main engines used for maritime propulsion on ships are a primary source of air pollutants (Cooper, 2001), and different types of ships often exhibit nanoparticle emission characteristics related to their engine differences (Bencs et al., 2017). Consequently, there are significant differences in emission characteristics between vessel types. Analyzing the shipping emissions of different types of vessels helps to understand better the emission reduction effects of the digital economy in specific contexts. Considering the practical circumstances of coastal port cities, we classify ships into ocean-going vessels (OGVs) and coastal vessels (CVs).
Table 7 presents the results of the panel threshold existence test, with coastal and ocean-going vessel emissions as the dependent variables. The findings indicate that when port size (PORT) is used as the threshold variable, the DE has a significant single-threshold effect on emissions from both coastal and ocean-going vessels.
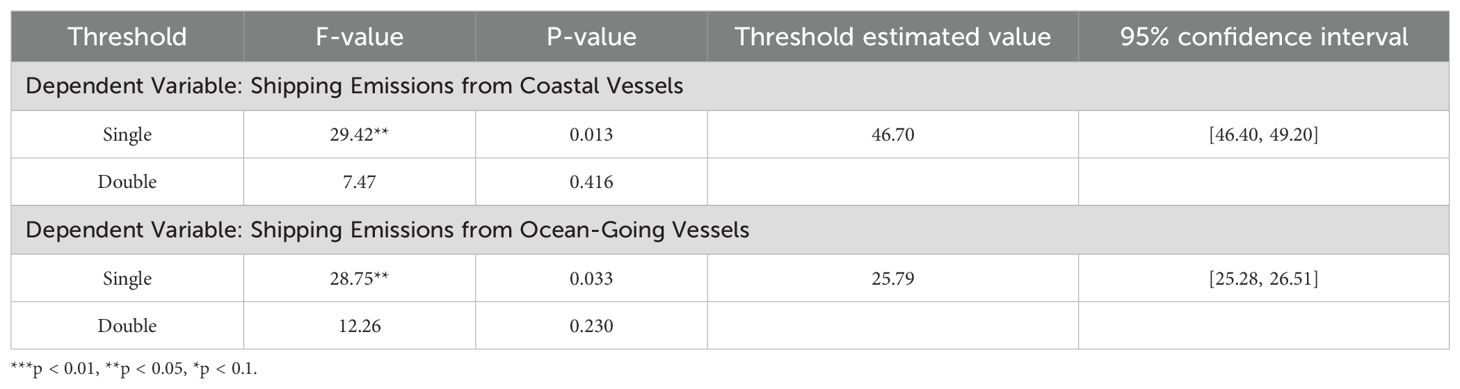
Table 7. Threshold existence test (Heterogeneity of vessel types).
Table 8 presents the results of the panel threshold model for vessel type heterogeneity, showing significant differences in the impact of the DE on emissions from different types of vessels, particularly influenced by the moderating role of port size. Specifically, for coastal vessel emissions, the impact of the DE varies significantly with port size. When port size is less than or equal to 46.70, the coefficient of the DE is -1.040, significant at the 5% level. However, when the port size exceeds 46.70, the effect of the DE significantly increases, with a coefficient of -5.056, significant at the 1% level. Similarly, for ocean-going vessel emissions, the impact of the DE also varies with port size. When port size is less than or equal to 25.79, the coefficient of the DE is -2.236, significant at the 1% level. When port size exceeds 25.79, the effect significantly increases, with a coefficient of -3.237, which is also significant at the 1% level.
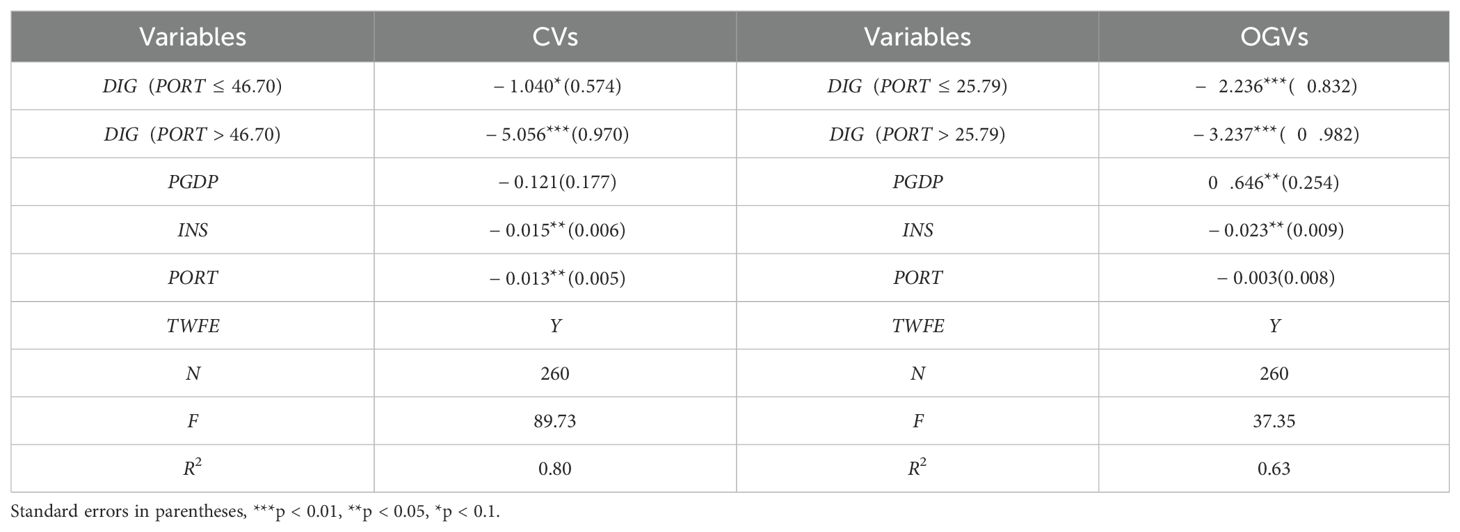
Table 8. Results of the panel threshold model for heterogeneity of vessel types.
First, the analysis results indicate that the DE’s emission-reduction effect becomes more pronounced as port size increases. This characteristic is evident in both the coastal vessel and ocean-going vessel models, suggesting that port size significantly moderates the DE’s emission-reduction effect. Second, although the emission-reduction effect strengthens with increasing port size for both vessel types, differences between them still exist.
4.3.2 Heterogeneity of shipping-related PM2.5 components
The components of PM2.5 may vary depending on their sources (Honda et al., 2017), making it essential to analyze the emission-reduction effects of the DE on specific components to gain a more precise understanding of its impact on pollution control. We conduct regression analysis on six major shipping-related PM2.5 components: sulfate (PM_SO4), nitrate (PM_NO3), ammonium (PM_NH4), elemental carbon (PM_EC), primary organic matter (PM_POM), and secondary organic matter (PM_SOM). We first examined whether the regression models for each component needed to account for the threshold effects of port size. Table 9 indicates that the regression models for PM_NO3, PM_NH4, and PM_SOM did not exhibit significant threshold effects, so we employed a two-way fixed effects model for analysis. In contrast, PM_SO4, PM_EC, and PM_POM exhibited significant single-threshold effects, prompting us to use a panel threshold effects model for further analysis.
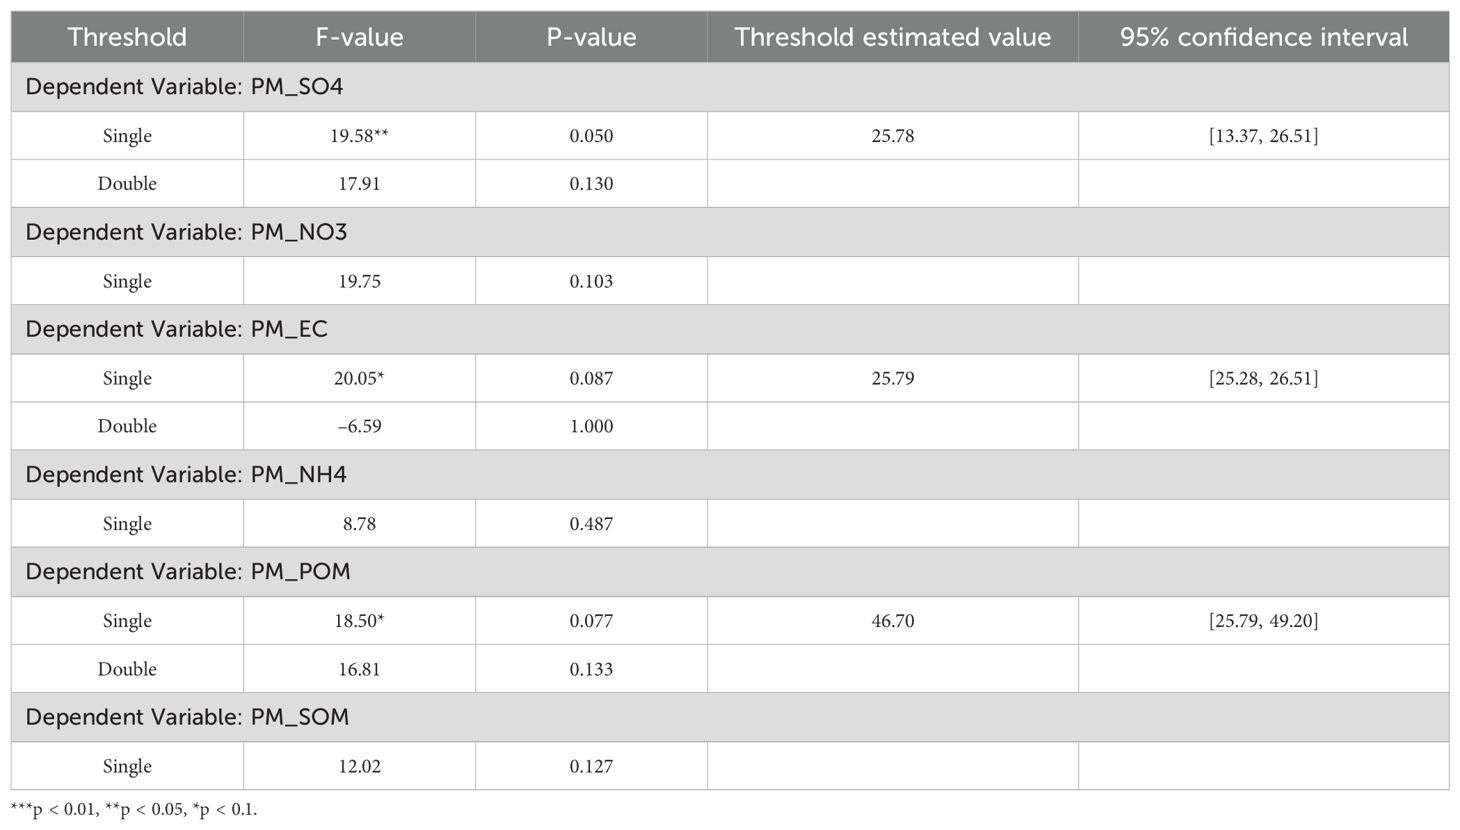
Table 9. Threshold existence test (Heterogeneity of shipping-related PM2.5 components).
The further regression results are presented using a forest plot (Figure 1) to visually compare the DE’s emission-reduction effects on various PM2.5 components under different port sizes. We find significant differences in the emission-reduction impacts of the DE on different shipping-related PM2.5 components. Specifically, for PM_SO4, PM_EC, and PM_POM, the DE has a significantly negative emission-reduction effect, which is more pronounced in large ports. PM_NH4 also exhibits a significant negative reduction effect; however, port size does not significantly influence its impact. In contrast, the emission-reduction effects of the DE on PM_NO3 and PM_SOM are not significant, indicating a weaker effect on these components.
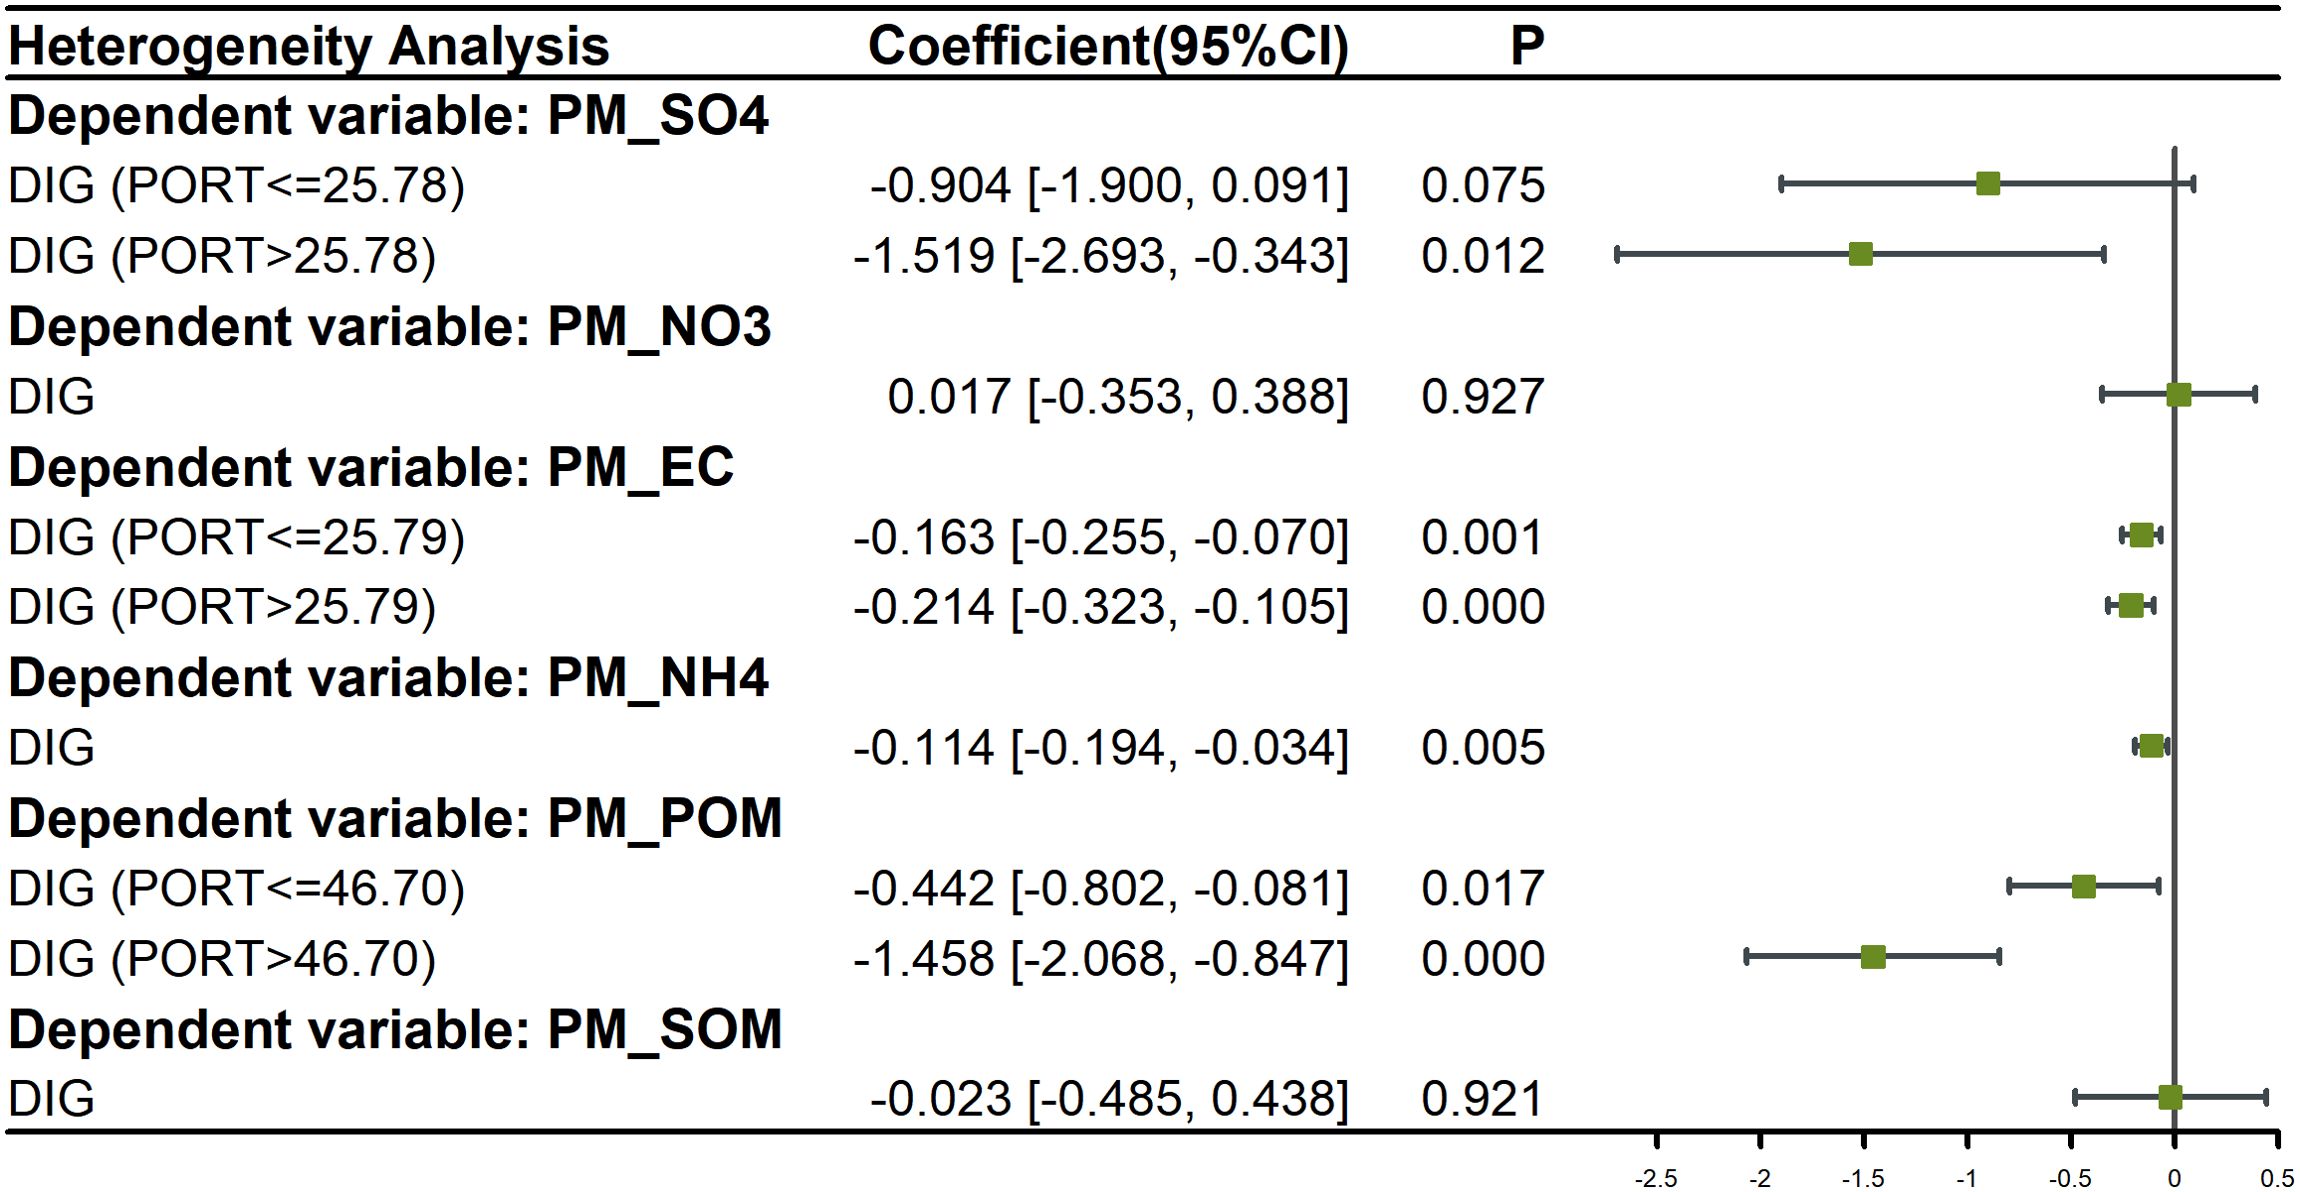
Figure 1. Results of the panel threshold model for heterogeneity of shipping-related PM2.5 components.
5 Conclusion
Based on panel data from 52 coastal port cities in China from 2016 to 2020, this study employed a two-way fixed effects model to examine the impact of the digital economy (DE) on shipping-related PM2.5 emissions and utilized a panel threshold regression approach to analyze the moderating role of port size. Additionally, heterogeneity analysis was conducted from two perspectives: vessel types and PM2.5 components.
The findings indicate that developing the DE significantly reduces shipping-related PM2.5 pollution levels in port cities. Digital technologies enhance operational efficiency in the shipping industry and optimize energy use, thereby reducing pollutant emissions. Specifically, for every 0.01 increase in the DE index, shipping-related pollution levels decrease by 0.03 μg/m³. The results also confirm the threshold effect of port size in the relationship between the DE and shipping-related pollution. When port size exceeds a certain threshold, the impact of emission reduction on the DE becomes more pronounced. This suggests that larger ports possess better resources and technological conditions, enabling them to reduce shipping-related pollution through digital upgrades more effectively. Heterogeneity analysis further reveals that port size significantly moderates the emission-reduction effects of the DE on emissions from coastal and ocean-going vessels. As port size increases, the emission-reduction effect strengthens significantly, although the two vessel types differ in the reduction intensity. Moreover, the heterogeneity analysis of PM2.5 components shows that the DE has significant emission-reduction effects on PM_SO4, PM_EC, PM_POM, and PM_NH4, with the first three being particularly pronounced in larger ports. In contrast, the effects on PM_NO3 and PM_SOM are weaker, reflecting the varying impacts of the DE on different components.
Based on the findings, this study offers the following policy recommendations: (1) Port cities should incorporate the shipping and port-related industries into their digital economy development strategies, promoting the application of digital technologies in port and shipping management. Especially in the post-pandemic era, challenges such as port congestion, supply chain disruptions, and low operational efficiency highlight the necessity of innovation (Xiao and Xu, 2024). By leveraging digital technologies, port cities can enhance efficiency, optimize logistics, and strengthen the resilience of the shipping industry while simultaneously reducing shipping-related emissions. (2) Considering the threshold effect of port size, policymakers should enhance support for the digitalization and smart development of ports, particularly large ports, to maximize their role as models and leaders in green shipping. This includes improving the efficiency of automated container terminals and promoting the electrification and digitalization of container trucks, which are crucial steps toward sustainable and intelligent port operations (Huang et al., 2025; Xiao et al., 2025). (3) In response to the heterogeneity analysis results, port cities should design targeted digital emission-reduction measures based on the level of DE development, the frequency of port calls, and the docking characteristics of different vessel types. Additionally, strategies should account for the varying reduction effects on different PM2.5 components. By integrating port size characteristics, policymakers can formulate more precise digital emission-reduction strategies.
This study is subject to certain limitations, primarily due to the lack of port-related data, which makes it impossible to measure the level of port intelligence directly. Future research should prioritize collecting comprehensive and detailed data to evaluate port intelligence levels more accurately. This would also facilitate a deeper exploration of the relationship between the DE’s development in port cities and port intelligence. Moreover, future studies could incorporate additional mechanisms to enrich the analysis. For instance, examining green patents related to shipping could offer valuable insights and broaden the perspective on the interplay between the DE and green development in the shipping sector. Furthermore, exploring the interactive effects of technological progress, policy factors, and the DE’s development in port cities would help refine the understanding of their combined impact on shipping-related pollution.
Data availability statement
Publicly available datasets were analyzed in this study. This data can be found here: China City Statistical Yearbook; Peking University Digital Research Center; China Port Yearbook;Shipping-related Pollution Data Source: https://doi.org/10.5281/zenodo.10643061.
Author contributions
XD: Conceptualization, Formal analysis, Methodology, Writing – original draft. JS: Data curation, Formal analysis, Writing – original draft. NZ: Conceptualization, Methodology, Writing – original draft. XJ: Supervision, Validation, Writing – review & editing.
Funding
The author(s) declare financial support was received for the research, authorship, and/or publication of this article. National Natural Science Foundation of China (72441005); Key Topics of Guangxi Science and Technology Think Tank (Gui Science Association (2024) K-113).
Acknowledgments
The authors would like to thank the Editors and the reviewers for the useful and constructive comments.
Conflict of interest
The authors declare that the research was conducted in the absence of any commercial or financial relationships that could be construed as a potential conflict of interest.
Generative AI statement
The author(s) declare that no Generative AI was used in the creation of this manuscript.
Publisher’s note
All claims expressed in this article are solely those of the authors and do not necessarily represent those of their affiliated organizations, or those of the publisher, the editors and the reviewers. Any product that may be evaluated in this article, or claim that may be made by its manufacturer, is not guaranteed or endorsed by the publisher.
References
Agarwala N. (2022). Powering India’s Blue Economy through ocean energy. Aust. J. Maritime Ocean Affairs 14, 270–296. doi: 10.1080/18366503.2021.1954494
Agarwala P., Chhabra S., Agarwala N. (2021). Using digitalisation to achieve decarbonisation in the shipping industry. J. Int. Maritime Safe. Environ. Affairs Ship. 5, 161–174. doi: 10.1080/25725084.2021.2009420
Bencs L., Horemans B., Buczyńska A. J., Van Grieken R. (2017). Uneven distribution of inorganic pollutants in marine air originating from ocean-going ships. Environ. pollut. 222, 226–233. doi: 10.1016/j.envpol.2016.12.052
Chen Z., Pak M. (2017). A Delphi analysis on green performance evaluation indices for ports in China. Maritime Policy Manage. 44, 537–550. doi: 10.1080/03088839.2017.1327726
Cheng J., Lian F., Yang Z. (2022). The impacts of port governance reform on port competition in China. Transport. Res. Part E: Logist. Transport. Rev. 160, 102660. doi: 10.1016/j.tre.2022.102660
Cong L.-z., Zhang D., Wang M.-l., Xu H.-f., Li L. (2020). The role of ports in the economic development of port cities: Panel evidence from China. Transpo. Policy 90, 13–21. doi: 10.1016/j.tranpol.2020.02.003
Contini D., Merico E. (2021). Recent advances in studying air quality and health effects of shipping emissions. Atmosphere 12. doi: 10.3390/atmos12010092
Cooper D. A. (2001). Exhaust emissions from high speed passenger ferries. Atmos. Environ. 35, 4189–4200. doi: 10.1016/S1352-2310(01)00192-3
Ding X., Choi Y.-J. (2024). The impact of port total factor productivity on carbon dioxide emissions in port cities: evidence from the Yangtze river ports. Appl. Sci. 14. doi: 10.3390/app14062406
Du K., Monios J., Wang Y. (2019). “Chapter 11 - Green Port Strategies in CHINA,” in Green Ports. Eds. Bergqvist R., Monios J. (Amsterdam: Elsevier), 211–229.
Fang D., Yu B. (2021). Driving mechanism and decoupling effect of PM2.5 emissions: Empirical evidence from China’s industrial sector. Energy Policy 149, 112017. doi: 10.1016/j.enpol.2020.112017
Feng Y., Yuan H., Liu Y. (2023). The energy-saving effect in the new transformation of urbanization. Econ. Anal. Policy 78, 41–59. doi: 10.1016/j.eap.2023.02.008
Fruth M., Teuteberg F. (2017). Digitization in maritime logistics—What is there and what is missing? Cogent Business Manage. 4, 1411066. doi: 10.1080/23311975.2017.1411066
Hansen B. E. (1999). Threshold effects in non-dynamic panels: Estimation, testing, and inference. J. Econ. 93, 345–368. doi: 10.1016/S0304-4076(99)00025-1
Honda A., Fukushima W., Oishi M., Tsuji K., Sawahara T., Hayashi T., et al. (2017). Effects of components of PM2.5 collected in Japan on the respiratory and immune systems. Int. J. Toxicol. 36, 153–164. doi: 10.1177/1091581816682224
Hou J., Li W., Zhang X. (2024a). Research on the impacts of digital economy on carbon emission efficiency at China’s City level. PloS One 19, e0308001. doi: 10.1371/journal.pone.0308001
Hou J., Shi J., Chen L., Zhang Z., Kuang E. (2024b). Exploring the spatial spillover effects of Yangtze River Delta ports on urban economic growth. PloS One 19, e0307770. doi: 10.1371/journal.pone.0307770
Huang M., He J., Yu H., Wang Y. (2025). Stack-based yard template generation in automated container terminals under uncertainty. Transport. Res. Part E: Logist. Transport. Rev. 193, 103851. doi: 10.1016/j.tre.2024.103851
Ismail A. M., Ballini F., Ölçer A. I., Alamoush A. S. (2024). Integrating ports into green shipping corridors: Drivers, challenges, and pathways to implementation. Mar. pollut. Bull. 209, 117201. doi: 10.1016/j.marpolbul.2024.117201
Jian L., Guo J., Ma H. (2022). Research on the impact of digital innovation driving the high-quality development of the shipping industry. Sustainability 14. doi: 10.3390/su14084648
Jiang J., Aksoyoglu S., Ciarelli G., Baltensperger U., Prévôt A. S. H. (2020). Changes in ozone and PM2.5 in Europe during the period of 1990–2030: Role of reductions in land and ship emissions. Sci. Total Environ. 741, 140467. doi: 10.1016/j.scitotenv.2020.140467
Jiang M., Zhao S., Jia P. (2023). The spatial spillover effect of seaport capacity on export trade: Evidence from China pilot free trade zones. Ocean Coast. Manage. 245, 106879. doi: 10.1016/j.ocecoaman.2023.106879
Jimenez V. J., Kim H., Munim Z. H. (2022). A review of ship energy efficiency research and directions towards emission reduction in the maritime industry. J. Clean. Product. 366, 132888. doi: 10.1016/j.jclepro.2022.132888
Kiihamäki S.-P., Korhonen M., Kukkonen J., Shiue I., Jaakkola J. J. K. (2024). Effects of ambient air pollution from shipping on mortality: A systematic review. Sci. Total Environ. 945, 173714. doi: 10.1016/j.scitotenv.2024.173714
Li R., Li L., Wang Q. (2022). The impact of energy efficiency on carbon emissions: Evidence from the transportation sector in Chinese 30 provinces. Sustain. Cities Soc. 82, 103880. doi: 10.1016/j.scs.2022.103880
Li Z., Li N., Wen H. (2021b). Digital economy and environmental quality: evidence from 217 cities in China. Sustainability 13. doi: 10.3390/su13148058
Li Z., Wang J. (2022). The dynamic impact of digital economy on carbon emission reduction: evidence city-level empirical data in China. J. Clean. Product. 351, 131570. doi: 10.1016/j.jclepro.2022.131570
Li Y., Yang X., Ran Q., Wu H., Irfan M., Ahmad M. (2021a). Energy structure, digital economy, and carbon emissions: evidence from China. Environ. Sci. pollut. Res. 28, 64606–64629. doi: 10.1007/s11356-021-15304-4
Li Y., Yin M., Ge J. (2024). The impact of port green competitiveness on the hinterland economy: A case study of China. PloS One 19, e0311221. doi: 10.1371/journal.pone.0311221
Li C., Zhou W. (2024). Can digital economy development contribute to urban carbon emission reduction? - Empirical evidence from China. J. Environ. Manage. 357, 120680. doi: 10.1016/j.jenvman.2024.120680
Liu W. (2023). The digital economy and environmental pollution: New evidence based on the support of logistics development. J. Clean. Product. 427, 139210. doi: 10.1016/j.jclepro.2023.139210
Liu Y., Jiang Y., Pei Z., Xia N., Wang A. (2023b). Evolution of the coupling coordination between the marine economy and digital economy. Sustainability 15. doi: 10.3390/su15065600
Liu X., Qin C., Liu B., Ahmed A. D., Ding C. J., Huang Y. (2024). The economic and environmental dividends of the digital development strategy: Evidence from Chinese cities. J. Clean. Product. 440, 140398. doi: 10.1016/j.jclepro.2023.140398
Liu T., Xue D., Fang Y., Zhang K. (2023a). The impact of differentiated development of the digital economy on employment quality—An empirical analysis based on provincial data from China. Sustainability 15. doi: 10.3390/su151914176
Luo Z., Lv Z., Zhao J., Sun H., He T., Yi W., et al. (2024). Shipping-related pollution decreased but mortality increased in Chinese port cities. Nat. Cities 1, 295–304. doi: 10.1038/s44284-024-00050-8
Ma Q., Li S., Jia P., Kuang H. (2025). Is port integration a panacea for regions green development: An empirical study of China port city. Transpo. Policy 160, 15–28. doi: 10.1016/j.tranpol.2024.10.036
Ma D., Zhu Q. (2022). Innovation in emerging economies: Research on the digital economy driving high-quality green development. J. Business Res. 145, 801–813. doi: 10.1016/j.jbusres.2022.03.041
Mueller N., Westerby M., Nieuwenhuijsen M. (2023). Health impact assessments of shipping and port-sourced air pollution on a global scale: A scoping literature review. Environ. Res. 216, 114460. doi: 10.1016/j.envres.2022.114460
Mwase N. S., Ekström A., Jonson J. E., Svensson E., Jalkanen J.-P., Wichmann J., et al. (2020). Health impact of air pollution from shipping in the Baltic sea: effects of different spatial resolutions in Sweden. Int. J. Environ. Res. Public Health 17. doi: 10.3390/ijerph17217963
Nunes R. A. O., Alvim-Ferraz M. C. M., Martins F. G., Peñuelas A. L., Durán-Grados V., Moreno-Gutiérrez J., et al. (2021). Estimating the health and economic burden of shipping related air pollution in the Iberian Peninsula. Environ. Int. 156, 106763. doi: 10.1016/j.envint.2021.106763
Organization W. H. (2021). WHO global air quality guidelines: particulate matter (PM2. 5 and PM10), ozone, nitrogen dioxide, sulfur dioxide and carbon monoxide (Geneva, Switzerland: World Health Organization).
Poulsen R. T., Ponte S., Sornn-Friese H. (2018). Environmental upgrading in global value chains: The potential and limitations of ports in the greening of maritime transport. Geoforum 89, 83–95. doi: 10.1016/j.geoforum.2018.01.011
Pournader M., Shi Y., Seuring S., Koh S. C. L. (2020). Blockchain applications in supply chains, transport and logistics: a systematic review of the literature. Int. J. Product. Res. 58, 2063–2081. doi: 10.1080/00207543.2019.1650976
Ramacher M. O. P., Matthias V., Aulinger A., Quante M., Bieser J., Karl M. (2020). Contributions of traffic and shipping emissions to city-scale NOx and PM2.5 exposure in Hamburg. Atmos. Environ. 237, 117674. doi: 10.1016/j.atmosenv.2020.117674
Rehman A., Ma H., Ahmad M., Ozturk I., Işık C. (2021). Estimating the connection of information technology, foreign direct investment, trade, renewable energy and economic progress in Pakistan: evidence from ARDL approach and cointegrating regression analysis. Environ. Sci. pollut. Res. 28, 50623–50635. doi: 10.1007/s11356-021-14303-9
Roberts T., Williams I., Preston J., Clarke N., Odum M., O’Gorman S. (2023). Ports in a storm: port-city environmental challenges and solutions. Sustainability 15. doi: 10.3390/su15129722
Russo M., Carvalho D., Jalkanen J.-P., Monteiro A. (2023). The future impact of shipping emissions on air quality in Europe under climate change. Atmosphere 14. doi: 10.3390/atmos14071126
Song B., Shi H., Wang M., Gu R. (2022). The research on the effect of digital economy development on urban air quality. Front. Environ. Sci. 10. doi: 10.3389/fenvs.2022.993353
Styhre L., Winnes H. (2019). “Chapter 6 - Emissions From Ships in Ports,” in Green Ports. Eds. Bergqvist R., Monios J. (Amsterdam: Elsevier), 109–124.
Sun X., Chen Z., Loh L. (2022). Exploring the effect of digital economy on PM2.5 pollution: the role of technological innovation in China. Front. Environ. Sci. 10. doi: 10.3389/fenvs.2022.904254
Sun Y., Yang L., Zheng J. (2020). Emission control areas: More or fewer? Transport. Res. Part D: Transpo. Environ. 84, 102349. doi: 10.1016/j.trd.2020.102349
Tan J., Chen L. (2022). Spatial effect of digital economy on particulate matter 2.5 in the process of smart cities: evidence from prefecture-level cities in China. Int. J. Environ. Res. Public Health 19.
Tang L., Ramacher M. O. P., Moldanová J., Matthias V., Karl M., Johansson L., et al. (2020). The impact of ship emissions on air quality and human health in the Gothenburg area – Part 1: 2012 emissions. Atmos. Chem. Phys. 20, 7509–7530. doi: 10.5194/acp-20-7509-2020
Wang T., Cheng P., Zhen L. (2023b). Green development of the maritime industry: Overview, perspectives, and future research opportunities. Transport. Res. Part E: Logist. Transport. Rev. 179, 103322. doi: 10.1016/j.tre.2023.103322
Wang R., Ding C. (2023). Bilateral impact of digital economy on air pollution: Emissions increase and reduction effects. Front. Environ. Sci. 11. doi: 10.3389/fenvs.2023.1134334
Wang Q., Dong Z., Li R., Wang L. (2022). Renewable energy and economic growth: New insight from country risks. Energy 238, 122018. doi: 10.1016/j.energy.2021.122018
Wang Q., Hu S., Li R. (2024a). Could information and communication technology (ICT) reduce carbon emissions? The role of trade openness and financial development. Telecommun. Policy 48, 102699. doi: 10.1016/j.telpol.2023.102699
Wang Q., Li L. (2021). The effects of population aging, life expectancy, unemployment rate, population density, per capita GDP, urbanization on per capita carbon emissions. Sustain. Product. Consumpt. 28, 760–774. doi: 10.1016/j.spc.2021.06.029
Wang Q., Sun J., Pata U. K., Li R., Kartal M. T. (2024b). Digital economy and carbon dioxide emissions: Examining the role of threshold variables. Geosci. Front. 15, 101644. doi: 10.1016/j.gsf.2023.101644
Wang Q., Wang L. (2020). Renewable energy consumption and economic growth in OECD countries: A nonlinear panel data analysis. Energy 207, 118200. doi: 10.1016/j.energy.2020.118200
Wang Q., Wang Y., Zhou P., Wei H. (2017). Whole process decomposition of energy-related SO2 in Jiangsu Province, China. Appl. Energy 194, 679–687. doi: 10.1016/j.apenergy.2016.05.073
Wang Q., Yang T., Li R. (2023a). Does income inequality reshape the environmental Kuznets curve (EKC) hypothesis? A nonlinear panel data analysis. Environ. Res. 216, 114575. doi: 10.1016/j.envres.2022.114575
Wang X., Yi W., Lv Z., Deng F., Zheng S., Xu H., et al. (2021). Ship emissions around China under gradually promoted control policies from 2016 to 2019. Atmos. Chem. Phys. 21, 13835–13853. doi: 10.5194/acp-21-13835-2021
Wei G., Yang Y., Li R., Liu Y., He B.-J. (2024). Digital economy exhibits varying degrees of mitigation of air pollution in China: Total cities-economic subdivisions-urban agglomerations. iScience 27, 110091. doi: 10.1016/j.isci.2024.110091
Weng J., Han T., Shi K., Li G. (2022). Impact analysis of ECA policies on ship trajectories and emissions. Mar. pollut. Bull. 179, 113687. doi: 10.1016/j.marpolbul.2022.113687
Wu S.-P., Cai M.-J., Xu C., Zhang N., Zhou J.-B., Yan J.-P., et al. (2020). Chemical nature of PM2.5 and PM10 in the coastal urban Xiamen, China: Insights into the impacts of shipping emissions and health risk. Atmos. Environ. 227, 117383. doi: 10.1016/j.atmosenv.2020.117383
Wu X., Qin Y., Xie Q., Zhang Y. (2022). The mediating and moderating effects of the digital economy on PM2.5: evidence from China. Sustainability 14.
Xiao G., Tong H., Shu Y., Ni A. (2025). Spatial-temporal load prediction of electric bus charging station based on S2TAT. Int. J. Electric. Power Energy Syst. 164, 110446. doi: 10.1016/j.ijepes.2024.110446
Xiao G., Xu L. (2024). Challenges and opportunities of maritime transport in the post-epidemic era. J. Mar. Sci. Eng. 12. doi: 10.3390/jmse12091685
Xu L., Shen C., Chen J., Pan X., Xiao G. (2024a). Efficiency evaluation and improvement pathway of sulfur-oxide emissions in European ports based on Context-dependent SBM-DEA model. Mar. pollut. Bull. 208, 117002. doi: 10.1016/j.marpolbul.2024.117002
Xu L., Wu J., Zhao Q., Chen J., Liu J., Gao F., et al. (2024b). Spatial-temporal characteristics of port infrastructures on sulfur-oxide concentrations of coastal port in China. Ocean Coast. Manage. 258, 107399. doi: 10.1016/j.ocecoaman.2024.107399
Xu L. D., Xu E. L., Li L. (2018). Industry 4.0: state of the art and future trends. Int. J. Product. Res. 56, 2941–2962. doi: 10.1080/00207543.2018.1444806
Xu Y., Yang C., Ge W., Liu G., Yang X., Ran Q. (2023). Can industrial intelligence promote green transformation? New insights from heavily polluting listed enterprises in China. J. Clean. Product. 421, 138550. doi: 10.1016/j.jclepro.2023.138550
Ytreberg E., Åström S., Fridell E. (2021). Valuating environmental impacts from ship emissions – The marine perspective. J. Environ. Manage. 282, 111958. doi: 10.1016/j.jenvman.2021.111958
Yu H., Wang J., Xu J. (2023). Assessing the role of digital economy agglomeration in energy conservation and emission reduction: Evidence from China. Energy 284, 128667. doi: 10.1016/j.energy.2023.128667
Zhang Y., Eastham S. D., Lau A. K. H., Fung J. C. H., Selin N. E. (2021). Global air quality and health impacts of domestic and international shipping. Environ. Res. Lett. 16, 084055. doi: 10.1088/1748-9326/ac146b
Zhang Z., Song C., Zhang J., Chen Z., Liu M., Aziz F., et al. (2024b). Digitalization and innovation in green ports: A review of current issues, contributions and the way forward in promoting sustainable ports and maritime logistics. Sci. Total Environ. 912, 169075. doi: 10.1016/j.scitotenv.2023.169075
Zhang G., Xing L. (2023). Research on tourism economic effect under the threshold of new-type urbanization in coastal cities of China: From the perspective of development economics. Ocean Coast. Manage. 239, 106587. doi: 10.1016/j.ocecoaman.2023.106587
Zhang C., Zhang Y., Zhang H., You J., Lv X., Cheng X. (2024a). The impact of digital economy on energy conservation and emission reduction: Evidence from prefecture-level cities in China. Sustain. Futures 8, 100288. doi: 10.1016/j.sftr.2024.100288
Zhang Z., Zhao M., Zhang Y., Feng Y. (2023). How does urbanization affect public health? New evidence from 175 countries worldwide. Front. Public Health 10. doi: 10.3389/fpubh.2022.1096964
Zhao H., Cheng Y., Zheng R. (2022). Impact of the digital economy on PM2.5: experience from the middle and lower reaches of the yellow river basin. Int. J. Environ. Res. Public Health 19.
Keywords: digital economy, shipping-related pollution, coastal port cities, panel threshold model, smart port
Citation: Ding X, Song J, Zhu N and Ji X (2025) Does the digital economy reduce shipping-related pollution? Evidence from coastal port cities in China. Front. Mar. Sci. 12:1538634. doi: 10.3389/fmars.2025.1538634
Received: 05 December 2024; Accepted: 04 February 2025;
Published: 20 February 2025.
Edited by:
Tsz Leung Yip, Hong Kong Polytechnic University, ChinaReviewed by:
Athena Progiou, AXON ENVIRO-GROUP Ltd., GreeceGuangnian Xiao, Shanghai Maritime University, China
Copyright © 2025 Ding, Song, Zhu and Ji. This is an open-access article distributed under the terms of the Creative Commons Attribution License (CC BY). The use, distribution or reproduction in other forums is permitted, provided the original author(s) and the copyright owner(s) are credited and that the original publication in this journal is cited, in accordance with accepted academic practice. No use, distribution or reproduction is permitted which does not comply with these terms.
*Correspondence: Nian Zhu, MTAyNjQzNjdAcXEuY29t; Xina Ji, aml4aW5hQG5idWZlLmVkdS5jbg==