Abstract
Eelgrass (Zostera marina) creates valuable, biodiverse habitats worldwide, but is at risk from combined environmental stressors and disease. We surveyed paired intertidal and subtidal meadows for seagrass wasting disease in the San Juan Islands, WA, USA in summers 2017–2019 to determine how disease varied with depth, temperature, and salinity. We expected reduced disease in deeper meadows with more stable environmental conditions compared to shallower, intertidal meadows with greater thermal and salinity variation. Leveraging a machine-learning algorithm to detect and quantify disease, we measured high disease levels and large changes in meadow densities, particularly in the warmer 2018 summer. Daily mean in situ and remote-sensed temperatures captured exposure to warming, though in situ temperatures better identified site-specific, seasonal thermal ranges. Subtidal meadows experienced nearly 14°C cooler maximum in situ temperatures compared to intertidal meadows. Disease severity was 2.24 times greater in shallow, intertidal meadows compared to deeper, subtidal meadows over the 3-year study and 1.39 times greater during the 2018 warming. Thus, some subtidal meadows can serve as valuable refugia against environmental and pathogenic stressors. Lower eelgrass densities were also associated with increased severity, suggesting a link between disease and meadow patchiness. Temperature and salinity were also key predictors of higher disease: prevalence and maximum sea surface temperatures covaried, as did severity and salinity range, suggesting these environmental factors may differentially influence seagrass wasting disease risk and progression. Our work highlights the value of both subtidal eelgrass meadows and sites with more stable environmental conditions as refugia from multiple stressors, which should be considered as differential drivers of disease.
1 Introduction
Climate change is dramatically impacting life on land and in our ocean, directly and via increased disease risk (Altizer et al., 2013). These environmental impacts trigger biodiversity loss and prominent changes to chemical and physical properties of coastal habitats, particularly when they influence foundation species like seagrasses. A temperate seagrass, eelgrass (Zostera marina) has declined both globally and regionally due to multiple stressors (Dunic et al., 2021; Graham et al., 2024). Environmental stressors can interact with climate-fueled pathogens (Burge and Hershberger, 2020), including Labyrinthula zosterae, the protist that causes seagrass wasting disease. Historic disease outbreaks in the 1930s ravaged eelgrass meadows along the Atlantic coasts of the USA and Europe (Rasmussen, 1977). Today, wasting disease continues to jeopardize the health of global eelgrass meadows, particularly since environmental conditions like warmer temperature favor L. zosterae.
As with other marine diseases (Harvell et al., 2002, 2019; Burge and Hershberger, 2020; Vega Thurber et al., 2020), warmer temperatures are associated with higher wasting disease prevalence and severity in natural eelgrass meadows (Groner et al., 2021; Aoki et al., 2022, 2023; Graham et al., 2023). Warmer temperatures have also been shown to promote faster pathogen growth in laboratory trials (Dawkins et al., 2018). Warming temperatures likely influence not only pathogen virulence, but also eelgrass resistance, as ocean warming has led to reduced flowering and reproductive output (Qin et al., 2020) and survival (Sawall et al., 2021; Berger et al., 2024). Recent experiments also showed that a simulated marine heatwave reduced aboveground eelgrass biomass among plants inoculated with L. zosterae (Egea et al., 2024). Of course, other environmental conditions like depth and salinity also influence seagrass wasting disease trajectories (Jakobsson-Thor et al., 2018) and eelgrass health more generally (Thom et al., 2018). For example, acute salinity fluctuations can stress eelgrass (Sola et al., 2020). Particularly for intertidal eelgrass meadows exposed during mid-day low tides, desiccation is a major environmental stressor, in addition to temperature and depth (Thom et al., 2014). Thus, multiple environmental stressors likely influence seagrass wasting disease trajectories and eelgrass health.
Eelgrass meadows are arguably the most important and best represented nearshore habitat in the Salish Sea, the transboundary waters spanning from British Columbia, Canada to Puget Sound, Washington, USA. The San Juan Islands stand out as having both high wasting disease levels and dramatic eelgrass declines (Groner et al., 2021; Aoki et al., 2023; Graham et al., 2024), even among six geographic regions spanning from Alaska to California (Aoki et al., 2022). Further, drop camera surveys demonstrated that the San Juans are anomalous statewide for rapid meadow declines over the last 20 years (Christiaen et al., 2022). However, initial field surveys indicated that deeper, subtidal meadows had lower disease levels and may support eelgrass resilience to multiple stressors, perhaps as refugia against climate and pathogenic stressors (Graham et al., 2023, 2024). Understanding how environmental stressors interact with pathogens and influence the health and resilience of marine foundation species is critical to effectively monitoring and conserving these habitats and the ecosystem services they provide.
Here, we aimed to test the following hypotheses: (i) Subtidal meadows have lower disease prevalence and severity than adjacent intertidal meadows. (ii) Exposure to thermal ranges varies between adjacent intertidal and subtidal meadows, influencing their susceptibility to disease. (iii) Decreased eelgrass densities are associated with higher disease. (iv) Smaller temperature and salinity ranges (i.e. more stable environmental conditions) are associated with lower disease prevalence and severity because greater environmental variability could physiologically stress eelgrass more than stable environmental conditions. To address these, we conducted wasting disease surveys in paired subtidal and intertidal eelgrass meadows in the San Juan Islands, WA (July 2017-2019); we also leveraged in situ and remote-sensed temperatures, modeled salinities, disease (prevalence, severity), and eelgrass biometric data (density, leaf area).
2 Materials and methods
2.1 Field surveys
Building on previous seagrass wasting disease work in the San Juan Islands, WA, USA (Groner et al., 2014, 2016, 2021; Aoki et al., 2022, 2023; Graham et al., 2023, 2024), we surveyed 5 sites throughout the San Juans for disease, leaf area, and eelgrass density. Each site had paired intertidal and subtidal meadows and spanned a range of sea surface and in situ temperatures and salinities (Figure 1). For each survey, we ran three, 20-m transects parallel to shore at each depth, targeting the middle of each meadow to avoid edge effects, such as differences in shoot densities (Harrison and Durance, 1992). We collected eelgrass at low tide for intertidal surveys and via snorkeling or SCUBA diving for subtidal surveys. Using GPS coordinates, compass headings, and field markers, we returned to the same transects each year. Intertidal meadows were approximately +1 m and subtidal meadows varied from approximately -5.0 to -9.8 m mean lower low water. We standardized eelgrass collections for disease analyses to the third-rank (third youngest) leaf on each shoot, as disease can vary with leaf age (Graham et al., 2021). To measure densities, we counted the total number of eelgrass shoots in 0.25 m2 quadrats along each transect. We measured densities at 0, 10, and 20 m for all subtidal surveys (n=9/site). For intertidal surveys, we measured densities at 5, 10, and 20 m in 2017 and 2018 (n=9/site), and at 4, 8, 12, 16 m in 2019 (n=12/site, 0.36 m2 quadrat). In 2019, we shifted intertidal survey methods to align with broader surveys beyond the San Juan Islands. Given that the intertidal eelgrass was moving seaward at all sites, we had to move all intertidal transects seaward (i.e. into the lower intertidal) in 2019. Due to logistical constraints, no density measurements were made at Fourth of July intertidal in 2018 nor subtidal in 2019. We also collected 25 mL benthic seawater samples in Falcon tubes from each site at 0 and 10 m (n=6/site) for single-point snapshots of salinity, which we measured using a refractometer immediately after each survey. After collection, we transported all leaves in bags with seawater on ice until processing in the lab.
Figure 1
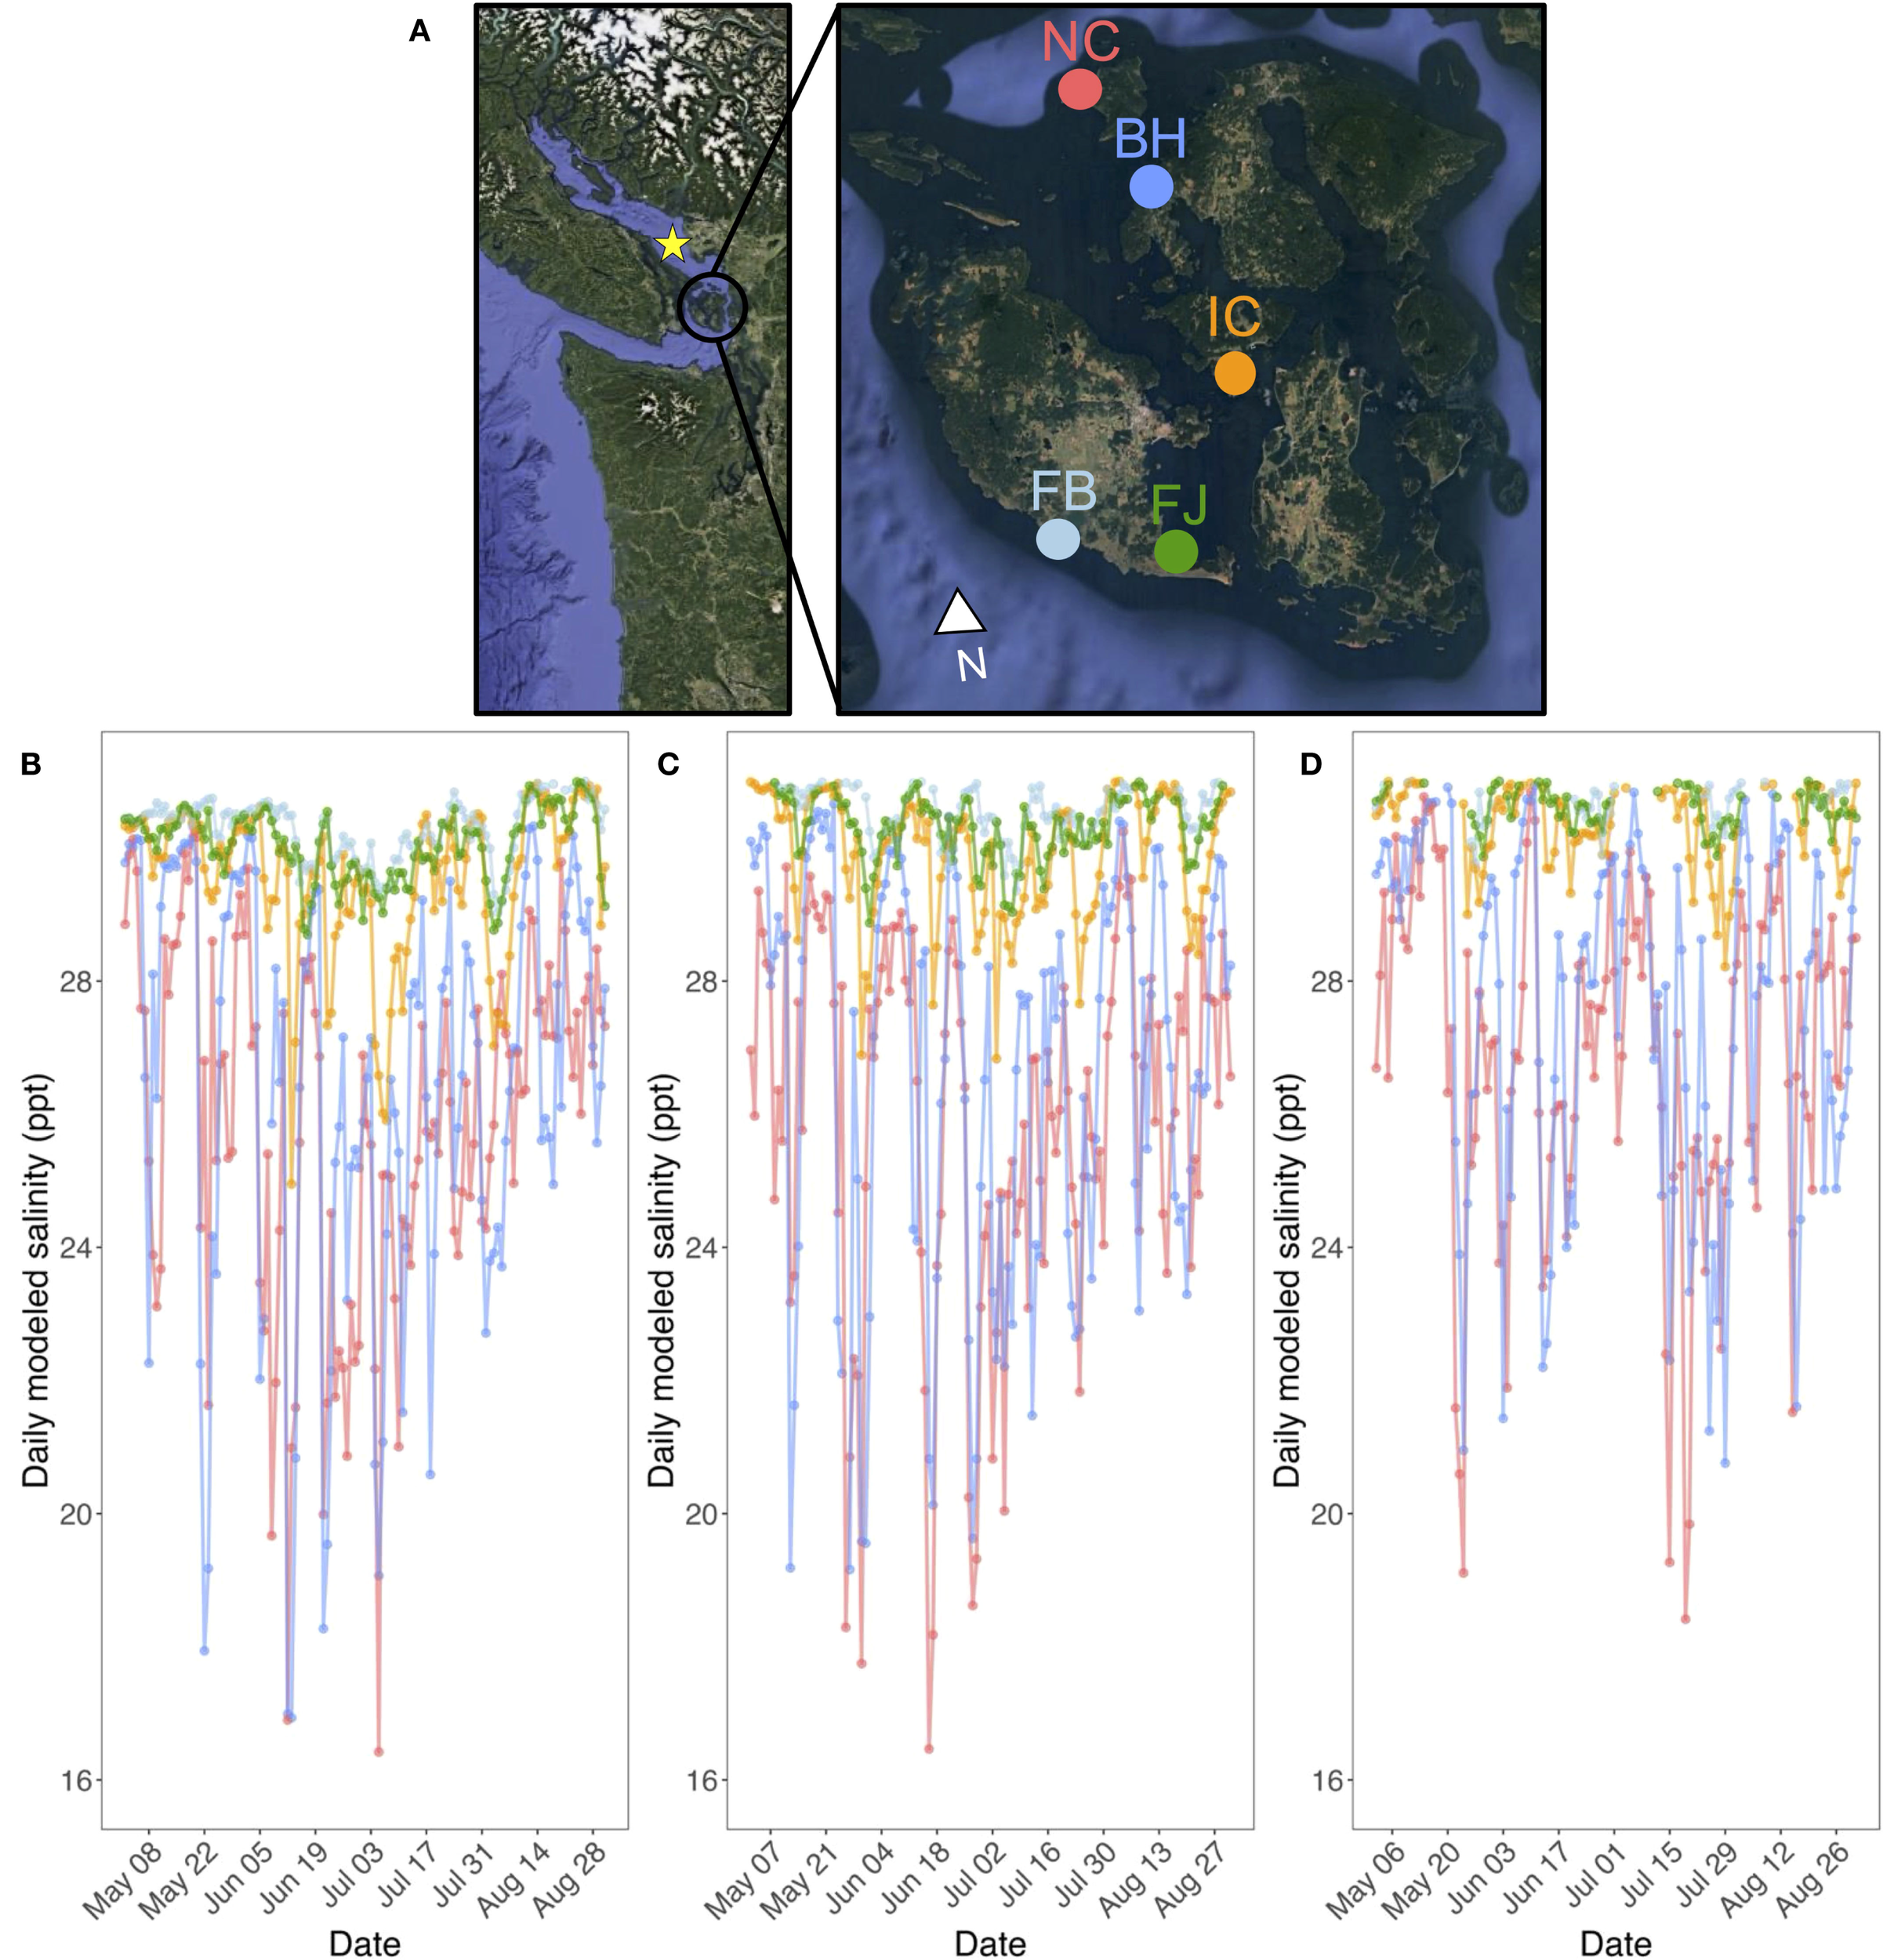
(A) Map of intertidal and subtidal eelgrass eld sites in the San Juan Islands, Washington, USA, including: North Cove (NC), Beach Haven (BH), Indian Cove (IC), False Bay (FB), and Fourth of July (FB). The star on the left inset map indicates the mouth of the Fraser River, British Columbia, Canada. Summer daily modeled salinities in (B) 2017, (C) 2018, and (D) 2019. Salinities used in models were restricted to June 1-Aug 31, 2017-2019. (Map created using Google Earth Pro.).
2.2 Disease measurements
In lab, we scraped epiphytes from leaves before scanning at 600 dpi resolution with a Canon CanoScan LiDE 220 scanner. We then analyzed all images using the Eelgrass Lesion Image Segmentation Analyzer (EeLISA), a robust machine learning algorithm, for precise disease and leaf area measurements (Rappazzo et al., 2021; Aoki et al., 2022; Graham et al., 2023). EeLISA measured disease prevalence (presence/absence of disease) and severity (proportion infected leaf area) for each third-rank leaf. Based on leaf-level prevalence, we calculated site-level mean prevalence (proportion of infected leaves) and severity, which was calculated only from infected leaves. Previous work confirmed the presence of L. zosterae in eelgrass from these sites using molecular diagnostics (Groner et al., 2021; Aoki et al., 2022).
2.3 Temperature data
To evaluate the linkages between disease and ocean temperatures, we leveraged remote-sensed sea surface temperatures and in situ temperature data. Remote-sensed temperatures can provide greater spatiotemporal resolution than in situ temperatures and allow calculation of anomaly metrics but may not capture fine-scale environmental conditions. By comparing temperatures measured at multiple scales, we were able to better evaluate exposure to warming and potentially stressful temperatures in the intertidal meadows. Following previously published methods (Aoki et al., 2022; Graham et al., 2023), we extracted remote-sensed, daily sea surface temperatures for each site via the NASA Jet Propulsion Laboratory OPeNDAP portal at 1-km spatial resolution (JPL MUR MEaSUREs Project, 2015) for comparison to in situ temperatures from HOBO TidBit temperature loggers. We deployed 1–2 intertidal loggers at each site that continuously logged temperature at 10-min intervals for the duration of the 3-year surveys. Given the challenges with finding and recovering small loggers in subtidal meadows, we deployed and recovered 1 subtidal logger per site at the start and end of each field season. We had the most complete set of in situ intertidal and subtidal temperatures from June 22 – July 20, 2017-2019; this period covered roughly the month prior to the field surveys and provided a snapshot of growing season conditions. We did not have subtidal in situ temperatures for Fourth of July (2017-2019) nor North Cove (2019), as we could not recover these loggers. We calculated in situ daily temperature mean, minimum, maximum, and range for each depth during the 4-week period of interest across all 3 summers; we also calculated remote-sensed daily temperature mean, minimum, maximum, and range for each site during this timeframe. Subsequently, we compared remote-sensed and in situ temperatures to see if they accurately captured within- and between-site thermal variation. We included temperature metrics in models of environmental and biotic drivers of disease prevalence and severity, henceforth referred to as “disease models” (described in the “statistical analyses” section below).
2.4 Salinity data
We utilized daily, modeled salinities for each site from the Salish Sea LiveOcean Model, which has 500 m horizontal resolution for most of the Salish Sea (Sobocinski, 2021; MacCready and Geyer, 2024). Ocean buoys off the Washington coast record in situ environmental parameters like salinity, temperature, and oxygen. The LiveOcean model integrates these measurements to provide 72-hr projections of ocean conditions (Newton et al., 2021). In turn, these robust data inform local and regional marine conservation decisions, such as when to close coastal shellfish harvests due to harmful algal blooms (Giddings et al., 2014; Barth et al., 2019). We plotted and visually compared in situ and modeled salinities for each sampling date to confirm modeled data accurately represented nearshore salinities. Here, we calculated the maximum, minimum, mean, and range of modeled salinities at each site from June 22-July 20 each summer to include in disease models. This report integrates in situ and remote-sensed temperatures across depths, modeled sea surface salinity, and field survey data for a more comprehensive analysis of seagrass wasting disease stressors.
2.5 Statistical analyses
We performed all statistical analyses in R v. 4.4.1 (R Core Team, 2023) and visualized data using the packages ggplot, ggpubr, and RcolorBrewer (Neuwirth, 2014; Wickham, 2016; Kassambara, 2020). We calculated site-level mean disease prevalence, severity, and standard error using the Rmisc package (Hope, 2022). To compare disease prevalence, severity, density, and in situ temperatures (mean, max, range) between depths, we ran non-parametric Wilcoxon tests. We ran non-parametric Kruskal-Wallis tests to assess site and year differences in temperature and density separately for subtidal and intertidal meadows. To determine if in situ temperatures were associated with remote-sensed temperatures, we ran a simple linear regression and visually evaluated fitted versus residual plots.
To examine predictor relationships, we assessed collinearity with the corrplot package (Wei and Simko, 2021) and visualized correlations among temperature, salinity, eelgrass biometrics, and disease metrics. Environmental parameters most strongly associated with disease prevalence and severity included maximum remote-sensed sea surface temperature, mean in situ temperature, modeled minimum and range salinity (Supplementary Figure S1).
We used generalized linear mixed models (GLMMs, glmmTMB package; Brooks et al., 2017) to evaluate predictors of leaf-level disease prevalence (binomial) and severity (beta regression with logit link). Predictors included year, temperature, salinity, density, depth, and biologically relevant interactions like temperature and leaf area, since eelgrass productivity is closely associated with temperature; site and transect were random effects. In total, we ran 84 candidate prevalence and severity models, respectively. We centered and scaled all numeric predictors and excluded leaves without density data from one meadow-year combination (Fourth of July intertidal, 2018; n = 74). Severity analyses focused on infected leaves using a hurdle model approach (Zuur et al., 2009); we logit-transformed severity using a link logit function (Warton and Hui, 2011), as the data were zero-skewed.
We selected the best-fit prevalence and severity models using corrected Akaike information criterion (AICc, MuMIn package; Barton, 2022). We assessed model diagnostic plots using the DHARMa package (Hartig, 2021). For significant predictors, we calculated the fixed effects variance (marginal R2, performance package; Ludecke, 2021) and estimated marginal means (emmeans package; Lenth, 2021) to test for depth and year effects. For additional details on candidate models, transformations, and full diagnostic results, please see the Supplementary Materials.
3 Results
3.1 Eelgrass disease and density patterns
Disease prevalence and severity were significantly lower in subtidal meadows than intertidal meadows (prevalence: W = 770209, p < 0.0001; severity: W = 876520, p < 0.0001; Figure 2; Supplementary Table S1). Across three years, intertidal prevalence averaged 79.58 ± 1.09% SE, 1.39 times higher than in subtidal prevalence (57.27 ± 1.63% SE). Disease prevalence peaked in 2018, especially in intertidal meadows (Figure 2), and remained consistently high (>50%) across most sites, indicating widespread disease (Figure 2; Supplementary Table S2).
Figure 2
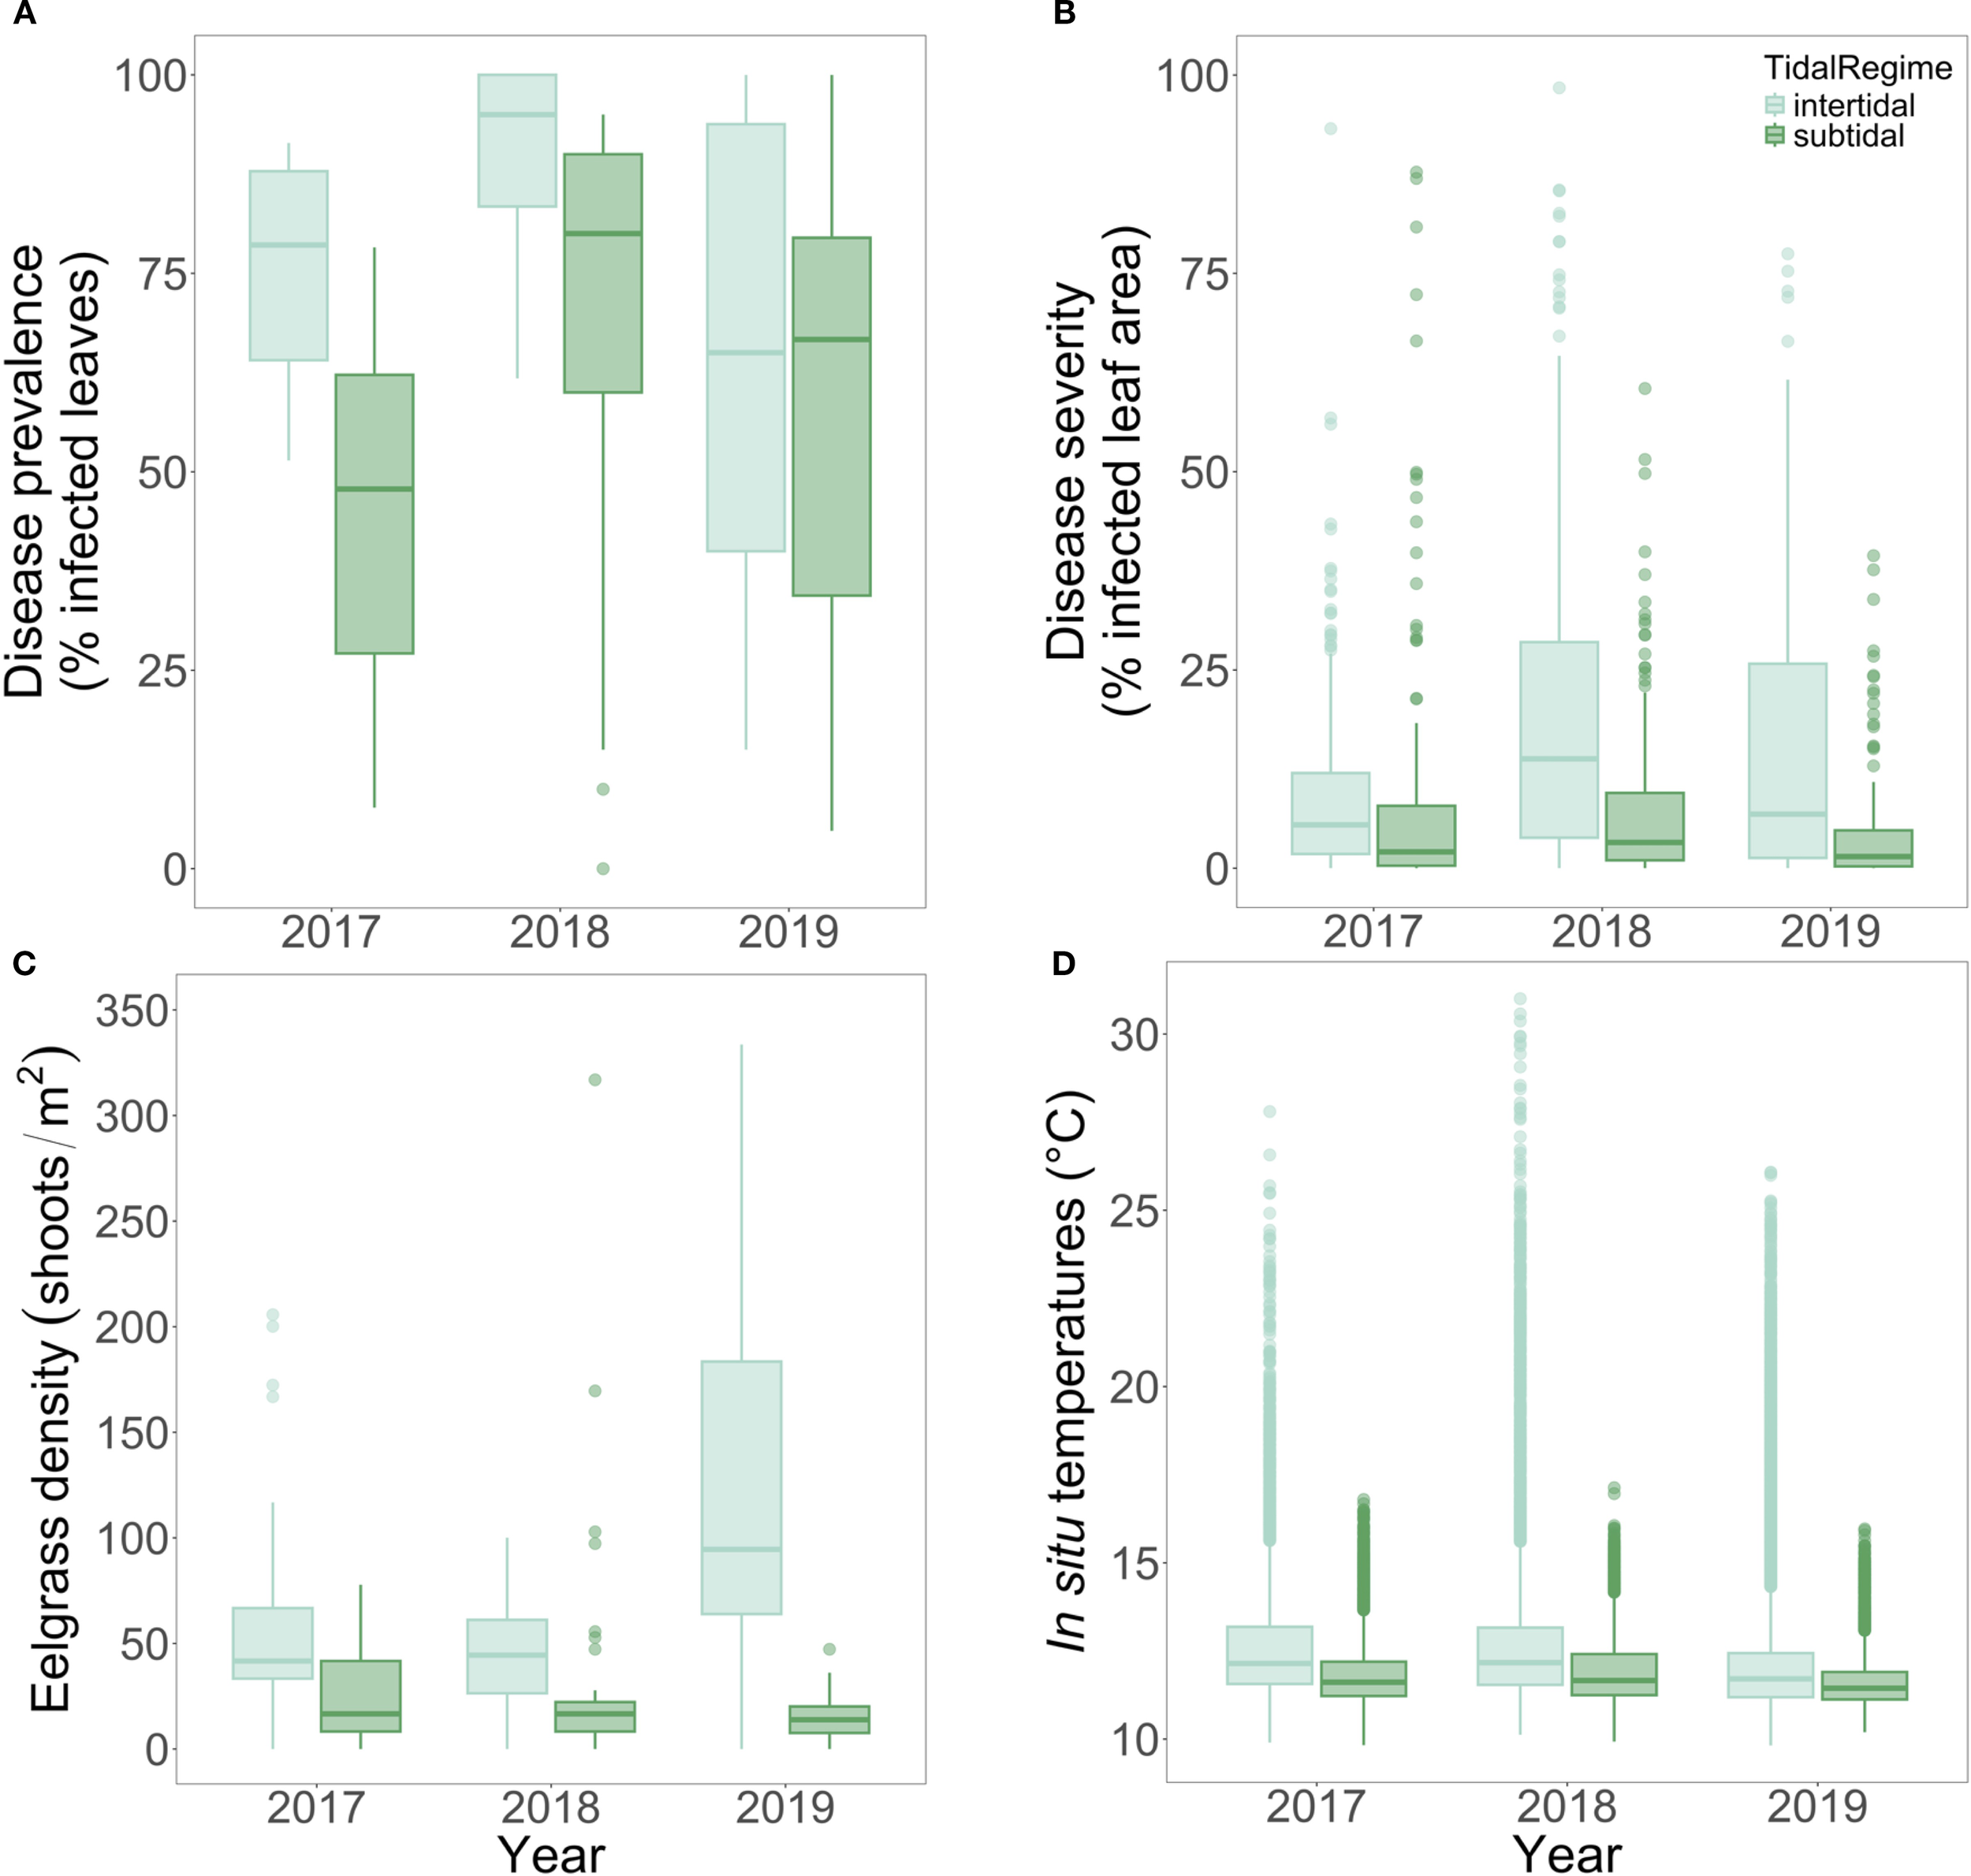
Boxplots of (A) disease prevalence, (B), disease severity, (C) eelgrass densities, and (D)in situ temperatures aggregated across 5 paired intertidal and subtidal meadows in the San Juan Islands, WA from summers 2017-2019. For disease prevalence, severity, and density by site, year, and depth, please see Supplementary Table S2.
Disease severity was also higher in intertidal eelgrass, averaging 15.06 ± 0.52% SE compared to 6.72 ± 0.51% SE in subtidal meadows (2.2-times higher; Figure 2; Supplementary Table S1). Severity peaked in 2018 alongside prevalence, with a stronger depth contrast that year. Most sites had reduced severity in 2019, except intertidal Beach Haven, which increased further (Supplementary Table S2). Across all 3 years, the highest intertidal prevalence and severity were at North Cove and Beach Haven, and the highest subtidal disease was at North Cove and Fourth of July (Supplementary Table S2).
Eelgrass density was nearly four times higher in intertidal meadows (84.5 ± 6.27 shoots/m2) than subtidal meadows (23.85 ± 3.18; Figure 2; Supplementary Table S1). Subtidal density varied by site but not year (site: χ2(4) = 38.40, p < 0.0001; year: χ2(2) = 2.18, p = 0.34), while intertidal density varied by both (site: χ2 (4) = 14.31, p = 0.0064; year: χ2(2) = 34.58, p < 0.0001; Supplementary Table S2). False Bay and North Cove had the highest intertidal densities, and False Bay had the highest subtidal densities (Supplementary Table S2). Intertidal declines in 2018 coincided with high severity, highlighting an inverse relationship between density and disease.
3.2 Environmental characterization: temperature and salinity
In situ temperatures captured precise thermal variation between depths and reflected strong thermal buffering in subtidal meadows (Supplementary Figure S3). Across all years and sites, maximum in situ subtidal temperatures were 14°C lower than intertidal maxima (subtidal: 17.1°C, intertidal: 31°C; W = 110994, p < 0.0001; Supplementary Table S1). Mean subtidal temperatures were also significantly cooler than intertidal means (W = 104553, p < 0.0001); intertidal meadows experienced a 13.9°C greater thermal range (intertidal: 21.2°C, subtidal: 7.3°C; W = 107114, p < 0.0001; Supplementary Figure S4). These patterns show the thermal stability of subtidal meadows compared to extreme intertidal warming during summertime low tides.
Remote-sensed sea surface temperatures revealed fine-scale within- and between-site variation and were generally warmer than in situ temperatures (Figure 3), averaging 0.57°C above intertidal and 1.04°C above subtidal temperatures (Supplementary Table S1). Nonetheless, mean daily in situ and remote-sensed temperatures were strongly correlated (R2 = 0.84, Supplementary Figure S2; Supplementary Table S3). In contrast, temperature ranges were not correlated between data sources (correlation coefficient = -0.11, Supplementary Figure S1), highlighting the importance of in situ monitoring for capturing local extremes.
Figure 3
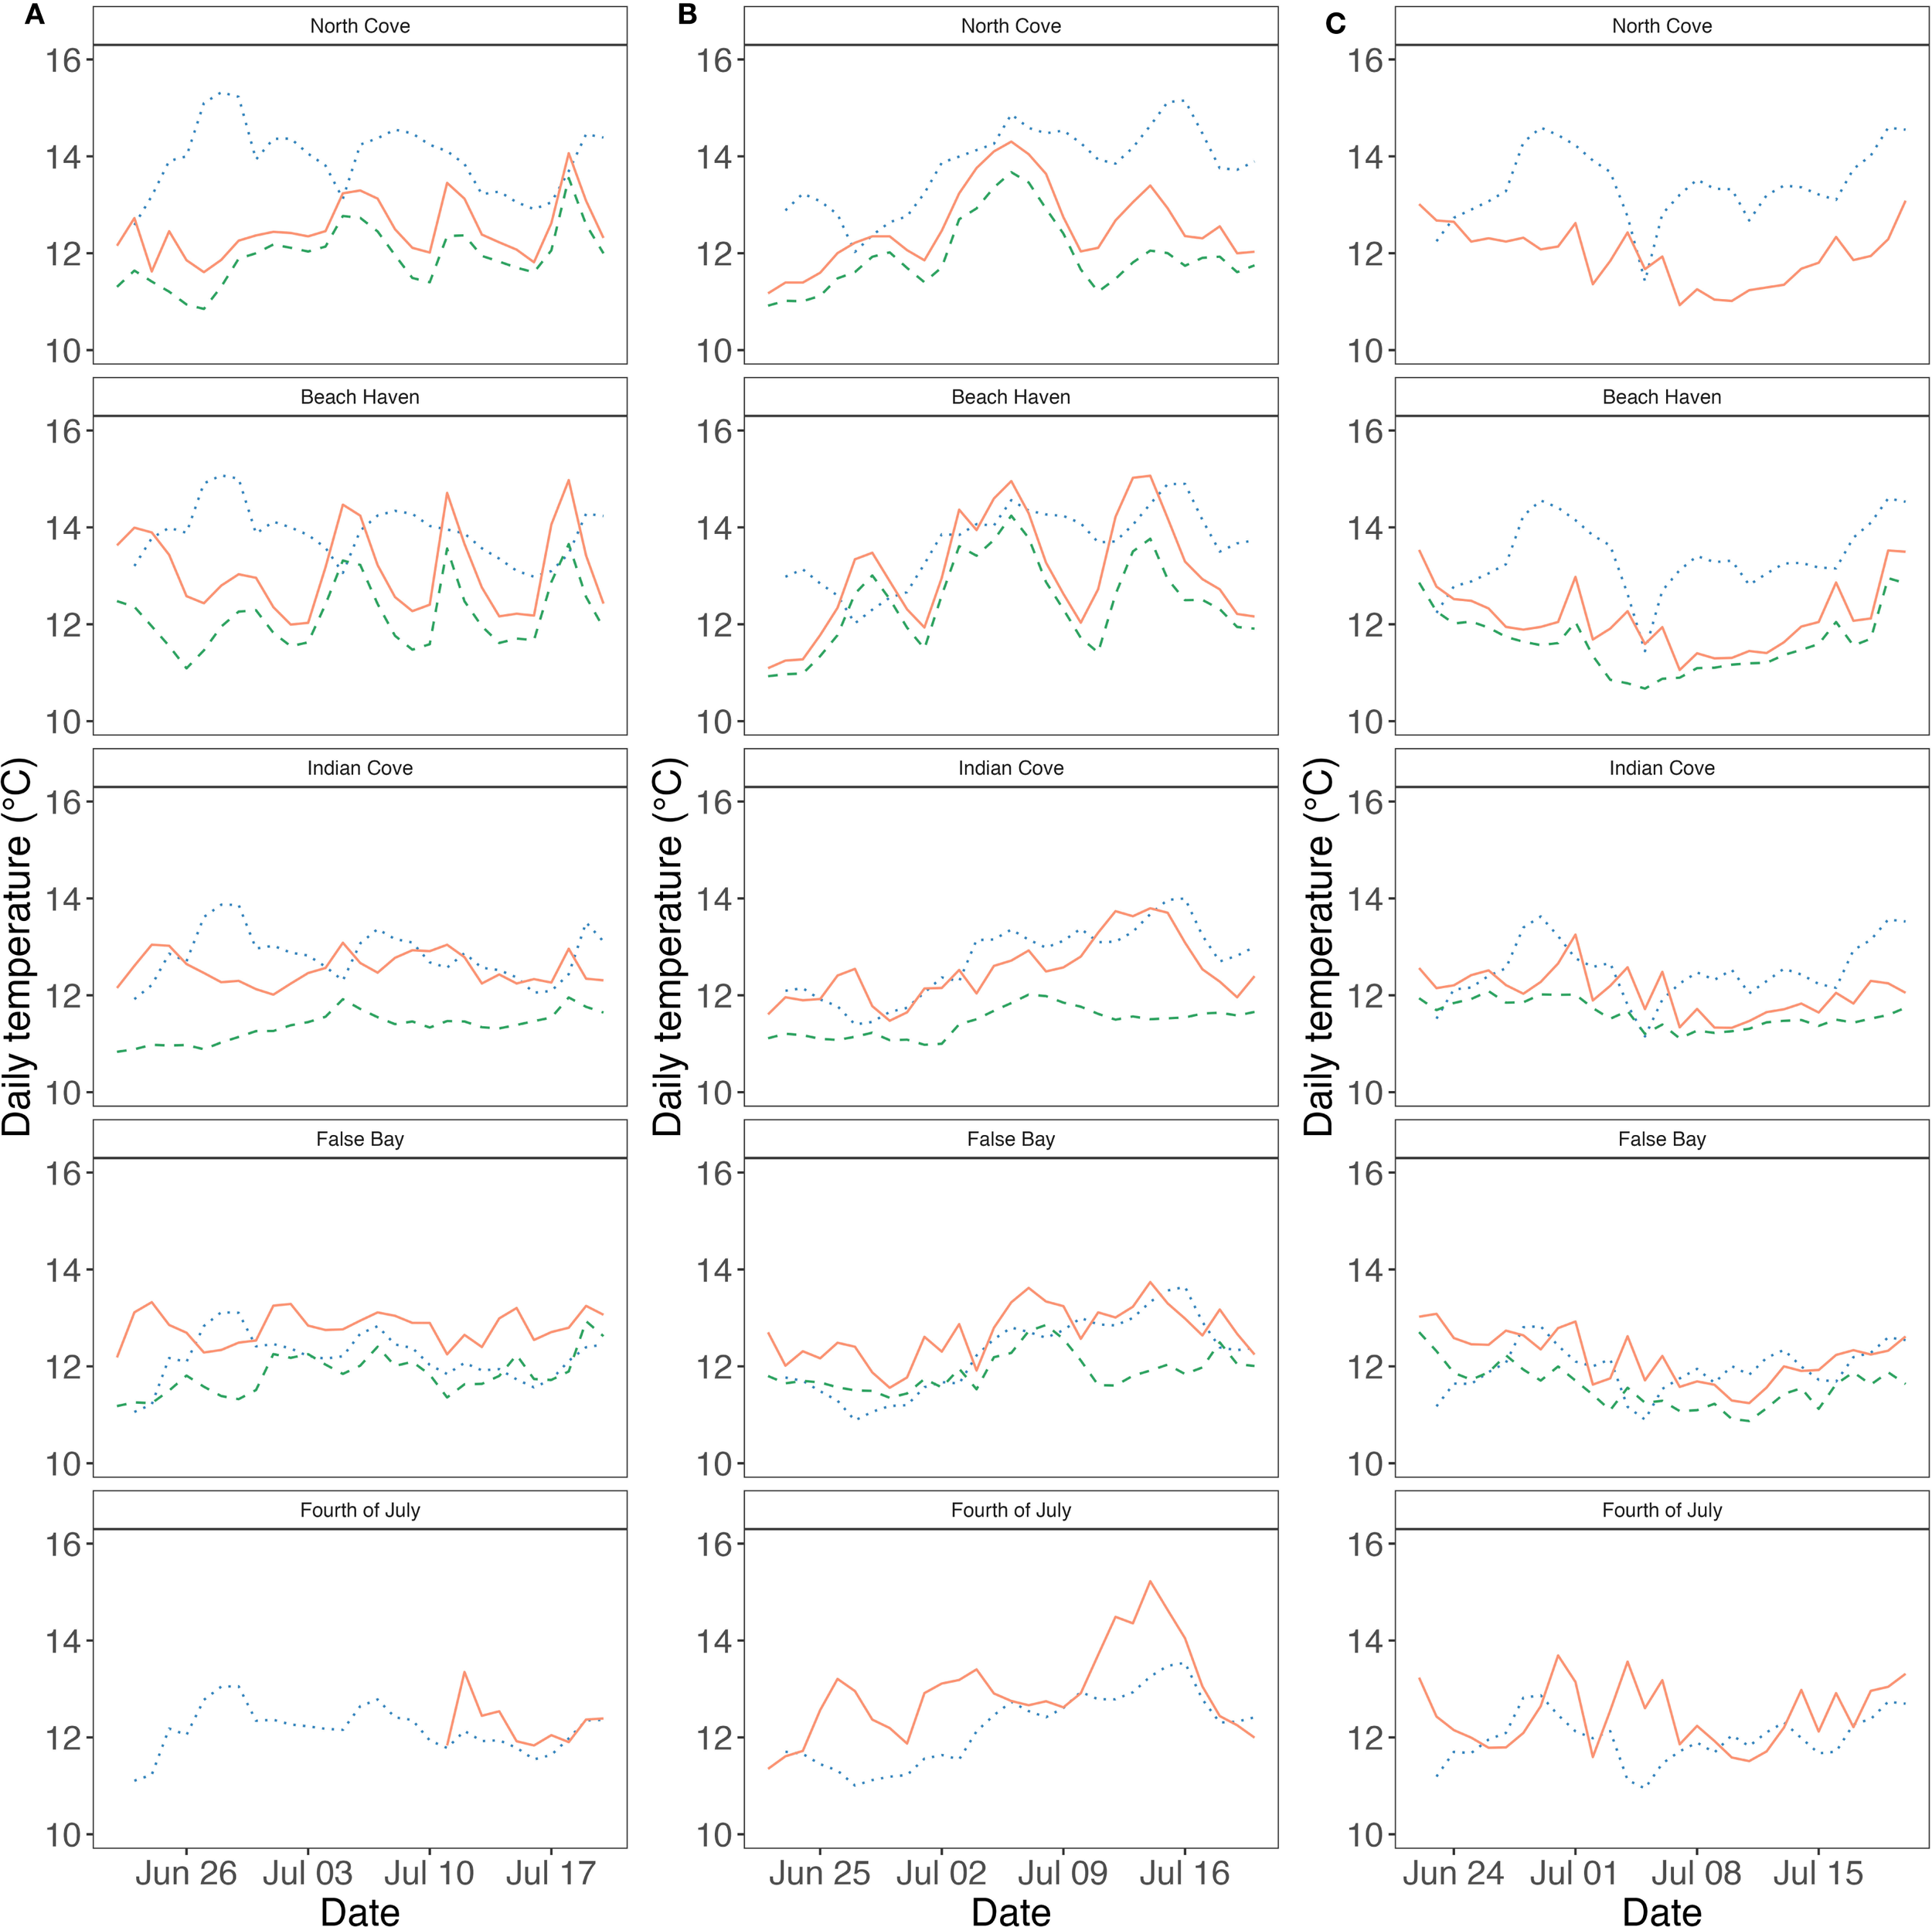
Eelgrass meadows in the San Juan Islands, WA experienced variable sea surface and in situ temperatures. Daily sea surface temperatures (blue, dotted line) and daily mean in situ intertidal (red, solid line) and subtidal (green, dashed line) temperatures at eelgrass meadows in the San Juan Islands, WA from June 22– July 20, (A) 2017, (B) 2018, and (C) 2019. Sites are arranged from north to south (top to bottom).
In situ temperature variation was also pronounced between depths and across space and time (Supplementary Table S4). Mean intertidal temperatures varied between sites and years (site: χ2(4) = 14.86, p = 0.005; year: χ2 (2) = 55.90, p < 0.0001). Beach Haven and Fourth of July had the warmest intertidal means (13.1°C and 12.93°C); Fourth of July experienced the highest maximum (31°C; Supplementary Table S4). Similarly, subtidal in situ temperatures varied by site and year (site: χ2(3) = 40.87, p < 0.0001; year: χ2(2) = 11.42, p = 0.00331). Averaged across all sites, 2018 was the warmest summer and 2019 was the coolest (Supplementary Tables S1, S4).
Salinity also reflected dramatic spatiotemporal variation (site: χ2(4) = 273.26, p < 0.0001; year: χ2(2) = 75.44, p < 0.0001; Supplementary Figure S6; Supplementary Table S5). Northern sites (North Cove and Beach Haven) exhibited the greatest variability, with ranges of 13.5 and 11.8 parts per thousand (ppt), respectively (Supplementary Table S1). Southern sites (Indian Cove, False Bay, Fourth of July) were comparatively stable, with daily ranges of 2.61-5.6 ppt. These differences were reflected in mean salinities, which were lower in the north than in the south (Supplementary Figure S5; Supplementary Tables S1, S2). Across years, 2019 had the highest mean salinity (29.54 ± 0.2 ppt) compared to 2017 (27.34 ± 0.25) and 2018 (27.99 ± 0.25), coinciding with cooler temperatures (Supplementary Table S1). Minimum salinity and salinity range were strongly correlated (Supplementary Figure S1), indicating both metrics reflected low salinity conditions. Modeled salinities generally aligned with salinity measurements from the field (Supplementary Figure S6).
3.3 Temperature x salinity x density models
Disease prevalence was significantly reduced in subtidal meadows compared to intertidal meadows (β = -3.13, SE = 0.33, p < 0.0001), and significantly increased with maximum remote-sensed sea surface temperatures (Figure 4; β = 1.09, SE = 0.18, p < 0.0001) and leaf areas (β = 0.81, SE = 0.099, p < 0.0001); prevalence varied significantly between years. Fixed effects explained 43.1% of the variance in disease prevalence (n = 1935 leaves; Supplementary Figure S7; Supplementary Table S7).
Figure 4
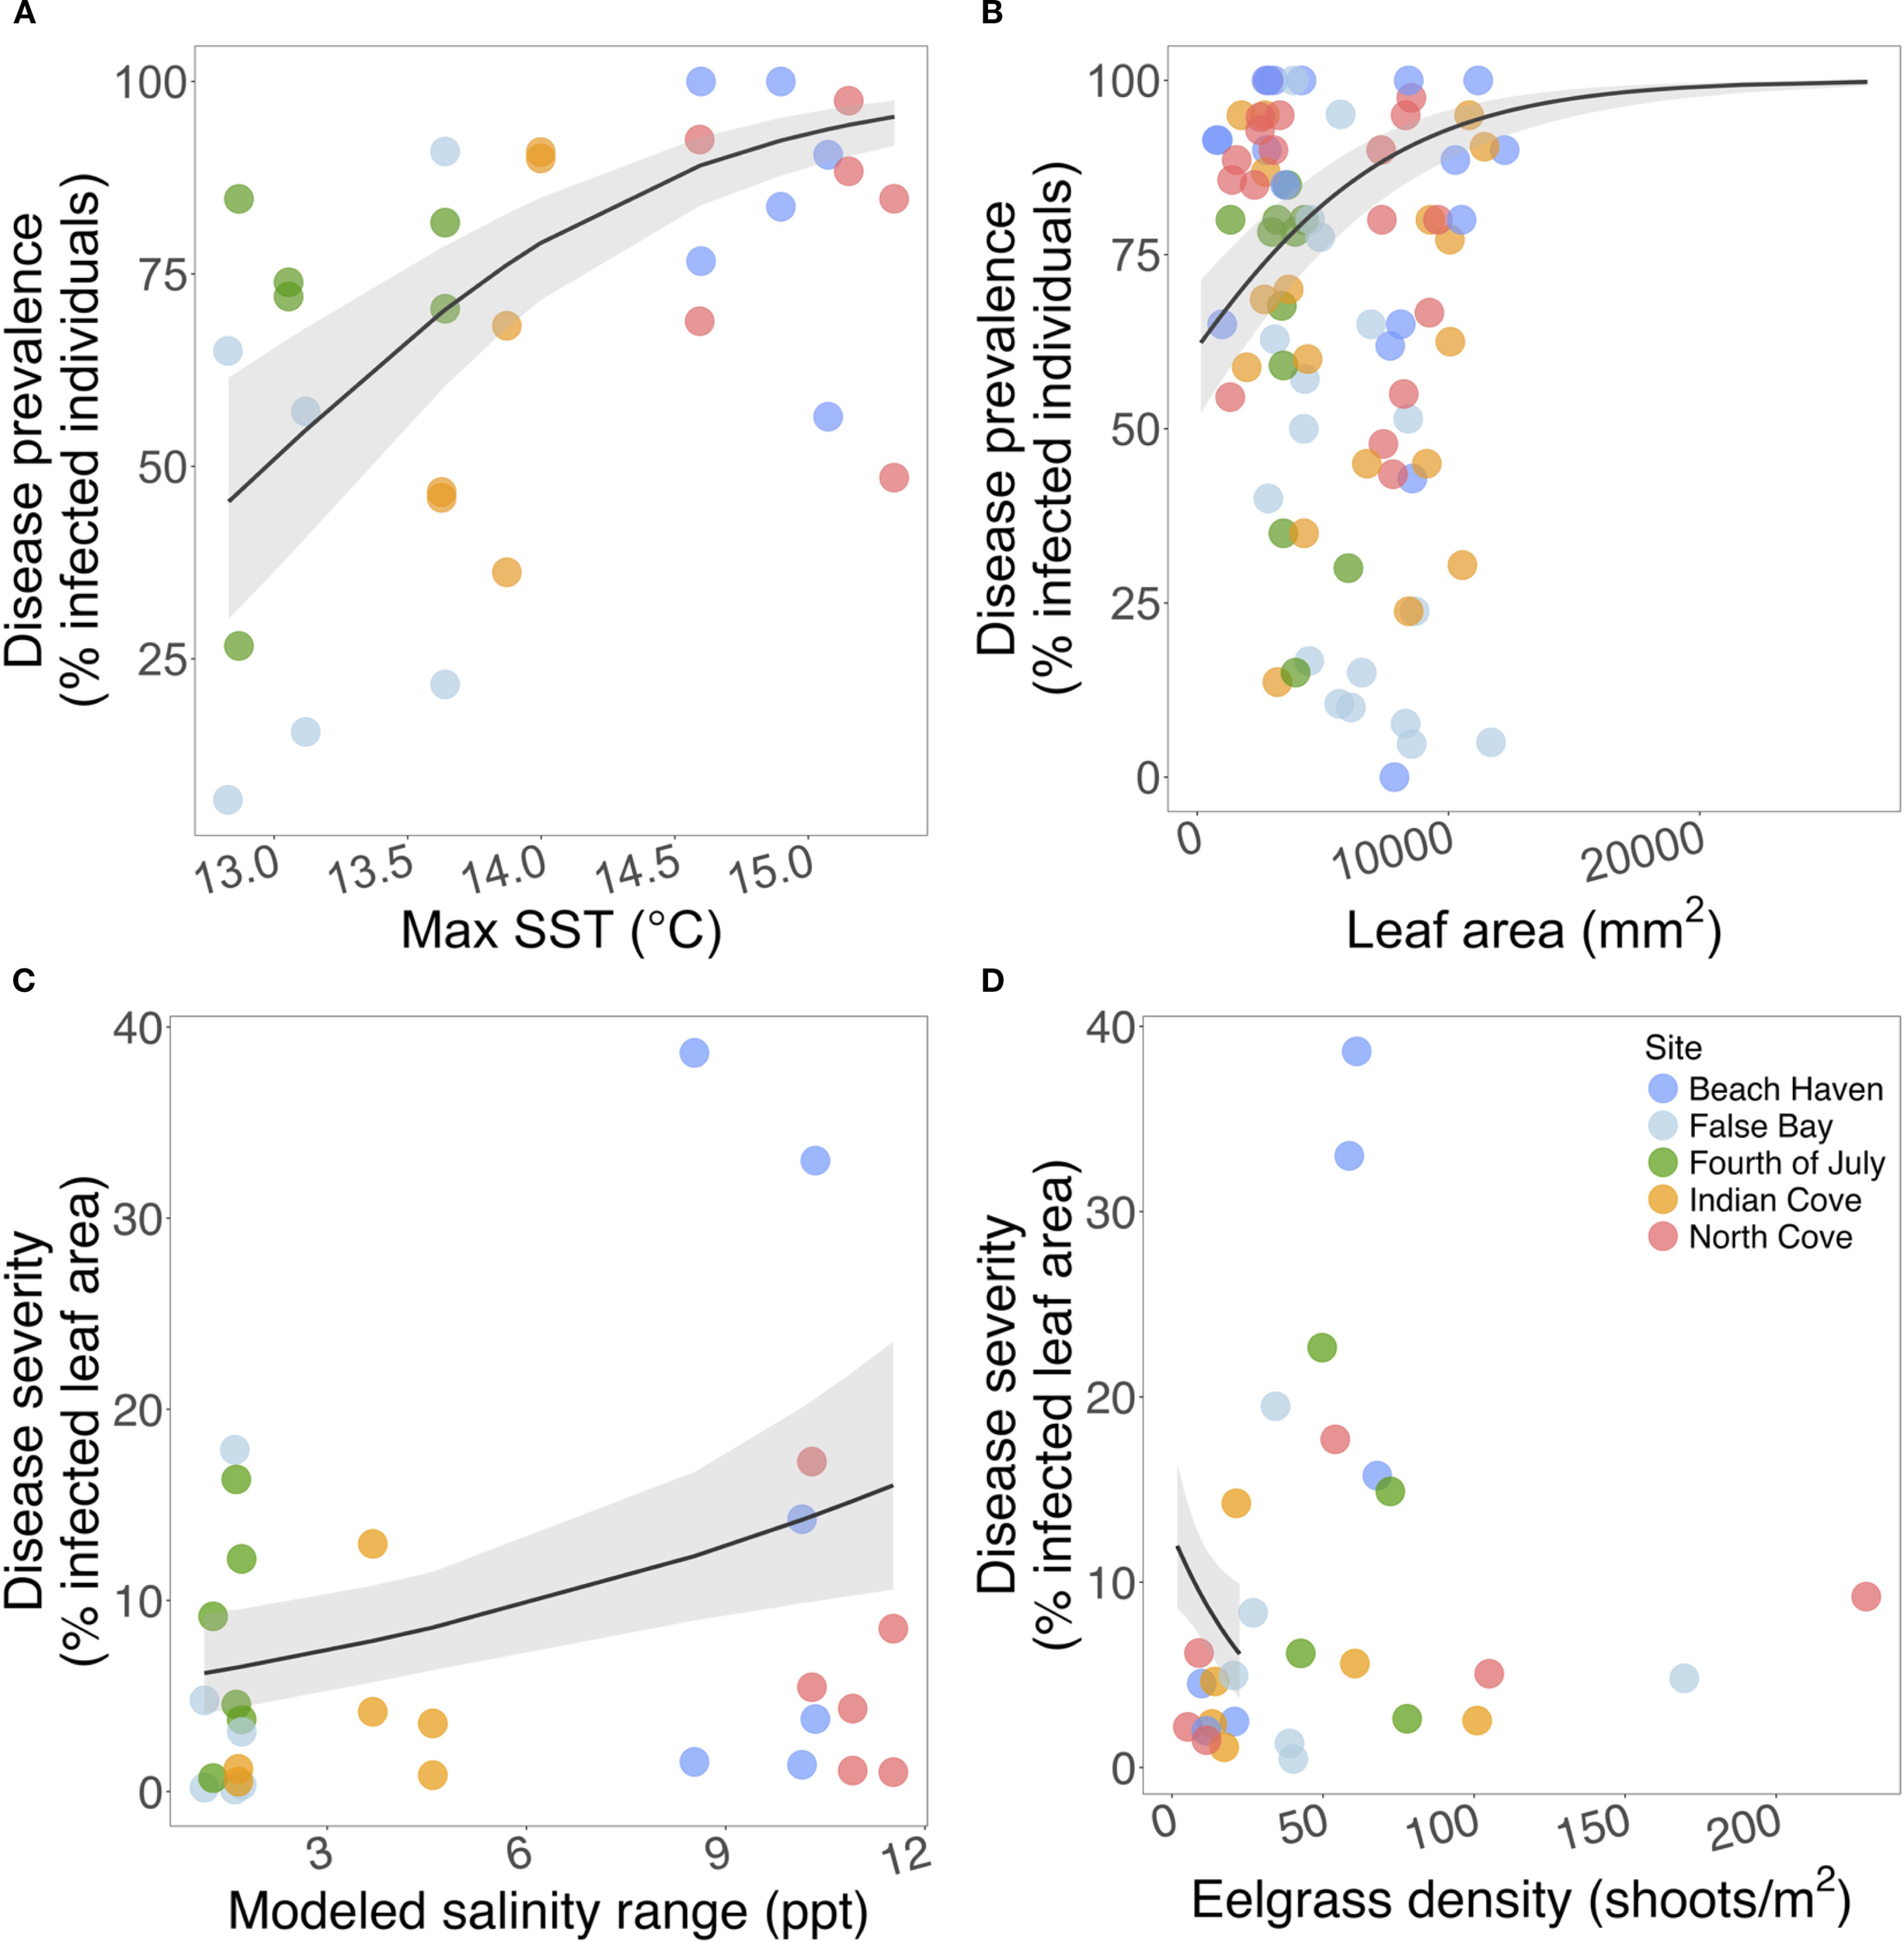
Environmental and biometric predictors of seagrass wasting disease, including (A) maximum sea surface temperatures, (B) leaf area, (C) modeled salinity range, and (D) eelgrass density. (A, C, D) site-level temperature, salinity, density, and disease (n=30); (B) transect-level mean leaf area and disease (n=90). Black lines indicate predicted relationships from best-fitting disease prevalence and severity models; grey shading shows 95% CI. For a similar plot colored by depth, please see Supplementary Figure S9.
Severity was significantly reduced in subtidal meadows (β = -1.27, SE = 0.18, p < 0.0001), positively associated with salinity range (β = 0.42, SE = 0.13, p = 0.0018), and inversely associated with mean eelgrass densities (β = -0.14, SE = 0.063, p = 0.021); severity also significantly varied between years. Fixed effects explained 30.5% of the variance in severity (n = 1351 leaves; Supplementary Figure S8; Supplementary Table S9). The association between eelgrass densities and severity was more prominent between depths (Supplementary Figure S9). Variable salinities at North Cove and Beach Haven also coincided with high disease levels; both sites consistently had the highest intertidal disease prevalence and severity across all 3 years (Figure 4; Supplementary Table S2).
4 Discussion
With recent large eelgrass declines quantified in the relatively pristine waters of the San Juan Islands (Aoki et al., 2023), this study aimed to understand environmental drivers of disease and identify possible refugia. Our parallel surveys of shallow, intertidal meadows adjacent to deeper, subtidal ones allowed us to evaluate the vulnerability of intertidal eelgrass and the potential of subtidal habitats as refugia from pathogenic and environmental stressors.
4.1 Eelgrass disease and density patterns
Across 2,288 eelgrass leaves surveyed over three years, disease prevalence and severity were consistently lower in subtidal than intertidal meadows, supporting our first hypothesis and previous findings of healthier, deeper eelgrass (Groner et al., 2014; Jakobsson-Thor et al., 2018; Graham et al., 2023, 2024). In intertidal meadows, we observed higher disease prevalence and severity, warmer temperatures, and reduced eelgrass densities in 2018, followed by cooler temperatures, lower disease, and increased densities in 2019. These patterns underscore links among warming, disease, and eelgrass declines, highlighting the need to understand climate impacts on eelgrass health and resilience.
4.2 Environmental characterization: temperature and salinity
Mean daily in situ temperatures tracked remote-sensed temperatures, but the former better captured fine-scale thermal stressors, including air exposure at low tides. Higher disease prevalence and severity in intertidal meadows supported our second hypothesis that thermal exposure drives disease susceptibility. Experimental work has also shown that warmer temperatures intensify disease (ex: 11-fold increase in disease severity and aboveground biomass loss; Egea et al., 2024). Likewise, deeper meadows were more resilient to marine heatwaves (Aoki et al., 2020) and meadows with tidal cooling (adjacent to cooler ocean inlets) had higher densities and reduced heat stress (Berger et al., 2024). Together, these findings demonstrate temperature is a key driver of eelgrass health and disease.
Modeled daily salinities were also linked to disease severity. The broad salinity range (16.4-30.8 ppt) at northern sites likely reflects Fraser River influence, which intensifies in summer with glacial melt and carries high nutrient and sediment loads south into the San Juan Islands (Yin et al., 1997). Incorporating modeled salinities into our analyses strengthens evidence that freshwater inputs and reduced salinity shape eelgrass disease risk.
4.3 Temperature x salinity x density models
Our models identified maximum remote-sensed sea surface temperature as a key predictor of disease prevalence, consistent with prior work showing thermal stress increases eelgrass susceptibility to L. zosterae and facilitates pathogen transmission (Dawkins et al., 2018; Jakobsson-Thor et al., 2020; Groner et al., 2021; Aoki et al., 2022, 2023; Graham et al., 2023). In contrast, salinity range was a strong predictor of disease severity, suggesting that variable salinity amplifies lesion development once infection is established. Together, these results suggest a two-stage process: hot ocean temperatures may trigger disease outbreaks, while salinity variability could exacerbate disease severity. These findings emphasize the need to consider multiple environmental stressors that may differentially influence seagrass wasting disease risk versus progression.
Maximum temperature and salinity range were important predictors of disease, though both were highly correlated with related metrics (temperature range and minimum salinity, respectively). This collinearity made it difficult to fully disentangle which specific metric drove disease patterns—maximum temperature or temperature range, minimum salinity or salinity range. Nonetheless, our analyses consistently pointed to two stressors—ocean warming (heatwaves or temperature fluctuation) and salinity fluctuations (freshwater pulses)—as central to meadow-scale wasting disease.
The association between high disease severity and variable salinities suggests that stable salinities may support healthier eelgrass. While eelgrass tolerates wide salinity ranges, fluctuations can reduce growth and photosynthesis (Sola et al., 2020) and seedling establishment (Xu et al., 2016). Salinity variability can also interact with other stressors: river plumes can deliver nutrients and sediments that reduce light availability. Low salinity combined with high nutrients dramatically reduced eelgrass growth and increased mortality in both mesocosm experiments (Villazán et al., 2015) and biomass models for Puget Sound, WA (Thom et al., 2018).
Intertidal meadows may be especially vulnerable, as their shallower depth exposes them more directly to freshwater inputs and other stressors (high temperatures, desiccation, wave turbulence, runoff) than subtidal habitats. As with thermal stressors, acute salinity fluctuations may affect eelgrass and L. zosterae differently than chronic exposure, emphasizing the need to consider the timing and duration of salinity stress (Sola et al., 2020). Overall, salinity appears to be an important driver of disease progression and should be incorporated into eelgrass site suitability assessments for conservation and restoration in the Salish Sea (Thom et al., 2018).
Unlike temperature, where links to wasting disease are well-established, salinity-disease associations have been less consistent. Danish eelgrass in brackish areas were less impacted by historic disease outbreaks than coastal meadows (Rasmussen, 1977). Lab and field studies reported smaller lesions and lower disease prevalence at lower salinities (McKone and Tanner, 2009; Jakobsson-Thor et al., 2018). Together, these reports indicate salinity effects vary but should remain a focus in eelgrass stressor assessments. A recent study also examined the impacts of estimated minimum sea surface salinity on wasting disease prevalence in Pacific and Atlantic Ocean eelgrass, but did not find a strong association between salinity and disease prevalence (Schenk et al., 2025).
Eelgrass density was inversely associated with disease severity: denser meadows had reduced disease severity. Though this contrasts with disease ecology theory, which predicts that higher density should increase transmission, it is aligns with prior Northeast Pacific surveys (Graham et al., 2023). One explanation is that high disease severity reduces clonal growth and kills shoots, leaving patchier meadows with fewer, more infected plants. Experimental work demonstrating disease reduced leaf growth and belowground starch reserves (Graham et al., 2021) supports the idea that disease impacts extend from individuals to entire meadows.
Many (a)biotic conditions influence disease dynamics beyond those captured here. For example, intertidal eelgrass in the Northeast Pacific experiences desiccation stress during summertime low tides (Aoki et al., 2023), and water currents likely influence the spread of L. zosterae via seawater and direct contact (Eisenlord et al., 2024). Our work highlights not only the role of temperature and salinity on seagrass wasting disease dynamics, but also the need to integrate diverse in situ, remote-sensed, and modeled data. Tools like the Salish Sea Model provide insights into how essential marine habitats respond to environmental changes and are especially important amidst shifting ecological baselines. Pairing such models with eelgrass health metrics could help identify more climate resilient sites for protection.
This study underscores the lower risk of environmental and disease stressors in deeper, subtidal meadows than intertidal ones. Following a heatwave in 2021, intertidal meadows at Beach Haven, Fourth of July, and Indian Cove declined by over 90%, demonstrating their extreme vulnerability (Aoki et al., 2023). Severe losses in the San Juan Islands (Aoki et al., 2023; Graham et al., 2024) emphasize the need to prioritize factors that support eelgrass resilience—like depth, light, and shoreline aspect—in future management. Given the Salish Sea’s transboundary nature, effective conservation requires sustained collaboration among agencies, nonprofit organizations, tribes, universities, and others (Sobocinski, 2021), similar to international efforts like the Seagrass Consortium (Lilley, 2024).
Statements
Data availability statement
Data and R scripts for these analyses are publicly available via the Cornell University eCommons Repository (https://doi.org/10.7298/gw50-gx83).
Author contributions
OG: Conceptualization, Data curation, Formal Analysis, Investigation, Methodology, Project administration, Validation, Visualization, Writing – original draft, Writing – review & editing. LA: Data curation, Investigation, Project administration, Writing – review & editing, Methodology. BR: Data curation, Formal Analysis, Investigation, Software, Writing – review & editing. ME: Data curation, Investigation, Project administration, Writing – review & editing. CDH: Conceptualization, Funding acquisition, Investigation, Methodology, Resources, Supervision, Writing – review & editing.
Funding
The author(s) declare financial support was received for the research and/or publication of this article. The following generous funds supported this work: Cornell University’s Atkinson Center for Sustainable Biodiversity Fund, Cornell Engaged Graduate Student Grant, Cornell Sigma Xi Research Grant, Andrew W. Mellon Student Research Grant, Dr. Carolyn Haugen, University of Washington Friday Harbor Labs Graduate Research Fellowship Endowment, Women Diver’s Hall of Fame Scholarship in Marine Conservation to OJG; NSF-REU and Susan Lynch support for the Cornell Ocean Research Apprenticeship for Lynch Scholars to summer research assistants Corinne Klohmann, Sukanya Dayal, Coco Dawkins, and Jack Novack; NSF awards OCE-1829921 and OCE-2109607 to CDH; Washington SeaGrant (grant no. NA18OAR4170095) to Carolyn Friedman, Colleen Burge, and CDH; NSF CompSustNet: Expanding the Horizons of Computational Sustainability (grant no. 1522054) to Carla P. Gomes.
Acknowledgments
We would like to thank our terrific field research assistants Phoebe Dawkins, Coco Dawkins, James Lee, Miranda Winningham, Jack Novack, Willem Weertman, Alex Lowe, Joey Ullman, Abigail Ames, Julia Kobelt, Christopher Wells, Maggie Shields, and Wendel Raymond. We would also like to thank Erika Mudrak for her valuable statistical advice and Dr. Parker MacCready for providing modeled salinity data from the LiveOcean Salish Sea Model. Finally, we would like to thank Dr. Carla P. Gomes for her terrific leadership and support in developing EeLISA and via the NSF ComSustNet grant.
Conflict of interest
The authors declare that the research was conducted in the absence of any commercial or financial relationships that could be construed as a potential conflict of interest.
Generative AI statement
The author(s) declare that no Generative AI was used in the creation of this manuscript.
Any alternative text (alt text) provided alongside figures in this article has been generated by Frontiers with the support of artificial intelligence and reasonable efforts have been made to ensure accuracy, including review by the authors wherever possible. If you identify any issues, please contact us.
Publisher’s note
All claims expressed in this article are solely those of the authors and do not necessarily represent those of their affiliated organizations, or those of the publisher, the editors and the reviewers. Any product that may be evaluated in this article, or claim that may be made by its manufacturer, is not guaranteed or endorsed by the publisher.
Supplementary material
The Supplementary Material for this article can be found online at: https://www.frontiersin.org/articles/10.3389/fmars.2025.1542488/full#supplementary-material
References
1
Altizer S. Ostfeld R. S. Johnson P. T. J. Kutz S. Harvell C. D. (2013). Climate change and infectious diseases: from evidence to a predictive framework. Science341, 514–519. doi: 10.1126/science.1239401
2
Aoki L. R. McGlathery K. J. Wiberg P. L. Al-Haj A . (2020). Depth Affects Seagrass Restoration Success and Resilience to Marine Heat Wave Disturbance. Estuaries and Coasts43, 316–328. doi: 10.1007/s12237-019-00685-0
3
Aoki L. R. Rappazzo B. Beatty D. S. Domke L. K. Eckert G. L. Eisenlord M. E. et al . (2022). Disease surveillance by artificial intelligence links eelgrass wasting disease to ocean warming across latitudes. Limnol. Oceanogr.67, 1577–1589. doi: 10.1002/lno.12152
4
Aoki L. Yang B. Graham O. Gomes C. Rappazzo B. Hawthorne T. et al . (2023). UAV high-resolution imaging and disease surveys combine to quantify climate-related decline in seagrass meadows. Oceanography. 36 (1), 38–39. doi: 10.5670/oceanog.2023.s1.12
5
Barth J. A. Allen S. E. Dever E. P. Dewey R. K. Evans W. Feely R. A. et al . (2019). Better regional ocean observing through cross-national cooperation: A case study from the Northeast Pacific. Front. Mar. Sci.6. doi: 10.3389/fmars.2019.00093
6
Barton K. (2022). MuMIn: Multi-Model Inference. Available online at: https://CRAN.R-project.org/package=MuMIn (Accessed August 1, 2024).
7
Berger A. Berg P. McGlathery K. Aoki L. Kerns K. (2024). Eelgrass meadow response to heat stress. II. Impacts of ocean warming and marine heatwaves measured by novel metrics. Mar. Ecol. Prog. Ser.736, 47–62. doi: 10.3354/meps14588
8
Brooks M. Kristensen K. van Benthem K. Magnusson A. Berg C. Nielsen A. et al . (2017). glmmTMB balances speed and flexibility among packages for zero-inflated generalized linear mixed modeling. R J.9, 378–400. doi: 10.32614/RJ-2017-066
9
Burge C. A. Hershberger P. K. (2020). “ Climate change can drive marine diseases,” in Marine Disease Ecology. Eds. BehringerD. C.SillimanB. R.LaffertyK. D. ( Oxford University Press, Oxford, United Kingdom), 83–94.
10
Christiaen B. Ferrier L. Dowty P. Gaeckle J. Berry H. (2022). Puget Sound Seagrass Monitoring Report, monitoring year 2018-2020 (Olympia, Washington: Washington State Department of Natural Resources). Available online at: https://www.dnr.wa.gov/publications/aqr_nrsh_svmp_monitoring_report_2018_2020_data.pdf (Accessed August 1, 2024).
11
Dawkins P. Eisenlord M. Yoshioka R. Fiorenza E. Fruchter S. Giammona F. et al . (2018). Environment, dosage, and pathogen isolate moderate virulence in eelgrass wasting disease. Dis. Aquat. Org.130, 51–63. doi: 10.3354/dao03263
12
Dunic J. C. Brown C. J. Connolly R. M. Turschwell M. P. Côté I. M. (2021). Long-term declines and recovery of meadow area across the world’s seagrass bioregions. Glob. Change Biol.27, 4096–4109. doi: 10.1111/gcb.15684
13
Egea L. G. Jiménez-Ramos R. English M. K. Tomas F. Mueller R. S. (2024). Marine heatwaves and disease alter community metabolism and DOC fluxes on a widespread habitat-forming seagrass species (Zostera marina). Sci. Total Environ.957, 177820. doi: 10.1016/j.scitotenv.2024.177820
14
Eisenlord M. E. Agnew M. V. Winningham M. Lobo O. J. Vompe A. D. Wippel B. et al . (2024). High infectivity and waterborne transmission of seagrass wasting disease. R. Soc Open Sci.11, 240663. doi: 10.1098/rsos.240663
15
Jakobsson-Thor S. Brakel J. Toth G. B. Pavia H. (2020). Complex Interactions of Temperature, Light and Tissue Damage on Seagrass Wasting Disease in Zostera marina. Front. Mar. Sci.7, 575183. doi: 10.3389/fmars.2020.575183
16
Giddings S. N. MacCready P. Hickey B. M. Banas N. S. Davis K. A. Siedlecki S. A. et al . (2014). Hindcasts of potential harmful algal bloom transport pathways on the Pacific Northwest coast. J. Geophys. Res. Oceans119, 2439–2461. doi: 10.1002/2013JC009622
17
Graham O. J. Aoki L. R. Stephens T. Stokes J. Dayal S. Rappazzo B. et al . (2021). Effects of seagrass wasting disease on eelgrass growth and belowground sugar in natural meadows. Front. Mar. Sci.8. doi: 10.3389/fmars.2021.768668
18
Graham O. J. Harvell D. Christiaen B. Gaeckle J. Aoki L. R. Ratliff B. et al . (2024). Taking the pulse of resilience in conserving seagrass meadows. Integr. And Comp. Biol.64 (3), 816–826. doi: 10.1093/icb/icae120
19
Graham O. J. Stephens T. Rappazzo B. Klohmann C. Dayal S. Adamczyk E. M. et al . (2023). Deeper habitats and cooler temperatures moderate a climate-driven seagrass disease. Phil. Trans. R. Soc B378, 20220016. doi: 10.1098/rstb.2022.0016
20
Groner M. Burge C. Couch C. Kim C. Siegmund G. Singhal S. et al . (2014). Host demography influences the prevalence and severity of eelgrass wasting disease. Dis. Aquat. Org.108, 165–175. doi: 10.3354/dao02709
21
Groner M. Burge C. Kim C. Rees E. Van Alstyne K. Yang S. et al . (2016). Plant characteristics associated with widespread variation in eelgrass wasting disease. Dis. Aquat. Org.118, 159–168. doi: 10.3354/dao02962
22
Groner M. Eisenlord M. Yoshioka R. Fiorenza E. Dawkins P. Graham O. et al . (2021). Warming sea surface temperatures fuel summer epidemics of eelgrass wasting disease. Mar. Ecol. Prog. Ser. 679, 47–58. doi: 10.3354/meps13902
23
Harrison P. G. Durance C. (1992). Variation in clonal structure in an eelgrass (Zostera marina) meadow on the Pacific coast of Canada. Can. J. Bot.70, 653–657. doi: 10.1139/b92-085
24
Hartig F. (2021). DHARMa: residual diagnostics for hierarchical (Multi-level/mixed) regression models. Available online at: https://CRAN.R-project.org/package=DHARMa (Accessed August 1, 2024).
25
Harvell C. D. Mitchell C. Ward J. Altizer S. Dobson A. Ostfeld R. et al . (2002). Climate warming and disease risks for terrestrial and marine biota. Science296, 2158–2162. doi: 10.1126/science.1063699
26
Harvell C. D. Montecino-Latorre D. Caldwell J. M. Burt J. M. Bosley K. Keller A. et al . (2019). Disease epidemic and a marine heat wave are associated with the continental-scale collapse of a pivotal predator (Pycnopodia helianthoides). Sci. Adv.5, eaau7042. doi: 10.1126/sciadv.aau7042
27
Hope R. M. (2022). Rmisc: Ryan Miscellaneous. Available online at: https://CRAN.R-project.org/package=Rmisc (Accessed August 1, 2024).
28
Jakobsson-Thor S. Toth G. Brakel J. Bockelmann A. Pavia H. (2018). Seagrass wasting disease varies with salinity and depth in natural Zostera marina populations. Mar. Ecol. Prog. Ser.587, 105–115. doi: 10.3354/meps12406
29
Kassambara A. (2020). ggpubr: “ggplot2” Based publication ready plots. Available online at: https://CRAN.R-project.org/package=ggpubr (Accessed August 1, 2024).
30
Lenth R. V. (2021). emmeans: Estimated Marginal Means, aka Least-Squares Means. Available online at: https://cran.r-project.org/web/packages/emmeans/index.html (Accessed August 1, 2024).
31
Lilley R. (2024). The seagrass consortium: a unique partnership between scientists, social entrepreneurs, tech firms, and government officials to accelerate the scale and impact of seagrass restoration in Europe. Naples, Italy: World Seagrass Conference.
32
Ludecke (2021). performance: an R package for assessment, comparison, and testing of statistical models. J. Open Source Softw.6. doi: 10.21105/joss.03139
33
MacCready P. Geyer W. R. (2024). Estuarine exchange flow in the Salish Sea. JGR Oceans129, e2023JC020369. doi: 10.1029/2023JC020369
34
McKone K. Tanner C. (2009). Role of salinity in the susceptibility of eelgrass Zostera marina to the wasting disease pathogen Labyrinthula zosterae. Mar. Ecol. Prog. Ser.377, 123–130. doi: 10.3354/meps07860
35
Neuwirth (2014). RColorBrewer: ColorBrewer Palettes. Available online at: https://CRAN.R-project.org/package=RColorBrewer (Accessed August 1, 2024).
36
Newton J. MacCready P. Siedlecki S. Manalang D. Mickett J. Alin S. et al . (2021). Multi-stressor observations and modeling to build understanding of and resilience to the coastal impacts of climate change. Oceanog34 (4), 86–87. doi: 10.5670/oceanog.2021.supplement.02-31
37
Qin L.-Z. Kim S. H. Song H.-J. Kim H. G. Suonan Z. Kwon O. et al . (2020). Long-term variability in the flowering phenology and intensity of the temperate seagrass Zostera marina in response to regional sea warming. Ecol. Indic.119, 106821. doi: 10.1016/j.ecolind.2020.106821
38
Rappazzo B. H. Eisenlord M. E. Graham O. J. Aoki L. R. Dawkins P. D. Harvell D. et al . (2021). EeLISA: combating global warming through the rapid analysis of eelgrass wasting disease. AAAI-21, IAAI-21, EAAI-21 Proceedings. 10. doi: 10.1609/aaai.v35i17.17779
39
Rasmussen E. (1977). “ The wasting disease of eelgrass (Zostera marina) and its effects on environmental factors and fauna,” in Seagrass Ecosystems: A Scientific Perspective. Eds. McRoyC. P.HelfferichC. ( Marcel Dekker, New York), 1–52.
40
R Core Team (2023). R: A language and environment for statistical computing. Available online at: https://www.R-project.org/ (Accessed August 1, 2024).
41
Sawall Y. Ito M. Pansch C. (2021). Chronically elevated sea surface temperatures revealed high susceptibility of the eelgrass Zostera marinato winter and spring warming. Limnol. Oceanogr.66, 4112–4124. doi: 10.1002/lno.11947
42
Schenck F. R. Baum J. K. Boyer K. E. Duffy J. E. Fodrie F. J. Gaeckle J. Hanley T. C. et al . (2025) Host traits and temperature predict biogeographical variation in seagrass disease prevalence. Proc. R. Soc. B292, 20243055. doi: 10.1098/rspb.2024.3055
43
Sobocinski K. L. (2021). State of the Salish Sea ( Salish Sea Institute, Western Washington University). doi: 10.25710/vfhb-3a69
44
Sola J. Sorrell B. K. Olesen B. Søndergaard Jørgensen M. Lund-Hansen L. C. (2020). Acute and prolonged effects of variable salinity on growth, gas exchange and photobiology of eelgrass (Zostera marina L.). Aquat. Bot.165, 103236. doi: 10.1016/j.aquabot.2020.103236
45
Thom R. Gaeckle J. Buenau K. Borde A. Vavrinec J. Aston L. et al . (2018). Eelgrass (Zostera marina) restoration in Puget Sound: development of a site suitability assessment process. Restor. Ecol.26, 1066–1074. doi: 10.1111/rec.12702
46
Thom R. Southard S. Borde A. (2014). Climate-linked mechanisms driving spatial and temporal variation in eelgrass (Zostera marina L.) growth and assemblage structure in Pacific Northwest Estuaries, U.S.A. J. Coast. Res.68, 1–11. doi: 10.2112/SI68-001.1
47
Vega Thurber R. Mydlarz L. D. Brandt M. Harvell D. Weil E. Raymundo L. et al . (2020). Deciphering coral disease dynamics: integrating host, microbiome, and the changing environment. Front. Ecol. Evol.8. doi: 10.3389/fevo.2020.575927
48
Villazán B. Salo T. Brun F. Vergara J. Pedersen M. (2015). High ammonium availability amplifies the adverse effect of low salinity on eelgrass Zostera marina. Mar. Ecol. Prog. Ser.536, 149–162. doi: 10.3354/meps11435
49
Warton D. I. Hui F. K. C. (2011). The arcsine is asinine: the analysis of proportions in ecology. Ecology92, 3–10. doi: 10.1890/10-0340.1
50
Wei T. Simko V. (2021). R package “corrplot”: Visualization of a Correlation Matrix. Available online at: https://github.com/taiyun/corrplot (Accessed August 1, 2024).
51
Wickham H. (2016). ggplot2: Elegant Graphics for Data Analysis (New York: Springer-Verlag).
52
Xu S. Zhou Y. Wang P. Wang F. Zhang X. Gu R. (2016). Salinity and temperature significantly influence seed germination, seedling establishment, and seedling growth of eelgrass Zostera marina L. PeerJ4, e2697. doi: 10.7717/peerj.2697
53
Yin K. Goldblatt R. Harrison P. StJohn M. Clifford P. Beamish R. (1997). Importance of wind and river discharge in influencing nutrient dynamics and phytoplankton production in summer in the central Strait of Georgia. Mar. Ecol. Prog. Ser.161, 173–183. doi: 10.3354/meps161173
54
Zuur A. F. Ieno E. N. Walker N. Saveliev A. A. Smith G. M. (2009). Mixed effects models and extensions in ecology with R (New York, NY: Springer New York). doi: 10.1007/978-0-387-87458-6
Summary
Keywords
salinity, marine heatwave, heat stress, resilience, Zostera marina , ocean warming, seagrass wasting disease
Citation
Graham OJ, Aoki LR, Rappazzo B, Eisenlord M and Harvell CD (2025) Deeper eelgrass meadows are refugia from disease and environmental stressors. Front. Mar. Sci. 12:1542488. doi: 10.3389/fmars.2025.1542488
Received
09 December 2024
Accepted
10 September 2025
Published
17 October 2025
Volume
12 - 2025
Edited by
Letitia (tish) Conway-Cranos, Washington Department of Fish and Wildlife, United States
Reviewed by
W. Judson Kenworthy, Independent Researcher, Beaufort, NC, United States; Nicole Knight, University of British Columbia, Canada
Updates
Copyright
© 2025 Graham, Aoki, Rappazzo, Eisenlord and Harvell.
This is an open-access article distributed under the terms of the Creative Commons Attribution License (CC BY). The use, distribution or reproduction in other forums is permitted, provided the original author(s) and the copyright owner(s) are credited and that the original publication in this journal is cited, in accordance with accepted academic practice. No use, distribution or reproduction is permitted which does not comply with these terms.
*Correspondence: Olivia J. Graham, ojg5@cornell.edu
† Present address: Lillian R. Aoki, Department of Environmental Studies, University of Oregon, Eugene, OR, United States; Morgan Eisenlord, Shannon Point Marine Center, Western Washington University, Anacortes, WA, United States
Disclaimer
All claims expressed in this article are solely those of the authors and do not necessarily represent those of their affiliated organizations, or those of the publisher, the editors and the reviewers. Any product that may be evaluated in this article or claim that may be made by its manufacturer is not guaranteed or endorsed by the publisher.