Abstract
Introduction:
Anatomical information is crucial in marine biology research. Traditionally, destructive techniques, such as slice imaging of the sample, are used to image the inside of the sample, which are unsuitable for valuable or rare specimens. While energy-integrating detectors computed tomography (CT) can provide non-invasive anatomical information, it suffers from limitations such as low spatial resolution, high noise, and an inability to analyze material composition.
Methods:
Photon-counting (PC) micro-CT offers a promising alternative, enabling noninvasive imaging of both internal and external structures of marine organisms. Various species, including bivalves, conchs, and fish otoliths, were scanned using this advanced technology. The influence of different tube voltages on image quality is analyzed in this paper.
Results:
One of the key capabilities of PC micro-CT is the reconstruction of virtual monoenergetic images and material decomposition, which has been tested. To further enhance soft tissue visualization, iodixanol solution was employed for contrast imaging.
Discussion:
PC micro-CT provides high resolution both in non-contrast images and iodixanol-contrast images which digestive tracts and glands can be seen. Material decomposition of fish otoliths revealed the characteristic wheel-shaped distribution of calcium content. PC micro-CT has the potential ability for imaging marine organisms and promising future in broader utilization in marine biological research.
1 Introduction
The ocean covers approximately 70% of the Earth’s surface and contains a wide variety of organisms, with more than 200,000 marine species found so far. In recent years, many studies have focused on the spatial and temporal distribution of marine organisms, and the anatomical characteristics of marine organisms are one of the important factors (Whitman et al., 1998; Tittensor et al., 2010; Hatton et al., 2021). In the classification tasks, reliably capturing and recording the true three-dimensional imaging of organisms is essential (Metscher, 2009; Vasileiadou et al., 2024). Accurate three-dimensional imaging of marine organisms is also indispensable in the study of its morphology (Naleway et al., 2016; Putnam et al., 2017).Therefore, detailed internal and external anatomical features of marine organisms can provide reliable evidence for most marine biology studies. However, due to the large differences in anatomical features among various species and the detailed and complex internal structures, it is difficult to capture detailed features. Therefore, how to carry out accurate three-dimensional visualization of marine organisms is a major challenge.
In 3D imaging, the primary goal is to represent both the external texture of the sample and its internal structure, which cannot be directly observed. Imaging the internal structure of opaque samples presents a significant challenge. Before X-ray computed tomography was widespread, samples were often sliced and viewed under an optical or electron microscope (Maeno et al., 2019). However, this method is not suitable for rare specimens such as fossils, and the preparation of the samples is labor-intensive and technically difficult. To address these issues, X-ray computed tomography (CT) has emerged as a non-destructive alternative (Lukeneder, 2012). In CT imaging, X-ray sources and detectors rotate around the sample to capture projected data from multiple angles (Boistel et al., 2011). The CT images have been reconstructed using some algorithms, allowing researchers to view the internal structure of the organism without damage. CT has certain limitations in soft tissue imaging, so contrast imaging is usually used in biological and medical imaging (Metscher, 2009; Degenhardt et al., 2010). Often high number compounds, such as barium sulfate (Caron et al., 2023), gadolinium (Cockman et al., 2006), gold nanoparticles, and iodine (Lee et al., 2014), can be used as contrast agents. These materials enhance tissues and structures that would otherwise be indistinguishable, making them essential tools in bioimaging research. Energy-integrating detectors CT (EID CT) suffers from limitations such as low spatial resolution, high noise, and an inability to analyze material composition, because of its disability in detecting single photon energy.
Photon-counting CT (PCCT) leverages the advantages of photon-counting detectors (PCDs) to significantly enhance imaging performance. By directly counting and measuring individual photon energies, PCDs improve spatial resolution by filtering out low-energy photons, effectively reducing electronic noise and enhancing the visualization of fine details (Shikhaliev, 2005). Additionally, PCCT improves density resolution by enabling the reconstruction of virtual monoenergetic images (Flohr et al., 2020). Since tissues and materials absorb X-rays differently across energy ranges, this capability optimizes contrast for tissues with similar densities. Compared to energy-integrating detector (EID) CT, PCCT can achieve the same image quality with fewer X-rays, indirectly reducing radiation dose (Lundqvist et al., 2001). Moreover, it facilitates material decomposition and quantitative analysis of elements such as iodine and calcium, which is particularly valuable for contrast imaging (McCollough et al., 2023). Its ability to perform multi-contrast imaging in a single scan further enhances its versatility. For instance, when a mixture of iodine and calcium is injected, PCCT can separately reconstruct water, iodine, and calcium maps for further analysis (Richtsmeier et al., 2020).
In this study, the newly developed PC micro-CT was used to investigate various marine organisms and examine the imaging performance of different protocols, including spatial and density resolution. In addition, virtual monoenergetic images were reconstructed for certain samples, enabling detailed quantitative analysis of noise levels, signal-to-noise ratio (SNR) and contrast noise ratio (CNR) over different energy ranges. In order to improve the density resolution, iodixanol immersion imaging was applied to obtain a higher quality imaging. Three-dimensional reconstructions of selected samples were generated, offering a more intuitive and detailed visualization of the internal structures of marine organisms.
2 Materials and methods
2.1 Specimen sampling
Ten different kinds of marine organisms were collected for PC micro-CT scanning, and each sample was randomly selected to ensure the reliability of data. These species include: Ruditapes philippinarum, Pectinidae, Strombus canarium, Turritella, Venus verrucosa, Ruditapes lusoria, Sinonovacula constricta, Conus, Meretrix lusoria, and Otolith. These species were selected to represent a diverse array of marine organism forms, encompassing various classes and providing a comprehensive view of their structural variations, including soft tissues and shells. These marine organisms were collected from Sanya, Hainan, China (18°09′34″–18°37′27″ N, 108°56′30″–109°48′28″ E) in March–April 2024. All samples were rinsed with water to remove surface debris. After cleaning, some samples were dried and scanned directly, while others underwent iodine contrast imaging (with the staining process detailed in Section 2.6). As CT is a non-invasive imaging technique, these procedures did not cause any structural damage to the samples.
2.2 Photon-counting micro-CT system
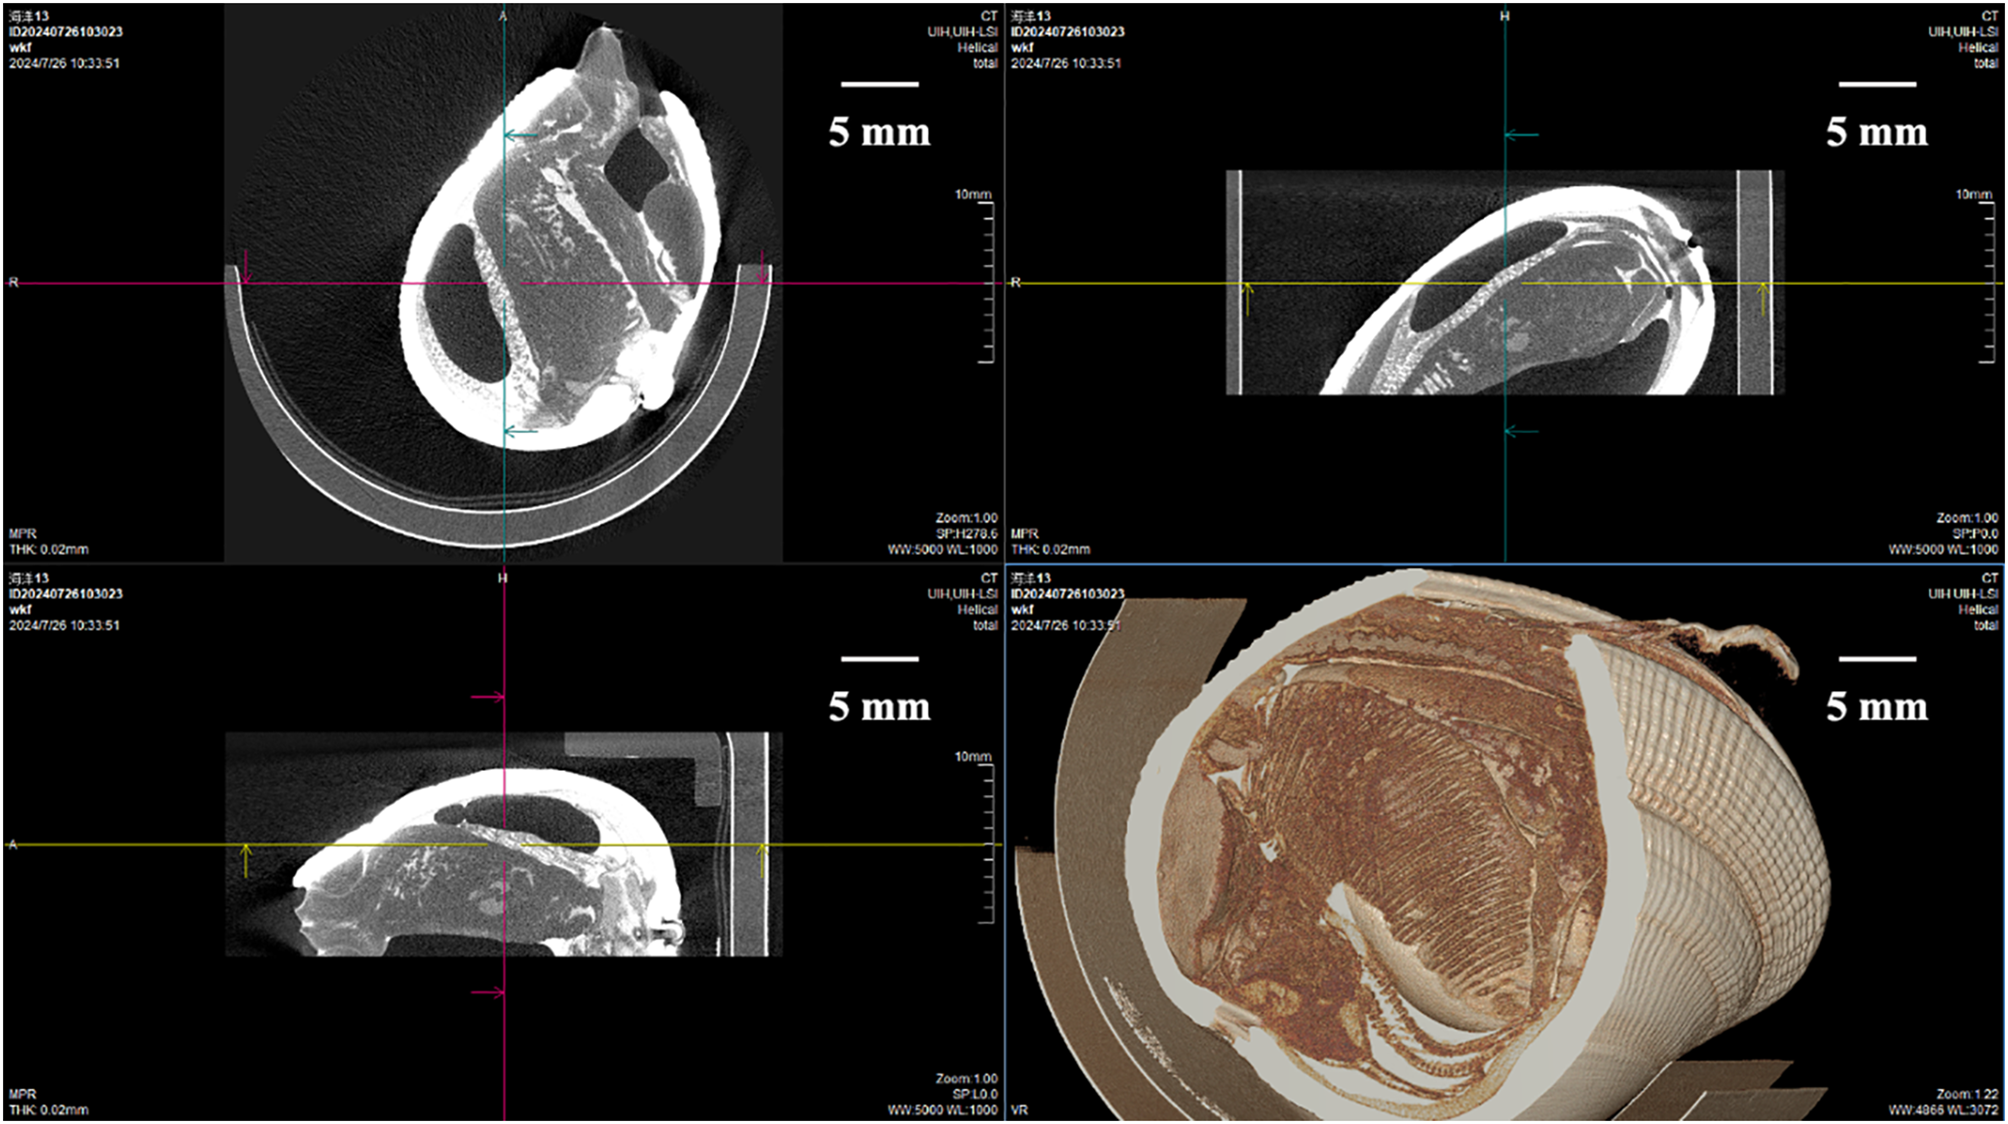
The developed PC micro-CT (PCD MicroCT, United Imaging Life Science Instrument, China) is mainly composed of tube with micro-focus radiation source, a collimator, a photon counting detector, a gantry mechanical system and a console Personal Computer. The scanning sample is positioned between the tube and the detector, where the beam rotates around the sample to collect projection data from different angles. Following numerical correction, geometric correction and image reconstruction are performed using the commercial toolbox from United Imaging Life Science Instrument. Figure 1 shows the system of PC micro-CT.
Figure 1
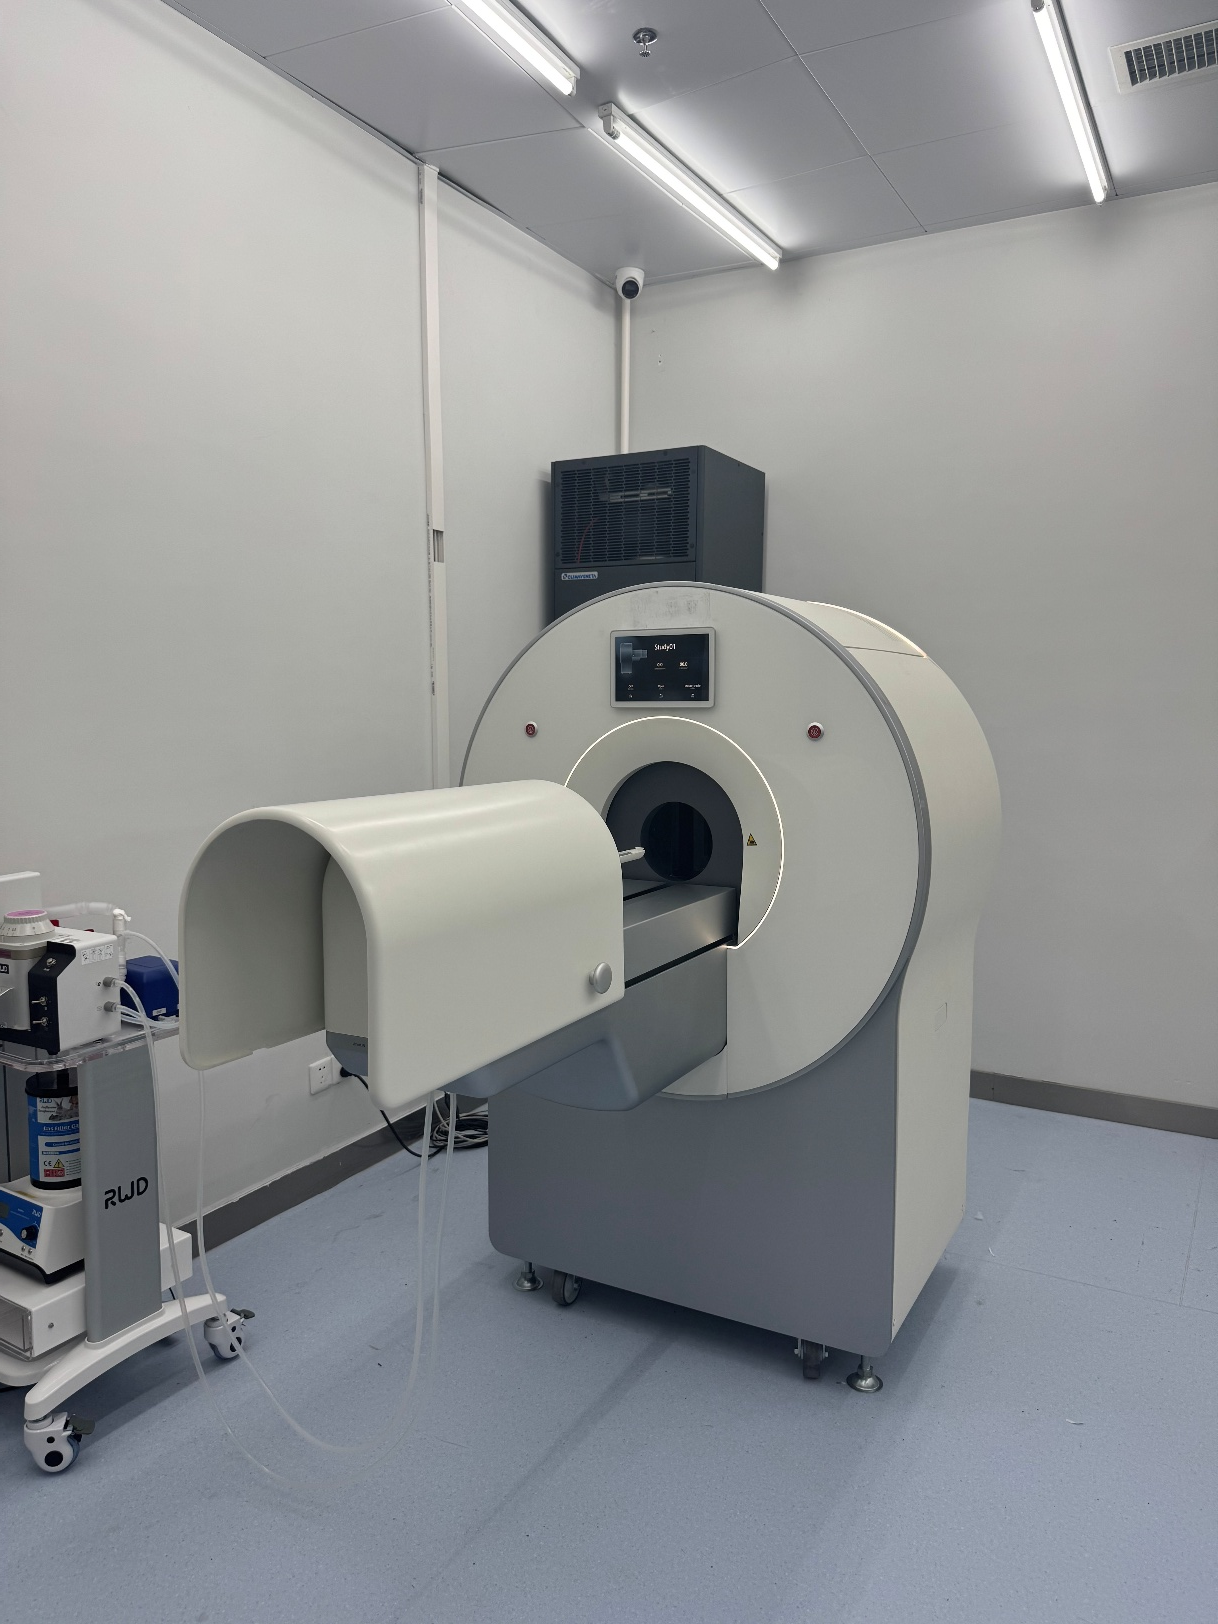
Photon-counting micro-CT system.
PC micro-CT offers ultra-high spatial resolution of up to 11 microns and provides greater tissue contrast than EID micro-CT. It can detect a 20-micron target even when the contrast between the target and background is only 10%. In practical applications, micro-CT is widely used for imaging laboratory mice, enabling detailed bone microstructure analysis (Yu et al., 2022) and tumor imaging (Li et al., 2024). Its high imaging speed allows a full 360-degree projection in just 6 seconds, with an angular resolution of 0.1 degrees, making it suitable for lung and heart imaging in mice. Iodine contrast imaging is another common application, providing sufficient resolution to visualize cerebral blood vessels (Ghanavati et al., 2014), including the circle of Willis. Given the superior imaging performance of PC micro-CT, this study employed it to image marine organisms.
2.3 Scan protocol and reconstruction
The PC micro-CT system includes three commonly used animal chambers: an ex vivo chamber, a mouse chamber, and a rat chamber. These support three field-of-view (FOV) sizes—20 × 20 mm, 35 × 35 mm, and 100 × 100 mm—which are adjusted by modifying the distances between the X-ray source, rotation center, and detector. The corresponding minimum detectable object sizes are 11 µm, 23 µm, and 53 µm, respectively. For imaging marine specimens, we selected the 35 × 35 mm FOV based on sample size and resolution requirements.
Key imaging parameters, including tube voltage, additional filtration, and exposure time, must also be configured. Tube voltage and filter type determine the X-ray energy distribution. Higher tube voltage increases the average photon energy, enabling penetration of denser materials. Thicker and denser filters shift the X-ray spectrum toward higher energies by removing low-energy photons, which helps reduce radiation dose and minimize noise caused by low-energy X-rays. Exposure time and the number of projections per rotation influence the system’s effective tube current. Longer exposure times result in greater X-ray output, more projection data, and reconstructed images that better approximate the actual structure.
Beyond these conventional imaging parameters, the photon-counting detector allows energy threshold settings, classifying detected X-ray photons into high- and low-energy categories to reconstruct separate high- and low-energy images. Given the interdependence of various parameters, the system provides preset imaging protocols, each comprising a specific combination of settings. In this study, we used three protocols: H_HighResolution_60kV, H_SoftTissue_80kV, and H_HighDensity_100kV, with detailed parameters listed in Table 1.
Table 1
| Scanning Parameters | H_HighResolution_60kV | H_SoftTissue_80kV | H_HighDensity_100kV |
|---|---|---|---|
| Tube Voltage | 60 kVp | 80 kVp | 100 kVp |
| Filter | 0.5mm Al | 0.5 mm Al | 1 mm Al + 0.3 mm Cu |
| Single-angle Exposure Time | 105 ms | 55 ms | 45 ms |
| Field of view | 35 cm | 35 cm | 35 cm |
| Low Energy Threshold | 15–35 keV | 15–30 keV | 15–40 keV |
| High Energy Threshold | >35 keV | >30 keV | >40 keV |
Photon-counting micro-CT scan protocols.
2.4 Monoenergetic images and material decomposition
Post-processing was conducted using in-house developed Micro-PCCT Toolkit on a dedicated workstation. The photon-counting detectors in the system allow for the simultaneous recording of both high- and low-energy photons during a single exposure, with user-defined energy thresholds. This capability enables the reconstruction of not only the total-energy image but also separate high- and low-energy images.
By scanning an object with two distinct energy thresholds, materials with different effective atomic numbers can be differentiated, as the same object exhibits varying CT values in high- and low-energy images. Material decomposition is performed based on these images, allowing the presentation of the image as a combination of two basic materials, thus creating maps such as iodine and water maps or calcium and water maps.
The results of material decomposition provide energy-independent information, which can be used to generate synthetic monoenergetic images—also known as virtual monoenergetic or virtual monochromatic images. These images simulate the appearance of a CT scan performed with a true monoenergetic photon source, such as a synchrotron X-ray source (McCollough et al., 2020). High- and low-energy images each offer specific advantages; for instance, soft tissues exhibit higher density resolution in low-energy images, whereas high-density materials, such as shells, are better resolved in high-energy images.
Pectinidae specimens were scanned using a PC micro-CT system under the H_SoftTissue_80kV protocol. The energy threshold of the photon-counting detector was set at 15 keV, with a low-energy window of 15–30 keV and a high-energy window above 30 keV. Monoenergetic images were reconstructed at 20, 40, 60, 80, 100, and 120 keV using the in-house developed PC Micro-CT Toolkit. Regions of interest (ROIs) were selected from high-density (shell) and low-density (soft tissue) regions to quantitatively compare the monoenergetic images with the polychromatic image.
To demonstrate the advantages of PC micro-CT, the same Otolith specimen was imaged using both PC micro-CT and an EID micro-CT system (uCT 788, United Imaging Life Science Instrument, China). For PC micro-CT, additional reconstructions were performed, including a monoenergetic image at 100 keV and calcium decomposition imaging. For EID micro-CT, the specimen was scanned using the C_Abdomen_CMOS protocol, with a tube voltage of 80 kVp and a 0.5 mm Al filter. Representative images from the four imaging modalities were selected, and CT value histograms were generated for quantitative comparison. These histograms were used to analyze differences between the imaging techniques.
2.5 Quantitative analysis of CT image
Representative images of various species at different tube voltages were selected for CT value analysis. A line profile along the x-axis of each image was extracted to quantitatively assess the CT values of both soft tissues and shells across the different tube voltages.
After reconstructing the monoenergetic images, several key parameters were measured to quantitatively evaluate image quality and facilitate comparison between virtual monoenergetic images. These parameters include image noise, signal-to-noise ratio (SNR), and contrast-to-noise ratio (CNR). A circular region of interest (ROI) was placed in both soft tissues and shells at three consecutive slices at the center of each component, avoiding partial volume artifacts. Image noise was defined as the standard deviation of CT values within the ROI (i.e., SDROI). The definitions of the three parameters are as follows (Cruz-Bastida et al., 2019; Rajagopal et al., 2021; Wang and Pelc, 2021):
where CTm refers to mean CT value of ROI, SDm refers to standard deviation of CT value of ROI, CTw refers to CT value of background, SDw refers to standard deviation of CT value of background.
2.6 Iodine-stained marine organisms imaging
Due to the lack of inherent contrast in soft tissue imaging, high atomic weight contrast agents, such as iodine-based agents, are commonly used in CT scans, particularly in clinical practice. To enhance soft tissue contrast, a higher concentration of iodixanol solution is often employed in clinical CT imaging. A 320 mg/mL iodixanol solution (Aladdin®) was used to immerse various marine organisms, based on concentrations commonly applied in clinical practice, with the aim of revealing finer details within soft tissue structures. The immersion durations were 1, 12, 24, and 36 hours. Additionally, material decomposition and virtual monoenergetic reconstruction were applied to images with higher imaging quality.
3 Results
3.1 Imaging performance of some marine organisms in PC micro-CT
Figure 2 shows some of the investigated marine organisms, including (A) Ruditapes philippinarum, (B) Pectinidae, (C) Strombus canarium, (D) Turritella, (E) Venus verrucosa, and (F) Ruditapes lusoria. Figure 2 shows the photos, scout images, and CT images of the corresponding species from left to right. In CT images, the shell, soft tissue, and air of the sample are clearly distinguishable. The hinge, which connecting the two valves of bivalves, appears as a distinct dividing line in the CT images of Ruditapes philippinarum (Figure 2A) and Venus verrucosa(Figure 2E). Quantitative analysis shows that the minimum detectable hinge clearance width is about 0.8 mm. The imaging of snails, such as Turritella (Figure 2D), has excellent resolution that the spiral structure is particularly clear. In addition to the internal structure, the high resolution of the tomographic images captures external textures, such as the fine patterns on the Ruditapes lusoria’s shell (Figure 2F). These results highlight the effectiveness of PC micro-CT in revealing the internal and external features of marine organisms with remarkable detail.
Figure 2
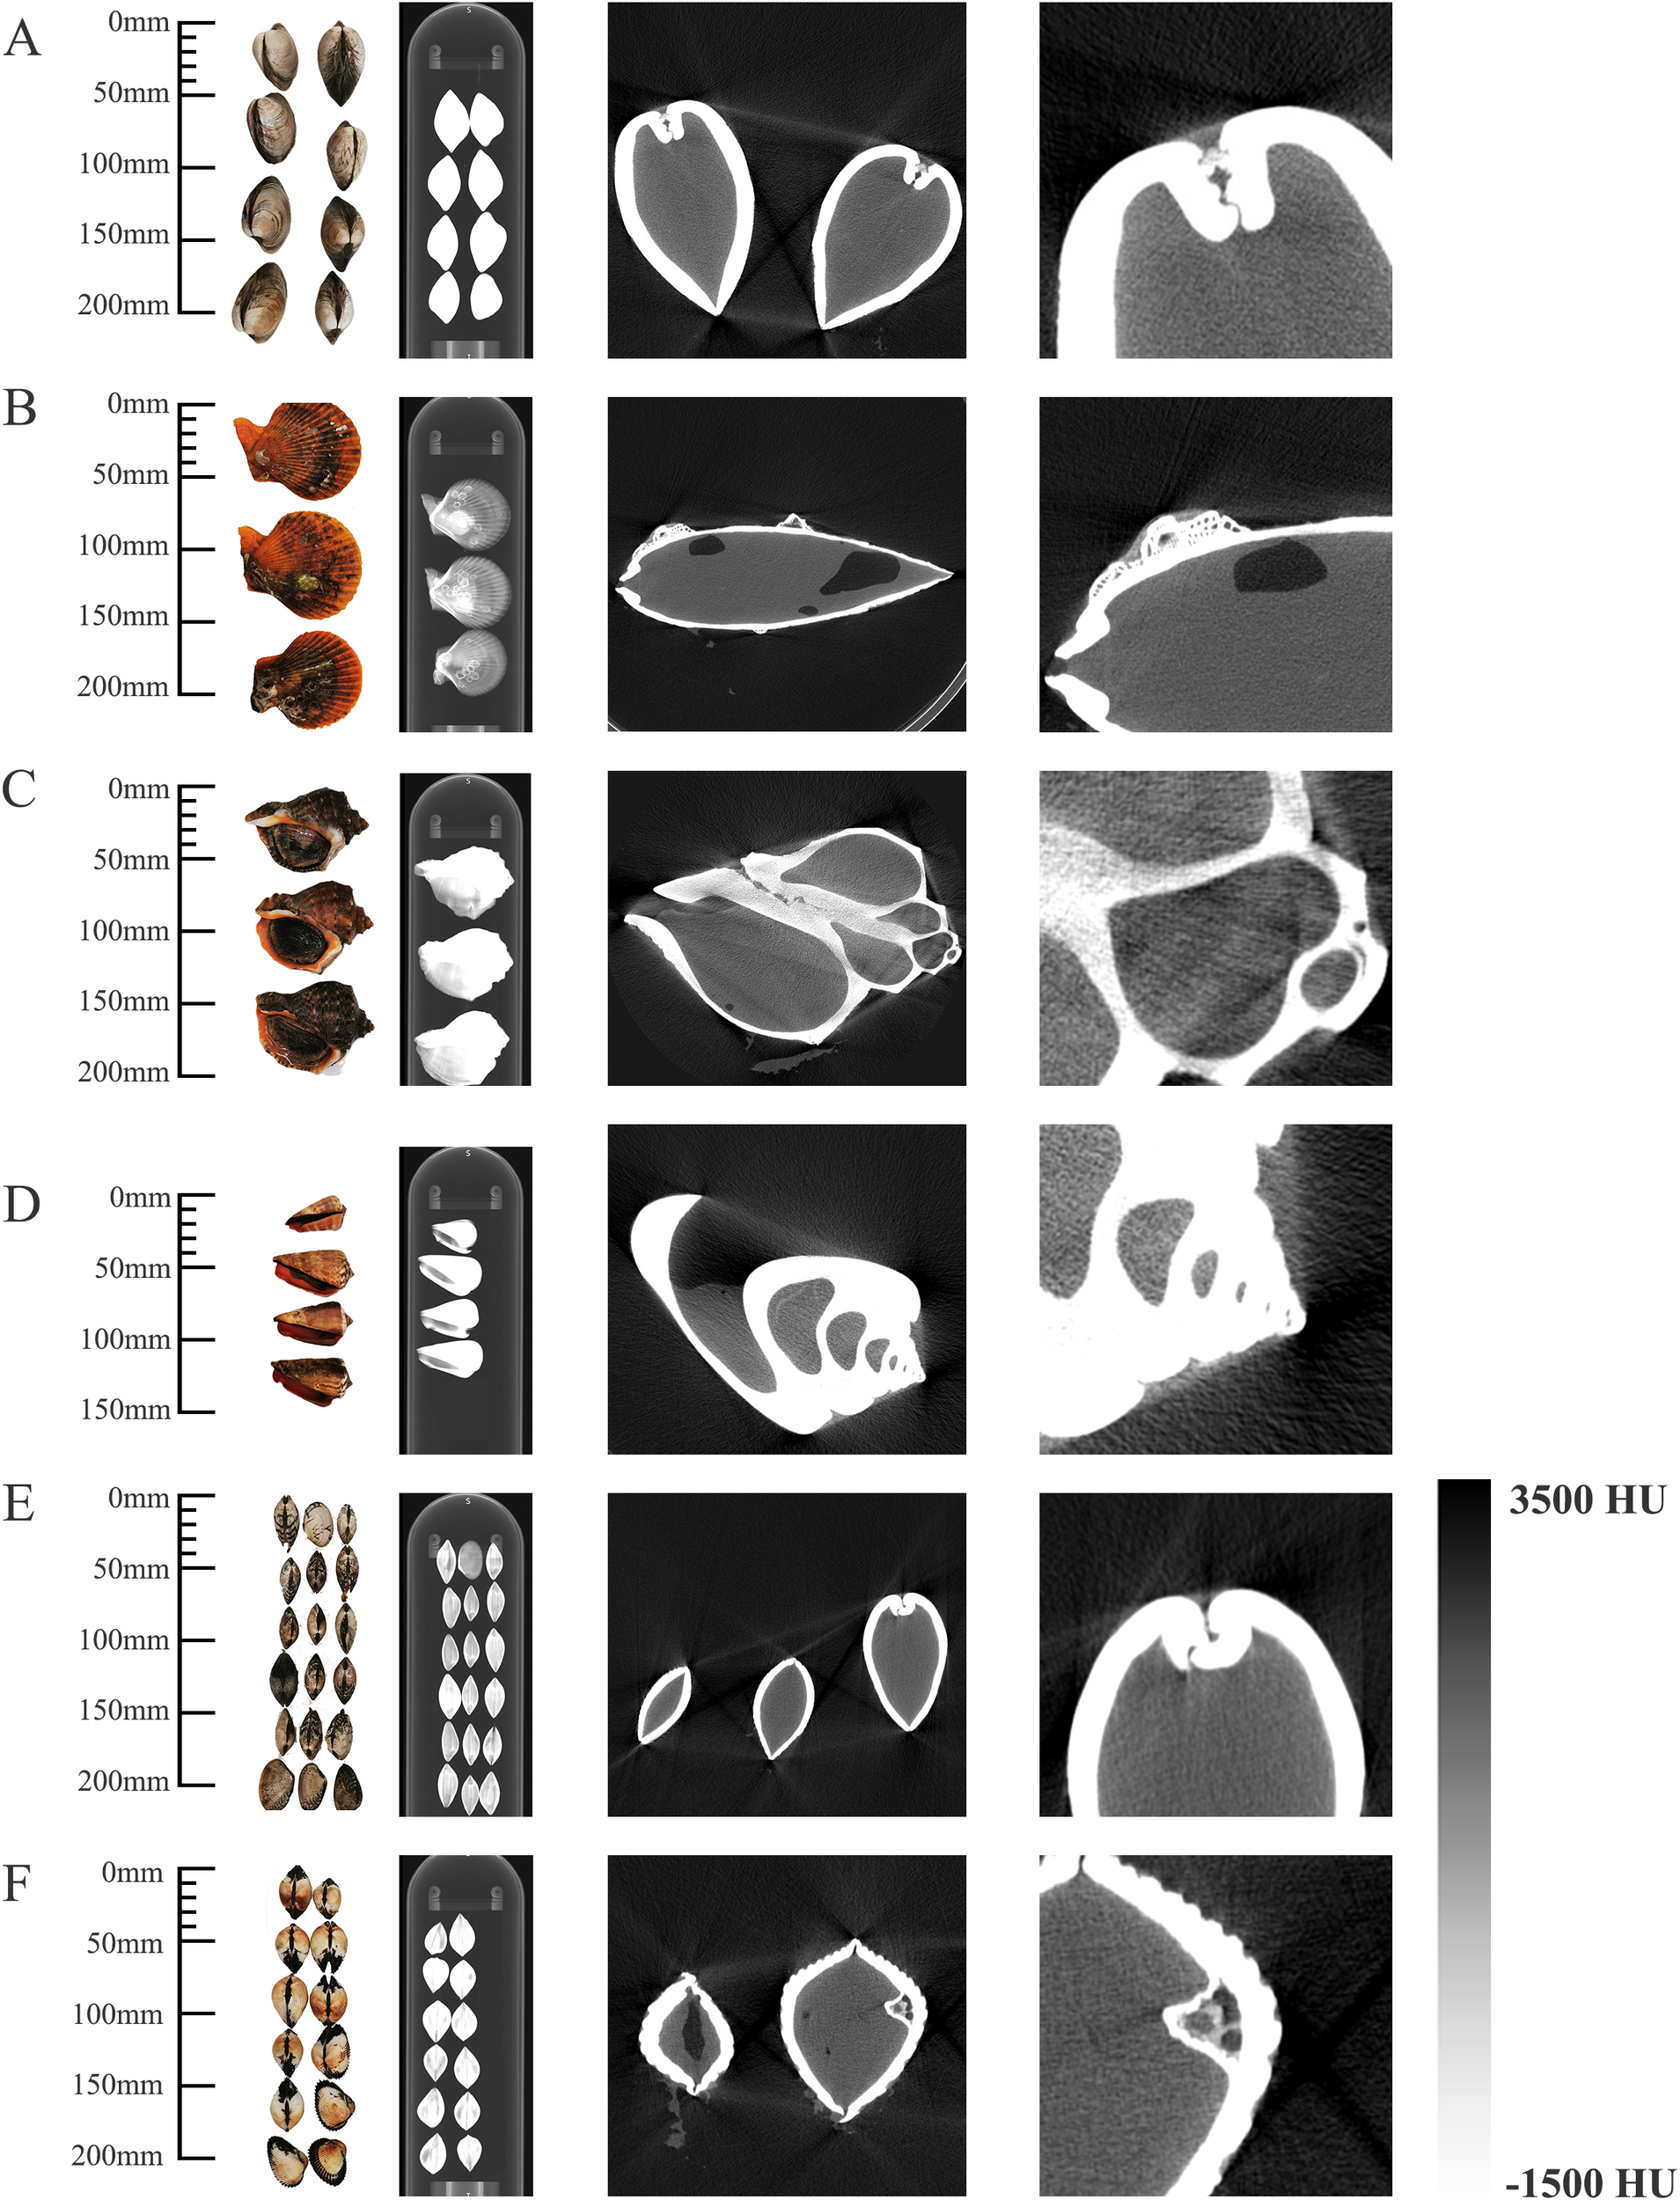
Representative images of (A)Ruditapes philippinarum, (B)Pectinidae, (C)Strombus canarium, (D)Turritella, (E)Venus verrucosa, and (F)Ruditapes lusoria. (Left to right: photographs, CT scout images, CT images from photon-counting micro-CT, and detailed reconstructions with high resolution).
To evaluate the optimal scanning protocol for imaging marine organisms, this study evaluated three different protocols by imaging the same species under varying tube voltage conditions. The images, presented in Figure 3, indicate that higher tube voltages effectively reduce beam hardening artifacts and enhance image resolution. For soft tissue, the 80 kVp protocol provides superior contrast resolution. The last column of Figure 3 displays the Hounsfield unit (HU) profile along the X-axis of the image. At 60 kVp, the HU variation between the shell and soft tissue reaches 9000. As the tube voltage increases, this variation gradually decreases. Additionally, a variation in the average HU values of the shells in samples Sinonovacula constricta and Strombus canarium is observed, with values of 9000 HU and 8000 HU, respectively, under 60 kVp.
Figure 3
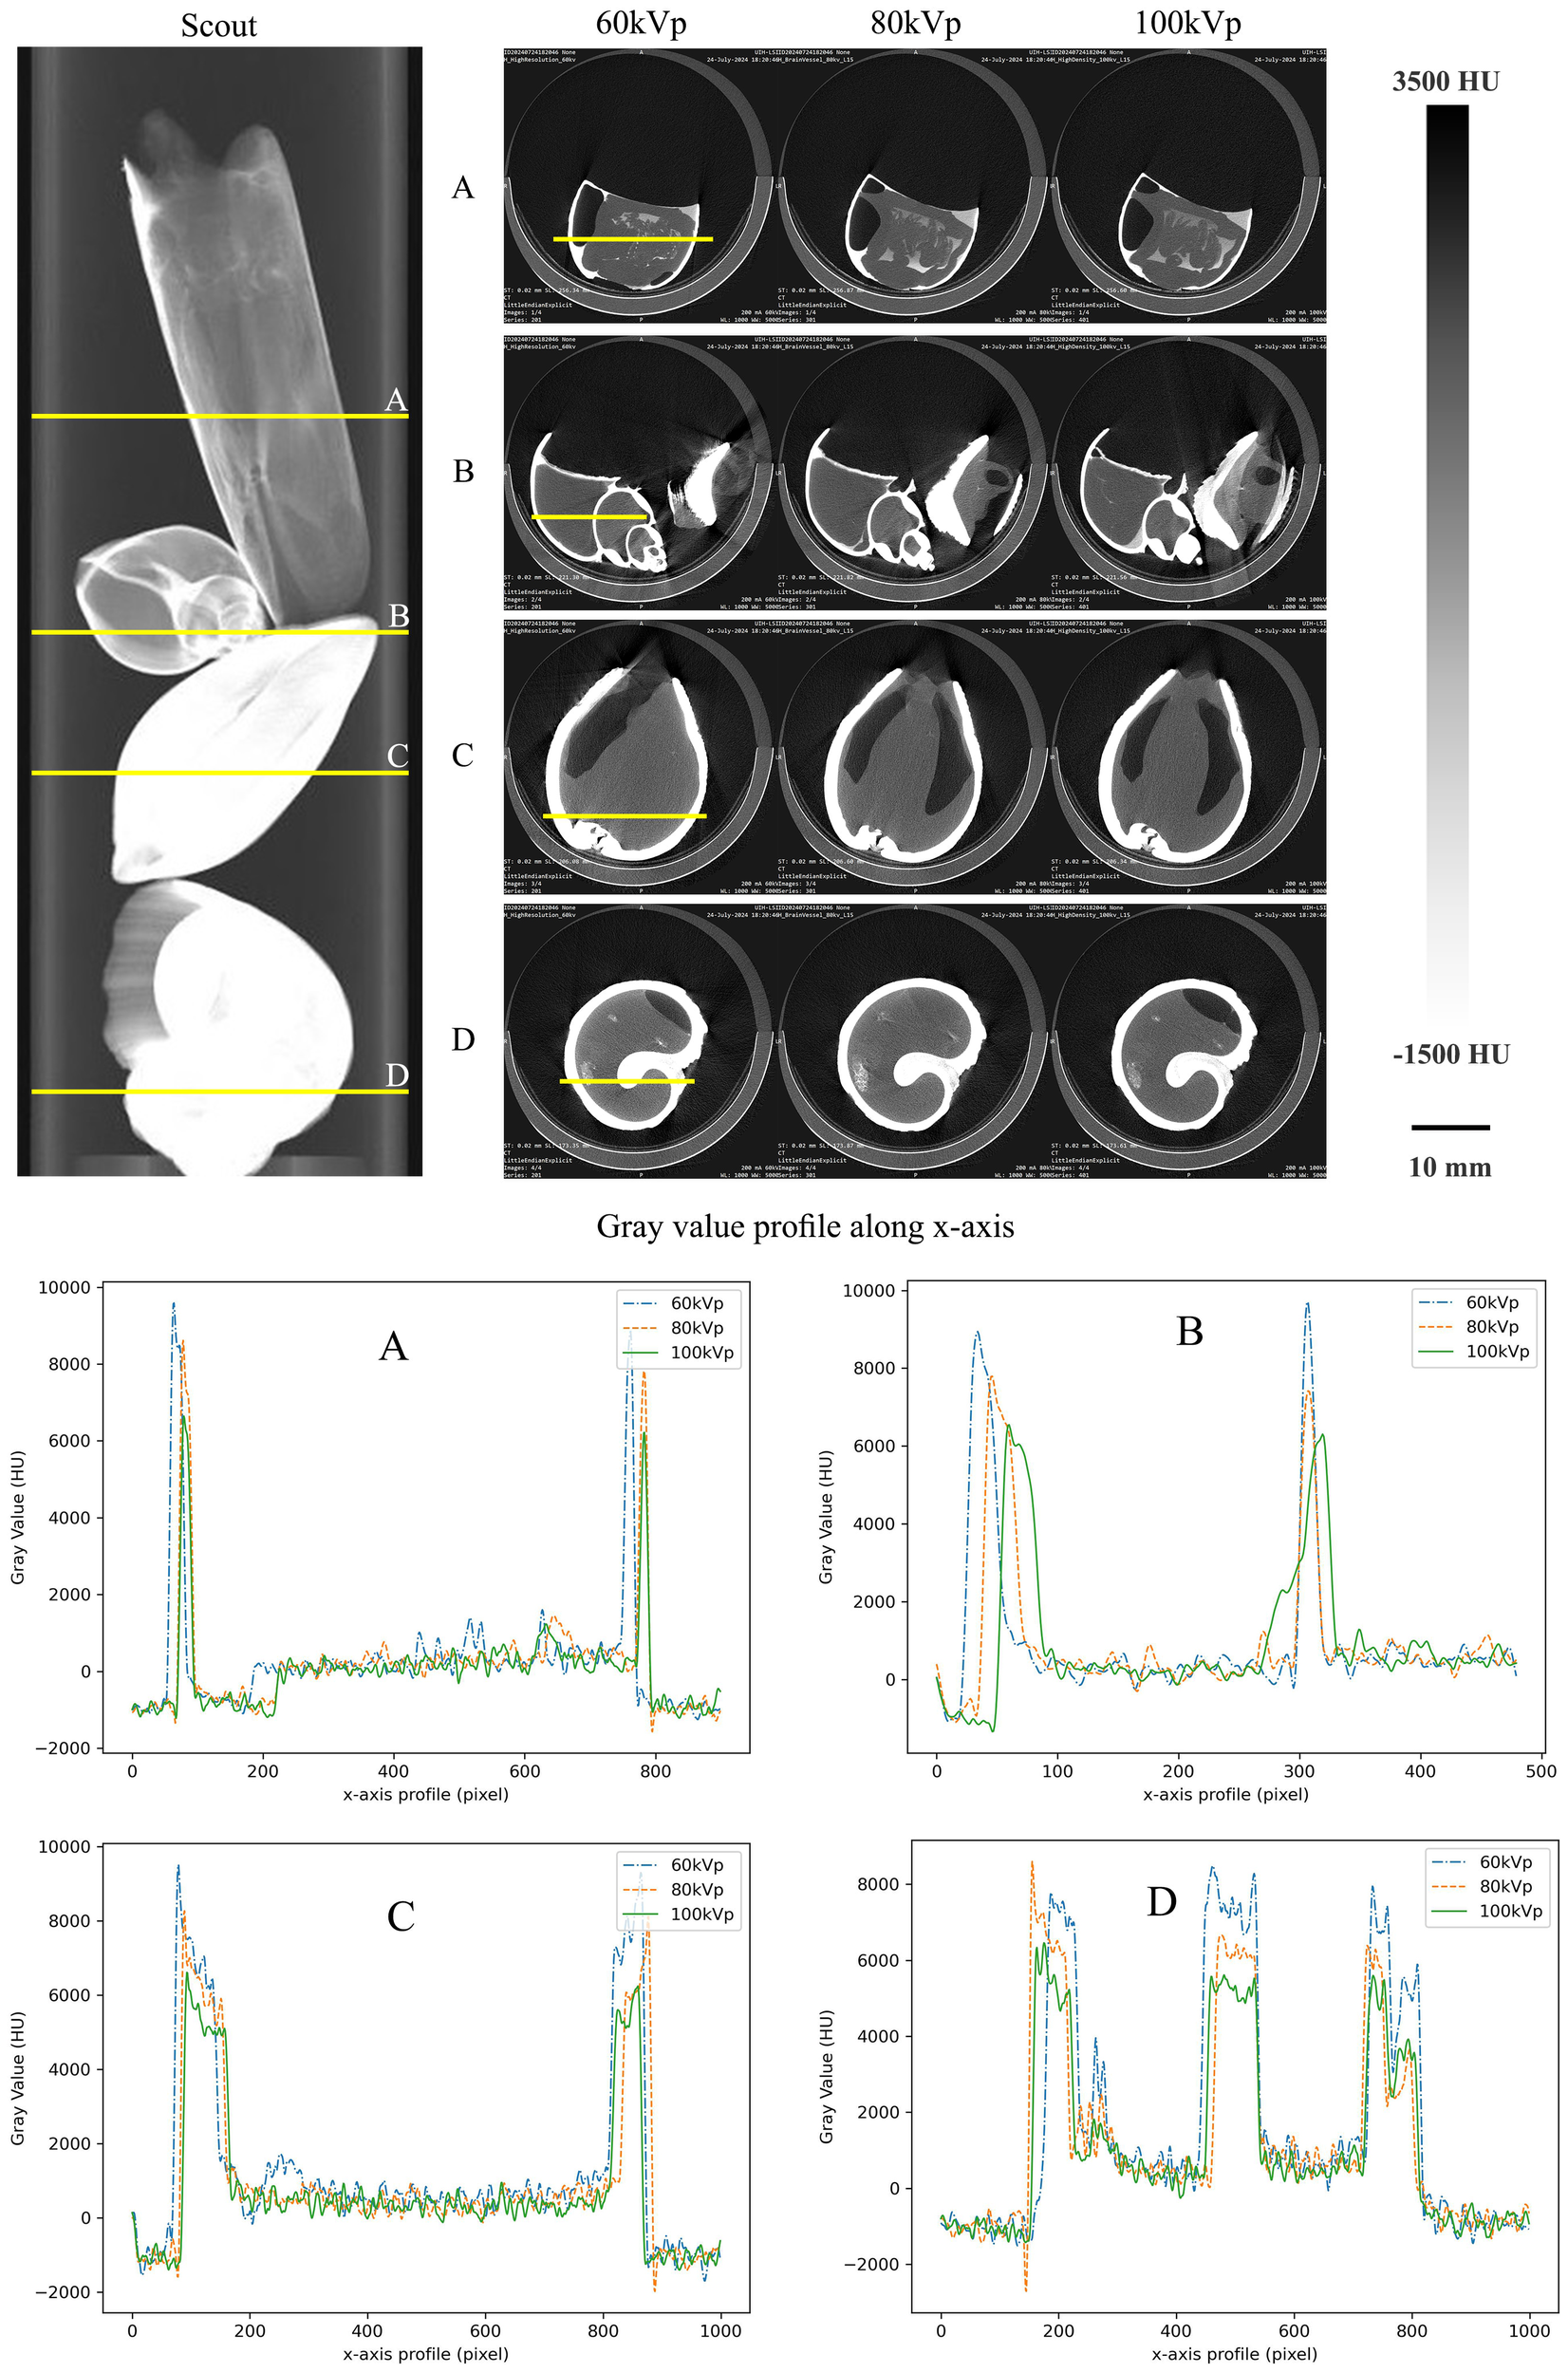
Examples of 2D reconstructions of (A)Sinonovacula constricta, (B)Conus, (C)Meretrix lusoria, and (D)Strombus canarium. The images include scout images, CT images at 60, 80, and 100 kVp, and profiles of CT numbers along the x-axis, presented from left to right. The CT images at three different tube voltages were extracted from the same region in the scout image (indicated by yellow lines). The CT number profiles along the x-axis were obtained from the same line in the CT images (also marked by yellow lines).
3.2 Imaging performance of monoenergetic images
PC micro-CT leverages the photon energy discrimination capabilities of photon-counting detectors to enable virtual monoenergetic imaging. Figure 4 illustrates the virtual monoenergetic reconstructions spanning energies between 20 and 120 keV, while the quantitative analysis results are shown in Figure 5.
Figure 4
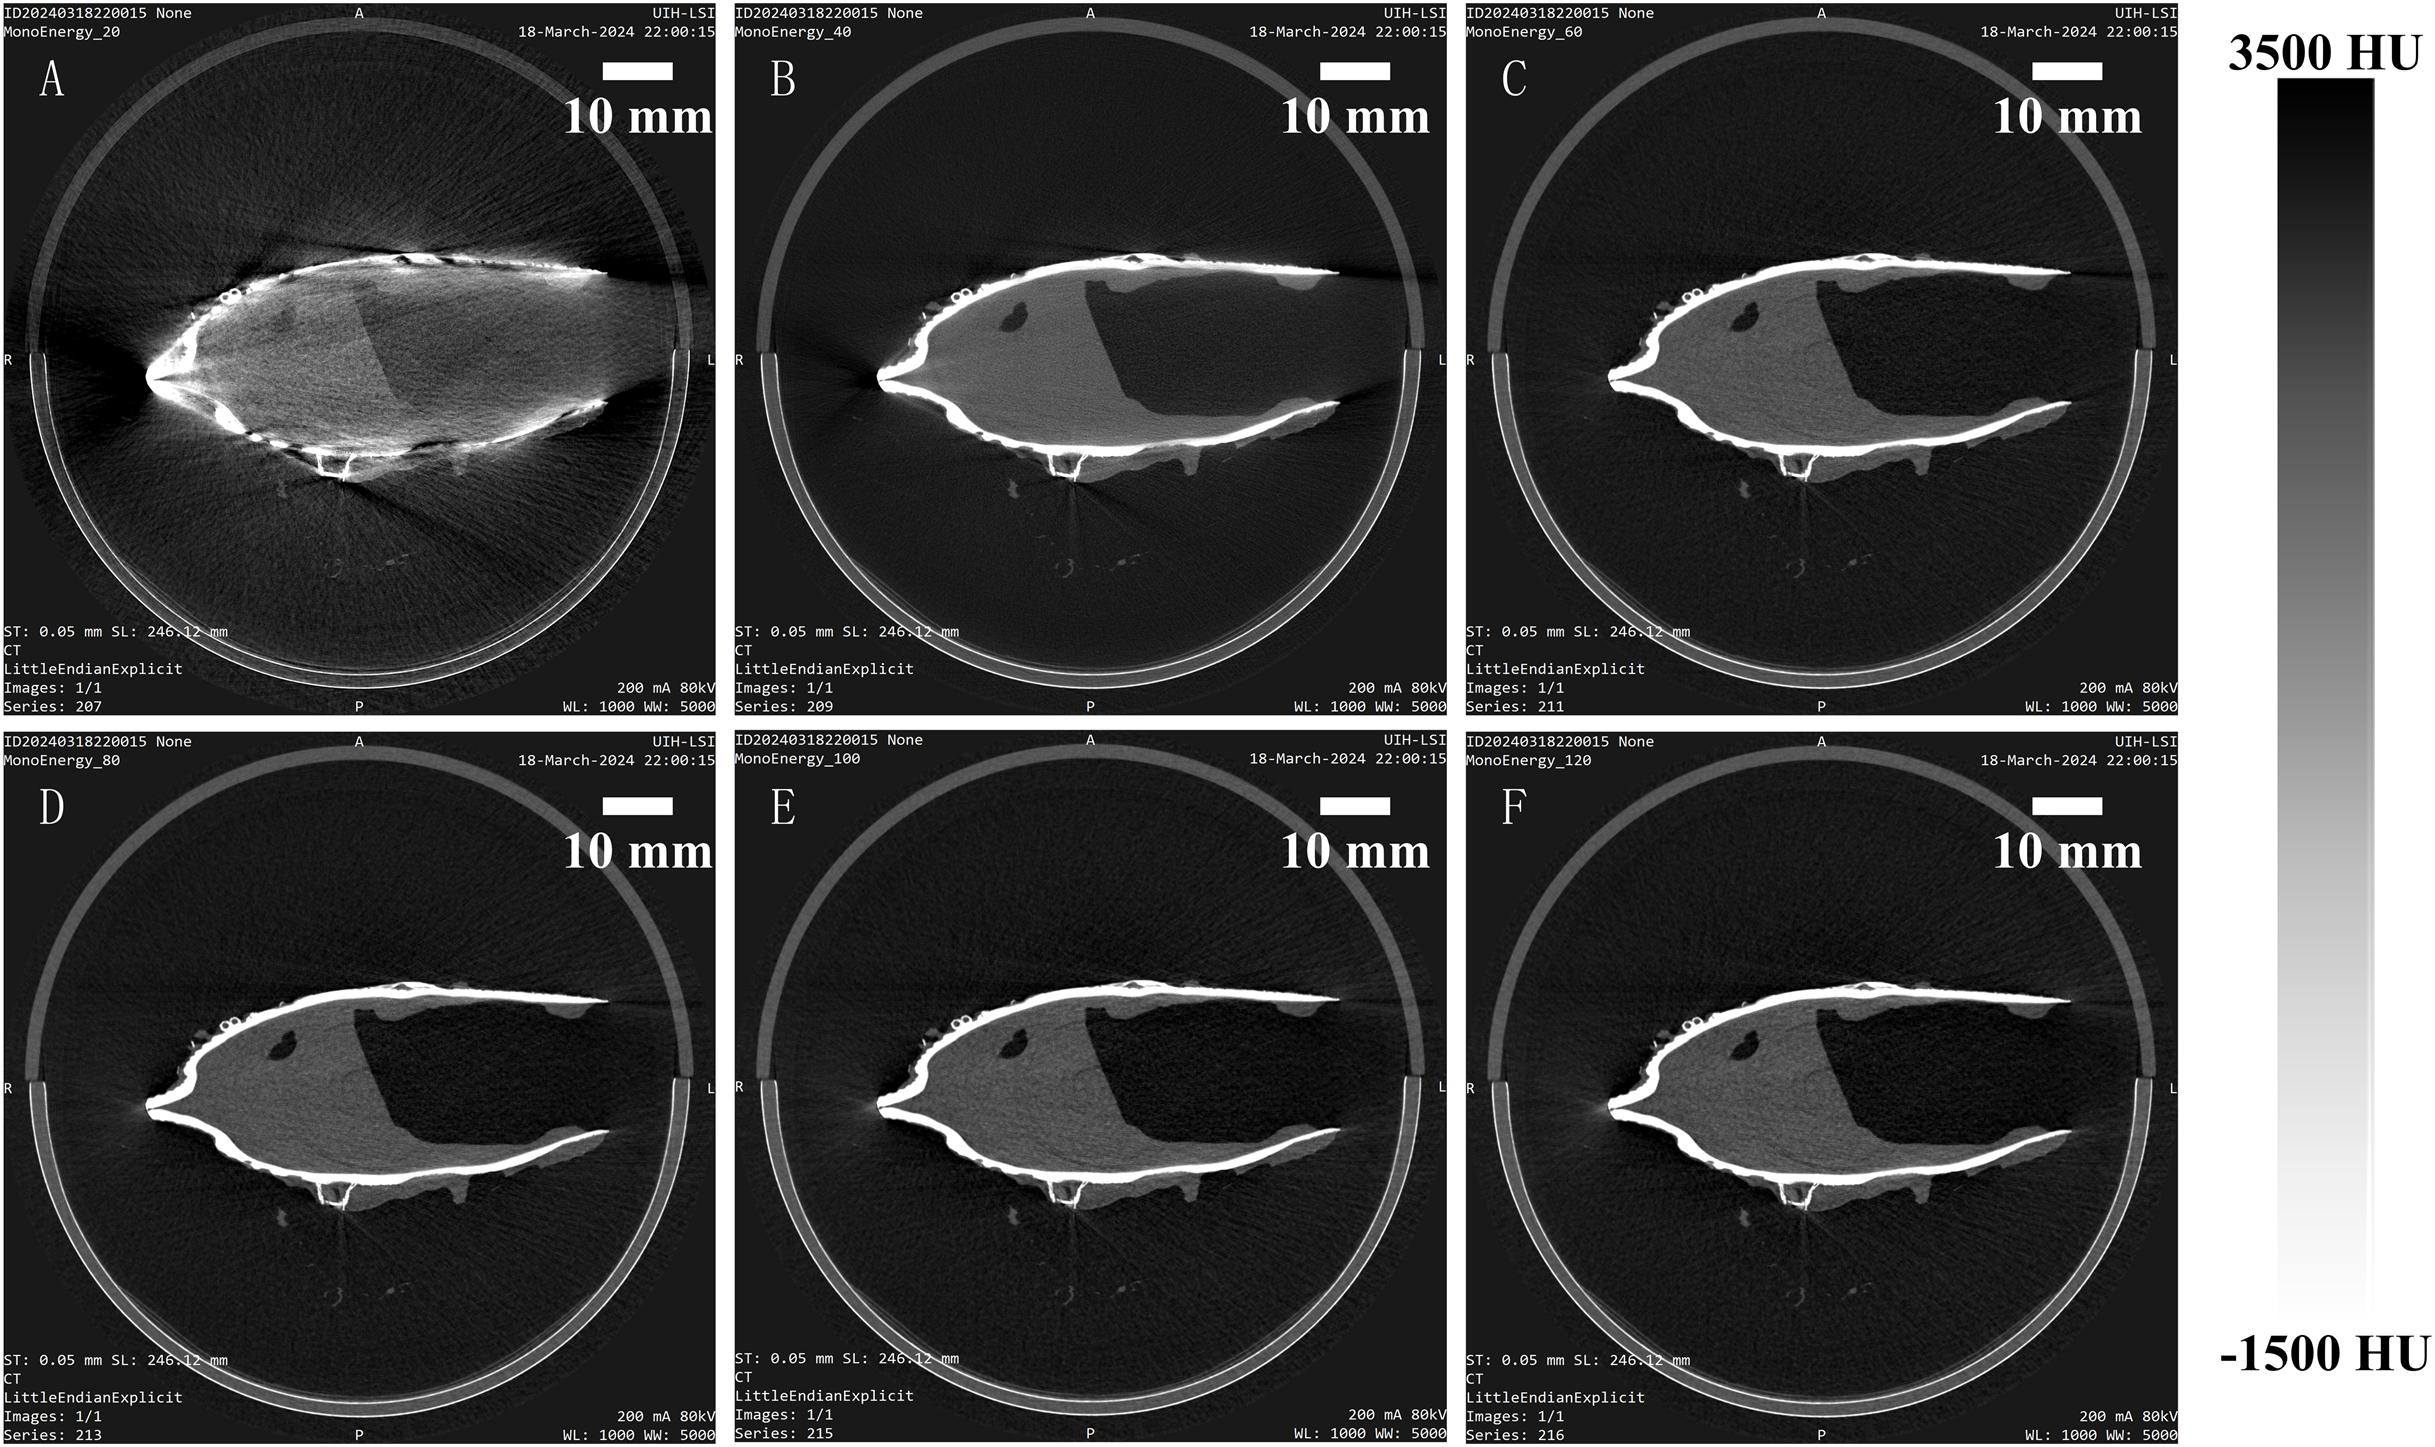
Virtual monoenergetic imaging results of Pectinidae obtained using photon-counting micro-CT, presented from (A–F): 20, 40, 60, 80, 100, 120 keV.
Figure 5
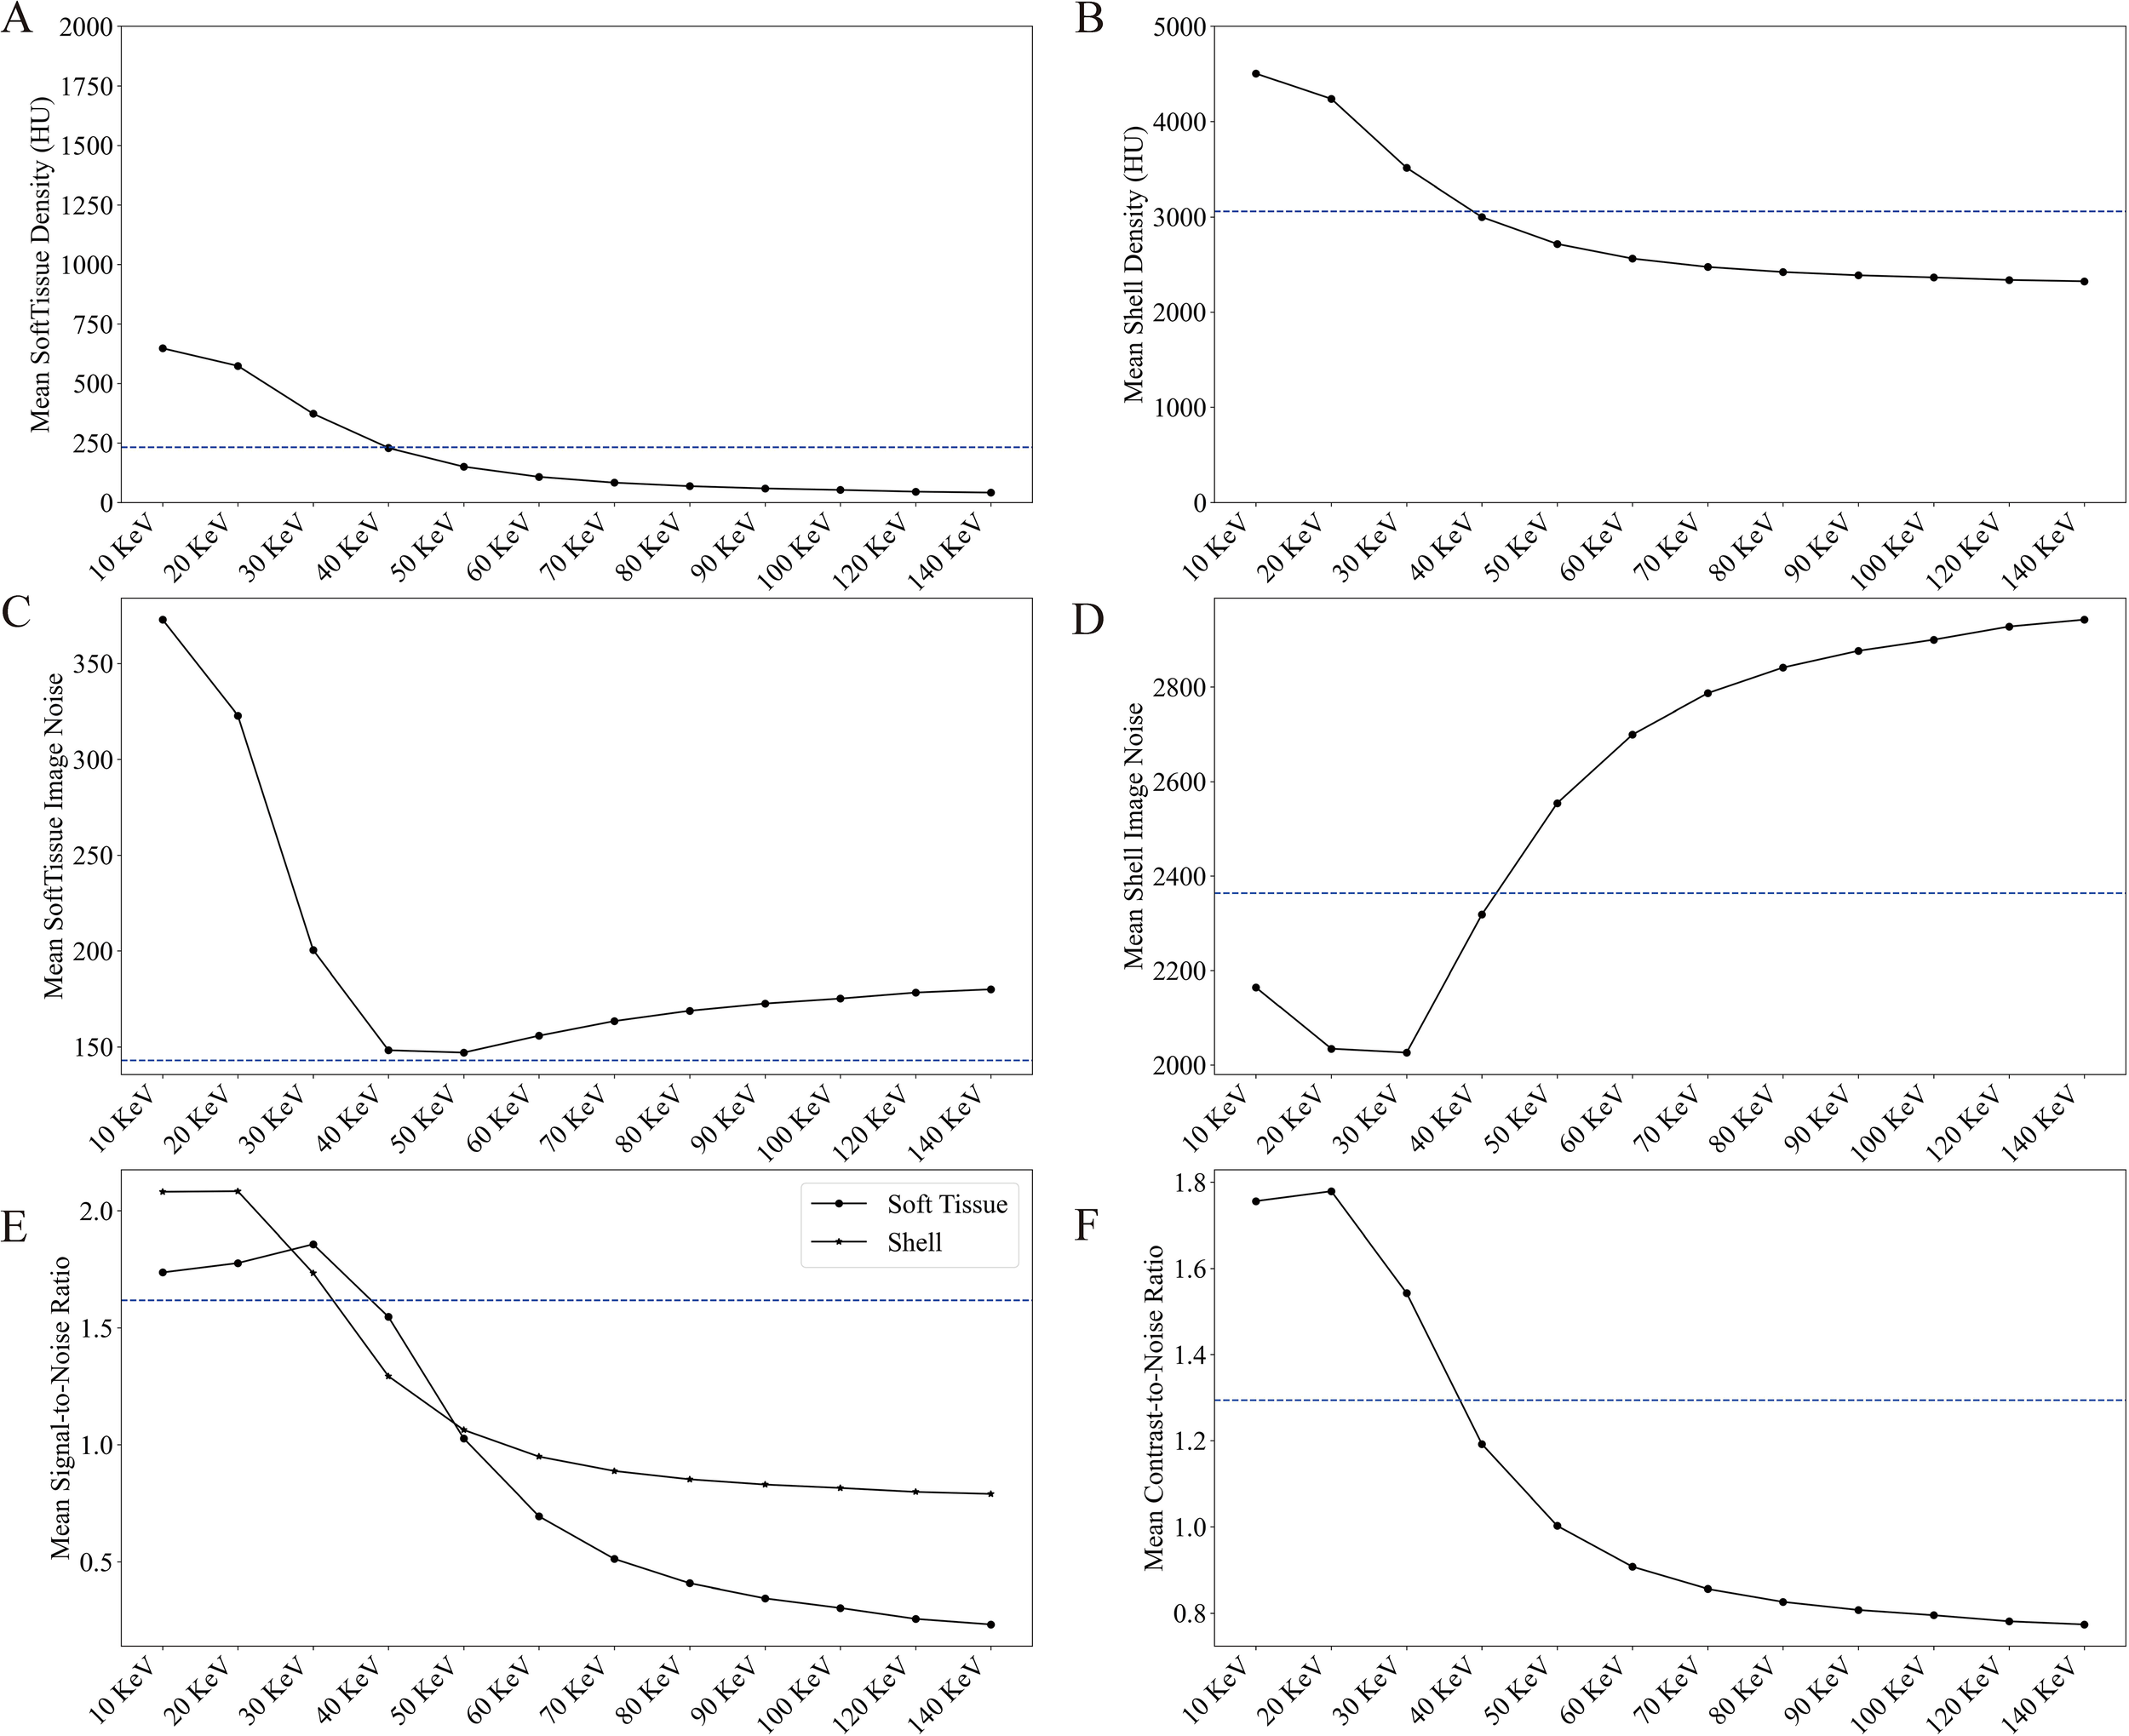
Quantitative results of virtual monoenergetic imaging of Pectinidae obtained using PC micro-CT. The mean HU of soft tissue (A) and shell (B), the noise level of soft tissue (C) and shell (D), the SNR for both tissues (E), and the CNR between soft tissue and shell (F) are presented. The blue dotted line represents the corresponding values derived from the full-energy image of the PC micro-CT.
The average CT value of soft tissue (Figure 5A) was measured at 231.1 HU for the polyenergetic reconstructions (dashed blue line solid) and varied from 42.0 to 647.6 HU for the virtual monoenergetic images (line with dots). Similarly, the average CT value of shell (Figure 5B) was 3059.1 HU for the polyenergetic reconstructions, ranging from 2323.7 to 4504.5 HU for the virtual monoenergetic images. Notably, the densities of both soft tissue and shell decrease with increasing energy, with values approximating those of the full-energy images at a virtual monoenergetic energy of 40 keV.
The noise levels in the soft tissue ROI (Figure 5C) averaged 142.9 HU for the polyenergetic reconstructions and ranged from 147.0 to 372.9 HU for the virtual monoenergetic images. For the shell ROI (Figure 5D), the average noise level (Equation 1) was 2363.4 HU for the polyenergetic reconstructions, ranging from 2026.2 to 2942.9 HU in the virtual monoenergetic images. The noise levels in both regions followed a trend of initial decrease, reaching a minimum around 40 keV, and then increasing as monoenergetic energy rose further.
Regarding image quality metrics, the average SNR in the soft tissue ROI (Figure 5E) was 1.6 for the polyenergetic reconstructions, ranging from 0.23 to 1.86 for the virtual monoenergetic images. In the shell ROI, the SNR averaged 1.3 for the polyenergetic reconstructions and ranged from 1.79 to 2.08 for the virtual monoenergetic images. For CNR (Figure 5F), the average value was 1.2 for the polyenergetic reconstructions, spanning from 0.77 to 1.78 for the virtual monoenergetic images. Both SNR (Equation 2) and CNR (Equation 3) exhibited a decreasing trend beyond 30 keV, indicating a trade-off between resolution and energy level in virtual monoenergetic imaging.
3.3 Comparison between PC micro-CT and energy-integrating detector micro-CT
To compare the imaging performance of PC micro-CT and energy-integrating detector micro-CT (EID micro-CT), the same otolith specimen was scanned using both systems, resulting in four distinct image types. The grayscale histogram of a full-energy image obtained from PC micro-CT (Figure 6A) ranged between 5215 HU and 10149 HU, with an average CT value of 7719.8 HU. Based on the image obtained from PC micro-CT, a calcium map (Figure 6B) was reconstructed, yielding an average calcium density of 1692.4 mg/ml, ranging from 1080.8 to 2629.5 mg/ml. The calcium content within the otolith gradually decreases from the periphery toward the center. Additionally, a monoenergetic image reconstructed at 100 keV (Figure 6C) ranged from 1677 to 6835.8 HU, with an average of 4427.4 HU. An image acquired using EID micro-CT (Figure 6D) ranged from 3237 HU to 14019.7 HU, with an average of 9150.3 HU. Noise levels were markedly different, with PC micro-CT showing only 512.97 HU—less than half of the 1092.10 HU observed in EID micro-CT. The reconstructed images from PC micro-CT effectively reveal the internal density variations within the otolith, whereas EID micro-CT is limited to visualizing the overall shape of the otolith without providing detailed information on density distribution.
Figure 6
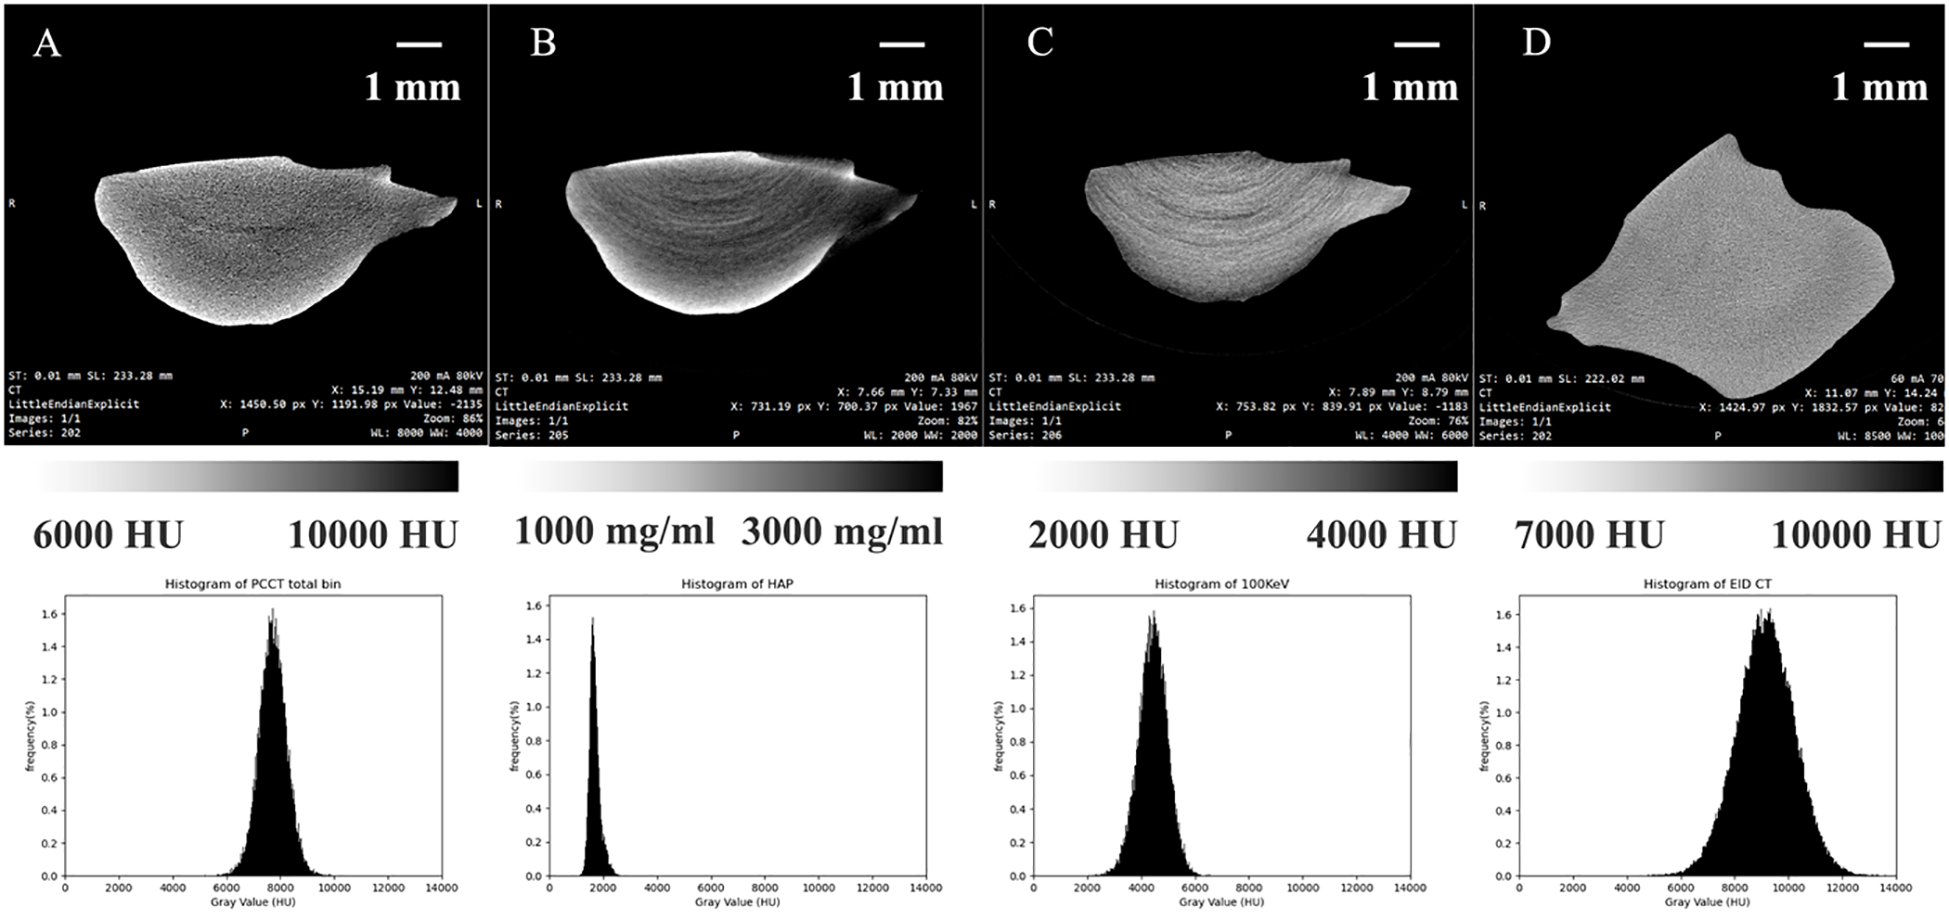
CT images of Otolith under different conditions, presented from left to right: (A) full-energy image from photon-counting micro-CT, (B) calcium map derived from photon-counting micro-CT, (C) monoenergetic photon-counting micro-CT image at 100 keV, and (D) traditional integral-detector CT image. The bottom row shows the corresponding CT value histograms for each image.
3.4 Iodine-stained imaging
Figure 7 shows the contrast images of different species of marine organisms. In an effort to optimize the contrast observed by micro-CT, we stained these samples in a 320 mg/ml iodoxanol solution for various periods of time (0, 1, 12, 24 hours) before micro-CT imaging. At 0 hours, the soft tissue structures are barely visible. After 1-hour, distinct features begin to emerge, such as the gill structures in Sinonovacula constricta (Figure 7E) and the digestive glands in Strombus canarium (Figure 7H). By 24 hours, the digestive gland of Sinonovacula constricta (Figure 7O) is clearly outlined. Similarly, in Meretrix lusoria (Figure 7P), the internal soft tissues, particularly the gills, are visualized with remarkable clarity.
Figure 7
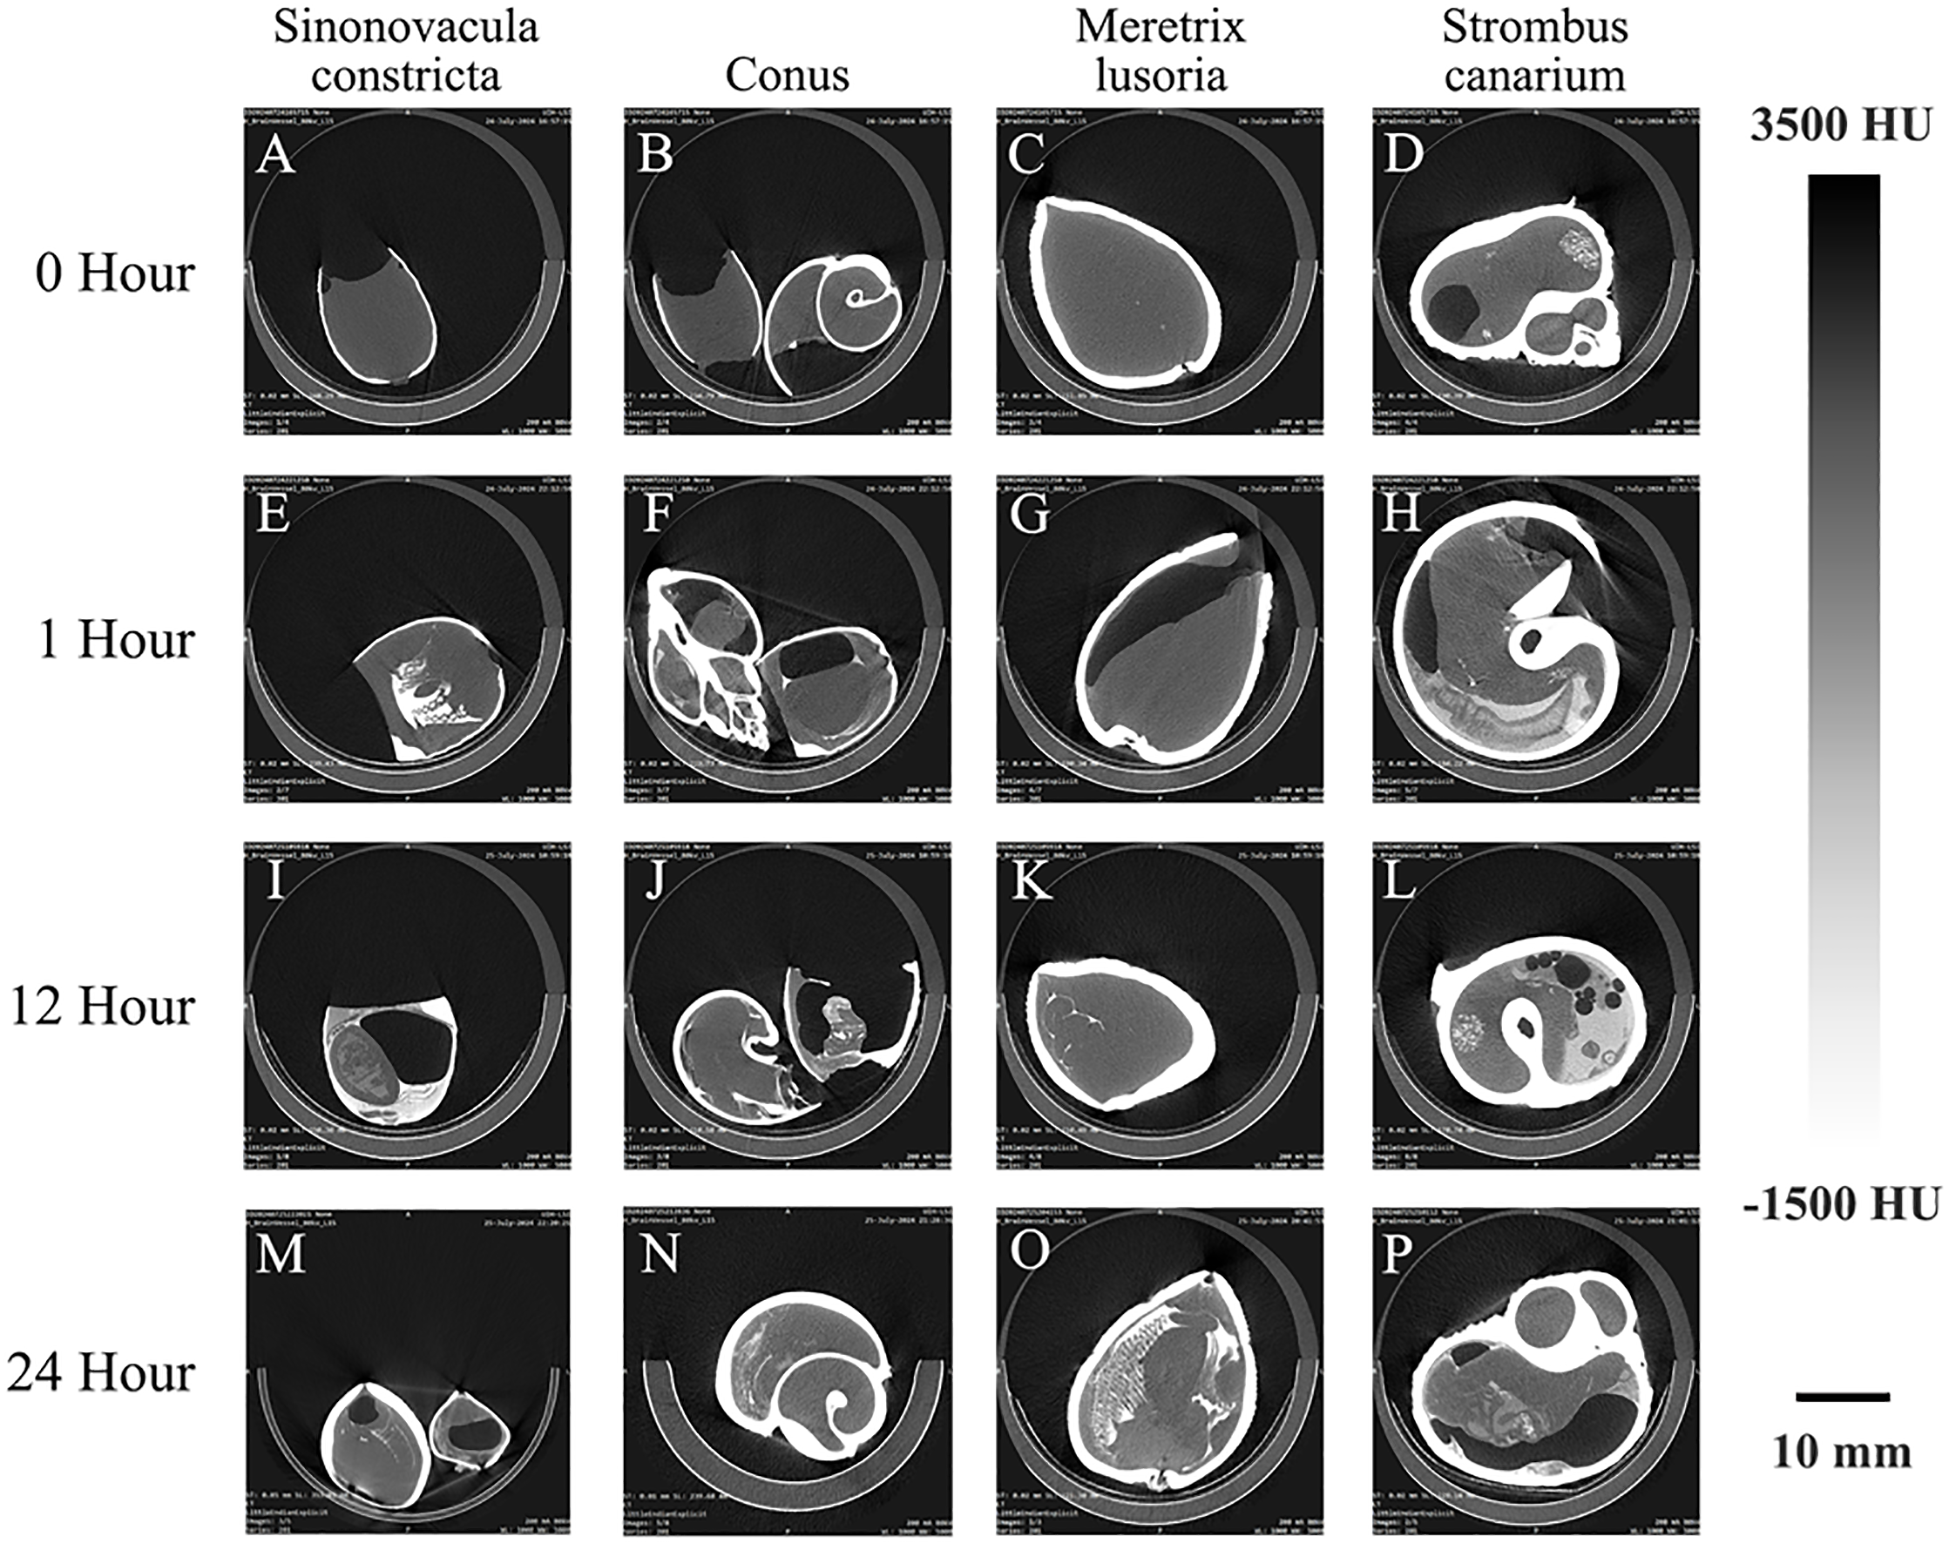
Examples of CT images of marine life immersed in a 320 mg/mL Iohexol solution for 0 (A–D), 1 (E–H), 12(I–L), and 24(M–P) hours. Note that as immersion time increases, the clarity of soft tissue details in the marine organisms progressively improves.
Figure 8 presents the reconstructed images of Strombus canarium after immersion in a 320 mg/mL iodixanol solution for 36 hours. A calcium map and virtual monoenergetic images at 20 and 40 keV have been displayed in order. In both full-energy and high-energy virtual monoenergetic images, the shell, foot, and digestive system are clearly visible, with clear outlines of their features. The calcium map not only provides the detail structure information of the shells, but enabling quantitative study of calcium content.
Figure 8
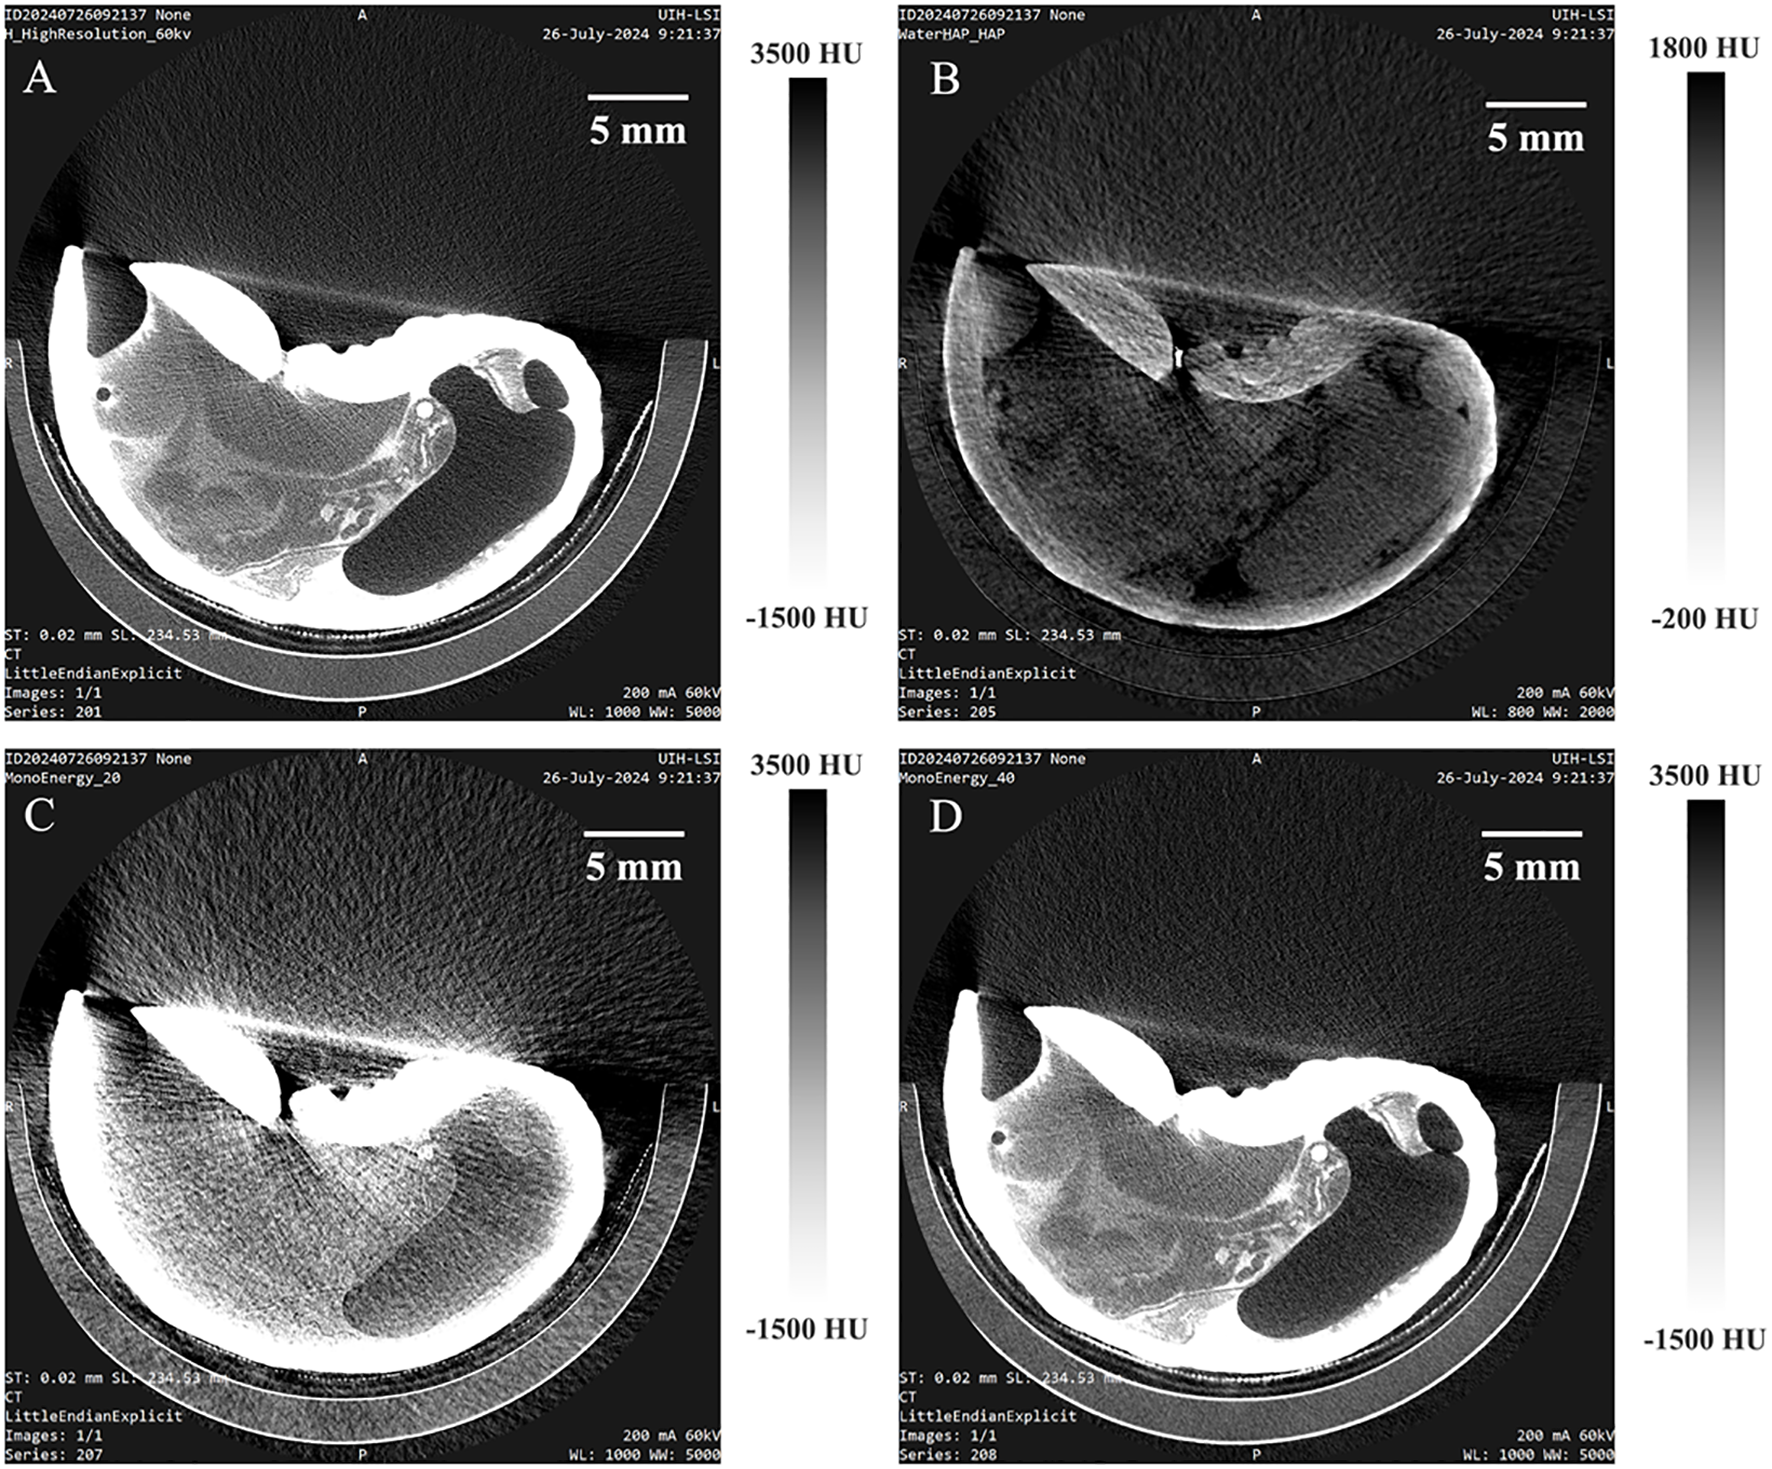
Virtual monoenergetic imaging and calcium map results of Strombus canarium after immersion in a 320 mg/mL Iohexol solution for 36 hours, obtained using photon-counting micro-CT. The images include the full-energy image (A), calcium map (B), and monoenergetic imaging at 20 (C) and 40 (D) keV.
In order to further display the contrast image result of PC micro-CT for marine organisms, Figure 9 presents the horizontal, coronal, sagittal view and 3D rendering of Meretrix lusoria immersed in iodixanol solution for 36 hours. The 3D rendering captures not only the intricate texture details of the shell surface but also reveals the fine structures of the gills. It is worth emphasizing that this system in combination with iodine contrast agents can show very great advantages in marine organisms’ imaging.
Figure 9
Three-dimensional rendering based on photon-counting micro-CT data of Meretrix lusoria after immersion in a 320 mg/mL Iohexol solution for 36 hours. The XY (horizontal), XZ (vertical), and YZ (vertical) views, along with the 3D reconstruction, are shown. Note that detailed structures are visible in the 3D reconstructions.
4 Discussions
Because of the ability of CT to nondestructively visualized the internal structures of marine organisms, it occupies a significant position in the research of marine biology. In archaeology, it is usually necessary to study marine fossils, and such rare and fragile samples also need to be imaged using CT which have no harm to the samples (Ye et al., 2024). To the best of our knowledge, this study marks the first instance of applying PC micro-CT to marine organism imaging. The results highlight its potential for high-resolution imaging of bivalves and other organisms. PC micro-CT is the tool that should be recommended to adopted in marine biology research to enhance the understanding of more marine organisms in morphology (Wei and Erbe, 2024), taxonomy (Yang et al., 2024), and functional anatomy (Teichert et al., 2024).
The high spatial resolution of PC micro-CT enables detailed visualization of intricate biological structures, as demonstrated in the imaging of bivalves (Figure 2). In bivalves, the two shells are typically connected by a hinge structure (Kahler et al., 1976), which PC micro-CT captures with exceptional clarity, precisely delineating its boundaries. It is valuable for functional and comparative analyses of hinge mechanisms across species. Unlike EID micro-CT, which struggles with electronic noise and limited contrast in low-density materials, PC micro-CT employs a photon-counting detector that selectively filters low-energy photon signals, reducing noise and enhancing image contrast. Fine structural features are more distinctly resolved. The ability of PC micro-CT to characterize shell microstructure with high precision makes it particularly relevant for studies on biomineralization and mechanical properties of marine organisms. For example, previous studies have utilized micro-CT to investigate the role of gastropod shell composition and microstructure in resisting dissolution caused by ocean acidification (Barclay et al., 2020), as well as the micromechanics of echinoderm skeletons using X-ray tomography (Müter et al., 2015). PC micro-CT offers significant advancements by providing higher spatial resolution, which enable more precise characterization of shell microstructures, facilitating deeper insights into biomineralization processes. By enabling high-resolution, non-destructive analysis with superior contrast and spectral information, PC micro-CT has the potential to refine and expand upon existing research, offering a more comprehensive understanding of the impacts of environmental change and evolutionary adaptations in marine species.
Marine organisms typically have a high-density shell enclosing low-density soft tissue. When performing micro-CT imaging, beam hardening artifacts often appear behind the dense shell, affecting the visualization of the shell-soft tissue boundary. This issue can be mitigated by selecting appropriate scanning protocols. This study investigated the effects of three tube voltage levels on image quality. Figure 3 shows that the H_SoftTissue_80kV protocol produced the optimal imaging results. At low tube voltages, such as 60 kVp, X-ray interactions are predominantly governed by the photoelectric effect, leading to significant attenuation differences between tissues and improving density resolution. However, more photons in the X-ray spectrum are absorbed by the high-density shell, resulting in fewer photons reaching the detector. This causes beam hardening artifacts in the reconstructed images, compromising image quality. To reduce these artifacts, we recommend higher tube voltage protocols for imaging specimens with high-density components, such as shells (Figure 3C). In contrast, at high tube voltage (100 kVp), the higher average photon energy allows better penetration through the shell, but the increased contribution of Compton scattering reduces contrast between different tissues. An intermediate voltage of 80 kVp provides a balance between the photoelectric effect and Compton scattering. This optimizes the attenuation coefficient differences among soft tissues while maintaining sufficient signal intensity, ultimately enhancing soft tissue contrast in the reconstructed images. Additionally, advancements in post-processing algorithms offer a supplementary approach to reducing beam hardening artifacts (Deng et al., 2011).
Compared to conventional EID micro-CT, the most significant advantage of PC micro-CT lies in its spectral imaging capabilities, particularly virtual monoenergetic imaging and material decomposition. Virtual monoenergetic imaging reconstructs images at different monochromatic energy levels by utilizing both high- and low-energy projection data. This technique optimizes tissue contrast, reduces beam hardening artifacts, and enhances the visibility of contrast agents, thereby improving density resolution. The advantages of virtual monoenergetic imaging are demonstrated in Figures 4, 5, where images acquired at energy levels below 50 keV exhibit superior delineation of both high- and low-density tissues in marine organisms. While virtual monoenergetic imaging has not yet been applied in marine biology, its clinical applications highlight its potential utility. For instance, in pulmonary nodule assessment, low-energy virtual monoenergetic imaging improves soft tissue contrast, thereby enhancing the visibility of small lung nodules (He et al., 2020). Similarly, in the evaluation of atherosclerosis and vascular stenosis, high-energy virtual monoenergetic imaging effectively reduces metal and calcification artifacts, allowing for more accurate assessment of coronary artery stenosis and improving the precision of interventional treatments (D’Angelo et al., 2019). These advantages suggest that VMI could be a valuable tool for marine biological imaging, but further investigation is required to explore its full potential in this field.
Material decomposition, another key spectral imaging technique, analyzes X-ray attenuation characteristics at different energy levels to separate mixed tissue signals into quantitative maps of specific base materials (e.g., water, fat, iodine). This approach enables quantitative tissue composition analysis, enhances contrast agent detection accuracy, and reduces artifact interference. Figure 6 presents a calcium map obtained via water-calcium decomposition. For fish otolith, the growth ring is the significant structure representing the aging of fish which record critical biological and environmental information (Valerio et al., 2025). Thanks to the PC micro-CT, not only can the growth ring be seen in the full-energy images, but it can be quantitatively analyzed in calcium map, offering a novel approach for studying marine organism development. Although material decomposition imaging has not yet been applied to marine biological studies, existing research has demonstrated its effectiveness in other domains. In low-energy micro-CT, material decomposition using a photon-counting X-ray detector enables the differentiation and mapping of iron, calcium, and paraffin in atherosclerotic plaques (Solem et al., 2021). In dual- and triple-energy cone-beam micro-CT, material-specific imaging allows for the separation and visualization of bone and blood vessels in ex vivo rat specimens perfused with a lead-based contrast agent (Granton et al., 2008). These applications demonstrate the potential of material decomposition for enhancing imaging contrast and specificity in complex biological structures. Further research is needed to extend this approach to marine biological studies, particularly for the quantitative analysis of biomineralized tissues.
A major challenge in marine biology is obtaining clear images of the soft tissues of marine organisms to better understand their functional differences (Lv et al., 2019). Non-contrast PC micro-CT imaging, while effective for high-density structures such as shells, does not provide clear visualization of soft tissues like digestive glands, digestive tracts, and circulatory systems. this study explores the use of iodine contrast imaging to enhance the visibility of these internal structures. Our results demonstrate that after 12 hours of immersion in a 320 mg/mL iodixanol solution, the digestive glands and other soft tissue structures of certain marine organisms become visible. After 24 hours of immersion, high-resolution imaging of the soft tissues of all the marine organisms studied in this paper is achieved, providing detailed internal views. Studies have demonstrated that iodine-stained Syllis can be effectively imaged using micro-CT. Iodine staining has proven advantageous over non-staining methods for visualizing delicate low-density structures, such as segmental organs, ganglionic connective tissues, the ventral nerve cord, and segmental nerves (Parapar et al., 2019). For marine invertebrates, a buffered iodine solution applied to specimens fixed with 10% formalin provides optimal nervous tissue contrast (Chapuis et al., 2024), which aligns with the findings of this study. Regarding immersion time, this study evaluated imaging results at 0, 1, 12, 24, and 36 hours and found no significant difference between 24 and 36 hours for Meretrix lusoria and Strombus canarium imaging. Therefore, a 24-hour pretreatment period is recommended for iodine-based imaging, consistent with previous studies (Chapuis et al., 2024).
While PC micro-CT demonstrates excellent performance in imaging marine organisms, several challenges remain. Motion artifacts may still occur when scanning living marine organisms, despite the rapid scanning speed of CT. Additionally, the relatively low operating tube voltage of micro-CT may result in insufficient X-ray energy to penetrate samples with high-density components, leading to beam hardening and metal artifacts in the images. Another limitation is that the system is primarily designed to decompose substances with iodine and calcium as the base material, requiring further experiments to analyze other materials. Furthermore, this study included only one representative organism per species, which may impact the generalizability of the findings. Further research is warranted to address these limitations and to expand the applicability of PC micro-CT in marine biology.
Recent years have seen a surge in the use of high-resolution micro-CT technology by marine biologists for studying various marine organisms (Poore and Black, 2024). This technique has played an invaluable role in the field of morphology and classification of marine biology. In addition, it also plays an important role in the research field of marine environment and climate changes (Thomson et al., 2024). There are even many studies that require scanning of fossils to study evolution (SChade et al., 2024). The novel PC micro-CT was introduced into marine biology research, achieved significant advancements in the outcomes. These improvements include enhanced spatial resolution, reduced image noise, material decomposition capabilities, and more detailed visualization of density distributions within structures, along with effective imaging using contrast agents. As PC micro-CT technology is still in its early stages, its future development holds great promise. Continued improvements in spatial resolution, expanded applications of virtual monoenergetic imaging, and enhanced precision and sensitivity in material decomposition are expected. Moreover, the technology could further advance to support multi-material decomposition, broadening its application scenarios in marine biology and beyond.
5 Conclusion
To the best of our knowledge, this study marks the first application of PC micro-CT in marine biology. PC micro-CT outperforms conventional EID micro-CT, particularly in spatial resolution and noise reduction. Virtual monoenergetic imaging enhances soft tissue contrast at lower keV levels while minimizing beam hardening artifacts at higher energies. Additionally, the system’s material decomposition capability enables quantitative mapping of iodine and calcium distributions in otoliths, revealing intricate biomineralization patterns.
For optimal imaging of marine organisms, higher tube voltages, such as 100 kVp, should be used. Furthermore, iodixanol immersion significantly enhances soft tissue visualization, improving contrast imaging of structures like digestive glands and gills. Expanding material decomposition to include phosphorus and magnesium will further advance biomineralization research.
PC micro-CT opens new avenues for assessing climate change effects on marine organisms, such as shell microstructure degradation due to ocean acidification, and for non-destructive analysis of fossilized specimens.
Overall, this study establishes PC micro-CT as a transformative tool in marine biology, enabling high-resolution, non-invasive 3D imaging. Its applications extend across taxonomy, functional morphology, and environmental adaptation research, paving the way for broader advancements in marine science.
Statements
Data availability statement
The original contributions presented in the study are included in the article/supplementary material, further inquiries can be directed to the corresponding author/s.
Ethics statement
The manuscript presents research on animals that do not require ethical approval for their study.
Author contributions
MX: Data curation, Writing – original draft, Writing – review & editing, Formal analysis, Investigation. TX: Writing – review & editing, Data curation, Supervision, Writing – original draft. QL: Writing – review & editing, Funding acquisition.
Funding
The author(s) declare that financial support was received for the research and/or publication of this article. This work was supported by National Natural Science Foundation of China (32227801).
Conflict of interest
The authors declare that the research was conducted in the absence of any commercial or financial relationships that could be construed as a potential conflict of interest.
Generative AI statement
The author(s) declare that no Generative AI was used in the creation of this manuscript.
Publisher’s note
All claims expressed in this article are solely those of the authors and do not necessarily represent those of their affiliated organizations, or those of the publisher, the editors and the reviewers. Any product that may be evaluated in this article, or claim that may be made by its manufacturer, is not guaranteed or endorsed by the publisher.
References
1
Barclay K. M. Gingras M. K. Packer S. T. Leighton L. R. (2020). The role of gastropod shell composition and microstructure in resisting dissolution caused by ocean acidification. Marine Environ. Res.162, 105105. doi: 10.1016/j.marenvres.2020.105105
2
Boistel R. Swoger J. Krzic U. Fernandez V. Gillet B. Reynaud E. G. (2011). The future of three-dimensional microscopic imaging in marine biology. Marine Ecology-An Evolutionary Perspective32, 438–452. doi: 10.1111/j.1439-0485.2011.00442.x
3
Caron R. Seoud L. Londono I. Villemure I. (2023). Segmentation of trabecular bone microdamage in Xray microCT images using a two-step deep learning method. J. Mechanical Behav. Biomed. Materials137. doi: 10.1016/j.jmbbm.2022.105540
4
Chapuis L. Andres C. S. Gerneke D. A. Radford C. A. (2024). Bioimaging marine crustacean brain: quantitative comparison of micro-CT preparations in an Alpheid snapping shrimp. Front. Neurosci.18. doi: 10.3389/fnins.2024.1428825
5
Cockman M. D. Blanton C. A. Chmielewski P. A. Dong L. Dufresne T. E. Hookfin E. B. et al . (2006). Quantitative imaging of proteoglycan in cartilage using a gadolinium probe and microCT. Osteoarthritis Cartilage14, 210–214. doi: 10.1016/j.joca.2005.08.010
6
Cruz-Bastida J. P. Zhang R. Gomez-Cardona D. Hayes J. Li K. Chen G. H. (2019). Impact of noise reduction schemes on quantitative accuracy of CT numbers. Med. Phys.46, 3013–3024. doi: 10.1002/mp.13549
7
D’Angelo T. Cicero G. Mazziotti S. Ascenti G. Albrecht M. H. Martin S. S. et al . (2019). Dual energy computed tomography virtual monoenergetic imaging: technique and clinical applications. Br. J. Radiol.92, 20180546. doi: 10.1259/bjr.20180546
8
Degenhardt K. Wright A. C. Horng D. Padmanabhan A. Epstein J. A. (2010). Rapid 3D phenotyping of cardiovascular development in mouse embryos by micro-CT with iodine staining. Circulation-Cardiovascular Imaging3, 314–U138. doi: 10.1161/CIRCIMAGING.109.918482
9
Deng J. J. Yan S. K. Chen M. Bruckbauer T. Ieee (2011). “Beam hardening correction using a conical water-equivalent phantom for preclinical micro-CT,” in 2011 IEEE Nuclear Science Symposium and Medical Imaging Conference (NSS/MIC). Valencia, Spain. doi: 10.1109/NSSMIC.2011.6152520
10
Flohr T. Petersilka M. Henning A. Ulzheimer S. Ferda J. Schmidt B. (2020). Photon-counting CT review. Physica Medica-European J. Med. Phys.79, 126–136. doi: 10.1016/j.ejmp.2020.10.030
11
Ghanavati S. Yu L. X. Lerch J. P. Sled J. G. (2014). A perfusion procedure for imaging of the mouse cerebral vasculature by X-ray micro-CT. J. Neurosci. Methods221, 70–77. doi: 10.1016/j.jneumeth.2013.09.002
12
Granton P. Pollmann S. Ford N. Drangova M. Holdsworth D. (2008). Implementation of dual-and triple-energy cone-beam micro-CT for postreconstruction material decomposition. Med. Phys.35, 5030–5042. doi: 10.1118/1.2987668
13
Hatton I. A. Heneghan R. F. Bar-On Y. M. Galbraith E. D. (2021). The global ocean size spectrum from bacteria to whales. Sci. Adv.7. doi: 10.1126/sciadv.abh3732
14
He C. Liu J. Hu S. Qing H. Qiao L. Luo H. et al . (2020). Accuracy of pulmonary nodule volumetry using noise-optimized virtual monoenergetic image and nonlinear blending image algorithms in dual-energy computed tomography: a phantom study. J. Comput. Assisted Tomography44, 847–851. doi: 10.1097/RCT.0000000000001102
15
Kahler G. A. Fisher F. M. Sass R. L. (1976). The chemical composition and mechanical properties of the hinge ligament in bivalve molluscs. Biol. Bull.151, 161–181. doi: 10.2307/1540712
16
Lee C. L. Min H. Befera N. Clark D. Qi Y. Das S. et al . (2014). Assessing cardiac injury in mice with dual energy-microCT, 4D-microCT, and microSPECT imaging after partial heart irradiation. Int. J. Radiat. Oncol. Biol. Phys.88, 686–693. doi: 10.1016/j.ijrobp.2013.11.238
17
Li M. Z. Guo X. D. Verma A. Rudkouskaya A. McKenna A. M. Intes X. et al . (2024). Contrast-enhanced photon-counting micro-CT of tumor xenograft models. Phys. Med. Biol.69, 16. doi: 10.1088/1361-6560/ad4447
18
Lukeneder A. (2012). Computed 3D visualisation of an extinct cephalopod using computer tomographs. Comput. Geosciences45, 68–74. doi: 10.1016/j.cageo.2012.04.003
19
Lundqvist M. Cederström B. Chmill V. Danielsson M. Hasegawa B. (2001). Evaluation of a photon-counting X-ray imaging system. IEEE Trans. Nuclear Sci.48, 1530–1536. doi: 10.1109/23.958392
20
Lv Z. Y. Lu Q. X. Dong B. (2019). Morphogenesis: a focus on marine invertebrates. Marine Life Sci. Technol.1, 28–40. doi: 10.1007/s42995-019-00016-z
21
Maeno A. Kohtsuka H. Takatani K. Nakano H. (2019). Microfocus X-ray CT (microCT) Imaging of Actinia equina (Cnidaria), Harmothoe sp. (Annelida), and Xenoturbella japonica (Xenacoelomorpha). Jove-Journal Visualized Experiments150. doi: 10.3791/59161
22
McCollough C. H. Boedeker K. Cody D. Duan X. Flohr T. Halliburton S. S. et al . (2020). Principles and applications of multienergy CT: Report of AAPM Task Group 291. Med. Phys.47, e881–e912. doi: 10.1002/mp.14157
23
McCollough C. H. Rajendran K. Leng S. (2023). Standardization and quantitative imaging with photon-counting detector CT. Invest. Radiol.58, 451–458. doi: 10.1097/RLI.0000000000000948
24
Metscher B. D. (2009). MicroCT for comparative morphology: simple staining methods allow high-contrast 3D imaging of diverse non-mineralized animal tissues. BMC Physiol.9, 11. doi: 10.1186/1472-6793-9-11
25
Müter D. Sørensen H. Oddershede J. Dalby K. Stipp S. (2015). Microstructure and micromechanics of the heart urchin test from X-ray tomography. Acta Biomaterialia23, 21–26. doi: 10.1016/j.actbio.2015.05.007
26
Naleway S. E. Taylor J. R. A. Porter M. M. Meyers M. A. McKittrick J. (2016). Structure and mechanical properties of selected protective systems in marine organisms. Materials Sci. Engineering: C59, 1143–1167. doi: 10.1016/j.msec.2015.10.033
27
Parapar J. Caramelo C. Candás M. Cunha-Veira X. Moreira J. (2019). An integrative approach to the anatomy of Syllis gracilis Grube, 1840 (Annelida) using micro-computed X-ray tomography. Peerj7, 37. doi: 10.7717/peerj.7251
28
Poore G. C. B. Black J. R. (2024). Four new species of Valvifera (Crustacea: Isopoda) from ANDEEP cruises in the Weddell Sea. Zootaxa5477, 295–314. doi: 10.11646/zootaxa.5477.3.2
29
Putnam H. M. Barott K. L. Ainsworth T. D. Gates R. D. (2017). The vulnerability and resilience of reef-building corals. Curr. Biol.27, R528–R540. doi: 10.1016/j.cub.2017.04.047
30
Rajagopal J. R. Farhadi F. Solomon J. Sahbaee P. Saboury B. Pritchard W. F. et al . (2021). Comparison of low dose performance of photon-counting and energy integrating CT. Acad. Radiol.28, 1754–1760. doi: 10.1016/j.acra.2020.07.033
31
Richtsmeier D. Dunning C. A. S. Iniewski K. Bazalova-Carter M. (2020). Multi-contrast K-edge imaging on a bench-top photon-counting CT system: acquisition parameter study. J. Instrumentation15. doi: 10.1088/1748-0221/15/10/P10029
32
SChade M. Deutschmann A. Foth C. Paetzel C. Püttmann T. Kenzler M. et al . (2024). The long and icy journey of Mesozoic marine reptile vertebrae from northern Germany, their provenance and internal structures. Palaeontologia Electronica27. doi: 10.26879/1313
33
Shikhaliev P. M. (2005). Beam hardening artefacts in computed tomography with photon counting, charge integrating and energy weighting detectors: a simulation study. Phys. Med. Biol.50, 5813–5827. doi: 10.1088/0031-9155/50/24/004
34
Solem R. Dreier T. Goncalves I. Bech M. (2021). Material decomposition in low-energy micro-CT using a dual-threshold photon counting x-ray detector. Front. Phys.9, 673843. doi: 10.3389/fphy.2021.673843
35
Teichert S. Reddin C. J. Wisshak M. (2024). In situ decrease in rhodolith growth associated with Arctic climate change. Global Change Biol.30, e17300. doi: 10.1111/gcb.17300
36
Thomson D. P. Dee S. Doropoulos C. Orr M. Wilson S. K. Hoey A. S. (2024). High rates of erosion on a wave-exposed fringing coral reef. Limnology Oceanography69, 1439–1449. doi: 10.1002/lno.12586
37
Tittensor D. P. Mora C. Jetz W. Lotze H. K. Ricard D. Vanden Berghe E. et al . (2010). Global patterns and predictors of marine biodiversity across taxa. Nature466, 1098–U107. doi: 10.1038/nature09329
38
Valerio J. Vasconcelos-Filho J. E. Stosic B. de Oliveira W. R. Santana F. M. Antonino A. C. D. et al . (2025). Topological analysis of the three-dimensional radiodensity distribution of fish otoliths: Point sampling effects on dimensionality reduction. Micron188. doi: 10.1016/j.micron.2024.103731
39
Vasileiadou K. Chatzinikolaou E. Klayn S. Pavloudi C. Reizopoulou S. (2024). Marine biodiversity hotspots - challenges and resilience. Front. Marine Sci.11. doi: 10.3389/fmars.2024.1338242
40
Wang A. S. Pelc N. J. (2021). Spectral photon counting CT: imaging algorithms and performance assessment. IEEE Trans. Radiat. Plasma Med. Sci.5, 453–464. doi: 10.1109/TRPMS.2020.3007380
41
Wei C. Erbe C. (2024). Sound reception and hearing capabilities in the Little Penguin (Eudyptula minor): first predicted in-air and underwater audiograms. R. Soc. Open Sci.11. doi: 10.1098/rsos.240593
42
Whitman W. B. Coleman D. C. Wiebe W. J. (1998). Prokaryotes: The unseen majority. Proc. Natl. Acad. Sci.95, 6578–6583. doi: 10.1073/pnas.95.12.6578
43
Yang C.-H. Kumar A. B. Chan T.-Y. (2024). On the differences between the two widely distributed and closely related rock shrimps Sicyonia japonica Balss, 1914 and S. parajaponica Crosnier, 2003 (Dendrobranchiata, Penaeoidea, Sicyoniidae), with a new record of S. japonica from Taiwan. Zootaxa5476, 505–513. doi: 10.11646/zootaxa.5476.1.36
44
Ye X.-J. Sun Z.-Y. Yao M. T. (2024). A keichousaurus-bearing regurgitalite from the middle triassic xingyi fauna, dingxiao of xingyi city, guizhou, south China. Palaeoworld33, 363–373. doi: 10.1016/j.palwor.2023.03.009
45
Yu H. Wang S. Fan Y. N. Wang G. P. Li J. Q. Liu C. et al . (2022). Large-factor Micro-CT super-resolution of bone microstructure. Front. Phys.10. doi: 10.3389/fphy.2022.997582
Summary
Keywords
photon-counting detector CT, micro-computed tomography, spectral ct imaging, material decomposition, image quality, bivalve
Citation
Xue M, Xie T and Liu Q (2025) Evaluation of photon-counting micro-CT scanning for imaging marine organisms. Front. Mar. Sci. 12:1542703. doi: 10.3389/fmars.2025.1542703
Received
10 December 2024
Accepted
19 May 2025
Published
03 June 2025
Volume
12 - 2025
Edited by
Maria Angeles Esteban, University of Murcia, Spain
Reviewed by
Wenjun Zhu, Tongji University, China
Maria Romeu, University of Porto, Portugal
Updates
Copyright
© 2025 Xue, Xie and Liu.
This is an open-access article distributed under the terms of the Creative Commons Attribution License (CC BY). The use, distribution or reproduction in other forums is permitted, provided the original author(s) and the copyright owner(s) are credited and that the original publication in this journal is cited, in accordance with accepted academic practice. No use, distribution or reproduction is permitted which does not comply with these terms.
*Correspondence: Tianwu Xie, tianwuxie@fudan.edu.cn
Disclaimer
All claims expressed in this article are solely those of the authors and do not necessarily represent those of their affiliated organizations, or those of the publisher, the editors and the reviewers. Any product that may be evaluated in this article or claim that may be made by its manufacturer is not guaranteed or endorsed by the publisher.